Cities with the Lowest Per Capita Income in Connecticut
RELATED REPORTS & OPTIONS
Lowest Per Capita Income
Connecticut
Compare Cities
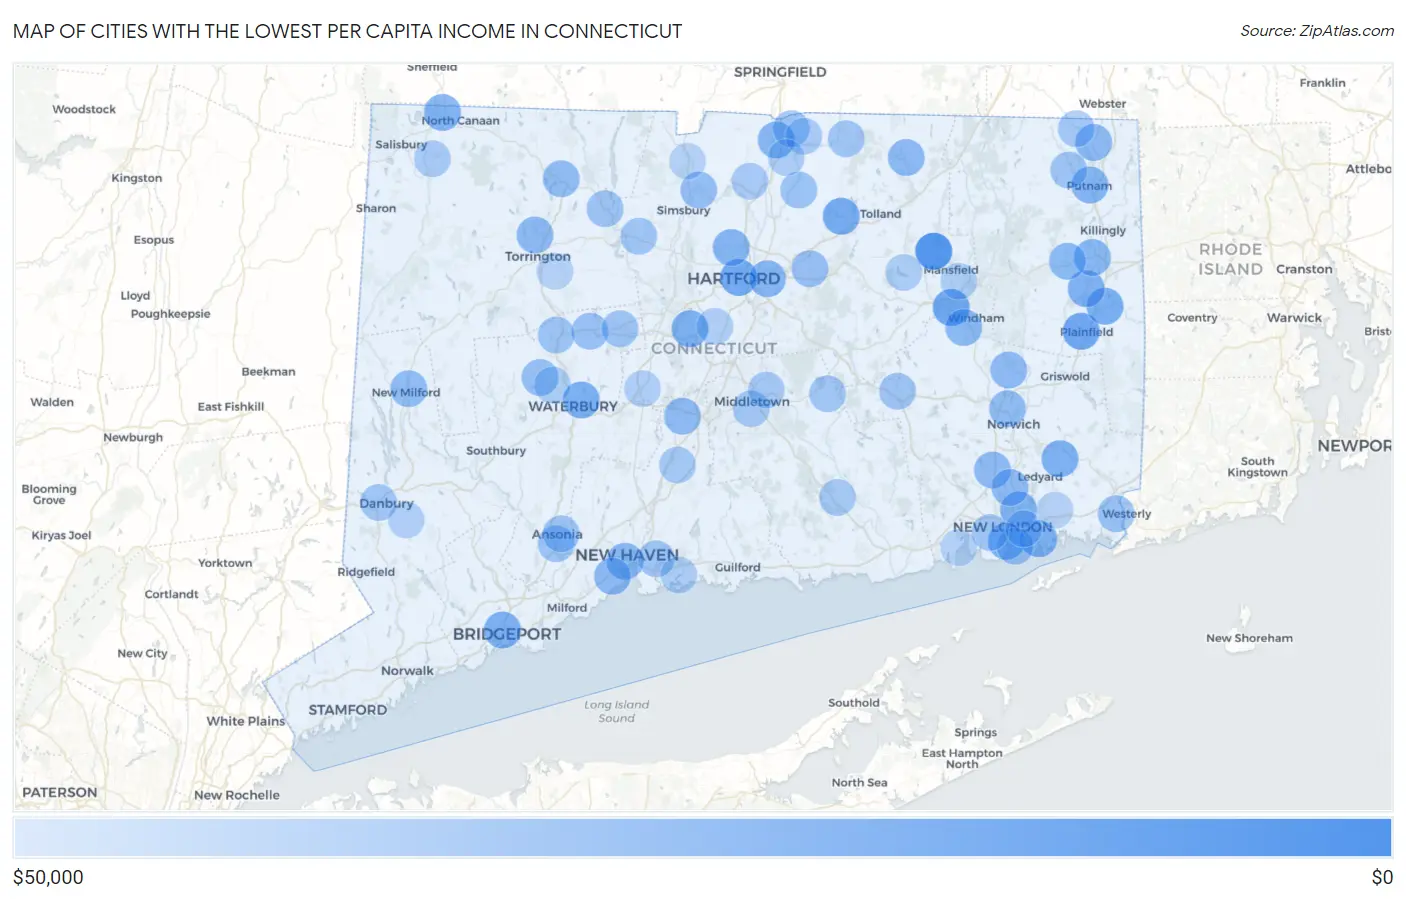
Map of Cities with the Lowest Per Capita Income in Connecticut
$50,000
$0
Cities with the Lowest Per Capita Income in Connecticut
| City | Per Capita Income | vs State | vs National | |
| 1. | Fairfield University | $3,508 | $52,034(-48.5k)#1 | $41,261(-37.8k)#12 |
| 2. | Quinnipiac University | $5,580 | $52,034(-46.5k)#2 | $41,261(-35.7k)#58 |
| 3. | Sacred Heart University | $6,099 | $52,034(-45.9k)#3 | $41,261(-35.2k)#81 |
| 4. | Storrs | $14,547 | $52,034(-37.5k)#4 | $41,261(-26.7k)#1,264 |
| 5. | Willimantic | $22,953 | $52,034(-29.1k)#5 | $41,261(-18.3k)#6,115 |
| 6. | Plainfield Village | $24,079 | $52,034(-28.0k)#6 | $41,261(-17.2k)#7,255 |
| 7. | Hartford | $25,229 | $52,034(-26.8k)#7 | $41,261(-16.0k)#8,538 |
| 8. | Rockville | $26,387 | $52,034(-25.6k)#8 | $41,261(-14.9k)#9,914 |
| 9. | Taylor Corners | $26,505 | $52,034(-25.5k)#9 | $41,261(-14.8k)#10,039 |
| 10. | Pleasant Valley | $27,402 | $52,034(-24.6k)#10 | $41,261(-13.9k)#11,160 |
| 11. | Moosup | $27,761 | $52,034(-24.3k)#11 | $41,261(-13.5k)#11,610 |
| 12. | Jewett City Borough | $27,895 | $52,034(-24.1k)#12 | $41,261(-13.4k)#11,784 |
| 13. | Lake Chaffee | $27,948 | $52,034(-24.1k)#13 | $41,261(-13.3k)#11,841 |
| 14. | Danielson Borough | $28,055 | $52,034(-24.0k)#14 | $41,261(-13.2k)#11,982 |
| 15. | Waterbury | $28,723 | $52,034(-23.3k)#15 | $41,261(-12.5k)#12,763 |
| 16. | New Britain | $28,796 | $52,034(-23.2k)#16 | $41,261(-12.5k)#12,839 |
| 17. | Poquonock Bridge | $29,079 | $52,034(-23.0k)#17 | $41,261(-12.2k)#13,166 |
| 18. | Bridgeport | $29,506 | $52,034(-22.5k)#18 | $41,261(-11.8k)#13,672 |
| 19. | Mashantucket | $29,723 | $52,034(-22.3k)#19 | $41,261(-11.5k)#13,922 |
| 20. | Wauregan | $30,063 | $52,034(-22.0k)#20 | $41,261(-11.2k)#14,307 |
| 21. | Conning Towers Nautilus Park | $30,443 | $52,034(-21.6k)#21 | $41,261(-10.8k)#14,742 |
| 22. | New London | $30,943 | $52,034(-21.1k)#22 | $41,261(-10.3k)#15,304 |
| 23. | Canaan | $30,944 | $52,034(-21.1k)#23 | $41,261(-10.3k)#15,307 |
| 24. | Putnam | $31,597 | $52,034(-20.4k)#24 | $41,261(-9.66k)#16,032 |
| 25. | Blue Hills | $31,612 | $52,034(-20.4k)#25 | $41,261(-9.65k)#16,054 |
| 26. | Thompsonville | $32,465 | $52,034(-19.6k)#26 | $41,261(-8.80k)#16,986 |
| 27. | East Hartford | $32,527 | $52,034(-19.5k)#27 | $41,261(-8.73k)#17,048 |
| 28. | East Brooklyn | $33,125 | $52,034(-18.9k)#28 | $41,261(-8.14k)#17,645 |
| 29. | New Haven | $33,449 | $52,034(-18.6k)#29 | $41,261(-7.81k)#18,013 |
| 30. | Brooklyn | $33,738 | $52,034(-18.3k)#30 | $41,261(-7.52k)#18,315 |
| 31. | South Windham | $34,225 | $52,034(-17.8k)#31 | $41,261(-7.04k)#18,772 |
| 32. | Dayville | $34,324 | $52,034(-17.7k)#32 | $41,261(-6.94k)#18,872 |
| 33. | Torrington | $34,516 | $52,034(-17.5k)#33 | $41,261(-6.75k)#19,046 |
| 34. | West Haven | $34,740 | $52,034(-17.3k)#34 | $41,261(-6.52k)#19,220 |
| 35. | North Grosvenor Dale | $34,770 | $52,034(-17.3k)#35 | $41,261(-6.49k)#19,259 |
| 36. | Stafford Springs | $34,841 | $52,034(-17.2k)#36 | $41,261(-6.42k)#19,321 |
| 37. | Oxoboxo River | $35,003 | $52,034(-17.0k)#37 | $41,261(-6.26k)#19,464 |
| 38. | Baltic | $35,231 | $52,034(-16.8k)#38 | $41,261(-6.03k)#19,656 |
| 39. | Gales Ferry | $35,737 | $52,034(-16.3k)#39 | $41,261(-5.52k)#20,097 |
| 40. | Mechanicsville | $35,797 | $52,034(-16.2k)#40 | $41,261(-5.46k)#20,152 |
| 41. | Meriden | $35,859 | $52,034(-16.2k)#41 | $41,261(-5.40k)#20,216 |
| 42. | Inglenook | $35,886 | $52,034(-16.1k)#42 | $41,261(-5.38k)#20,231 |
| 43. | Norwich | $36,075 | $52,034(-16.0k)#43 | $41,261(-5.19k)#20,385 |
| 44. | New Milford | $36,334 | $52,034(-15.7k)#44 | $41,261(-4.93k)#20,607 |
| 45. | Winsted | $36,436 | $52,034(-15.6k)#45 | $41,261(-4.83k)#20,685 |
| 46. | Watertown | $37,847 | $52,034(-14.2k)#46 | $41,261(-3.41k)#21,687 |
| 47. | Tariffville | $37,875 | $52,034(-14.2k)#47 | $41,261(-3.39k)#21,698 |
| 48. | Terryville | $38,268 | $52,034(-13.8k)#48 | $41,261(-2.99k)#21,956 |
| 49. | Bigelow Corners | $38,512 | $52,034(-13.5k)#49 | $41,261(-2.75k)#22,110 |
| 50. | Manchester | $38,839 | $52,034(-13.2k)#50 | $41,261(-2.42k)#22,314 |
| 51. | Stratford Downtown | $39,269 | $52,034(-12.8k)#51 | $41,261(-1.99k)#22,551 |
| 52. | Pawcatuck | $39,655 | $52,034(-12.4k)#52 | $41,261(-1.61k)#22,767 |
| 53. | Thomaston | $39,700 | $52,034(-12.3k)#53 | $41,261(-1.56k)#22,796 |
| 54. | Derby | $40,298 | $52,034(-11.7k)#54 | $41,261(-963)#23,116 |
| 55. | Broad Brook | $40,425 | $52,034(-11.6k)#55 | $41,261(-836)#23,184 |
| 56. | Sherwood Manor | $40,506 | $52,034(-11.5k)#56 | $41,261(-755)#23,228 |
| 57. | Ansonia | $40,604 | $52,034(-11.4k)#57 | $41,261(-657)#23,282 |
| 58. | Colchester | $40,669 | $52,034(-11.4k)#58 | $41,261(-592)#23,313 |
| 59. | Groton | $40,702 | $52,034(-11.3k)#59 | $41,261(-559)#23,334 |
| 60. | Bristol | $40,984 | $52,034(-11.1k)#60 | $41,261(-277)#23,500 |
| 61. | New Hartford Center | $41,027 | $52,034(-11.0k)#61 | $41,261(-234)#23,523 |
| 62. | Quasset Lake | $41,057 | $52,034(-11.0k)#62 | $41,261(-204)#23,538 |
| 63. | South Woodstock | $41,187 | $52,034(-10.8k)#63 | $41,261(-74.0)#23,602 |
| 64. | East Haven | $41,397 | $52,034(-10.6k)#64 | $41,261(+136)#23,697 |
| 65. | Somers | $41,583 | $52,034(-10.5k)#65 | $41,261(+322)#23,779 |
| 66. | Waterford | $41,727 | $52,034(-10.3k)#66 | $41,261(+466)#23,856 |
| 67. | Canton Valley | $41,879 | $52,034(-10.2k)#67 | $41,261(+618)#23,918 |
| 68. | Naugatuck Borough | $42,211 | $52,034(-9.82k)#68 | $41,261(+950)#24,088 |
| 69. | Candlewood Knolls | $42,465 | $52,034(-9.57k)#69 | $41,261(+1.20k)#24,211 |
| 70. | Danbury | $42,497 | $52,034(-9.54k)#70 | $41,261(+1.24k)#24,224 |
| 71. | East Hampton | $42,508 | $52,034(-9.53k)#71 | $41,261(+1.25k)#24,228 |
| 72. | Quinebaug | $43,066 | $52,034(-8.97k)#72 | $41,261(+1.80k)#24,461 |
| 73. | Long Hill | $43,121 | $52,034(-8.91k)#73 | $41,261(+1.86k)#24,481 |
| 74. | Bantam Borough | $43,134 | $52,034(-8.90k)#74 | $41,261(+1.87k)#24,489 |
| 75. | Middletown | $43,202 | $52,034(-8.83k)#75 | $41,261(+1.94k)#24,519 |
| 76. | Dodgingtown | $43,361 | $52,034(-8.67k)#76 | $41,261(+2.10k)#24,580 |
| 77. | Chester Center | $43,834 | $52,034(-8.20k)#77 | $41,261(+2.57k)#24,801 |
| 78. | Wallingford Center | $44,067 | $52,034(-7.97k)#78 | $41,261(+2.81k)#24,898 |
| 79. | Portland | $44,122 | $52,034(-7.91k)#79 | $41,261(+2.86k)#24,928 |
| 80. | Windsor Locks | $44,568 | $52,034(-7.47k)#80 | $41,261(+3.31k)#25,086 |
| 81. | Falls Village | $44,892 | $52,034(-7.14k)#81 | $41,261(+3.63k)#25,223 |
| 82. | Trumbull Center | $45,008 | $52,034(-7.03k)#82 | $41,261(+3.75k)#25,262 |
| 83. | Hazardville | $45,011 | $52,034(-7.02k)#83 | $41,261(+3.75k)#25,266 |
| 84. | Branford Center | $45,865 | $52,034(-6.17k)#84 | $41,261(+4.60k)#25,604 |
| 85. | Southwood Acres | $45,992 | $52,034(-6.04k)#85 | $41,261(+4.73k)#25,640 |
| 86. | Oakville | $46,412 | $52,034(-5.62k)#86 | $41,261(+5.15k)#25,765 |
| 87. | South Coventry | $46,518 | $52,034(-5.52k)#87 | $41,261(+5.26k)#25,800 |
| 88. | Mansfield Center | $46,815 | $52,034(-5.22k)#88 | $41,261(+5.55k)#25,899 |
| 89. | Topstone | $46,912 | $52,034(-5.12k)#89 | $41,261(+5.65k)#25,936 |
| 90. | Plantsville | $46,959 | $52,034(-5.08k)#90 | $41,261(+5.70k)#25,948 |
| 91. | Chimney Point | $47,511 | $52,034(-4.52k)#91 | $41,261(+6.25k)#26,099 |
| 92. | Bethel | $47,635 | $52,034(-4.40k)#92 | $41,261(+6.37k)#26,145 |
| 93. | Newington | $47,853 | $52,034(-4.18k)#93 | $41,261(+6.59k)#26,207 |
| 94. | Lake Bungee | $48,192 | $52,034(-3.84k)#94 | $41,261(+6.93k)#26,311 |
| 95. | Candlewood Shores | $48,617 | $52,034(-3.42k)#95 | $41,261(+7.36k)#26,423 |
| 96. | Northwest Harwinton | $48,836 | $52,034(-3.20k)#96 | $41,261(+7.58k)#26,480 |
| 97. | Ball Pond | $48,875 | $52,034(-3.16k)#97 | $41,261(+7.61k)#26,489 |
| 98. | Old Mystic | $49,133 | $52,034(-2.90k)#98 | $41,261(+7.87k)#26,559 |
| 99. | Niantic | $49,192 | $52,034(-2.84k)#99 | $41,261(+7.93k)#26,574 |
| 100. | Salmon Brook | $49,216 | $52,034(-2.82k)#100 | $41,261(+7.96k)#26,580 |
Common Questions
What are the Top 10 Cities with the Lowest Per Capita Income in Connecticut?
Top 10 Cities with the Lowest Per Capita Income in Connecticut are:
#1
$14,547
#2
$22,953
#3
$24,079
#4
$25,229
#5
$26,387
#6
$27,761
#7
$28,723
#8
$28,796
#9
$29,079
#10
$29,506
What city has the Lowest Per Capita Income in Connecticut?
Storrs has the Lowest Per Capita Income in Connecticut with $14,547.
What is the Per Capita Income in the State of Connecticut?
Per Capita Income in Connecticut is $52,034.
What is the Per Capita Income in the United States?
Per Capita Income in the United States is $41,261.