Chester Center, CT Map & Demographics
Chester Center Map
Chester Center Overview
$43,834
PER CAPITA INCOME
$102,727
AVG FAMILY INCOME
$73,611
AVG HOUSEHOLD INCOME
28.5%
WAGE / INCOME GAP [ % ]
71.5¢/ $1
WAGE / INCOME GAP [ $ ]
0.45
INEQUALITY / GINI INDEX
1,729
TOTAL POPULATION
939
MALE POPULATION
790
FEMALE POPULATION
118.86
MALES / 100 FEMALES
84.13
FEMALES / 100 MALES
49.9
MEDIAN AGE
2.5
AVG FAMILY SIZE
2.0
AVG HOUSEHOLD SIZE
885
LABOR FORCE [ PEOPLE ]
60.4%
PERCENT IN LABOR FORCE
3.3%
UNEMPLOYMENT RATE
Income in Chester Center
Income Overview in Chester Center
Per Capita Income in Chester Center is $43,834, while median incomes of families and households are $102,727 and $73,611 respectively.
| Characteristic | Number | Measure |
| Per Capita Income | 1,729 | $43,834 |
| Median Family Income | 510 | $102,727 |
| Mean Family Income | 510 | $113,850 |
| Median Household Income | 770 | $73,611 |
| Mean Household Income | 770 | $97,037 |
| Income Deficit | 510 | $0 |
| Wage / Income Gap (%) | 1,729 | 28.47% |
| Wage / Income Gap ($) | 1,729 | 71.53¢ per $1 |
| Gini / Inequality Index | 1,729 | 0.45 |
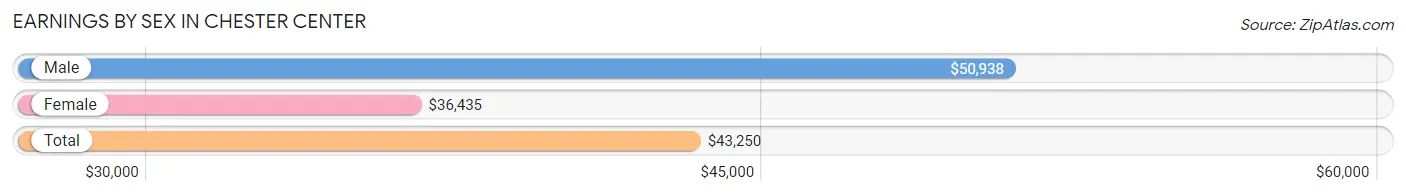
Earnings by Sex in Chester Center
Average Earnings in Chester Center are $43,250, $50,938 for men and $36,435 for women, a difference of 28.5%.
| Sex | Number | Average Earnings |
| Male | 509 (53.0%) | $50,938 |
| Female | 451 (47.0%) | $36,435 |
| Total | 960 (100.0%) | $43,250 |
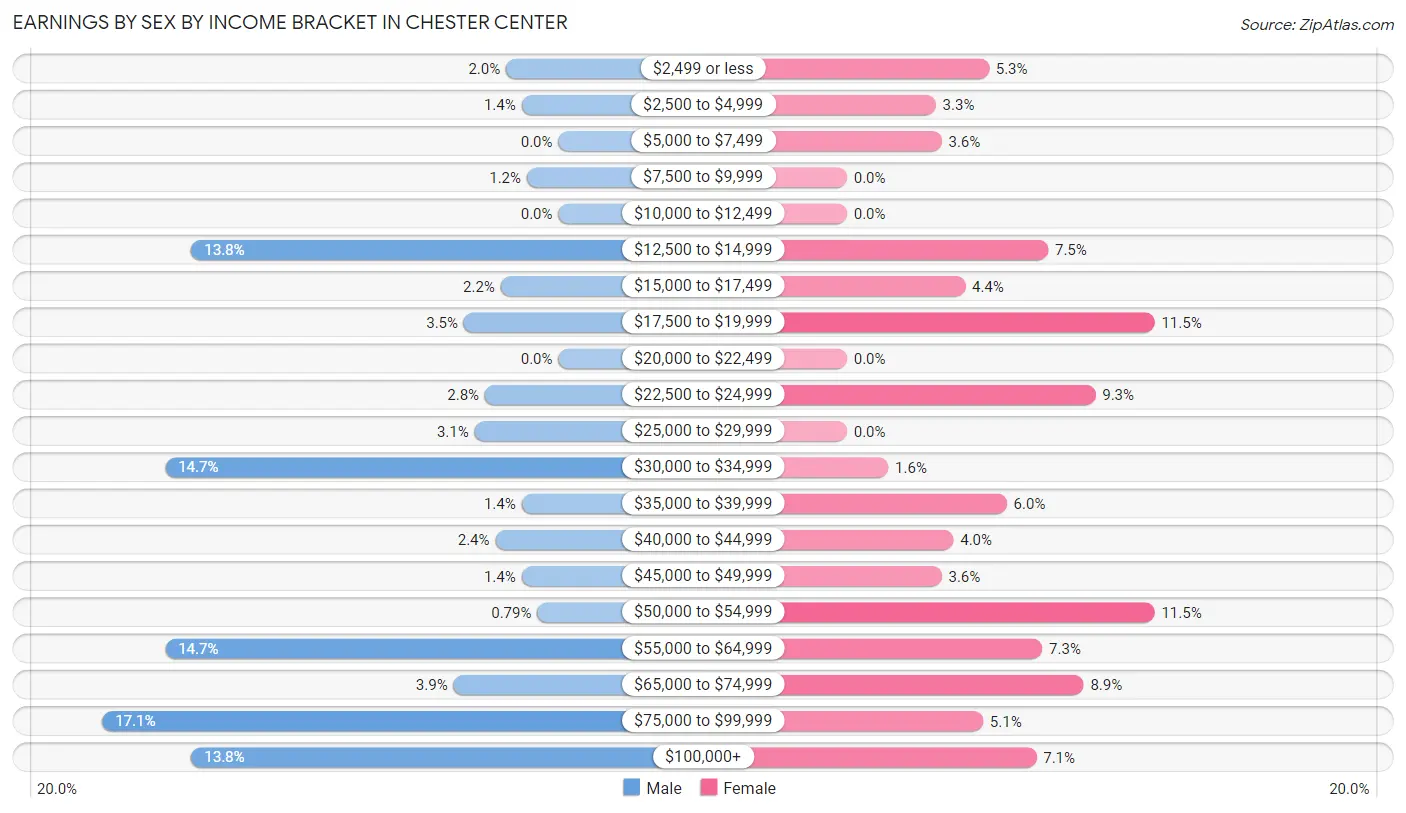
Earnings by Sex by Income Bracket in Chester Center
The most common earnings brackets in Chester Center are $75,000 to $99,999 for men (87 | 17.1%) and $17,500 to $19,999 for women (52 | 11.5%).
| Income | Male | Female |
| $2,499 or less | 10 (2.0%) | 24 (5.3%) |
| $2,500 to $4,999 | 7 (1.4%) | 15 (3.3%) |
| $5,000 to $7,499 | 0 (0.0%) | 16 (3.5%) |
| $7,500 to $9,999 | 6 (1.2%) | 0 (0.0%) |
| $10,000 to $12,499 | 0 (0.0%) | 0 (0.0%) |
| $12,500 to $14,999 | 70 (13.8%) | 34 (7.5%) |
| $15,000 to $17,499 | 11 (2.2%) | 20 (4.4%) |
| $17,500 to $19,999 | 18 (3.5%) | 52 (11.5%) |
| $20,000 to $22,499 | 0 (0.0%) | 0 (0.0%) |
| $22,500 to $24,999 | 14 (2.8%) | 42 (9.3%) |
| $25,000 to $29,999 | 16 (3.1%) | 0 (0.0%) |
| $30,000 to $34,999 | 75 (14.7%) | 7 (1.5%) |
| $35,000 to $39,999 | 7 (1.4%) | 27 (6.0%) |
| $40,000 to $44,999 | 12 (2.4%) | 18 (4.0%) |
| $45,000 to $49,999 | 7 (1.4%) | 16 (3.5%) |
| $50,000 to $54,999 | 4 (0.8%) | 52 (11.5%) |
| $55,000 to $64,999 | 75 (14.7%) | 33 (7.3%) |
| $65,000 to $74,999 | 20 (3.9%) | 40 (8.9%) |
| $75,000 to $99,999 | 87 (17.1%) | 23 (5.1%) |
| $100,000+ | 70 (13.8%) | 32 (7.1%) |
| Total | 509 (100.0%) | 451 (100.0%) |
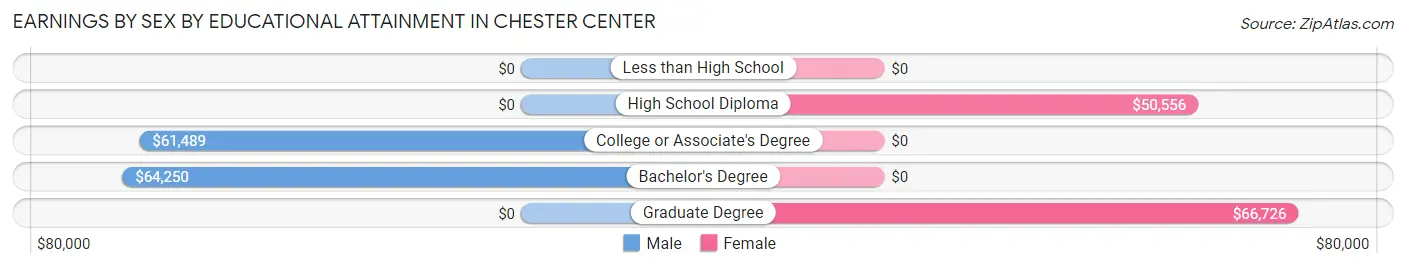
Earnings by Sex by Educational Attainment in Chester Center
Average earnings in Chester Center are $61,296 for men and $43,681 for women, a difference of 28.7%. Men with an educational attainment of bachelor's degree enjoy the highest average annual earnings of $64,250, while those with college or associate's degree education earn the least with $61,489. Women with an educational attainment of graduate degree earn the most with the average annual earnings of $66,726, while those with high school diploma education have the smallest earnings of $50,556.
| Educational Attainment | Male Income | Female Income |
| Less than High School | - | - |
| High School Diploma | - | - |
| College or Associate's Degree | $61,489 | $0 |
| Bachelor's Degree | $64,250 | $0 |
| Graduate Degree | - | - |
| Total | $61,296 | $43,681 |
Family Income in Chester Center
Family Income Brackets in Chester Center
According to the Chester Center family income data, there are 145 families falling into the $100,000 to $149,999 income range, which is the most common income bracket and makes up 28.4% of all families.
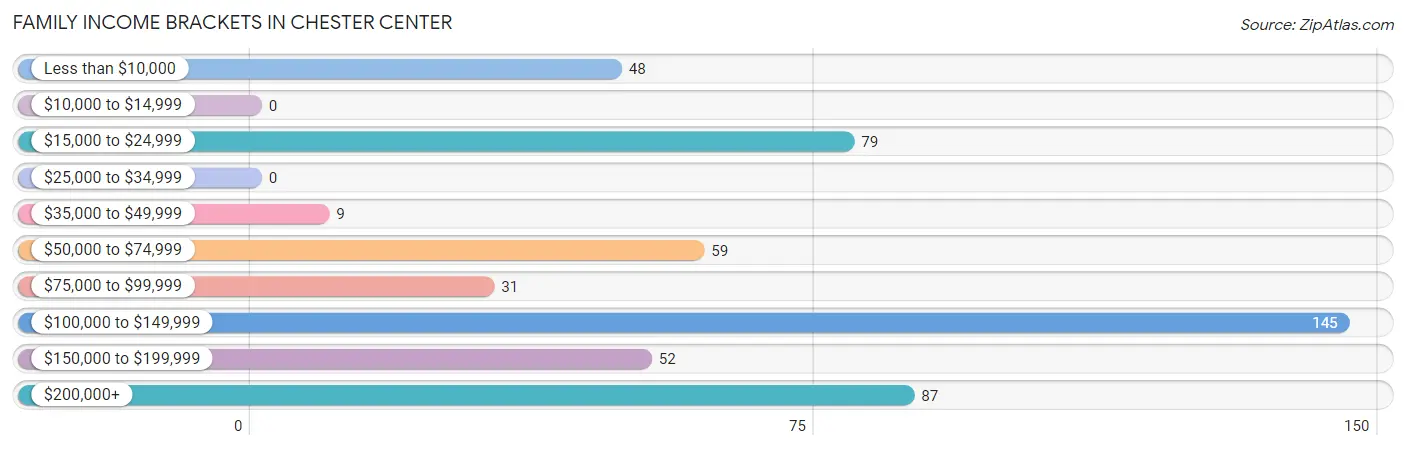
| Income Bracket | # Families | % Families |
| Less than $10,000 | 48 | 9.4% |
| $10,000 to $14,999 | 0 | 0.0% |
| $15,000 to $24,999 | 79 | 15.5% |
| $25,000 to $34,999 | 0 | 0.0% |
| $35,000 to $49,999 | 9 | 1.8% |
| $50,000 to $74,999 | 59 | 11.6% |
| $75,000 to $99,999 | 31 | 6.1% |
| $100,000 to $149,999 | 145 | 28.4% |
| $150,000 to $199,999 | 52 | 10.2% |
| $200,000+ | 87 | 17.1% |
Family Income by Famaliy Size in Chester Center
4-person families (80 | 15.7%) account for the highest median family income in Chester Center with $181,071 per family, while 2-person families (317 | 62.2%) have the highest median income of $51,875 per family member.
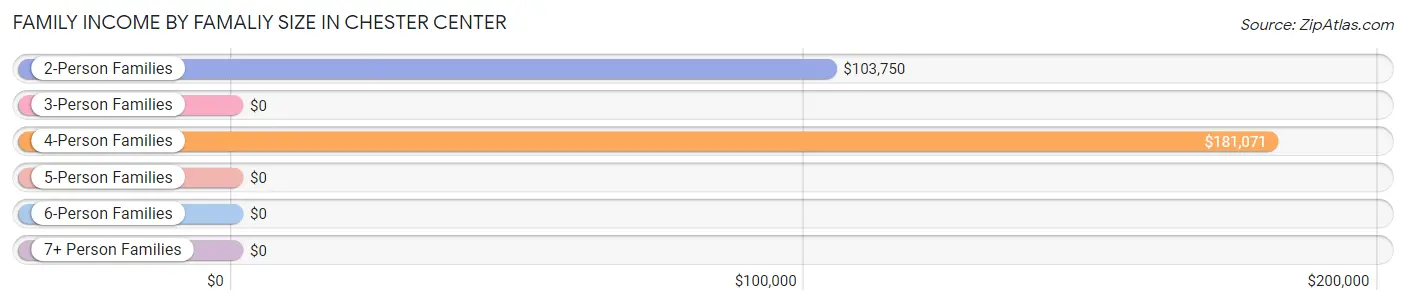
| Income Bracket | # Families | Median Income |
| 2-Person Families | 317 (62.2%) | $103,750 |
| 3-Person Families | 90 (17.6%) | $0 |
| 4-Person Families | 80 (15.7%) | $181,071 |
| 5-Person Families | 0 (0.0%) | $0 |
| 6-Person Families | 0 (0.0%) | $0 |
| 7+ Person Families | 23 (4.5%) | $0 |
| Total | 510 (100.0%) | $102,727 |
Family Income by Number of Earners in Chester Center
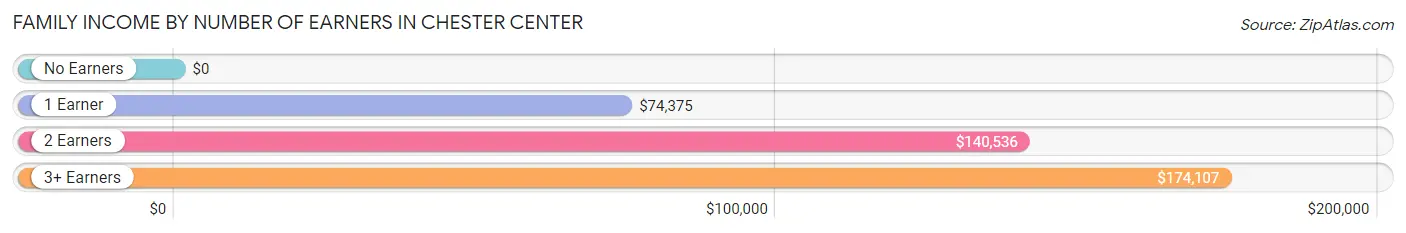
| Number of Earners | # Families | Median Income |
| No Earners | 95 (18.6%) | $0 |
| 1 Earner | 199 (39.0%) | $74,375 |
| 2 Earners | 155 (30.4%) | $140,536 |
| 3+ Earners | 61 (12.0%) | $174,107 |
| Total | 510 (100.0%) | $102,727 |
Household Income in Chester Center
Household Income Brackets in Chester Center
With 169 households falling in the category, the $100,000 to $149,999 income range is the most frequent in Chester Center, accounting for 22.0% of all households. In contrast, only 9 households (1.2%) fall into the $10,000 to $14,999 income bracket, making it the least populous group.
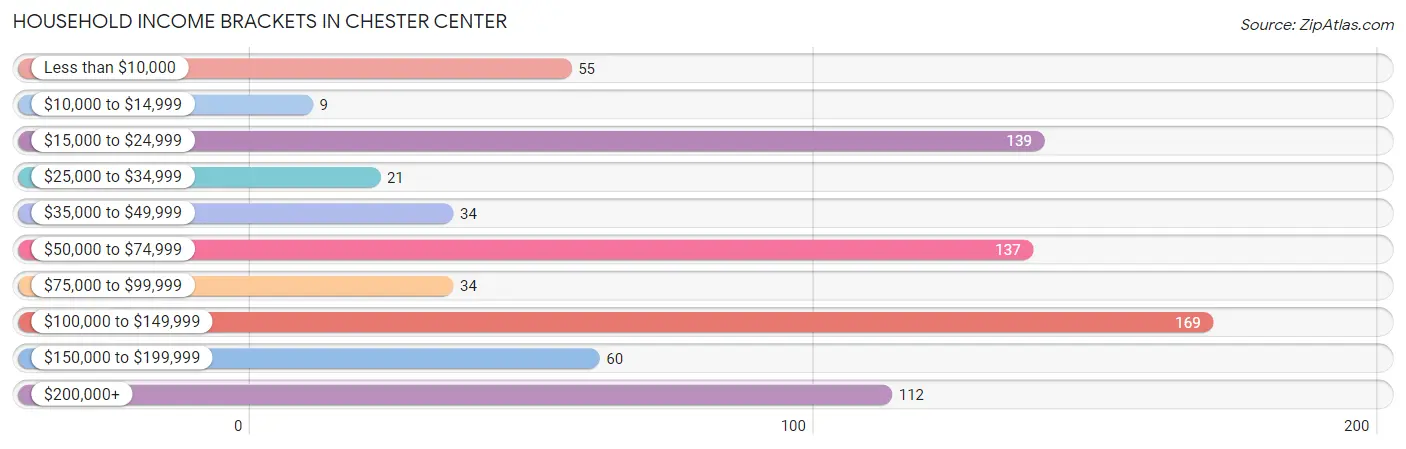
| Income Bracket | # Households | % Households |
| Less than $10,000 | 55 | 7.1% |
| $10,000 to $14,999 | 9 | 1.2% |
| $15,000 to $24,999 | 139 | 18.1% |
| $25,000 to $34,999 | 21 | 2.7% |
| $35,000 to $49,999 | 34 | 4.4% |
| $50,000 to $74,999 | 137 | 17.8% |
| $75,000 to $99,999 | 34 | 4.4% |
| $100,000 to $149,999 | 169 | 21.9% |
| $150,000 to $199,999 | 60 | 7.8% |
| $200,000+ | 112 | 14.5% |
Household Income by Householder Age in Chester Center
The median household income in Chester Center is $73,611, with the highest median household income of $122,083 found in the 45 to 64 years age bracket for the primary householder. A total of 222 households (28.8%) fall into this category.
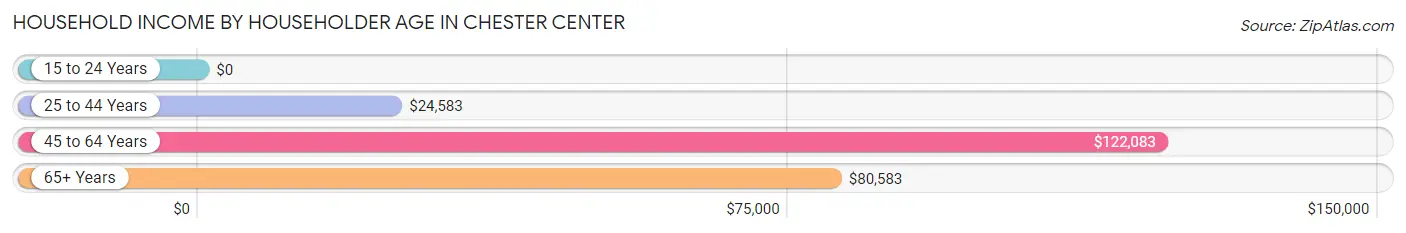
| Income Bracket | # Households | Median Income |
| 15 to 24 Years | 0 (0.0%) | $0 |
| 25 to 44 Years | 241 (31.3%) | $24,583 |
| 45 to 64 Years | 222 (28.8%) | $122,083 |
| 65+ Years | 307 (39.9%) | $80,583 |
| Total | 770 (100.0%) | $73,611 |
Poverty in Chester Center
Income Below Poverty by Sex and Age in Chester Center
With 17.7% poverty level for males and 11.7% for females among the residents of Chester Center, under 5 year old males and 5 year old females are the most vulnerable to poverty, with 37 males (82.2%) and 28 females (100.0%) in their respective age groups living below the poverty level.
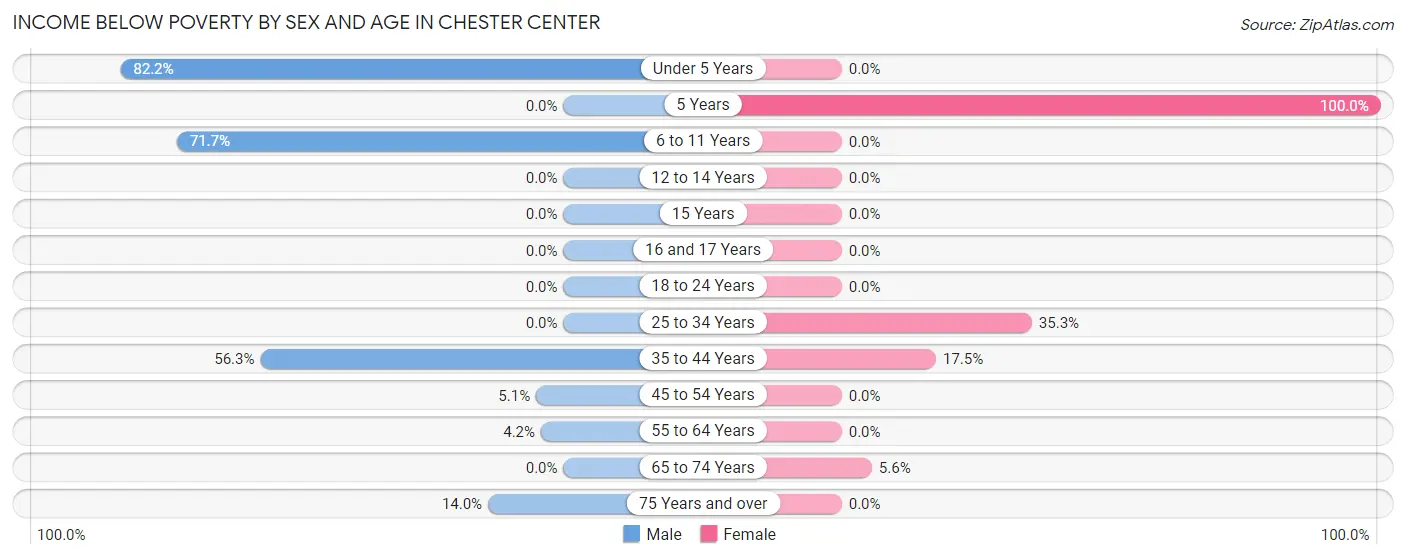
| Age Bracket | Male | Female |
| Under 5 Years | 37 (82.2%) | 0 (0.0%) |
| 5 Years | 0 (0.0%) | 28 (100.0%) |
| 6 to 11 Years | 66 (71.7%) | 0 (0.0%) |
| 12 to 14 Years | 0 (0.0%) | 0 (0.0%) |
| 15 Years | 0 (0.0%) | 0 (0.0%) |
| 16 and 17 Years | 0 (0.0%) | 0 (0.0%) |
| 18 to 24 Years | 0 (0.0%) | 0 (0.0%) |
| 25 to 34 Years | 0 (0.0%) | 24 (35.3%) |
| 35 to 44 Years | 36 (56.2%) | 28 (17.5%) |
| 45 to 54 Years | 3 (5.1%) | 0 (0.0%) |
| 55 to 64 Years | 4 (4.2%) | 0 (0.0%) |
| 65 to 74 Years | 0 (0.0%) | 9 (5.6%) |
| 75 Years and over | 7 (14.0%) | 0 (0.0%) |
| Total | 153 (17.7%) | 89 (11.7%) |
Income Above Poverty by Sex and Age in Chester Center
According to the poverty statistics in Chester Center, males aged 12 to 14 years and females aged under 5 years are the age groups that are most secure financially, with 100.0% of males and 100.0% of females in these age groups living above the poverty line.
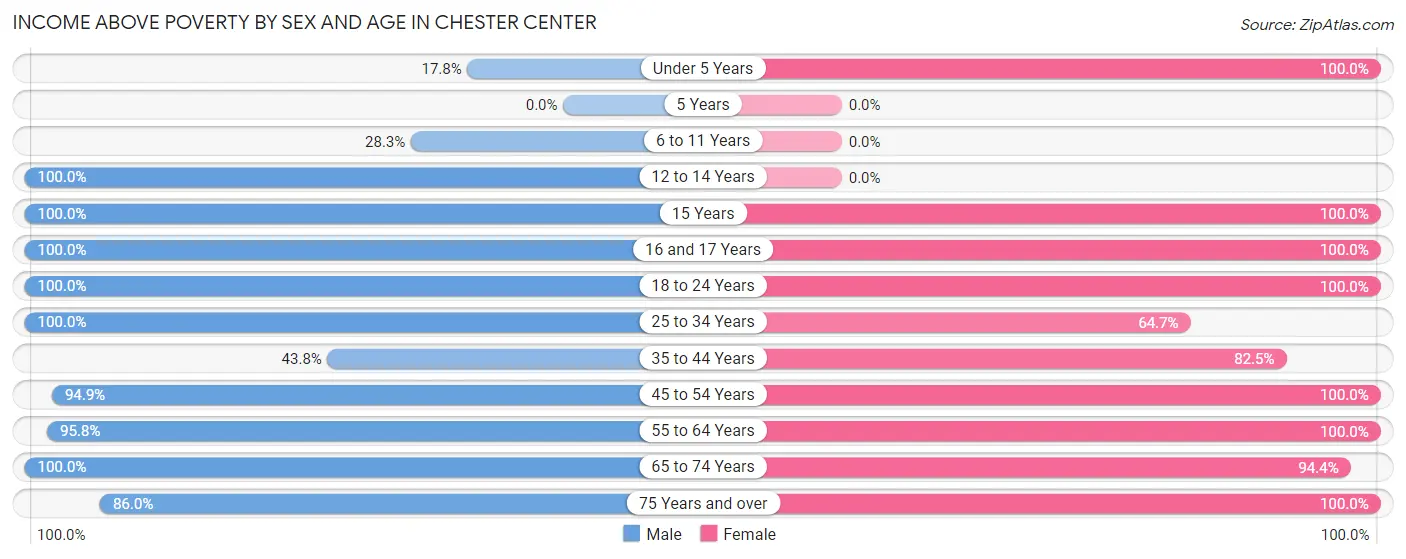
| Age Bracket | Male | Female |
| Under 5 Years | 8 (17.8%) | 35 (100.0%) |
| 5 Years | 0 (0.0%) | 0 (0.0%) |
| 6 to 11 Years | 26 (28.3%) | 0 (0.0%) |
| 12 to 14 Years | 27 (100.0%) | 0 (0.0%) |
| 15 Years | 9 (100.0%) | 27 (100.0%) |
| 16 and 17 Years | 18 (100.0%) | 13 (100.0%) |
| 18 to 24 Years | 83 (100.0%) | 36 (100.0%) |
| 25 to 34 Years | 122 (100.0%) | 44 (64.7%) |
| 35 to 44 Years | 28 (43.8%) | 132 (82.5%) |
| 45 to 54 Years | 56 (94.9%) | 72 (100.0%) |
| 55 to 64 Years | 92 (95.8%) | 120 (100.0%) |
| 65 to 74 Years | 199 (100.0%) | 152 (94.4%) |
| 75 Years and over | 43 (86.0%) | 38 (100.0%) |
| Total | 711 (82.3%) | 669 (88.3%) |
Income Below Poverty Among Married-Couple Families in Chester Center
The poverty statistics for married-couple families in Chester Center show that 6.7% or 23 of the total 345 families live below the poverty line. Families with 5 or more children have the highest poverty rate of 100.0%, comprising of 23 families. On the other hand, families with no children have the lowest poverty rate of 0.0%, which includes 0 families.
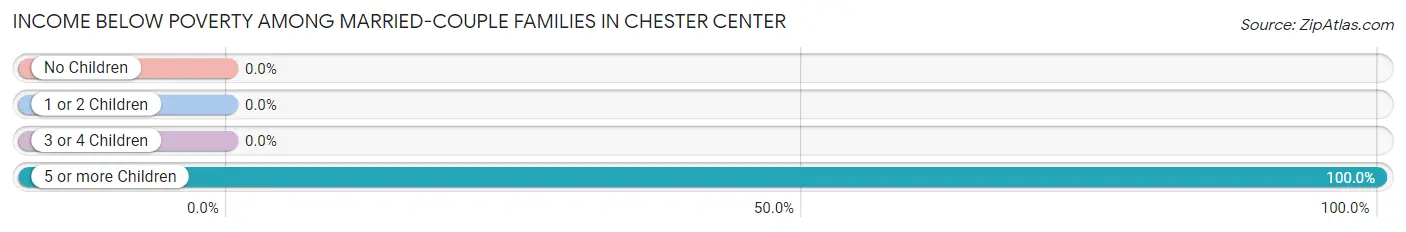
| Children | Above Poverty | Below Poverty |
| No Children | 260 (100.0%) | 0 (0.0%) |
| 1 or 2 Children | 62 (100.0%) | 0 (0.0%) |
| 3 or 4 Children | 0 (0.0%) | 0 (0.0%) |
| 5 or more Children | 0 (0.0%) | 23 (100.0%) |
| Total | 322 (93.3%) | 23 (6.7%) |
Income Below Poverty Among Single-Parent Households in Chester Center
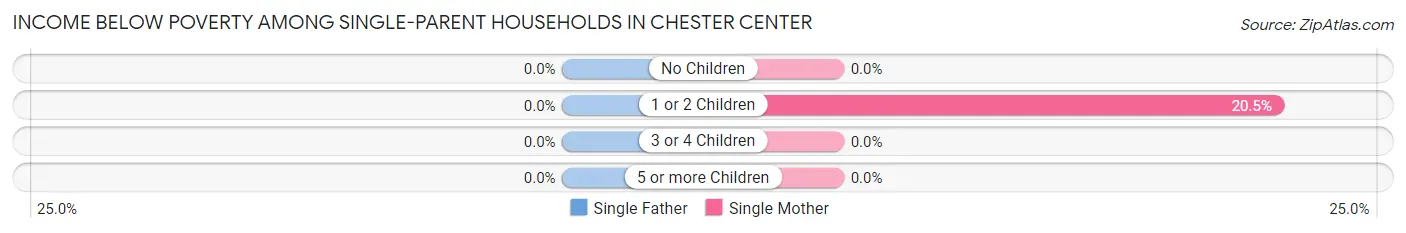
| Children | Single Father | Single Mother |
| No Children | 0 (0.0%) | 0 (0.0%) |
| 1 or 2 Children | 0 (0.0%) | 25 (20.5%) |
| 3 or 4 Children | 0 (0.0%) | 0 (0.0%) |
| 5 or more Children | 0 (0.0%) | 0 (0.0%) |
| Total | 0 (0.0%) | 25 (19.1%) |
Income Below Poverty Among Married-Couple vs Single-Parent Households in Chester Center
The poverty data for Chester Center shows that 23 of the married-couple family households (6.7%) and 25 of the single-parent households (15.1%) are living below the poverty level. Within the married-couple family households, those with 5 or more children have the highest poverty rate, with 23 households (100.0%) falling below the poverty line. Among the single-parent households, those with 1 or 2 children have the highest poverty rate, with 25 household (20.5%) living below poverty.
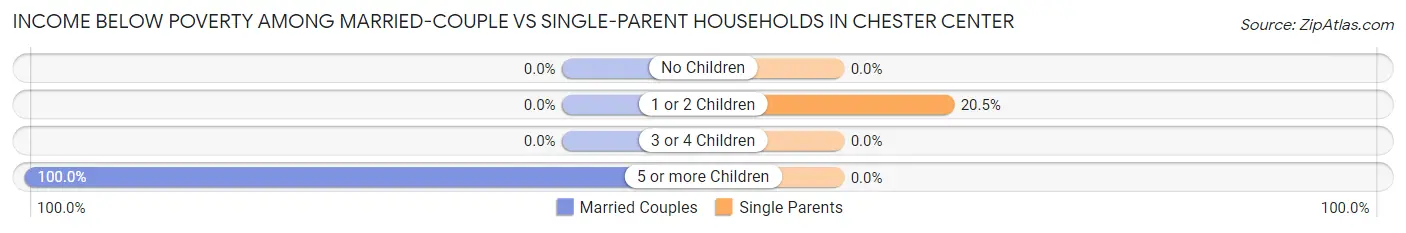
| Children | Married-Couple Families | Single-Parent Households |
| No Children | 0 (0.0%) | 0 (0.0%) |
| 1 or 2 Children | 0 (0.0%) | 25 (20.5%) |
| 3 or 4 Children | 0 (0.0%) | 0 (0.0%) |
| 5 or more Children | 23 (100.0%) | 0 (0.0%) |
| Total | 23 (6.7%) | 25 (15.1%) |
Race in Chester Center
The most populous races in Chester Center are White / Caucasian (1,542 | 89.2%), Hispanic or Latino (116 | 6.7%), and Some other Race (91 | 5.3%).
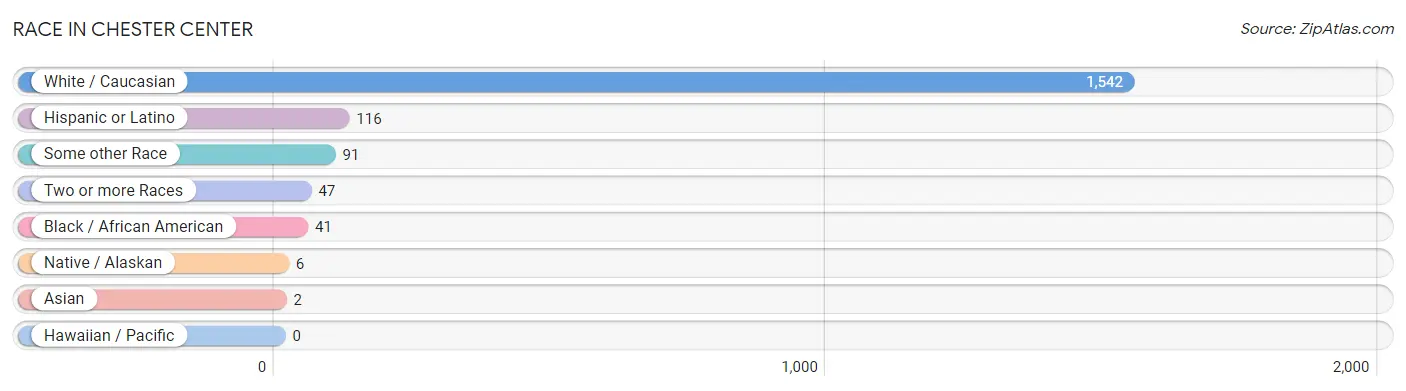
| Race | # Population | % Population |
| Asian | 2 | 0.1% |
| Black / African American | 41 | 2.4% |
| Hawaiian / Pacific | 0 | 0.0% |
| Hispanic or Latino | 116 | 6.7% |
| Native / Alaskan | 6 | 0.4% |
| White / Caucasian | 1,542 | 89.2% |
| Two or more Races | 47 | 2.7% |
| Some other Race | 91 | 5.3% |
| Total | 1,729 | 100.0% |
Ancestry in Chester Center
The most populous ancestries reported in Chester Center are Irish (564 | 32.6%), German (311 | 18.0%), Italian (284 | 16.4%), English (270 | 15.6%), and French (97 | 5.6%), together accounting for 88.3% of all Chester Center residents.

| Ancestry | # Population | % Population |
| American | 86 | 5.0% |
| Cape Verdean | 11 | 0.6% |
| Celtic | 15 | 0.9% |
| Central American | 2 | 0.1% |
| Central American Indian | 16 | 0.9% |
| Dutch | 10 | 0.6% |
| Eastern European | 20 | 1.2% |
| English | 270 | 15.6% |
| French | 97 | 5.6% |
| French Canadian | 70 | 4.1% |
| German | 311 | 18.0% |
| Greek | 24 | 1.4% |
| Guatemalan | 2 | 0.1% |
| Haitian | 2 | 0.1% |
| Hungarian | 31 | 1.8% |
| Irish | 564 | 32.6% |
| Italian | 284 | 16.4% |
| Jamaican | 26 | 1.5% |
| Northern European | 53 | 3.1% |
| Norwegian | 11 | 0.6% |
| Peruvian | 91 | 5.3% |
| Polish | 43 | 2.5% |
| Portuguese | 12 | 0.7% |
| Puerto Rican | 6 | 0.4% |
| Scottish | 22 | 1.3% |
| South American | 91 | 5.3% |
| Spaniard | 6 | 0.4% |
| Subsaharan African | 11 | 0.6% |
| Swedish | 67 | 3.9% |
| Swiss | 9 | 0.5% |
| Thai | 2 | 0.1% |
| Ukrainian | 12 | 0.7% |
| Welsh | 6 | 0.4% | View All 33 Rows |
Immigrants in Chester Center
The most numerous immigrant groups reported in Chester Center came from Latin America (105 | 6.1%), South America (59 | 3.4%), Peru (52 | 3.0%), Caribbean (44 | 2.5%), and Europe (33 | 1.9%), together accounting for 16.9% of all Chester Center residents.
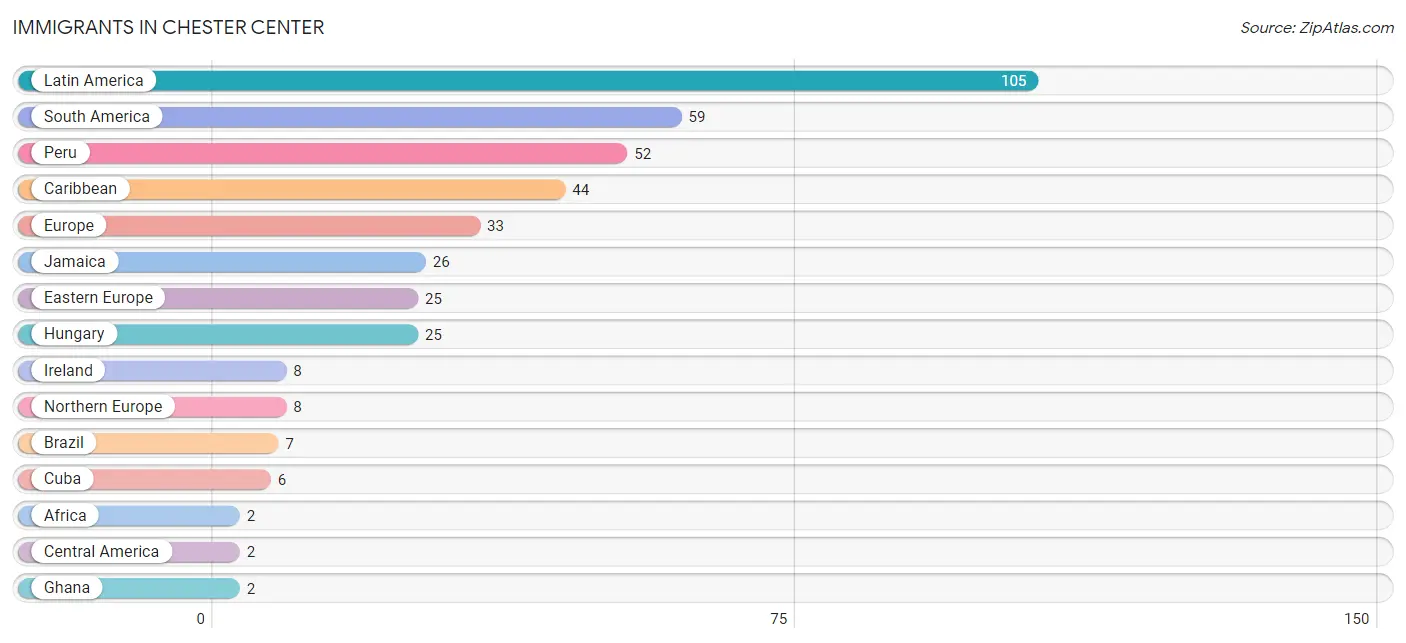
| Immigration Origin | # Population | % Population |
| Africa | 2 | 0.1% |
| Brazil | 7 | 0.4% |
| Caribbean | 44 | 2.5% |
| Central America | 2 | 0.1% |
| Cuba | 6 | 0.4% |
| Eastern Europe | 25 | 1.5% |
| Europe | 33 | 1.9% |
| Ghana | 2 | 0.1% |
| Guatemala | 2 | 0.1% |
| Haiti | 2 | 0.1% |
| Hungary | 25 | 1.5% |
| Ireland | 8 | 0.5% |
| Jamaica | 26 | 1.5% |
| Latin America | 105 | 6.1% |
| Northern Europe | 8 | 0.5% |
| Peru | 52 | 3.0% |
| South America | 59 | 3.4% |
| Western Africa | 2 | 0.1% | View All 18 Rows |
Sex and Age in Chester Center
Sex and Age in Chester Center
The most populous age groups in Chester Center are 70 to 74 Years (117 | 12.5%) for men and 40 to 44 Years (124 | 15.7%) for women.
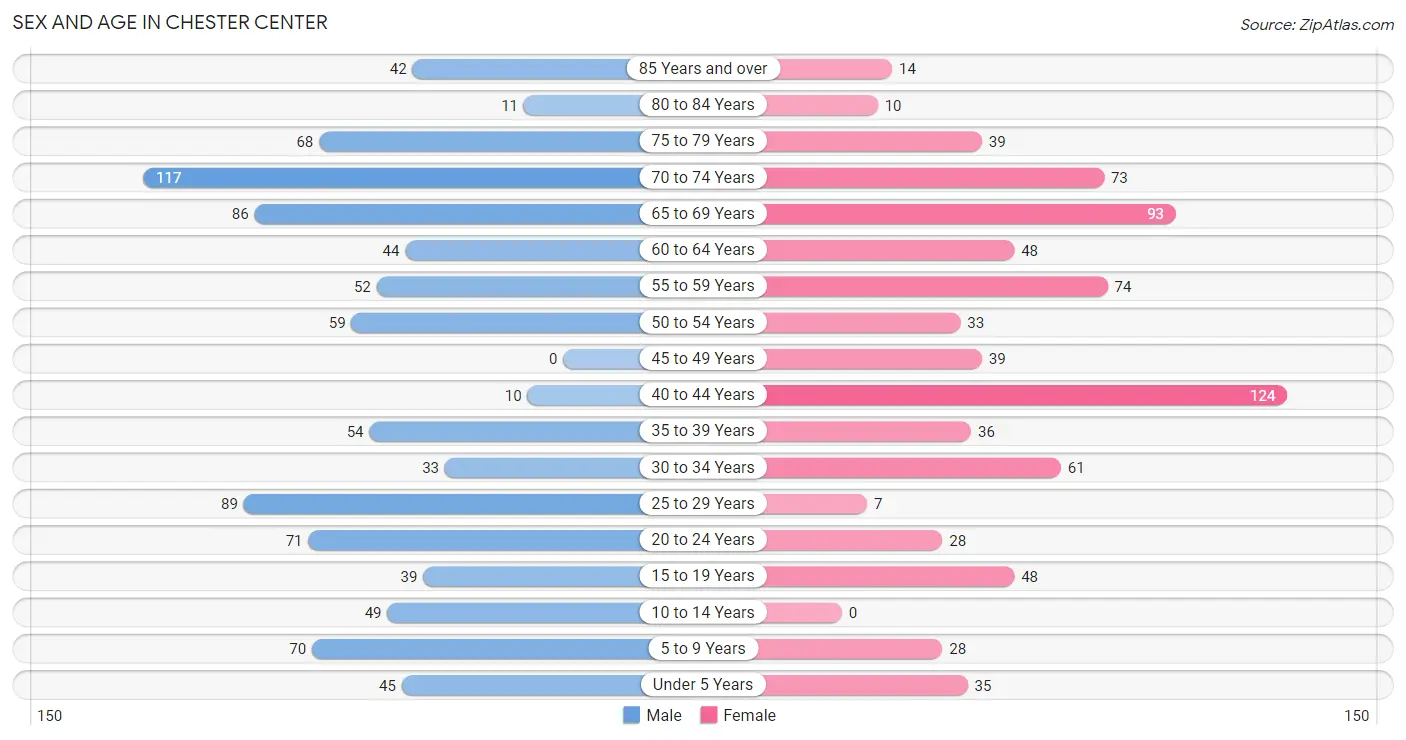
| Age Bracket | Male | Female |
| Under 5 Years | 45 (4.8%) | 35 (4.4%) |
| 5 to 9 Years | 70 (7.4%) | 28 (3.5%) |
| 10 to 14 Years | 49 (5.2%) | 0 (0.0%) |
| 15 to 19 Years | 39 (4.2%) | 48 (6.1%) |
| 20 to 24 Years | 71 (7.6%) | 28 (3.5%) |
| 25 to 29 Years | 89 (9.5%) | 7 (0.9%) |
| 30 to 34 Years | 33 (3.5%) | 61 (7.7%) |
| 35 to 39 Years | 54 (5.8%) | 36 (4.6%) |
| 40 to 44 Years | 10 (1.1%) | 124 (15.7%) |
| 45 to 49 Years | 0 (0.0%) | 39 (4.9%) |
| 50 to 54 Years | 59 (6.3%) | 33 (4.2%) |
| 55 to 59 Years | 52 (5.5%) | 74 (9.4%) |
| 60 to 64 Years | 44 (4.7%) | 48 (6.1%) |
| 65 to 69 Years | 86 (9.2%) | 93 (11.8%) |
| 70 to 74 Years | 117 (12.5%) | 73 (9.2%) |
| 75 to 79 Years | 68 (7.2%) | 39 (4.9%) |
| 80 to 84 Years | 11 (1.2%) | 10 (1.3%) |
| 85 Years and over | 42 (4.5%) | 14 (1.8%) |
| Total | 939 (100.0%) | 790 (100.0%) |
Families and Households in Chester Center
Median Family Size in Chester Center
The median family size in Chester Center is 2.55 persons per family, with married-couple families (345 | 67.6%) accounting for the largest median family size of 2.81 persons per family. On the other hand, single female/mother families (131 | 25.7%) represent the smallest median family size with 1.93 persons per family.
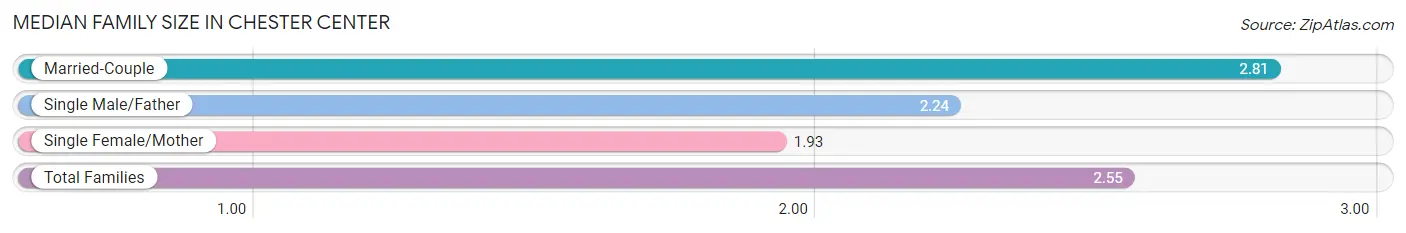
| Family Type | # Families | Family Size |
| Married-Couple | 345 (67.6%) | 2.81 |
| Single Male/Father | 34 (6.7%) | 2.24 |
| Single Female/Mother | 131 (25.7%) | 1.93 |
| Total Families | 510 (100.0%) | 2.55 |
Median Household Size in Chester Center
The median household size in Chester Center is 2.05 persons per household, with married-couple households (345 | 44.8%) accounting for the largest median household size of 2.81 persons per household. non-family households (260 | 33.8%) represent the smallest median household size with 1.04 persons per household.
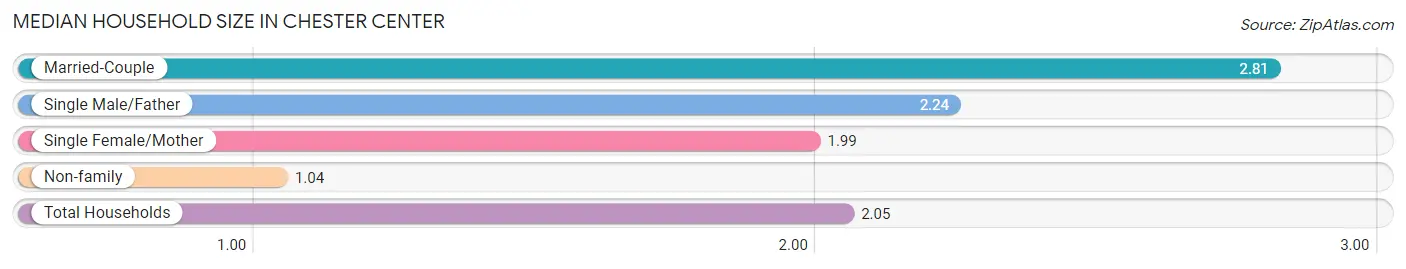
| Household Type | # Households | Household Size |
| Married-Couple | 345 (44.8%) | 2.81 |
| Single Male/Father | 34 (4.4%) | 2.24 |
| Single Female/Mother | 131 (17.0%) | 1.99 |
| Non-family | 260 (33.8%) | 1.04 |
| Total Households | 770 (100.0%) | 2.05 |
Household Size by Marriage Status in Chester Center
Out of a total of 770 households in Chester Center, 510 (66.2%) are family households, while 260 (33.8%) are nonfamily households. The most numerous type of family households are 2-person households, comprising 309, and the most common type of nonfamily households are 1-person households, comprising 249.
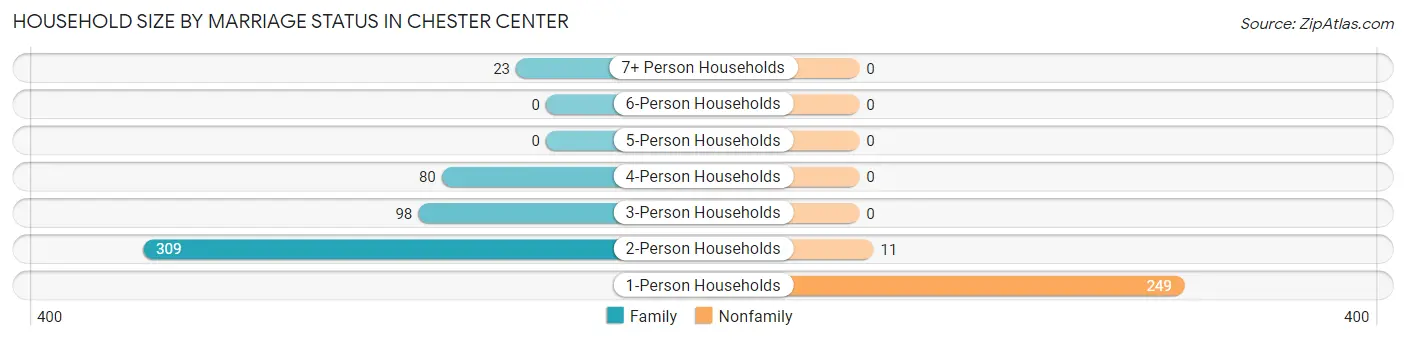
| Household Size | Family Households | Nonfamily Households |
| 1-Person Households | - | 249 (32.3%) |
| 2-Person Households | 309 (40.1%) | 11 (1.4%) |
| 3-Person Households | 98 (12.7%) | 0 (0.0%) |
| 4-Person Households | 80 (10.4%) | 0 (0.0%) |
| 5-Person Households | 0 (0.0%) | 0 (0.0%) |
| 6-Person Households | 0 (0.0%) | 0 (0.0%) |
| 7+ Person Households | 23 (3.0%) | 0 (0.0%) |
| Total | 510 (66.2%) | 260 (33.8%) |
Female Fertility in Chester Center
Fertility by Age in Chester Center
Average fertility rate in Chester Center is 52.0 births per 1,000 women. Women in the age bracket of 20 to 34 years have the highest fertility rate with 188.0 births per 1,000 women. Women in the age bracket of 20 to 34 years acount for 100.0% of all women with births.
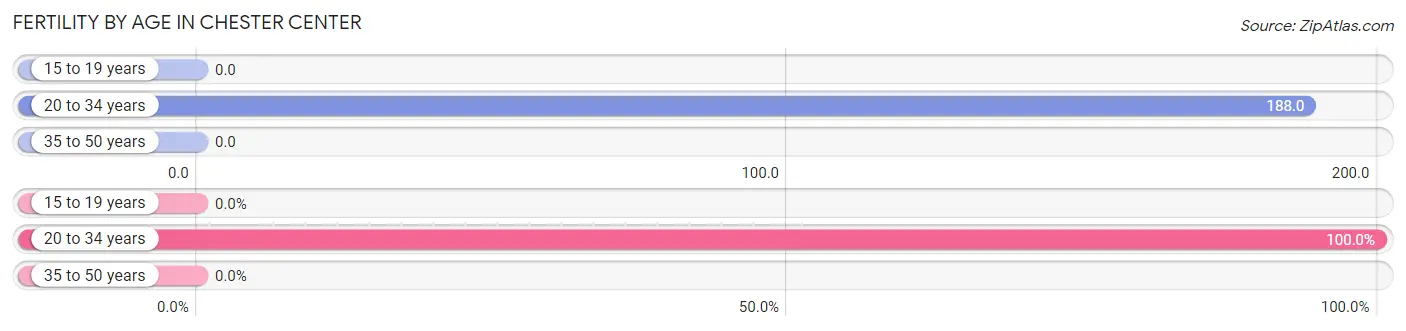
| Age Bracket | Women with Births | Births / 1,000 Women |
| 15 to 19 years | 0 (0.0%) | 0.0 |
| 20 to 34 years | 18 (100.0%) | 188.0 |
| 35 to 50 years | 0 (0.0%) | 0.0 |
| Total | 18 (100.0%) | 52.0 |
Fertility by Age by Marriage Status in Chester Center

| Age Bracket | Married | Unmarried |
| 15 to 19 years | 0 (0.0%) | 0 (0.0%) |
| 20 to 34 years | 18 (100.0%) | 0 (0.0%) |
| 35 to 50 years | 0 (0.0%) | 0 (0.0%) |
| Total | 18 (100.0%) | 0 (0.0%) |
Fertility by Education in Chester Center
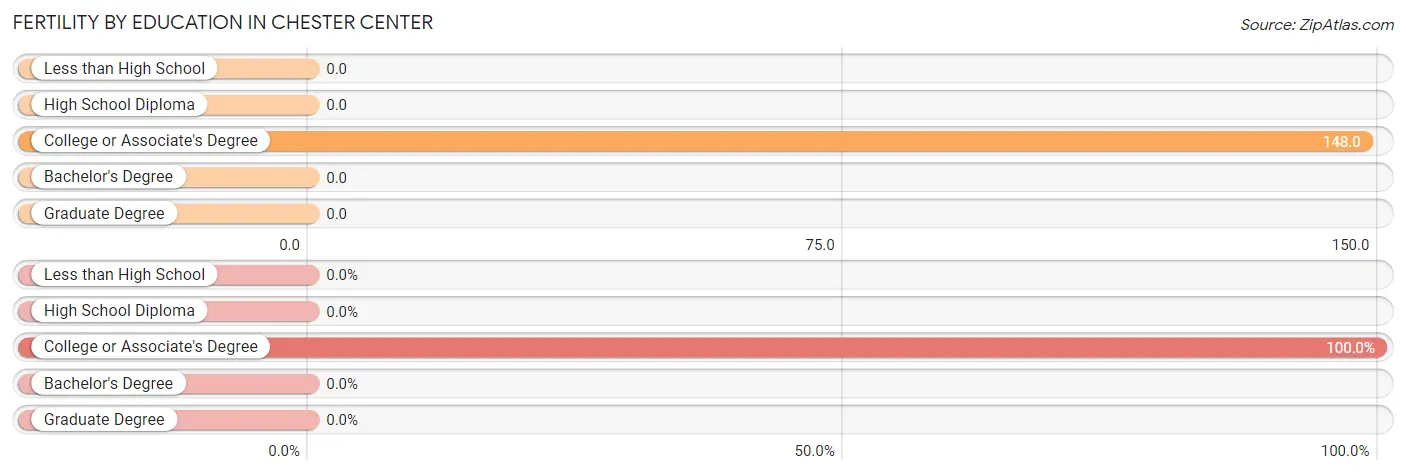
| Educational Attainment | Women with Births | Births / 1,000 Women |
| Less than High School | 0 (0.0%) | 0.0 |
| High School Diploma | 0 (0.0%) | 0.0 |
| College or Associate's Degree | 18 (100.0%) | 148.0 |
| Bachelor's Degree | 0 (0.0%) | 0.0 |
| Graduate Degree | 0 (0.0%) | 0.0 |
| Total | 18 (100.0%) | 52.0 |
Fertility by Education by Marriage Status in Chester Center
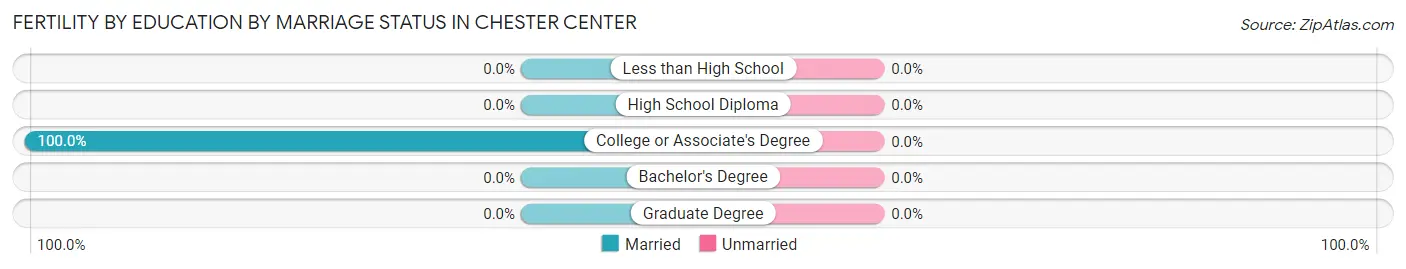
| Educational Attainment | Married | Unmarried |
| Less than High School | 0 (0.0%) | 0 (0.0%) |
| High School Diploma | 0 (0.0%) | 0 (0.0%) |
| College or Associate's Degree | 18 (100.0%) | 0 (0.0%) |
| Bachelor's Degree | 0 (0.0%) | 0 (0.0%) |
| Graduate Degree | 0 (0.0%) | 0 (0.0%) |
| Total | 18 (100.0%) | 0 (0.0%) |
Employment Characteristics in Chester Center
Employment by Class of Employer in Chester Center
Among the 856 employed individuals in Chester Center, private company employees (619 | 72.3%), self-employed (not incorporated) (63 | 7.4%), and local government employees (49 | 5.7%) make up the most common classes of employment.
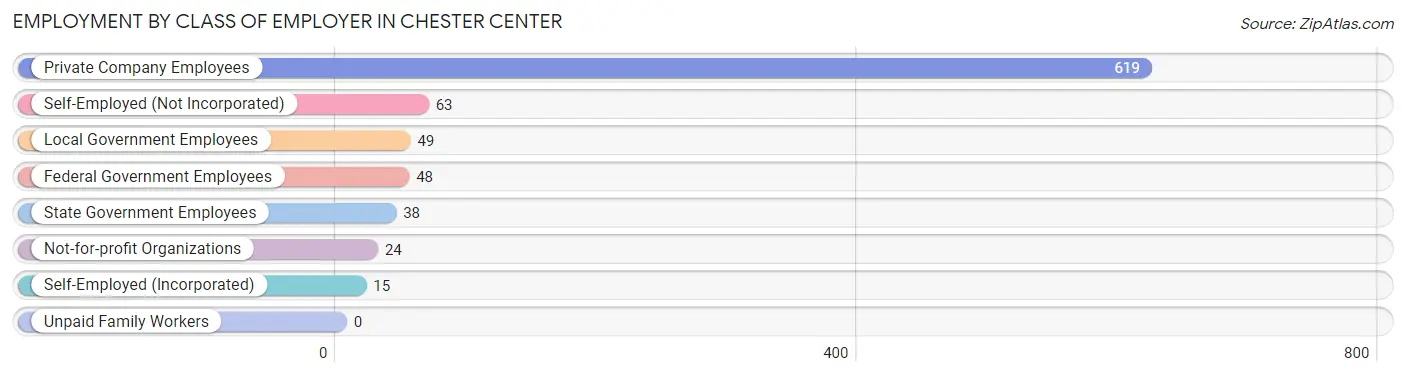
| Employer Class | # Employees | % Employees |
| Private Company Employees | 619 | 72.3% |
| Self-Employed (Incorporated) | 15 | 1.8% |
| Self-Employed (Not Incorporated) | 63 | 7.4% |
| Not-for-profit Organizations | 24 | 2.8% |
| Local Government Employees | 49 | 5.7% |
| State Government Employees | 38 | 4.4% |
| Federal Government Employees | 48 | 5.6% |
| Unpaid Family Workers | 0 | 0.0% |
| Total | 856 | 100.0% |
Employment Status by Age in Chester Center
According to the labor force statistics for Chester Center, out of the total population over 16 years of age (1,466), 60.4% or 885 individuals are in the labor force, with 3.3% or 29 of them unemployed. The age group with the highest labor force participation rate is 25 to 29 years, with 100.0% or 96 individuals in the labor force. Within the labor force, the 35 to 44 years age range has the highest percentage of unemployed individuals, with 13.1% or 23 of them being unemployed.
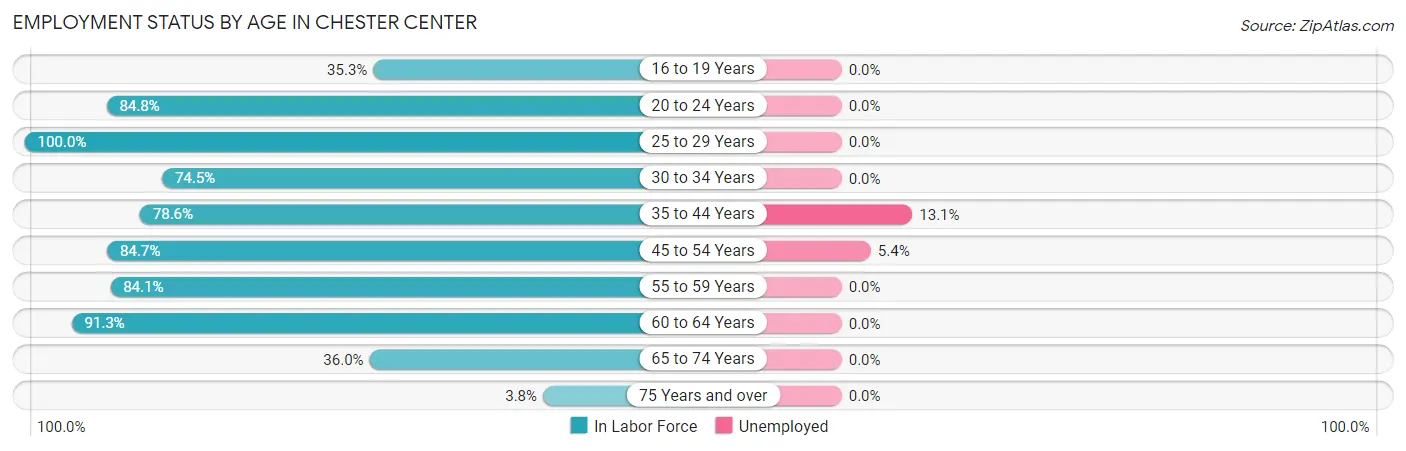
| Age Bracket | In Labor Force | Unemployed |
| 16 to 19 Years | 18 (35.3%) | 0 (0.0%) |
| 20 to 24 Years | 84 (84.8%) | 0 (0.0%) |
| 25 to 29 Years | 96 (100.0%) | 0 (0.0%) |
| 30 to 34 Years | 70 (74.5%) | 0 (0.0%) |
| 35 to 44 Years | 176 (78.6%) | 23 (13.1%) |
| 45 to 54 Years | 111 (84.7%) | 6 (5.4%) |
| 55 to 59 Years | 106 (84.1%) | 0 (0.0%) |
| 60 to 64 Years | 84 (91.3%) | 0 (0.0%) |
| 65 to 74 Years | 133 (36.0%) | 0 (0.0%) |
| 75 Years and over | 7 (3.8%) | 0 (0.0%) |
| Total | 885 (60.4%) | 29 (3.3%) |
Employment Status by Educational Attainment in Chester Center
According to labor force statistics for Chester Center, 84.3% of individuals (643) out of the total population between 25 and 64 years of age (763) are in the labor force, with 4.5% or 29 of them being unemployed. The group with the highest labor force participation rate are those with the educational attainment of bachelor's degree or higher, with 94.4% or 238 individuals in the labor force. Within the labor force, individuals with less than high school education have the highest percentage of unemployment, with 100.0% or 23 of them being unemployed.
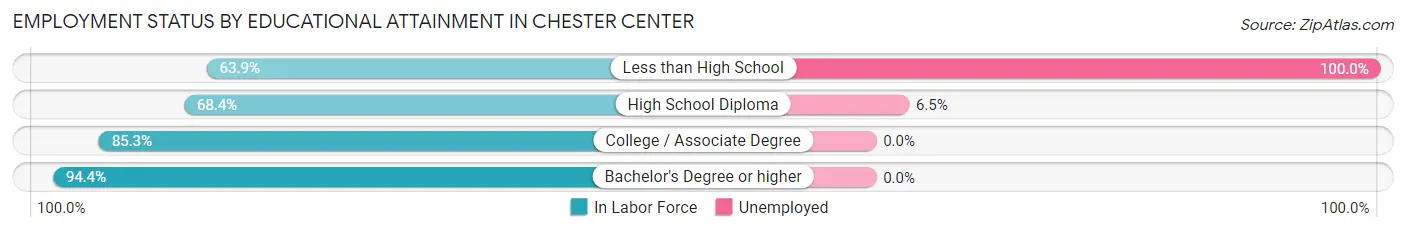
| Educational Attainment | In Labor Force | Unemployed |
| Less than High School | 23 (63.9%) | 36 (100.0%) |
| High School Diploma | 93 (68.4%) | 9 (6.5%) |
| College / Associate Degree | 289 (85.3%) | 0 (0.0%) |
| Bachelor's Degree or higher | 238 (94.4%) | 0 (0.0%) |
| Total | 643 (84.3%) | 34 (4.5%) |
Employment Occupations by Sex in Chester Center
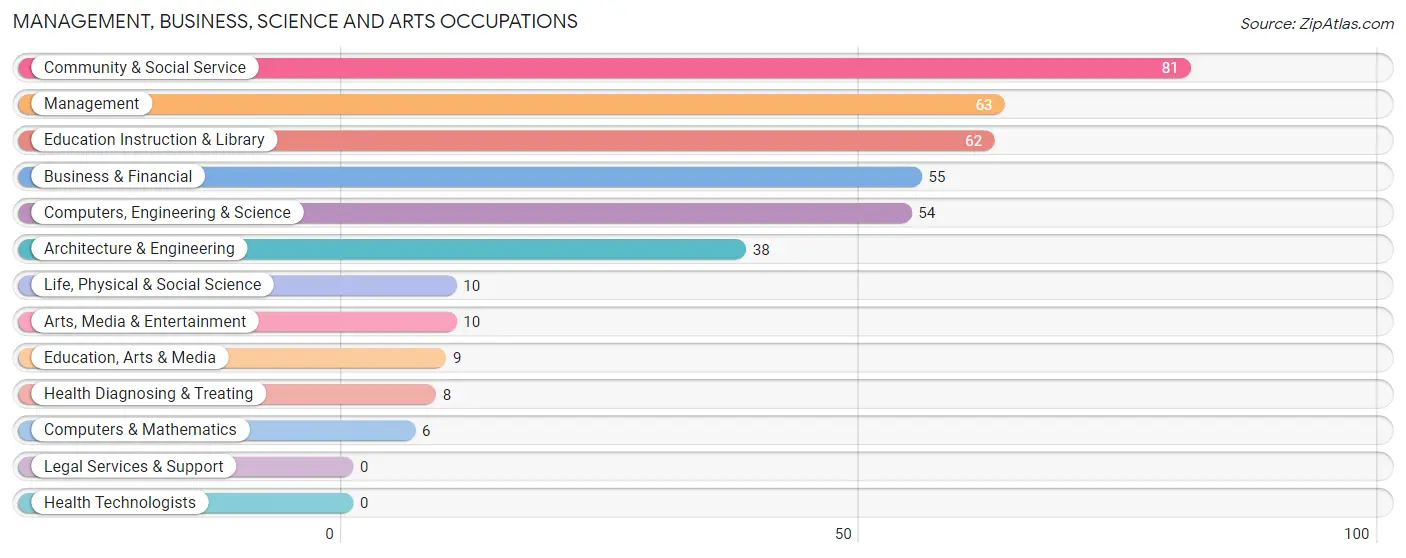
Management, Business, Science and Arts Occupations
The most common Management, Business, Science and Arts occupations in Chester Center are Community & Social Service (81 | 9.5%), Management (63 | 7.4%), Education Instruction & Library (62 | 7.2%), Business & Financial (55 | 6.4%), and Computers, Engineering & Science (54 | 6.3%).
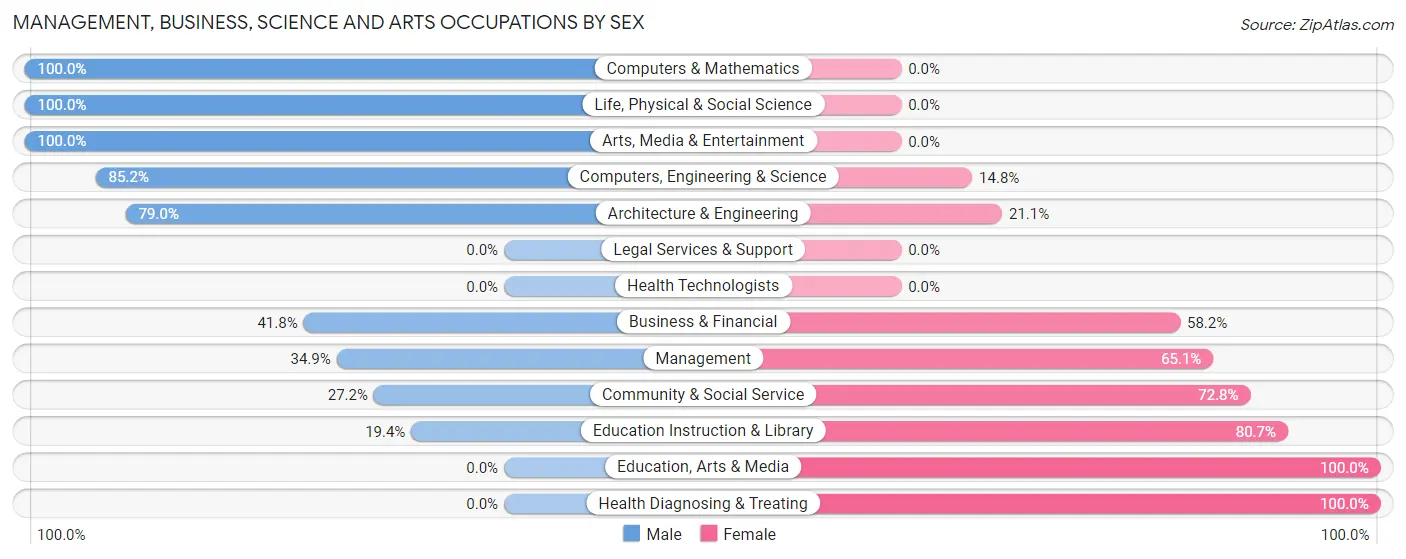
Management, Business, Science and Arts Occupations by Sex
Within the Management, Business, Science and Arts occupations in Chester Center, the most male-oriented occupations are Computers & Mathematics (100.0%), Life, Physical & Social Science (100.0%), and Arts, Media & Entertainment (100.0%), while the most female-oriented occupations are Education, Arts & Media (100.0%), Health Diagnosing & Treating (100.0%), and Education Instruction & Library (80.6%).
| Occupation | Male | Female |
| Management | 22 (34.9%) | 41 (65.1%) |
| Business & Financial | 23 (41.8%) | 32 (58.2%) |
| Computers, Engineering & Science | 46 (85.2%) | 8 (14.8%) |
| Computers & Mathematics | 6 (100.0%) | 0 (0.0%) |
| Architecture & Engineering | 30 (78.9%) | 8 (21.0%) |
| Life, Physical & Social Science | 10 (100.0%) | 0 (0.0%) |
| Community & Social Service | 22 (27.2%) | 59 (72.8%) |
| Education, Arts & Media | 0 (0.0%) | 9 (100.0%) |
| Legal Services & Support | 0 (0.0%) | 0 (0.0%) |
| Education Instruction & Library | 12 (19.4%) | 50 (80.6%) |
| Arts, Media & Entertainment | 10 (100.0%) | 0 (0.0%) |
| Health Diagnosing & Treating | 0 (0.0%) | 8 (100.0%) |
| Health Technologists | 0 (0.0%) | 0 (0.0%) |
| Total (Category) | 113 (43.3%) | 148 (56.7%) |
| Total (Overall) | 429 (50.1%) | 427 (49.9%) |
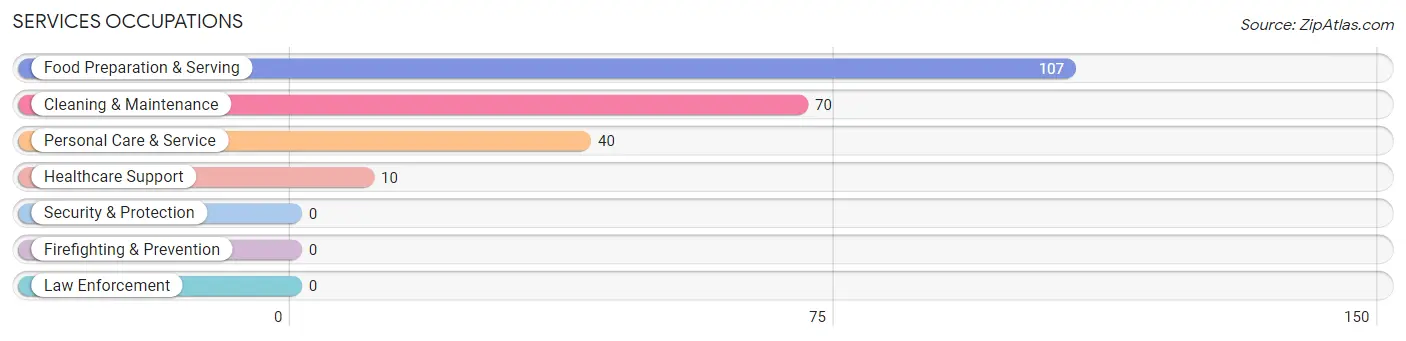
Services Occupations
The most common Services occupations in Chester Center are Food Preparation & Serving (107 | 12.5%), Cleaning & Maintenance (70 | 8.2%), Personal Care & Service (40 | 4.7%), and Healthcare Support (10 | 1.2%).
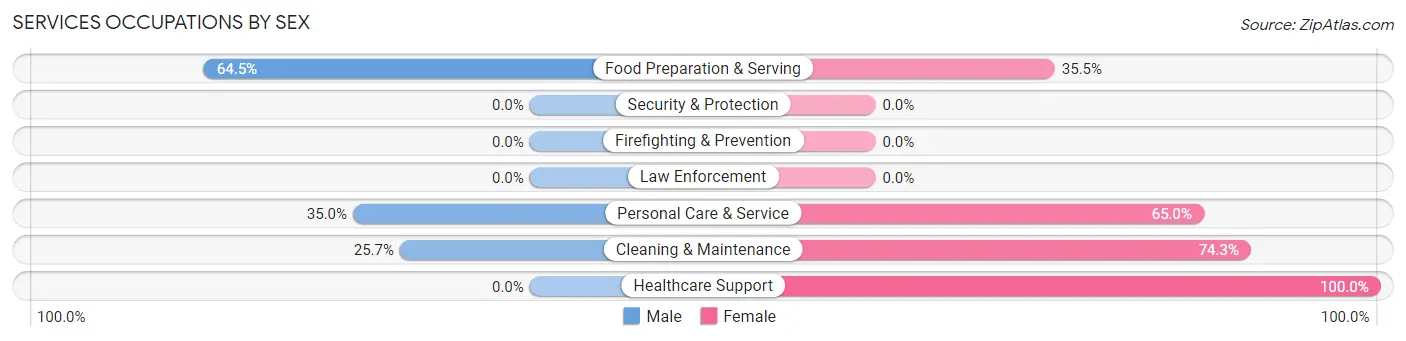
Services Occupations by Sex
Within the Services occupations in Chester Center, the most male-oriented occupations are Food Preparation & Serving (64.5%), Personal Care & Service (35.0%), and Cleaning & Maintenance (25.7%), while the most female-oriented occupations are Healthcare Support (100.0%), Cleaning & Maintenance (74.3%), and Personal Care & Service (65.0%).
| Occupation | Male | Female |
| Healthcare Support | 0 (0.0%) | 10 (100.0%) |
| Security & Protection | 0 (0.0%) | 0 (0.0%) |
| Firefighting & Prevention | 0 (0.0%) | 0 (0.0%) |
| Law Enforcement | 0 (0.0%) | 0 (0.0%) |
| Food Preparation & Serving | 69 (64.5%) | 38 (35.5%) |
| Cleaning & Maintenance | 18 (25.7%) | 52 (74.3%) |
| Personal Care & Service | 14 (35.0%) | 26 (65.0%) |
| Total (Category) | 101 (44.5%) | 126 (55.5%) |
| Total (Overall) | 429 (50.1%) | 427 (49.9%) |
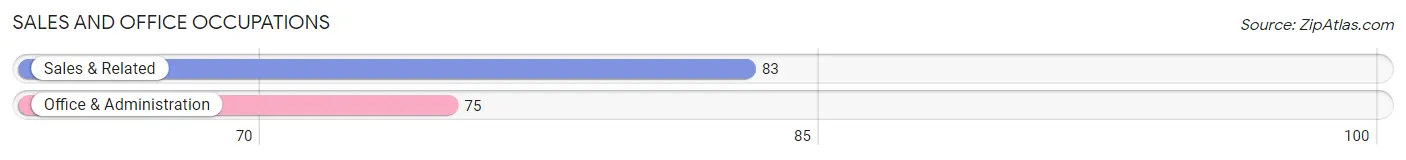
Sales and Office Occupations
The most common Sales and Office occupations in Chester Center are Sales & Related (83 | 9.7%), and Office & Administration (75 | 8.8%).
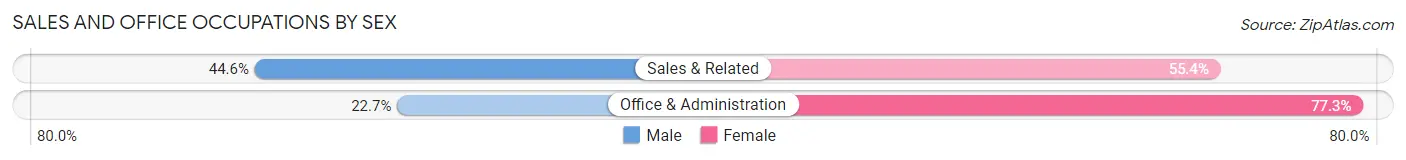
Sales and Office Occupations by Sex
| Occupation | Male | Female |
| Sales & Related | 37 (44.6%) | 46 (55.4%) |
| Office & Administration | 17 (22.7%) | 58 (77.3%) |
| Total (Category) | 54 (34.2%) | 104 (65.8%) |
| Total (Overall) | 429 (50.1%) | 427 (49.9%) |
Natural Resources, Construction and Maintenance Occupations
The most common Natural Resources, Construction and Maintenance occupations in Chester Center are , and Construction & Extraction (59 | 6.9%).
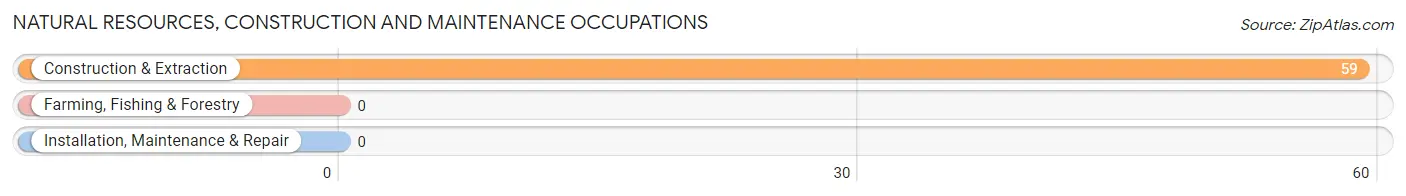
Natural Resources, Construction and Maintenance Occupations by Sex
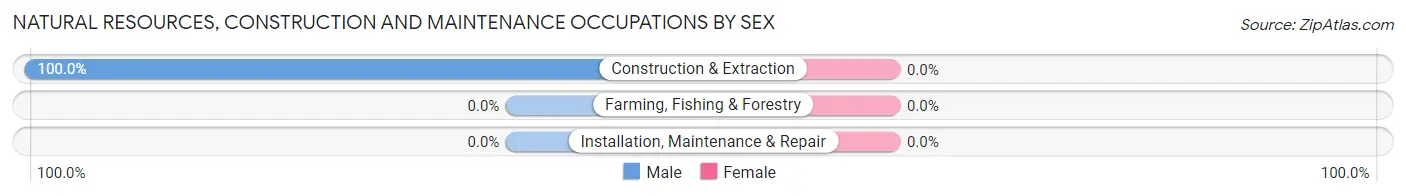
| Occupation | Male | Female |
| Farming, Fishing & Forestry | 0 (0.0%) | 0 (0.0%) |
| Construction & Extraction | 59 (100.0%) | 0 (0.0%) |
| Installation, Maintenance & Repair | 0 (0.0%) | 0 (0.0%) |
| Total (Category) | 59 (100.0%) | 0 (0.0%) |
| Total (Overall) | 429 (50.1%) | 427 (49.9%) |
Production, Transportation and Moving Occupations
The most common Production, Transportation and Moving occupations in Chester Center are Production (121 | 14.1%), Transportation (17 | 2.0%), and Material Moving (13 | 1.5%).
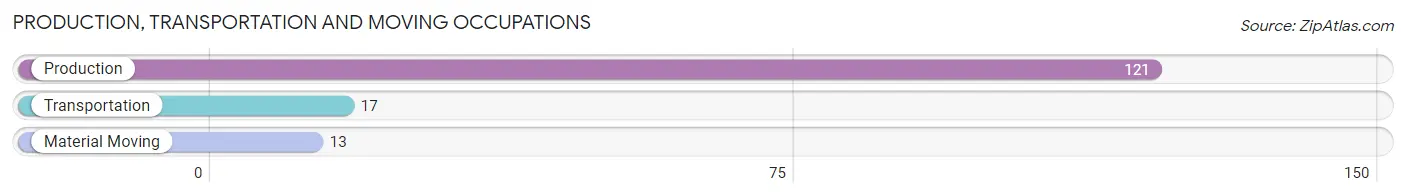
Production, Transportation and Moving Occupations by Sex
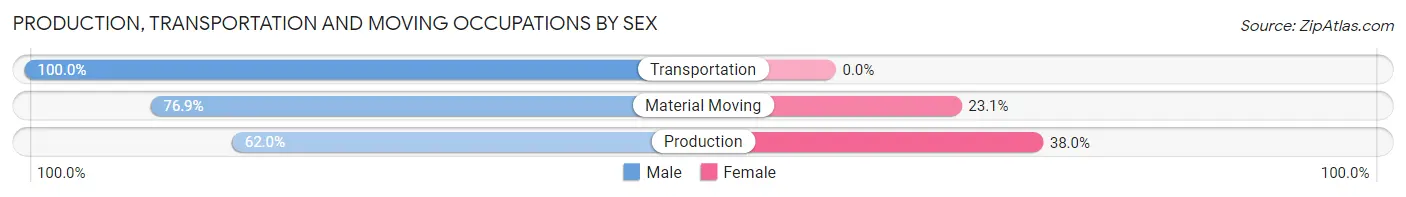
| Occupation | Male | Female |
| Production | 75 (62.0%) | 46 (38.0%) |
| Transportation | 17 (100.0%) | 0 (0.0%) |
| Material Moving | 10 (76.9%) | 3 (23.1%) |
| Total (Category) | 102 (67.5%) | 49 (32.5%) |
| Total (Overall) | 429 (50.1%) | 427 (49.9%) |
Employment Industries by Sex in Chester Center
Employment Industries in Chester Center
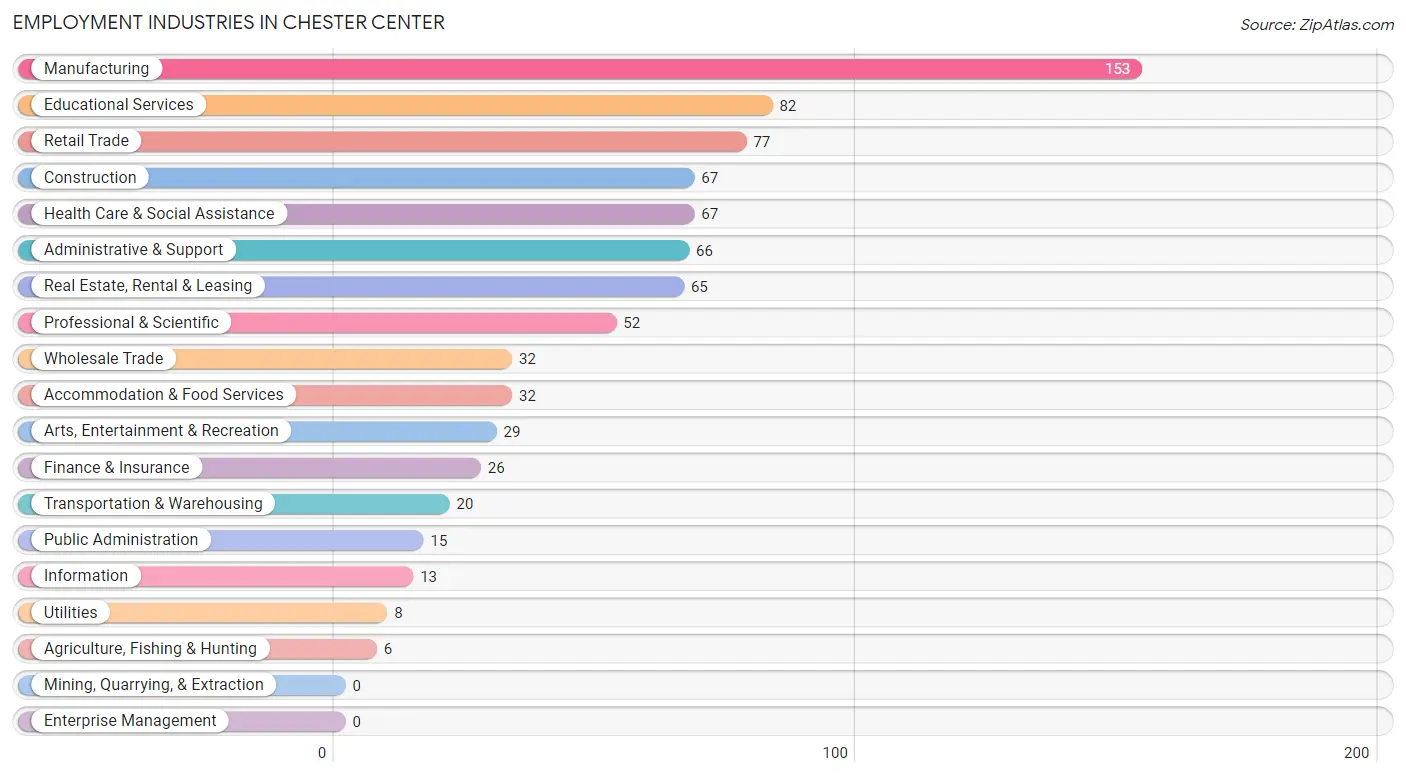
The major employment industries in Chester Center include Manufacturing (153 | 17.9%), Educational Services (82 | 9.6%), Retail Trade (77 | 9.0%), Construction (67 | 7.8%), and Health Care & Social Assistance (67 | 7.8%).
Employment Industries by Sex in Chester Center
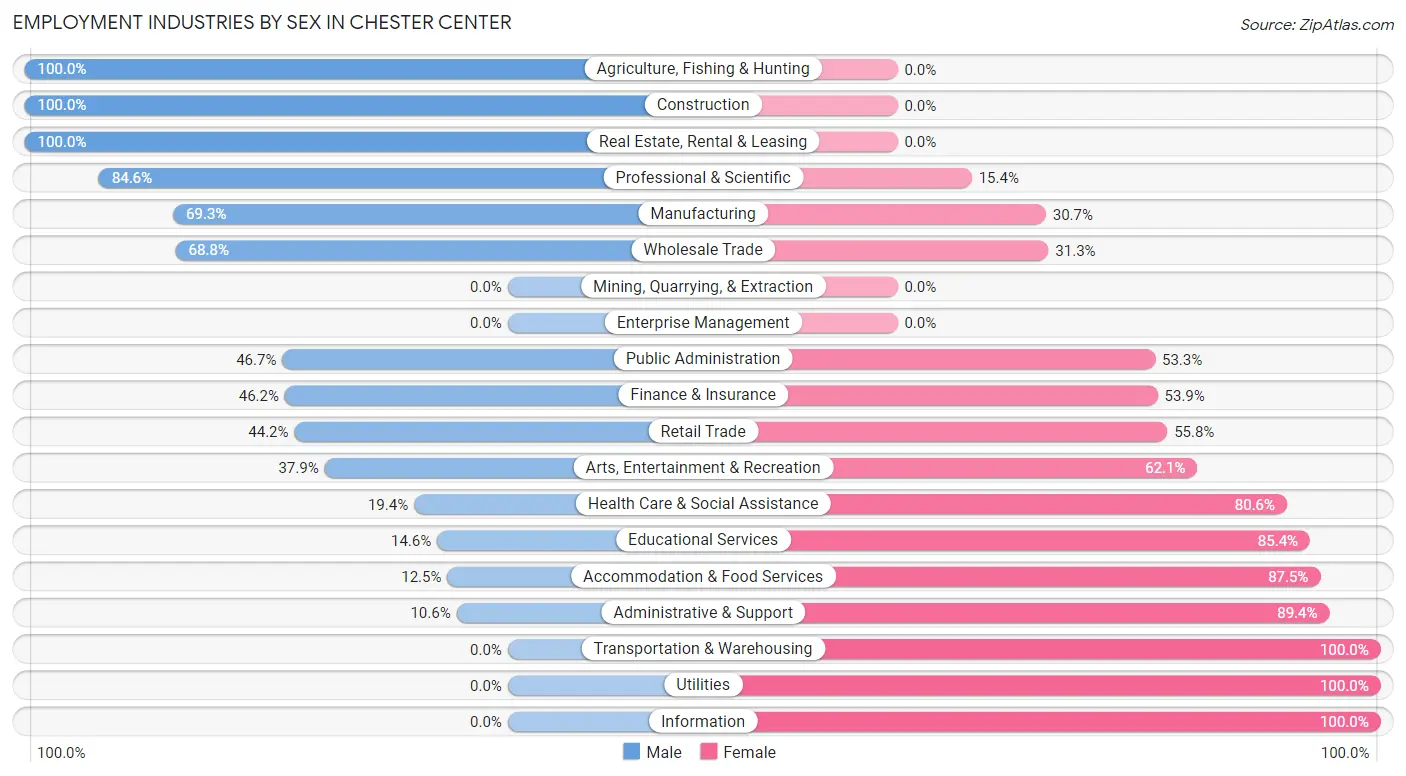
The Chester Center industries that see more men than women are Agriculture, Fishing & Hunting (100.0%), Construction (100.0%), and Real Estate, Rental & Leasing (100.0%), whereas the industries that tend to have a higher number of women are Transportation & Warehousing (100.0%), Utilities (100.0%), and Information (100.0%).
| Industry | Male | Female |
| Agriculture, Fishing & Hunting | 6 (100.0%) | 0 (0.0%) |
| Mining, Quarrying, & Extraction | 0 (0.0%) | 0 (0.0%) |
| Construction | 67 (100.0%) | 0 (0.0%) |
| Manufacturing | 106 (69.3%) | 47 (30.7%) |
| Wholesale Trade | 22 (68.8%) | 10 (31.2%) |
| Retail Trade | 34 (44.2%) | 43 (55.8%) |
| Transportation & Warehousing | 0 (0.0%) | 20 (100.0%) |
| Utilities | 0 (0.0%) | 8 (100.0%) |
| Information | 0 (0.0%) | 13 (100.0%) |
| Finance & Insurance | 12 (46.2%) | 14 (53.8%) |
| Real Estate, Rental & Leasing | 65 (100.0%) | 0 (0.0%) |
| Professional & Scientific | 44 (84.6%) | 8 (15.4%) |
| Enterprise Management | 0 (0.0%) | 0 (0.0%) |
| Administrative & Support | 7 (10.6%) | 59 (89.4%) |
| Educational Services | 12 (14.6%) | 70 (85.4%) |
| Health Care & Social Assistance | 13 (19.4%) | 54 (80.6%) |
| Arts, Entertainment & Recreation | 11 (37.9%) | 18 (62.1%) |
| Accommodation & Food Services | 4 (12.5%) | 28 (87.5%) |
| Public Administration | 7 (46.7%) | 8 (53.3%) |
| Total | 429 (50.1%) | 427 (49.9%) |
Education in Chester Center
School Enrollment in Chester Center
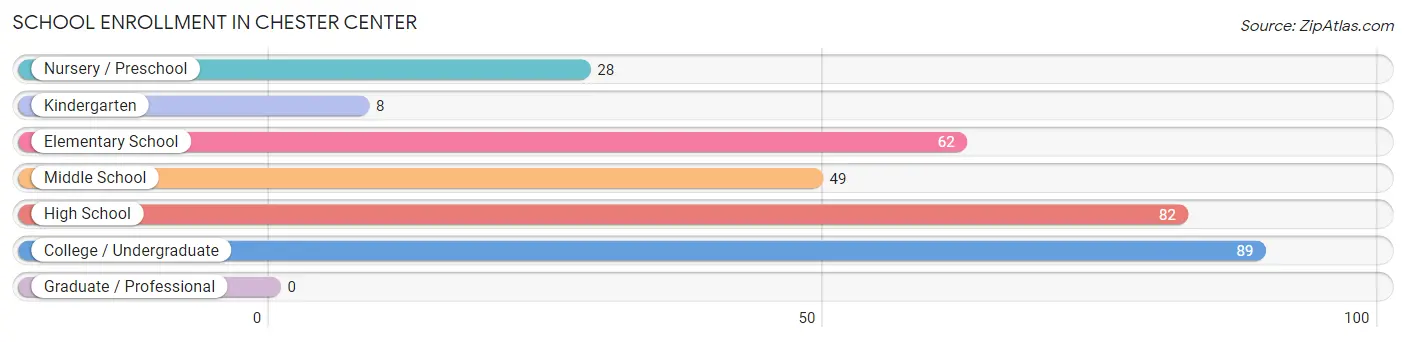
The most common levels of schooling among the 318 students in Chester Center are college / undergraduate (89 | 28.0%), high school (82 | 25.8%), and elementary school (62 | 19.5%).
| School Level | # Students | % Students |
| Nursery / Preschool | 28 | 8.8% |
| Kindergarten | 8 | 2.5% |
| Elementary School | 62 | 19.5% |
| Middle School | 49 | 15.4% |
| High School | 82 | 25.8% |
| College / Undergraduate | 89 | 28.0% |
| Graduate / Professional | 0 | 0.0% |
| Total | 318 | 100.0% |
School Enrollment by Age by Funding Source in Chester Center
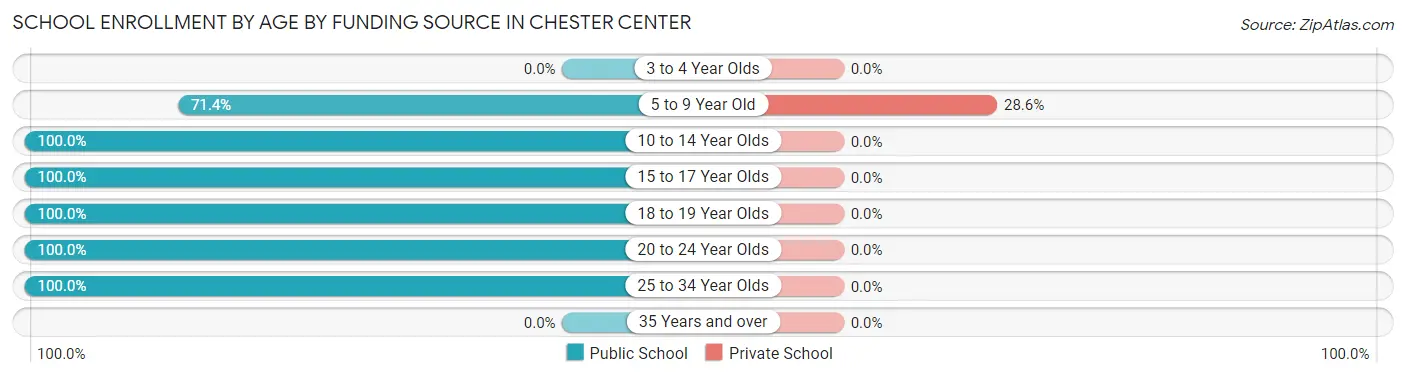
Out of a total of 318 students who are enrolled in schools in Chester Center, 28 (8.8%) attend a private institution, while the remaining 290 (91.2%) are enrolled in public schools. The age group of 5 to 9 year old has the highest likelihood of being enrolled in private schools, with 28 (28.6% in the age bracket) enrolled. Conversely, the age group of 10 to 14 year olds has the lowest likelihood of being enrolled in a private school, with 49 (100.0% in the age bracket) attending a public institution.
| Age Bracket | Public School | Private School |
| 3 to 4 Year Olds | 0 (0.0%) | 0 (0.0%) |
| 5 to 9 Year Old | 70 (71.4%) | 28 (28.6%) |
| 10 to 14 Year Olds | 49 (100.0%) | 0 (0.0%) |
| 15 to 17 Year Olds | 67 (100.0%) | 0 (0.0%) |
| 18 to 19 Year Olds | 20 (100.0%) | 0 (0.0%) |
| 20 to 24 Year Olds | 79 (100.0%) | 0 (0.0%) |
| 25 to 34 Year Olds | 5 (100.0%) | 0 (0.0%) |
| 35 Years and over | 0 (0.0%) | 0 (0.0%) |
| Total | 290 (91.2%) | 28 (8.8%) |
Educational Attainment by Field of Study in Chester Center
Education (90 | 17.6%), arts & humanities (62 | 12.2%), science & technology (61 | 12.0%), visual & performing arts (51 | 10.0%), and business (48 | 9.4%) are the most common fields of study among 510 individuals in Chester Center who have obtained a bachelor's degree or higher.
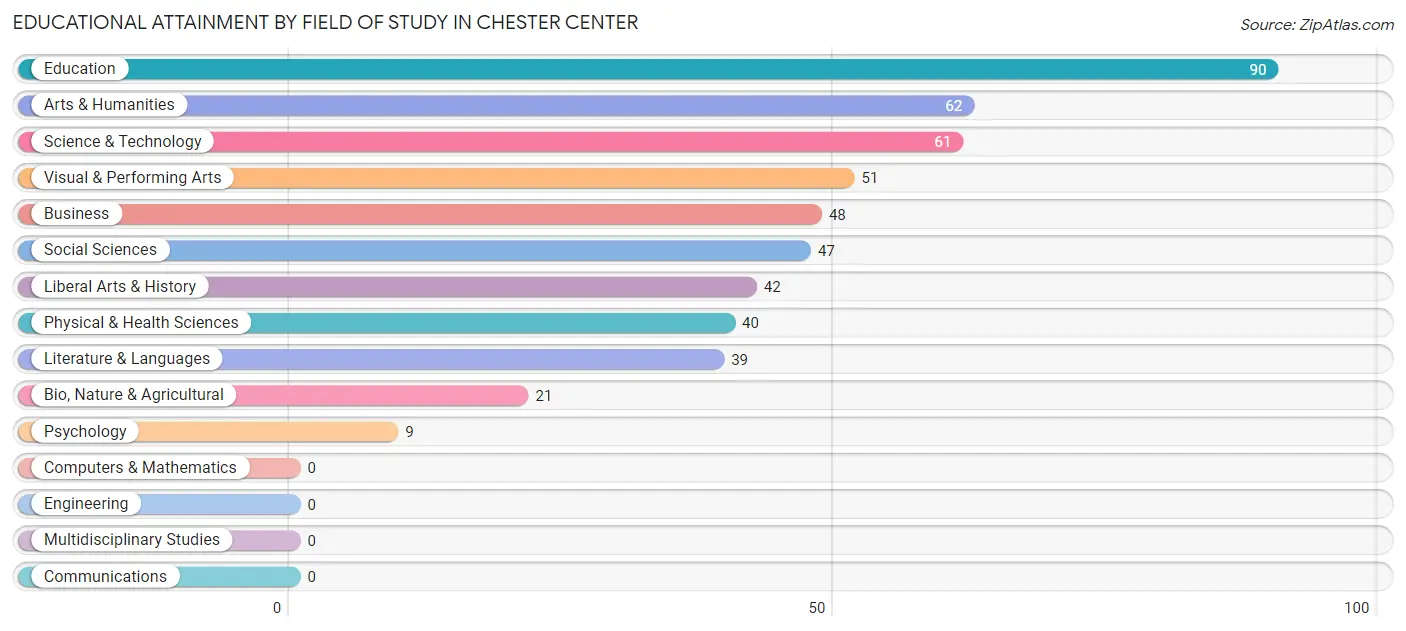
| Field of Study | # Graduates | % Graduates |
| Computers & Mathematics | 0 | 0.0% |
| Bio, Nature & Agricultural | 21 | 4.1% |
| Physical & Health Sciences | 40 | 7.8% |
| Psychology | 9 | 1.8% |
| Social Sciences | 47 | 9.2% |
| Engineering | 0 | 0.0% |
| Multidisciplinary Studies | 0 | 0.0% |
| Science & Technology | 61 | 12.0% |
| Business | 48 | 9.4% |
| Education | 90 | 17.6% |
| Literature & Languages | 39 | 7.6% |
| Liberal Arts & History | 42 | 8.2% |
| Visual & Performing Arts | 51 | 10.0% |
| Communications | 0 | 0.0% |
| Arts & Humanities | 62 | 12.2% |
| Total | 510 | 100.0% |
Transportation & Commute in Chester Center
Vehicle Availability by Sex in Chester Center
The most prevalent vehicle ownership categories in Chester Center are males with 4 vehicles (178, accounting for 41.8%) and females with 4 vehicles (50, making up 42.0%).
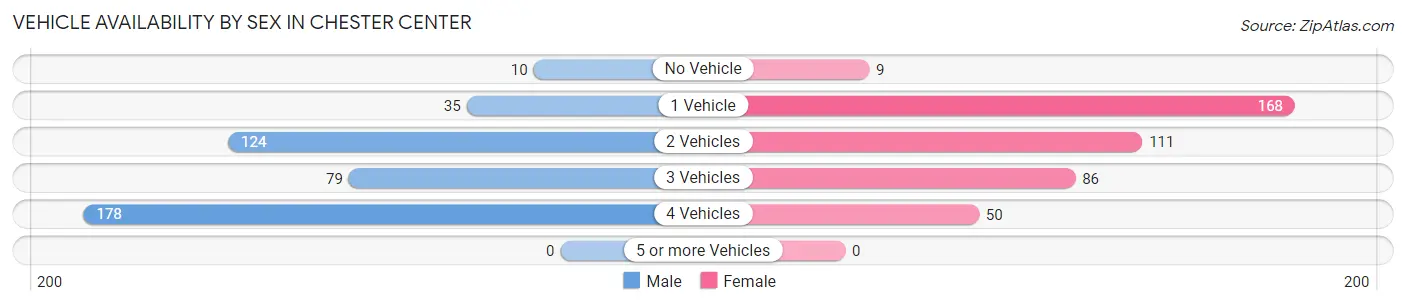
| Vehicles Available | Male | Female |
| No Vehicle | 10 (2.4%) | 9 (2.1%) |
| 1 Vehicle | 35 (8.2%) | 168 (39.6%) |
| 2 Vehicles | 124 (29.1%) | 111 (26.2%) |
| 3 Vehicles | 79 (18.5%) | 86 (20.3%) |
| 4 Vehicles | 178 (41.8%) | 50 (11.8%) |
| 5 or more Vehicles | 0 (0.0%) | 0 (0.0%) |
| Total | 426 (100.0%) | 424 (100.0%) |
Commute Time in Chester Center
The most frequently occuring commute durations in Chester Center are 20 to 24 minutes (244 commuters, 34.0%), 10 to 14 minutes (133 commuters, 18.5%), and 15 to 19 minutes (85 commuters, 11.8%).
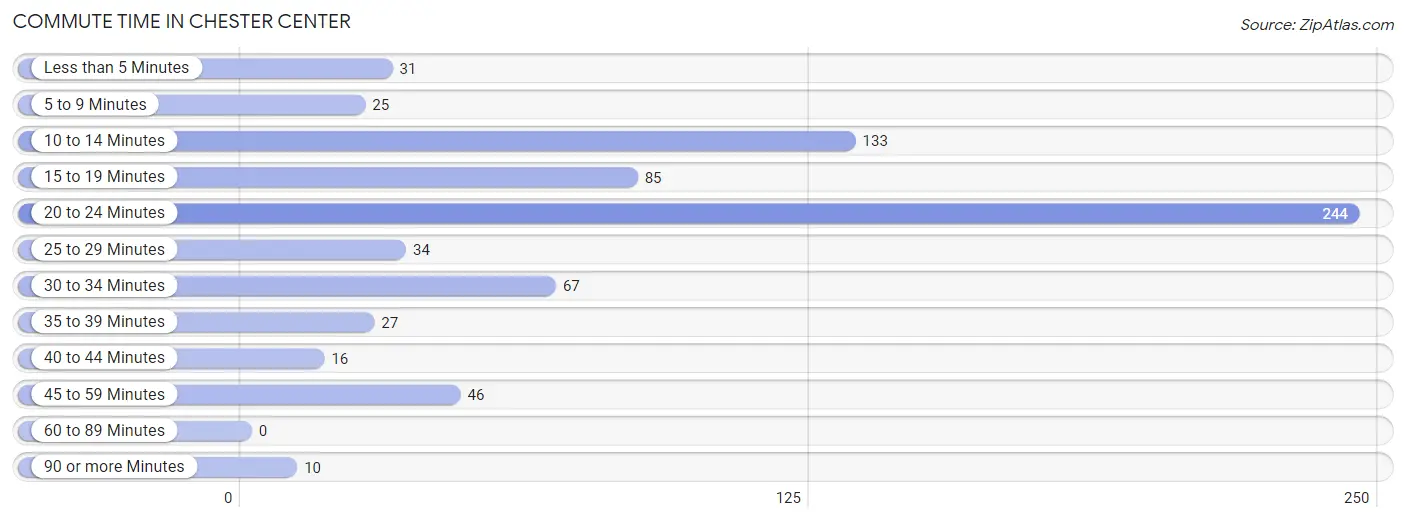
| Commute Time | # Commuters | % Commuters |
| Less than 5 Minutes | 31 | 4.3% |
| 5 to 9 Minutes | 25 | 3.5% |
| 10 to 14 Minutes | 133 | 18.5% |
| 15 to 19 Minutes | 85 | 11.8% |
| 20 to 24 Minutes | 244 | 34.0% |
| 25 to 29 Minutes | 34 | 4.7% |
| 30 to 34 Minutes | 67 | 9.3% |
| 35 to 39 Minutes | 27 | 3.8% |
| 40 to 44 Minutes | 16 | 2.2% |
| 45 to 59 Minutes | 46 | 6.4% |
| 60 to 89 Minutes | 0 | 0.0% |
| 90 or more Minutes | 10 | 1.4% |
Commute Time by Sex in Chester Center
The most common commute times in Chester Center are 20 to 24 minutes (144 commuters, 43.9%) for males and 20 to 24 minutes (100 commuters, 25.6%) for females.
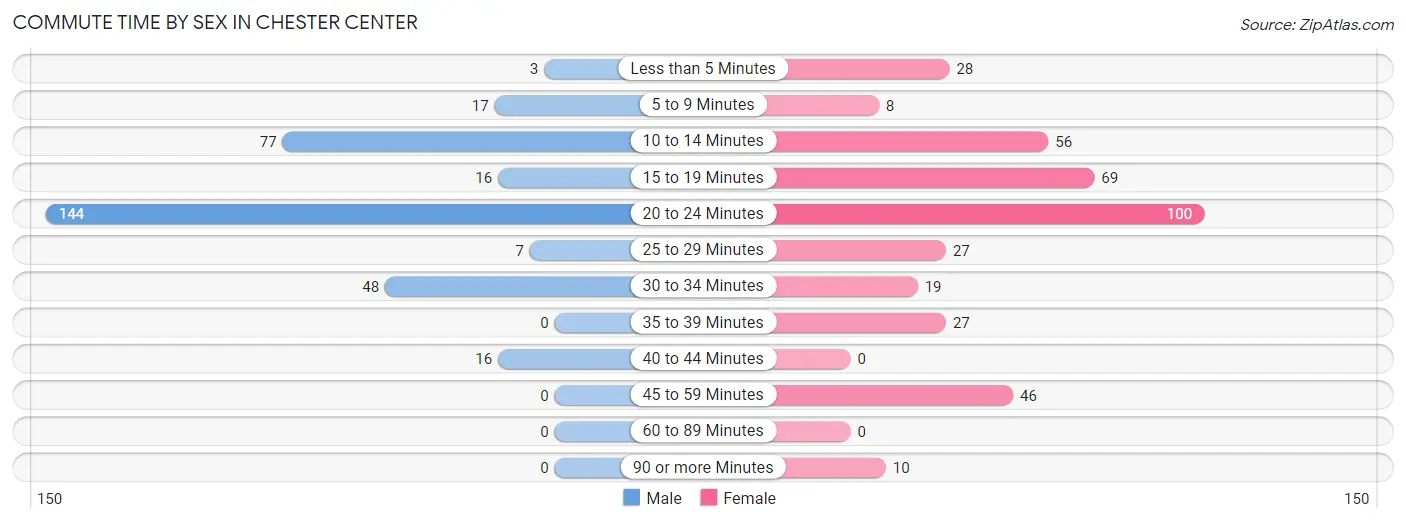
| Commute Time | Male | Female |
| Less than 5 Minutes | 3 (0.9%) | 28 (7.2%) |
| 5 to 9 Minutes | 17 (5.2%) | 8 (2.1%) |
| 10 to 14 Minutes | 77 (23.5%) | 56 (14.4%) |
| 15 to 19 Minutes | 16 (4.9%) | 69 (17.7%) |
| 20 to 24 Minutes | 144 (43.9%) | 100 (25.6%) |
| 25 to 29 Minutes | 7 (2.1%) | 27 (6.9%) |
| 30 to 34 Minutes | 48 (14.6%) | 19 (4.9%) |
| 35 to 39 Minutes | 0 (0.0%) | 27 (6.9%) |
| 40 to 44 Minutes | 16 (4.9%) | 0 (0.0%) |
| 45 to 59 Minutes | 0 (0.0%) | 46 (11.8%) |
| 60 to 89 Minutes | 0 (0.0%) | 0 (0.0%) |
| 90 or more Minutes | 0 (0.0%) | 10 (2.6%) |
Time of Departure to Work by Sex in Chester Center
The most frequent times of departure to work in Chester Center are 9:00 AM to 9:59 AM (76, 23.2%) for males and 4:00 PM to 11:59 PM (70, 17.9%) for females.
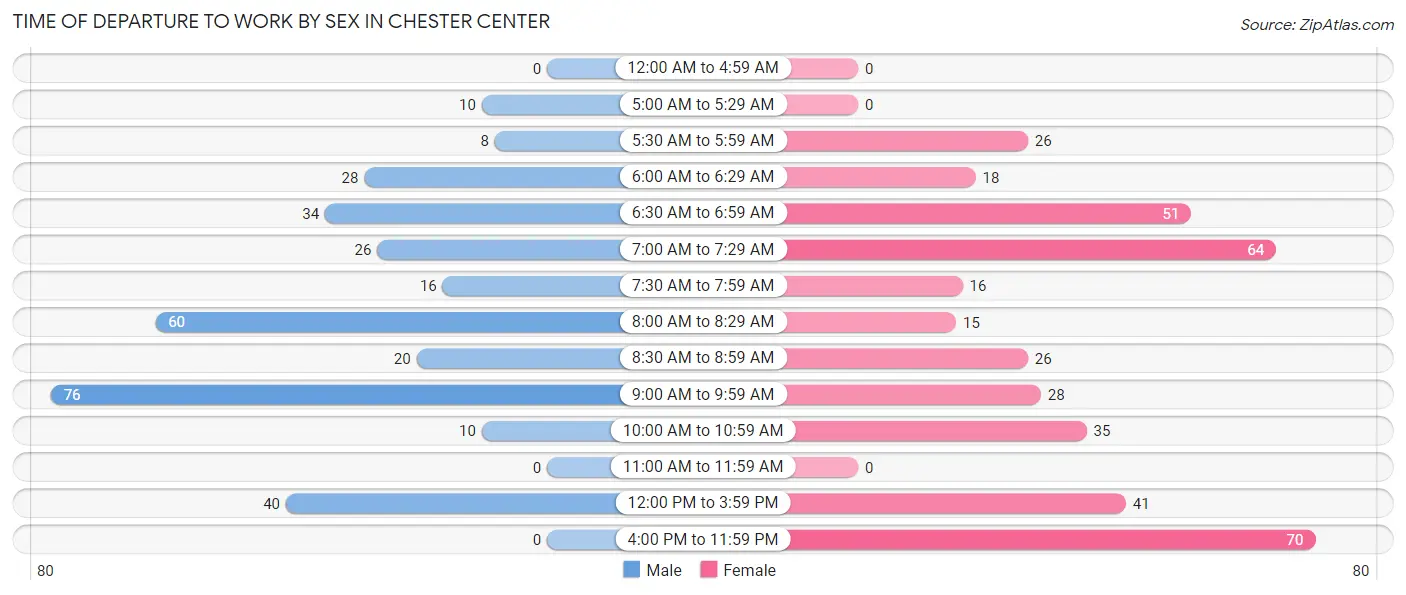
| Time of Departure | Male | Female |
| 12:00 AM to 4:59 AM | 0 (0.0%) | 0 (0.0%) |
| 5:00 AM to 5:29 AM | 10 (3.0%) | 0 (0.0%) |
| 5:30 AM to 5:59 AM | 8 (2.4%) | 26 (6.7%) |
| 6:00 AM to 6:29 AM | 28 (8.5%) | 18 (4.6%) |
| 6:30 AM to 6:59 AM | 34 (10.4%) | 51 (13.1%) |
| 7:00 AM to 7:29 AM | 26 (7.9%) | 64 (16.4%) |
| 7:30 AM to 7:59 AM | 16 (4.9%) | 16 (4.1%) |
| 8:00 AM to 8:29 AM | 60 (18.3%) | 15 (3.8%) |
| 8:30 AM to 8:59 AM | 20 (6.1%) | 26 (6.7%) |
| 9:00 AM to 9:59 AM | 76 (23.2%) | 28 (7.2%) |
| 10:00 AM to 10:59 AM | 10 (3.0%) | 35 (9.0%) |
| 11:00 AM to 11:59 AM | 0 (0.0%) | 0 (0.0%) |
| 12:00 PM to 3:59 PM | 40 (12.2%) | 41 (10.5%) |
| 4:00 PM to 11:59 PM | 0 (0.0%) | 70 (17.9%) |
| Total | 328 (100.0%) | 390 (100.0%) |
Housing Occupancy in Chester Center
Occupancy by Ownership in Chester Center
Of the total 770 dwellings in Chester Center, owner-occupied units account for 529 (68.7%), while renter-occupied units make up 241 (31.3%).
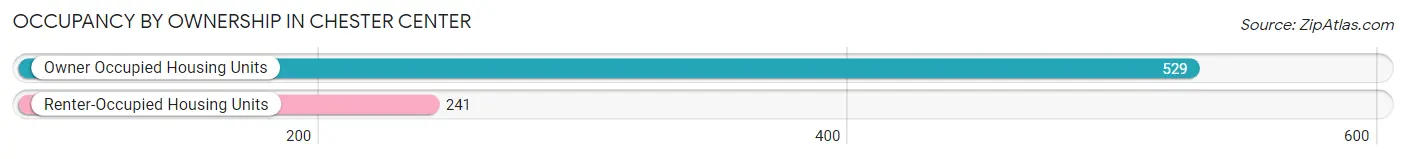
| Occupancy | # Housing Units | % Housing Units |
| Owner Occupied Housing Units | 529 | 68.7% |
| Renter-Occupied Housing Units | 241 | 31.3% |
| Total Occupied Housing Units | 770 | 100.0% |
Occupancy by Household Size in Chester Center
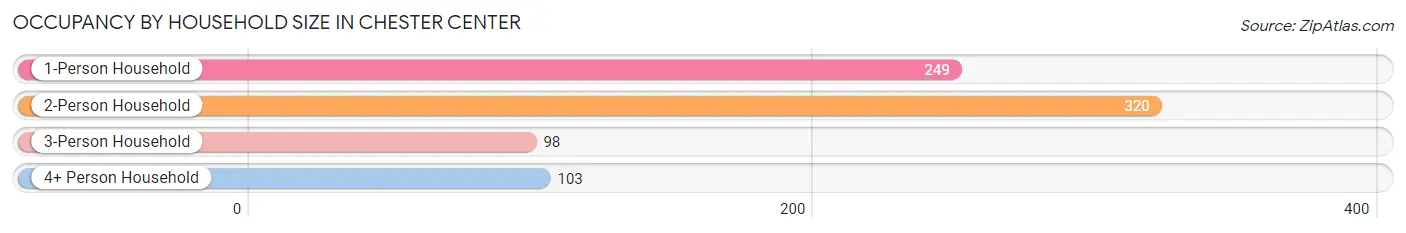
| Household Size | # Housing Units | % Housing Units |
| 1-Person Household | 249 | 32.3% |
| 2-Person Household | 320 | 41.6% |
| 3-Person Household | 98 | 12.7% |
| 4+ Person Household | 103 | 13.4% |
| Total Housing Units | 770 | 100.0% |
Occupancy by Ownership by Household Size in Chester Center
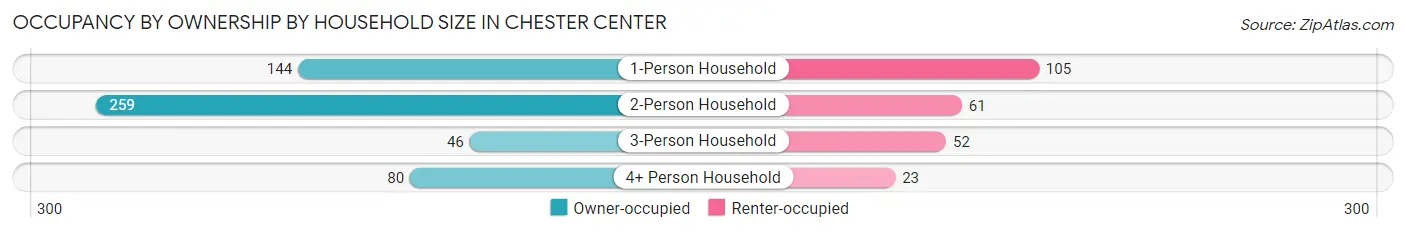
| Household Size | Owner-occupied | Renter-occupied |
| 1-Person Household | 144 (57.8%) | 105 (42.2%) |
| 2-Person Household | 259 (80.9%) | 61 (19.1%) |
| 3-Person Household | 46 (46.9%) | 52 (53.1%) |
| 4+ Person Household | 80 (77.7%) | 23 (22.3%) |
| Total Housing Units | 529 (68.7%) | 241 (31.3%) |
Occupancy by Educational Attainment in Chester Center
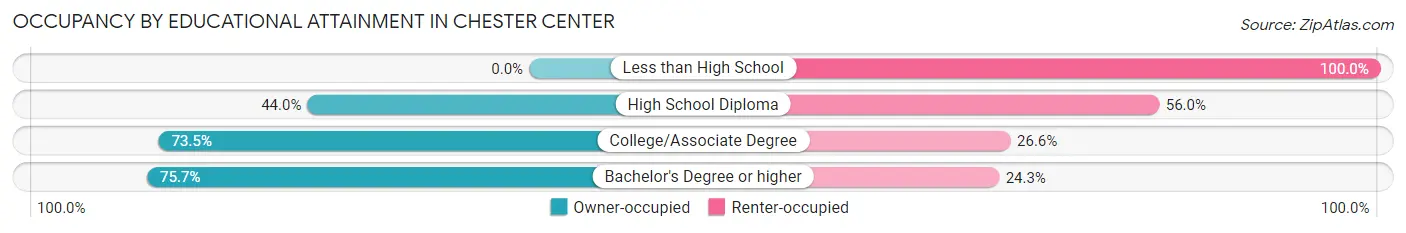
| Household Size | Owner-occupied | Renter-occupied |
| Less than High School | 0 (0.0%) | 23 (100.0%) |
| High School Diploma | 40 (44.0%) | 51 (56.0%) |
| College/Associate Degree | 249 (73.5%) | 90 (26.6%) |
| Bachelor's Degree or higher | 240 (75.7%) | 77 (24.3%) |
Occupancy by Age of Householder in Chester Center
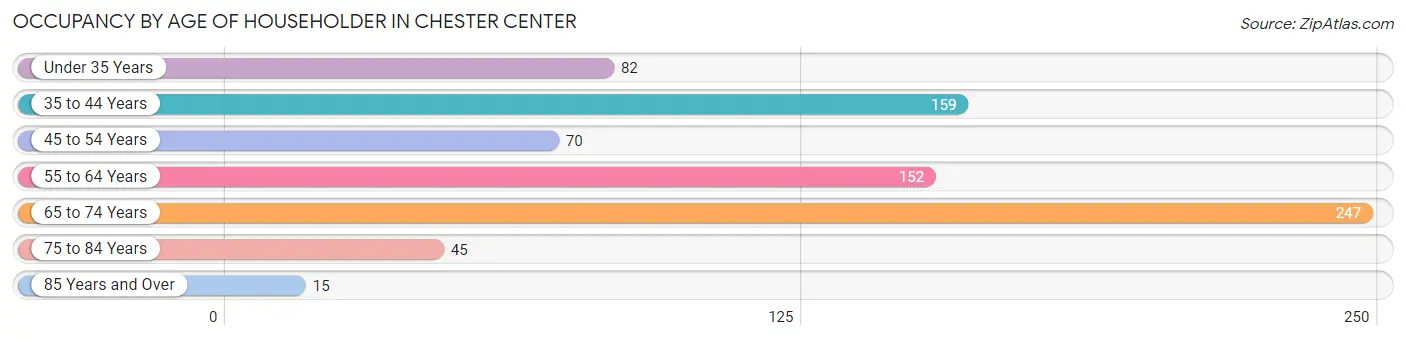
| Age Bracket | # Households | % Households |
| Under 35 Years | 82 | 10.6% |
| 35 to 44 Years | 159 | 20.6% |
| 45 to 54 Years | 70 | 9.1% |
| 55 to 64 Years | 152 | 19.7% |
| 65 to 74 Years | 247 | 32.1% |
| 75 to 84 Years | 45 | 5.8% |
| 85 Years and Over | 15 | 1.9% |
| Total | 770 | 100.0% |
Housing Finances in Chester Center
Median Income by Occupancy in Chester Center
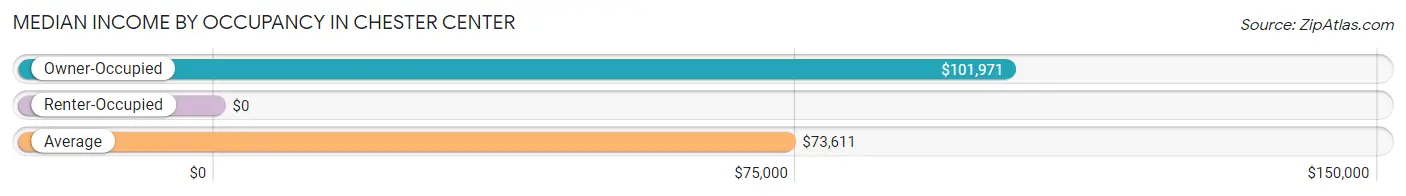
| Occupancy Type | # Households | Median Income |
| Owner-Occupied | 529 (68.7%) | $101,971 |
| Renter-Occupied | 241 (31.3%) | $0 |
| Average | 770 (100.0%) | $73,611 |
Occupancy by Householder Income Bracket in Chester Center
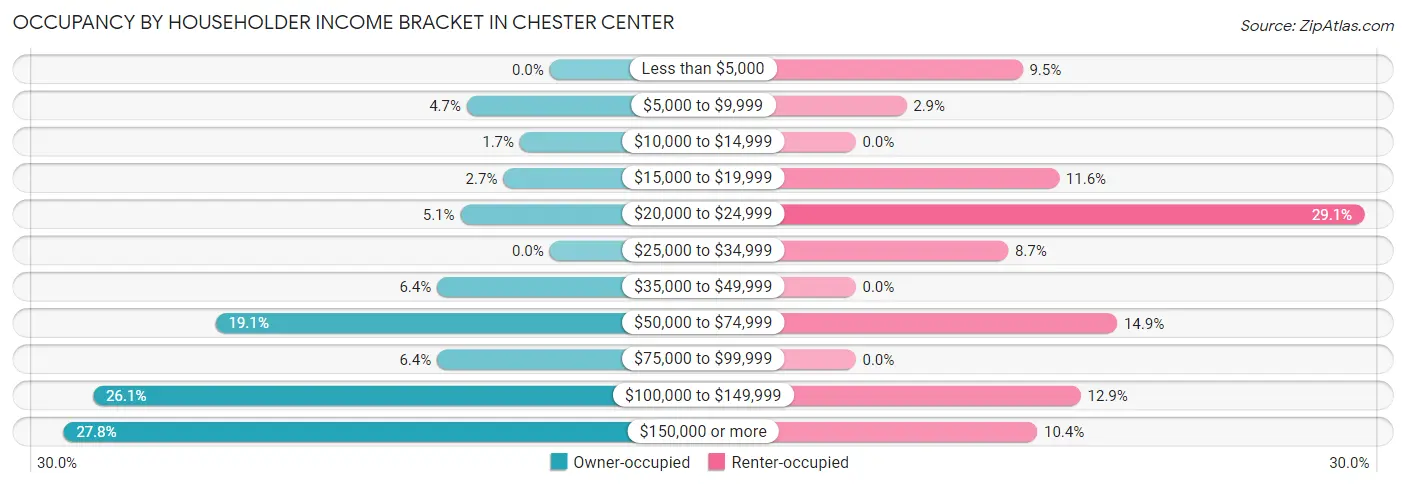
| Income Bracket | Owner-occupied | Renter-occupied |
| Less than $5,000 | 0 (0.0%) | 23 (9.5%) |
| $5,000 to $9,999 | 25 (4.7%) | 7 (2.9%) |
| $10,000 to $14,999 | 9 (1.7%) | 0 (0.0%) |
| $15,000 to $19,999 | 14 (2.6%) | 28 (11.6%) |
| $20,000 to $24,999 | 27 (5.1%) | 70 (29.0%) |
| $25,000 to $34,999 | 0 (0.0%) | 21 (8.7%) |
| $35,000 to $49,999 | 34 (6.4%) | 0 (0.0%) |
| $50,000 to $74,999 | 101 (19.1%) | 36 (14.9%) |
| $75,000 to $99,999 | 34 (6.4%) | 0 (0.0%) |
| $100,000 to $149,999 | 138 (26.1%) | 31 (12.9%) |
| $150,000 or more | 147 (27.8%) | 25 (10.4%) |
| Total | 529 (100.0%) | 241 (100.0%) |
Monthly Housing Cost Tiers in Chester Center
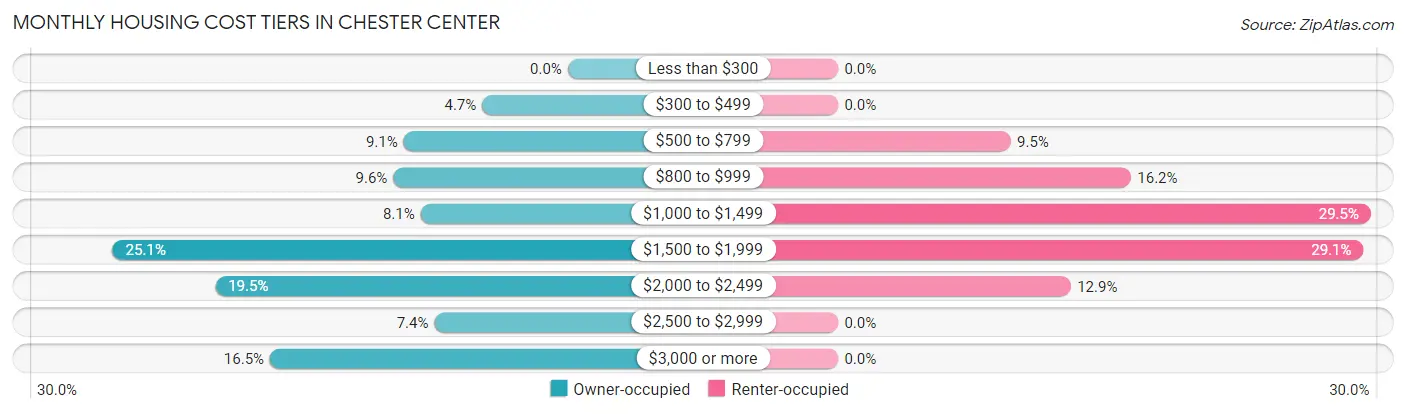
| Monthly Cost | Owner-occupied | Renter-occupied |
| Less than $300 | 0 (0.0%) | 0 (0.0%) |
| $300 to $499 | 25 (4.7%) | 0 (0.0%) |
| $500 to $799 | 48 (9.1%) | 23 (9.5%) |
| $800 to $999 | 51 (9.6%) | 39 (16.2%) |
| $1,000 to $1,499 | 43 (8.1%) | 71 (29.5%) |
| $1,500 to $1,999 | 133 (25.1%) | 70 (29.0%) |
| $2,000 to $2,499 | 103 (19.5%) | 31 (12.9%) |
| $2,500 to $2,999 | 39 (7.4%) | 0 (0.0%) |
| $3,000 or more | 87 (16.5%) | 0 (0.0%) |
| Total | 529 (100.0%) | 241 (100.0%) |
Physical Housing Characteristics in Chester Center
Housing Structures in Chester Center
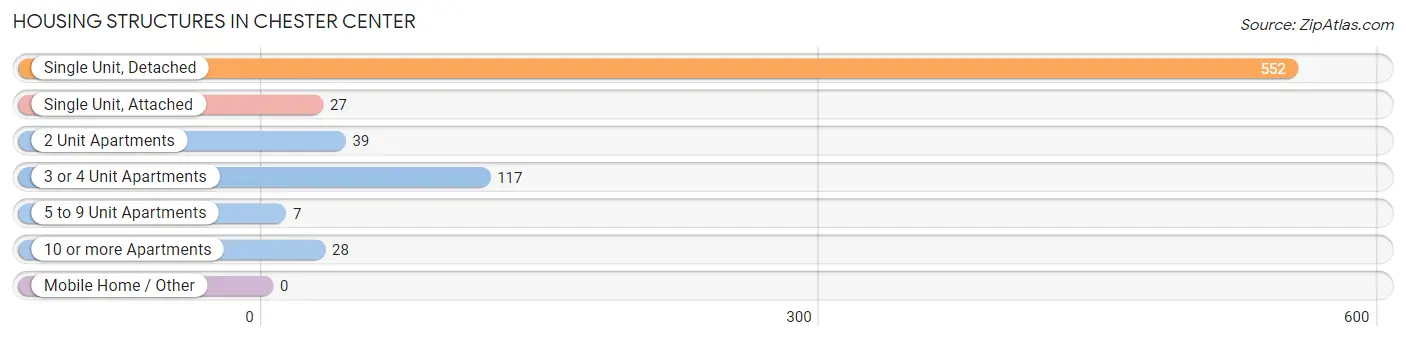
| Structure Type | # Housing Units | % Housing Units |
| Single Unit, Detached | 552 | 71.7% |
| Single Unit, Attached | 27 | 3.5% |
| 2 Unit Apartments | 39 | 5.1% |
| 3 or 4 Unit Apartments | 117 | 15.2% |
| 5 to 9 Unit Apartments | 7 | 0.9% |
| 10 or more Apartments | 28 | 3.6% |
| Mobile Home / Other | 0 | 0.0% |
| Total | 770 | 100.0% |
Housing Structures by Occupancy in Chester Center
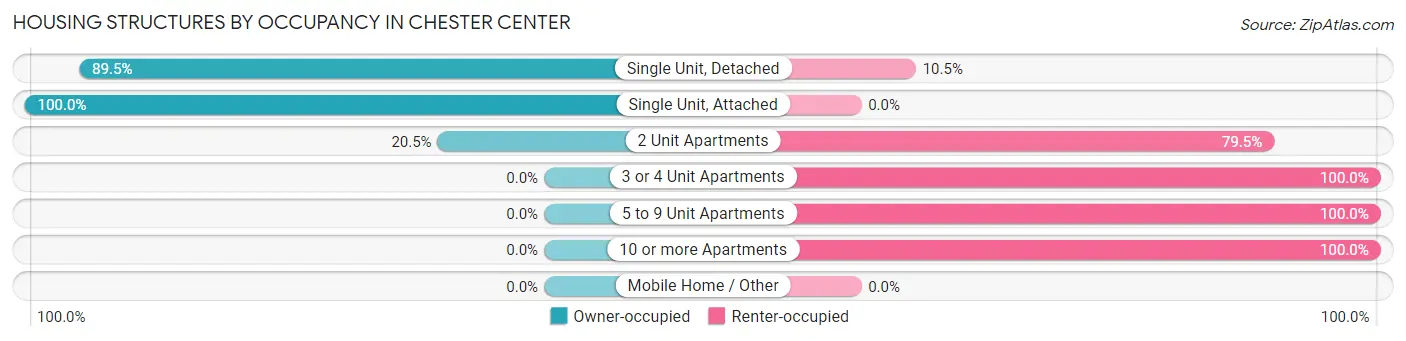
| Structure Type | Owner-occupied | Renter-occupied |
| Single Unit, Detached | 494 (89.5%) | 58 (10.5%) |
| Single Unit, Attached | 27 (100.0%) | 0 (0.0%) |
| 2 Unit Apartments | 8 (20.5%) | 31 (79.5%) |
| 3 or 4 Unit Apartments | 0 (0.0%) | 117 (100.0%) |
| 5 to 9 Unit Apartments | 0 (0.0%) | 7 (100.0%) |
| 10 or more Apartments | 0 (0.0%) | 28 (100.0%) |
| Mobile Home / Other | 0 (0.0%) | 0 (0.0%) |
| Total | 529 (68.7%) | 241 (31.3%) |
Housing Structures by Number of Rooms in Chester Center
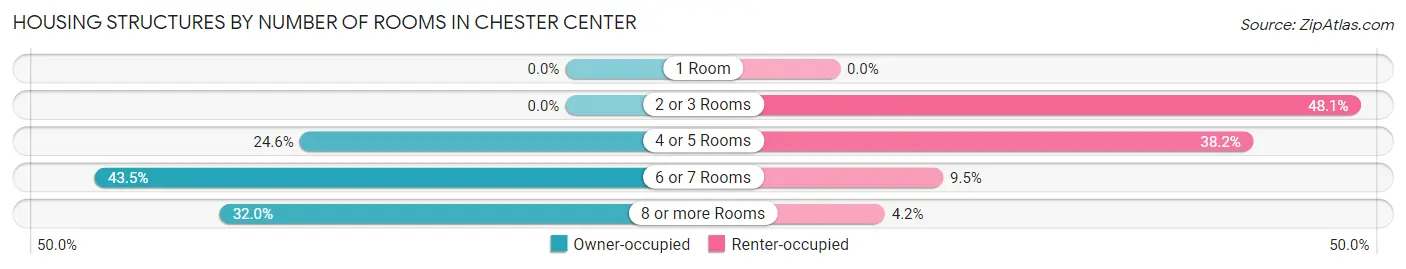
| Number of Rooms | Owner-occupied | Renter-occupied |
| 1 Room | 0 (0.0%) | 0 (0.0%) |
| 2 or 3 Rooms | 0 (0.0%) | 116 (48.1%) |
| 4 or 5 Rooms | 130 (24.6%) | 92 (38.2%) |
| 6 or 7 Rooms | 230 (43.5%) | 23 (9.5%) |
| 8 or more Rooms | 169 (32.0%) | 10 (4.2%) |
| Total | 529 (100.0%) | 241 (100.0%) |
Housing Structure by Heating Type in Chester Center
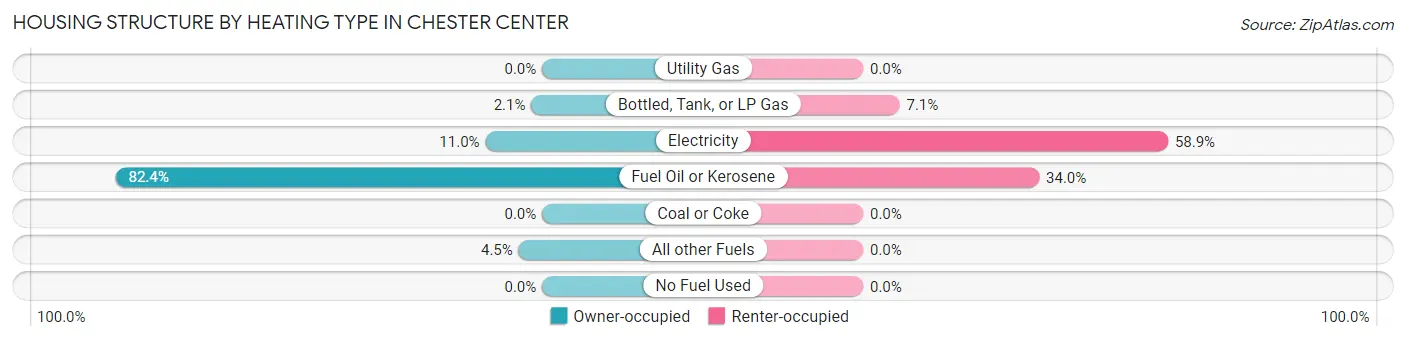
| Heating Type | Owner-occupied | Renter-occupied |
| Utility Gas | 0 (0.0%) | 0 (0.0%) |
| Bottled, Tank, or LP Gas | 11 (2.1%) | 17 (7.0%) |
| Electricity | 58 (11.0%) | 142 (58.9%) |
| Fuel Oil or Kerosene | 436 (82.4%) | 82 (34.0%) |
| Coal or Coke | 0 (0.0%) | 0 (0.0%) |
| All other Fuels | 24 (4.5%) | 0 (0.0%) |
| No Fuel Used | 0 (0.0%) | 0 (0.0%) |
| Total | 529 (100.0%) | 241 (100.0%) |
Household Vehicle Usage in Chester Center
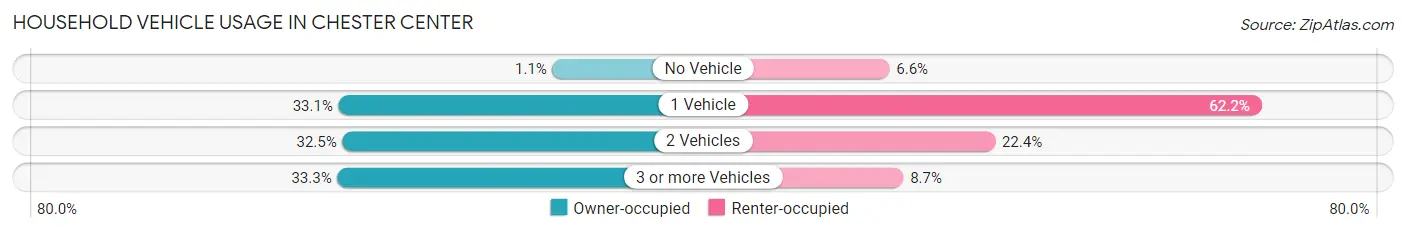
| Vehicles per Household | Owner-occupied | Renter-occupied |
| No Vehicle | 6 (1.1%) | 16 (6.6%) |
| 1 Vehicle | 175 (33.1%) | 150 (62.2%) |
| 2 Vehicles | 172 (32.5%) | 54 (22.4%) |
| 3 or more Vehicles | 176 (33.3%) | 21 (8.7%) |
| Total | 529 (100.0%) | 241 (100.0%) |
Real Estate & Mortgages in Chester Center
Real Estate and Mortgage Overview in Chester Center
| Characteristic | Without Mortgage | With Mortgage |
| Housing Units | 134 | 395 |
| Median Property Value | $290,000 | $414,700 |
| Median Household Income | $80,625 | $120 |
| Monthly Housing Costs | $788 | $87 |
| Real Estate Taxes | $5,156 | $11 |
Property Value by Mortgage Status in Chester Center
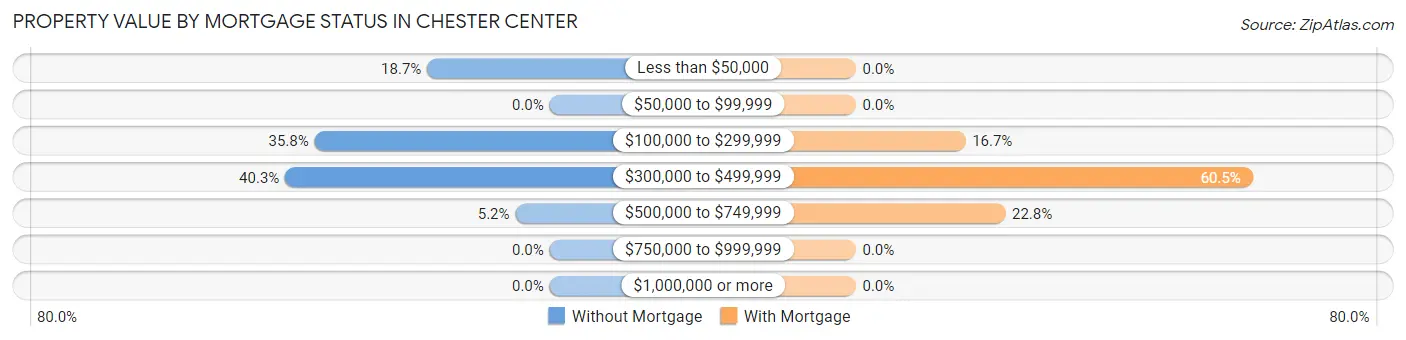
| Property Value | Without Mortgage | With Mortgage |
| Less than $50,000 | 25 (18.7%) | 0 (0.0%) |
| $50,000 to $99,999 | 0 (0.0%) | 0 (0.0%) |
| $100,000 to $299,999 | 48 (35.8%) | 66 (16.7%) |
| $300,000 to $499,999 | 54 (40.3%) | 239 (60.5%) |
| $500,000 to $749,999 | 7 (5.2%) | 90 (22.8%) |
| $750,000 to $999,999 | 0 (0.0%) | 0 (0.0%) |
| $1,000,000 or more | 0 (0.0%) | 0 (0.0%) |
| Total | 134 (100.0%) | 395 (100.0%) |
Household Income by Mortgage Status in Chester Center
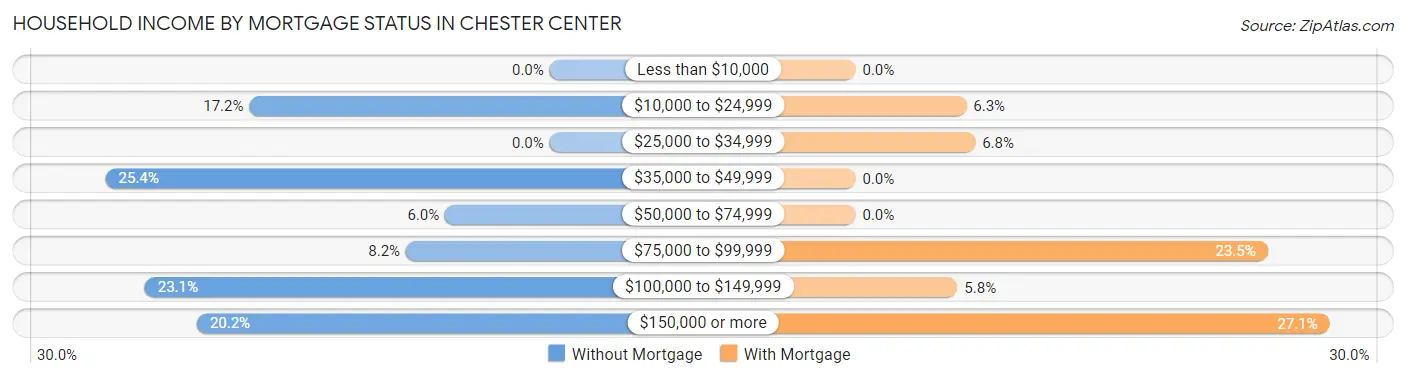
| Household Income | Without Mortgage | With Mortgage |
| Less than $10,000 | 0 (0.0%) | 0 (0.0%) |
| $10,000 to $24,999 | 23 (17.2%) | 25 (6.3%) |
| $25,000 to $34,999 | 0 (0.0%) | 27 (6.8%) |
| $35,000 to $49,999 | 34 (25.4%) | 0 (0.0%) |
| $50,000 to $74,999 | 8 (6.0%) | 0 (0.0%) |
| $75,000 to $99,999 | 11 (8.2%) | 93 (23.5%) |
| $100,000 to $149,999 | 31 (23.1%) | 23 (5.8%) |
| $150,000 or more | 27 (20.2%) | 107 (27.1%) |
| Total | 134 (100.0%) | 395 (100.0%) |
Property Value to Household Income Ratio in Chester Center
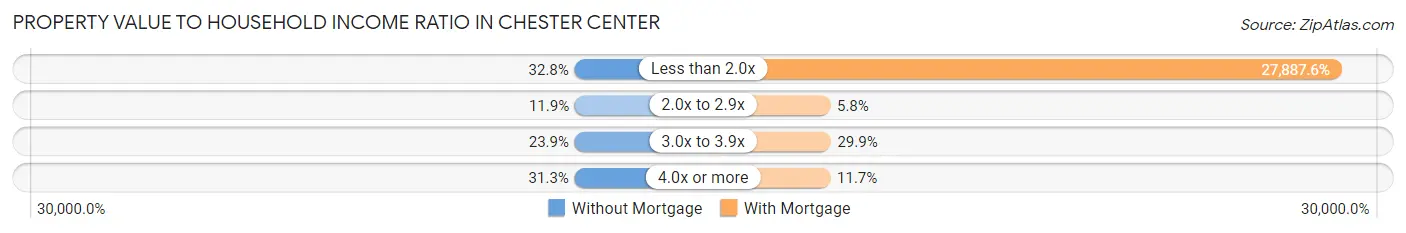
| Value-to-Income Ratio | Without Mortgage | With Mortgage |
| Less than 2.0x | 44 (32.8%) | 110,156 (27,887.6%) |
| 2.0x to 2.9x | 16 (11.9%) | 23 (5.8%) |
| 3.0x to 3.9x | 32 (23.9%) | 118 (29.9%) |
| 4.0x or more | 42 (31.3%) | 46 (11.7%) |
| Total | 134 (100.0%) | 395 (100.0%) |
Real Estate Taxes by Mortgage Status in Chester Center
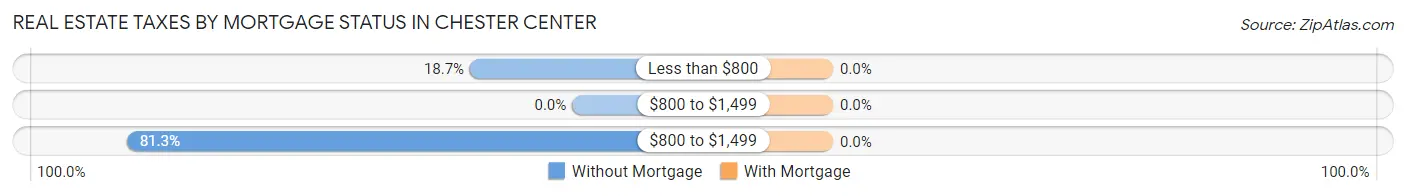
| Property Taxes | Without Mortgage | With Mortgage |
| Less than $800 | 25 (18.7%) | 0 (0.0%) |
| $800 to $1,499 | 0 (0.0%) | 0 (0.0%) |
| $800 to $1,499 | 109 (81.3%) | 0 (0.0%) |
| Total | 134 (100.0%) | 395 (100.0%) |
Health & Disability in Chester Center
Health Insurance Coverage by Age in Chester Center
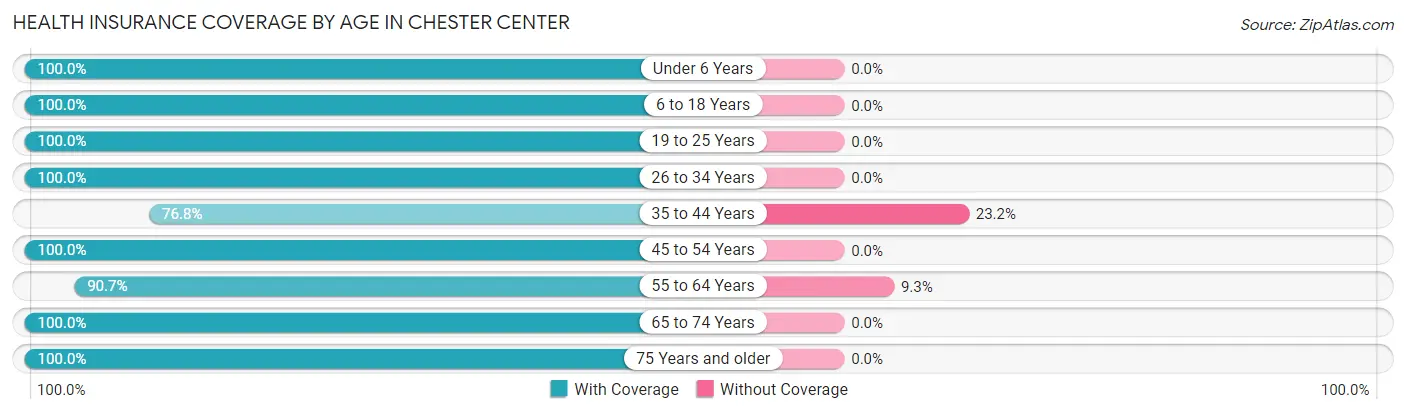
| Age Bracket | With Coverage | Without Coverage |
| Under 6 Years | 108 (100.0%) | 0 (0.0%) |
| 6 to 18 Years | 201 (100.0%) | 0 (0.0%) |
| 19 to 25 Years | 172 (100.0%) | 0 (0.0%) |
| 26 to 34 Years | 122 (100.0%) | 0 (0.0%) |
| 35 to 44 Years | 172 (76.8%) | 52 (23.2%) |
| 45 to 54 Years | 131 (100.0%) | 0 (0.0%) |
| 55 to 64 Years | 196 (90.7%) | 20 (9.3%) |
| 65 to 74 Years | 360 (100.0%) | 0 (0.0%) |
| 75 Years and older | 88 (100.0%) | 0 (0.0%) |
| Total | 1,550 (95.6%) | 72 (4.4%) |
Health Insurance Coverage by Citizenship Status in Chester Center
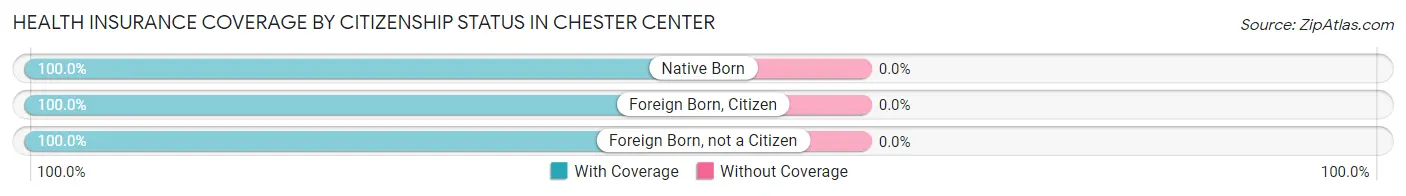
| Citizenship Status | With Coverage | Without Coverage |
| Native Born | 108 (100.0%) | 0 (0.0%) |
| Foreign Born, Citizen | 201 (100.0%) | 0 (0.0%) |
| Foreign Born, not a Citizen | 172 (100.0%) | 0 (0.0%) |
Health Insurance Coverage by Household Income in Chester Center
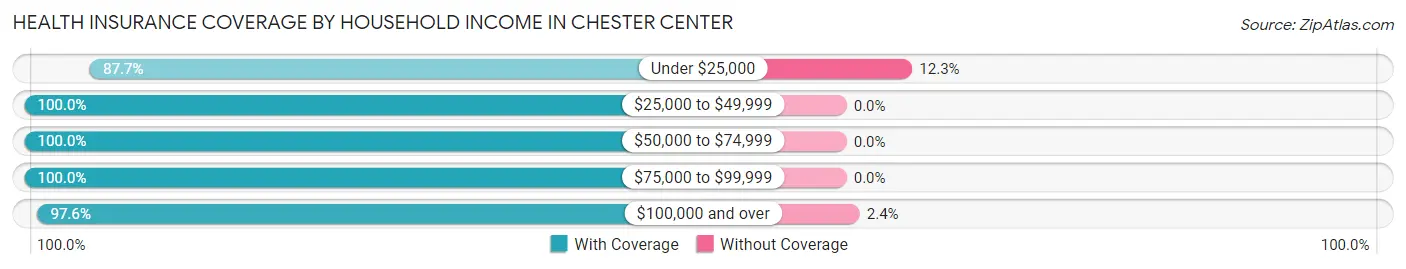
| Household Income | With Coverage | Without Coverage |
| Under $25,000 | 371 (87.7%) | 52 (12.3%) |
| $25,000 to $49,999 | 74 (100.0%) | 0 (0.0%) |
| $50,000 to $74,999 | 186 (100.0%) | 0 (0.0%) |
| $75,000 to $99,999 | 74 (100.0%) | 0 (0.0%) |
| $100,000 and over | 801 (97.6%) | 20 (2.4%) |
Public vs Private Health Insurance Coverage by Age in Chester Center
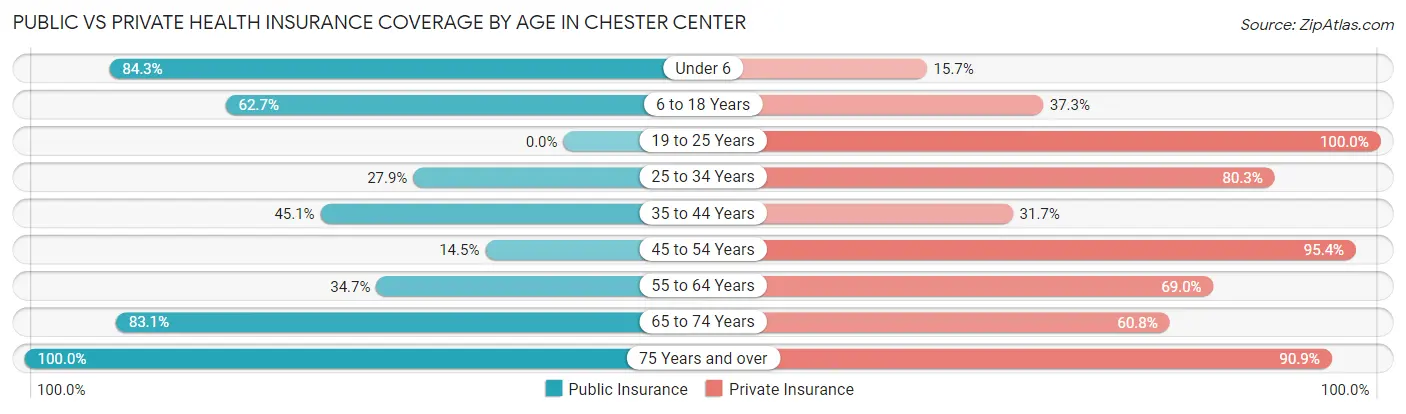
| Age Bracket | Public Insurance | Private Insurance |
| Under 6 | 91 (84.3%) | 17 (15.7%) |
| 6 to 18 Years | 126 (62.7%) | 75 (37.3%) |
| 19 to 25 Years | 0 (0.0%) | 172 (100.0%) |
| 25 to 34 Years | 34 (27.9%) | 98 (80.3%) |
| 35 to 44 Years | 101 (45.1%) | 71 (31.7%) |
| 45 to 54 Years | 19 (14.5%) | 125 (95.4%) |
| 55 to 64 Years | 75 (34.7%) | 149 (69.0%) |
| 65 to 74 Years | 299 (83.1%) | 219 (60.8%) |
| 75 Years and over | 88 (100.0%) | 80 (90.9%) |
| Total | 833 (51.4%) | 1,006 (62.0%) |
Disability Status by Sex by Age in Chester Center
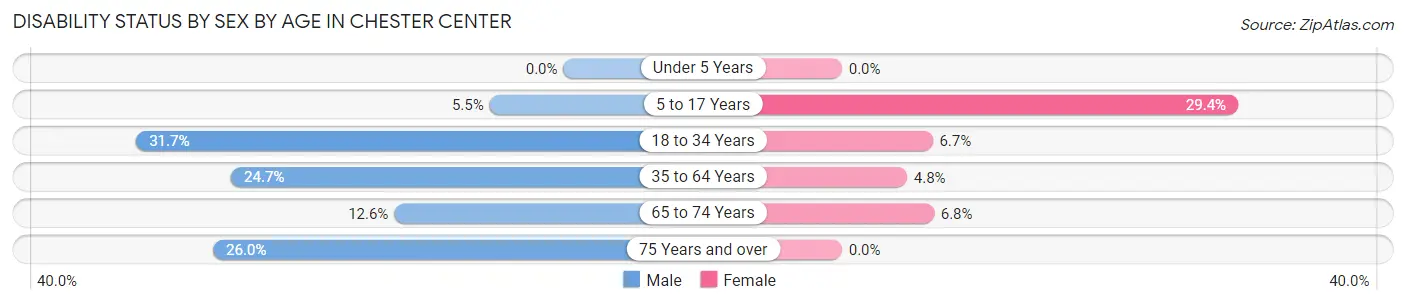
| Age Bracket | Male | Female |
| Under 5 Years | 0 (0.0%) | 0 (0.0%) |
| 5 to 17 Years | 8 (5.5%) | 20 (29.4%) |
| 18 to 34 Years | 65 (31.7%) | 7 (6.7%) |
| 35 to 64 Years | 54 (24.7%) | 17 (4.8%) |
| 65 to 74 Years | 25 (12.6%) | 11 (6.8%) |
| 75 Years and over | 13 (26.0%) | 0 (0.0%) |
Disability Class by Sex by Age in Chester Center
Disability Class: Hearing Difficulty
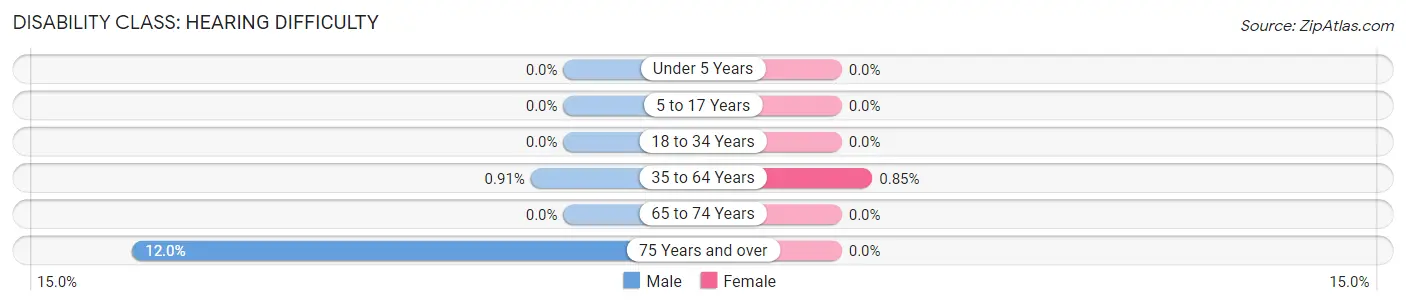
| Age Bracket | Male | Female |
| Under 5 Years | 0 (0.0%) | 0 (0.0%) |
| 5 to 17 Years | 0 (0.0%) | 0 (0.0%) |
| 18 to 34 Years | 0 (0.0%) | 0 (0.0%) |
| 35 to 64 Years | 2 (0.9%) | 3 (0.9%) |
| 65 to 74 Years | 0 (0.0%) | 0 (0.0%) |
| 75 Years and over | 6 (12.0%) | 0 (0.0%) |
Disability Class: Vision Difficulty
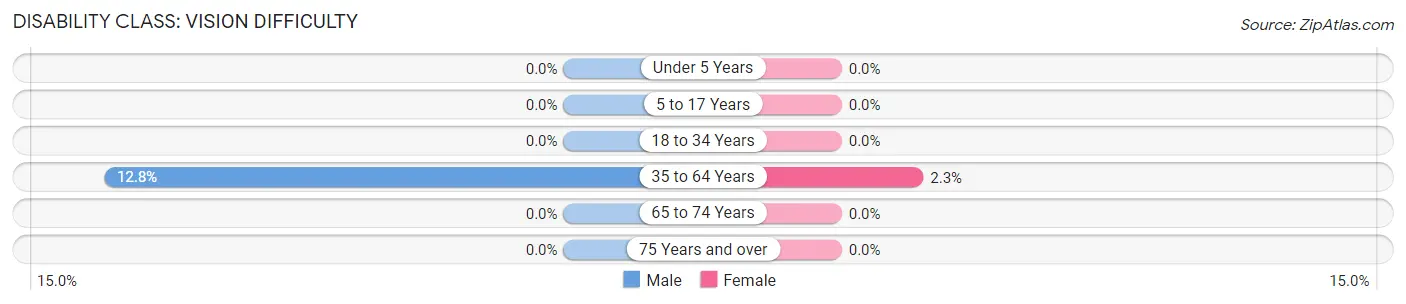
| Age Bracket | Male | Female |
| Under 5 Years | 0 (0.0%) | 0 (0.0%) |
| 5 to 17 Years | 0 (0.0%) | 0 (0.0%) |
| 18 to 34 Years | 0 (0.0%) | 0 (0.0%) |
| 35 to 64 Years | 28 (12.8%) | 8 (2.3%) |
| 65 to 74 Years | 0 (0.0%) | 0 (0.0%) |
| 75 Years and over | 0 (0.0%) | 0 (0.0%) |
Disability Class: Cognitive Difficulty
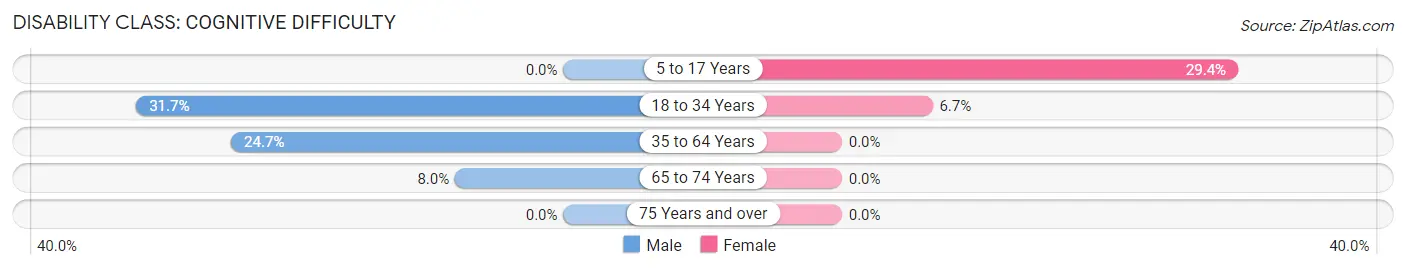
| Age Bracket | Male | Female |
| 5 to 17 Years | 0 (0.0%) | 20 (29.4%) |
| 18 to 34 Years | 65 (31.7%) | 7 (6.7%) |
| 35 to 64 Years | 54 (24.7%) | 0 (0.0%) |
| 65 to 74 Years | 16 (8.0%) | 0 (0.0%) |
| 75 Years and over | 0 (0.0%) | 0 (0.0%) |
Disability Class: Ambulatory Difficulty
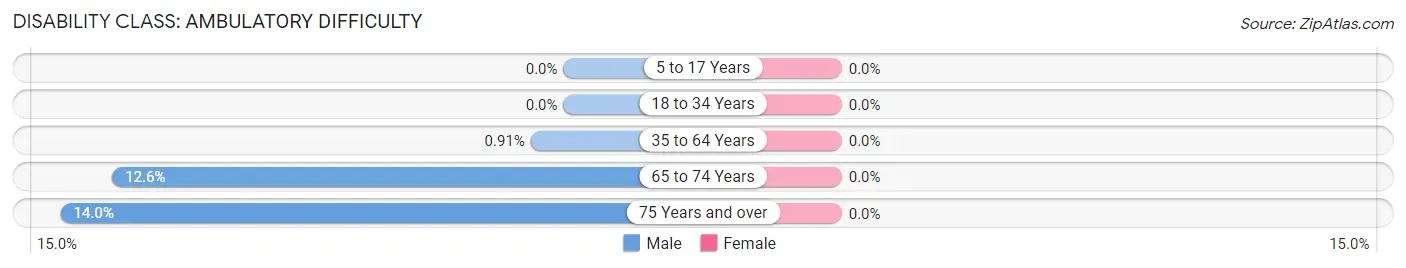
| Age Bracket | Male | Female |
| 5 to 17 Years | 0 (0.0%) | 0 (0.0%) |
| 18 to 34 Years | 0 (0.0%) | 0 (0.0%) |
| 35 to 64 Years | 2 (0.9%) | 0 (0.0%) |
| 65 to 74 Years | 25 (12.6%) | 0 (0.0%) |
| 75 Years and over | 7 (14.0%) | 0 (0.0%) |
Disability Class: Self-Care Difficulty
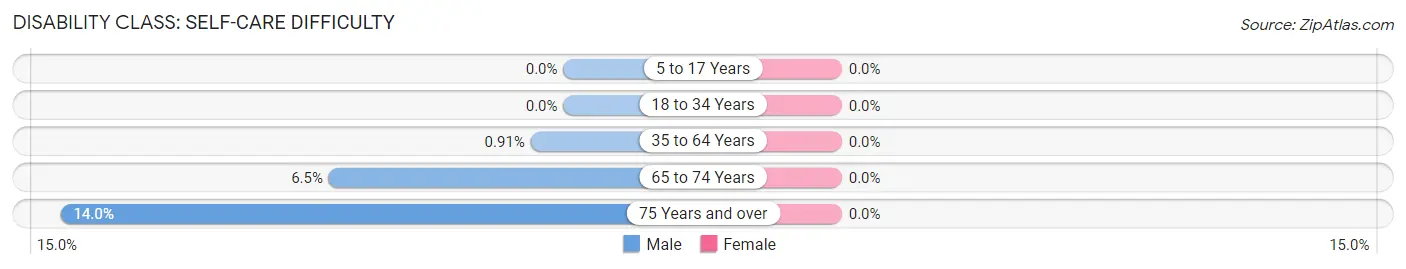
| Age Bracket | Male | Female |
| 5 to 17 Years | 0 (0.0%) | 0 (0.0%) |
| 18 to 34 Years | 0 (0.0%) | 0 (0.0%) |
| 35 to 64 Years | 2 (0.9%) | 0 (0.0%) |
| 65 to 74 Years | 13 (6.5%) | 0 (0.0%) |
| 75 Years and over | 7 (14.0%) | 0 (0.0%) |
Technology Access in Chester Center
Computing Device Access in Chester Center
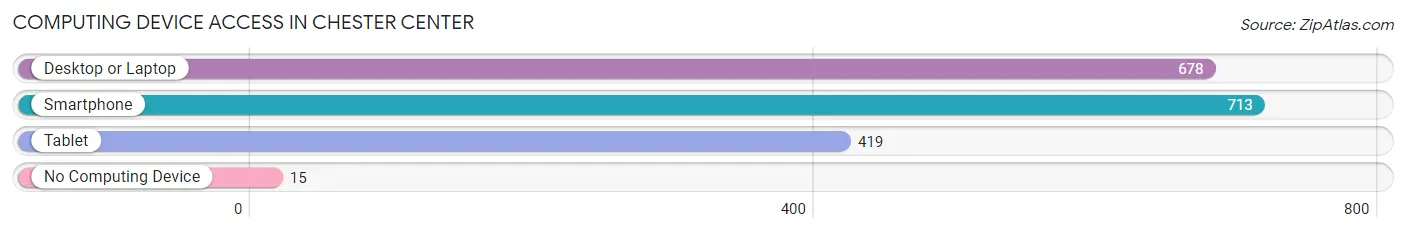
| Device Type | # Households | % Households |
| Desktop or Laptop | 678 | 88.0% |
| Smartphone | 713 | 92.6% |
| Tablet | 419 | 54.4% |
| No Computing Device | 15 | 1.9% |
| Total | 770 | 100.0% |
Internet Access in Chester Center
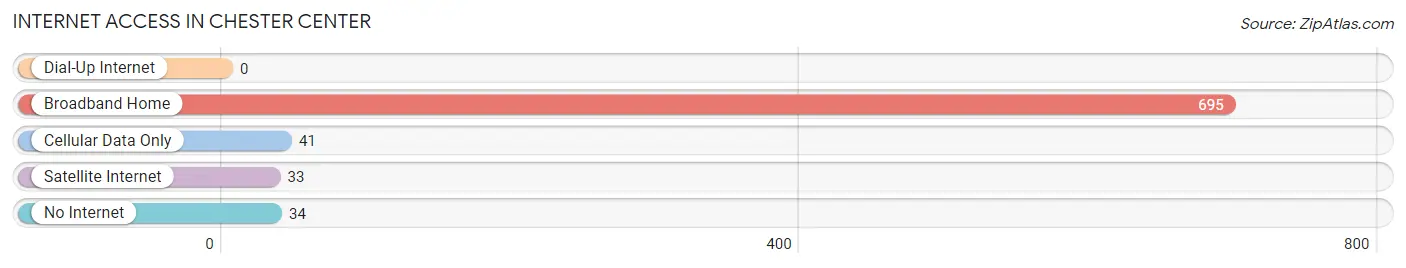
| Internet Type | # Households | % Households |
| Dial-Up Internet | 0 | 0.0% |
| Broadband Home | 695 | 90.3% |
| Cellular Data Only | 41 | 5.3% |
| Satellite Internet | 33 | 4.3% |
| No Internet | 34 | 4.4% |
| Total | 770 | 100.0% |
Chester Center Summary
Chester Center is a small town located in the state of Connecticut in the United States. It is situated in the southeastern part of the state, in the county of Middlesex. The town has a population of approximately 4,000 people and covers an area of about 8.5 square miles.
Geography
Chester Center is located in the southeastern part of Connecticut, in the county of Middlesex. It is situated on the banks of the Connecticut River, which forms the town’s western border. The town is bordered by the towns of Deep River to the north, Essex to the east, and Haddam to the south. The town is located in the Connecticut River Valley, which is a region of rolling hills and valleys. The highest point in the town is the summit of Mount Tom, which is located in the northern part of the town and has an elevation of 845 feet.
The town is home to several small lakes, including Lake Hayward, Lake Beseck, and Lake Pocotopaug. The town also contains several small streams, including the Chester Creek, which flows through the center of town.
Economy
The economy of Chester Center is largely based on tourism and agriculture. The town is home to several small businesses, including restaurants, retail stores, and a few small manufacturing companies. The town is also home to several farms, which produce a variety of crops, including corn, soybeans, and hay.
The town is also home to several small wineries, which produce a variety of wines. The town is also home to several small art galleries, which feature the work of local artists.
Demographics
As of the 2010 census, the population of Chester Center was 4,039. The racial makeup of the town was 94.3% White, 1.2% African American, 0.3% Native American, 1.2% Asian, 0.1% Pacific Islander, 1.2% from other races, and 1.9% from two or more races. Hispanic or Latino of any race were 3.2% of the population.
The median income for a household in the town was $68,750, and the median income for a family was $77,917. The per capita income for the town was $30,945. About 4.2% of families and 5.3% of the population were below the poverty line, including 6.2% of those under age 18 and 4.2% of those age 65 or over.
Chester Center is a small town with a rich history and a vibrant economy. The town is home to several small businesses, farms, wineries, and art galleries. The town is also home to a diverse population, with a variety of racial and ethnic backgrounds. The town is a great place to live, work, and visit.
Common Questions
What is Per Capita Income in Chester Center?
Per Capita income in Chester Center is $43,834.
What is the Median Family Income in Chester Center?
Median Family Income in Chester Center is $102,727.
What is the Median Household income in Chester Center?
Median Household Income in Chester Center is $73,611.
What is Income or Wage Gap in Chester Center?
Income or Wage Gap in Chester Center is 28.5%.
Women in Chester Center earn 71.5 cents for every dollar earned by a man.
What is Inequality or Gini Index in Chester Center?
Inequality or Gini Index in Chester Center is 0.45.
What is the Total Population of Chester Center?
Total Population of Chester Center is 1,729.
What is the Total Male Population of Chester Center?
Total Male Population of Chester Center is 939.
What is the Total Female Population of Chester Center?
Total Female Population of Chester Center is 790.
What is the Ratio of Males per 100 Females in Chester Center?
There are 118.86 Males per 100 Females in Chester Center.
What is the Ratio of Females per 100 Males in Chester Center?
There are 84.13 Females per 100 Males in Chester Center.
What is the Median Population Age in Chester Center?
Median Population Age in Chester Center is 49.9 Years.
What is the Average Family Size in Chester Center
Average Family Size in Chester Center is 2.5 People.
What is the Average Household Size in Chester Center
Average Household Size in Chester Center is 2.0 People.
How Large is the Labor Force in Chester Center?
There are 885 People in the Labor Forcein in Chester Center.
What is the Percentage of People in the Labor Force in Chester Center?
60.4% of People are in the Labor Force in Chester Center.
What is the Unemployment Rate in Chester Center?
Unemployment Rate in Chester Center is 3.3%.