Cities with the Highest Percentage of Scandinavian Population in Connecticut
RELATED REPORTS & OPTIONS
Scandinavian
Connecticut
Compare Cities
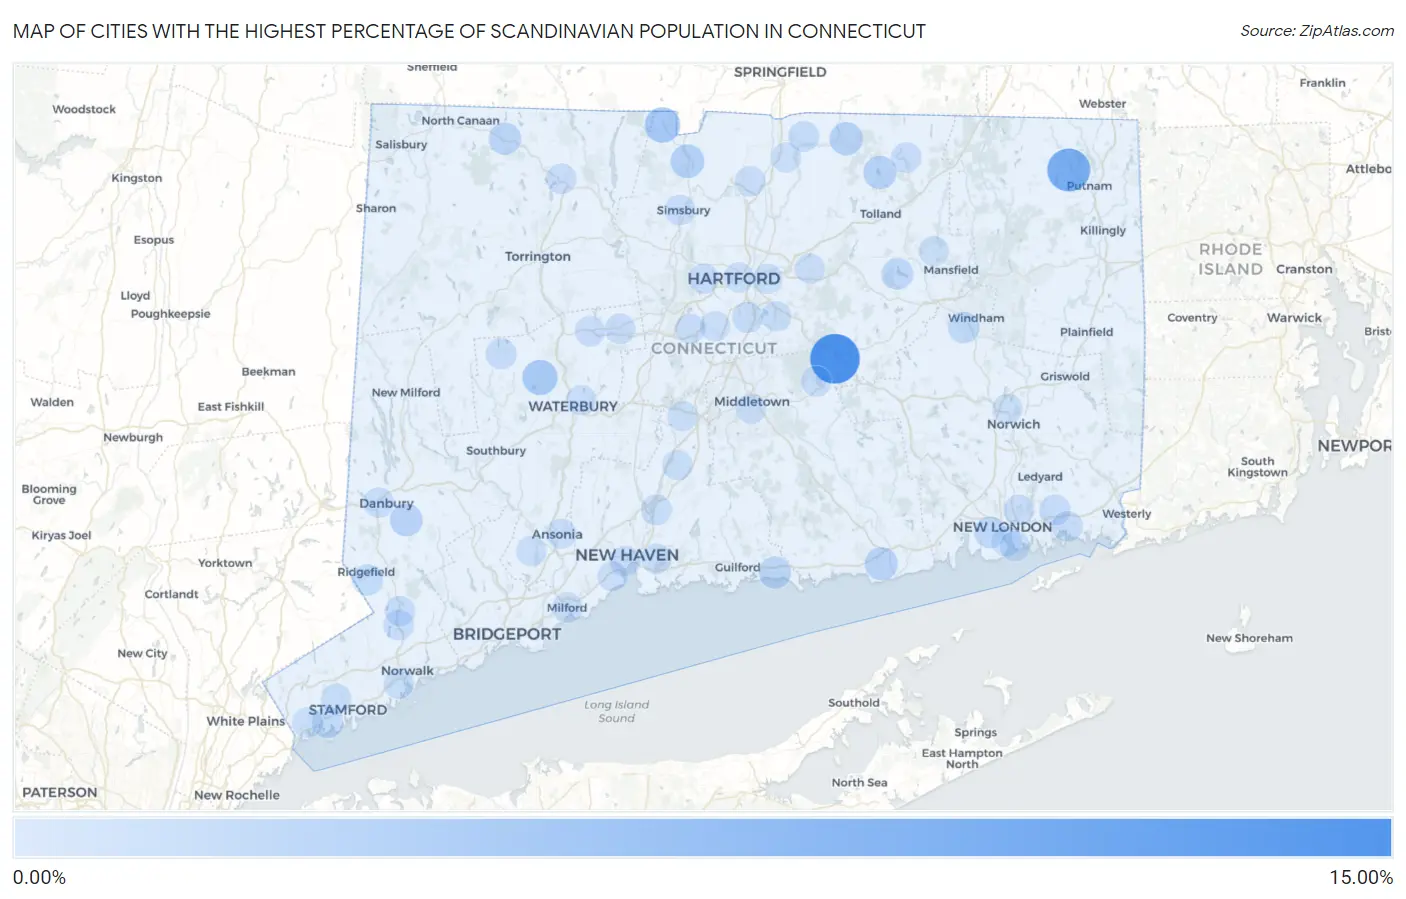
Map of Cities with the Highest Percentage of Scandinavian Population in Connecticut
0.00%
15.00%
Cities with the Highest Percentage of Scandinavian Population in Connecticut
| City | Scandinavian | vs State | vs National | |
| 1. | Terramuggus | 10.54% | 0.17%(+10.4)#1 | 0.30%(+10.2)#108 |
| 2. | South Woodstock | 6.91% | 0.17%(+6.74)#2 | 0.30%(+6.61)#200 |
| 3. | North Granby | 2.76% | 0.17%(+2.60)#3 | 0.30%(+2.46)#844 |
| 4. | Watertown | 2.68% | 0.17%(+2.51)#4 | 0.30%(+2.38)#882 |
| 5. | Lake Bungee | 2.14% | 0.17%(+1.97)#5 | 0.30%(+1.83)#1,203 |
| 6. | Stepney | 1.91% | 0.17%(+1.74)#6 | 0.30%(+1.60)#1,395 |
| 7. | Salmon Brook | 1.79% | 0.17%(+1.62)#7 | 0.30%(+1.48)#1,511 |
| 8. | Somers | 1.61% | 0.17%(+1.45)#8 | 0.30%(+1.31)#1,715 |
| 9. | Crystal Lake | 1.59% | 0.17%(+1.42)#9 | 0.30%(+1.28)#1,755 |
| 10. | Old Saybrook Center | 1.49% | 0.17%(+1.32)#10 | 0.30%(+1.18)#1,867 |
| 11. | Bethel | 1.33% | 0.17%(+1.17)#11 | 0.30%(+1.03)#2,109 |
| 12. | Indian Field | 1.33% | 0.17%(+1.16)#12 | 0.30%(+1.03)#2,115 |
| 13. | Bantam Borough | 1.15% | 0.17%(+0.980)#13 | 0.30%(+0.843)#2,493 |
| 14. | Norfolk | 1.07% | 0.17%(+0.906)#14 | 0.30%(+0.769)#2,673 |
| 15. | Madison Center | 1.04% | 0.17%(+0.874)#15 | 0.30%(+0.737)#2,741 |
| 16. | Tashua | 0.97% | 0.17%(+0.801)#16 | 0.30%(+0.665)#2,932 |
| 17. | Coventry Lake | 0.81% | 0.17%(+0.639)#17 | 0.30%(+0.503)#3,474 |
| 18. | South Windham | 0.78% | 0.17%(+0.611)#18 | 0.30%(+0.475)#3,593 |
| 19. | Darien Downtown | 0.76% | 0.17%(+0.597)#19 | 0.30%(+0.460)#3,657 |
| 20. | Waterford | 0.76% | 0.17%(+0.595)#20 | 0.30%(+0.459)#3,663 |
| 21. | Riverside | 0.63% | 0.17%(+0.459)#21 | 0.30%(+0.323)#4,270 |
| 22. | Lordship | 0.62% | 0.17%(+0.455)#22 | 0.30%(+0.319)#4,286 |
| 23. | Oronoque | 0.59% | 0.17%(+0.422)#23 | 0.30%(+0.286)#4,447 |
| 24. | Litchfield Borough | 0.59% | 0.17%(+0.422)#24 | 0.30%(+0.286)#4,448 |
| 25. | Westport | 0.52% | 0.17%(+0.357)#25 | 0.30%(+0.220)#4,822 |
| 26. | Ridgebury | 0.50% | 0.17%(+0.335)#26 | 0.30%(+0.199)#4,969 |
| 27. | Northford | 0.50% | 0.17%(+0.333)#27 | 0.30%(+0.197)#4,984 |
| 28. | Ridgefield | 0.50% | 0.17%(+0.328)#28 | 0.30%(+0.192)#5,016 |
| 29. | Fairfield University | 0.44% | 0.17%(+0.274)#29 | 0.30%(+0.137)#5,438 |
| 30. | Saugatuck | 0.43% | 0.17%(+0.265)#30 | 0.30%(+0.129)#5,508 |
| 31. | Bethlehem Village | 0.43% | 0.17%(+0.260)#31 | 0.30%(+0.124)#5,565 |
| 32. | Old Mystic | 0.41% | 0.17%(+0.246)#32 | 0.30%(+0.109)#5,689 |
| 33. | Quinnipiac University | 0.37% | 0.17%(+0.197)#33 | 0.30%(+0.061)#6,150 |
| 34. | Hazardville | 0.36% | 0.17%(+0.191)#34 | 0.30%(+0.055)#6,205 |
| 35. | Compo | 0.33% | 0.17%(+0.162)#35 | 0.30%(+0.026)#6,505 |
| 36. | Naugatuck Borough | 0.30% | 0.17%(+0.129)#36 | 0.30%(-0.007)#6,869 |
| 37. | Wethersfield | 0.29% | 0.17%(+0.126)#37 | 0.30%(-0.010)#6,901 |
| 38. | North Haven | 0.28% | 0.17%(+0.113)#38 | 0.30%(-0.023)#7,057 |
| 39. | Staples | 0.26% | 0.17%(+0.096)#39 | 0.30%(-0.040)#7,275 |
| 40. | Greens Farms | 0.26% | 0.17%(+0.094)#40 | 0.30%(-0.042)#7,304 |
| 41. | Mystic | 0.25% | 0.17%(+0.081)#41 | 0.30%(-0.055)#7,513 |
| 42. | Wilton Center | 0.24% | 0.17%(+0.076)#42 | 0.30%(-0.061)#7,606 |
| 43. | Wallingford Center | 0.22% | 0.17%(+0.051)#43 | 0.30%(-0.086)#7,965 |
| 44. | Conning Towers Nautilus Park | 0.22% | 0.17%(+0.048)#44 | 0.30%(-0.088)#8,009 |
| 45. | Windsor Locks | 0.21% | 0.17%(+0.047)#45 | 0.30%(-0.089)#8,023 |
| 46. | Lake Pocotopaug | 0.21% | 0.17%(+0.042)#46 | 0.30%(-0.094)#8,100 |
| 47. | Winsted | 0.20% | 0.17%(+0.035)#47 | 0.30%(-0.101)#8,197 |
| 48. | Cannondale | 0.19% | 0.17%(+0.020)#48 | 0.30%(-0.116)#8,419 |
| 49. | Stafford Springs | 0.18% | 0.17%(+0.016)#49 | 0.30%(-0.120)#8,472 |
| 50. | West Hartford | 0.17% | 0.17%(-0.003)#50 | 0.30%(-0.139)#8,738 |
| 51. | Bristol | 0.16% | 0.17%(-0.006)#51 | 0.30%(-0.142)#8,788 |
| 52. | Terryville | 0.16% | 0.17%(-0.008)#52 | 0.30%(-0.144)#8,825 |
| 53. | Simsbury Center | 0.15% | 0.17%(-0.021)#53 | 0.30%(-0.157)#9,041 |
| 54. | New Britain | 0.15% | 0.17%(-0.021)#54 | 0.30%(-0.157)#9,048 |
| 55. | New Haven | 0.14% | 0.17%(-0.024)#55 | 0.30%(-0.161)#9,088 |
| 56. | Danbury | 0.12% | 0.17%(-0.050)#56 | 0.30%(-0.186)#9,439 |
| 57. | Milford City Balance | 0.12% | 0.17%(-0.052)#57 | 0.30%(-0.188)#9,453 |
| 58. | Norwalk | 0.12% | 0.17%(-0.052)#58 | 0.30%(-0.188)#9,454 |
| 59. | Glastonbury Center | 0.11% | 0.17%(-0.055)#59 | 0.30%(-0.191)#9,501 |
| 60. | Stamford | 0.11% | 0.17%(-0.060)#60 | 0.30%(-0.196)#9,595 |
| 61. | Storrs | 0.097% | 0.17%(-0.071)#61 | 0.30%(-0.208)#9,740 |
| 62. | Ansonia | 0.090% | 0.17%(-0.078)#62 | 0.30%(-0.215)#9,826 |
| 63. | Southwood Acres | 0.088% | 0.17%(-0.080)#63 | 0.30%(-0.216)#9,842 |
| 64. | Shelton | 0.087% | 0.17%(-0.081)#64 | 0.30%(-0.217)#9,854 |
| 65. | Newington | 0.085% | 0.17%(-0.083)#65 | 0.30%(-0.219)#9,880 |
| 66. | East Haven | 0.083% | 0.17%(-0.086)#66 | 0.30%(-0.222)#9,920 |
| 67. | New London | 0.069% | 0.17%(-0.099)#67 | 0.30%(-0.235)#10,099 |
| 68. | Greenwich | 0.057% | 0.17%(-0.111)#68 | 0.30%(-0.247)#10,234 |
| 69. | Meriden | 0.048% | 0.17%(-0.120)#69 | 0.30%(-0.256)#10,330 |
| 70. | Middletown | 0.048% | 0.17%(-0.120)#70 | 0.30%(-0.257)#10,331 |
| 71. | Manchester | 0.043% | 0.17%(-0.125)#71 | 0.30%(-0.261)#10,382 |
| 72. | Groton | 0.043% | 0.17%(-0.125)#72 | 0.30%(-0.262)#10,389 |
| 73. | Waterbury | 0.035% | 0.17%(-0.133)#73 | 0.30%(-0.269)#10,461 |
| 74. | Norwich | 0.025% | 0.17%(-0.143)#74 | 0.30%(-0.279)#10,537 |
| 75. | West Haven | 0.022% | 0.17%(-0.146)#75 | 0.30%(-0.283)#10,560 |
| 76. | East Hartford | 0.022% | 0.17%(-0.146)#76 | 0.30%(-0.283)#10,561 |
| 77. | Hartford | 0.013% | 0.17%(-0.155)#77 | 0.30%(-0.291)#10,590 |
Common Questions
What are the Top 10 Cities with the Highest Percentage of Scandinavian Population in Connecticut?
Top 10 Cities with the Highest Percentage of Scandinavian Population in Connecticut are:
#1
10.54%
#2
6.91%
#3
2.76%
#4
2.68%
#5
1.79%
#6
1.61%
#7
1.59%
#8
1.49%
#9
1.33%
#10
1.07%
What city has the Highest Percentage of Scandinavian Population in Connecticut?
Terramuggus has the Highest Percentage of Scandinavian Population in Connecticut with 10.54%.
What is the Percentage of Scandinavian Population in the State of Connecticut?
Percentage of Scandinavian Population in Connecticut is 0.17%.
What is the Percentage of Scandinavian Population in the United States?
Percentage of Scandinavian Population in the United States is 0.30%.