Zip Codes with the Highest Percentage of Population Employed in Food Preparation & Serving in Bridgeport, CT
RELATED REPORTS & OPTIONS
Food Preparation & Serving
Bridgeport
Compare Zip Codes
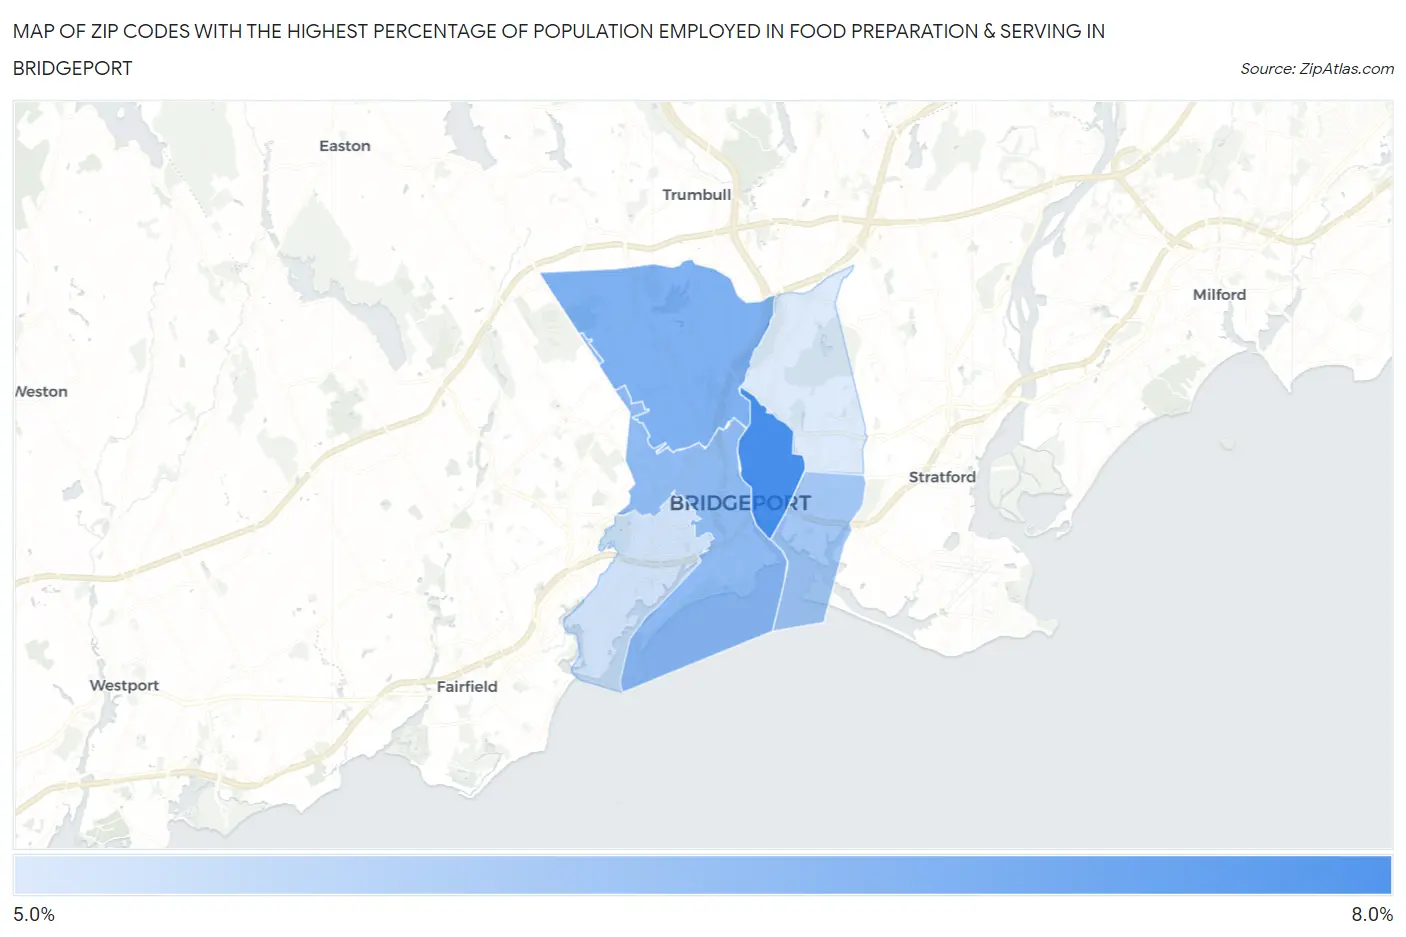
Map of Zip Codes with the Highest Percentage of Population Employed in Food Preparation & Serving in Bridgeport
5.6%
7.6%
Zip Codes with the Highest Percentage of Population Employed in Food Preparation & Serving in Bridgeport, CT
| Zip Code | % Employed | vs State | vs National | |
| 1. | 06608 | 7.6% | 4.7%(+2.93)#33 | 5.3%(+2.33)#5,353 |
| 2. | 06606 | 6.9% | 4.7%(+2.18)#47 | 5.3%(+1.58)#6,907 |
| 3. | 06604 | 6.6% | 4.7%(+1.96)#49 | 5.3%(+1.36)#7,506 |
| 4. | 06607 | 6.4% | 4.7%(+1.67)#60 | 5.3%(+1.07)#8,273 |
| 5. | 06605 | 5.8% | 4.7%(+1.08)#71 | 5.3%(+0.475)#10,148 |
| 6. | 06610 | 5.6% | 4.7%(+0.892)#75 | 5.3%(+0.290)#10,781 |
1
Common Questions
What are the Top 5 Zip Codes with the Highest Percentage of Population Employed in Food Preparation & Serving in Bridgeport, CT?
Top 5 Zip Codes with the Highest Percentage of Population Employed in Food Preparation & Serving in Bridgeport, CT are:
What zip code has the Highest Percentage of Population Employed in Food Preparation & Serving in Bridgeport, CT?
06608 has the Highest Percentage of Population Employed in Food Preparation & Serving in Bridgeport, CT with 7.6%.
What is the Percentage of Population Employed in Food Preparation & Serving in Bridgeport, CT?
Percentage of Population Employed in Food Preparation & Serving in Bridgeport is 6.5%.
What is the Percentage of Population Employed in Food Preparation & Serving in Connecticut?
Percentage of Population Employed in Food Preparation & Serving in Connecticut is 4.7%.
What is the Percentage of Population Employed in Food Preparation & Serving in the United States?
Percentage of Population Employed in Food Preparation & Serving in the United States is 5.3%.