South Woodstock, CT Map & Demographics
South Woodstock Map
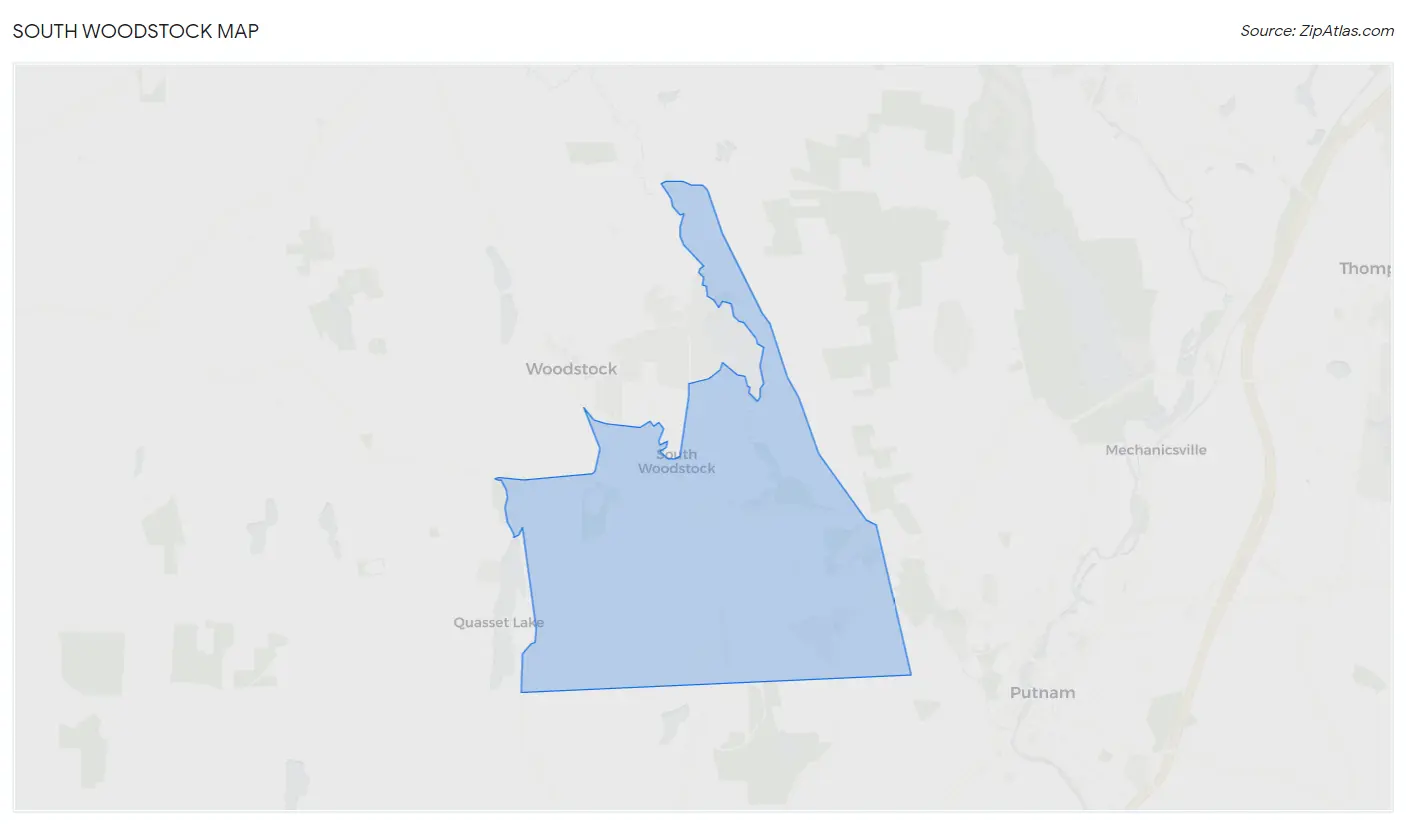
South Woodstock Overview
$41,187
PER CAPITA INCOME
$109,353
AVG FAMILY INCOME
$75,763
AVG HOUSEHOLD INCOME
0.35
INEQUALITY / GINI INDEX
1,418
TOTAL POPULATION
728
MALE POPULATION
690
FEMALE POPULATION
105.51
MALES / 100 FEMALES
94.78
FEMALES / 100 MALES
31.8
MEDIAN AGE
3.2
AVG FAMILY SIZE
2.0
AVG HOUSEHOLD SIZE
1,054
LABOR FORCE [ PEOPLE ]
81.3%
PERCENT IN LABOR FORCE
7.2%
UNEMPLOYMENT RATE
South Woodstock Area Codes
Income in South Woodstock
Income Overview in South Woodstock
Per Capita Income in South Woodstock is $41,187, while median incomes of families and households are $109,353 and $75,763 respectively.
| Characteristic | Number | Measure |
| Per Capita Income | 1,418 | $41,187 |
| Median Family Income | 281 | $109,353 |
| Mean Family Income | 281 | $125,464 |
| Median Household Income | 702 | $75,763 |
| Mean Household Income | 702 | $87,484 |
| Income Deficit | 281 | $0 |
| Wage / Income Gap (%) | 1,418 | 0.00% |
| Wage / Income Gap ($) | 1,418 | 100.00¢ per $1 |
| Gini / Inequality Index | 1,418 | 0.35 |
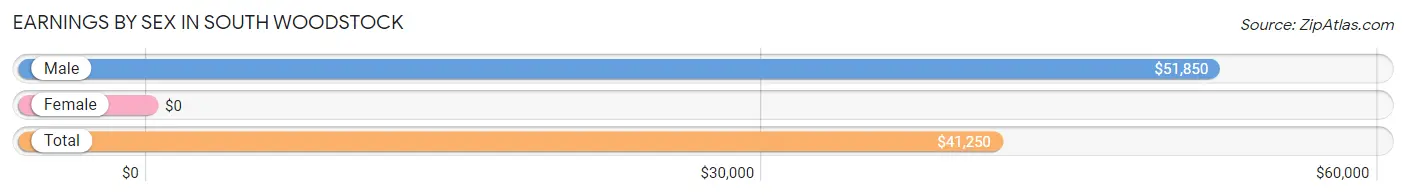
Earnings by Sex in South Woodstock
| Sex | Number | Average Earnings |
| Male | 617 (59.1%) | $51,850 |
| Female | 427 (40.9%) | $0 |
| Total | 1,044 (100.0%) | $41,250 |
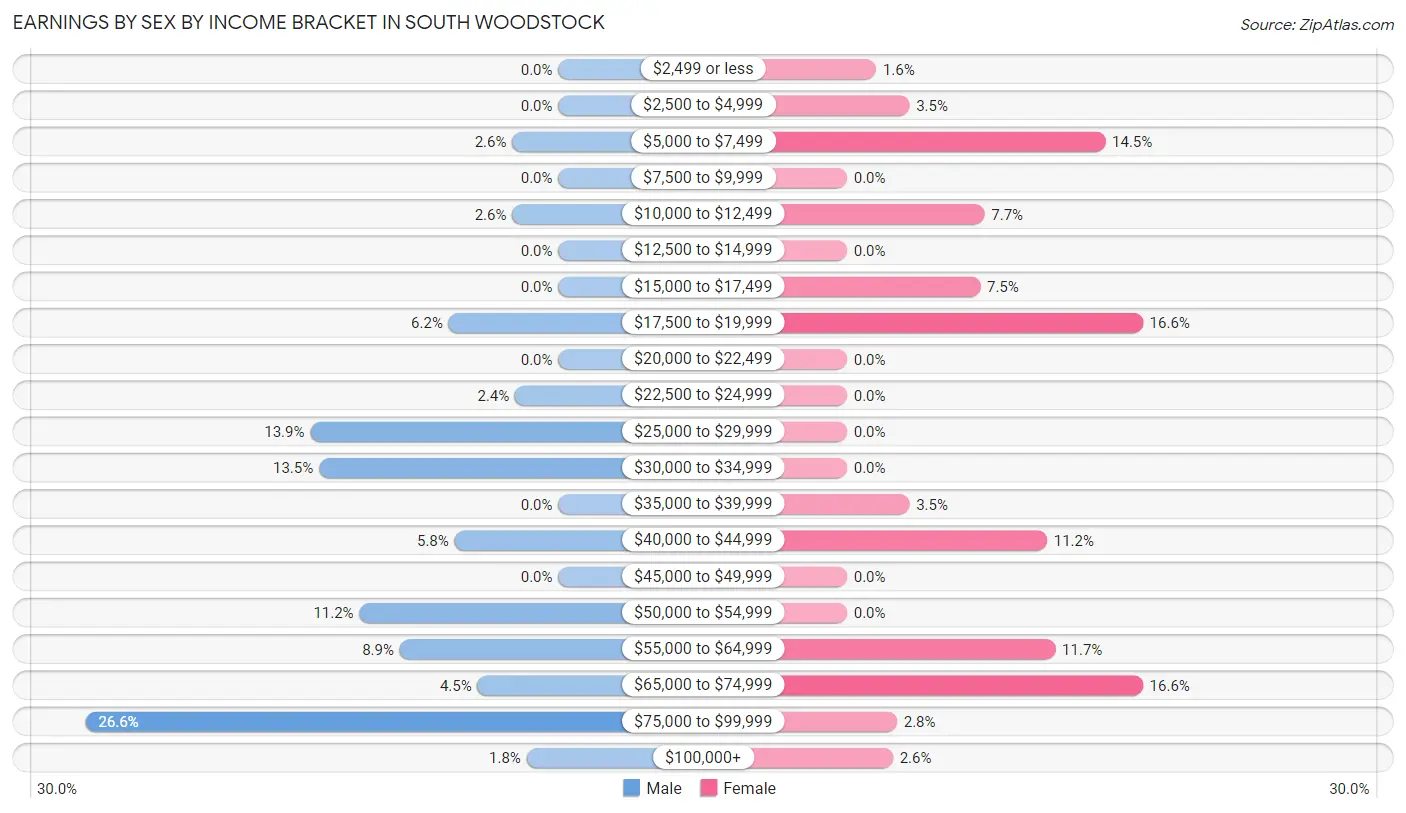
Earnings by Sex by Income Bracket in South Woodstock
The most common earnings brackets in South Woodstock are $75,000 to $99,999 for men (164 | 26.6%) and $17,500 to $19,999 for women (71 | 16.6%).
| Income | Male | Female |
| $2,499 or less | 0 (0.0%) | 7 (1.6%) |
| $2,500 to $4,999 | 0 (0.0%) | 15 (3.5%) |
| $5,000 to $7,499 | 16 (2.6%) | 62 (14.5%) |
| $7,500 to $9,999 | 0 (0.0%) | 0 (0.0%) |
| $10,000 to $12,499 | 16 (2.6%) | 33 (7.7%) |
| $12,500 to $14,999 | 0 (0.0%) | 0 (0.0%) |
| $15,000 to $17,499 | 0 (0.0%) | 32 (7.5%) |
| $17,500 to $19,999 | 38 (6.2%) | 71 (16.6%) |
| $20,000 to $22,499 | 0 (0.0%) | 0 (0.0%) |
| $22,500 to $24,999 | 15 (2.4%) | 0 (0.0%) |
| $25,000 to $29,999 | 86 (13.9%) | 0 (0.0%) |
| $30,000 to $34,999 | 83 (13.5%) | 0 (0.0%) |
| $35,000 to $39,999 | 0 (0.0%) | 15 (3.5%) |
| $40,000 to $44,999 | 36 (5.8%) | 48 (11.2%) |
| $45,000 to $49,999 | 0 (0.0%) | 0 (0.0%) |
| $50,000 to $54,999 | 69 (11.2%) | 0 (0.0%) |
| $55,000 to $64,999 | 55 (8.9%) | 50 (11.7%) |
| $65,000 to $74,999 | 28 (4.5%) | 71 (16.6%) |
| $75,000 to $99,999 | 164 (26.6%) | 12 (2.8%) |
| $100,000+ | 11 (1.8%) | 11 (2.6%) |
| Total | 617 (100.0%) | 427 (100.0%) |
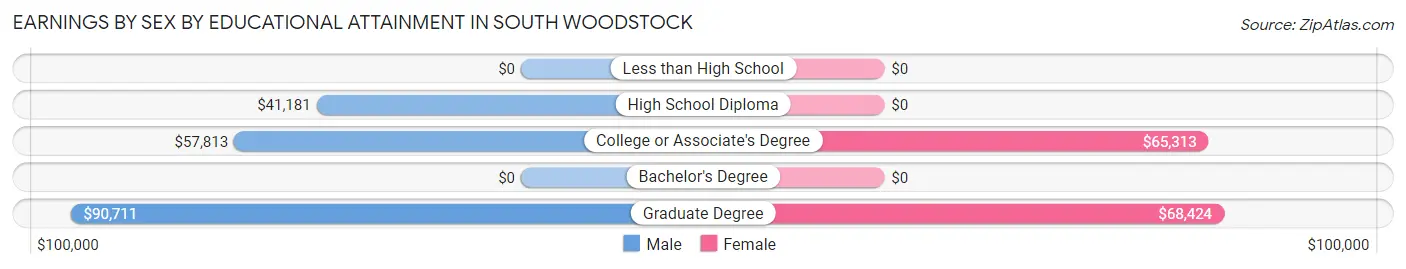
Earnings by Sex by Educational Attainment in South Woodstock
Average earnings in South Woodstock are $58,993 for men and $58,700 for women, a difference of 0.5%. Men with an educational attainment of graduate degree enjoy the highest average annual earnings of $90,711, while those with high school diploma education earn the least with $41,181. Women with an educational attainment of graduate degree earn the most with the average annual earnings of $68,424, while those with college or associate's degree education have the smallest earnings of $65,313.
| Educational Attainment | Male Income | Female Income |
| Less than High School | - | - |
| High School Diploma | $41,181 | $0 |
| College or Associate's Degree | $57,813 | $65,313 |
| Bachelor's Degree | - | - |
| Graduate Degree | $90,711 | $68,424 |
| Total | $58,993 | $58,700 |
Family Income in South Woodstock
Family Income Brackets in South Woodstock
According to the South Woodstock family income data, there are 72 families falling into the $150,000 to $199,999 income range, which is the most common income bracket and makes up 25.6% of all families.
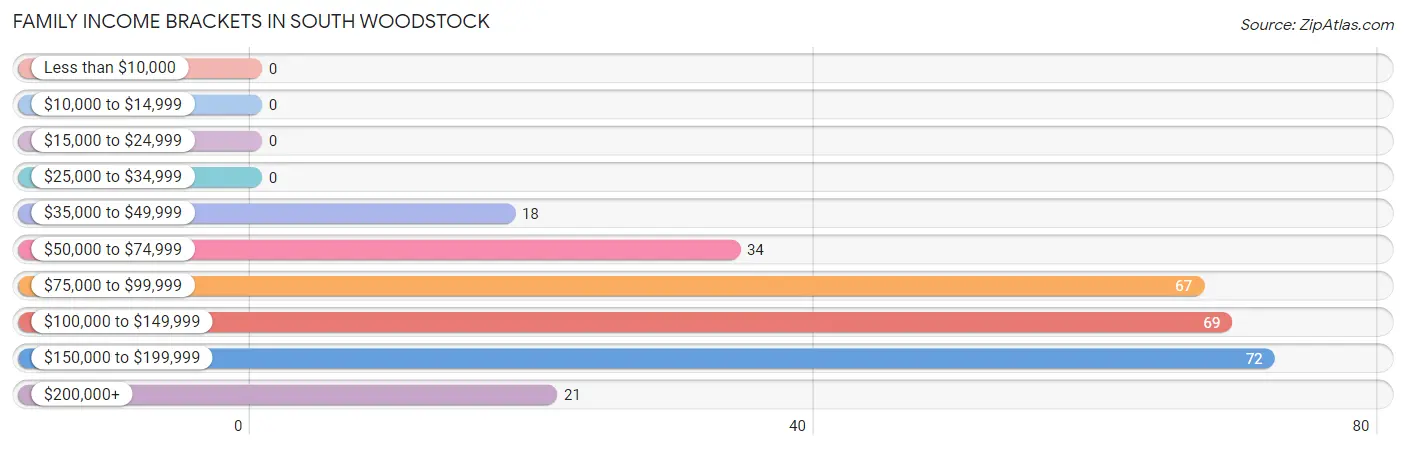
| Income Bracket | # Families | % Families |
| Less than $10,000 | 0 | 0.0% |
| $10,000 to $14,999 | 0 | 0.0% |
| $15,000 to $24,999 | 0 | 0.0% |
| $25,000 to $34,999 | 0 | 0.0% |
| $35,000 to $49,999 | 18 | 6.4% |
| $50,000 to $74,999 | 34 | 12.1% |
| $75,000 to $99,999 | 67 | 23.8% |
| $100,000 to $149,999 | 69 | 24.6% |
| $150,000 to $199,999 | 72 | 25.6% |
| $200,000+ | 21 | 7.5% |
Family Income by Famaliy Size in South Woodstock
2-person families (60 | 21.3%) account for the highest median family income in South Woodstock with $99,688 per family, while 2-person families (60 | 21.3%) have the highest median income of $49,844 per family member.
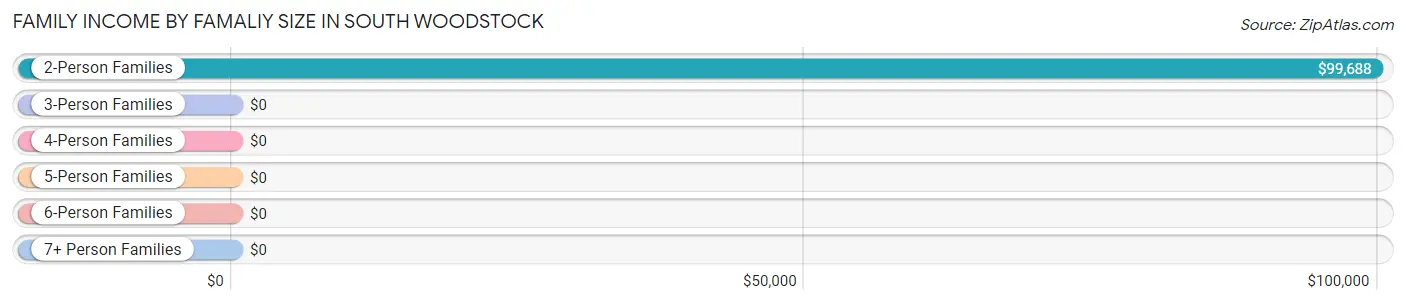
| Income Bracket | # Families | Median Income |
| 2-Person Families | 60 (21.3%) | $99,688 |
| 3-Person Families | 57 (20.3%) | $0 |
| 4-Person Families | 114 (40.6%) | $0 |
| 5-Person Families | 50 (17.8%) | $0 |
| 6-Person Families | 0 (0.0%) | $0 |
| 7+ Person Families | 0 (0.0%) | $0 |
| Total | 281 (100.0%) | $109,353 |
Family Income by Number of Earners in South Woodstock
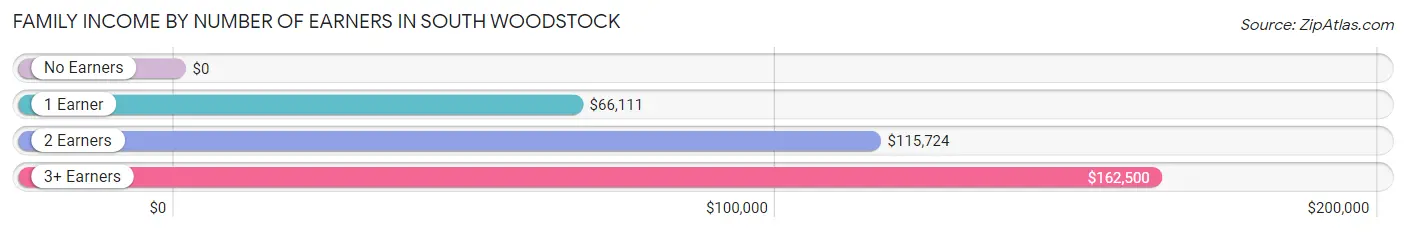
| Number of Earners | # Families | Median Income |
| No Earners | 16 (5.7%) | $0 |
| 1 Earner | 52 (18.5%) | $66,111 |
| 2 Earners | 69 (24.6%) | $115,724 |
| 3+ Earners | 144 (51.2%) | $162,500 |
| Total | 281 (100.0%) | $109,353 |
Household Income in South Woodstock
Household Income Brackets in South Woodstock
With 147 households falling in the category, the $75,000 to $99,999 income range is the most frequent in South Woodstock, accounting for 20.9% of all households.
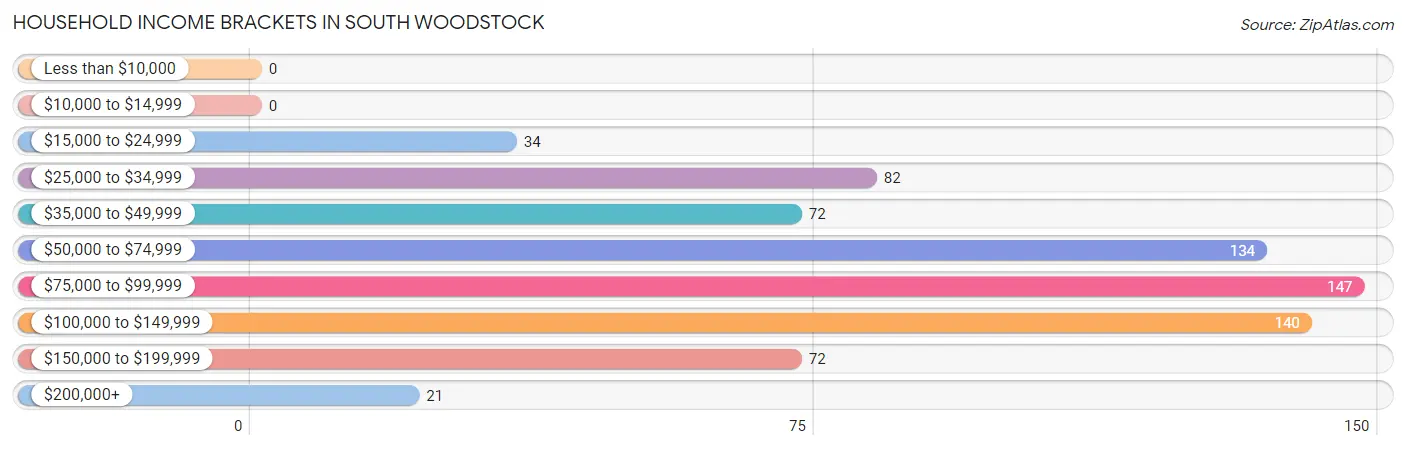
| Income Bracket | # Households | % Households |
| Less than $10,000 | 0 | 0.0% |
| $10,000 to $14,999 | 0 | 0.0% |
| $15,000 to $24,999 | 34 | 4.8% |
| $25,000 to $34,999 | 82 | 11.7% |
| $35,000 to $49,999 | 72 | 10.3% |
| $50,000 to $74,999 | 134 | 19.1% |
| $75,000 to $99,999 | 147 | 20.9% |
| $100,000 to $149,999 | 140 | 19.9% |
| $150,000 to $199,999 | 72 | 10.3% |
| $200,000+ | 21 | 3.0% |
Household Income by Householder Age in South Woodstock
The median household income in South Woodstock is $75,763, with the highest median household income of $84,861 found in the 45 to 64 years age bracket for the primary householder. A total of 302 households (43.0%) fall into this category. Meanwhile, the 15 to 24 years age bracket for the primary householder has the lowest median household income of $0, with 81 households (11.5%) in this group.
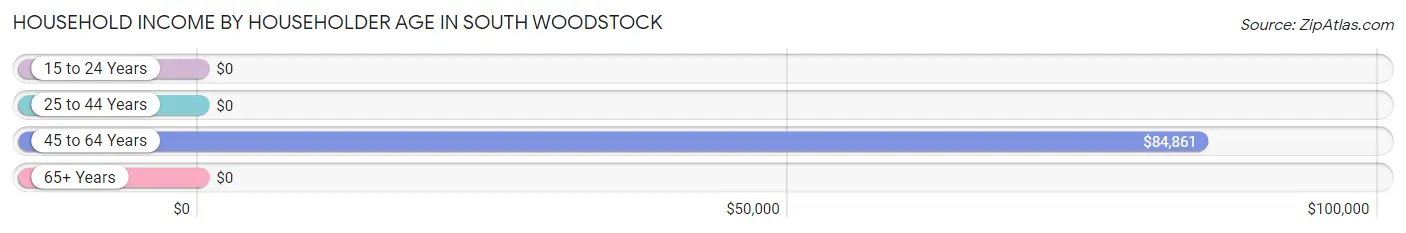
| Income Bracket | # Households | Median Income |
| 15 to 24 Years | 81 (11.5%) | $0 |
| 25 to 44 Years | 221 (31.5%) | $0 |
| 45 to 64 Years | 302 (43.0%) | $84,861 |
| 65+ Years | 98 (14.0%) | $0 |
| Total | 702 (100.0%) | $75,763 |
Poverty in South Woodstock
Income Below Poverty by Sex and Age in South Woodstock
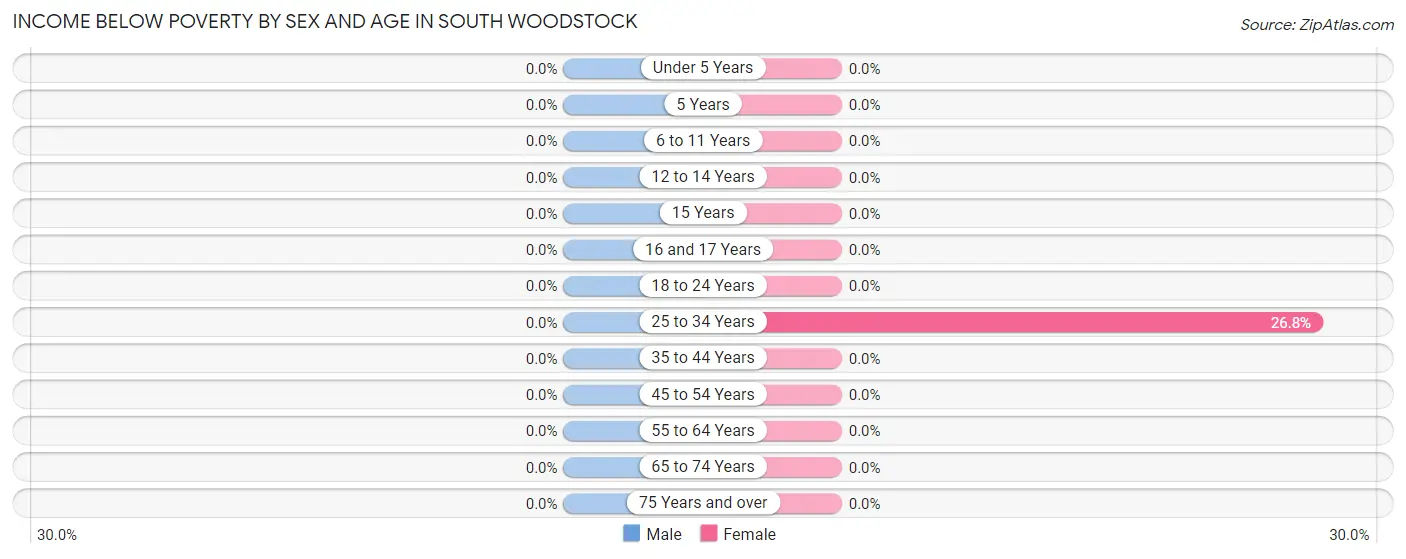
| Age Bracket | Male | Female |
| Under 5 Years | 0 (0.0%) | 0 (0.0%) |
| 5 Years | 0 (0.0%) | 0 (0.0%) |
| 6 to 11 Years | 0 (0.0%) | 0 (0.0%) |
| 12 to 14 Years | 0 (0.0%) | 0 (0.0%) |
| 15 Years | 0 (0.0%) | 0 (0.0%) |
| 16 and 17 Years | 0 (0.0%) | 0 (0.0%) |
| 18 to 24 Years | 0 (0.0%) | 0 (0.0%) |
| 25 to 34 Years | 0 (0.0%) | 15 (26.8%) |
| 35 to 44 Years | 0 (0.0%) | 0 (0.0%) |
| 45 to 54 Years | 0 (0.0%) | 0 (0.0%) |
| 55 to 64 Years | 0 (0.0%) | 0 (0.0%) |
| 65 to 74 Years | 0 (0.0%) | 0 (0.0%) |
| 75 Years and over | 0 (0.0%) | 0 (0.0%) |
| Total | 0 (0.0%) | 15 (2.2%) |
Income Above Poverty by Sex and Age in South Woodstock
According to the poverty statistics in South Woodstock, males aged under 5 years and females aged under 5 years are the age groups that are most secure financially, with 100.0% of males and 100.0% of females in these age groups living above the poverty line.
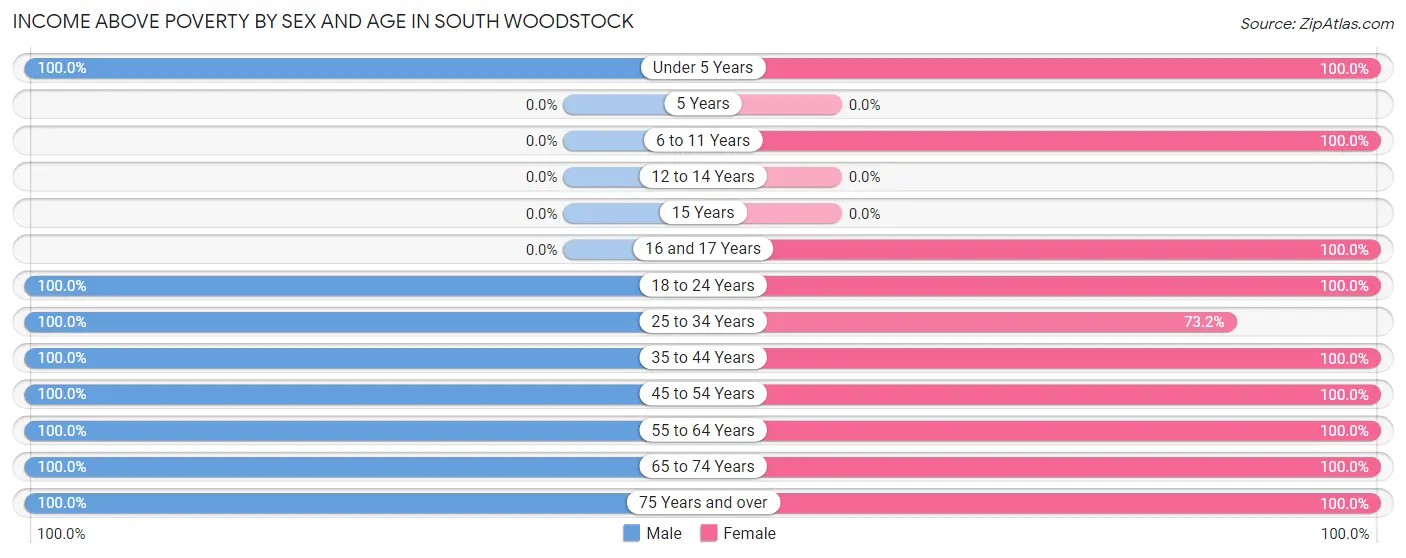
| Age Bracket | Male | Female |
| Under 5 Years | 79 (100.0%) | 32 (100.0%) |
| 5 Years | 0 (0.0%) | 0 (0.0%) |
| 6 to 11 Years | 0 (0.0%) | 10 (100.0%) |
| 12 to 14 Years | 0 (0.0%) | 0 (0.0%) |
| 15 Years | 0 (0.0%) | 0 (0.0%) |
| 16 and 17 Years | 0 (0.0%) | 69 (100.0%) |
| 18 to 24 Years | 144 (100.0%) | 187 (100.0%) |
| 25 to 34 Years | 164 (100.0%) | 41 (73.2%) |
| 35 to 44 Years | 57 (100.0%) | 41 (100.0%) |
| 45 to 54 Years | 87 (100.0%) | 90 (100.0%) |
| 55 to 64 Years | 131 (100.0%) | 122 (100.0%) |
| 65 to 74 Years | 34 (100.0%) | 67 (100.0%) |
| 75 Years and over | 32 (100.0%) | 16 (100.0%) |
| Total | 728 (100.0%) | 675 (97.8%) |
Income Below Poverty Among Married-Couple Families in South Woodstock
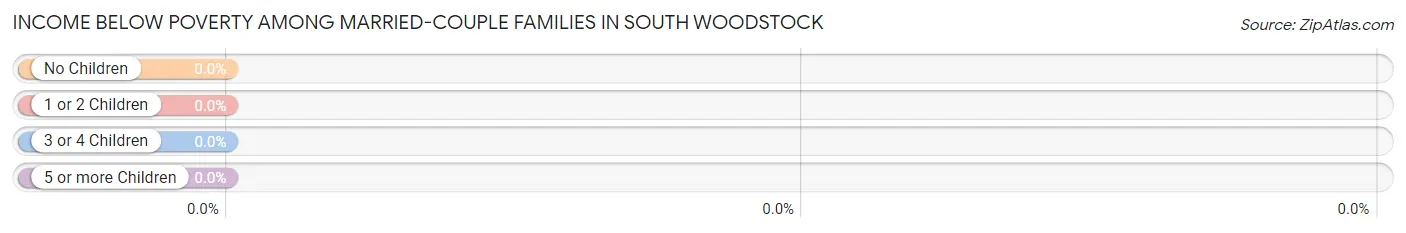
| Children | Above Poverty | Below Poverty |
| No Children | 183 (100.0%) | 0 (0.0%) |
| 1 or 2 Children | 51 (100.0%) | 0 (0.0%) |
| 3 or 4 Children | 0 (0.0%) | 0 (0.0%) |
| 5 or more Children | 0 (0.0%) | 0 (0.0%) |
| Total | 234 (100.0%) | 0 (0.0%) |
Income Below Poverty Among Single-Parent Households in South Woodstock
| Children | Single Father | Single Mother |
| No Children | 0 (0.0%) | 0 (0.0%) |
| 1 or 2 Children | 0 (0.0%) | 0 (0.0%) |
| 3 or 4 Children | 0 (0.0%) | 0 (0.0%) |
| 5 or more Children | 0 (0.0%) | 0 (0.0%) |
| Total | 0 (0.0%) | 0 (0.0%) |
Income Below Poverty Among Married-Couple vs Single-Parent Households in South Woodstock
| Children | Married-Couple Families | Single-Parent Households |
| No Children | 0 (0.0%) | 0 (0.0%) |
| 1 or 2 Children | 0 (0.0%) | 0 (0.0%) |
| 3 or 4 Children | 0 (0.0%) | 0 (0.0%) |
| 5 or more Children | 0 (0.0%) | 0 (0.0%) |
| Total | 0 (0.0%) | 0 (0.0%) |
Race in South Woodstock
The most populous races in South Woodstock are White / Caucasian (1,304 | 92.0%), and Two or more Races (114 | 8.0%).
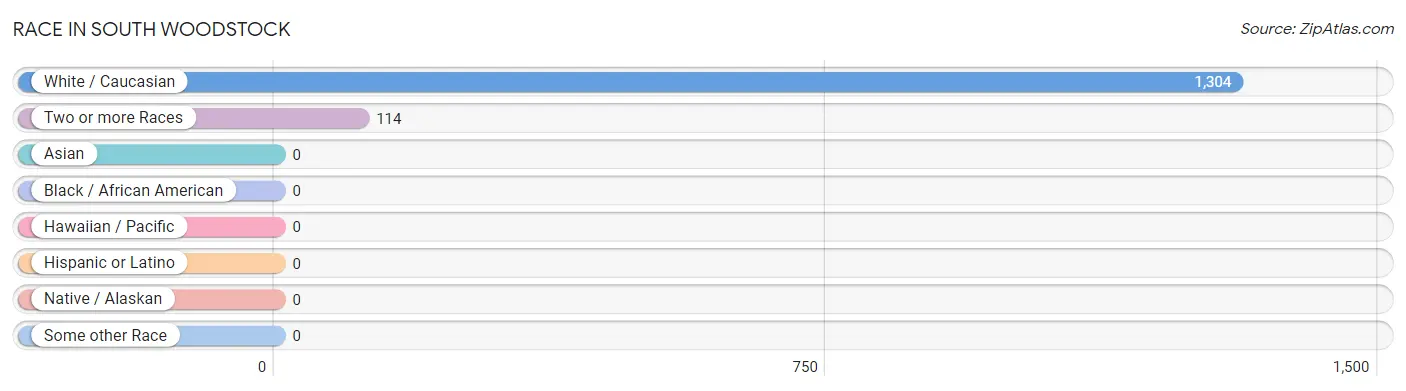
| Race | # Population | % Population |
| Asian | 0 | 0.0% |
| Black / African American | 0 | 0.0% |
| Hawaiian / Pacific | 0 | 0.0% |
| Hispanic or Latino | 0 | 0.0% |
| Native / Alaskan | 0 | 0.0% |
| White / Caucasian | 1,304 | 92.0% |
| Two or more Races | 114 | 8.0% |
| Some other Race | 0 | 0.0% |
| Total | 1,418 | 100.0% |
Ancestry in South Woodstock
The most populous ancestries reported in South Woodstock are French (369 | 26.0%), Irish (290 | 20.4%), English (187 | 13.2%), Polish (173 | 12.2%), and Italian (167 | 11.8%), together accounting for 83.6% of all South Woodstock residents.
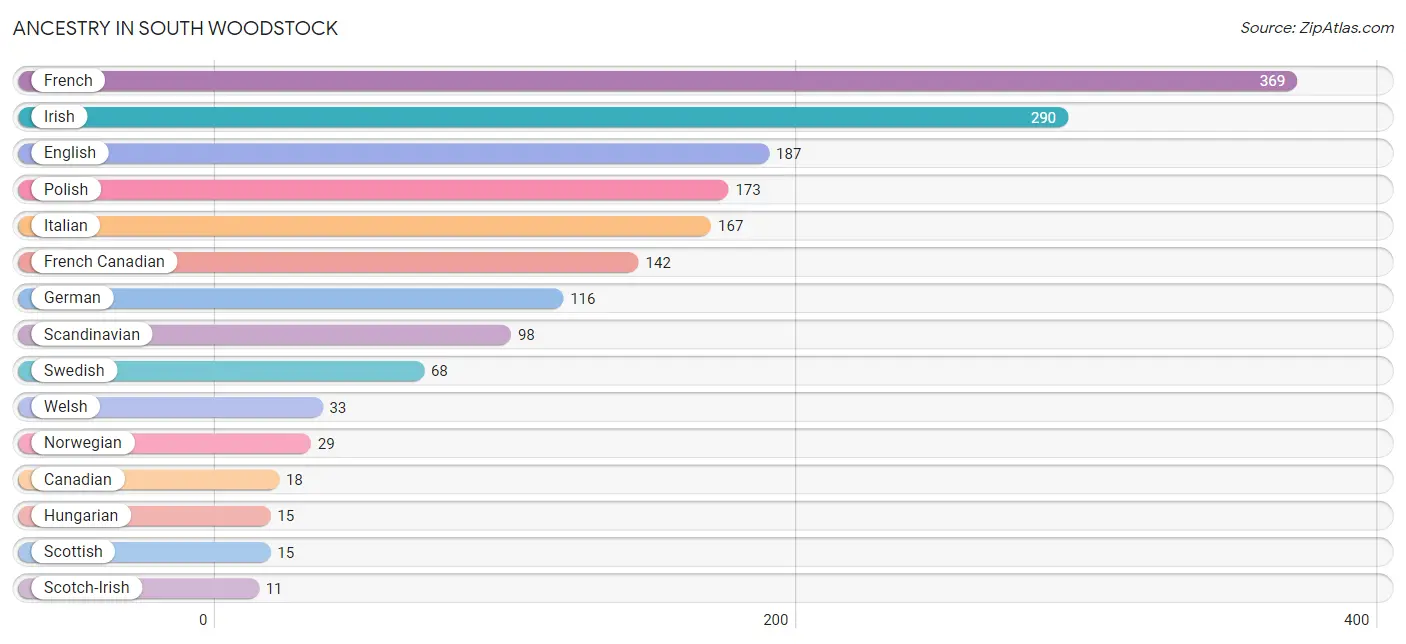
| Ancestry | # Population | % Population |
| Canadian | 18 | 1.3% |
| English | 187 | 13.2% |
| French | 369 | 26.0% |
| French Canadian | 142 | 10.0% |
| German | 116 | 8.2% |
| Hungarian | 15 | 1.1% |
| Irish | 290 | 20.4% |
| Italian | 167 | 11.8% |
| Norwegian | 29 | 2.1% |
| Polish | 173 | 12.2% |
| Scandinavian | 98 | 6.9% |
| Scotch-Irish | 11 | 0.8% |
| Scottish | 15 | 1.1% |
| Swedish | 68 | 4.8% |
| Welsh | 33 | 2.3% | View All 15 Rows |
Immigrants in South Woodstock

| Immigration Origin | # Population | % Population | View All 0 Rows |
Sex and Age in South Woodstock
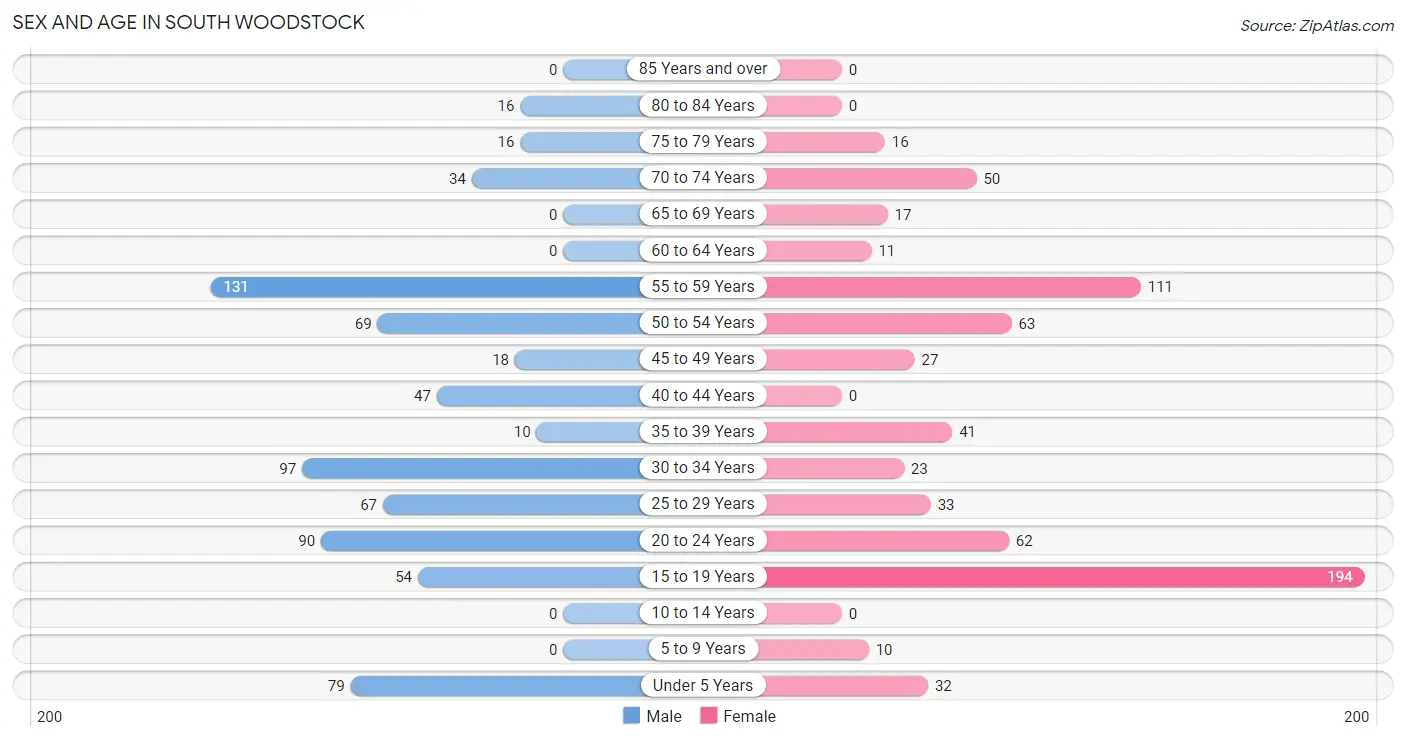
Sex and Age in South Woodstock
The most populous age groups in South Woodstock are 55 to 59 Years (131 | 18.0%) for men and 15 to 19 Years (194 | 28.1%) for women.
| Age Bracket | Male | Female |
| Under 5 Years | 79 (10.8%) | 32 (4.6%) |
| 5 to 9 Years | 0 (0.0%) | 10 (1.5%) |
| 10 to 14 Years | 0 (0.0%) | 0 (0.0%) |
| 15 to 19 Years | 54 (7.4%) | 194 (28.1%) |
| 20 to 24 Years | 90 (12.4%) | 62 (9.0%) |
| 25 to 29 Years | 67 (9.2%) | 33 (4.8%) |
| 30 to 34 Years | 97 (13.3%) | 23 (3.3%) |
| 35 to 39 Years | 10 (1.4%) | 41 (5.9%) |
| 40 to 44 Years | 47 (6.5%) | 0 (0.0%) |
| 45 to 49 Years | 18 (2.5%) | 27 (3.9%) |
| 50 to 54 Years | 69 (9.5%) | 63 (9.1%) |
| 55 to 59 Years | 131 (18.0%) | 111 (16.1%) |
| 60 to 64 Years | 0 (0.0%) | 11 (1.6%) |
| 65 to 69 Years | 0 (0.0%) | 17 (2.5%) |
| 70 to 74 Years | 34 (4.7%) | 50 (7.2%) |
| 75 to 79 Years | 16 (2.2%) | 16 (2.3%) |
| 80 to 84 Years | 16 (2.2%) | 0 (0.0%) |
| 85 Years and over | 0 (0.0%) | 0 (0.0%) |
| Total | 728 (100.0%) | 690 (100.0%) |
Families and Households in South Woodstock
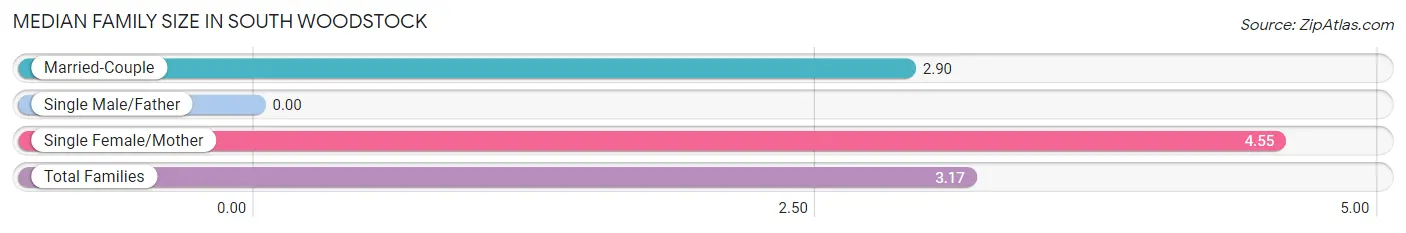
Median Family Size in South Woodstock
| Family Type | # Families | Family Size |
| Married-Couple | 234 (83.3%) | 2.90 |
| Single Male/Father | 0 (0.0%) | - |
| Single Female/Mother | 47 (16.7%) | 4.55 |
| Total Families | 281 (100.0%) | 3.17 |
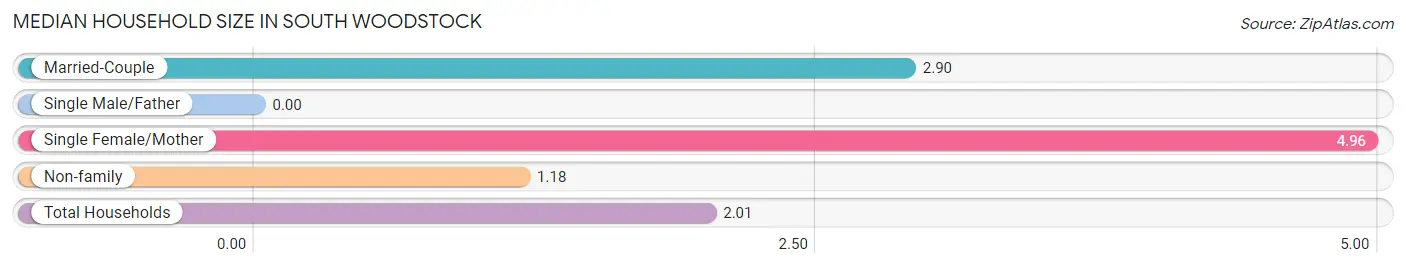
Median Household Size in South Woodstock
| Household Type | # Households | Household Size |
| Married-Couple | 234 (33.3%) | 2.90 |
| Single Male/Father | 0 (0.0%) | - |
| Single Female/Mother | 47 (6.7%) | 4.96 |
| Non-family | 421 (60.0%) | 1.18 |
| Total Households | 702 (100.0%) | 2.01 |
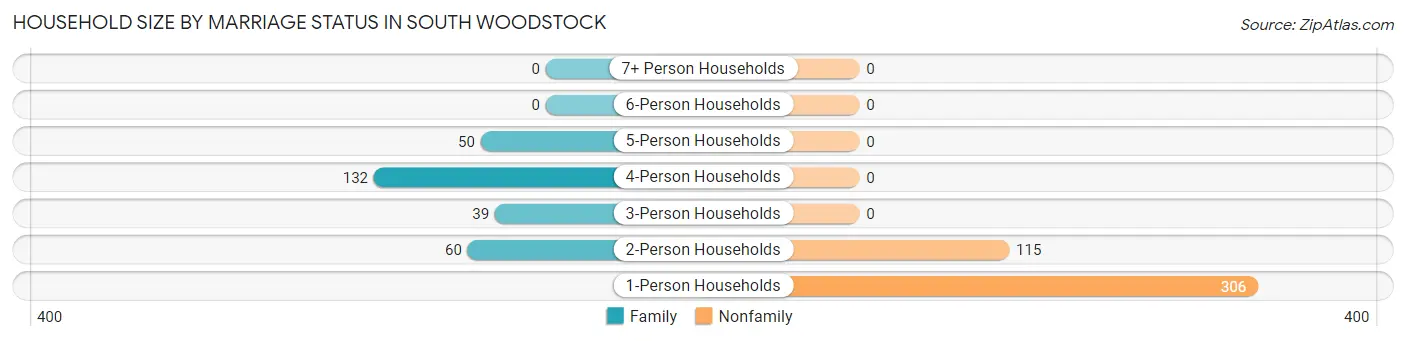
Household Size by Marriage Status in South Woodstock
Out of a total of 702 households in South Woodstock, 281 (40.0%) are family households, while 421 (60.0%) are nonfamily households. The most numerous type of family households are 4-person households, comprising 132, and the most common type of nonfamily households are 1-person households, comprising 306.
| Household Size | Family Households | Nonfamily Households |
| 1-Person Households | - | 306 (43.6%) |
| 2-Person Households | 60 (8.6%) | 115 (16.4%) |
| 3-Person Households | 39 (5.6%) | 0 (0.0%) |
| 4-Person Households | 132 (18.8%) | 0 (0.0%) |
| 5-Person Households | 50 (7.1%) | 0 (0.0%) |
| 6-Person Households | 0 (0.0%) | 0 (0.0%) |
| 7+ Person Households | 0 (0.0%) | 0 (0.0%) |
| Total | 281 (40.0%) | 421 (60.0%) |
Female Fertility in South Woodstock
Fertility by Age in South Woodstock
Average fertility rate in South Woodstock is 47.0 births per 1,000 women. Women in the age bracket of 20 to 34 years have the highest fertility rate with 153.0 births per 1,000 women. Women in the age bracket of 20 to 34 years acount for 100.0% of all women with births.
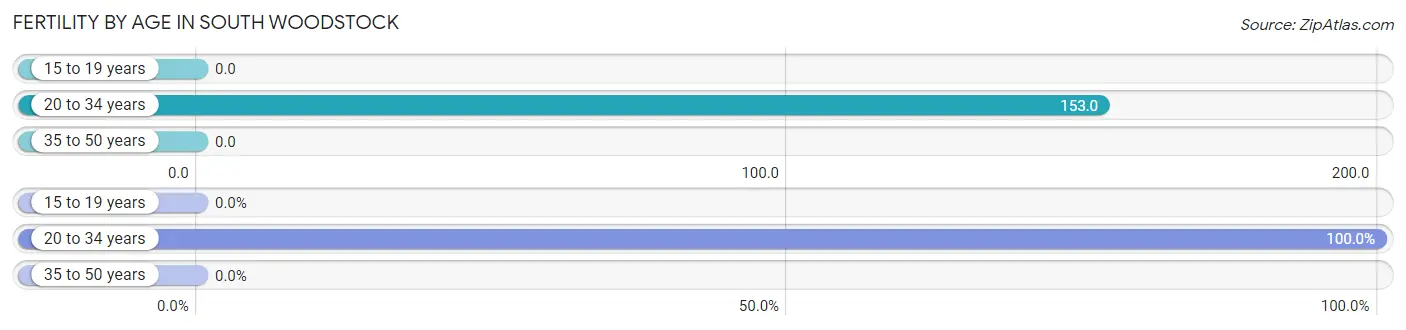
| Age Bracket | Women with Births | Births / 1,000 Women |
| 15 to 19 years | 0 (0.0%) | 0.0 |
| 20 to 34 years | 18 (100.0%) | 153.0 |
| 35 to 50 years | 0 (0.0%) | 0.0 |
| Total | 18 (100.0%) | 47.0 |
Fertility by Age by Marriage Status in South Woodstock
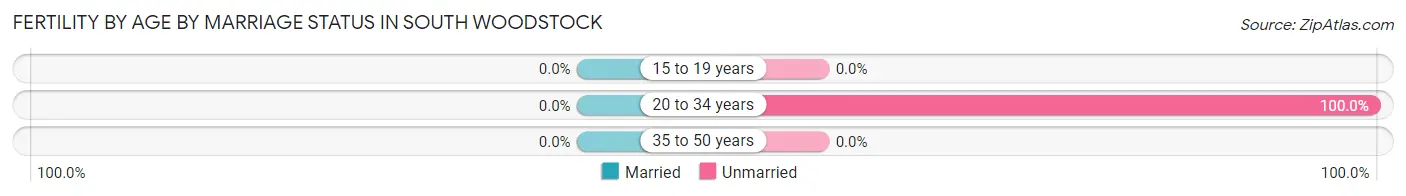
| Age Bracket | Married | Unmarried |
| 15 to 19 years | 0 (0.0%) | 0 (0.0%) |
| 20 to 34 years | 0 (0.0%) | 18 (100.0%) |
| 35 to 50 years | 0 (0.0%) | 0 (0.0%) |
| Total | 0 (0.0%) | 18 (100.0%) |
Fertility by Education in South Woodstock
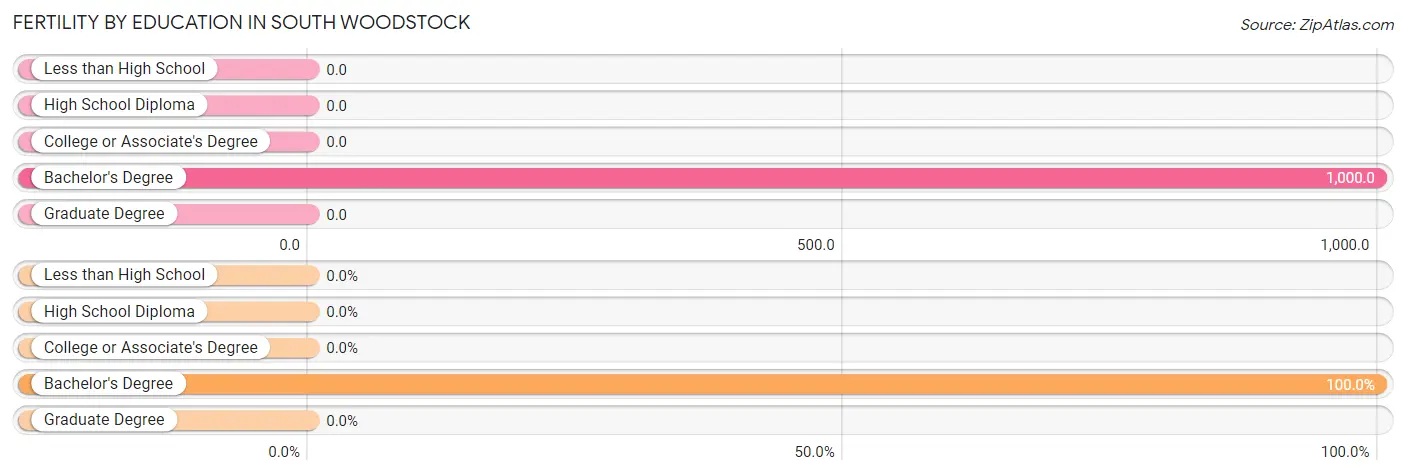
| Educational Attainment | Women with Births | Births / 1,000 Women |
| Less than High School | 0 (0.0%) | 0.0 |
| High School Diploma | 0 (0.0%) | 0.0 |
| College or Associate's Degree | 0 (0.0%) | 0.0 |
| Bachelor's Degree | 18 (100.0%) | 1,000.0 |
| Graduate Degree | 0 (0.0%) | 0.0 |
| Total | 18 (100.0%) | 47.0 |
Fertility by Education by Marriage Status in South Woodstock
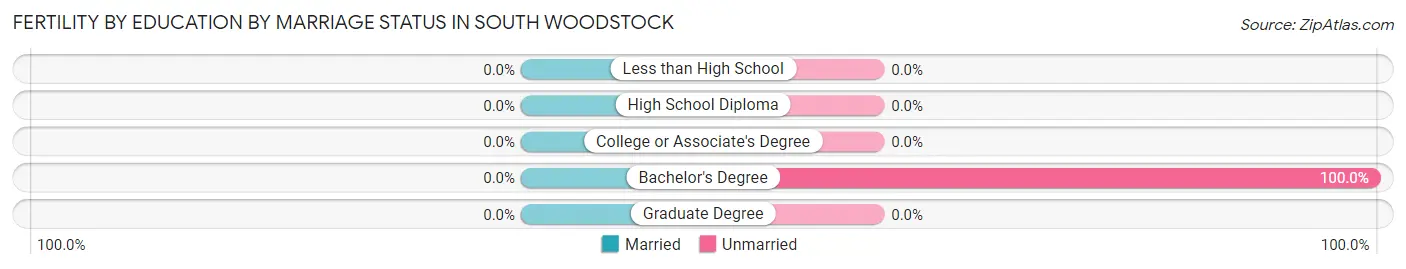
| Educational Attainment | Married | Unmarried |
| Less than High School | 0 (0.0%) | 0 (0.0%) |
| High School Diploma | 0 (0.0%) | 0 (0.0%) |
| College or Associate's Degree | 0 (0.0%) | 0 (0.0%) |
| Bachelor's Degree | 0 (0.0%) | 18 (100.0%) |
| Graduate Degree | 0 (0.0%) | 0 (0.0%) |
| Total | 0 (0.0%) | 18 (100.0%) |
Employment Characteristics in South Woodstock
Employment by Class of Employer in South Woodstock
Among the 979 employed individuals in South Woodstock, private company employees (621 | 63.4%), local government employees (130 | 13.3%), and self-employed (incorporated) (102 | 10.4%) make up the most common classes of employment.
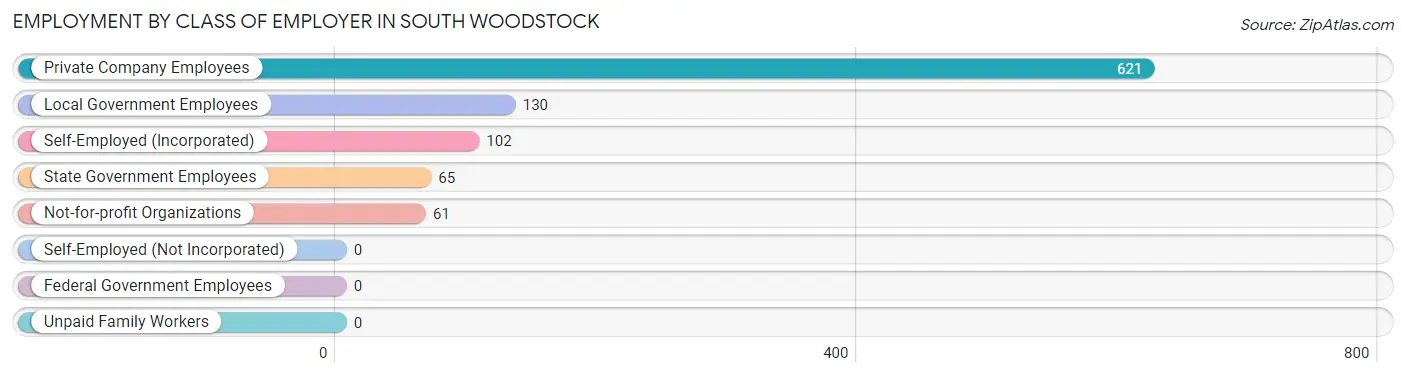
| Employer Class | # Employees | % Employees |
| Private Company Employees | 621 | 63.4% |
| Self-Employed (Incorporated) | 102 | 10.4% |
| Self-Employed (Not Incorporated) | 0 | 0.0% |
| Not-for-profit Organizations | 61 | 6.2% |
| Local Government Employees | 130 | 13.3% |
| State Government Employees | 65 | 6.6% |
| Federal Government Employees | 0 | 0.0% |
| Unpaid Family Workers | 0 | 0.0% |
| Total | 979 | 100.0% |
Employment Status by Age in South Woodstock
According to the labor force statistics for South Woodstock, out of the total population over 16 years of age (1,297), 81.3% or 1,054 individuals are in the labor force, with 7.2% or 76 of them unemployed. The age group with the highest labor force participation rate is 20 to 24 years, with 100.0% or 152 individuals in the labor force. Within the labor force, the 20 to 24 years age range has the highest percentage of unemployed individuals, with 26.3% or 40 of them being unemployed.
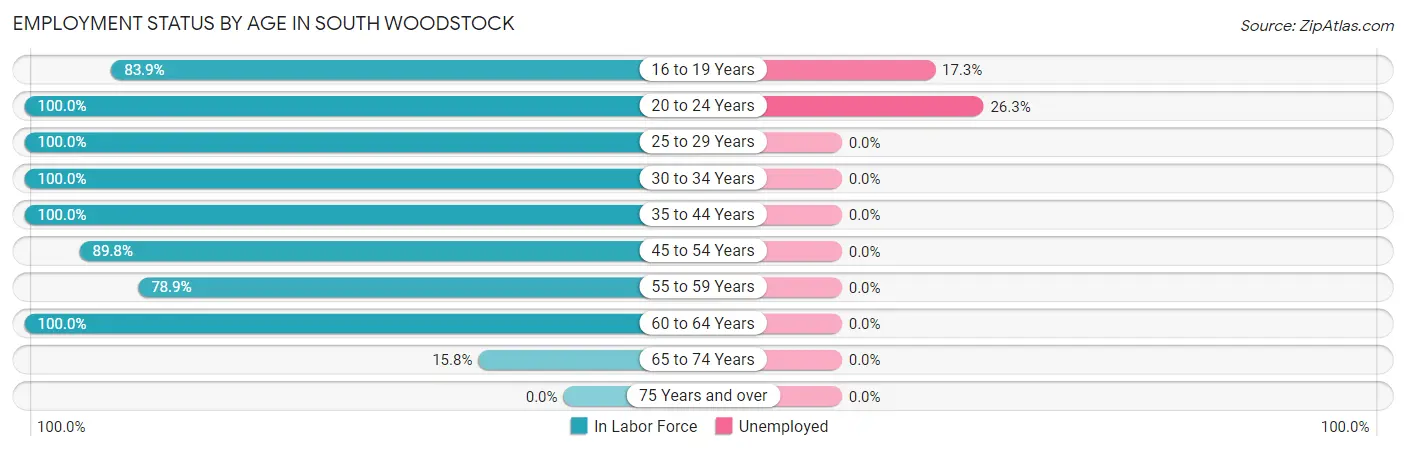
| Age Bracket | In Labor Force | Unemployed |
| 16 to 19 Years | 208 (83.9%) | 36 (17.3%) |
| 20 to 24 Years | 152 (100.0%) | 40 (26.3%) |
| 25 to 29 Years | 100 (100.0%) | 0 (0.0%) |
| 30 to 34 Years | 120 (100.0%) | 0 (0.0%) |
| 35 to 44 Years | 98 (100.0%) | 0 (0.0%) |
| 45 to 54 Years | 159 (89.8%) | 0 (0.0%) |
| 55 to 59 Years | 191 (78.9%) | 0 (0.0%) |
| 60 to 64 Years | 11 (100.0%) | 0 (0.0%) |
| 65 to 74 Years | 16 (15.8%) | 0 (0.0%) |
| 75 Years and over | 0 (0.0%) | 0 (0.0%) |
| Total | 1,054 (81.3%) | 76 (7.2%) |
Employment Status by Educational Attainment in South Woodstock
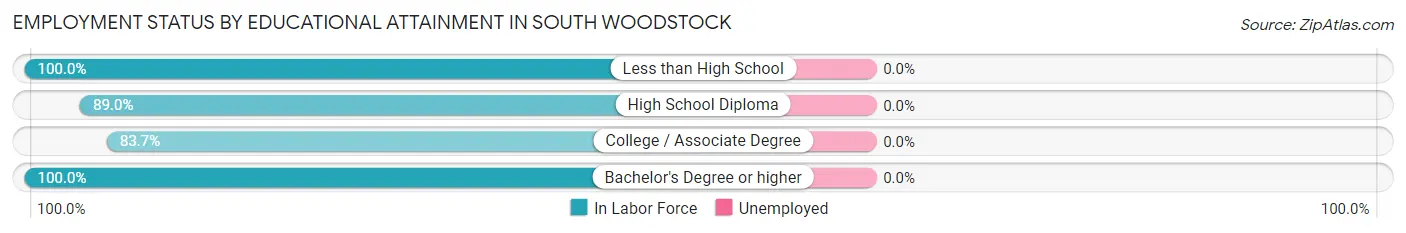
| Educational Attainment | In Labor Force | Unemployed |
| Less than High School | 9 (100.0%) | 0 (0.0%) |
| High School Diploma | 145 (89.0%) | 0 (0.0%) |
| College / Associate Degree | 261 (83.7%) | 0 (0.0%) |
| Bachelor's Degree or higher | 264 (100.0%) | 0 (0.0%) |
| Total | 679 (90.8%) | 0 (0.0%) |
Employment Occupations by Sex in South Woodstock
Management, Business, Science and Arts Occupations
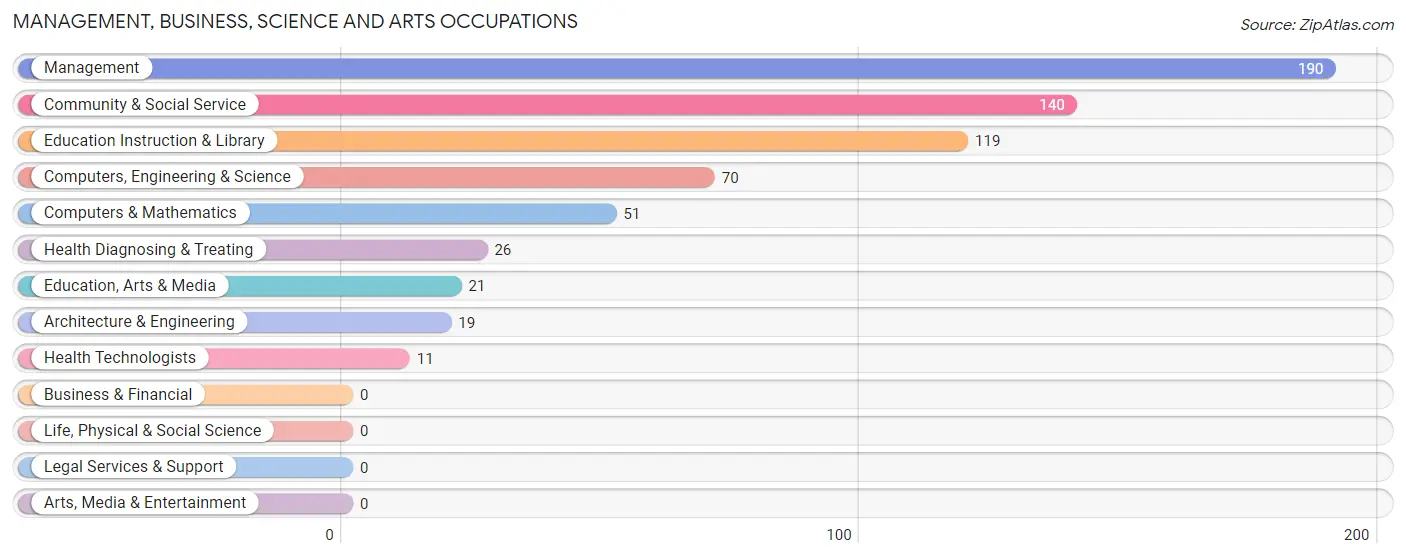
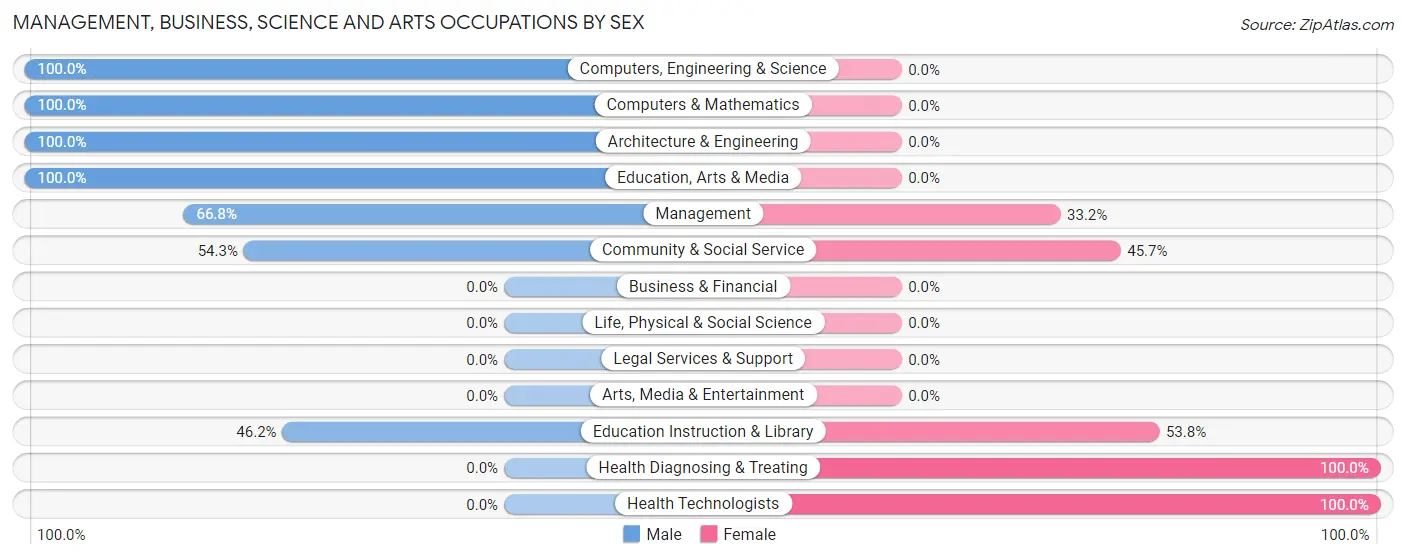
The most common Management, Business, Science and Arts occupations in South Woodstock are Management (190 | 19.4%), Community & Social Service (140 | 14.3%), Education Instruction & Library (119 | 12.2%), Computers, Engineering & Science (70 | 7.1%), and Computers & Mathematics (51 | 5.2%).
Management, Business, Science and Arts Occupations by Sex
Within the Management, Business, Science and Arts occupations in South Woodstock, the most male-oriented occupations are Computers, Engineering & Science (100.0%), Computers & Mathematics (100.0%), and Architecture & Engineering (100.0%), while the most female-oriented occupations are Health Diagnosing & Treating (100.0%), Health Technologists (100.0%), and Education Instruction & Library (53.8%).
| Occupation | Male | Female |
| Management | 127 (66.8%) | 63 (33.2%) |
| Business & Financial | 0 (0.0%) | 0 (0.0%) |
| Computers, Engineering & Science | 70 (100.0%) | 0 (0.0%) |
| Computers & Mathematics | 51 (100.0%) | 0 (0.0%) |
| Architecture & Engineering | 19 (100.0%) | 0 (0.0%) |
| Life, Physical & Social Science | 0 (0.0%) | 0 (0.0%) |
| Community & Social Service | 76 (54.3%) | 64 (45.7%) |
| Education, Arts & Media | 21 (100.0%) | 0 (0.0%) |
| Legal Services & Support | 0 (0.0%) | 0 (0.0%) |
| Education Instruction & Library | 55 (46.2%) | 64 (53.8%) |
| Arts, Media & Entertainment | 0 (0.0%) | 0 (0.0%) |
| Health Diagnosing & Treating | 0 (0.0%) | 26 (100.0%) |
| Health Technologists | 0 (0.0%) | 11 (100.0%) |
| Total (Category) | 273 (64.1%) | 153 (35.9%) |
| Total (Overall) | 574 (58.6%) | 405 (41.4%) |
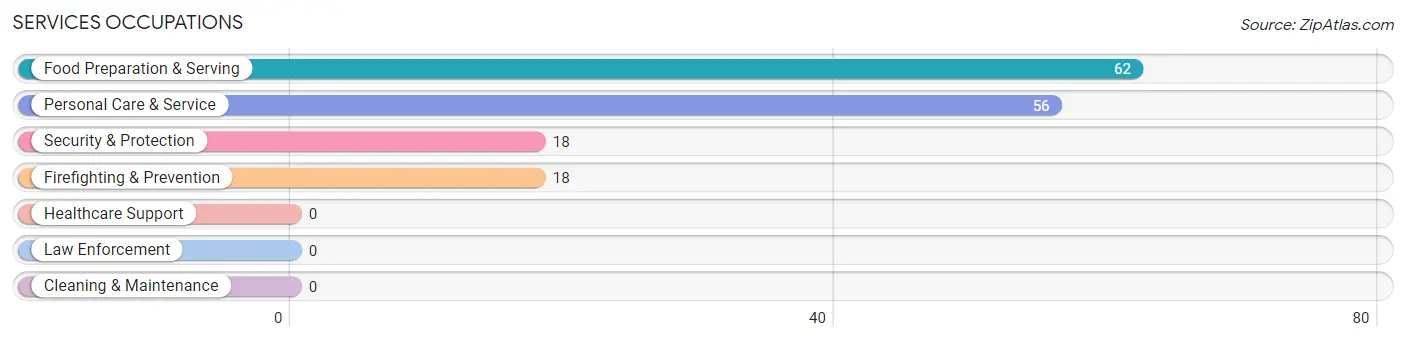
Services Occupations
The most common Services occupations in South Woodstock are Food Preparation & Serving (62 | 6.3%), Personal Care & Service (56 | 5.7%), Security & Protection (18 | 1.8%), and Firefighting & Prevention (18 | 1.8%).
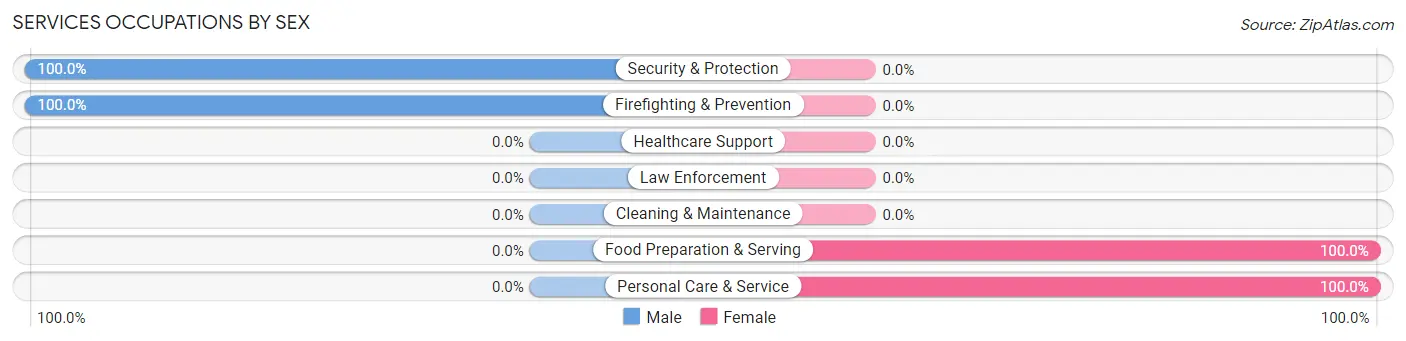
Services Occupations by Sex
Within the Services occupations in South Woodstock, the most male-oriented occupations are Security & Protection (100.0%), and Firefighting & Prevention (100.0%), while the most female-oriented occupations are Food Preparation & Serving (100.0%), and Personal Care & Service (100.0%).
| Occupation | Male | Female |
| Healthcare Support | 0 (0.0%) | 0 (0.0%) |
| Security & Protection | 18 (100.0%) | 0 (0.0%) |
| Firefighting & Prevention | 18 (100.0%) | 0 (0.0%) |
| Law Enforcement | 0 (0.0%) | 0 (0.0%) |
| Food Preparation & Serving | 0 (0.0%) | 62 (100.0%) |
| Cleaning & Maintenance | 0 (0.0%) | 0 (0.0%) |
| Personal Care & Service | 0 (0.0%) | 56 (100.0%) |
| Total (Category) | 18 (13.2%) | 118 (86.8%) |
| Total (Overall) | 574 (58.6%) | 405 (41.4%) |
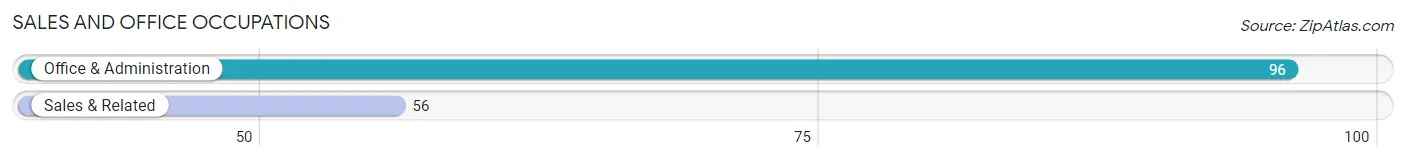
Sales and Office Occupations
The most common Sales and Office occupations in South Woodstock are Office & Administration (96 | 9.8%), and Sales & Related (56 | 5.7%).
Sales and Office Occupations by Sex
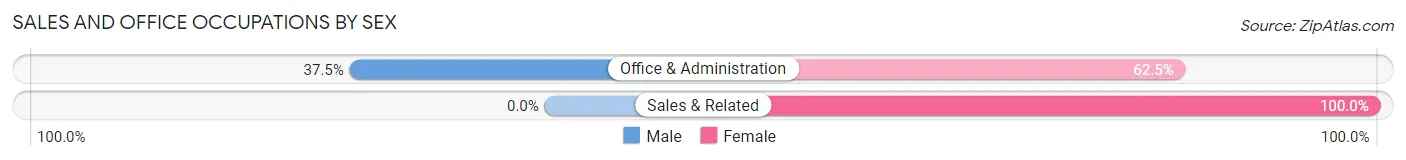
| Occupation | Male | Female |
| Sales & Related | 0 (0.0%) | 56 (100.0%) |
| Office & Administration | 36 (37.5%) | 60 (62.5%) |
| Total (Category) | 36 (23.7%) | 116 (76.3%) |
| Total (Overall) | 574 (58.6%) | 405 (41.4%) |
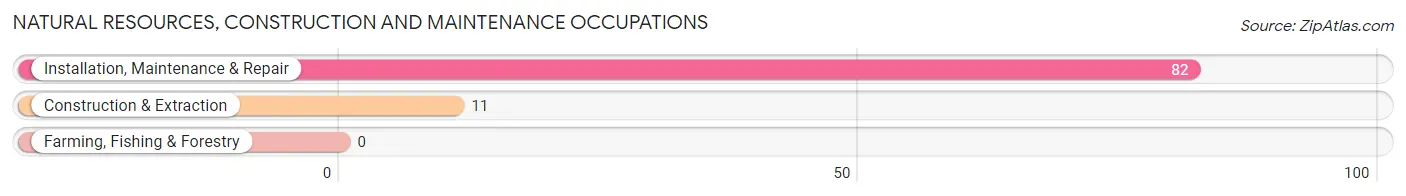
Natural Resources, Construction and Maintenance Occupations
The most common Natural Resources, Construction and Maintenance occupations in South Woodstock are Installation, Maintenance & Repair (82 | 8.4%), and Construction & Extraction (11 | 1.1%).
Natural Resources, Construction and Maintenance Occupations by Sex
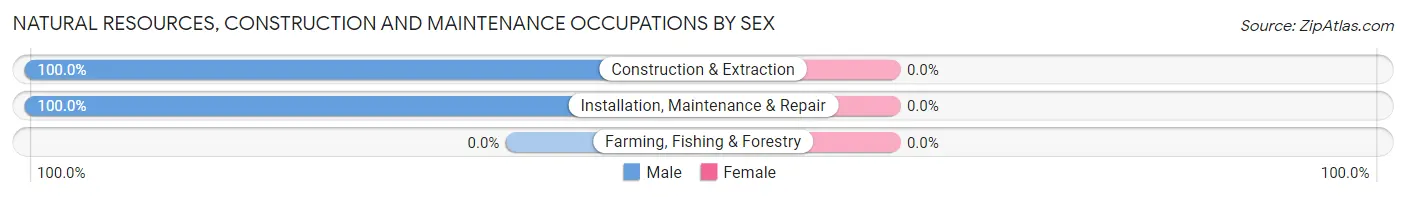
| Occupation | Male | Female |
| Farming, Fishing & Forestry | 0 (0.0%) | 0 (0.0%) |
| Construction & Extraction | 11 (100.0%) | 0 (0.0%) |
| Installation, Maintenance & Repair | 82 (100.0%) | 0 (0.0%) |
| Total (Category) | 93 (100.0%) | 0 (0.0%) |
| Total (Overall) | 574 (58.6%) | 405 (41.4%) |
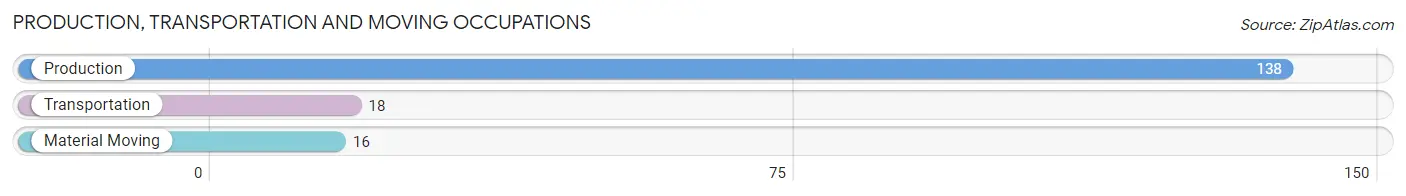
Production, Transportation and Moving Occupations
The most common Production, Transportation and Moving occupations in South Woodstock are Production (138 | 14.1%), Transportation (18 | 1.8%), and Material Moving (16 | 1.6%).
Production, Transportation and Moving Occupations by Sex
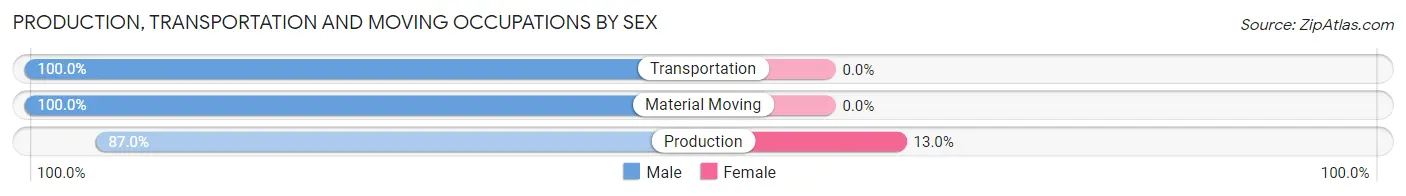
| Occupation | Male | Female |
| Production | 120 (87.0%) | 18 (13.0%) |
| Transportation | 18 (100.0%) | 0 (0.0%) |
| Material Moving | 16 (100.0%) | 0 (0.0%) |
| Total (Category) | 154 (89.5%) | 18 (10.5%) |
| Total (Overall) | 574 (58.6%) | 405 (41.4%) |
Employment Industries by Sex in South Woodstock
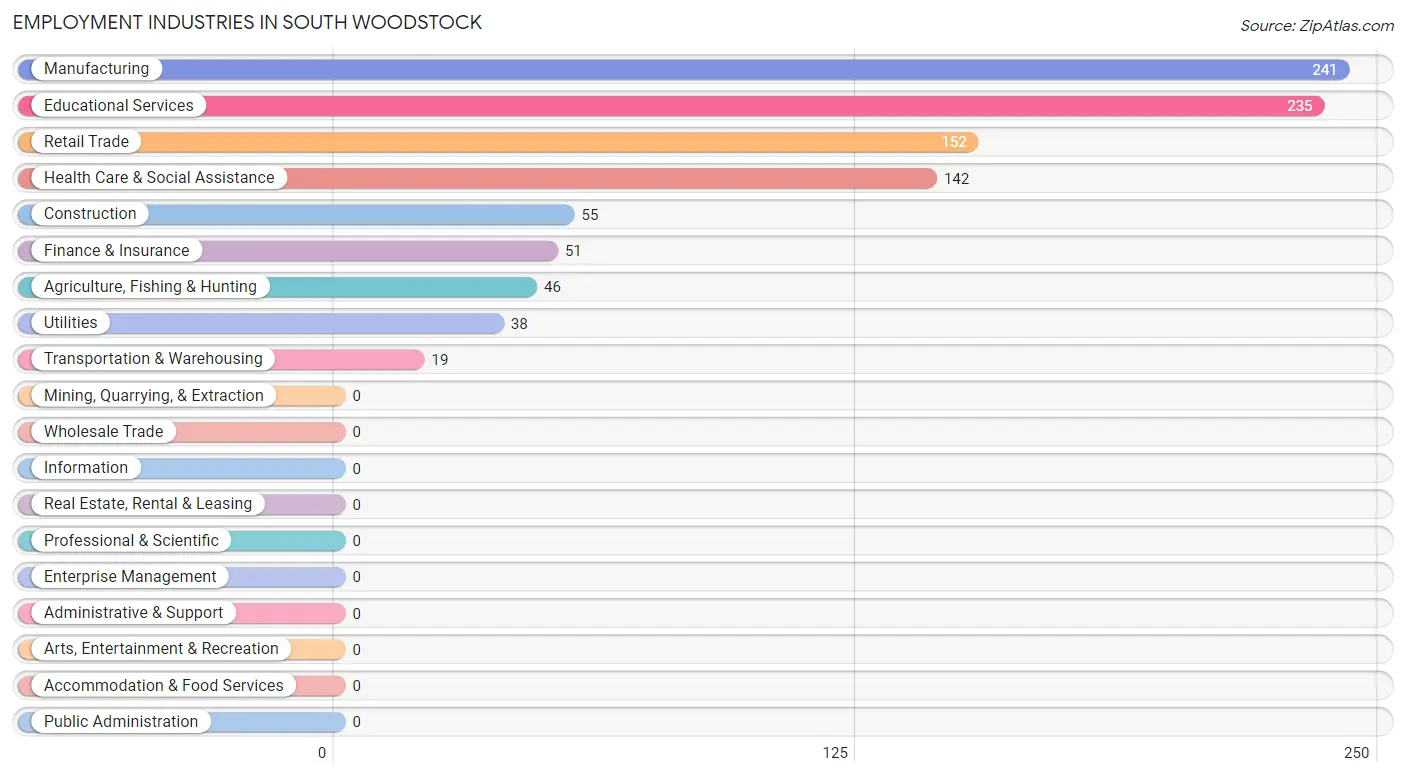
Employment Industries in South Woodstock
The major employment industries in South Woodstock include Manufacturing (241 | 24.6%), Educational Services (235 | 24.0%), Retail Trade (152 | 15.5%), Health Care & Social Assistance (142 | 14.5%), and Construction (55 | 5.6%).
Employment Industries by Sex in South Woodstock
The South Woodstock industries that see more men than women are Construction (100.0%), Transportation & Warehousing (100.0%), and Utilities (100.0%), whereas the industries that tend to have a higher number of women are Health Care & Social Assistance (85.2%), Retail Trade (77.6%), and Educational Services (36.2%).
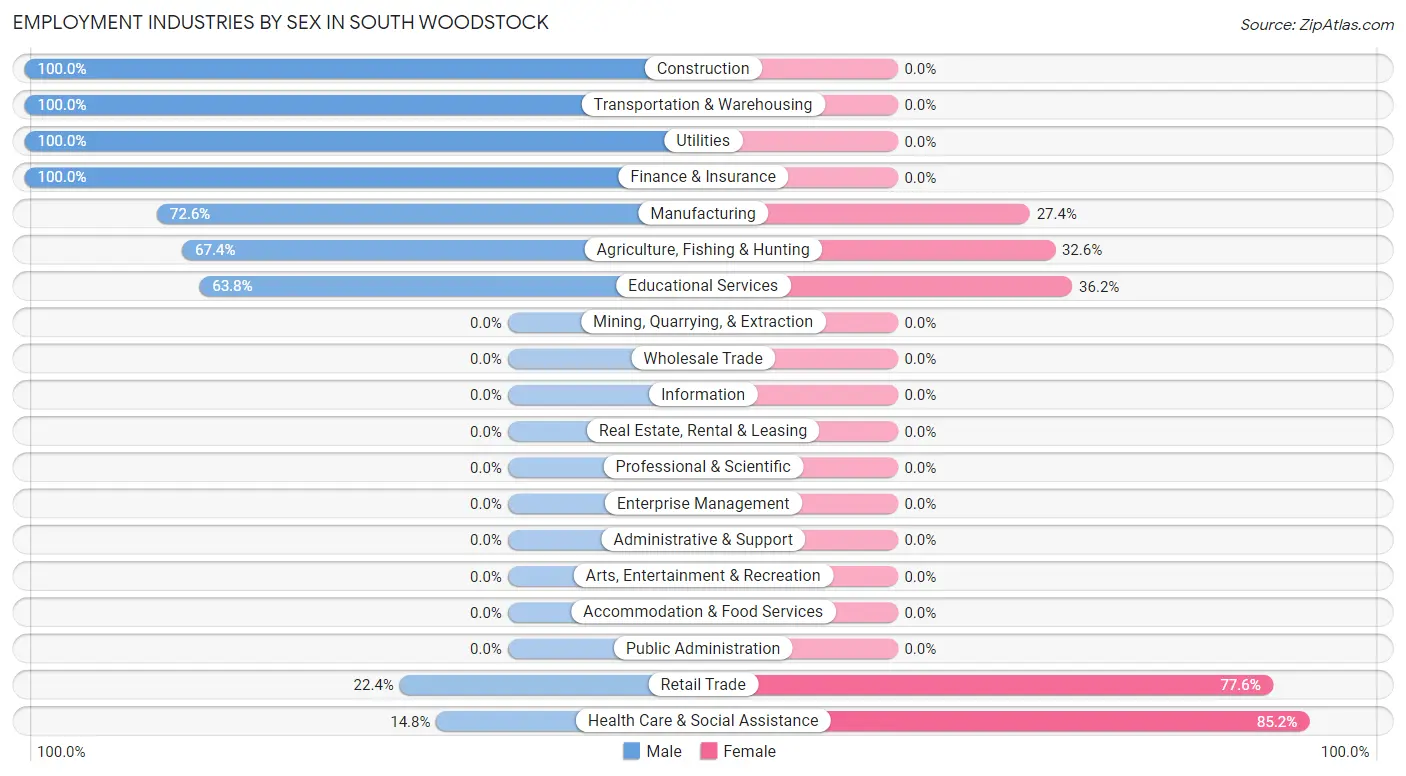
| Industry | Male | Female |
| Agriculture, Fishing & Hunting | 31 (67.4%) | 15 (32.6%) |
| Mining, Quarrying, & Extraction | 0 (0.0%) | 0 (0.0%) |
| Construction | 55 (100.0%) | 0 (0.0%) |
| Manufacturing | 175 (72.6%) | 66 (27.4%) |
| Wholesale Trade | 0 (0.0%) | 0 (0.0%) |
| Retail Trade | 34 (22.4%) | 118 (77.6%) |
| Transportation & Warehousing | 19 (100.0%) | 0 (0.0%) |
| Utilities | 38 (100.0%) | 0 (0.0%) |
| Information | 0 (0.0%) | 0 (0.0%) |
| Finance & Insurance | 51 (100.0%) | 0 (0.0%) |
| Real Estate, Rental & Leasing | 0 (0.0%) | 0 (0.0%) |
| Professional & Scientific | 0 (0.0%) | 0 (0.0%) |
| Enterprise Management | 0 (0.0%) | 0 (0.0%) |
| Administrative & Support | 0 (0.0%) | 0 (0.0%) |
| Educational Services | 150 (63.8%) | 85 (36.2%) |
| Health Care & Social Assistance | 21 (14.8%) | 121 (85.2%) |
| Arts, Entertainment & Recreation | 0 (0.0%) | 0 (0.0%) |
| Accommodation & Food Services | 0 (0.0%) | 0 (0.0%) |
| Public Administration | 0 (0.0%) | 0 (0.0%) |
| Total | 574 (58.6%) | 405 (41.4%) |
Education in South Woodstock
School Enrollment in South Woodstock
The most common levels of schooling among the 349 students in South Woodstock are college / undergraduate (219 | 62.7%), high school (76 | 21.8%), and nursery / preschool (44 | 12.6%).
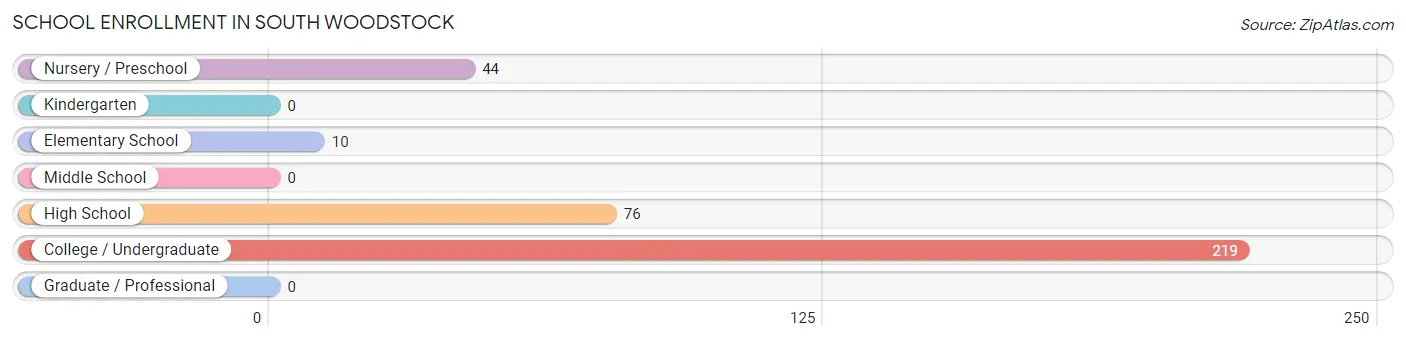
| School Level | # Students | % Students |
| Nursery / Preschool | 44 | 12.6% |
| Kindergarten | 0 | 0.0% |
| Elementary School | 10 | 2.9% |
| Middle School | 0 | 0.0% |
| High School | 76 | 21.8% |
| College / Undergraduate | 219 | 62.7% |
| Graduate / Professional | 0 | 0.0% |
| Total | 349 | 100.0% |
School Enrollment by Age by Funding Source in South Woodstock
Out of a total of 349 students who are enrolled in schools in South Woodstock, 44 (12.6%) attend a private institution, while the remaining 305 (87.4%) are enrolled in public schools. The age group of 3 to 4 year olds has the highest likelihood of being enrolled in private schools, with 44 (100.0% in the age bracket) enrolled. Conversely, the age group of 5 to 9 year old has the lowest likelihood of being enrolled in a private school, with 10 (100.0% in the age bracket) attending a public institution.
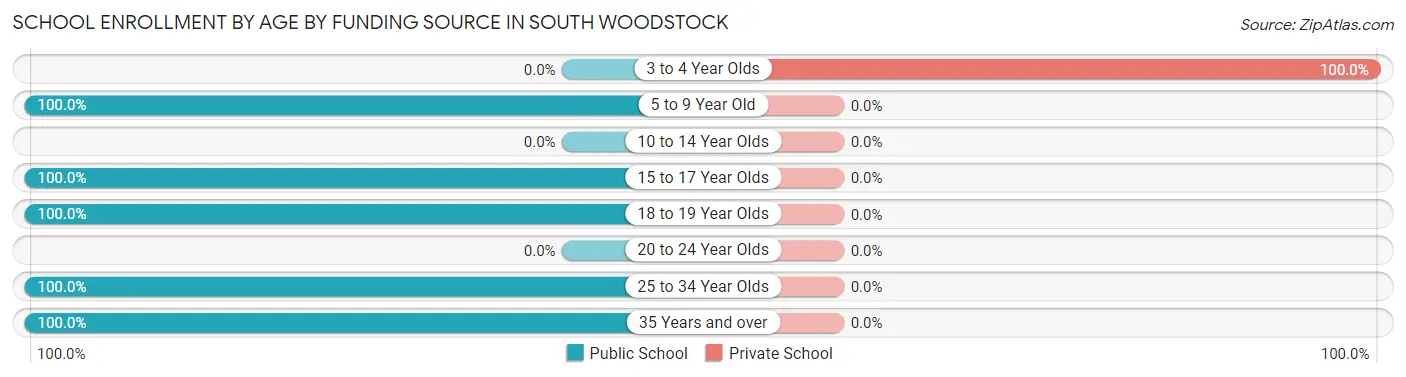
| Age Bracket | Public School | Private School |
| 3 to 4 Year Olds | 0 (0.0%) | 44 (100.0%) |
| 5 to 9 Year Old | 10 (100.0%) | 0 (0.0%) |
| 10 to 14 Year Olds | 0 (0.0%) | 0 (0.0%) |
| 15 to 17 Year Olds | 69 (100.0%) | 0 (0.0%) |
| 18 to 19 Year Olds | 125 (100.0%) | 0 (0.0%) |
| 20 to 24 Year Olds | 0 (0.0%) | 0 (0.0%) |
| 25 to 34 Year Olds | 67 (100.0%) | 0 (0.0%) |
| 35 Years and over | 34 (100.0%) | 0 (0.0%) |
| Total | 305 (87.4%) | 44 (12.6%) |
Educational Attainment by Field of Study in South Woodstock
Arts & humanities (70 | 18.8%), education (52 | 13.9%), business (51 | 13.7%), bio, nature & agricultural (44 | 11.8%), and psychology (44 | 11.8%) are the most common fields of study among 373 individuals in South Woodstock who have obtained a bachelor's degree or higher.
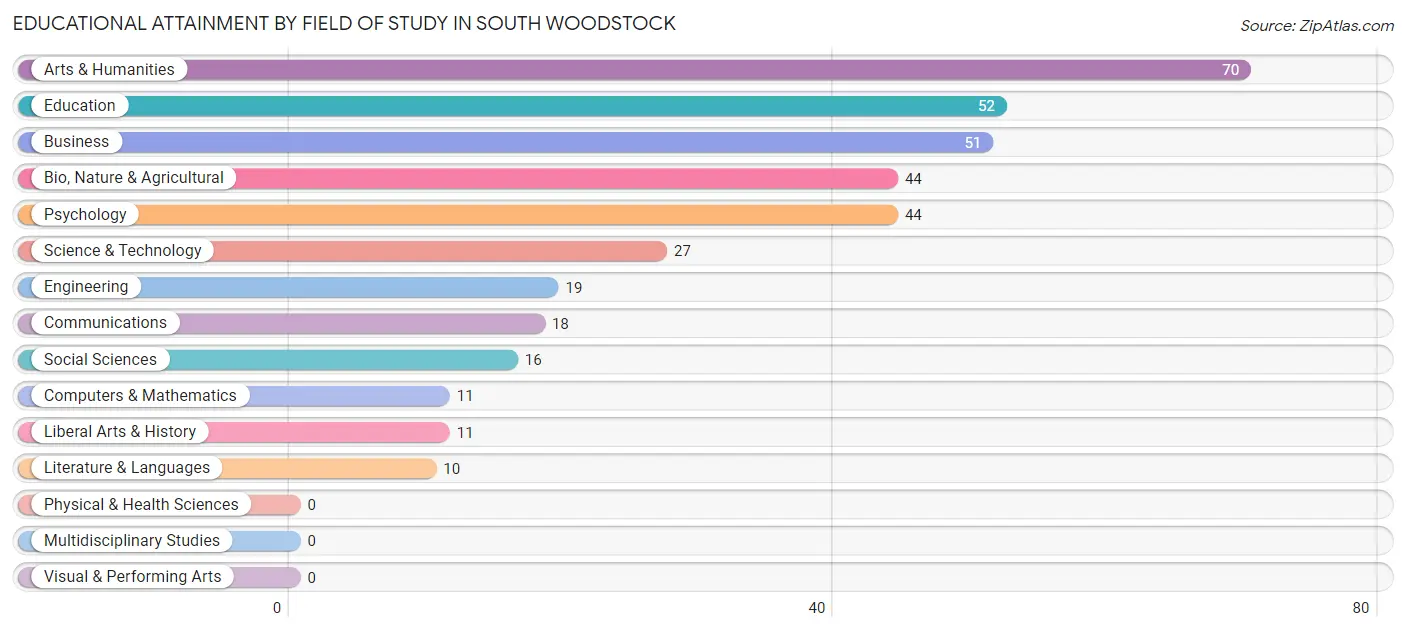
| Field of Study | # Graduates | % Graduates |
| Computers & Mathematics | 11 | 2.9% |
| Bio, Nature & Agricultural | 44 | 11.8% |
| Physical & Health Sciences | 0 | 0.0% |
| Psychology | 44 | 11.8% |
| Social Sciences | 16 | 4.3% |
| Engineering | 19 | 5.1% |
| Multidisciplinary Studies | 0 | 0.0% |
| Science & Technology | 27 | 7.2% |
| Business | 51 | 13.7% |
| Education | 52 | 13.9% |
| Literature & Languages | 10 | 2.7% |
| Liberal Arts & History | 11 | 2.9% |
| Visual & Performing Arts | 0 | 0.0% |
| Communications | 18 | 4.8% |
| Arts & Humanities | 70 | 18.8% |
| Total | 373 | 100.0% |
Transportation & Commute in South Woodstock
Vehicle Availability by Sex in South Woodstock
The most prevalent vehicle ownership categories in South Woodstock are males with 2 vehicles (222, accounting for 39.4%) and females with 2 vehicles (129, making up 54.8%).
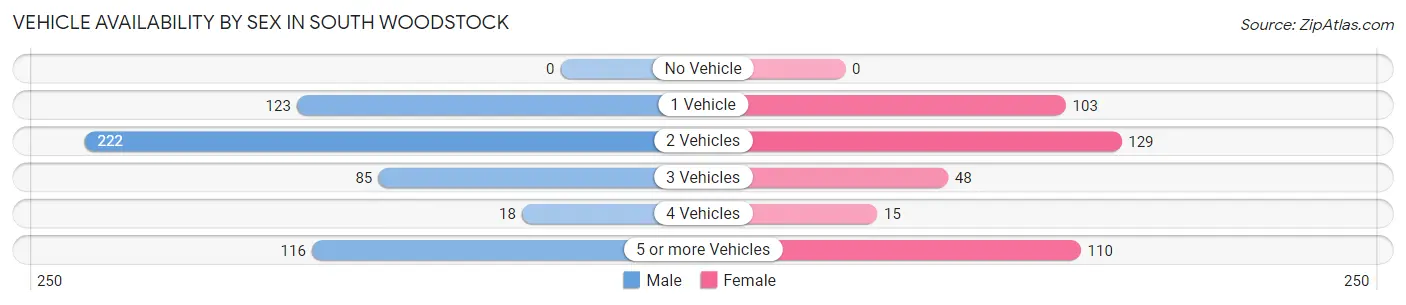
| Vehicles Available | Male | Female |
| No Vehicle | 0 (0.0%) | 0 (0.0%) |
| 1 Vehicle | 123 (21.8%) | 103 (25.4%) |
| 2 Vehicles | 222 (39.4%) | 129 (31.9%) |
| 3 Vehicles | 85 (15.1%) | 48 (11.8%) |
| 4 Vehicles | 18 (3.2%) | 15 (3.7%) |
| 5 or more Vehicles | 116 (20.6%) | 110 (27.2%) |
| Total | 564 (100.0%) | 405 (100.0%) |
Commute Time in South Woodstock
The most frequently occuring commute durations in South Woodstock are less than 5 minutes (169 commuters, 18.2%), 10 to 14 minutes (156 commuters, 16.8%), and 5 to 9 minutes (150 commuters, 16.1%).
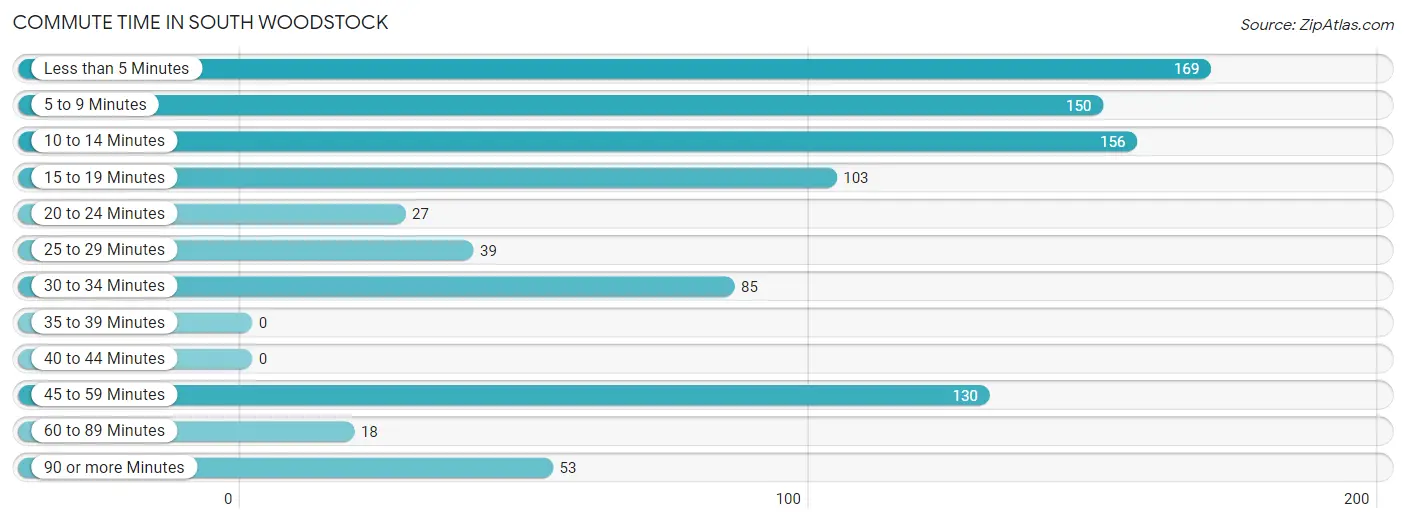
| Commute Time | # Commuters | % Commuters |
| Less than 5 Minutes | 169 | 18.2% |
| 5 to 9 Minutes | 150 | 16.1% |
| 10 to 14 Minutes | 156 | 16.8% |
| 15 to 19 Minutes | 103 | 11.1% |
| 20 to 24 Minutes | 27 | 2.9% |
| 25 to 29 Minutes | 39 | 4.2% |
| 30 to 34 Minutes | 85 | 9.1% |
| 35 to 39 Minutes | 0 | 0.0% |
| 40 to 44 Minutes | 0 | 0.0% |
| 45 to 59 Minutes | 130 | 14.0% |
| 60 to 89 Minutes | 18 | 1.9% |
| 90 or more Minutes | 53 | 5.7% |
Commute Time by Sex in South Woodstock
The most common commute times in South Woodstock are less than 5 minutes (121 commuters, 22.4%) for males and 10 to 14 minutes (135 commuters, 34.6%) for females.
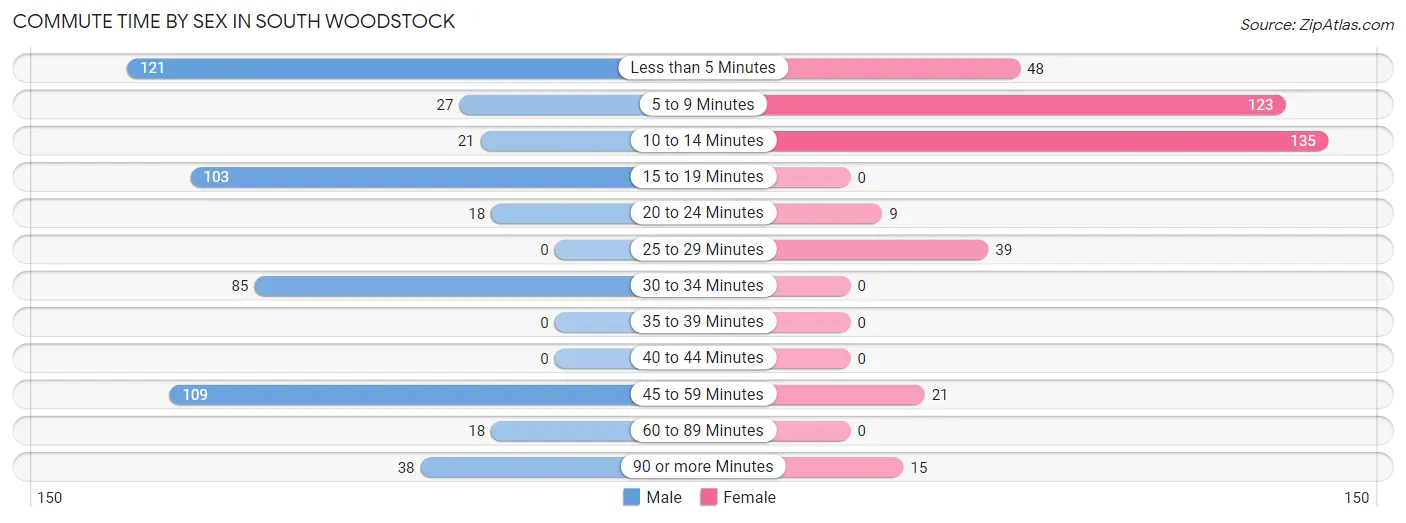
| Commute Time | Male | Female |
| Less than 5 Minutes | 121 (22.4%) | 48 (12.3%) |
| 5 to 9 Minutes | 27 (5.0%) | 123 (31.5%) |
| 10 to 14 Minutes | 21 (3.9%) | 135 (34.6%) |
| 15 to 19 Minutes | 103 (19.1%) | 0 (0.0%) |
| 20 to 24 Minutes | 18 (3.3%) | 9 (2.3%) |
| 25 to 29 Minutes | 0 (0.0%) | 39 (10.0%) |
| 30 to 34 Minutes | 85 (15.7%) | 0 (0.0%) |
| 35 to 39 Minutes | 0 (0.0%) | 0 (0.0%) |
| 40 to 44 Minutes | 0 (0.0%) | 0 (0.0%) |
| 45 to 59 Minutes | 109 (20.2%) | 21 (5.4%) |
| 60 to 89 Minutes | 18 (3.3%) | 0 (0.0%) |
| 90 or more Minutes | 38 (7.0%) | 15 (3.8%) |
Time of Departure to Work by Sex in South Woodstock
The most frequent times of departure to work in South Woodstock are 6:30 AM to 6:59 AM (186, 34.4%) for males and 7:00 AM to 7:29 AM (215, 55.1%) for females.
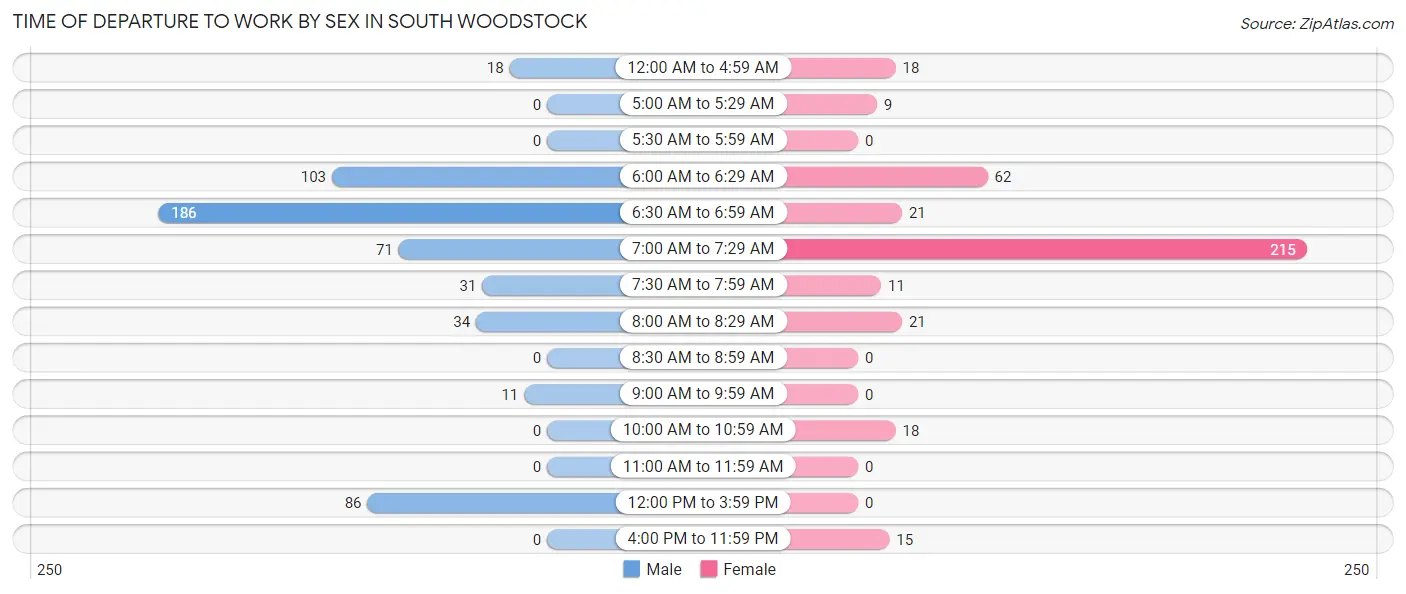
| Time of Departure | Male | Female |
| 12:00 AM to 4:59 AM | 18 (3.3%) | 18 (4.6%) |
| 5:00 AM to 5:29 AM | 0 (0.0%) | 9 (2.3%) |
| 5:30 AM to 5:59 AM | 0 (0.0%) | 0 (0.0%) |
| 6:00 AM to 6:29 AM | 103 (19.1%) | 62 (15.9%) |
| 6:30 AM to 6:59 AM | 186 (34.4%) | 21 (5.4%) |
| 7:00 AM to 7:29 AM | 71 (13.2%) | 215 (55.1%) |
| 7:30 AM to 7:59 AM | 31 (5.7%) | 11 (2.8%) |
| 8:00 AM to 8:29 AM | 34 (6.3%) | 21 (5.4%) |
| 8:30 AM to 8:59 AM | 0 (0.0%) | 0 (0.0%) |
| 9:00 AM to 9:59 AM | 11 (2.0%) | 0 (0.0%) |
| 10:00 AM to 10:59 AM | 0 (0.0%) | 18 (4.6%) |
| 11:00 AM to 11:59 AM | 0 (0.0%) | 0 (0.0%) |
| 12:00 PM to 3:59 PM | 86 (15.9%) | 0 (0.0%) |
| 4:00 PM to 11:59 PM | 0 (0.0%) | 15 (3.8%) |
| Total | 540 (100.0%) | 390 (100.0%) |
Housing Occupancy in South Woodstock
Occupancy by Ownership in South Woodstock
Of the total 702 dwellings in South Woodstock, owner-occupied units account for 357 (50.8%), while renter-occupied units make up 345 (49.1%).
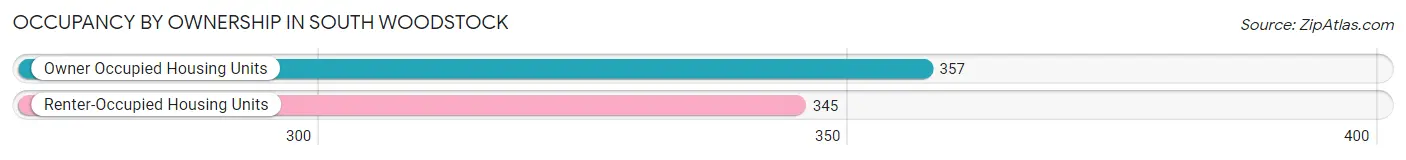
| Occupancy | # Housing Units | % Housing Units |
| Owner Occupied Housing Units | 357 | 50.8% |
| Renter-Occupied Housing Units | 345 | 49.1% |
| Total Occupied Housing Units | 702 | 100.0% |
Occupancy by Household Size in South Woodstock
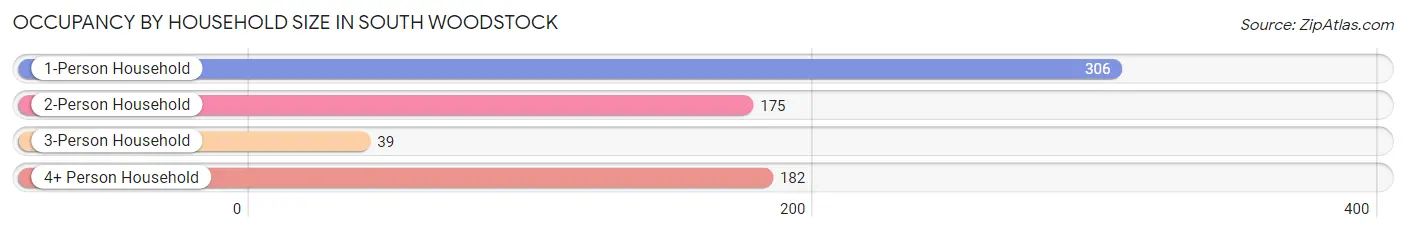
| Household Size | # Housing Units | % Housing Units |
| 1-Person Household | 306 | 43.6% |
| 2-Person Household | 175 | 24.9% |
| 3-Person Household | 39 | 5.6% |
| 4+ Person Household | 182 | 25.9% |
| Total Housing Units | 702 | 100.0% |
Occupancy by Ownership by Household Size in South Woodstock
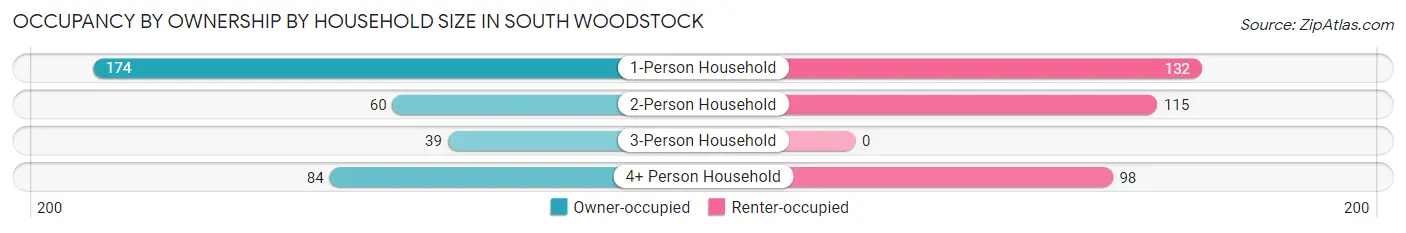
| Household Size | Owner-occupied | Renter-occupied |
| 1-Person Household | 174 (56.9%) | 132 (43.1%) |
| 2-Person Household | 60 (34.3%) | 115 (65.7%) |
| 3-Person Household | 39 (100.0%) | 0 (0.0%) |
| 4+ Person Household | 84 (46.2%) | 98 (53.8%) |
| Total Housing Units | 357 (50.8%) | 345 (49.1%) |
Occupancy by Educational Attainment in South Woodstock
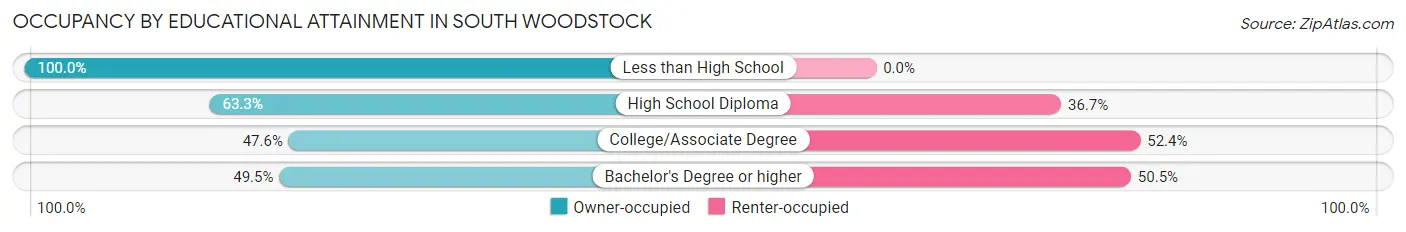
| Household Size | Owner-occupied | Renter-occupied |
| Less than High School | 9 (100.0%) | 0 (0.0%) |
| High School Diploma | 57 (63.3%) | 33 (36.7%) |
| College/Associate Degree | 191 (47.6%) | 210 (52.4%) |
| Bachelor's Degree or higher | 100 (49.5%) | 102 (50.5%) |
Occupancy by Age of Householder in South Woodstock
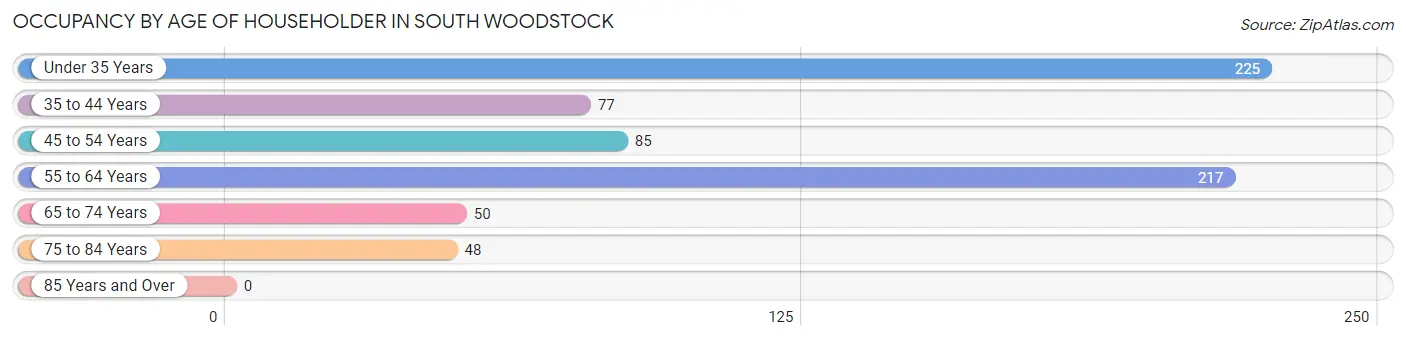
| Age Bracket | # Households | % Households |
| Under 35 Years | 225 | 32.1% |
| 35 to 44 Years | 77 | 11.0% |
| 45 to 54 Years | 85 | 12.1% |
| 55 to 64 Years | 217 | 30.9% |
| 65 to 74 Years | 50 | 7.1% |
| 75 to 84 Years | 48 | 6.8% |
| 85 Years and Over | 0 | 0.0% |
| Total | 702 | 100.0% |
Housing Finances in South Woodstock
Median Income by Occupancy in South Woodstock
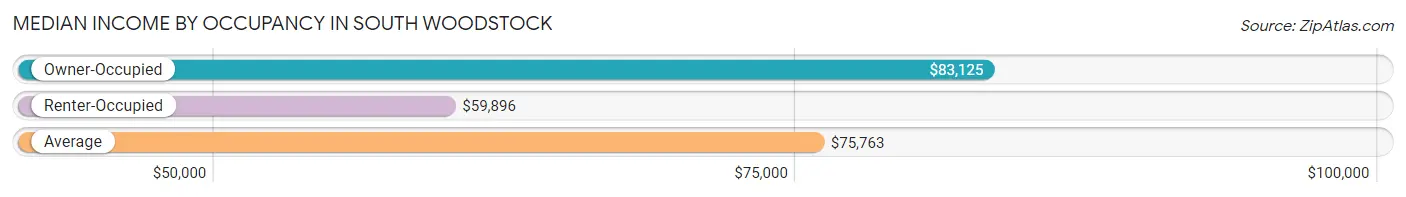
| Occupancy Type | # Households | Median Income |
| Owner-Occupied | 357 (50.8%) | $83,125 |
| Renter-Occupied | 345 (49.1%) | $59,896 |
| Average | 702 (100.0%) | $75,763 |
Occupancy by Householder Income Bracket in South Woodstock
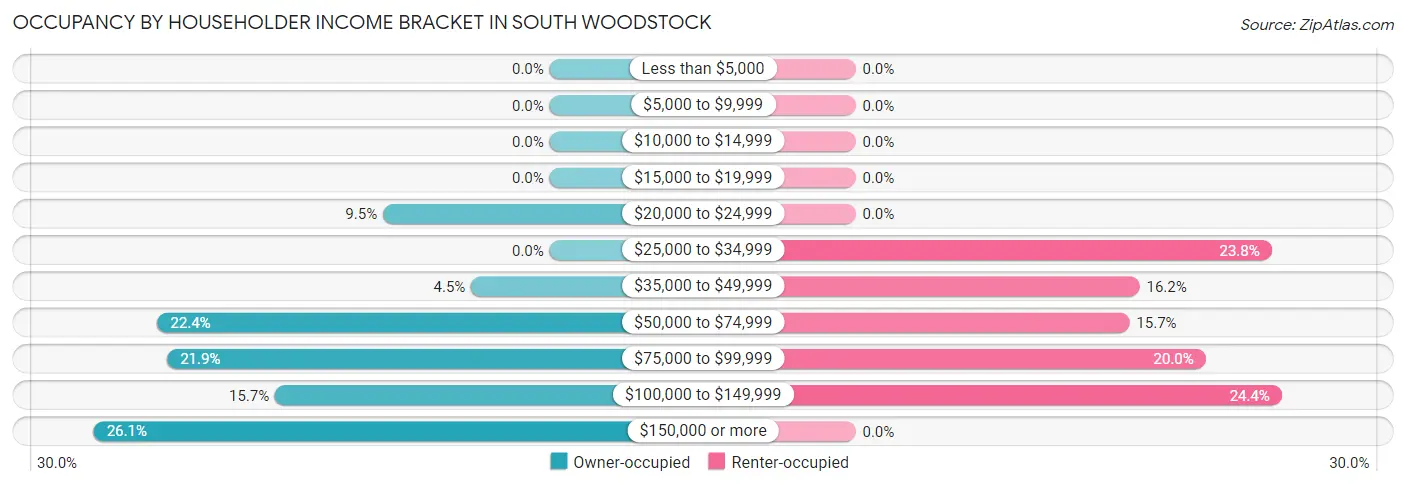
| Income Bracket | Owner-occupied | Renter-occupied |
| Less than $5,000 | 0 (0.0%) | 0 (0.0%) |
| $5,000 to $9,999 | 0 (0.0%) | 0 (0.0%) |
| $10,000 to $14,999 | 0 (0.0%) | 0 (0.0%) |
| $15,000 to $19,999 | 0 (0.0%) | 0 (0.0%) |
| $20,000 to $24,999 | 34 (9.5%) | 0 (0.0%) |
| $25,000 to $34,999 | 0 (0.0%) | 82 (23.8%) |
| $35,000 to $49,999 | 16 (4.5%) | 56 (16.2%) |
| $50,000 to $74,999 | 80 (22.4%) | 54 (15.7%) |
| $75,000 to $99,999 | 78 (21.8%) | 69 (20.0%) |
| $100,000 to $149,999 | 56 (15.7%) | 84 (24.3%) |
| $150,000 or more | 93 (26.1%) | 0 (0.0%) |
| Total | 357 (100.0%) | 345 (100.0%) |
Monthly Housing Cost Tiers in South Woodstock
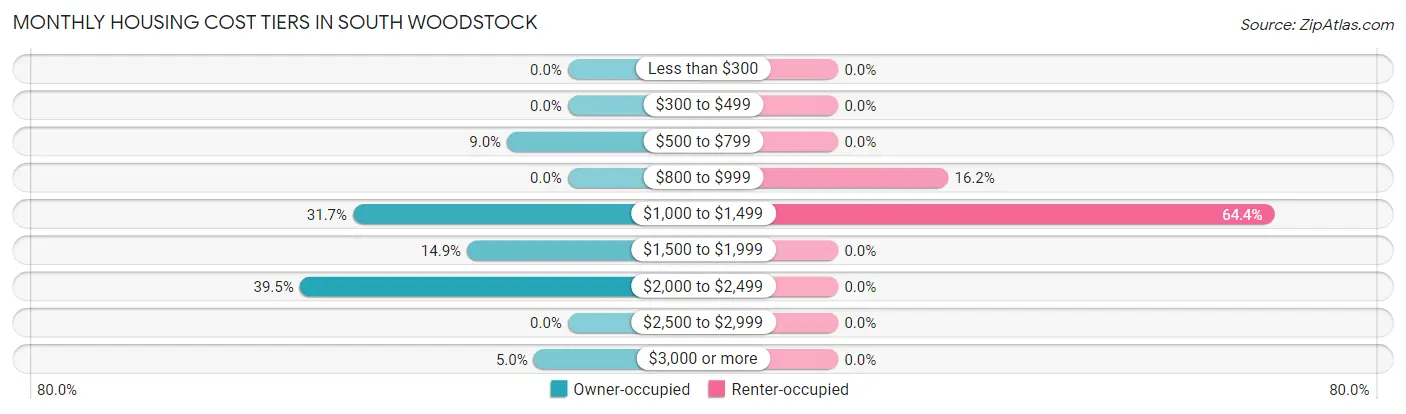
| Monthly Cost | Owner-occupied | Renter-occupied |
| Less than $300 | 0 (0.0%) | 0 (0.0%) |
| $300 to $499 | 0 (0.0%) | 0 (0.0%) |
| $500 to $799 | 32 (9.0%) | 0 (0.0%) |
| $800 to $999 | 0 (0.0%) | 56 (16.2%) |
| $1,000 to $1,499 | 113 (31.7%) | 222 (64.3%) |
| $1,500 to $1,999 | 53 (14.8%) | 0 (0.0%) |
| $2,000 to $2,499 | 141 (39.5%) | 0 (0.0%) |
| $2,500 to $2,999 | 0 (0.0%) | 0 (0.0%) |
| $3,000 or more | 18 (5.0%) | 0 (0.0%) |
| Total | 357 (100.0%) | 345 (100.0%) |
Physical Housing Characteristics in South Woodstock
Housing Structures in South Woodstock
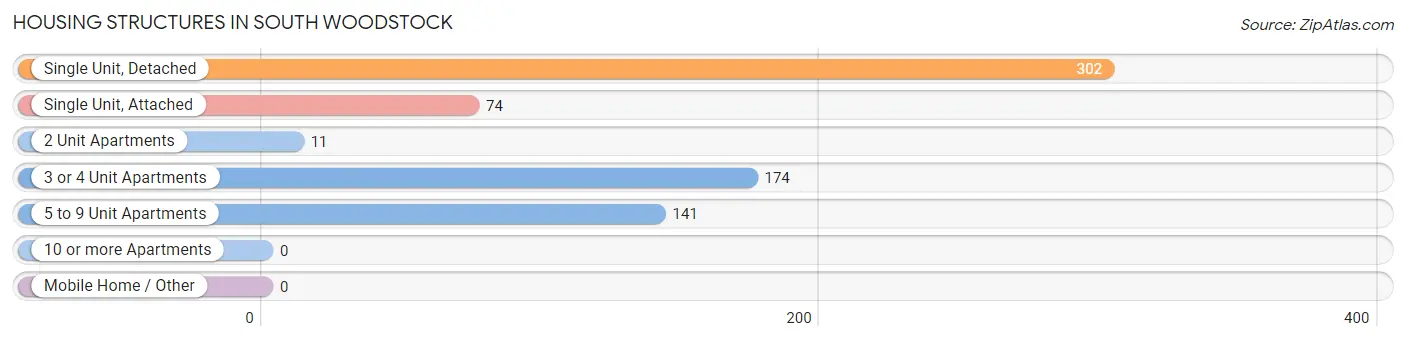
| Structure Type | # Housing Units | % Housing Units |
| Single Unit, Detached | 302 | 43.0% |
| Single Unit, Attached | 74 | 10.5% |
| 2 Unit Apartments | 11 | 1.6% |
| 3 or 4 Unit Apartments | 174 | 24.8% |
| 5 to 9 Unit Apartments | 141 | 20.1% |
| 10 or more Apartments | 0 | 0.0% |
| Mobile Home / Other | 0 | 0.0% |
| Total | 702 | 100.0% |
Housing Structures by Occupancy in South Woodstock
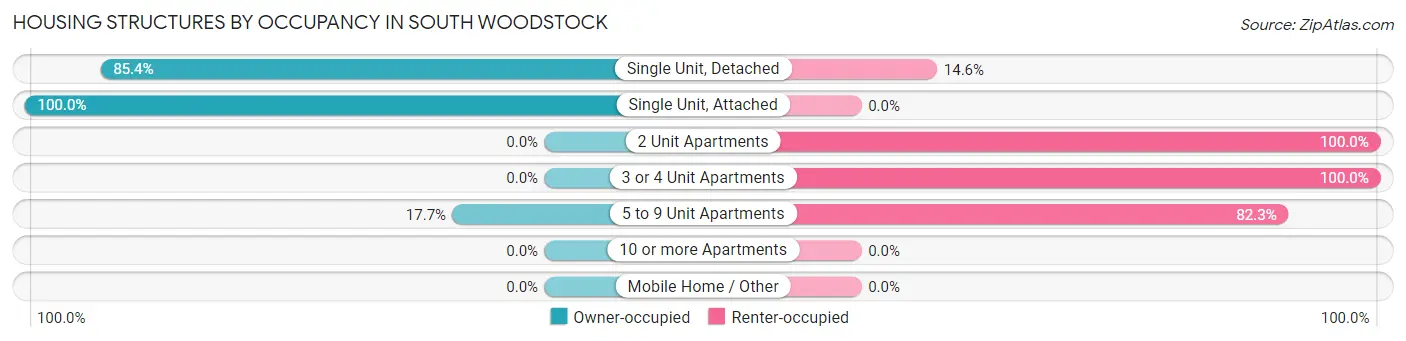
| Structure Type | Owner-occupied | Renter-occupied |
| Single Unit, Detached | 258 (85.4%) | 44 (14.6%) |
| Single Unit, Attached | 74 (100.0%) | 0 (0.0%) |
| 2 Unit Apartments | 0 (0.0%) | 11 (100.0%) |
| 3 or 4 Unit Apartments | 0 (0.0%) | 174 (100.0%) |
| 5 to 9 Unit Apartments | 25 (17.7%) | 116 (82.3%) |
| 10 or more Apartments | 0 (0.0%) | 0 (0.0%) |
| Mobile Home / Other | 0 (0.0%) | 0 (0.0%) |
| Total | 357 (50.8%) | 345 (49.1%) |
Housing Structures by Number of Rooms in South Woodstock
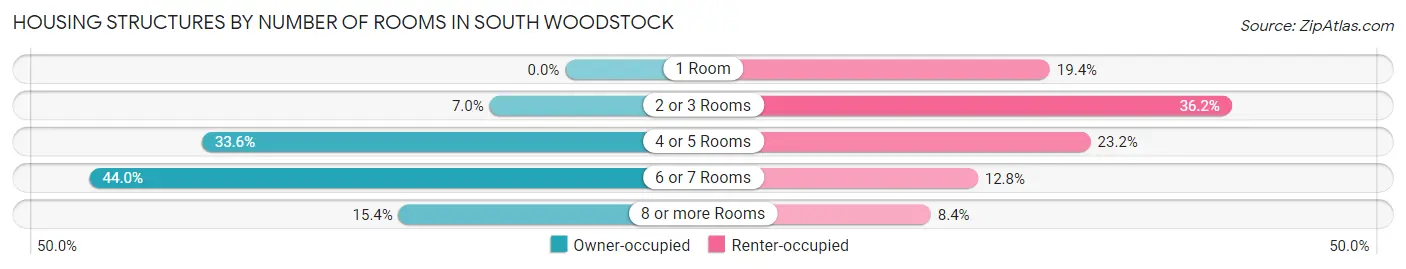
| Number of Rooms | Owner-occupied | Renter-occupied |
| 1 Room | 0 (0.0%) | 67 (19.4%) |
| 2 or 3 Rooms | 25 (7.0%) | 125 (36.2%) |
| 4 or 5 Rooms | 120 (33.6%) | 80 (23.2%) |
| 6 or 7 Rooms | 157 (44.0%) | 44 (12.8%) |
| 8 or more Rooms | 55 (15.4%) | 29 (8.4%) |
| Total | 357 (100.0%) | 345 (100.0%) |
Housing Structure by Heating Type in South Woodstock
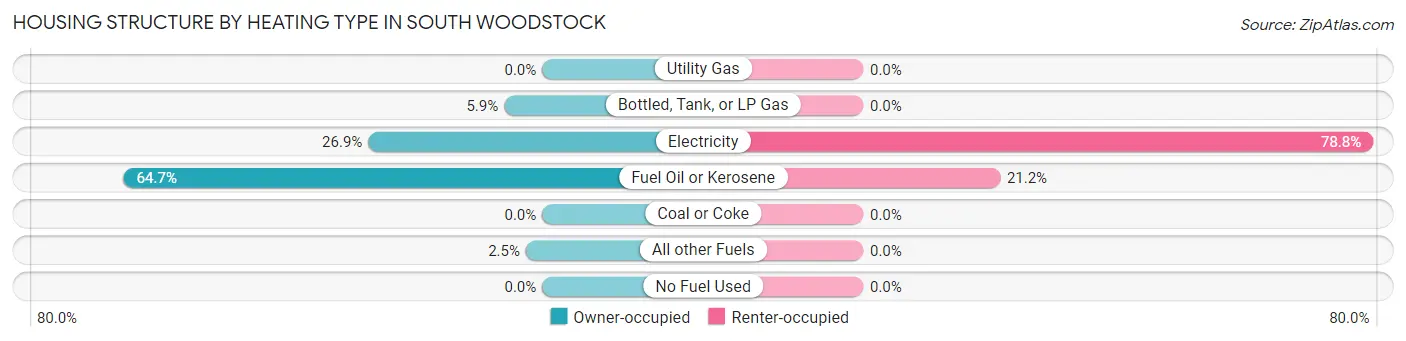
| Heating Type | Owner-occupied | Renter-occupied |
| Utility Gas | 0 (0.0%) | 0 (0.0%) |
| Bottled, Tank, or LP Gas | 21 (5.9%) | 0 (0.0%) |
| Electricity | 96 (26.9%) | 272 (78.8%) |
| Fuel Oil or Kerosene | 231 (64.7%) | 73 (21.2%) |
| Coal or Coke | 0 (0.0%) | 0 (0.0%) |
| All other Fuels | 9 (2.5%) | 0 (0.0%) |
| No Fuel Used | 0 (0.0%) | 0 (0.0%) |
| Total | 357 (100.0%) | 345 (100.0%) |
Household Vehicle Usage in South Woodstock
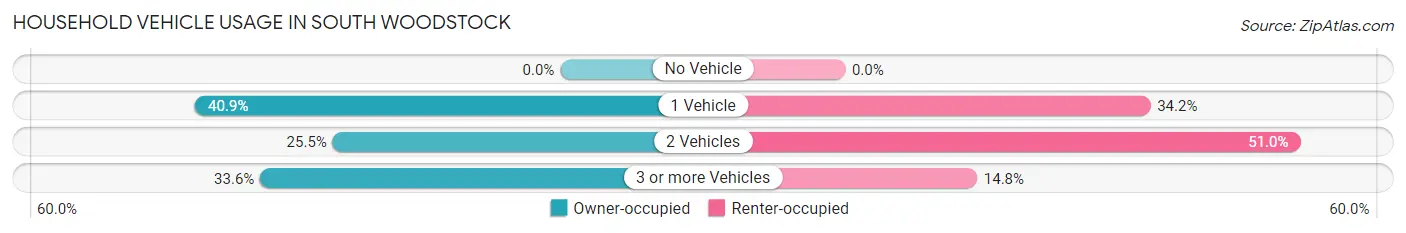
| Vehicles per Household | Owner-occupied | Renter-occupied |
| No Vehicle | 0 (0.0%) | 0 (0.0%) |
| 1 Vehicle | 146 (40.9%) | 118 (34.2%) |
| 2 Vehicles | 91 (25.5%) | 176 (51.0%) |
| 3 or more Vehicles | 120 (33.6%) | 51 (14.8%) |
| Total | 357 (100.0%) | 345 (100.0%) |
Real Estate & Mortgages in South Woodstock
Real Estate and Mortgage Overview in South Woodstock
| Characteristic | Without Mortgage | With Mortgage |
| Housing Units | 32 | 325 |
| Median Property Value | - | - |
| Median Household Income | - | - |
| Monthly Housing Costs | - | - |
| Real Estate Taxes | - | - |
Property Value by Mortgage Status in South Woodstock
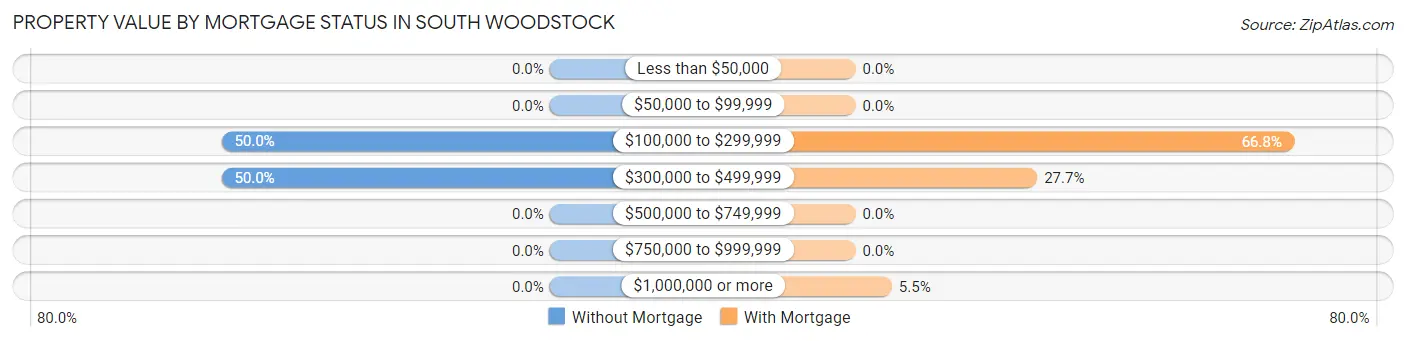
| Property Value | Without Mortgage | With Mortgage |
| Less than $50,000 | 0 (0.0%) | 0 (0.0%) |
| $50,000 to $99,999 | 0 (0.0%) | 0 (0.0%) |
| $100,000 to $299,999 | 16 (50.0%) | 217 (66.8%) |
| $300,000 to $499,999 | 16 (50.0%) | 90 (27.7%) |
| $500,000 to $749,999 | 0 (0.0%) | 0 (0.0%) |
| $750,000 to $999,999 | 0 (0.0%) | 0 (0.0%) |
| $1,000,000 or more | 0 (0.0%) | 18 (5.5%) |
| Total | 32 (100.0%) | 325 (100.0%) |
Household Income by Mortgage Status in South Woodstock
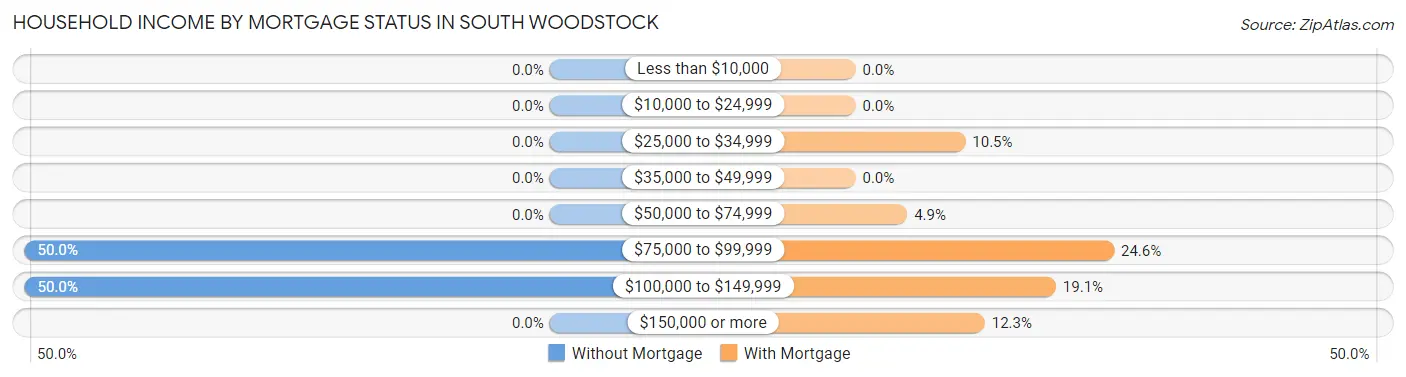
| Household Income | Without Mortgage | With Mortgage |
| Less than $10,000 | 0 (0.0%) | 0 (0.0%) |
| $10,000 to $24,999 | 0 (0.0%) | 0 (0.0%) |
| $25,000 to $34,999 | 0 (0.0%) | 34 (10.5%) |
| $35,000 to $49,999 | 0 (0.0%) | 0 (0.0%) |
| $50,000 to $74,999 | 0 (0.0%) | 16 (4.9%) |
| $75,000 to $99,999 | 16 (50.0%) | 80 (24.6%) |
| $100,000 to $149,999 | 16 (50.0%) | 62 (19.1%) |
| $150,000 or more | 0 (0.0%) | 40 (12.3%) |
| Total | 32 (100.0%) | 325 (100.0%) |
Property Value to Household Income Ratio in South Woodstock
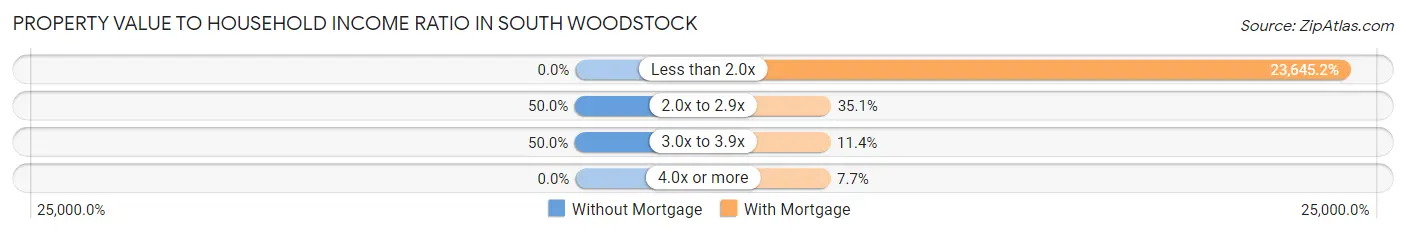
| Value-to-Income Ratio | Without Mortgage | With Mortgage |
| Less than 2.0x | 0 (0.0%) | 76,847 (23,645.2%) |
| 2.0x to 2.9x | 16 (50.0%) | 114 (35.1%) |
| 3.0x to 3.9x | 16 (50.0%) | 37 (11.4%) |
| 4.0x or more | 0 (0.0%) | 25 (7.7%) |
| Total | 32 (100.0%) | 325 (100.0%) |
Real Estate Taxes by Mortgage Status in South Woodstock
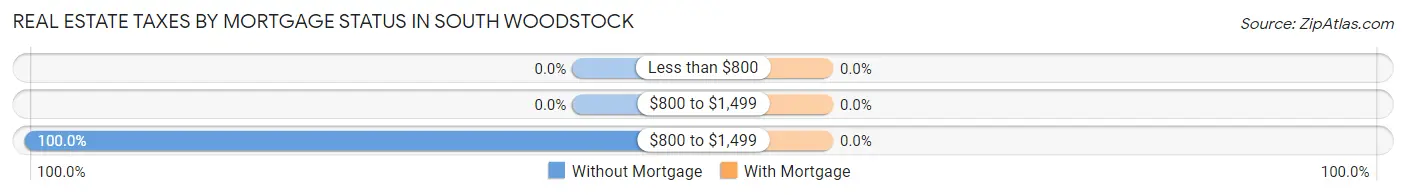
| Property Taxes | Without Mortgage | With Mortgage |
| Less than $800 | 0 (0.0%) | 0 (0.0%) |
| $800 to $1,499 | 0 (0.0%) | 0 (0.0%) |
| $800 to $1,499 | 32 (100.0%) | 0 (0.0%) |
| Total | 32 (100.0%) | 325 (100.0%) |
Health & Disability in South Woodstock
Health Insurance Coverage by Age in South Woodstock
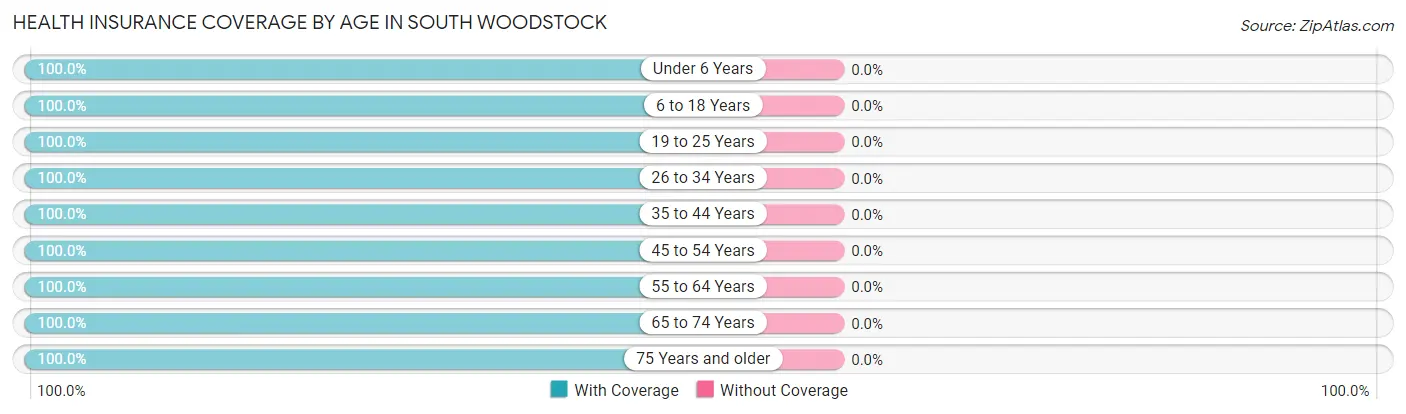
| Age Bracket | With Coverage | Without Coverage |
| Under 6 Years | 111 (100.0%) | 0 (0.0%) |
| 6 to 18 Years | 186 (100.0%) | 0 (0.0%) |
| 19 to 25 Years | 224 (100.0%) | 0 (0.0%) |
| 26 to 34 Years | 220 (100.0%) | 0 (0.0%) |
| 35 to 44 Years | 98 (100.0%) | 0 (0.0%) |
| 45 to 54 Years | 177 (100.0%) | 0 (0.0%) |
| 55 to 64 Years | 253 (100.0%) | 0 (0.0%) |
| 65 to 74 Years | 101 (100.0%) | 0 (0.0%) |
| 75 Years and older | 48 (100.0%) | 0 (0.0%) |
| Total | 1,418 (100.0%) | 0 (0.0%) |
Health Insurance Coverage by Citizenship Status in South Woodstock
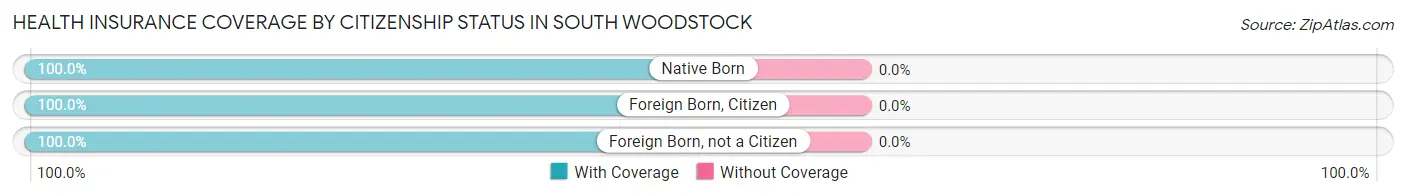
| Citizenship Status | With Coverage | Without Coverage |
| Native Born | 111 (100.0%) | 0 (0.0%) |
| Foreign Born, Citizen | 186 (100.0%) | 0 (0.0%) |
| Foreign Born, not a Citizen | 224 (100.0%) | 0 (0.0%) |
Health Insurance Coverage by Household Income in South Woodstock
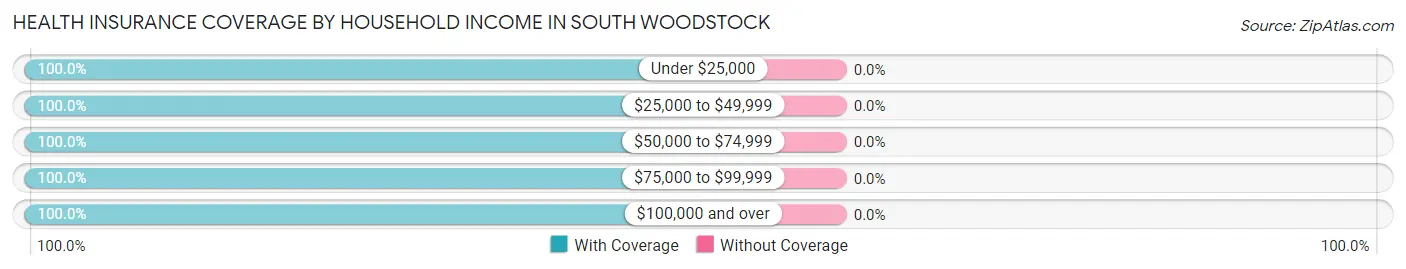
| Household Income | With Coverage | Without Coverage |
| Under $25,000 | 34 (100.0%) | 0 (0.0%) |
| $25,000 to $49,999 | 207 (100.0%) | 0 (0.0%) |
| $50,000 to $74,999 | 250 (100.0%) | 0 (0.0%) |
| $75,000 to $99,999 | 211 (100.0%) | 0 (0.0%) |
| $100,000 and over | 706 (100.0%) | 0 (0.0%) |
Public vs Private Health Insurance Coverage by Age in South Woodstock
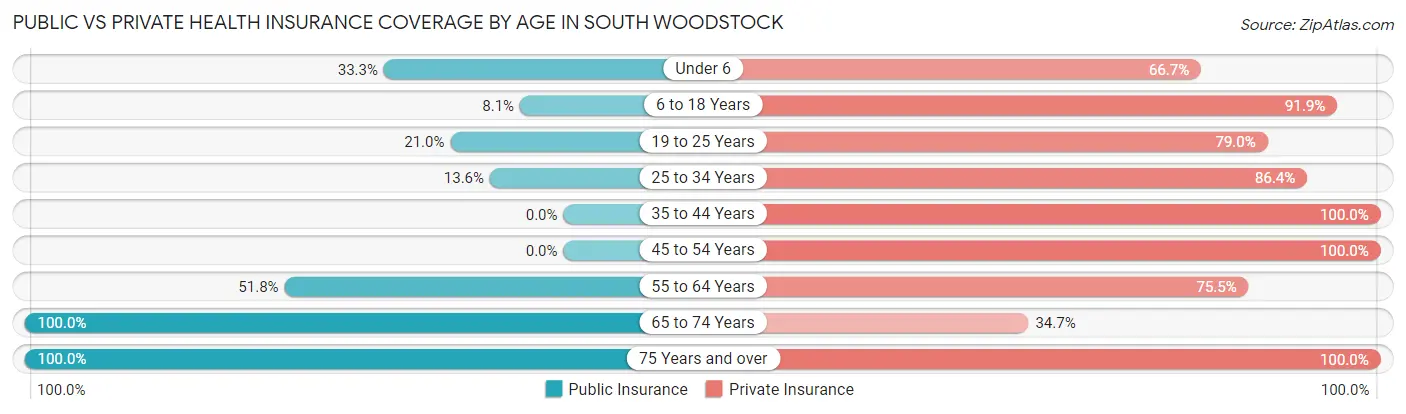
| Age Bracket | Public Insurance | Private Insurance |
| Under 6 | 37 (33.3%) | 74 (66.7%) |
| 6 to 18 Years | 15 (8.1%) | 171 (91.9%) |
| 19 to 25 Years | 47 (21.0%) | 177 (79.0%) |
| 25 to 34 Years | 30 (13.6%) | 190 (86.4%) |
| 35 to 44 Years | 0 (0.0%) | 98 (100.0%) |
| 45 to 54 Years | 0 (0.0%) | 177 (100.0%) |
| 55 to 64 Years | 131 (51.8%) | 191 (75.5%) |
| 65 to 74 Years | 101 (100.0%) | 35 (34.6%) |
| 75 Years and over | 48 (100.0%) | 48 (100.0%) |
| Total | 409 (28.8%) | 1,161 (81.9%) |
Disability Status by Sex by Age in South Woodstock
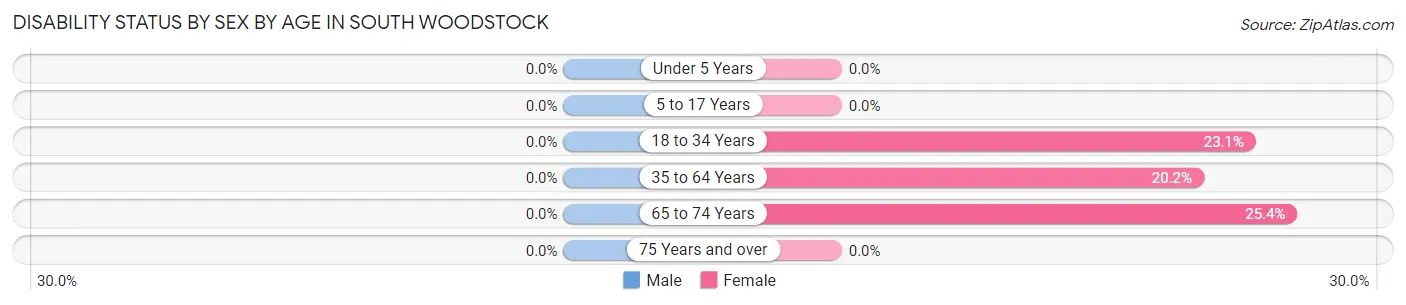
| Age Bracket | Male | Female |
| Under 5 Years | 0 (0.0%) | 0 (0.0%) |
| 5 to 17 Years | 0 (0.0%) | 0 (0.0%) |
| 18 to 34 Years | 0 (0.0%) | 56 (23.1%) |
| 35 to 64 Years | 0 (0.0%) | 51 (20.2%) |
| 65 to 74 Years | 0 (0.0%) | 17 (25.4%) |
| 75 Years and over | 0 (0.0%) | 0 (0.0%) |
Disability Class by Sex by Age in South Woodstock
Disability Class: Hearing Difficulty
| Age Bracket | Male | Female |
| Under 5 Years | 0 (0.0%) | 0 (0.0%) |
| 5 to 17 Years | 0 (0.0%) | 0 (0.0%) |
| 18 to 34 Years | 0 (0.0%) | 0 (0.0%) |
| 35 to 64 Years | 0 (0.0%) | 0 (0.0%) |
| 65 to 74 Years | 0 (0.0%) | 0 (0.0%) |
| 75 Years and over | 0 (0.0%) | 0 (0.0%) |
Disability Class: Vision Difficulty
| Age Bracket | Male | Female |
| Under 5 Years | 0 (0.0%) | 0 (0.0%) |
| 5 to 17 Years | 0 (0.0%) | 0 (0.0%) |
| 18 to 34 Years | 0 (0.0%) | 0 (0.0%) |
| 35 to 64 Years | 0 (0.0%) | 0 (0.0%) |
| 65 to 74 Years | 0 (0.0%) | 0 (0.0%) |
| 75 Years and over | 0 (0.0%) | 0 (0.0%) |
Disability Class: Cognitive Difficulty
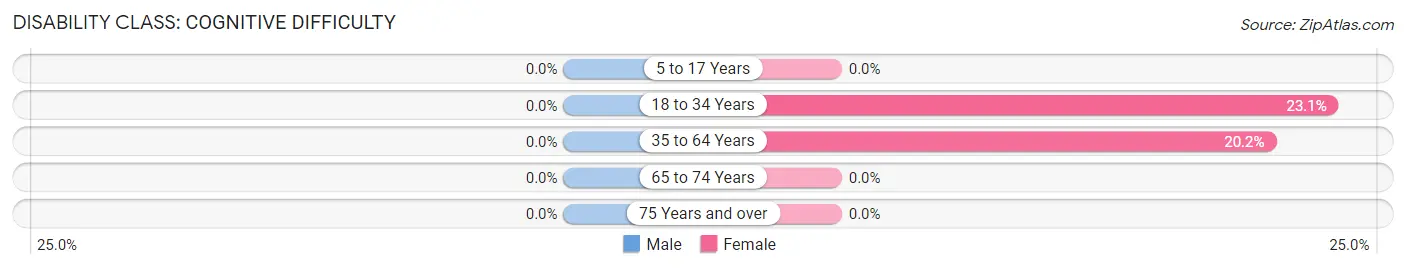
| Age Bracket | Male | Female |
| 5 to 17 Years | 0 (0.0%) | 0 (0.0%) |
| 18 to 34 Years | 0 (0.0%) | 56 (23.1%) |
| 35 to 64 Years | 0 (0.0%) | 51 (20.2%) |
| 65 to 74 Years | 0 (0.0%) | 0 (0.0%) |
| 75 Years and over | 0 (0.0%) | 0 (0.0%) |
Disability Class: Ambulatory Difficulty
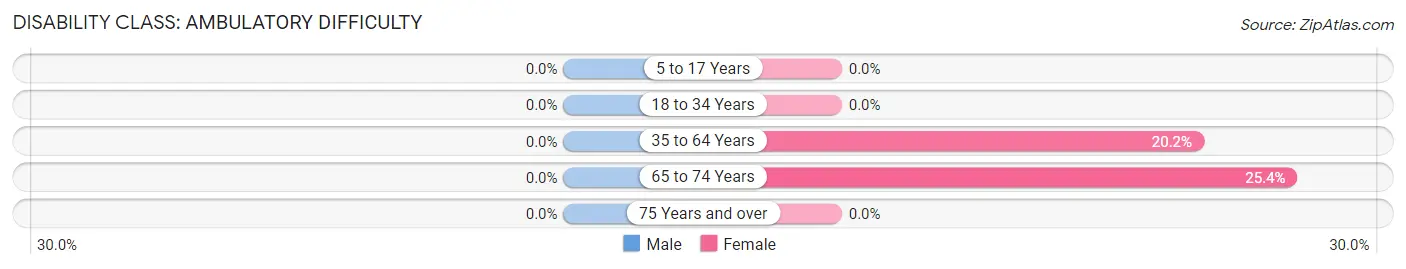
| Age Bracket | Male | Female |
| 5 to 17 Years | 0 (0.0%) | 0 (0.0%) |
| 18 to 34 Years | 0 (0.0%) | 0 (0.0%) |
| 35 to 64 Years | 0 (0.0%) | 51 (20.2%) |
| 65 to 74 Years | 0 (0.0%) | 17 (25.4%) |
| 75 Years and over | 0 (0.0%) | 0 (0.0%) |
Disability Class: Self-Care Difficulty
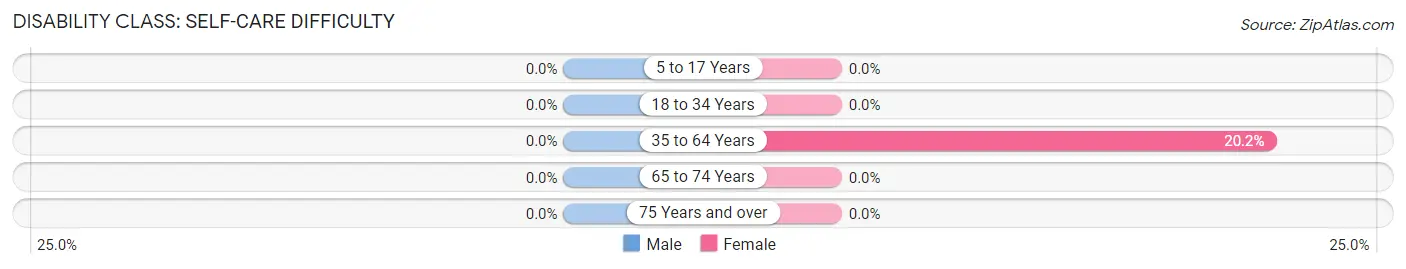
| Age Bracket | Male | Female |
| 5 to 17 Years | 0 (0.0%) | 0 (0.0%) |
| 18 to 34 Years | 0 (0.0%) | 0 (0.0%) |
| 35 to 64 Years | 0 (0.0%) | 51 (20.2%) |
| 65 to 74 Years | 0 (0.0%) | 0 (0.0%) |
| 75 Years and over | 0 (0.0%) | 0 (0.0%) |
Technology Access in South Woodstock
Computing Device Access in South Woodstock
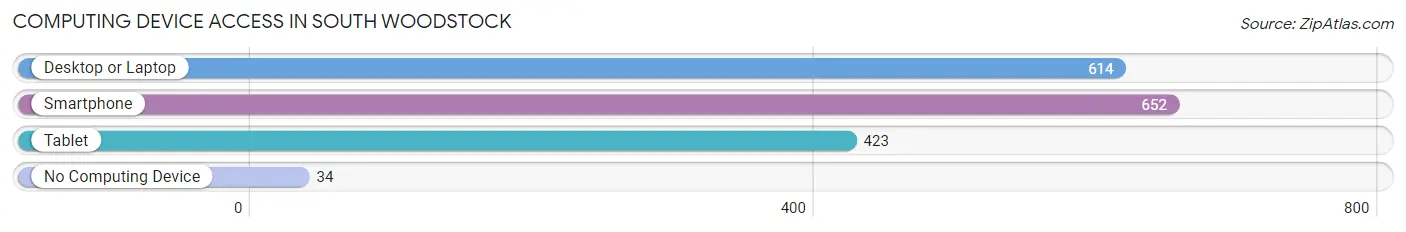
| Device Type | # Households | % Households |
| Desktop or Laptop | 614 | 87.5% |
| Smartphone | 652 | 92.9% |
| Tablet | 423 | 60.3% |
| No Computing Device | 34 | 4.8% |
| Total | 702 | 100.0% |
Internet Access in South Woodstock
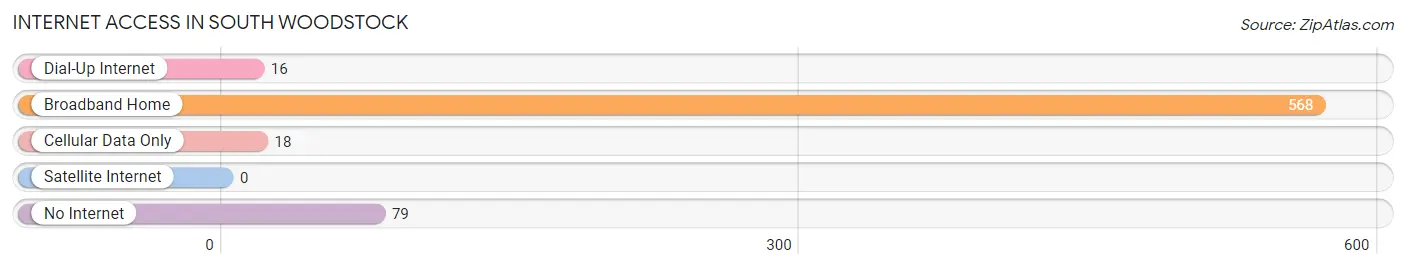
| Internet Type | # Households | % Households |
| Dial-Up Internet | 16 | 2.3% |
| Broadband Home | 568 | 80.9% |
| Cellular Data Only | 18 | 2.6% |
| Satellite Internet | 0 | 0.0% |
| No Internet | 79 | 11.3% |
| Total | 702 | 100.0% |
South Woodstock Summary
Woodstock, Connecticut is a small town located in the northeastern part of the state. It is part of the Windham County and is bordered by the towns of Pomfret, Eastford, and Union. The town was incorporated in 1761 and has a population of approximately 3,000 people.
Geography
Woodstock is located in the northeastern part of Connecticut, in Windham County. It is bordered by the towns of Pomfret, Eastford, and Union. The town is situated in the foothills of the Berkshires and is surrounded by rolling hills and forests. The town is located on the Quinebaug River, which is a tributary of the Thames River. The town is also home to several small lakes, including Lake Bunggee, Lake Siog, and Lake Siog.
The town has a total area of 33.2 square miles, of which 32.9 square miles is land and 0.3 square miles is water. The town is located at an elevation of 830 feet above sea level.
History
Woodstock was first settled in 1761 by settlers from Massachusetts. The town was named after Woodstock, England, which was the birthplace of the first settler, John Wood. The town was incorporated in 1761 and was originally part of the town of Pomfret.
The town was an agricultural community for many years, with the main crops being corn, potatoes, and hay. The town also had several mills, including a sawmill, gristmill, and a woolen mill.
In the late 19th century, the town began to develop as a summer resort area. Several large hotels were built, including the Woodstock Inn and the Woodstock Hotel. The town also became a popular destination for artists and writers, including Mark Twain and William Dean Howells.
Economy
The economy of Woodstock is largely based on tourism and agriculture. The town is home to several small businesses, including restaurants, shops, and galleries. The town is also home to several farms, which produce a variety of crops, including corn, potatoes, hay, and apples.
The town is also home to several manufacturing companies, including a paper mill, a plastics factory, and a machine shop. The town is also home to several small technology companies, including a software development company and a web design firm.
Demographics
As of the 2010 census, the population of Woodstock was 3,048. The racial makeup of the town was 95.3% White, 0.7% African American, 0.3% Native American, 0.7% Asian, 0.1% Pacific Islander, 1.2% from other races, and 1.9% from two or more races. Hispanic or Latino of any race were 3.2% of the population.
The median household income in Woodstock was $63,750, and the median family income was $76,250. The per capita income for the town was $30,945. About 5.2% of families and 7.2% of the population were below the poverty line, including 8.3% of those under age 18 and 5.2% of those age 65 or over.
Conclusion
Woodstock, Connecticut is a small town located in the northeastern part of the state. It is part of the Windham County and is bordered by the towns of Pomfret, Eastford, and Union. The town was incorporated in 1761 and has a population of approximately 3,000 people. The town is largely based on tourism and agriculture, with several small businesses, farms, and manufacturing companies. The population of Woodstock is largely white, with a small percentage of African American, Native American, Asian, and Pacific Islander residents. The median household income in Woodstock is $63,750, and the median family income is $76,250.
Common Questions
What is Per Capita Income in South Woodstock?
Per Capita income in South Woodstock is $41,187.
What is the Median Family Income in South Woodstock?
Median Family Income in South Woodstock is $109,353.
What is the Median Household income in South Woodstock?
Median Household Income in South Woodstock is $75,763.
What is Inequality or Gini Index in South Woodstock?
Inequality or Gini Index in South Woodstock is 0.35.
What is the Total Population of South Woodstock?
Total Population of South Woodstock is 1,418.
What is the Total Male Population of South Woodstock?
Total Male Population of South Woodstock is 728.
What is the Total Female Population of South Woodstock?
Total Female Population of South Woodstock is 690.
What is the Ratio of Males per 100 Females in South Woodstock?
There are 105.51 Males per 100 Females in South Woodstock.
What is the Ratio of Females per 100 Males in South Woodstock?
There are 94.78 Females per 100 Males in South Woodstock.
What is the Median Population Age in South Woodstock?
Median Population Age in South Woodstock is 31.8 Years.
What is the Average Family Size in South Woodstock
Average Family Size in South Woodstock is 3.2 People.
What is the Average Household Size in South Woodstock
Average Household Size in South Woodstock is 2.0 People.
How Large is the Labor Force in South Woodstock?
There are 1,054 People in the Labor Forcein in South Woodstock.
What is the Percentage of People in the Labor Force in South Woodstock?
81.3% of People are in the Labor Force in South Woodstock.
What is the Unemployment Rate in South Woodstock?
Unemployment Rate in South Woodstock is 7.2%.