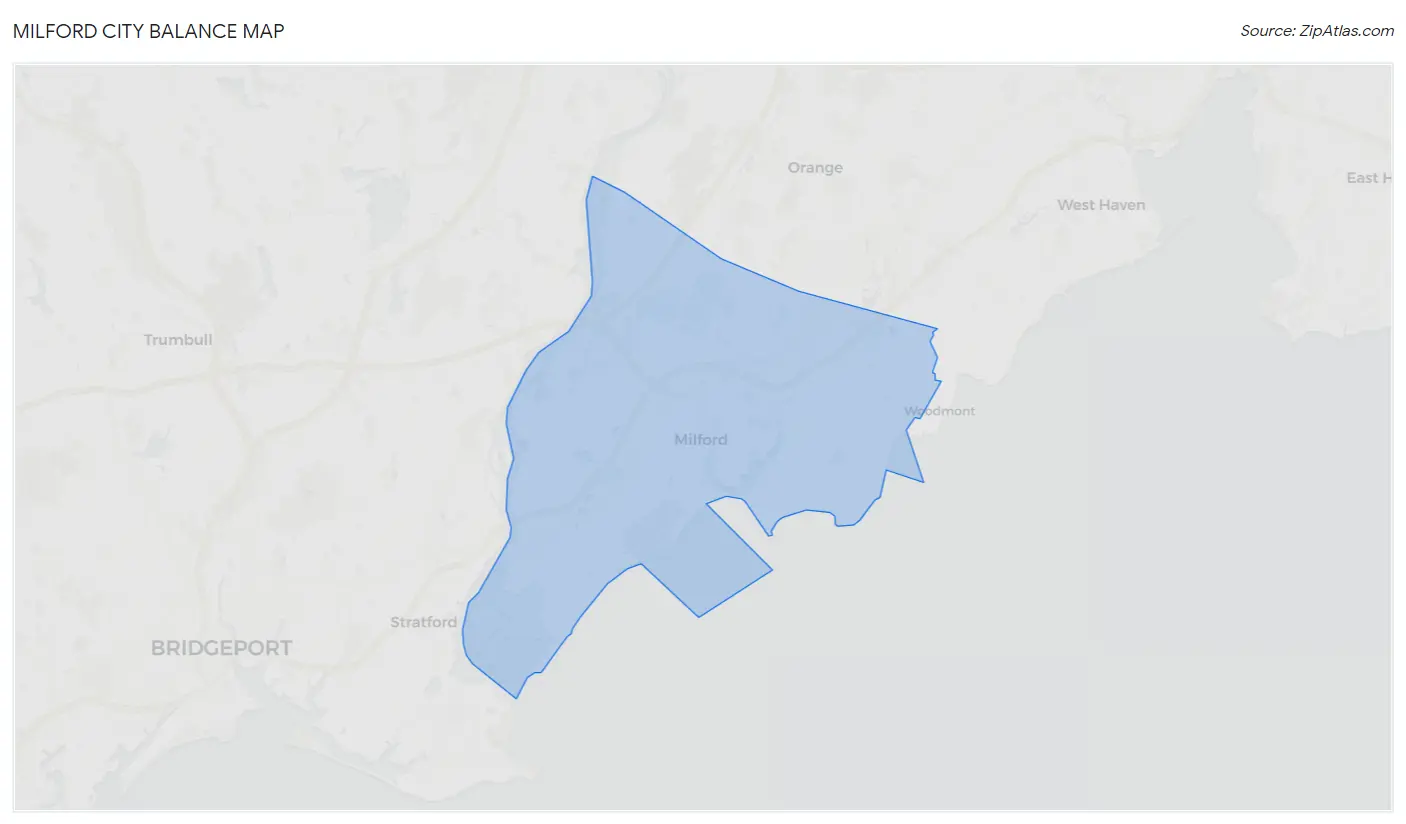
Milford city balance, CT Map & Demographics
Milford city balance Map
Milford city balance Overview
$59,735
PER CAPITA INCOME
$134,721
AVG FAMILY INCOME
$104,503
AVG HOUSEHOLD INCOME
20.3%
WAGE / INCOME GAP [ % ]
79.7¢/ $1
WAGE / INCOME GAP [ $ ]
$10,689
FAMILY INCOME DEFICIT
0.45
INEQUALITY / GINI INDEX
50,664
TOTAL POPULATION
24,502
MALE POPULATION
26,162
FEMALE POPULATION
93.65
MALES / 100 FEMALES
106.77
FEMALES / 100 MALES
46.6
MEDIAN AGE
3.0
AVG FAMILY SIZE
2.4
AVG HOUSEHOLD SIZE
29,331
LABOR FORCE [ PEOPLE ]
67.4%
PERCENT IN LABOR FORCE
4.3%
UNEMPLOYMENT RATE
Income in Milford city balance
Income Overview in Milford city balance
Per Capita Income in Milford city balance is $59,735, while median incomes of families and households are $134,721 and $104,503 respectively.
| Characteristic | Number | Measure |
| Per Capita Income | 50,664 | $59,735 |
| Median Family Income | 13,297 | $134,721 |
| Mean Family Income | 13,297 | $169,668 |
| Median Household Income | 21,152 | $104,503 |
| Mean Household Income | 21,152 | $140,411 |
| Income Deficit | 13,297 | $10,689 |
| Wage / Income Gap (%) | 50,664 | 20.32% |
| Wage / Income Gap ($) | 50,664 | 79.68¢ per $1 |
| Gini / Inequality Index | 50,664 | 0.45 |
Earnings by Sex in Milford city balance
Average Earnings in Milford city balance are $63,976, $71,982 for men and $57,356 for women, a difference of 20.3%.
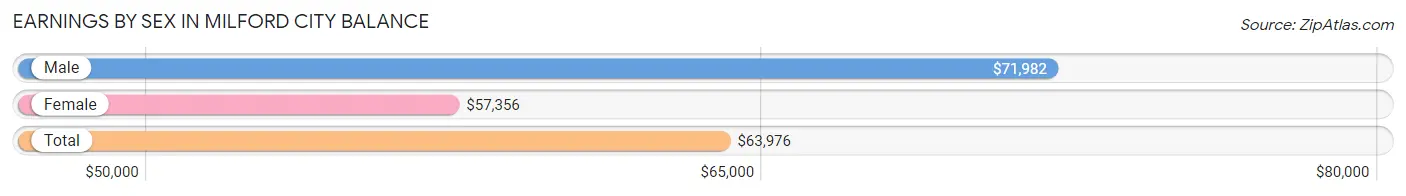
| Sex | Number | Average Earnings |
| Male | 15,053 (50.1%) | $71,982 |
| Female | 14,988 (49.9%) | $57,356 |
| Total | 30,041 (100.0%) | $63,976 |
Earnings by Sex by Income Bracket in Milford city balance
The most common earnings brackets in Milford city balance are $100,000+ for men (5,115 | 34.0%) and $100,000+ for women (2,972 | 19.8%).
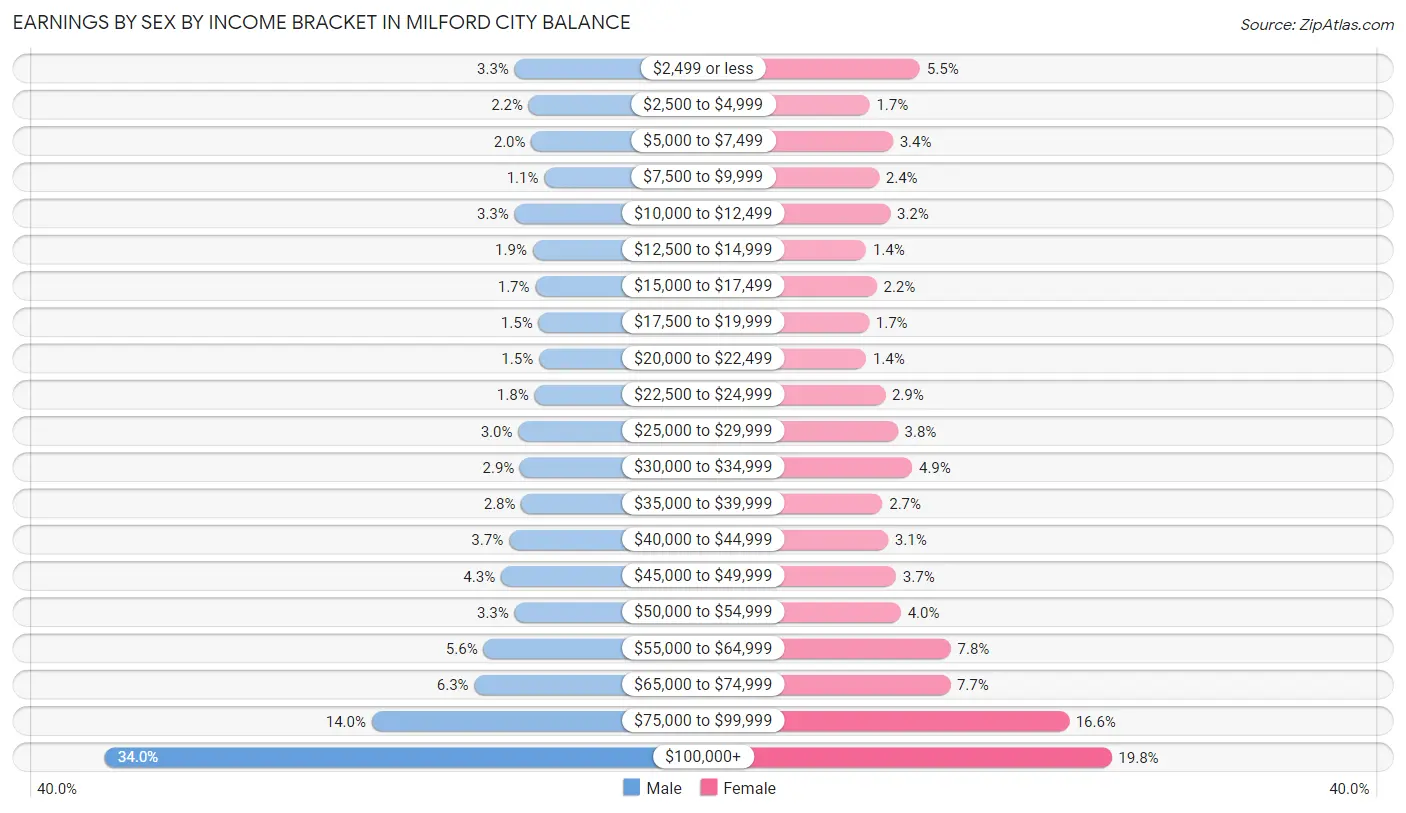
| Income | Male | Female |
| $2,499 or less | 492 (3.3%) | 821 (5.5%) |
| $2,500 to $4,999 | 333 (2.2%) | 255 (1.7%) |
| $5,000 to $7,499 | 304 (2.0%) | 515 (3.4%) |
| $7,500 to $9,999 | 158 (1.1%) | 360 (2.4%) |
| $10,000 to $12,499 | 494 (3.3%) | 485 (3.2%) |
| $12,500 to $14,999 | 289 (1.9%) | 216 (1.4%) |
| $15,000 to $17,499 | 259 (1.7%) | 334 (2.2%) |
| $17,500 to $19,999 | 224 (1.5%) | 248 (1.7%) |
| $20,000 to $22,499 | 219 (1.5%) | 216 (1.4%) |
| $22,500 to $24,999 | 270 (1.8%) | 428 (2.9%) |
| $25,000 to $29,999 | 452 (3.0%) | 571 (3.8%) |
| $30,000 to $34,999 | 431 (2.9%) | 733 (4.9%) |
| $35,000 to $39,999 | 417 (2.8%) | 398 (2.7%) |
| $40,000 to $44,999 | 557 (3.7%) | 461 (3.1%) |
| $45,000 to $49,999 | 648 (4.3%) | 552 (3.7%) |
| $50,000 to $54,999 | 494 (3.3%) | 606 (4.0%) |
| $55,000 to $64,999 | 845 (5.6%) | 1,166 (7.8%) |
| $65,000 to $74,999 | 947 (6.3%) | 1,159 (7.7%) |
| $75,000 to $99,999 | 2,105 (14.0%) | 2,492 (16.6%) |
| $100,000+ | 5,115 (34.0%) | 2,972 (19.8%) |
| Total | 15,053 (100.0%) | 14,988 (100.0%) |
Earnings by Sex by Educational Attainment in Milford city balance
Average earnings in Milford city balance are $79,802 for men and $64,032 for women, a difference of 19.8%. Men with an educational attainment of graduate degree enjoy the highest average annual earnings of $124,313, while those with less than high school education earn the least with $49,018. Women with an educational attainment of graduate degree earn the most with the average annual earnings of $83,093, while those with less than high school education have the smallest earnings of $16,515.
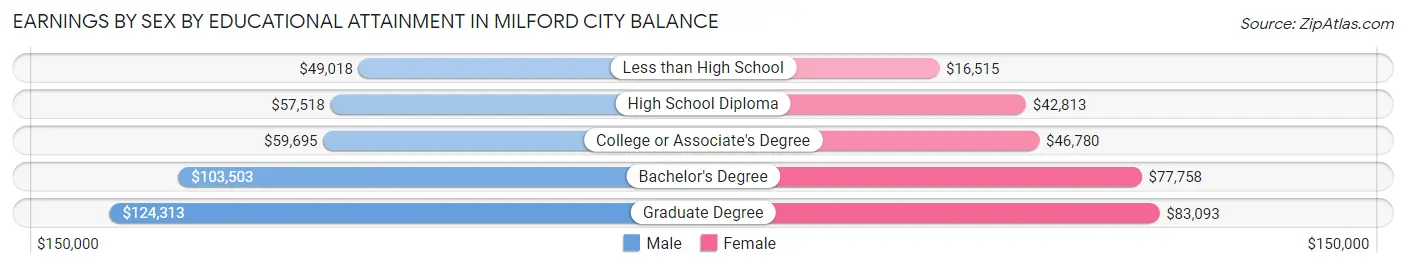
| Educational Attainment | Male Income | Female Income |
| Less than High School | $49,018 | $16,515 |
| High School Diploma | $57,518 | $42,813 |
| College or Associate's Degree | $59,695 | $46,780 |
| Bachelor's Degree | $103,503 | $77,758 |
| Graduate Degree | $124,313 | $83,093 |
| Total | $79,802 | $64,032 |
Family Income in Milford city balance
Family Income Brackets in Milford city balance
According to the Milford city balance family income data, there are 3,550 families falling into the $200,000+ income range, which is the most common income bracket and makes up 26.7% of all families. Conversely, the $10,000 to $14,999 income bracket is the least frequent group with only 106 families (0.8%) belonging to this category.
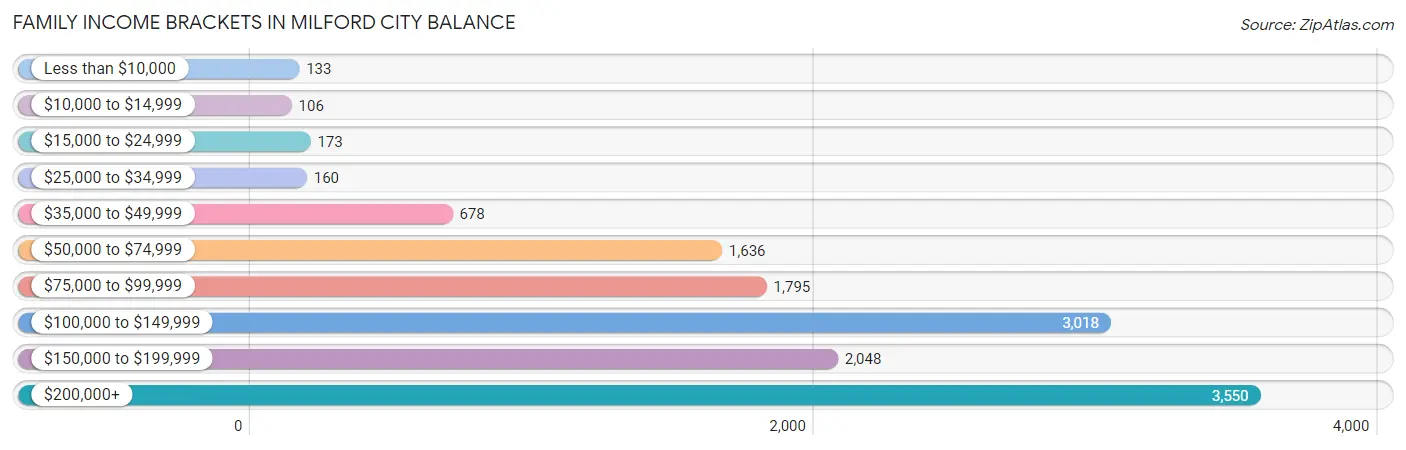
| Income Bracket | # Families | % Families |
| Less than $10,000 | 133 | 1.0% |
| $10,000 to $14,999 | 106 | 0.8% |
| $15,000 to $24,999 | 173 | 1.3% |
| $25,000 to $34,999 | 160 | 1.2% |
| $35,000 to $49,999 | 678 | 5.1% |
| $50,000 to $74,999 | 1,636 | 12.3% |
| $75,000 to $99,999 | 1,795 | 13.5% |
| $100,000 to $149,999 | 3,018 | 22.7% |
| $150,000 to $199,999 | 2,048 | 15.4% |
| $200,000+ | 3,550 | 26.7% |
Family Income by Famaliy Size in Milford city balance
6-person families (301 | 2.3%) account for the highest median family income in Milford city balance with $250,001 per family, while 2-person families (6,437 | 48.4%) have the highest median income of $54,496 per family member.
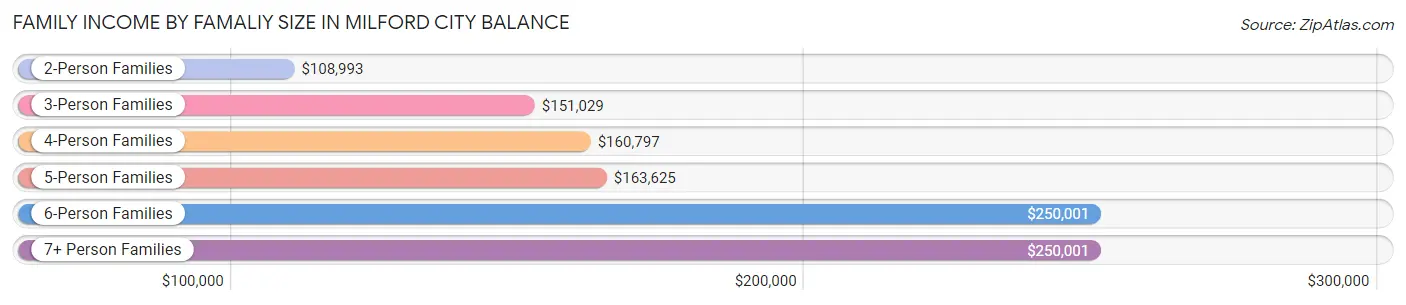
| Income Bracket | # Families | Median Income |
| 2-Person Families | 6,437 (48.4%) | $108,993 |
| 3-Person Families | 3,318 (24.9%) | $151,029 |
| 4-Person Families | 2,399 (18.0%) | $160,797 |
| 5-Person Families | 777 (5.8%) | $163,625 |
| 6-Person Families | 301 (2.3%) | $250,001 |
| 7+ Person Families | 65 (0.5%) | $250,001 |
| Total | 13,297 (100.0%) | $134,721 |
Family Income by Number of Earners in Milford city balance
The median family income in Milford city balance is $134,721, with families comprising 3+ earners (1,881) having the highest median family income of $207,598, while families with no earners (1,611) have the lowest median family income of $72,703, accounting for 14.1% and 12.1% of families, respectively.
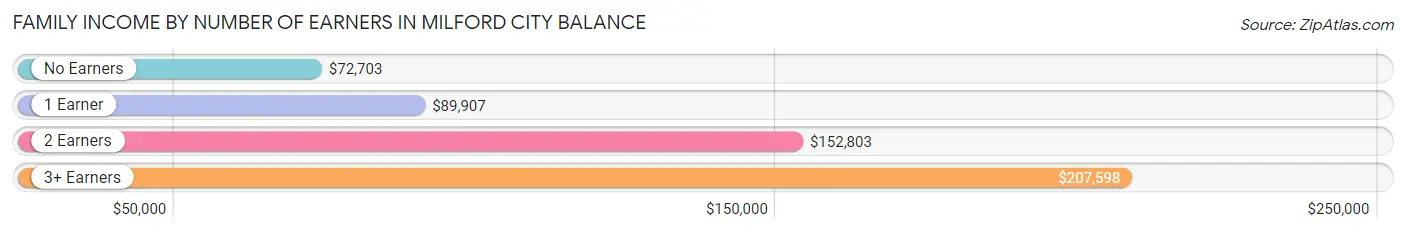
| Number of Earners | # Families | Median Income |
| No Earners | 1,611 (12.1%) | $72,703 |
| 1 Earner | 3,379 (25.4%) | $89,907 |
| 2 Earners | 6,426 (48.3%) | $152,803 |
| 3+ Earners | 1,881 (14.1%) | $207,598 |
| Total | 13,297 (100.0%) | $134,721 |
Household Income in Milford city balance
Household Income Brackets in Milford city balance
With 4,273 households falling in the category, the $100,000 to $149,999 income range is the most frequent in Milford city balance, accounting for 20.2% of all households. In contrast, only 486 households (2.3%) fall into the $10,000 to $14,999 income bracket, making it the least populous group.
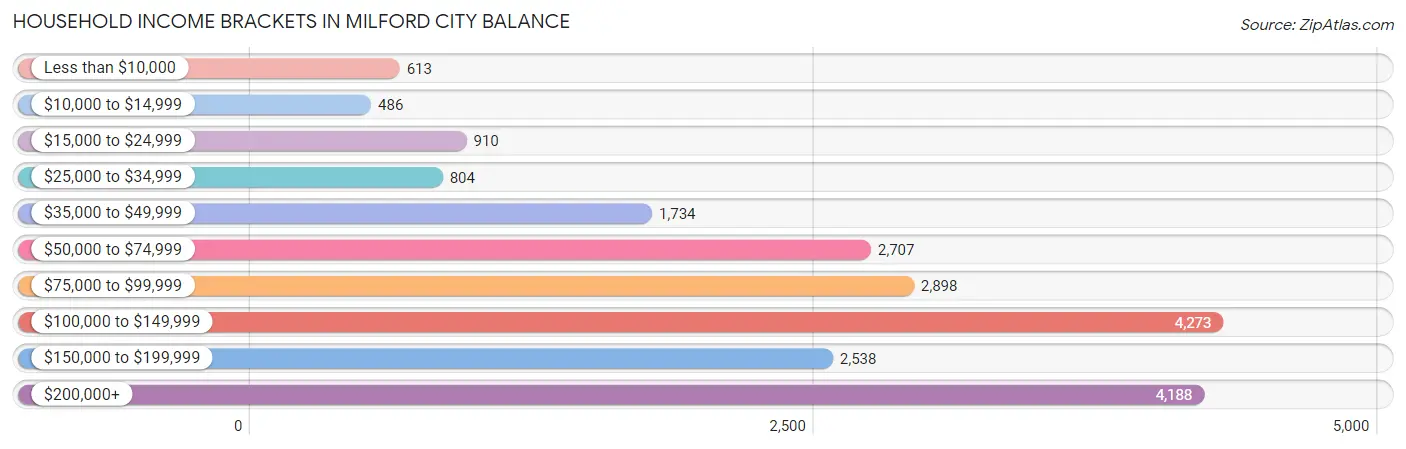
| Income Bracket | # Households | % Households |
| Less than $10,000 | 613 | 2.9% |
| $10,000 to $14,999 | 486 | 2.3% |
| $15,000 to $24,999 | 910 | 4.3% |
| $25,000 to $34,999 | 804 | 3.8% |
| $35,000 to $49,999 | 1,734 | 8.2% |
| $50,000 to $74,999 | 2,707 | 12.8% |
| $75,000 to $99,999 | 2,898 | 13.7% |
| $100,000 to $149,999 | 4,273 | 20.2% |
| $150,000 to $199,999 | 2,538 | 12.0% |
| $200,000+ | 4,188 | 19.8% |
Household Income by Householder Age in Milford city balance
The median household income in Milford city balance is $104,503, with the highest median household income of $128,512 found in the 25 to 44 years age bracket for the primary householder. A total of 5,725 households (27.1%) fall into this category. Meanwhile, the 65+ years age bracket for the primary householder has the lowest median household income of $68,705, with 6,390 households (30.2%) in this group.
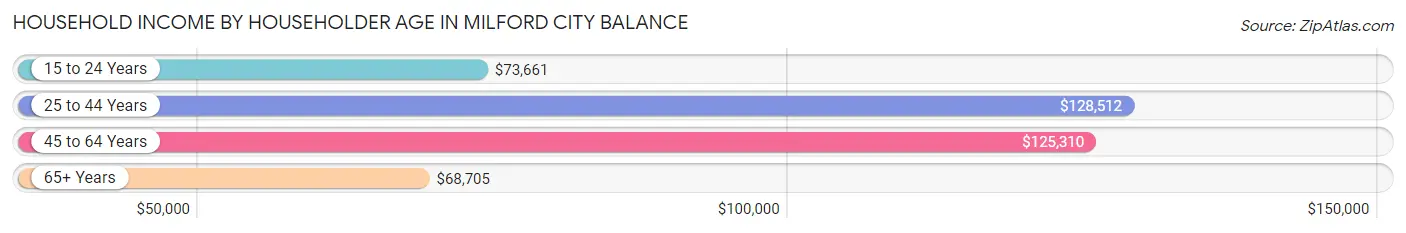
| Income Bracket | # Households | Median Income |
| 15 to 24 Years | 131 (0.6%) | $73,661 |
| 25 to 44 Years | 5,725 (27.1%) | $128,512 |
| 45 to 64 Years | 8,906 (42.1%) | $125,310 |
| 65+ Years | 6,390 (30.2%) | $68,705 |
| Total | 21,152 (100.0%) | $104,503 |
Poverty in Milford city balance
Income Below Poverty by Sex and Age in Milford city balance
With 3.8% poverty level for males and 5.1% for females among the residents of Milford city balance, 55 to 64 year old males and 12 to 14 year old females are the most vulnerable to poverty, with 300 males (7.0%) and 64 females (10.3%) in their respective age groups living below the poverty level.
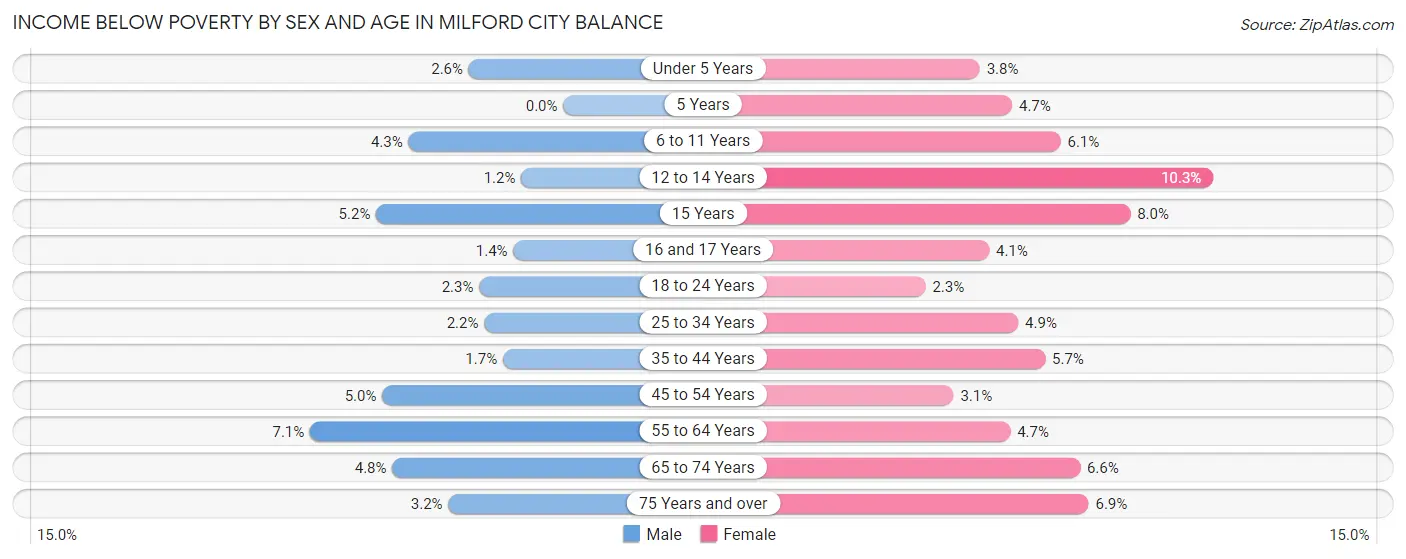
| Age Bracket | Male | Female |
| Under 5 Years | 32 (2.6%) | 37 (3.8%) |
| 5 Years | 0 (0.0%) | 9 (4.7%) |
| 6 to 11 Years | 53 (4.3%) | 73 (6.1%) |
| 12 to 14 Years | 9 (1.2%) | 64 (10.3%) |
| 15 Years | 15 (5.2%) | 22 (8.0%) |
| 16 and 17 Years | 13 (1.4%) | 25 (4.1%) |
| 18 to 24 Years | 40 (2.3%) | 43 (2.3%) |
| 25 to 34 Years | 66 (2.2%) | 167 (4.9%) |
| 35 to 44 Years | 49 (1.7%) | 167 (5.7%) |
| 45 to 54 Years | 170 (5.0%) | 114 (3.1%) |
| 55 to 64 Years | 300 (7.0%) | 205 (4.7%) |
| 65 to 74 Years | 135 (4.8%) | 244 (6.6%) |
| 75 Years and over | 46 (3.2%) | 149 (6.9%) |
| Total | 928 (3.8%) | 1,319 (5.1%) |
Income Above Poverty by Sex and Age in Milford city balance
According to the poverty statistics in Milford city balance, males aged 5 years and females aged 18 to 24 years are the age groups that are most secure financially, with 100.0% of males and 97.7% of females in these age groups living above the poverty line.
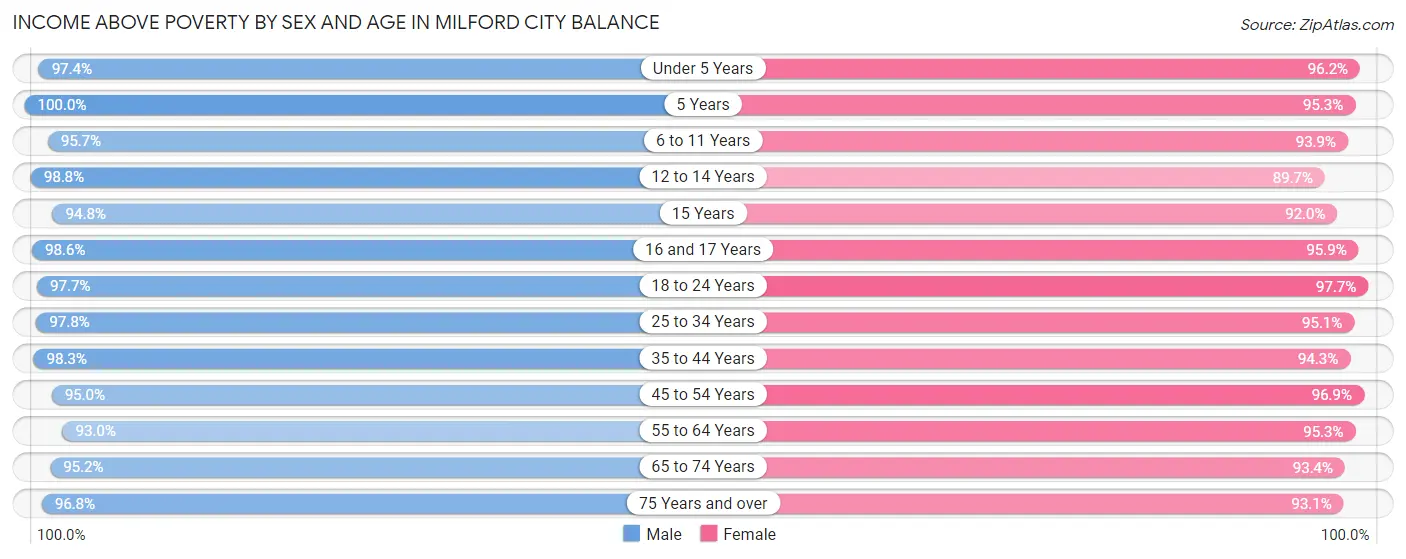
| Age Bracket | Male | Female |
| Under 5 Years | 1,183 (97.4%) | 926 (96.2%) |
| 5 Years | 336 (100.0%) | 181 (95.3%) |
| 6 to 11 Years | 1,178 (95.7%) | 1,126 (93.9%) |
| 12 to 14 Years | 761 (98.8%) | 555 (89.7%) |
| 15 Years | 273 (94.8%) | 252 (92.0%) |
| 16 and 17 Years | 923 (98.6%) | 585 (95.9%) |
| 18 to 24 Years | 1,672 (97.7%) | 1,801 (97.7%) |
| 25 to 34 Years | 2,933 (97.8%) | 3,232 (95.1%) |
| 35 to 44 Years | 2,864 (98.3%) | 2,783 (94.3%) |
| 45 to 54 Years | 3,206 (95.0%) | 3,554 (96.9%) |
| 55 to 64 Years | 3,958 (92.9%) | 4,163 (95.3%) |
| 65 to 74 Years | 2,702 (95.2%) | 3,436 (93.4%) |
| 75 Years and over | 1,392 (96.8%) | 2,019 (93.1%) |
| Total | 23,381 (96.2%) | 24,613 (94.9%) |
Income Below Poverty Among Married-Couple Families in Milford city balance
The poverty statistics for married-couple families in Milford city balance show that 2.0% or 214 of the total 10,817 families live below the poverty line. Families with 3 or 4 children have the highest poverty rate of 7.1%, comprising of 31 families. On the other hand, families with 5 or more children have the lowest poverty rate of 0.0%, which includes 0 families.
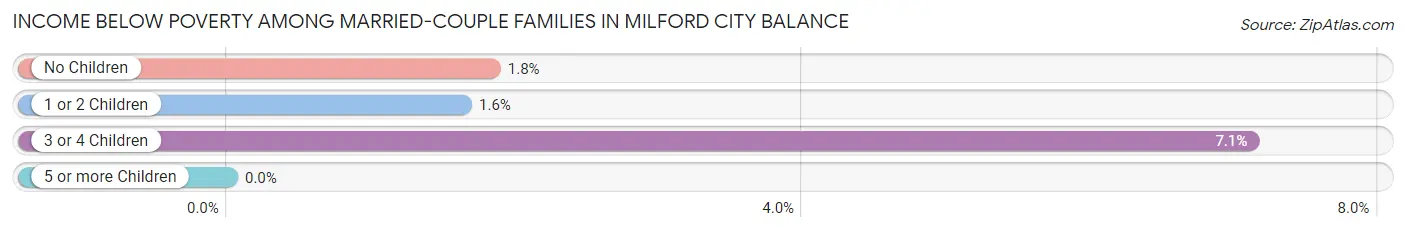
| Children | Above Poverty | Below Poverty |
| No Children | 6,990 (98.2%) | 130 (1.8%) |
| 1 or 2 Children | 3,198 (98.4%) | 53 (1.6%) |
| 3 or 4 Children | 405 (92.9%) | 31 (7.1%) |
| 5 or more Children | 10 (100.0%) | 0 (0.0%) |
| Total | 10,603 (98.0%) | 214 (2.0%) |
Income Below Poverty Among Single-Parent Households in Milford city balance
According to the poverty data in Milford city balance, 4.7% or 28 single-father households and 4.2% or 80 single-mother households are living below the poverty line. Among single-father households, those with no children have the highest poverty rate, with 20 households (5.2%) experiencing poverty. Likewise, among single-mother households, those with 1 or 2 children have the highest poverty rate, with 60 households (9.6%) falling below the poverty line.
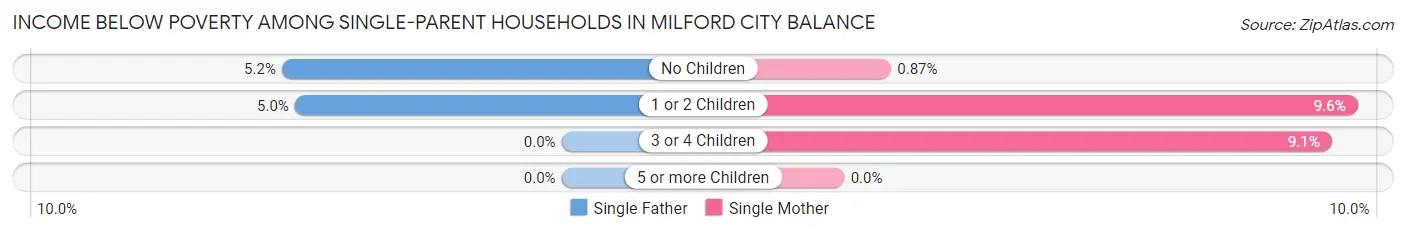
| Children | Single Father | Single Mother |
| No Children | 20 (5.2%) | 10 (0.9%) |
| 1 or 2 Children | 8 (5.0%) | 60 (9.6%) |
| 3 or 4 Children | 0 (0.0%) | 10 (9.1%) |
| 5 or more Children | 0 (0.0%) | 0 (0.0%) |
| Total | 28 (4.7%) | 80 (4.2%) |
Income Below Poverty Among Married-Couple vs Single-Parent Households in Milford city balance
The poverty data for Milford city balance shows that 214 of the married-couple family households (2.0%) and 108 of the single-parent households (4.3%) are living below the poverty level. Within the married-couple family households, those with 3 or 4 children have the highest poverty rate, with 31 households (7.1%) falling below the poverty line. Among the single-parent households, those with 1 or 2 children have the highest poverty rate, with 68 household (8.6%) living below poverty.
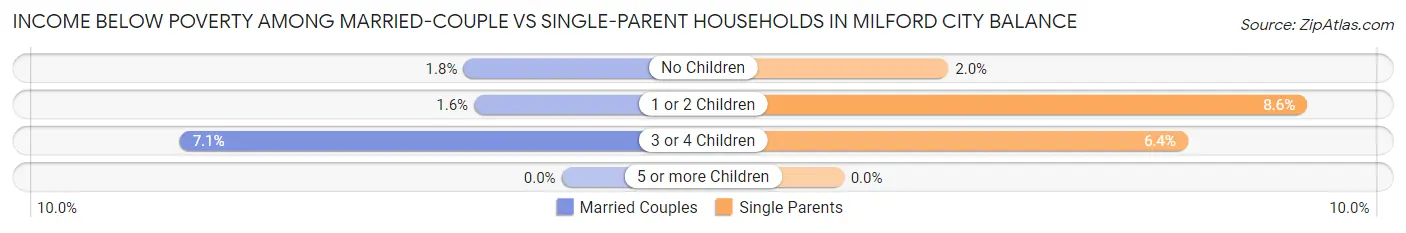
| Children | Married-Couple Families | Single-Parent Households |
| No Children | 130 (1.8%) | 30 (1.9%) |
| 1 or 2 Children | 53 (1.6%) | 68 (8.6%) |
| 3 or 4 Children | 31 (7.1%) | 10 (6.4%) |
| 5 or more Children | 0 (0.0%) | 0 (0.0%) |
| Total | 214 (2.0%) | 108 (4.3%) |
Race in Milford city balance
The most populous races in Milford city balance are White / Caucasian (43,386 | 85.6%), Hispanic or Latino (3,899 | 7.7%), and Two or more Races (2,817 | 5.6%).
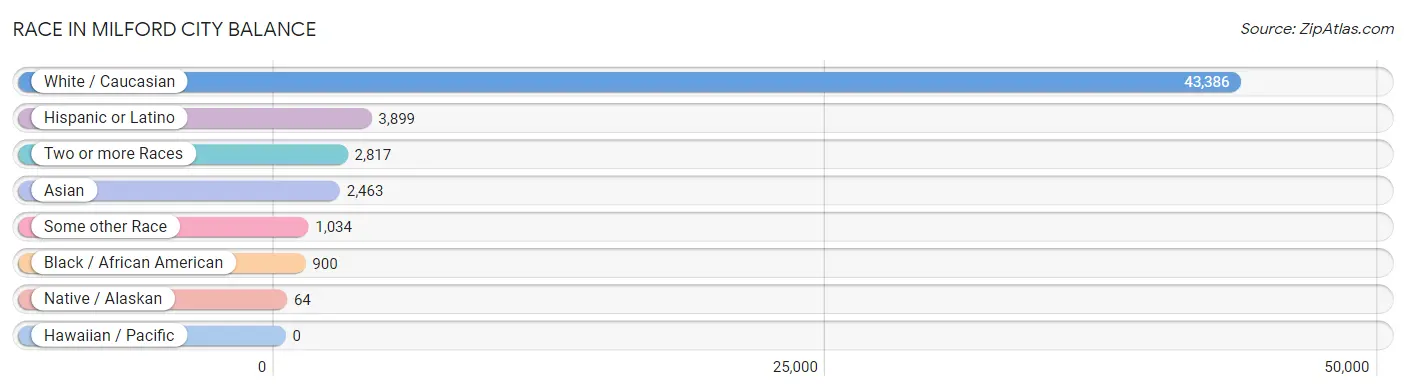
| Race | # Population | % Population |
| Asian | 2,463 | 4.9% |
| Black / African American | 900 | 1.8% |
| Hawaiian / Pacific | 0 | 0.0% |
| Hispanic or Latino | 3,899 | 7.7% |
| Native / Alaskan | 64 | 0.1% |
| White / Caucasian | 43,386 | 85.6% |
| Two or more Races | 2,817 | 5.6% |
| Some other Race | 1,034 | 2.0% |
| Total | 50,664 | 100.0% |
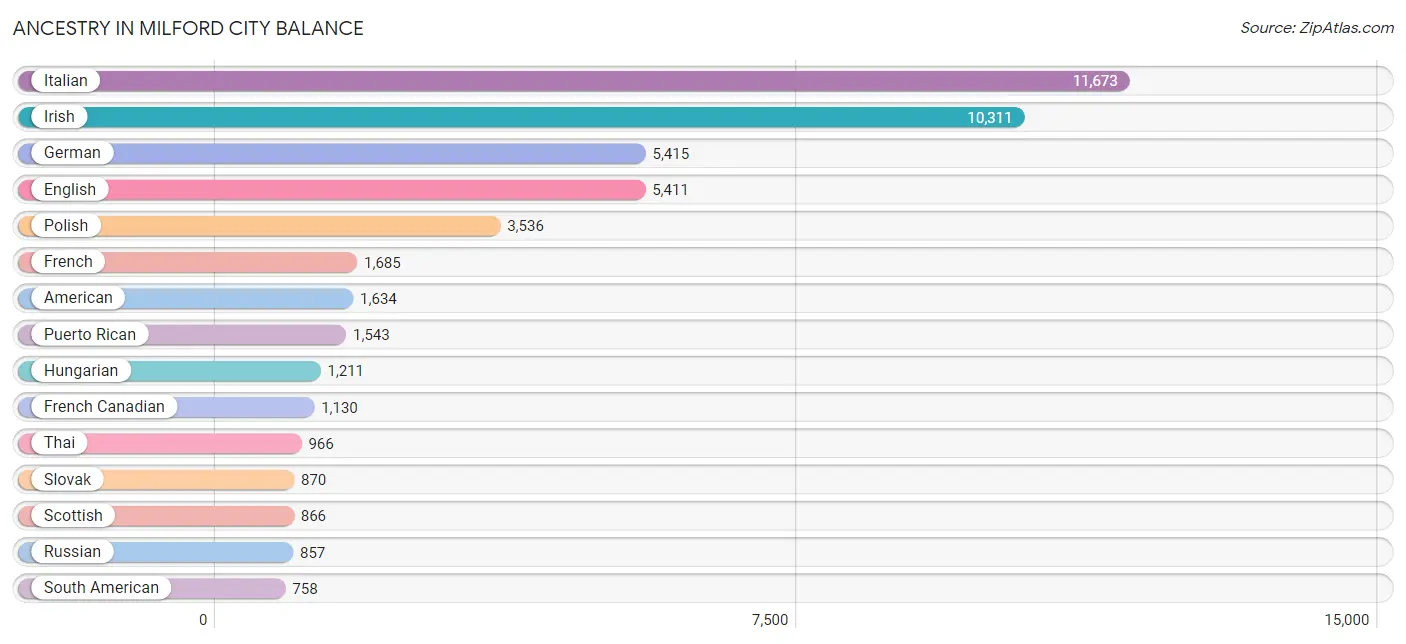
Ancestry in Milford city balance
The most populous ancestries reported in Milford city balance are Italian (11,673 | 23.0%), Irish (10,311 | 20.3%), German (5,415 | 10.7%), English (5,411 | 10.7%), and Polish (3,536 | 7.0%), together accounting for 71.7% of all Milford city balance residents.
| Ancestry | # Population | % Population |
| African | 3 | 0.0% |
| Albanian | 226 | 0.4% |
| American | 1,634 | 3.2% |
| Arab | 326 | 0.6% |
| Argentinean | 1 | 0.0% |
| Armenian | 316 | 0.6% |
| Austrian | 165 | 0.3% |
| Barbadian | 24 | 0.1% |
| Basque | 9 | 0.0% |
| Belgian | 30 | 0.1% |
| Bhutanese | 103 | 0.2% |
| Blackfeet | 31 | 0.1% |
| Brazilian | 327 | 0.6% |
| British | 198 | 0.4% |
| Bulgarian | 23 | 0.1% |
| Burmese | 163 | 0.3% |
| Canadian | 153 | 0.3% |
| Cape Verdean | 111 | 0.2% |
| Central American | 313 | 0.6% |
| Central American Indian | 61 | 0.1% |
| Cherokee | 7 | 0.0% |
| Colombian | 370 | 0.7% |
| Costa Rican | 115 | 0.2% |
| Croatian | 183 | 0.4% |
| Cuban | 175 | 0.4% |
| Czech | 192 | 0.4% |
| Czechoslovakian | 60 | 0.1% |
| Danish | 89 | 0.2% |
| Dominican | 206 | 0.4% |
| Dutch | 239 | 0.5% |
| Eastern European | 464 | 0.9% |
| Ecuadorian | 261 | 0.5% |
| Egyptian | 19 | 0.0% |
| English | 5,411 | 10.7% |
| Ethiopian | 15 | 0.0% |
| European | 551 | 1.1% |
| Filipino | 27 | 0.1% |
| Finnish | 141 | 0.3% |
| French | 1,685 | 3.3% |
| French Canadian | 1,130 | 2.2% |
| German | 5,415 | 10.7% |
| Ghanaian | 10 | 0.0% |
| Greek | 738 | 1.5% |
| Guamanian / Chamorro | 18 | 0.0% |
| Guatemalan | 10 | 0.0% |
| Haitian | 58 | 0.1% |
| Honduran | 30 | 0.1% |
| Hungarian | 1,211 | 2.4% |
| Icelander | 30 | 0.1% |
| Indian (Asian) | 633 | 1.3% |
| Inupiat | 19 | 0.0% |
| Irish | 10,311 | 20.3% |
| Iroquois | 6 | 0.0% |
| Israeli | 12 | 0.0% |
| Italian | 11,673 | 23.0% |
| Jamaican | 55 | 0.1% |
| Japanese | 56 | 0.1% |
| Jordanian | 28 | 0.1% |
| Korean | 368 | 0.7% |
| Latvian | 44 | 0.1% |
| Lebanese | 156 | 0.3% |
| Lithuanian | 201 | 0.4% |
| Malaysian | 22 | 0.0% |
| Mexican | 549 | 1.1% |
| Mexican American Indian | 14 | 0.0% |
| Mongolian | 12 | 0.0% |
| Moroccan | 35 | 0.1% |
| Native Hawaiian | 19 | 0.0% |
| Nicaraguan | 35 | 0.1% |
| Northern European | 81 | 0.2% |
| Norwegian | 328 | 0.6% |
| Pakistani | 65 | 0.1% |
| Palestinian | 40 | 0.1% |
| Panamanian | 85 | 0.2% |
| Paraguayan | 10 | 0.0% |
| Pennsylvania German | 33 | 0.1% |
| Peruvian | 63 | 0.1% |
| Polish | 3,536 | 7.0% |
| Portuguese | 492 | 1.0% |
| Puerto Rican | 1,543 | 3.0% |
| Romanian | 180 | 0.4% |
| Russian | 857 | 1.7% |
| Salvadoran | 38 | 0.1% |
| Scandinavian | 59 | 0.1% |
| Scotch-Irish | 252 | 0.5% |
| Scottish | 866 | 1.7% |
| Serbian | 38 | 0.1% |
| Slovak | 870 | 1.7% |
| Slovene | 37 | 0.1% |
| South American | 758 | 1.5% |
| South American Indian | 10 | 0.0% |
| Spaniard | 137 | 0.3% |
| Spanish | 151 | 0.3% |
| Spanish American | 36 | 0.1% |
| Spanish American Indian | 15 | 0.0% |
| Sri Lankan | 194 | 0.4% |
| Subsaharan African | 153 | 0.3% |
| Swedish | 687 | 1.4% |
| Swiss | 81 | 0.2% |
| Syrian | 7 | 0.0% |
| Thai | 966 | 1.9% |
| Trinidadian and Tobagonian | 8 | 0.0% |
| Turkish | 261 | 0.5% |
| Ukrainian | 332 | 0.7% |
| Venezuelan | 30 | 0.1% |
| Vietnamese | 97 | 0.2% |
| Welsh | 149 | 0.3% |
| West Indian | 13 | 0.0% | View All 108 Rows |
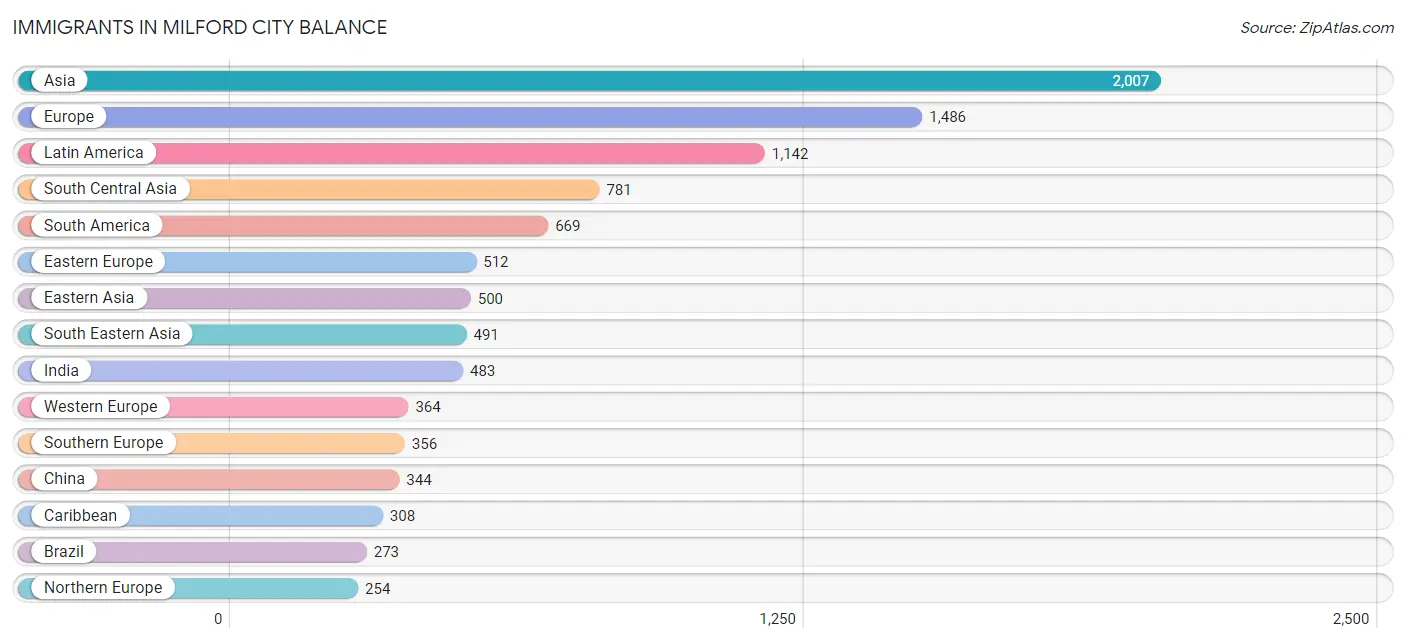
Immigrants in Milford city balance
The most numerous immigrant groups reported in Milford city balance came from Asia (2,007 | 4.0%), Europe (1,486 | 2.9%), Latin America (1,142 | 2.2%), South Central Asia (781 | 1.5%), and South America (669 | 1.3%), together accounting for 12.0% of all Milford city balance residents.
| Immigration Origin | # Population | % Population |
| Afghanistan | 42 | 0.1% |
| Africa | 127 | 0.3% |
| Albania | 36 | 0.1% |
| Argentina | 16 | 0.0% |
| Asia | 2,007 | 4.0% |
| Austria | 12 | 0.0% |
| Bangladesh | 153 | 0.3% |
| Belgium | 25 | 0.1% |
| Brazil | 273 | 0.5% |
| Bulgaria | 23 | 0.1% |
| Cabo Verde | 18 | 0.0% |
| Cambodia | 71 | 0.1% |
| Canada | 161 | 0.3% |
| Caribbean | 308 | 0.6% |
| Central America | 165 | 0.3% |
| China | 344 | 0.7% |
| Colombia | 210 | 0.4% |
| Costa Rica | 85 | 0.2% |
| Croatia | 13 | 0.0% |
| Cuba | 61 | 0.1% |
| Dominica | 13 | 0.0% |
| Dominican Republic | 122 | 0.2% |
| Eastern Asia | 500 | 1.0% |
| Eastern Europe | 512 | 1.0% |
| Ecuador | 117 | 0.2% |
| Egypt | 19 | 0.0% |
| El Salvador | 18 | 0.0% |
| England | 88 | 0.2% |
| Europe | 1,486 | 2.9% |
| France | 253 | 0.5% |
| Germany | 74 | 0.2% |
| Ghana | 41 | 0.1% |
| Greece | 25 | 0.1% |
| Guatemala | 10 | 0.0% |
| Honduras | 15 | 0.0% |
| Hong Kong | 31 | 0.1% |
| Hungary | 14 | 0.0% |
| India | 483 | 0.9% |
| Italy | 243 | 0.5% |
| Jamaica | 12 | 0.0% |
| Japan | 52 | 0.1% |
| Jordan | 37 | 0.1% |
| Korea | 104 | 0.2% |
| Laos | 14 | 0.0% |
| Latin America | 1,142 | 2.2% |
| Lebanon | 43 | 0.1% |
| Malaysia | 20 | 0.0% |
| Mexico | 18 | 0.0% |
| Moldova | 54 | 0.1% |
| Morocco | 8 | 0.0% |
| Nicaragua | 11 | 0.0% |
| Northern Africa | 43 | 0.1% |
| Northern Europe | 254 | 0.5% |
| Pakistan | 47 | 0.1% |
| Panama | 8 | 0.0% |
| Peru | 47 | 0.1% |
| Philippines | 215 | 0.4% |
| Poland | 144 | 0.3% |
| Portugal | 88 | 0.2% |
| Romania | 32 | 0.1% |
| Russia | 66 | 0.1% |
| Saudi Arabia | 30 | 0.1% |
| Scotland | 31 | 0.1% |
| Serbia | 8 | 0.0% |
| South Africa | 12 | 0.0% |
| South America | 669 | 1.3% |
| South Central Asia | 781 | 1.5% |
| South Eastern Asia | 491 | 1.0% |
| Southern Europe | 356 | 0.7% |
| Sri Lanka | 56 | 0.1% |
| Sweden | 43 | 0.1% |
| Taiwan | 28 | 0.1% |
| Thailand | 58 | 0.1% |
| Trinidad and Tobago | 8 | 0.0% |
| Turkey | 111 | 0.2% |
| Ukraine | 77 | 0.2% |
| Venezuela | 6 | 0.0% |
| Vietnam | 113 | 0.2% |
| West Indies | 92 | 0.2% |
| Western Africa | 59 | 0.1% |
| Western Asia | 235 | 0.5% |
| Western Europe | 364 | 0.7% | View All 82 Rows |
Sex and Age in Milford city balance
Sex and Age in Milford city balance
The most populous age groups in Milford city balance are 55 to 59 Years (2,310 | 9.4%) for men and 55 to 59 Years (2,294 | 8.8%) for women.
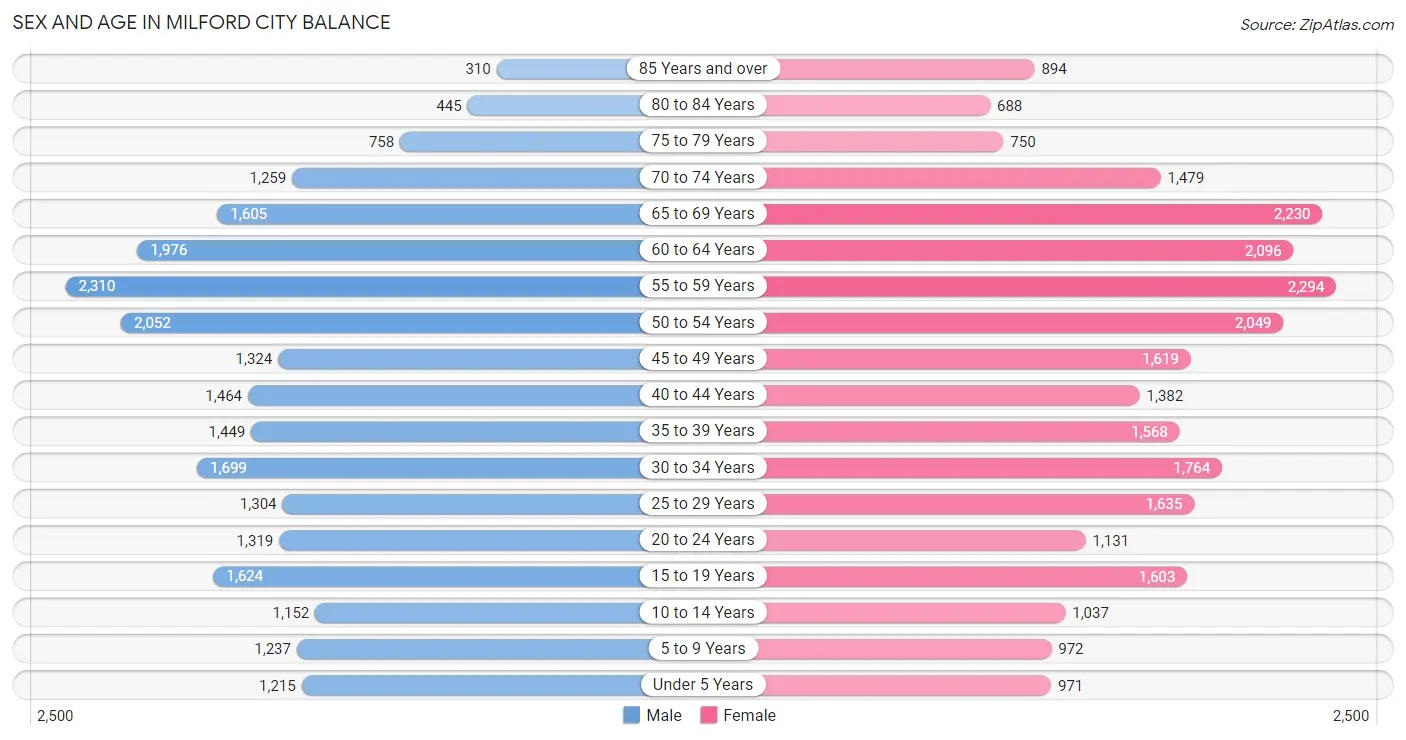
| Age Bracket | Male | Female |
| Under 5 Years | 1,215 (5.0%) | 971 (3.7%) |
| 5 to 9 Years | 1,237 (5.1%) | 972 (3.7%) |
| 10 to 14 Years | 1,152 (4.7%) | 1,037 (4.0%) |
| 15 to 19 Years | 1,624 (6.6%) | 1,603 (6.1%) |
| 20 to 24 Years | 1,319 (5.4%) | 1,131 (4.3%) |
| 25 to 29 Years | 1,304 (5.3%) | 1,635 (6.2%) |
| 30 to 34 Years | 1,699 (6.9%) | 1,764 (6.7%) |
| 35 to 39 Years | 1,449 (5.9%) | 1,568 (6.0%) |
| 40 to 44 Years | 1,464 (6.0%) | 1,382 (5.3%) |
| 45 to 49 Years | 1,324 (5.4%) | 1,619 (6.2%) |
| 50 to 54 Years | 2,052 (8.4%) | 2,049 (7.8%) |
| 55 to 59 Years | 2,310 (9.4%) | 2,294 (8.8%) |
| 60 to 64 Years | 1,976 (8.1%) | 2,096 (8.0%) |
| 65 to 69 Years | 1,605 (6.6%) | 2,230 (8.5%) |
| 70 to 74 Years | 1,259 (5.1%) | 1,479 (5.7%) |
| 75 to 79 Years | 758 (3.1%) | 750 (2.9%) |
| 80 to 84 Years | 445 (1.8%) | 688 (2.6%) |
| 85 Years and over | 310 (1.3%) | 894 (3.4%) |
| Total | 24,502 (100.0%) | 26,162 (100.0%) |
Families and Households in Milford city balance
Median Family Size in Milford city balance
The median family size in Milford city balance is 3.03 persons per family, with married-couple families (10,817 | 81.4%) accounting for the largest median family size of 3.1 persons per family. On the other hand, single female/mother families (1,889 | 14.2%) represent the smallest median family size with 2.68 persons per family.
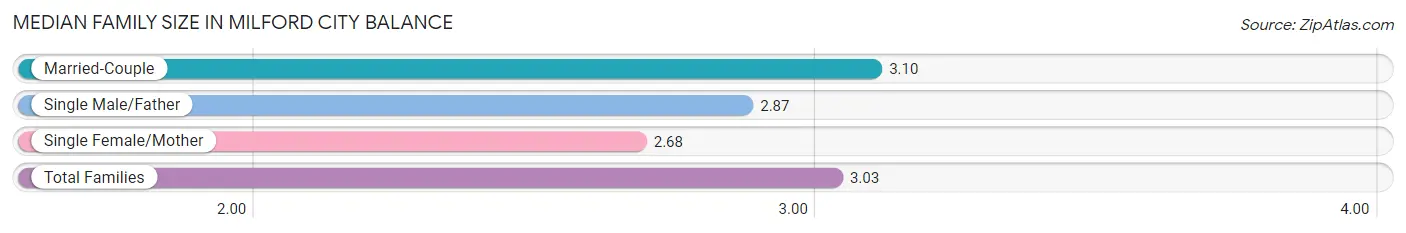
| Family Type | # Families | Family Size |
| Married-Couple | 10,817 (81.4%) | 3.10 |
| Single Male/Father | 591 (4.4%) | 2.87 |
| Single Female/Mother | 1,889 (14.2%) | 2.68 |
| Total Families | 13,297 (100.0%) | 3.03 |
Median Household Size in Milford city balance
The median household size in Milford city balance is 2.37 persons per household, with married-couple households (10,817 | 51.1%) accounting for the largest median household size of 3.11 persons per household. non-family households (7,855 | 37.1%) represent the smallest median household size with 1.19 persons per household.
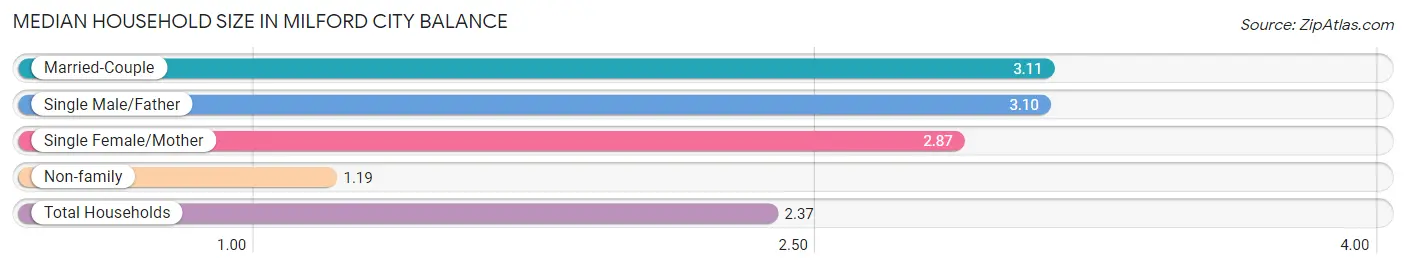
| Household Type | # Households | Household Size |
| Married-Couple | 10,817 (51.1%) | 3.11 |
| Single Male/Father | 591 (2.8%) | 3.10 |
| Single Female/Mother | 1,889 (8.9%) | 2.87 |
| Non-family | 7,855 (37.1%) | 1.19 |
| Total Households | 21,152 (100.0%) | 2.37 |
Household Size by Marriage Status in Milford city balance
Out of a total of 21,152 households in Milford city balance, 13,297 (62.9%) are family households, while 7,855 (37.1%) are nonfamily households. The most numerous type of family households are 2-person households, comprising 6,183, and the most common type of nonfamily households are 1-person households, comprising 6,594.
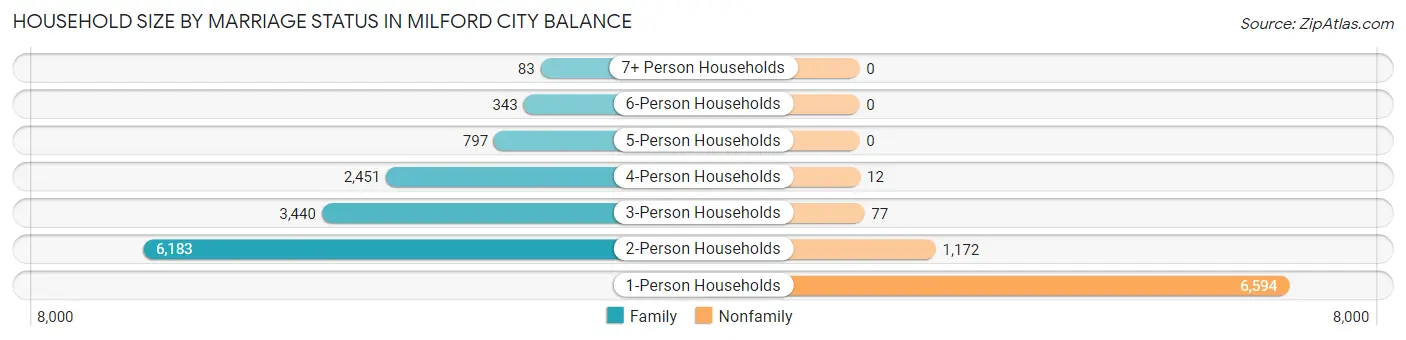
| Household Size | Family Households | Nonfamily Households |
| 1-Person Households | - | 6,594 (31.2%) |
| 2-Person Households | 6,183 (29.2%) | 1,172 (5.5%) |
| 3-Person Households | 3,440 (16.3%) | 77 (0.4%) |
| 4-Person Households | 2,451 (11.6%) | 12 (0.1%) |
| 5-Person Households | 797 (3.8%) | 0 (0.0%) |
| 6-Person Households | 343 (1.6%) | 0 (0.0%) |
| 7+ Person Households | 83 (0.4%) | 0 (0.0%) |
| Total | 13,297 (62.9%) | 7,855 (37.1%) |
Female Fertility in Milford city balance
Fertility by Age in Milford city balance
Average fertility rate in Milford city balance is 37.0 births per 1,000 women. Women in the age bracket of 20 to 34 years have the highest fertility rate with 60.0 births per 1,000 women. Women in the age bracket of 20 to 34 years acount for 65.6% of all women with births.
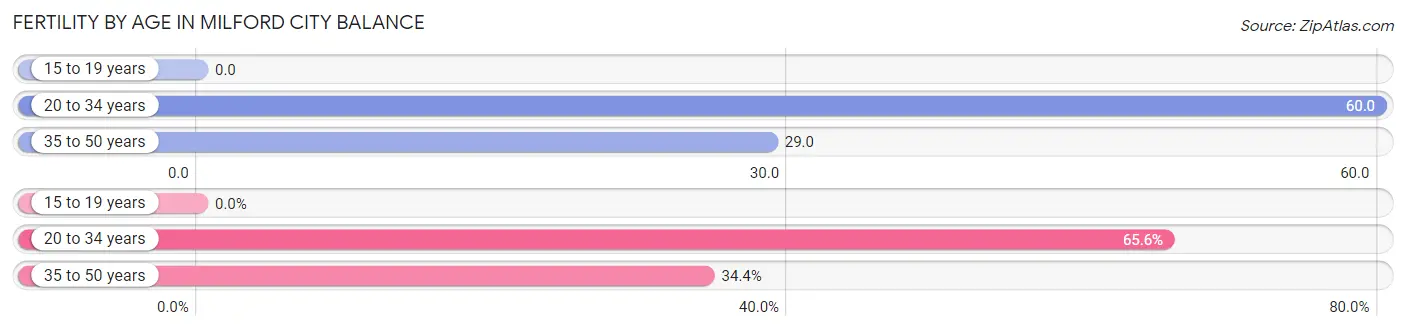
| Age Bracket | Women with Births | Births / 1,000 Women |
| 15 to 19 years | 0 (0.0%) | 0.0 |
| 20 to 34 years | 273 (65.6%) | 60.0 |
| 35 to 50 years | 143 (34.4%) | 29.0 |
| Total | 416 (100.0%) | 37.0 |
Fertility by Age by Marriage Status in Milford city balance
98.6% of women with births (416) in Milford city balance are married. The highest percentage of unmarried women with births falls into 20 to 34 years age bracket with 2.2% of them unmarried at the time of birth, while the lowest percentage of unmarried women with births belong to 35 to 50 years age bracket with 0.0% of them unmarried.
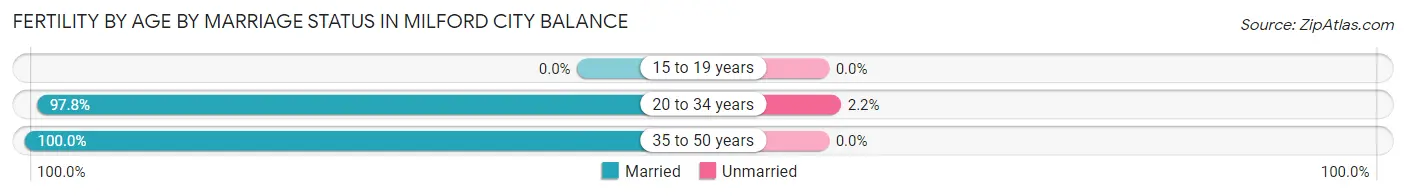
| Age Bracket | Married | Unmarried |
| 15 to 19 years | 0 (0.0%) | 0 (0.0%) |
| 20 to 34 years | 267 (97.8%) | 6 (2.2%) |
| 35 to 50 years | 143 (100.0%) | 0 (0.0%) |
| Total | 410 (98.6%) | 6 (1.4%) |
Fertility by Education in Milford city balance
Average fertility rate in Milford city balance is 37.0 births per 1,000 women. Women with the education attainment of graduate degree have the highest fertility rate of 91.0 births per 1,000 women, while women with the education attainment of less than high school have the lowest fertility at 12.0 births per 1,000 women. Women with the education attainment of graduate degree represent 59.9% of all women with births.
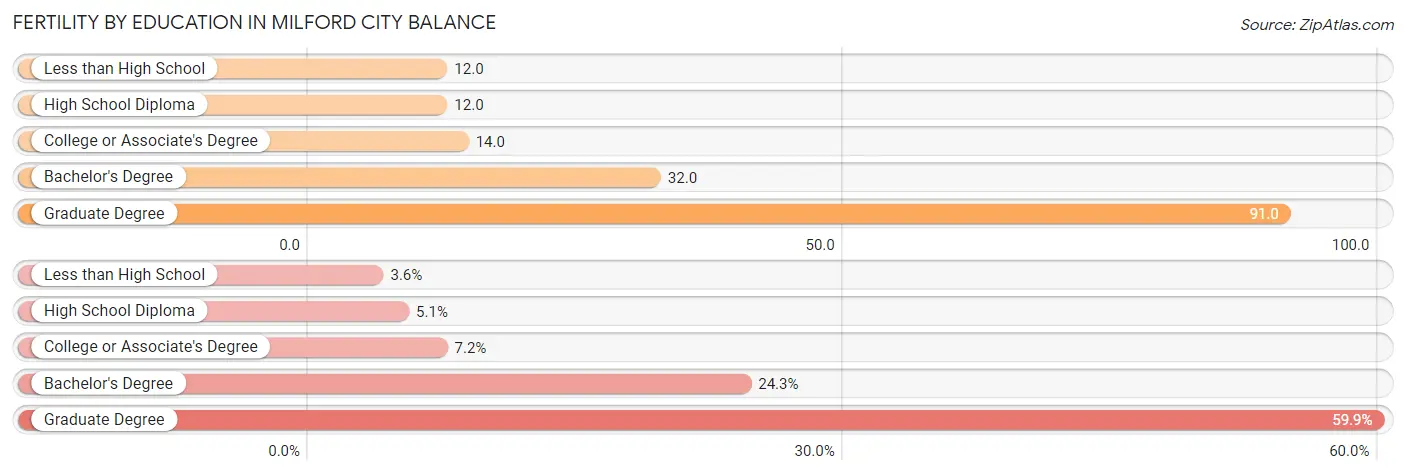
| Educational Attainment | Women with Births | Births / 1,000 Women |
| Less than High School | 15 (3.6%) | 12.0 |
| High School Diploma | 21 (5.1%) | 12.0 |
| College or Associate's Degree | 30 (7.2%) | 14.0 |
| Bachelor's Degree | 101 (24.3%) | 32.0 |
| Graduate Degree | 249 (59.9%) | 91.0 |
| Total | 416 (100.0%) | 37.0 |
Fertility by Education by Marriage Status in Milford city balance
1.4% of women with births in Milford city balance are unmarried. Women with the educational attainment of less than high school are most likely to be married with 100.0% of them married at childbirth, while women with the educational attainment of graduate degree are least likely to be married with 2.4% of them unmarried at childbirth.
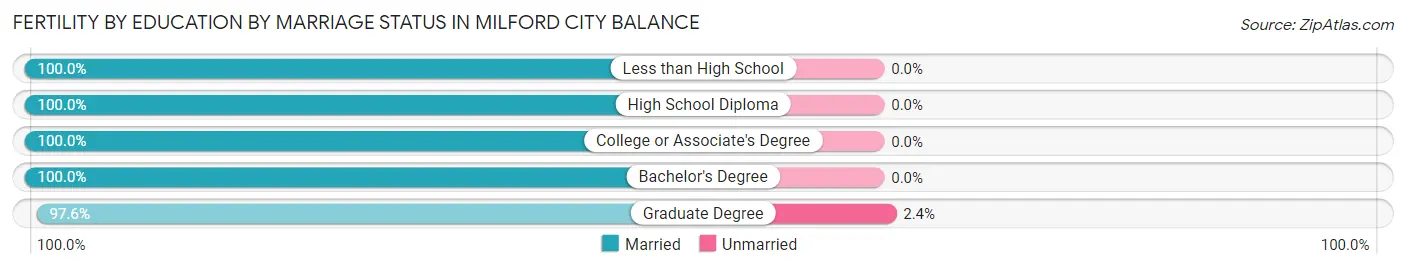
| Educational Attainment | Married | Unmarried |
| Less than High School | 15 (100.0%) | 0 (0.0%) |
| High School Diploma | 21 (100.0%) | 0 (0.0%) |
| College or Associate's Degree | 30 (100.0%) | 0 (0.0%) |
| Bachelor's Degree | 101 (100.0%) | 0 (0.0%) |
| Graduate Degree | 243 (97.6%) | 6 (2.4%) |
| Total | 410 (98.6%) | 6 (1.4%) |
Employment Characteristics in Milford city balance
Employment by Class of Employer in Milford city balance
Among the 27,302 employed individuals in Milford city balance, private company employees (17,818 | 65.3%), not-for-profit organizations (2,922 | 10.7%), and local government employees (2,565 | 9.4%) make up the most common classes of employment.
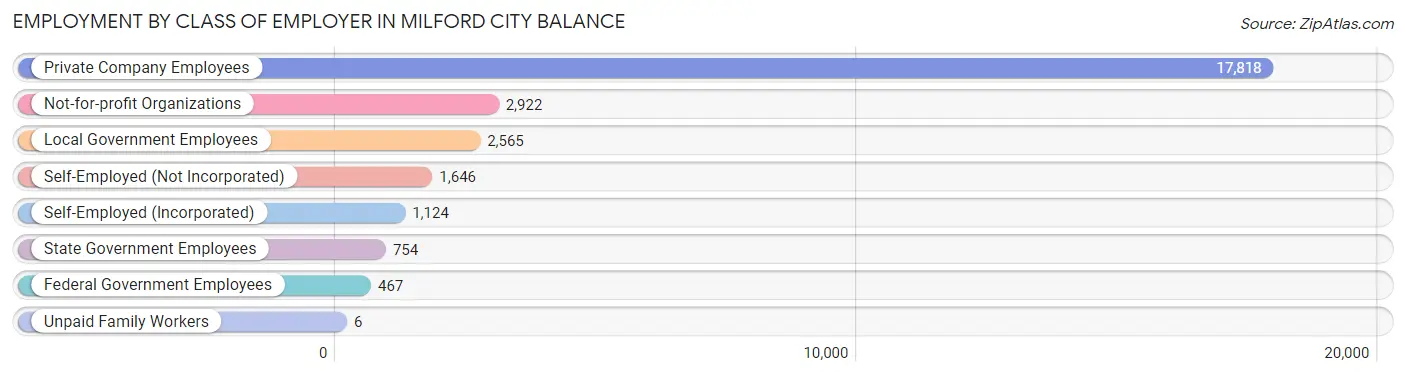
| Employer Class | # Employees | % Employees |
| Private Company Employees | 17,818 | 65.3% |
| Self-Employed (Incorporated) | 1,124 | 4.1% |
| Self-Employed (Not Incorporated) | 1,646 | 6.0% |
| Not-for-profit Organizations | 2,922 | 10.7% |
| Local Government Employees | 2,565 | 9.4% |
| State Government Employees | 754 | 2.8% |
| Federal Government Employees | 467 | 1.7% |
| Unpaid Family Workers | 6 | 0.0% |
| Total | 27,302 | 100.0% |
Employment Status by Age in Milford city balance
According to the labor force statistics for Milford city balance, out of the total population over 16 years of age (43,518), 67.4% or 29,331 individuals are in the labor force, with 4.3% or 1,261 of them unemployed. The age group with the highest labor force participation rate is 30 to 34 years, with 91.1% or 3,155 individuals in the labor force. Within the labor force, the 20 to 24 years age range has the highest percentage of unemployed individuals, with 8.9% or 161 of them being unemployed.
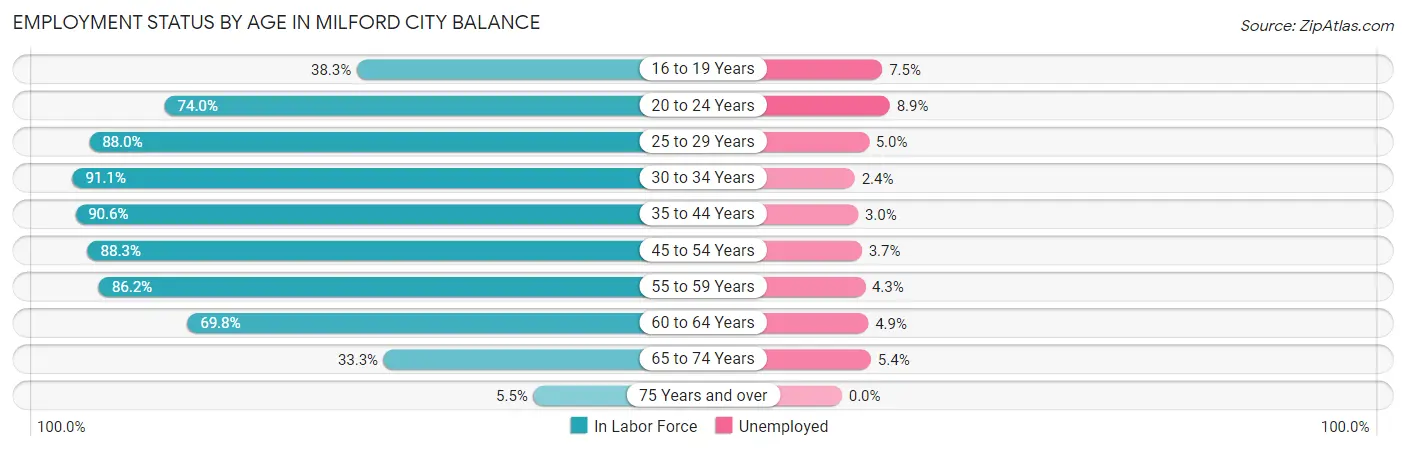
| Age Bracket | In Labor Force | Unemployed |
| 16 to 19 Years | 1,021 (38.3%) | 77 (7.5%) |
| 20 to 24 Years | 1,813 (74.0%) | 161 (8.9%) |
| 25 to 29 Years | 2,586 (88.0%) | 129 (5.0%) |
| 30 to 34 Years | 3,155 (91.1%) | 76 (2.4%) |
| 35 to 44 Years | 5,312 (90.6%) | 159 (3.0%) |
| 45 to 54 Years | 6,220 (88.3%) | 230 (3.7%) |
| 55 to 59 Years | 3,969 (86.2%) | 171 (4.3%) |
| 60 to 64 Years | 2,842 (69.8%) | 139 (4.9%) |
| 65 to 74 Years | 2,189 (33.3%) | 118 (5.4%) |
| 75 Years and over | 211 (5.5%) | 0 (0.0%) |
| Total | 29,331 (67.4%) | 1,261 (4.3%) |
Employment Status by Educational Attainment in Milford city balance
According to labor force statistics for Milford city balance, 86.1% of individuals (24,095) out of the total population between 25 and 64 years of age (27,985) are in the labor force, with 3.8% or 916 of them being unemployed. The group with the highest labor force participation rate are those with the educational attainment of bachelor's degree or higher, with 89.6% or 13,349 individuals in the labor force. Within the labor force, individuals with less than high school education have the highest percentage of unemployment, with 14.4% or 86 of them being unemployed.
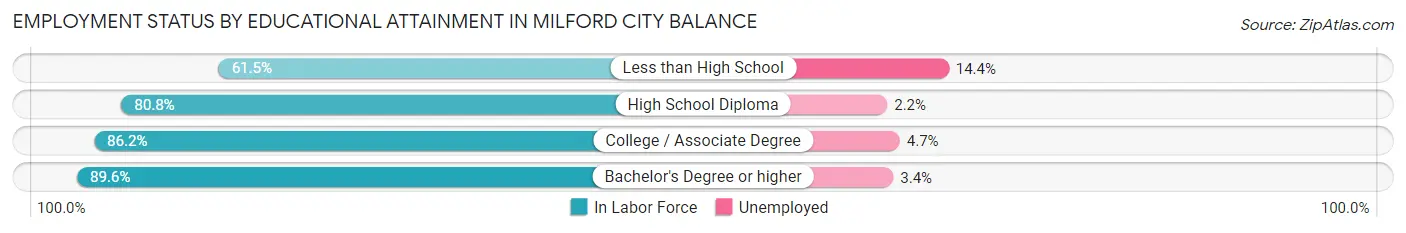
| Educational Attainment | In Labor Force | Unemployed |
| Less than High School | 597 (61.5%) | 140 (14.4%) |
| High School Diploma | 4,644 (80.8%) | 126 (2.2%) |
| College / Associate Degree | 5,490 (86.2%) | 299 (4.7%) |
| Bachelor's Degree or higher | 13,349 (89.6%) | 507 (3.4%) |
| Total | 24,095 (86.1%) | 1,063 (3.8%) |
Employment Occupations by Sex in Milford city balance
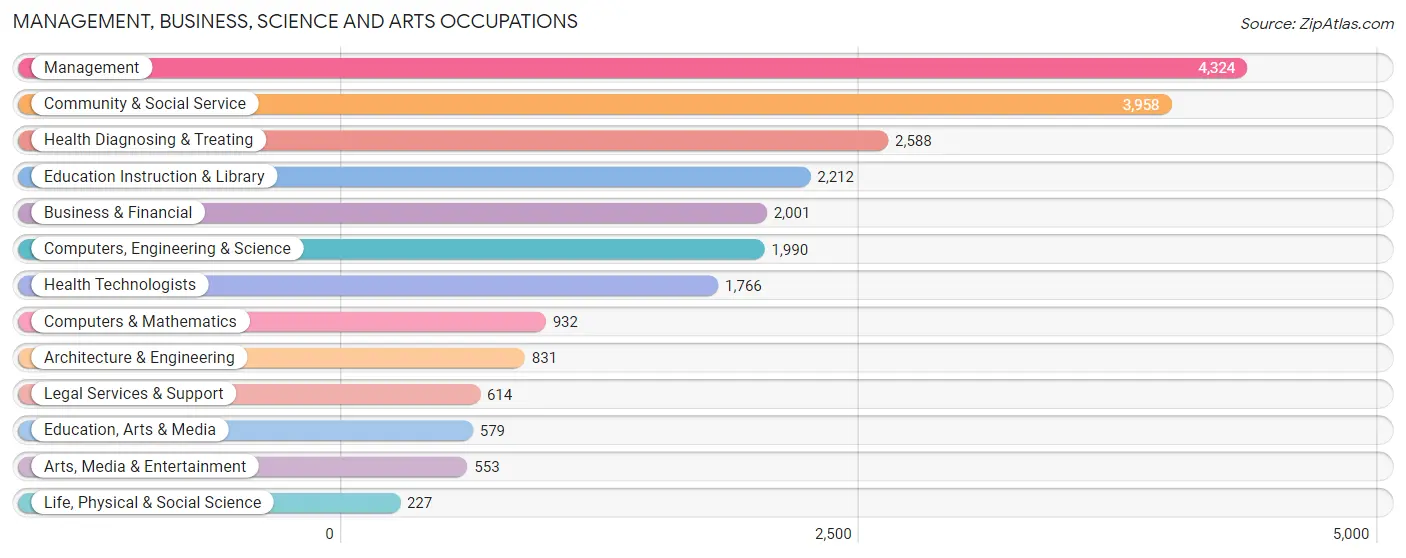
Management, Business, Science and Arts Occupations
The most common Management, Business, Science and Arts occupations in Milford city balance are Management (4,324 | 15.4%), Community & Social Service (3,958 | 14.1%), Health Diagnosing & Treating (2,588 | 9.2%), Education Instruction & Library (2,212 | 7.9%), and Business & Financial (2,001 | 7.1%).
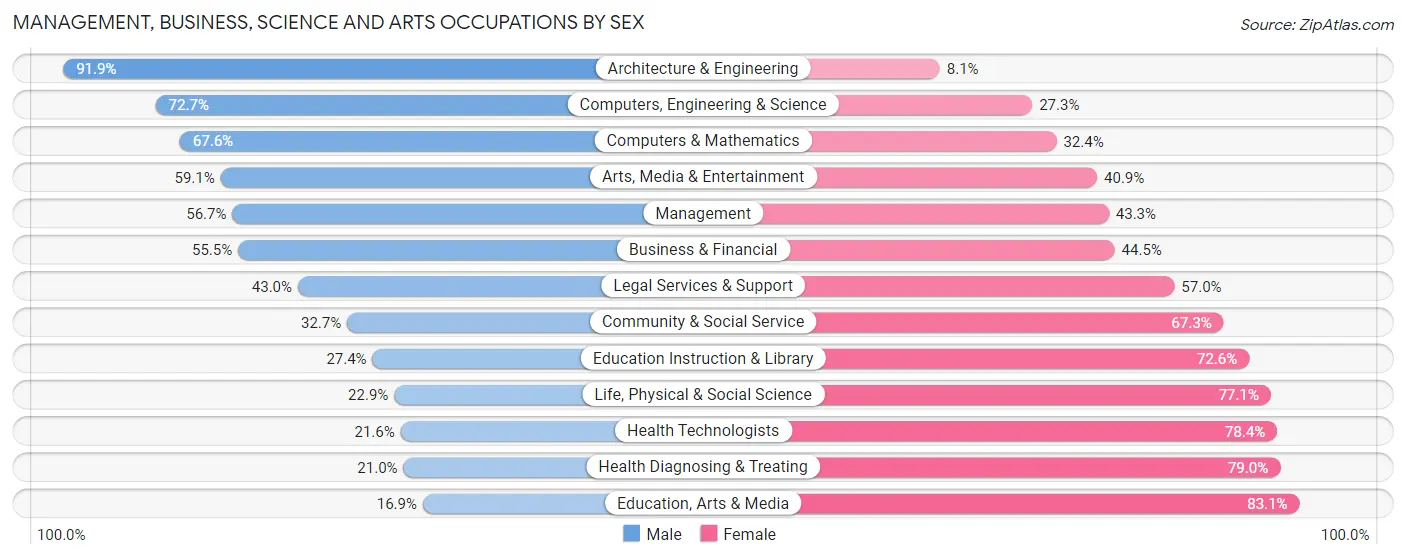
Management, Business, Science and Arts Occupations by Sex
Within the Management, Business, Science and Arts occupations in Milford city balance, the most male-oriented occupations are Architecture & Engineering (91.9%), Computers, Engineering & Science (72.7%), and Computers & Mathematics (67.6%), while the most female-oriented occupations are Education, Arts & Media (83.1%), Health Diagnosing & Treating (79.0%), and Health Technologists (78.4%).
| Occupation | Male | Female |
| Management | 2,451 (56.7%) | 1,873 (43.3%) |
| Business & Financial | 1,110 (55.5%) | 891 (44.5%) |
| Computers, Engineering & Science | 1,446 (72.7%) | 544 (27.3%) |
| Computers & Mathematics | 630 (67.6%) | 302 (32.4%) |
| Architecture & Engineering | 764 (91.9%) | 67 (8.1%) |
| Life, Physical & Social Science | 52 (22.9%) | 175 (77.1%) |
| Community & Social Service | 1,296 (32.7%) | 2,662 (67.3%) |
| Education, Arts & Media | 98 (16.9%) | 481 (83.1%) |
| Legal Services & Support | 264 (43.0%) | 350 (57.0%) |
| Education Instruction & Library | 607 (27.4%) | 1,605 (72.6%) |
| Arts, Media & Entertainment | 327 (59.1%) | 226 (40.9%) |
| Health Diagnosing & Treating | 543 (21.0%) | 2,045 (79.0%) |
| Health Technologists | 381 (21.6%) | 1,385 (78.4%) |
| Total (Category) | 6,846 (46.1%) | 8,015 (53.9%) |
| Total (Overall) | 14,157 (50.5%) | 13,885 (49.5%) |
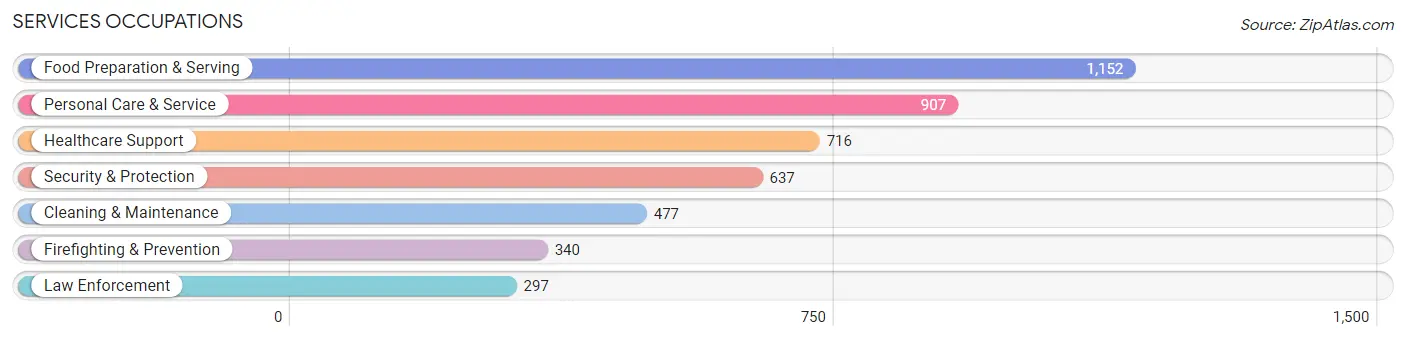
Services Occupations
The most common Services occupations in Milford city balance are Food Preparation & Serving (1,152 | 4.1%), Personal Care & Service (907 | 3.2%), Healthcare Support (716 | 2.5%), Security & Protection (637 | 2.3%), and Cleaning & Maintenance (477 | 1.7%).
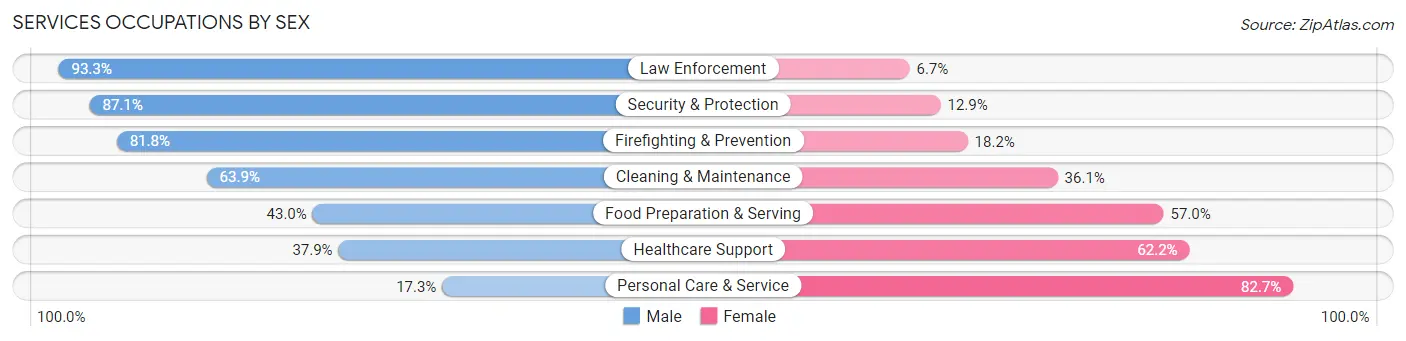
Services Occupations by Sex
Within the Services occupations in Milford city balance, the most male-oriented occupations are Law Enforcement (93.3%), Security & Protection (87.1%), and Firefighting & Prevention (81.8%), while the most female-oriented occupations are Personal Care & Service (82.7%), Healthcare Support (62.2%), and Food Preparation & Serving (57.0%).
| Occupation | Male | Female |
| Healthcare Support | 271 (37.9%) | 445 (62.2%) |
| Security & Protection | 555 (87.1%) | 82 (12.9%) |
| Firefighting & Prevention | 278 (81.8%) | 62 (18.2%) |
| Law Enforcement | 277 (93.3%) | 20 (6.7%) |
| Food Preparation & Serving | 495 (43.0%) | 657 (57.0%) |
| Cleaning & Maintenance | 305 (63.9%) | 172 (36.1%) |
| Personal Care & Service | 157 (17.3%) | 750 (82.7%) |
| Total (Category) | 1,783 (45.9%) | 2,106 (54.1%) |
| Total (Overall) | 14,157 (50.5%) | 13,885 (49.5%) |
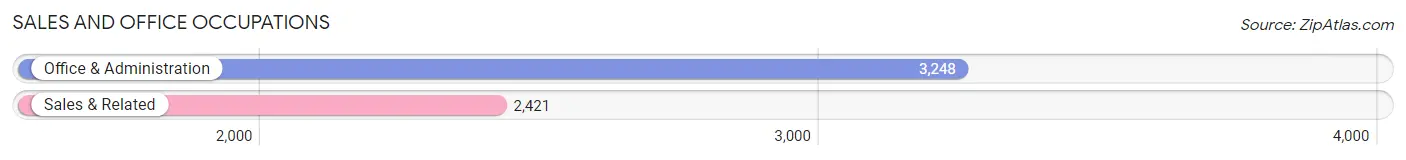
Sales and Office Occupations
The most common Sales and Office occupations in Milford city balance are Office & Administration (3,248 | 11.6%), and Sales & Related (2,421 | 8.6%).
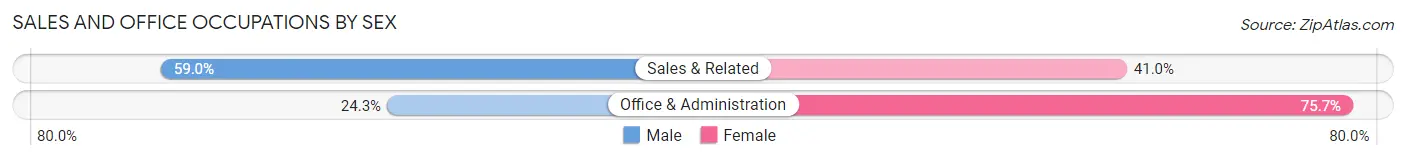
Sales and Office Occupations by Sex
| Occupation | Male | Female |
| Sales & Related | 1,429 (59.0%) | 992 (41.0%) |
| Office & Administration | 788 (24.3%) | 2,460 (75.7%) |
| Total (Category) | 2,217 (39.1%) | 3,452 (60.9%) |
| Total (Overall) | 14,157 (50.5%) | 13,885 (49.5%) |
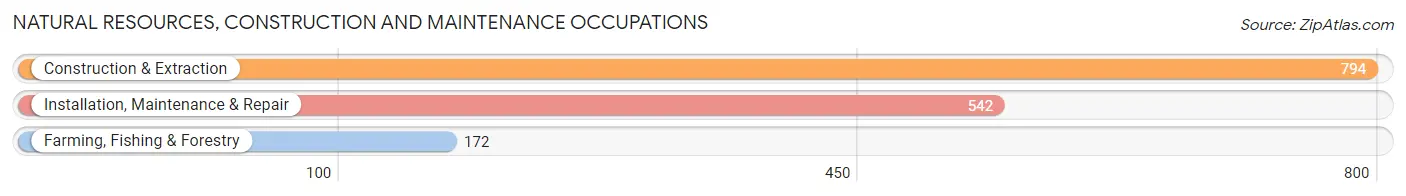
Natural Resources, Construction and Maintenance Occupations
The most common Natural Resources, Construction and Maintenance occupations in Milford city balance are Construction & Extraction (794 | 2.8%), Installation, Maintenance & Repair (542 | 1.9%), and Farming, Fishing & Forestry (172 | 0.6%).
Natural Resources, Construction and Maintenance Occupations by Sex
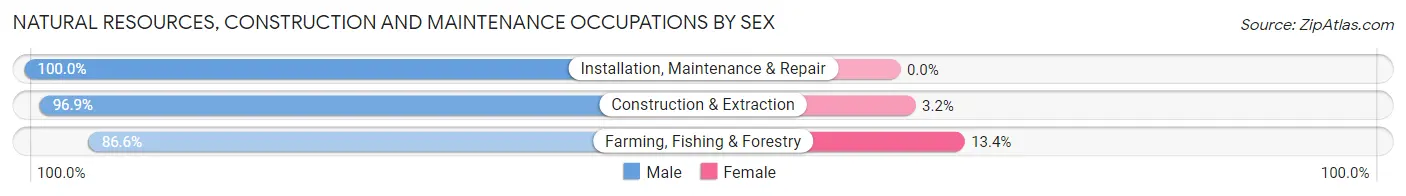
| Occupation | Male | Female |
| Farming, Fishing & Forestry | 149 (86.6%) | 23 (13.4%) |
| Construction & Extraction | 769 (96.9%) | 25 (3.2%) |
| Installation, Maintenance & Repair | 542 (100.0%) | 0 (0.0%) |
| Total (Category) | 1,460 (96.8%) | 48 (3.2%) |
| Total (Overall) | 14,157 (50.5%) | 13,885 (49.5%) |
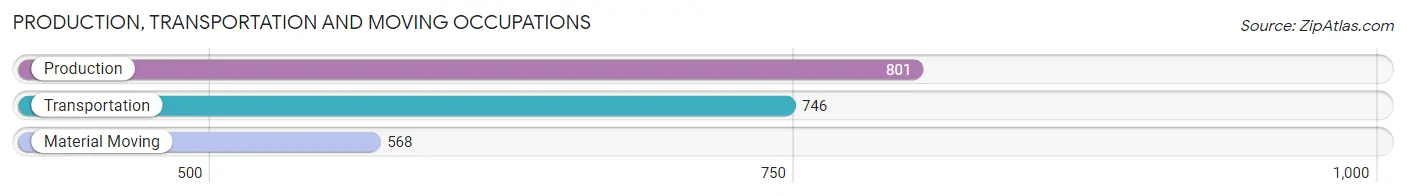
Production, Transportation and Moving Occupations
The most common Production, Transportation and Moving occupations in Milford city balance are Production (801 | 2.9%), Transportation (746 | 2.7%), and Material Moving (568 | 2.0%).
Production, Transportation and Moving Occupations by Sex
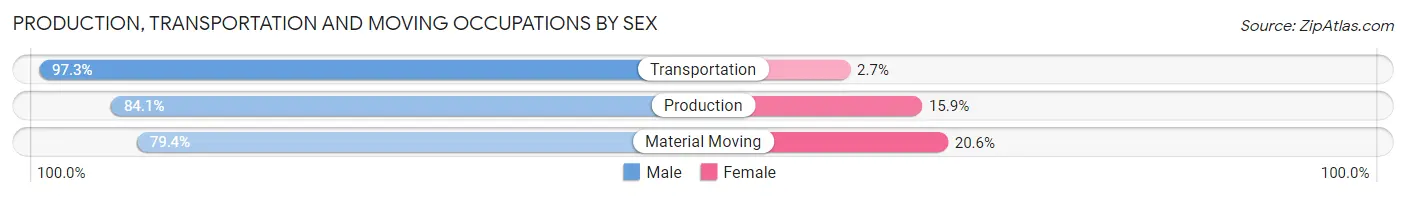
| Occupation | Male | Female |
| Production | 674 (84.1%) | 127 (15.9%) |
| Transportation | 726 (97.3%) | 20 (2.7%) |
| Material Moving | 451 (79.4%) | 117 (20.6%) |
| Total (Category) | 1,851 (87.5%) | 264 (12.5%) |
| Total (Overall) | 14,157 (50.5%) | 13,885 (49.5%) |
Employment Industries by Sex in Milford city balance
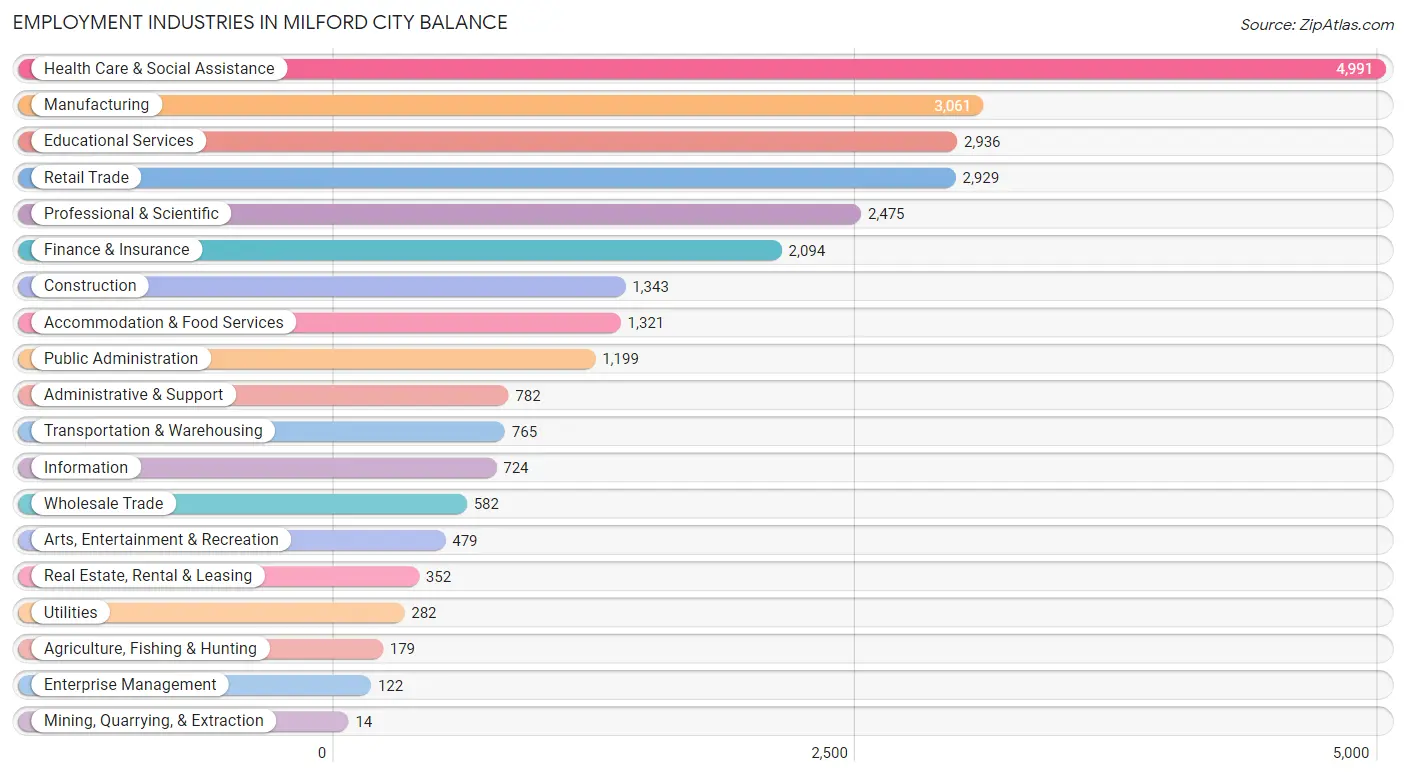
Employment Industries in Milford city balance
The major employment industries in Milford city balance include Health Care & Social Assistance (4,991 | 17.8%), Manufacturing (3,061 | 10.9%), Educational Services (2,936 | 10.5%), Retail Trade (2,929 | 10.4%), and Professional & Scientific (2,475 | 8.8%).
Employment Industries by Sex in Milford city balance
The Milford city balance industries that see more men than women are Mining, Quarrying, & Extraction (100.0%), Construction (93.4%), and Transportation & Warehousing (86.9%), whereas the industries that tend to have a higher number of women are Health Care & Social Assistance (83.9%), Enterprise Management (79.5%), and Utilities (71.3%).
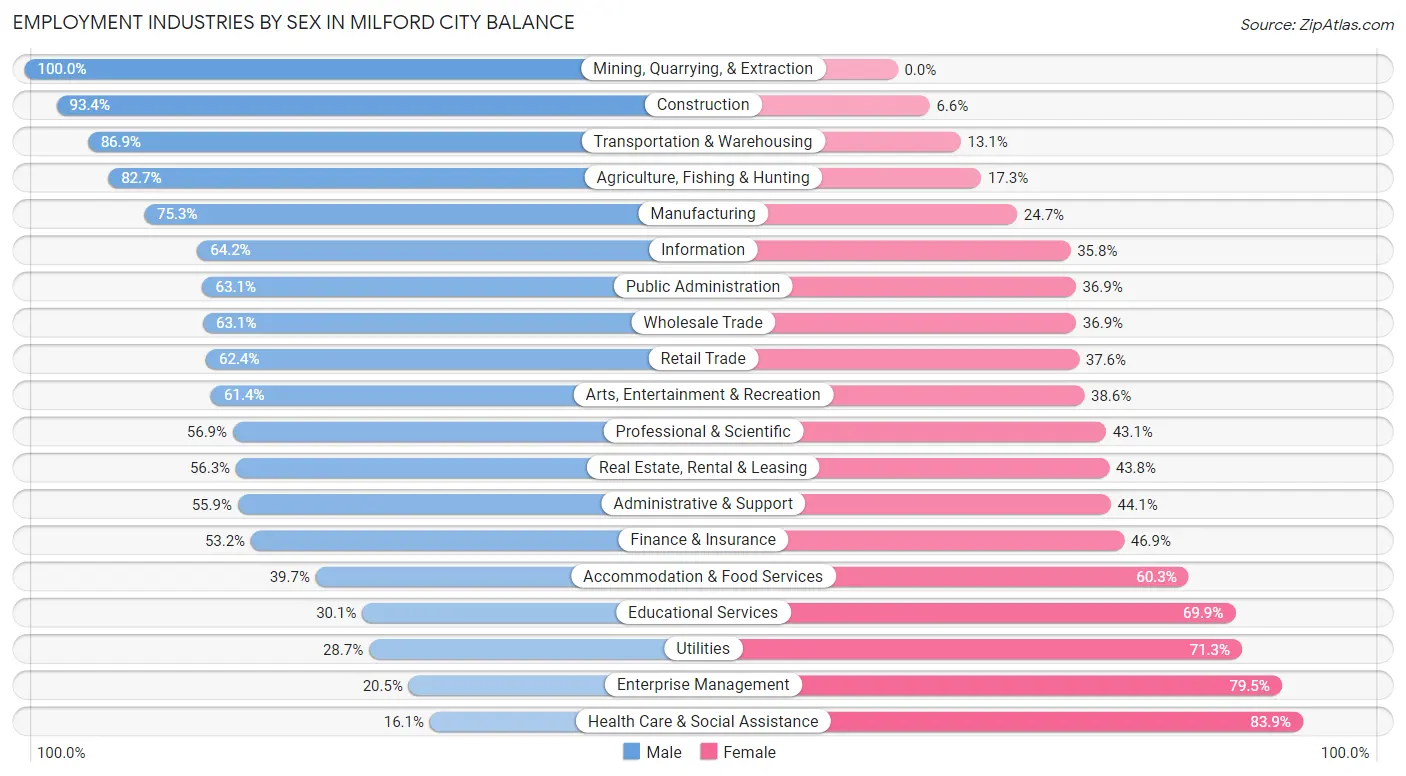
| Industry | Male | Female |
| Agriculture, Fishing & Hunting | 148 (82.7%) | 31 (17.3%) |
| Mining, Quarrying, & Extraction | 14 (100.0%) | 0 (0.0%) |
| Construction | 1,254 (93.4%) | 89 (6.6%) |
| Manufacturing | 2,304 (75.3%) | 757 (24.7%) |
| Wholesale Trade | 367 (63.1%) | 215 (36.9%) |
| Retail Trade | 1,829 (62.4%) | 1,100 (37.6%) |
| Transportation & Warehousing | 665 (86.9%) | 100 (13.1%) |
| Utilities | 81 (28.7%) | 201 (71.3%) |
| Information | 465 (64.2%) | 259 (35.8%) |
| Finance & Insurance | 1,113 (53.1%) | 981 (46.9%) |
| Real Estate, Rental & Leasing | 198 (56.2%) | 154 (43.8%) |
| Professional & Scientific | 1,408 (56.9%) | 1,067 (43.1%) |
| Enterprise Management | 25 (20.5%) | 97 (79.5%) |
| Administrative & Support | 437 (55.9%) | 345 (44.1%) |
| Educational Services | 884 (30.1%) | 2,052 (69.9%) |
| Health Care & Social Assistance | 805 (16.1%) | 4,186 (83.9%) |
| Arts, Entertainment & Recreation | 294 (61.4%) | 185 (38.6%) |
| Accommodation & Food Services | 525 (39.7%) | 796 (60.3%) |
| Public Administration | 757 (63.1%) | 442 (36.9%) |
| Total | 14,157 (50.5%) | 13,885 (49.5%) |
Education in Milford city balance
School Enrollment in Milford city balance
The most common levels of schooling among the 9,707 students in Milford city balance are high school (2,642 | 27.2%), college / undergraduate (1,857 | 19.1%), and elementary school (1,647 | 17.0%).
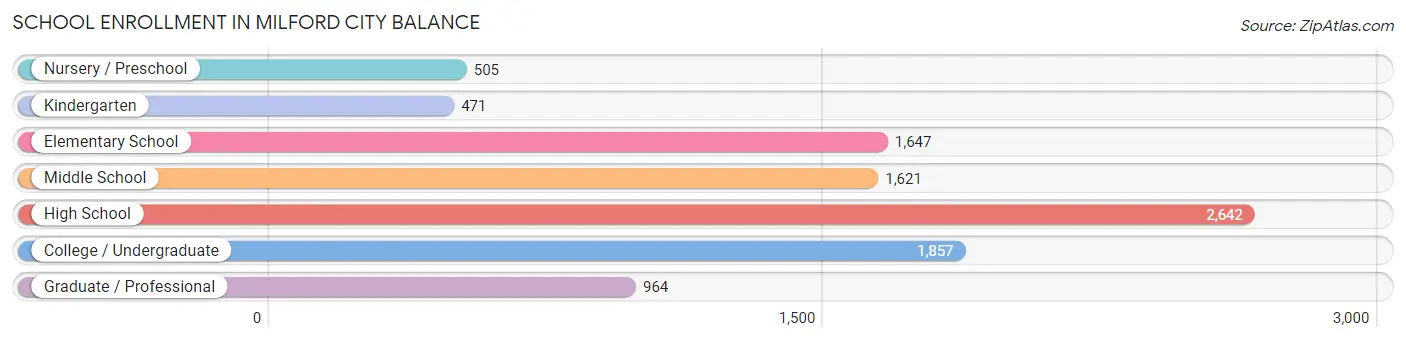
| School Level | # Students | % Students |
| Nursery / Preschool | 505 | 5.2% |
| Kindergarten | 471 | 4.9% |
| Elementary School | 1,647 | 17.0% |
| Middle School | 1,621 | 16.7% |
| High School | 2,642 | 27.2% |
| College / Undergraduate | 1,857 | 19.1% |
| Graduate / Professional | 964 | 9.9% |
| Total | 9,707 | 100.0% |
School Enrollment by Age by Funding Source in Milford city balance
Out of a total of 9,707 students who are enrolled in schools in Milford city balance, 2,330 (24.0%) attend a private institution, while the remaining 7,377 (76.0%) are enrolled in public schools. The age group of 35 years and over has the highest likelihood of being enrolled in private schools, with 275 (68.6% in the age bracket) enrolled. Conversely, the age group of 5 to 9 year old has the lowest likelihood of being enrolled in a private school, with 2,002 (94.8% in the age bracket) attending a public institution.
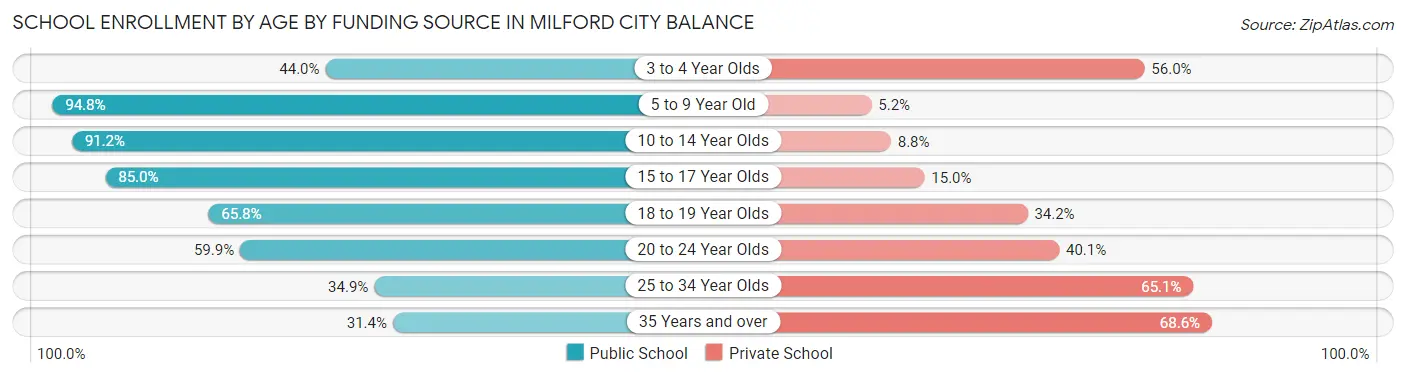
| Age Bracket | Public School | Private School |
| 3 to 4 Year Olds | 179 (44.0%) | 228 (56.0%) |
| 5 to 9 Year Old | 2,002 (94.8%) | 109 (5.2%) |
| 10 to 14 Year Olds | 1,954 (91.2%) | 188 (8.8%) |
| 15 to 17 Year Olds | 1,701 (85.0%) | 301 (15.0%) |
| 18 to 19 Year Olds | 490 (65.8%) | 255 (34.2%) |
| 20 to 24 Year Olds | 624 (59.9%) | 418 (40.1%) |
| 25 to 34 Year Olds | 299 (34.9%) | 558 (65.1%) |
| 35 Years and over | 126 (31.4%) | 275 (68.6%) |
| Total | 7,377 (76.0%) | 2,330 (24.0%) |
Educational Attainment by Field of Study in Milford city balance
Business (4,050 | 20.8%), education (1,958 | 10.1%), social sciences (1,782 | 9.2%), science & technology (1,632 | 8.4%), and engineering (1,414 | 7.3%) are the most common fields of study among 19,451 individuals in Milford city balance who have obtained a bachelor's degree or higher.
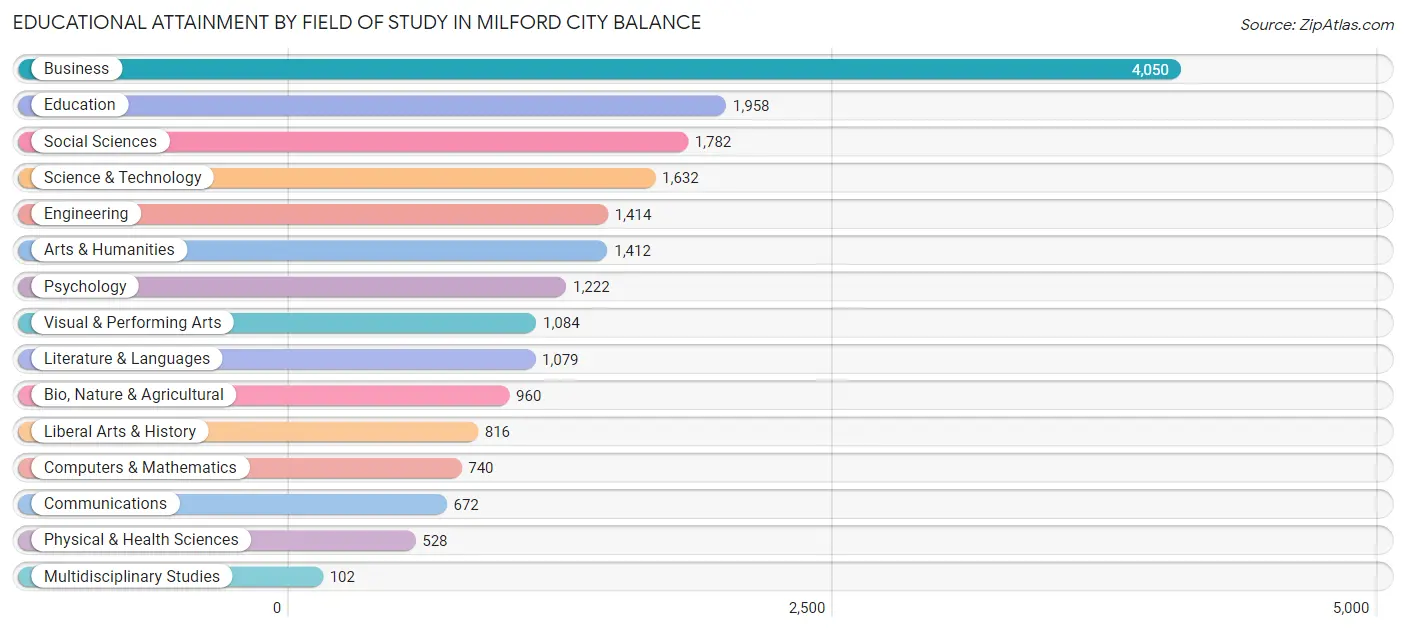
| Field of Study | # Graduates | % Graduates |
| Computers & Mathematics | 740 | 3.8% |
| Bio, Nature & Agricultural | 960 | 4.9% |
| Physical & Health Sciences | 528 | 2.7% |
| Psychology | 1,222 | 6.3% |
| Social Sciences | 1,782 | 9.2% |
| Engineering | 1,414 | 7.3% |
| Multidisciplinary Studies | 102 | 0.5% |
| Science & Technology | 1,632 | 8.4% |
| Business | 4,050 | 20.8% |
| Education | 1,958 | 10.1% |
| Literature & Languages | 1,079 | 5.6% |
| Liberal Arts & History | 816 | 4.2% |
| Visual & Performing Arts | 1,084 | 5.6% |
| Communications | 672 | 3.5% |
| Arts & Humanities | 1,412 | 7.3% |
| Total | 19,451 | 100.0% |
Transportation & Commute in Milford city balance
Vehicle Availability by Sex in Milford city balance
The most prevalent vehicle ownership categories in Milford city balance are males with 2 vehicles (5,608, accounting for 40.4%) and females with 2 vehicles (5,169, making up 41.9%).
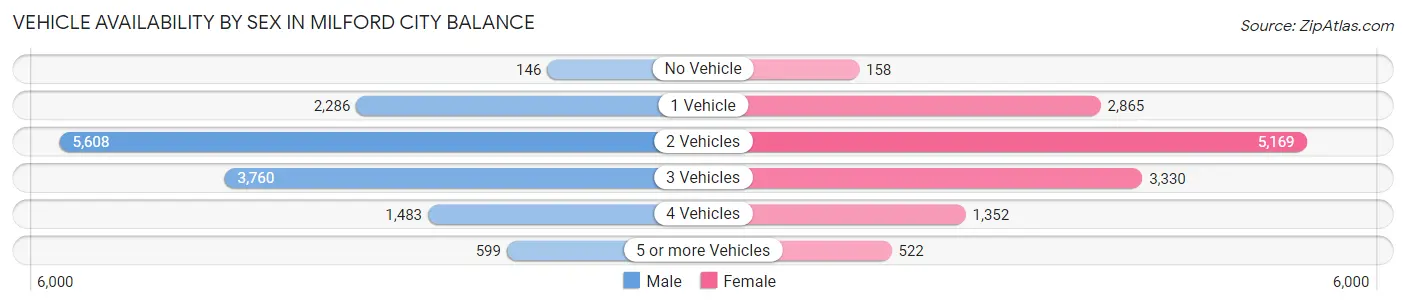
| Vehicles Available | Male | Female |
| No Vehicle | 146 (1.1%) | 158 (1.2%) |
| 1 Vehicle | 2,286 (16.5%) | 2,865 (21.4%) |
| 2 Vehicles | 5,608 (40.4%) | 5,169 (38.6%) |
| 3 Vehicles | 3,760 (27.1%) | 3,330 (24.9%) |
| 4 Vehicles | 1,483 (10.7%) | 1,352 (10.1%) |
| 5 or more Vehicles | 599 (4.3%) | 522 (3.9%) |
| Total | 13,882 (100.0%) | 13,396 (100.0%) |
Commute Time in Milford city balance
The most frequently occuring commute durations in Milford city balance are 15 to 19 minutes (4,042 commuters, 17.2%), 10 to 14 minutes (3,898 commuters, 16.6%), and 20 to 24 minutes (3,867 commuters, 16.4%).
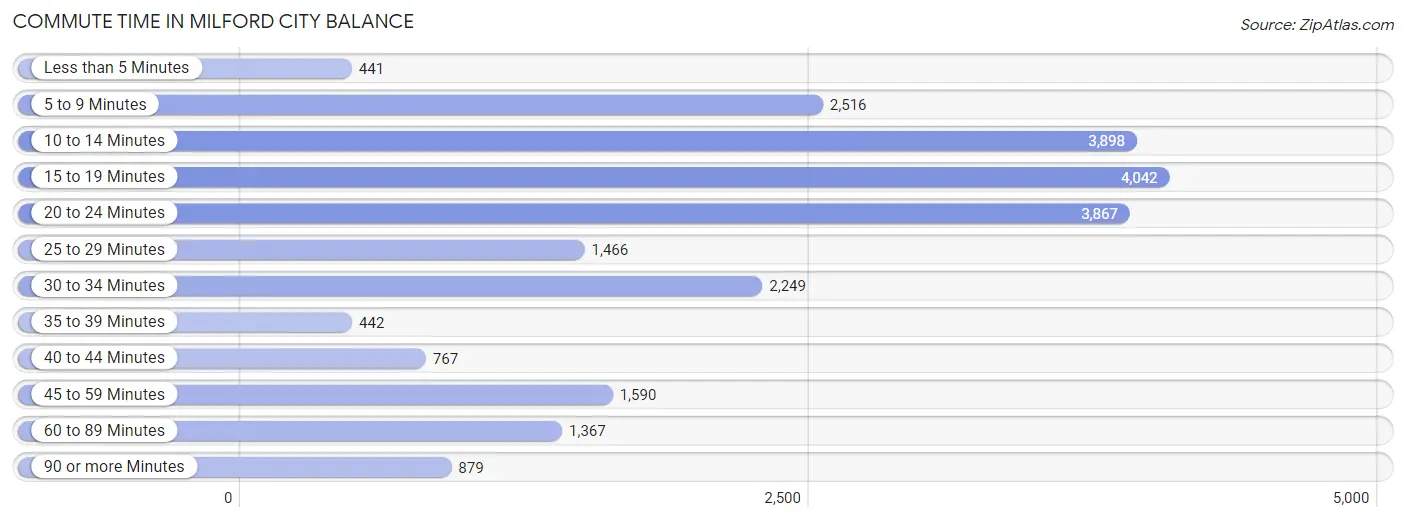
| Commute Time | # Commuters | % Commuters |
| Less than 5 Minutes | 441 | 1.9% |
| 5 to 9 Minutes | 2,516 | 10.7% |
| 10 to 14 Minutes | 3,898 | 16.6% |
| 15 to 19 Minutes | 4,042 | 17.2% |
| 20 to 24 Minutes | 3,867 | 16.4% |
| 25 to 29 Minutes | 1,466 | 6.2% |
| 30 to 34 Minutes | 2,249 | 9.6% |
| 35 to 39 Minutes | 442 | 1.9% |
| 40 to 44 Minutes | 767 | 3.3% |
| 45 to 59 Minutes | 1,590 | 6.8% |
| 60 to 89 Minutes | 1,367 | 5.8% |
| 90 or more Minutes | 879 | 3.7% |
Commute Time by Sex in Milford city balance
The most common commute times in Milford city balance are 15 to 19 minutes (2,052 commuters, 16.9%) for males and 20 to 24 minutes (2,210 commuters, 19.5%) for females.
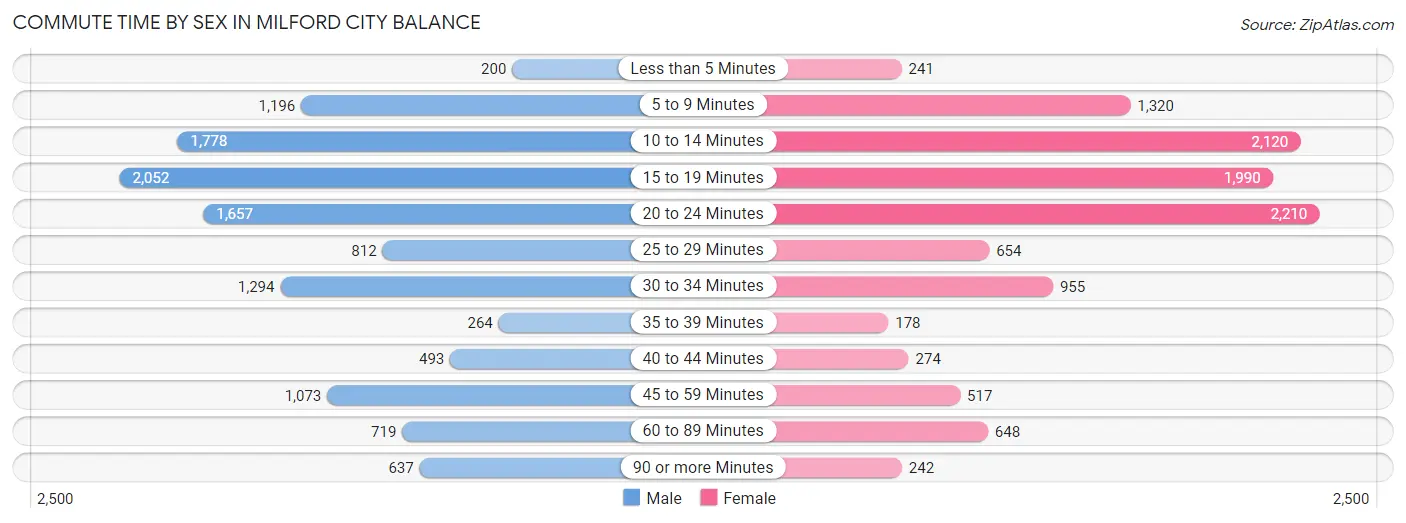
| Commute Time | Male | Female |
| Less than 5 Minutes | 200 (1.6%) | 241 (2.1%) |
| 5 to 9 Minutes | 1,196 (9.8%) | 1,320 (11.6%) |
| 10 to 14 Minutes | 1,778 (14.6%) | 2,120 (18.7%) |
| 15 to 19 Minutes | 2,052 (16.9%) | 1,990 (17.5%) |
| 20 to 24 Minutes | 1,657 (13.6%) | 2,210 (19.5%) |
| 25 to 29 Minutes | 812 (6.7%) | 654 (5.8%) |
| 30 to 34 Minutes | 1,294 (10.6%) | 955 (8.4%) |
| 35 to 39 Minutes | 264 (2.2%) | 178 (1.6%) |
| 40 to 44 Minutes | 493 (4.1%) | 274 (2.4%) |
| 45 to 59 Minutes | 1,073 (8.8%) | 517 (4.6%) |
| 60 to 89 Minutes | 719 (5.9%) | 648 (5.7%) |
| 90 or more Minutes | 637 (5.2%) | 242 (2.1%) |
Time of Departure to Work by Sex in Milford city balance
The most frequent times of departure to work in Milford city balance are 8:00 AM to 8:29 AM (1,897, 15.6%) for males and 8:00 AM to 8:29 AM (2,137, 18.8%) for females.
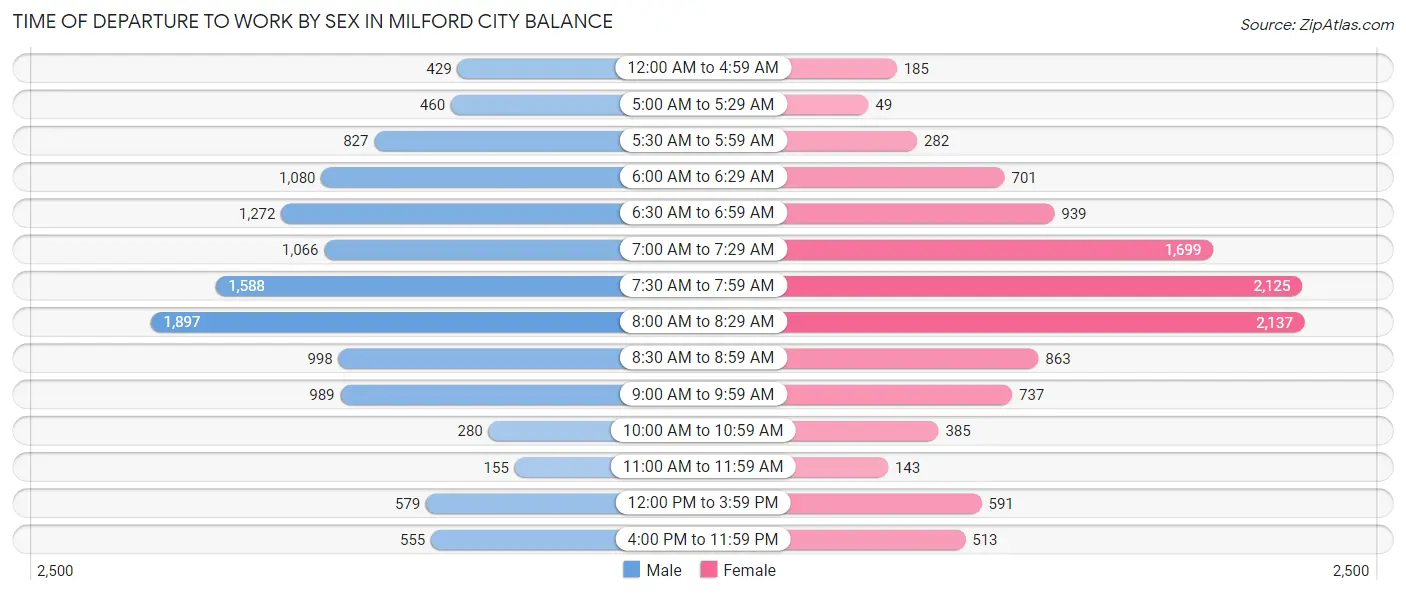
| Time of Departure | Male | Female |
| 12:00 AM to 4:59 AM | 429 (3.5%) | 185 (1.6%) |
| 5:00 AM to 5:29 AM | 460 (3.8%) | 49 (0.4%) |
| 5:30 AM to 5:59 AM | 827 (6.8%) | 282 (2.5%) |
| 6:00 AM to 6:29 AM | 1,080 (8.9%) | 701 (6.2%) |
| 6:30 AM to 6:59 AM | 1,272 (10.4%) | 939 (8.3%) |
| 7:00 AM to 7:29 AM | 1,066 (8.8%) | 1,699 (15.0%) |
| 7:30 AM to 7:59 AM | 1,588 (13.0%) | 2,125 (18.7%) |
| 8:00 AM to 8:29 AM | 1,897 (15.6%) | 2,137 (18.8%) |
| 8:30 AM to 8:59 AM | 998 (8.2%) | 863 (7.6%) |
| 9:00 AM to 9:59 AM | 989 (8.1%) | 737 (6.5%) |
| 10:00 AM to 10:59 AM | 280 (2.3%) | 385 (3.4%) |
| 11:00 AM to 11:59 AM | 155 (1.3%) | 143 (1.3%) |
| 12:00 PM to 3:59 PM | 579 (4.8%) | 591 (5.2%) |
| 4:00 PM to 11:59 PM | 555 (4.6%) | 513 (4.5%) |
| Total | 12,175 (100.0%) | 11,349 (100.0%) |
Housing Occupancy in Milford city balance
Occupancy by Ownership in Milford city balance
Of the total 21,152 dwellings in Milford city balance, owner-occupied units account for 16,221 (76.7%), while renter-occupied units make up 4,931 (23.3%).
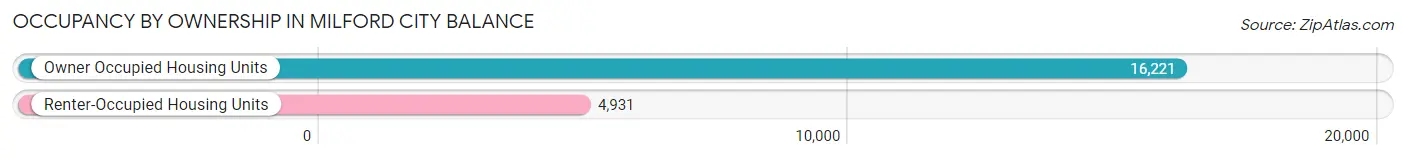
| Occupancy | # Housing Units | % Housing Units |
| Owner Occupied Housing Units | 16,221 | 76.7% |
| Renter-Occupied Housing Units | 4,931 | 23.3% |
| Total Occupied Housing Units | 21,152 | 100.0% |
Occupancy by Household Size in Milford city balance
| Household Size | # Housing Units | % Housing Units |
| 1-Person Household | 6,594 | 31.2% |
| 2-Person Household | 7,355 | 34.8% |
| 3-Person Household | 3,517 | 16.6% |
| 4+ Person Household | 3,686 | 17.4% |
| Total Housing Units | 21,152 | 100.0% |
Occupancy by Ownership by Household Size in Milford city balance
| Household Size | Owner-occupied | Renter-occupied |
| 1-Person Household | 4,155 (63.0%) | 2,439 (37.0%) |
| 2-Person Household | 5,792 (78.7%) | 1,563 (21.2%) |
| 3-Person Household | 3,014 (85.7%) | 503 (14.3%) |
| 4+ Person Household | 3,260 (88.4%) | 426 (11.6%) |
| Total Housing Units | 16,221 (76.7%) | 4,931 (23.3%) |
Occupancy by Educational Attainment in Milford city balance
| Household Size | Owner-occupied | Renter-occupied |
| Less than High School | 477 (63.3%) | 276 (36.6%) |
| High School Diploma | 3,497 (75.1%) | 1,159 (24.9%) |
| College/Associate Degree | 3,936 (79.5%) | 1,012 (20.4%) |
| Bachelor's Degree or higher | 8,311 (77.0%) | 2,484 (23.0%) |
Occupancy by Age of Householder in Milford city balance
| Age Bracket | # Households | % Households |
| Under 35 Years | 2,765 | 13.1% |
| 35 to 44 Years | 3,091 | 14.6% |
| 45 to 54 Years | 4,040 | 19.1% |
| 55 to 64 Years | 4,866 | 23.0% |
| 65 to 74 Years | 4,013 | 19.0% |
| 75 to 84 Years | 1,684 | 8.0% |
| 85 Years and Over | 693 | 3.3% |
| Total | 21,152 | 100.0% |
Housing Finances in Milford city balance
Median Income by Occupancy in Milford city balance
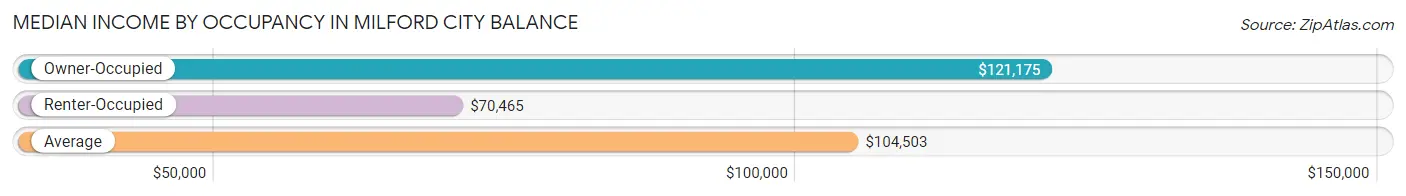
| Occupancy Type | # Households | Median Income |
| Owner-Occupied | 16,221 (76.7%) | $121,175 |
| Renter-Occupied | 4,931 (23.3%) | $70,465 |
| Average | 21,152 (100.0%) | $104,503 |
Occupancy by Householder Income Bracket in Milford city balance
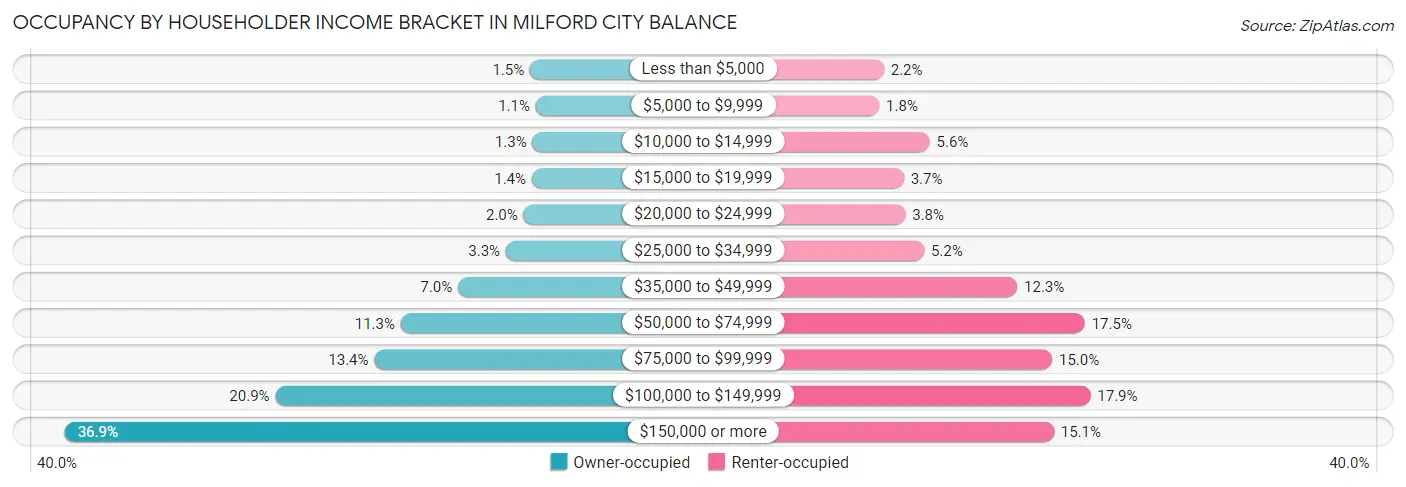
| Income Bracket | Owner-occupied | Renter-occupied |
| Less than $5,000 | 241 (1.5%) | 106 (2.1%) |
| $5,000 to $9,999 | 171 (1.1%) | 89 (1.8%) |
| $10,000 to $14,999 | 211 (1.3%) | 278 (5.6%) |
| $15,000 to $19,999 | 219 (1.3%) | 181 (3.7%) |
| $20,000 to $24,999 | 321 (2.0%) | 187 (3.8%) |
| $25,000 to $34,999 | 540 (3.3%) | 257 (5.2%) |
| $35,000 to $49,999 | 1,133 (7.0%) | 607 (12.3%) |
| $50,000 to $74,999 | 1,839 (11.3%) | 861 (17.5%) |
| $75,000 to $99,999 | 2,165 (13.4%) | 738 (15.0%) |
| $100,000 to $149,999 | 3,389 (20.9%) | 882 (17.9%) |
| $150,000 or more | 5,992 (36.9%) | 745 (15.1%) |
| Total | 16,221 (100.0%) | 4,931 (100.0%) |
Monthly Housing Cost Tiers in Milford city balance
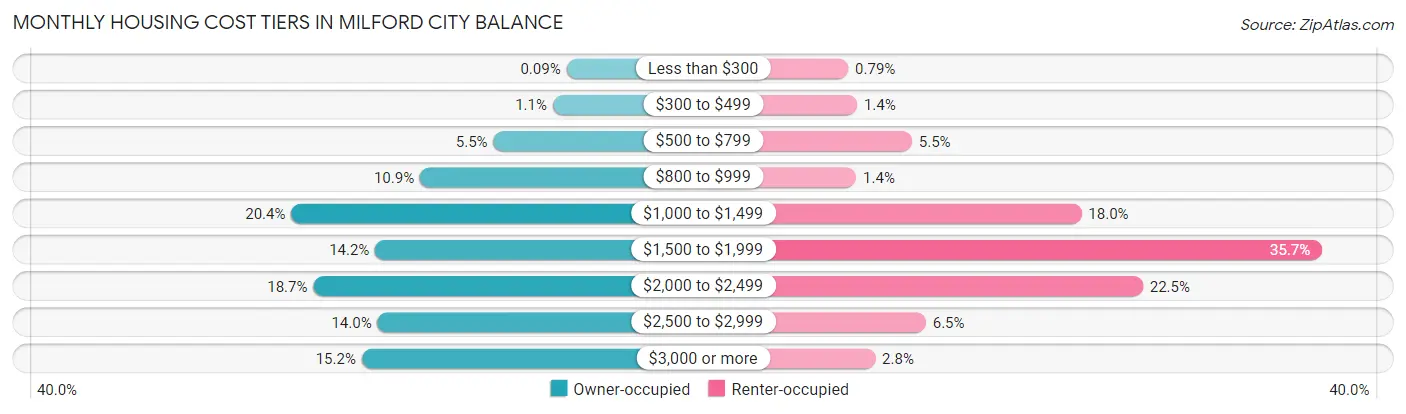
| Monthly Cost | Owner-occupied | Renter-occupied |
| Less than $300 | 15 (0.1%) | 39 (0.8%) |
| $300 to $499 | 178 (1.1%) | 71 (1.4%) |
| $500 to $799 | 887 (5.5%) | 270 (5.5%) |
| $800 to $999 | 1,765 (10.9%) | 68 (1.4%) |
| $1,000 to $1,499 | 3,303 (20.4%) | 886 (18.0%) |
| $1,500 to $1,999 | 2,300 (14.2%) | 1,760 (35.7%) |
| $2,000 to $2,499 | 3,040 (18.7%) | 1,109 (22.5%) |
| $2,500 to $2,999 | 2,272 (14.0%) | 321 (6.5%) |
| $3,000 or more | 2,461 (15.2%) | 137 (2.8%) |
| Total | 16,221 (100.0%) | 4,931 (100.0%) |
Physical Housing Characteristics in Milford city balance
Housing Structures in Milford city balance
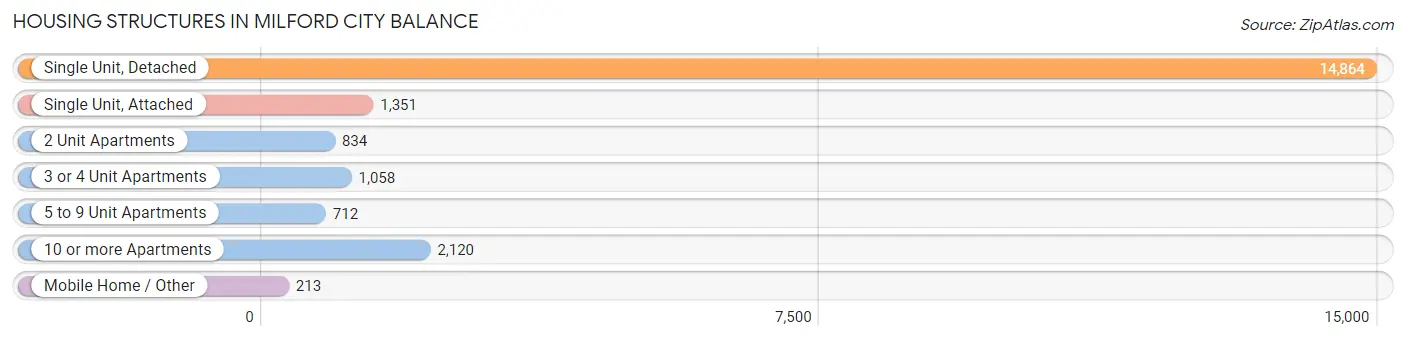
| Structure Type | # Housing Units | % Housing Units |
| Single Unit, Detached | 14,864 | 70.3% |
| Single Unit, Attached | 1,351 | 6.4% |
| 2 Unit Apartments | 834 | 3.9% |
| 3 or 4 Unit Apartments | 1,058 | 5.0% |
| 5 to 9 Unit Apartments | 712 | 3.4% |
| 10 or more Apartments | 2,120 | 10.0% |
| Mobile Home / Other | 213 | 1.0% |
| Total | 21,152 | 100.0% |
Housing Structures by Occupancy in Milford city balance
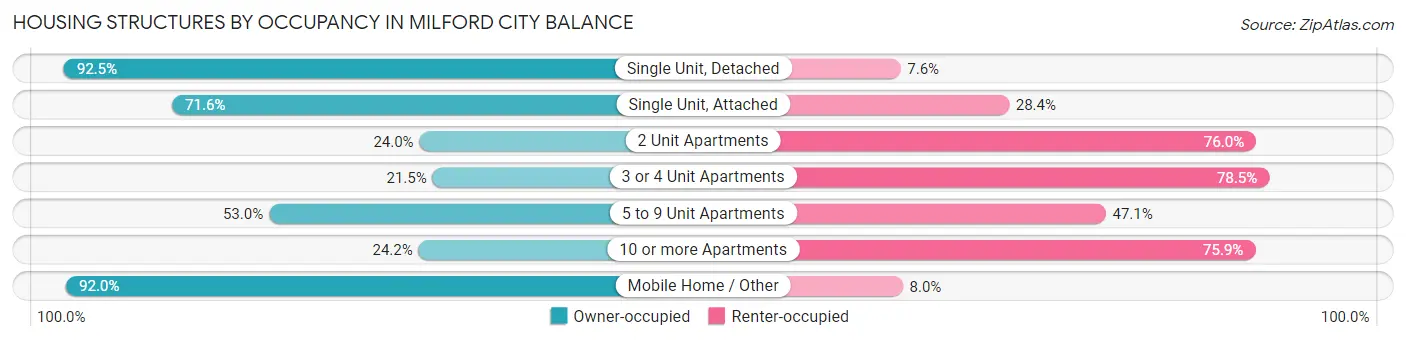
| Structure Type | Owner-occupied | Renter-occupied |
| Single Unit, Detached | 13,742 (92.4%) | 1,122 (7.5%) |
| Single Unit, Attached | 967 (71.6%) | 384 (28.4%) |
| 2 Unit Apartments | 200 (24.0%) | 634 (76.0%) |
| 3 or 4 Unit Apartments | 227 (21.5%) | 831 (78.5%) |
| 5 to 9 Unit Apartments | 377 (52.9%) | 335 (47.0%) |
| 10 or more Apartments | 512 (24.1%) | 1,608 (75.8%) |
| Mobile Home / Other | 196 (92.0%) | 17 (8.0%) |
| Total | 16,221 (76.7%) | 4,931 (23.3%) |
Housing Structures by Number of Rooms in Milford city balance
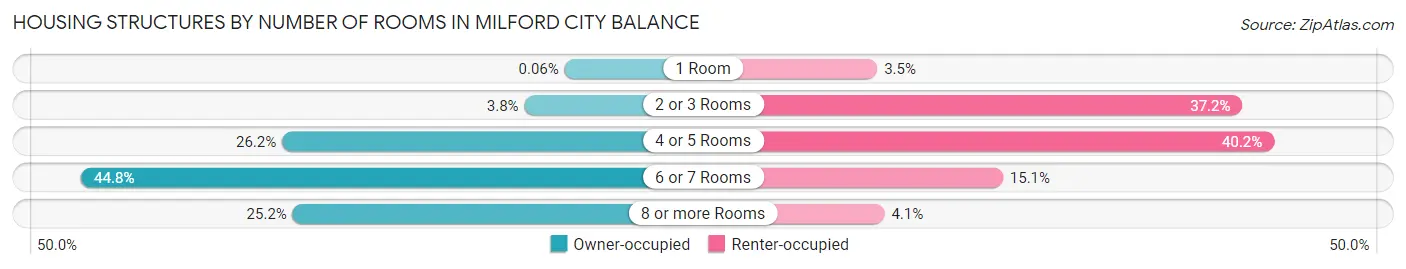
| Number of Rooms | Owner-occupied | Renter-occupied |
| 1 Room | 10 (0.1%) | 170 (3.5%) |
| 2 or 3 Rooms | 611 (3.8%) | 1,835 (37.2%) |
| 4 or 5 Rooms | 4,249 (26.2%) | 1,980 (40.2%) |
| 6 or 7 Rooms | 7,262 (44.8%) | 743 (15.1%) |
| 8 or more Rooms | 4,089 (25.2%) | 203 (4.1%) |
| Total | 16,221 (100.0%) | 4,931 (100.0%) |
Housing Structure by Heating Type in Milford city balance
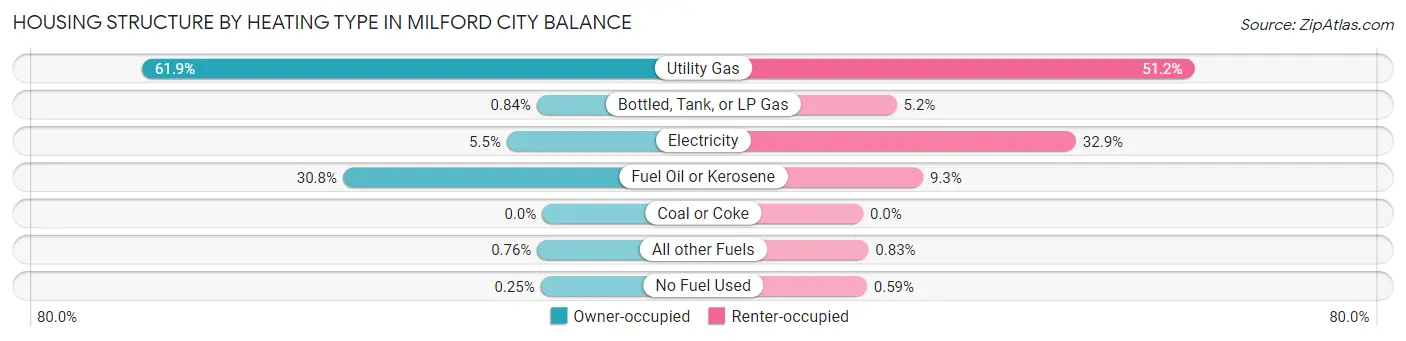
| Heating Type | Owner-occupied | Renter-occupied |
| Utility Gas | 10,036 (61.9%) | 2,525 (51.2%) |
| Bottled, Tank, or LP Gas | 137 (0.8%) | 256 (5.2%) |
| Electricity | 888 (5.5%) | 1,623 (32.9%) |
| Fuel Oil or Kerosene | 4,997 (30.8%) | 457 (9.3%) |
| Coal or Coke | 0 (0.0%) | 0 (0.0%) |
| All other Fuels | 123 (0.8%) | 41 (0.8%) |
| No Fuel Used | 40 (0.3%) | 29 (0.6%) |
| Total | 16,221 (100.0%) | 4,931 (100.0%) |
Household Vehicle Usage in Milford city balance
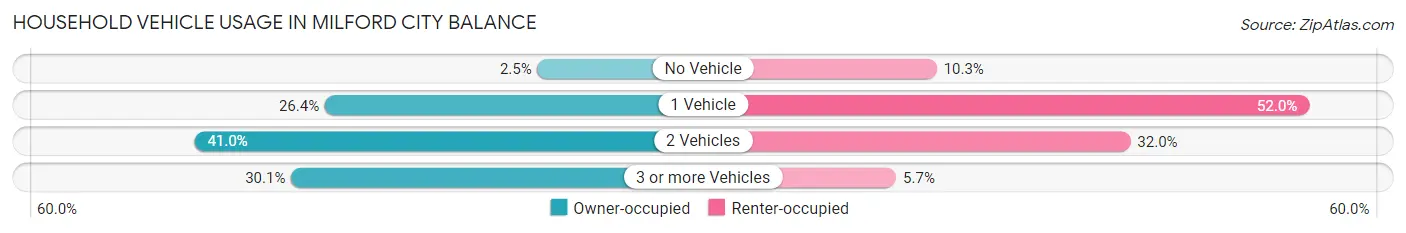
| Vehicles per Household | Owner-occupied | Renter-occupied |
| No Vehicle | 412 (2.5%) | 507 (10.3%) |
| 1 Vehicle | 4,275 (26.4%) | 2,564 (52.0%) |
| 2 Vehicles | 6,646 (41.0%) | 1,577 (32.0%) |
| 3 or more Vehicles | 4,888 (30.1%) | 283 (5.7%) |
| Total | 16,221 (100.0%) | 4,931 (100.0%) |
Real Estate & Mortgages in Milford city balance
Real Estate and Mortgage Overview in Milford city balance
| Characteristic | Without Mortgage | With Mortgage |
| Housing Units | 5,610 | 10,611 |
| Median Property Value | $358,600 | $363,500 |
| Median Household Income | $82,877 | $4,631 |
| Monthly Housing Costs | $1,038 | $2,373 |
| Real Estate Taxes | $6,480 | $199 |
Property Value by Mortgage Status in Milford city balance
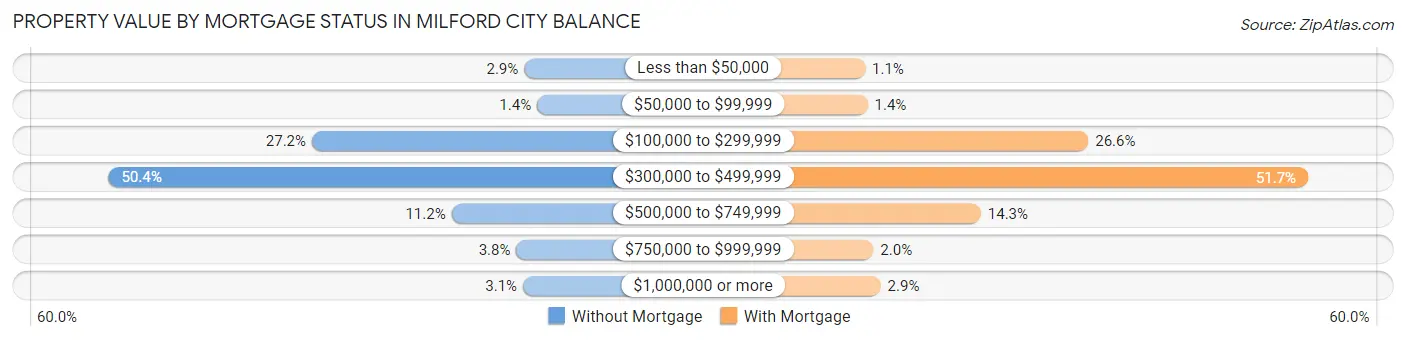
| Property Value | Without Mortgage | With Mortgage |
| Less than $50,000 | 163 (2.9%) | 116 (1.1%) |
| $50,000 to $99,999 | 81 (1.4%) | 146 (1.4%) |
| $100,000 to $299,999 | 1,524 (27.2%) | 2,822 (26.6%) |
| $300,000 to $499,999 | 2,828 (50.4%) | 5,486 (51.7%) |
| $500,000 to $749,999 | 629 (11.2%) | 1,520 (14.3%) |
| $750,000 to $999,999 | 214 (3.8%) | 216 (2.0%) |
| $1,000,000 or more | 171 (3.0%) | 305 (2.9%) |
| Total | 5,610 (100.0%) | 10,611 (100.0%) |
Household Income by Mortgage Status in Milford city balance
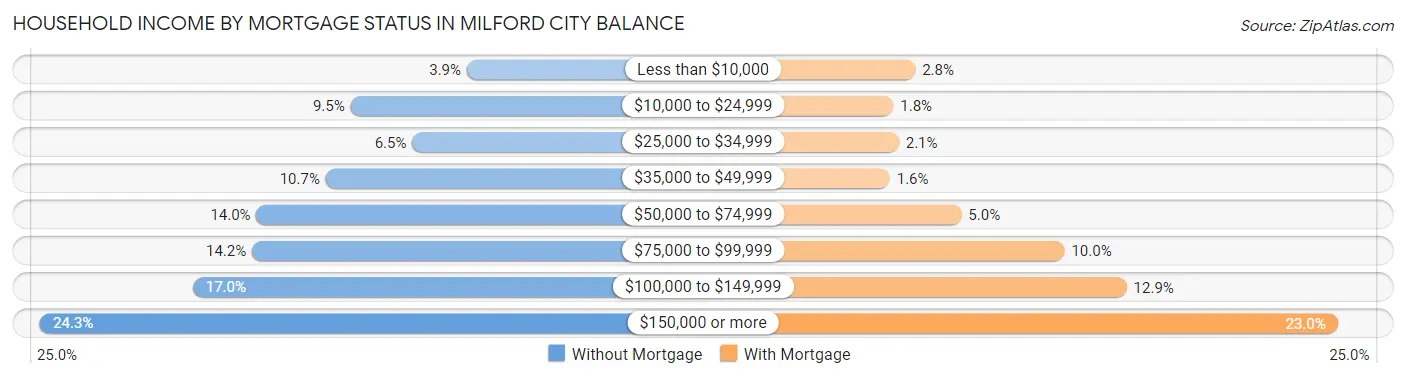
| Household Income | Without Mortgage | With Mortgage |
| Less than $10,000 | 221 (3.9%) | 301 (2.8%) |
| $10,000 to $24,999 | 532 (9.5%) | 191 (1.8%) |
| $25,000 to $34,999 | 367 (6.5%) | 219 (2.1%) |
| $35,000 to $49,999 | 598 (10.7%) | 173 (1.6%) |
| $50,000 to $74,999 | 783 (14.0%) | 535 (5.0%) |
| $75,000 to $99,999 | 795 (14.2%) | 1,056 (10.0%) |
| $100,000 to $149,999 | 953 (17.0%) | 1,370 (12.9%) |
| $150,000 or more | 1,361 (24.3%) | 2,436 (23.0%) |
| Total | 5,610 (100.0%) | 10,611 (100.0%) |
Property Value to Household Income Ratio in Milford city balance
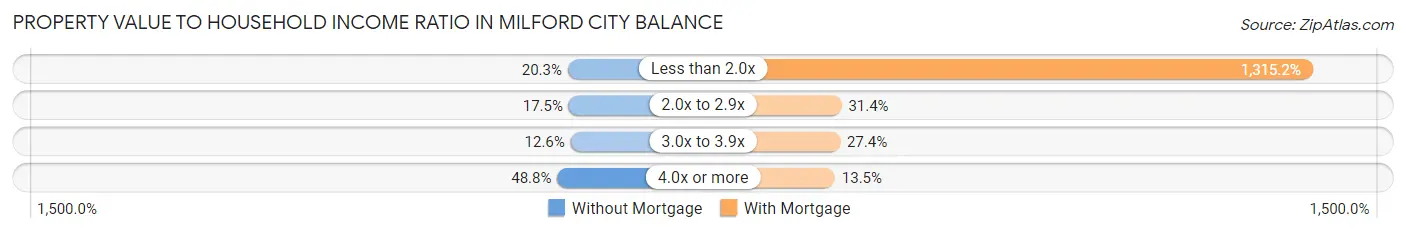
| Value-to-Income Ratio | Without Mortgage | With Mortgage |
| Less than 2.0x | 1,137 (20.3%) | 139,551 (1,315.2%) |
| 2.0x to 2.9x | 983 (17.5%) | 3,330 (31.4%) |
| 3.0x to 3.9x | 706 (12.6%) | 2,903 (27.4%) |
| 4.0x or more | 2,735 (48.7%) | 1,427 (13.5%) |
| Total | 5,610 (100.0%) | 10,611 (100.0%) |
Real Estate Taxes by Mortgage Status in Milford city balance
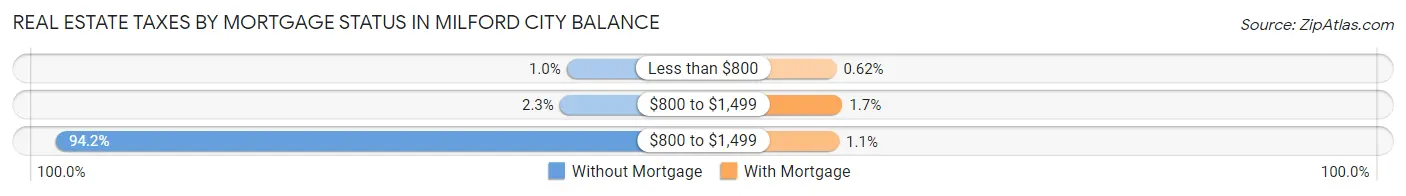
| Property Taxes | Without Mortgage | With Mortgage |
| Less than $800 | 57 (1.0%) | 66 (0.6%) |
| $800 to $1,499 | 128 (2.3%) | 181 (1.7%) |
| $800 to $1,499 | 5,287 (94.2%) | 119 (1.1%) |
| Total | 5,610 (100.0%) | 10,611 (100.0%) |
Health & Disability in Milford city balance
Health Insurance Coverage by Age in Milford city balance
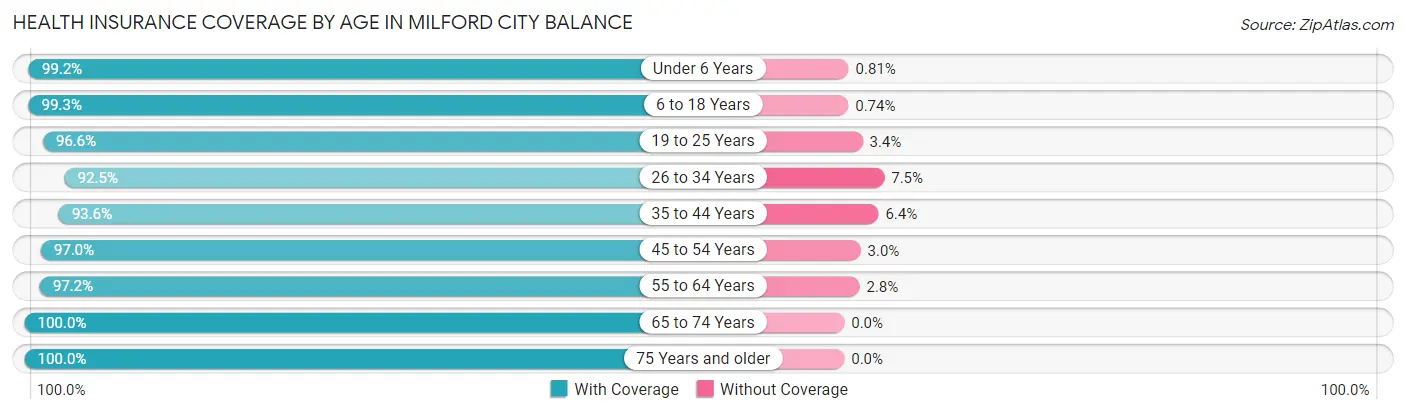
| Age Bracket | With Coverage | Without Coverage |
| Under 6 Years | 2,690 (99.2%) | 22 (0.8%) |
| 6 to 18 Years | 6,593 (99.3%) | 49 (0.7%) |
| 19 to 25 Years | 3,127 (96.6%) | 110 (3.4%) |
| 26 to 34 Years | 5,597 (92.5%) | 451 (7.5%) |
| 35 to 44 Years | 5,486 (93.6%) | 373 (6.4%) |
| 45 to 54 Years | 6,822 (97.0%) | 214 (3.0%) |
| 55 to 64 Years | 8,381 (97.2%) | 245 (2.8%) |
| 65 to 74 Years | 6,517 (100.0%) | 0 (0.0%) |
| 75 Years and older | 3,606 (100.0%) | 0 (0.0%) |
| Total | 48,819 (97.1%) | 1,464 (2.9%) |
Health Insurance Coverage by Citizenship Status in Milford city balance
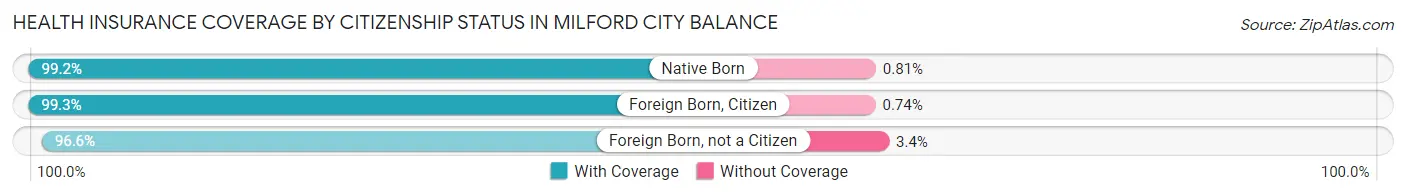
| Citizenship Status | With Coverage | Without Coverage |
| Native Born | 2,690 (99.2%) | 22 (0.8%) |
| Foreign Born, Citizen | 6,593 (99.3%) | 49 (0.7%) |
| Foreign Born, not a Citizen | 3,127 (96.6%) | 110 (3.4%) |
Health Insurance Coverage by Household Income in Milford city balance
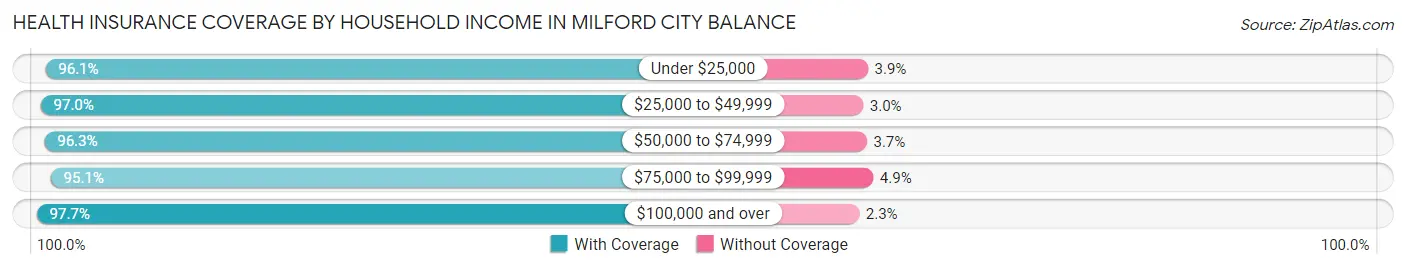
| Household Income | With Coverage | Without Coverage |
| Under $25,000 | 2,636 (96.1%) | 107 (3.9%) |
| $25,000 to $49,999 | 3,900 (97.0%) | 121 (3.0%) |
| $50,000 to $74,999 | 5,107 (96.3%) | 196 (3.7%) |
| $75,000 to $99,999 | 6,315 (95.1%) | 325 (4.9%) |
| $100,000 and over | 30,772 (97.7%) | 712 (2.3%) |
Public vs Private Health Insurance Coverage by Age in Milford city balance
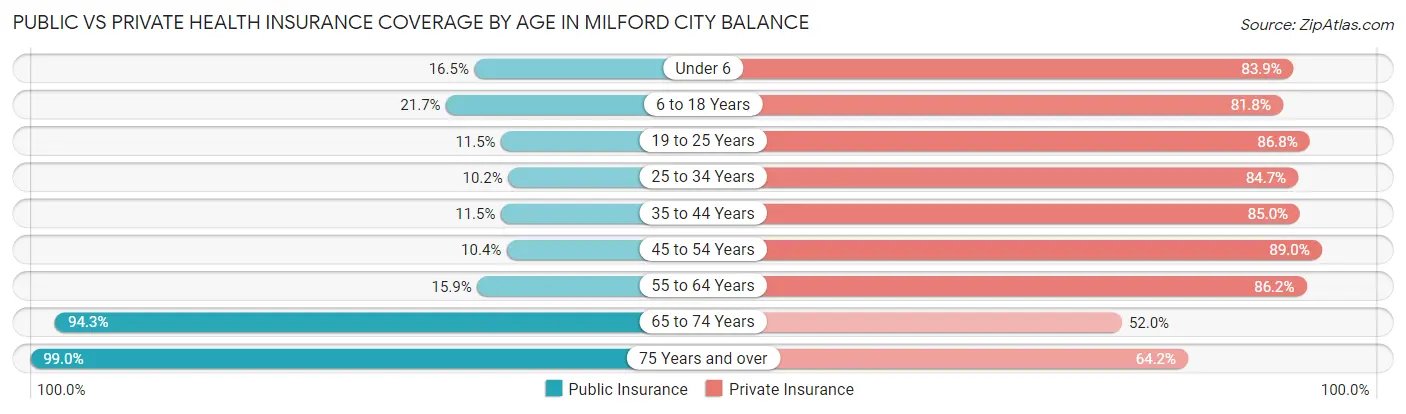
| Age Bracket | Public Insurance | Private Insurance |
| Under 6 | 446 (16.5%) | 2,274 (83.9%) |
| 6 to 18 Years | 1,442 (21.7%) | 5,436 (81.8%) |
| 19 to 25 Years | 372 (11.5%) | 2,810 (86.8%) |
| 25 to 34 Years | 615 (10.2%) | 5,120 (84.7%) |
| 35 to 44 Years | 675 (11.5%) | 4,982 (85.0%) |
| 45 to 54 Years | 734 (10.4%) | 6,265 (89.0%) |
| 55 to 64 Years | 1,373 (15.9%) | 7,437 (86.2%) |
| 65 to 74 Years | 6,148 (94.3%) | 3,389 (52.0%) |
| 75 Years and over | 3,568 (99.0%) | 2,316 (64.2%) |
| Total | 15,373 (30.6%) | 40,029 (79.6%) |
Disability Status by Sex by Age in Milford city balance
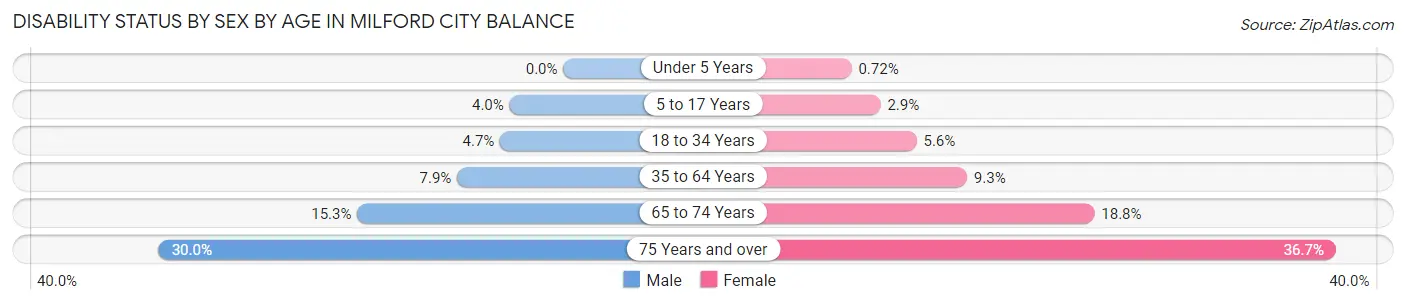
| Age Bracket | Male | Female |
| Under 5 Years | 0 (0.0%) | 7 (0.7%) |
| 5 to 17 Years | 144 (4.0%) | 83 (2.9%) |
| 18 to 34 Years | 221 (4.7%) | 291 (5.6%) |
| 35 to 64 Years | 830 (7.9%) | 1,021 (9.3%) |
| 65 to 74 Years | 434 (15.3%) | 690 (18.8%) |
| 75 Years and over | 432 (30.0%) | 795 (36.7%) |
Disability Class by Sex by Age in Milford city balance
Disability Class: Hearing Difficulty
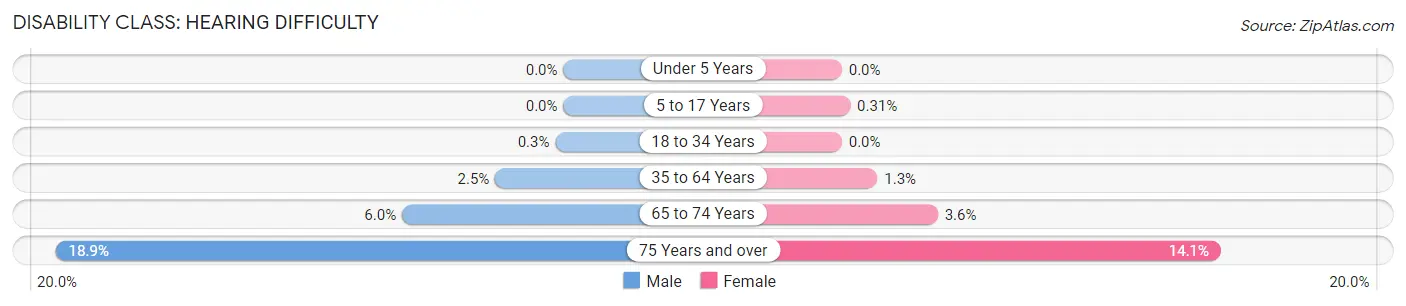
| Age Bracket | Male | Female |
| Under 5 Years | 0 (0.0%) | 0 (0.0%) |
| 5 to 17 Years | 0 (0.0%) | 9 (0.3%) |
| 18 to 34 Years | 14 (0.3%) | 0 (0.0%) |
| 35 to 64 Years | 267 (2.5%) | 145 (1.3%) |
| 65 to 74 Years | 170 (6.0%) | 131 (3.6%) |
| 75 Years and over | 271 (18.9%) | 305 (14.1%) |
Disability Class: Vision Difficulty
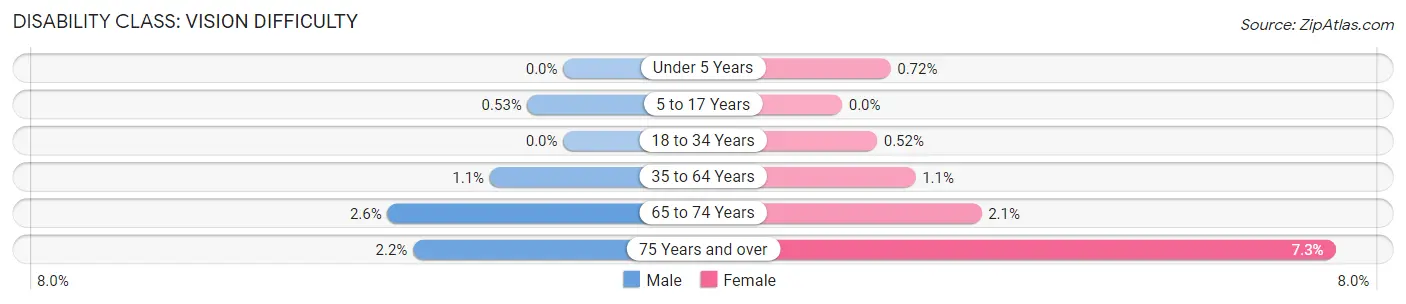
| Age Bracket | Male | Female |
| Under 5 Years | 0 (0.0%) | 7 (0.7%) |
| 5 to 17 Years | 19 (0.5%) | 0 (0.0%) |
| 18 to 34 Years | 0 (0.0%) | 27 (0.5%) |
| 35 to 64 Years | 115 (1.1%) | 120 (1.1%) |
| 65 to 74 Years | 74 (2.6%) | 76 (2.1%) |
| 75 Years and over | 32 (2.2%) | 159 (7.3%) |
Disability Class: Cognitive Difficulty
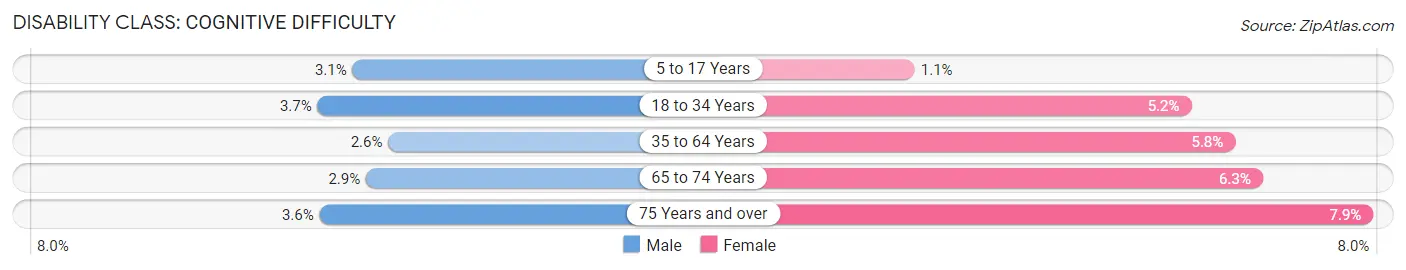
| Age Bracket | Male | Female |
| 5 to 17 Years | 113 (3.1%) | 31 (1.1%) |
| 18 to 34 Years | 172 (3.6%) | 272 (5.2%) |
| 35 to 64 Years | 274 (2.6%) | 642 (5.8%) |
| 65 to 74 Years | 83 (2.9%) | 230 (6.2%) |
| 75 Years and over | 52 (3.6%) | 171 (7.9%) |
Disability Class: Ambulatory Difficulty
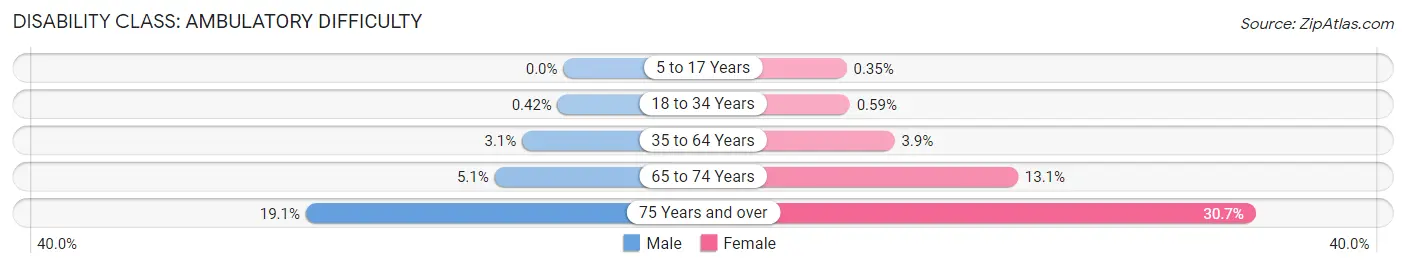
| Age Bracket | Male | Female |
| 5 to 17 Years | 0 (0.0%) | 10 (0.4%) |
| 18 to 34 Years | 20 (0.4%) | 31 (0.6%) |
| 35 to 64 Years | 322 (3.1%) | 430 (3.9%) |
| 65 to 74 Years | 145 (5.1%) | 481 (13.1%) |
| 75 Years and over | 275 (19.1%) | 666 (30.7%) |
Disability Class: Self-Care Difficulty
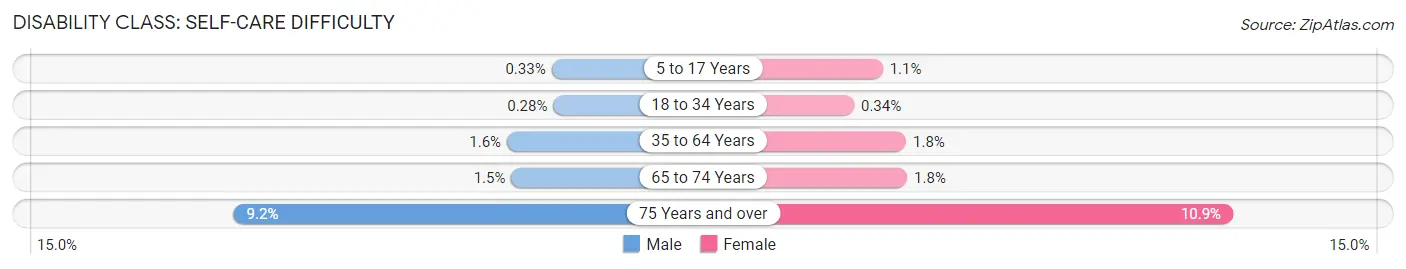
| Age Bracket | Male | Female |
| 5 to 17 Years | 12 (0.3%) | 33 (1.1%) |
| 18 to 34 Years | 13 (0.3%) | 18 (0.3%) |
| 35 to 64 Years | 165 (1.6%) | 197 (1.8%) |
| 65 to 74 Years | 41 (1.5%) | 67 (1.8%) |
| 75 Years and over | 132 (9.2%) | 236 (10.9%) |
Technology Access in Milford city balance
Computing Device Access in Milford city balance
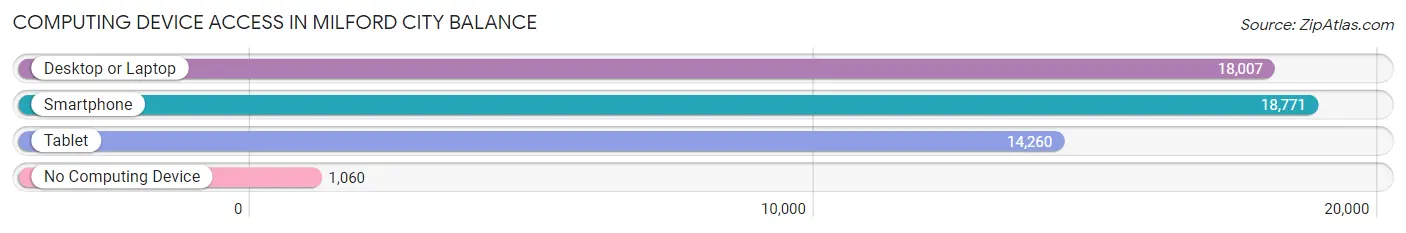
| Device Type | # Households | % Households |
| Desktop or Laptop | 18,007 | 85.1% |
| Smartphone | 18,771 | 88.7% |
| Tablet | 14,260 | 67.4% |
| No Computing Device | 1,060 | 5.0% |
| Total | 21,152 | 100.0% |
Internet Access in Milford city balance
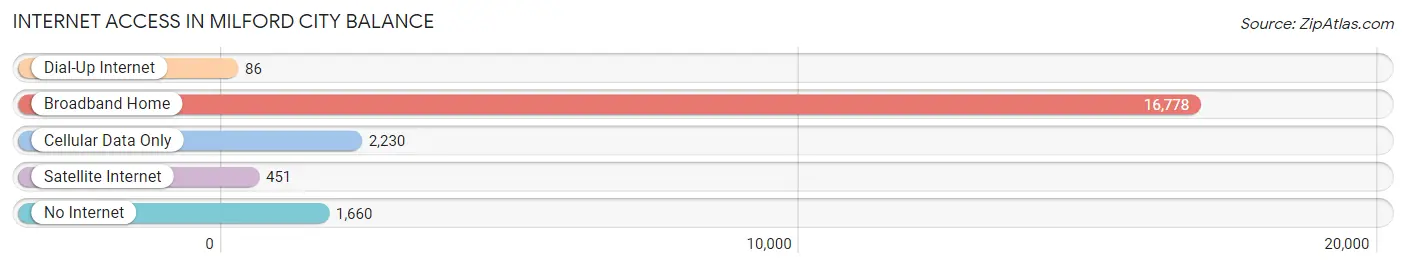
| Internet Type | # Households | % Households |
| Dial-Up Internet | 86 | 0.4% |
| Broadband Home | 16,778 | 79.3% |
| Cellular Data Only | 2,230 | 10.5% |
| Satellite Internet | 451 | 2.1% |
| No Internet | 1,660 | 7.9% |
| Total | 21,152 | 100.0% |
Milford city balance Summary
Milford City is a city located in the southwestern part of Connecticut, United States. It is situated in New Haven County and is part of the Bridgeport-Stamford-Norwalk Metropolitan Statistical Area. As of the 2010 census, the population of Milford City was estimated to be 52,759.
History
The area that is now Milford City was originally inhabited by the Paugusset Native American tribe. The first European settlers arrived in the area in 1639 and established the town of Milford. The town was named after the English town of Milford Haven in Wales. The town was incorporated in 1784 and was made a city in 1958.
Geography
Milford City is located at 41°12'N 73°3'W (41.20, -73.05). It has a total area of 16.3 square miles, of which 15.9 square miles is land and 0.4 square miles is water. The city is bordered by the towns of Orange, West Haven, Stratford, and Woodbridge.
Economy
Milford City has a diverse economy that is driven by a variety of industries. The city is home to several large employers, including Sikorsky Aircraft, Milford Hospital, and the Milford Public Schools. The city also has a thriving retail sector, with several shopping centers and malls located in the city.
Demographics
As of the 2010 census, the population of Milford City was estimated to be 52,759. The racial makeup of the city was 87.2% White, 5.3% African American, 0.4% Native American, 3.2% Asian, 0.1% Pacific Islander, and 3.8% from other races. The median household income was $68,845 and the median family income was $80,890.
Conclusion
Milford City is a vibrant city located in the southwestern part of Connecticut. It has a rich history and a diverse economy that is driven by a variety of industries. The city has a population of 52,759 and a median household income of $68,845. Milford City is a great place to live, work, and play.
Common Questions
What is Per Capita Income in Milford city balance?
Per Capita income in Milford city balance is $59,735.
What is the Median Family Income in Milford city balance?
Median Family Income in Milford city balance is $134,721.
What is the Median Household income in Milford city balance?
Median Household Income in Milford city balance is $104,503.
What is Income or Wage Gap in Milford city balance?
Income or Wage Gap in Milford city balance is 20.3%.
Women in Milford city balance earn 79.7 cents for every dollar earned by a man.
What is Family Income Deficit in Milford city balance?
Family Income Deficit in Milford city balance is $10,689.
Families that are below poverty line in Milford city balance earn $10,689 less on average than the poverty threshold level.
What is Inequality or Gini Index in Milford city balance?
Inequality or Gini Index in Milford city balance is 0.45.
What is the Total Population of Milford city balance?
Total Population of Milford city balance is 50,664.
What is the Total Male Population of Milford city balance?
Total Male Population of Milford city balance is 24,502.
What is the Total Female Population of Milford city balance?
Total Female Population of Milford city balance is 26,162.
What is the Ratio of Males per 100 Females in Milford city balance?
There are 93.65 Males per 100 Females in Milford city balance.
What is the Ratio of Females per 100 Males in Milford city balance?
There are 106.77 Females per 100 Males in Milford city balance.
What is the Median Population Age in Milford city balance?
Median Population Age in Milford city balance is 46.6 Years.
What is the Average Family Size in Milford city balance
Average Family Size in Milford city balance is 3.0 People.
What is the Average Household Size in Milford city balance
Average Household Size in Milford city balance is 2.4 People.
How Large is the Labor Force in Milford city balance?
There are 29,331 People in the Labor Forcein in Milford city balance.
What is the Percentage of People in the Labor Force in Milford city balance?
67.4% of People are in the Labor Force in Milford city balance.
What is the Unemployment Rate in Milford city balance?
Unemployment Rate in Milford city balance is 4.3%.