North Grosvenor Dale, CT Map & Demographics
North Grosvenor Dale Map
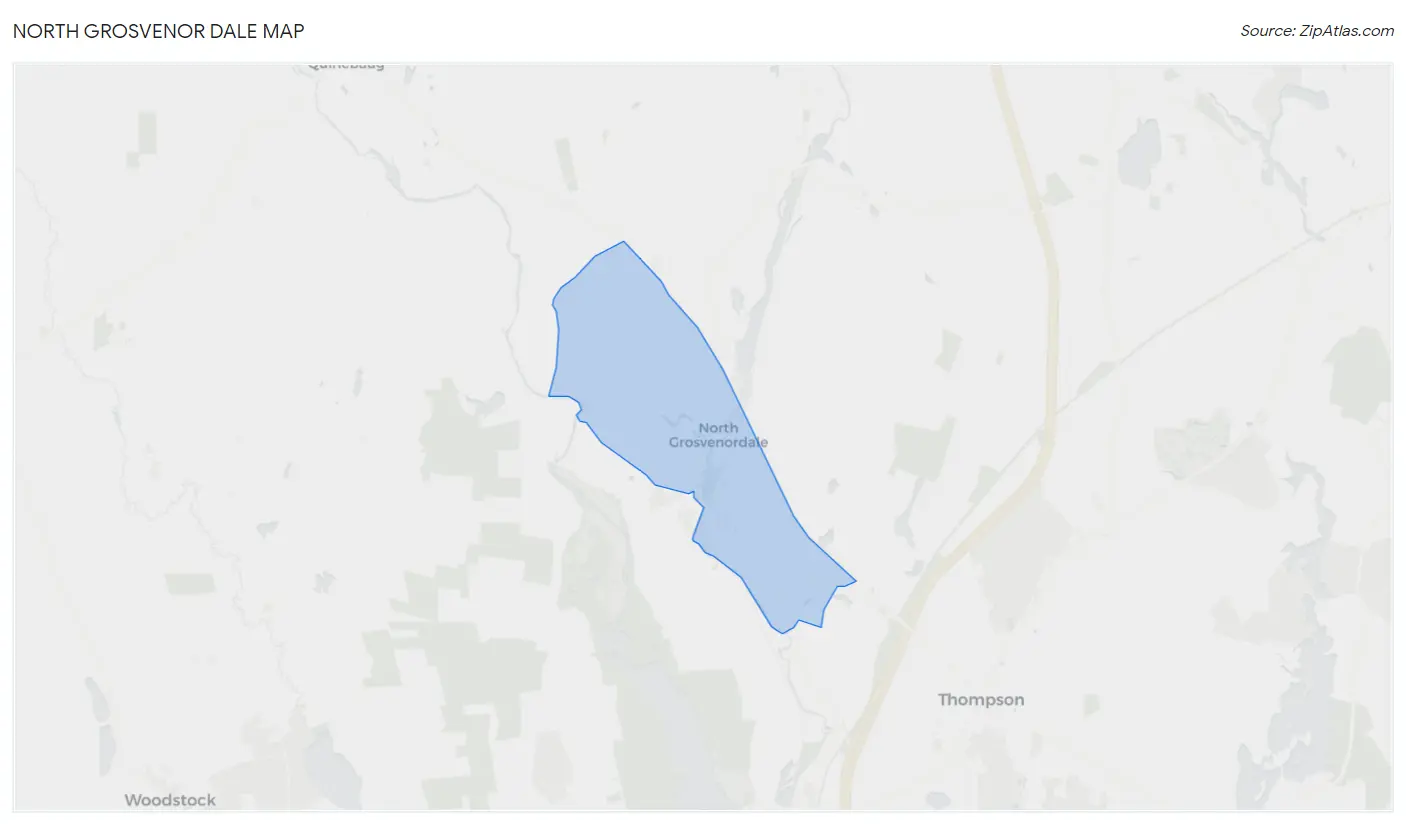
North Grosvenor Dale Overview
$34,770
PER CAPITA INCOME
$86,780
AVG FAMILY INCOME
$85,982
AVG HOUSEHOLD INCOME
6.4%
WAGE / INCOME GAP [ % ]
93.6¢/ $1
WAGE / INCOME GAP [ $ ]
0.36
INEQUALITY / GINI INDEX
1,281
TOTAL POPULATION
687
MALE POPULATION
594
FEMALE POPULATION
115.66
MALES / 100 FEMALES
86.46
FEMALES / 100 MALES
34.4
MEDIAN AGE
2.6
AVG FAMILY SIZE
2.2
AVG HOUSEHOLD SIZE
647
LABOR FORCE [ PEOPLE ]
61.7%
PERCENT IN LABOR FORCE
11.3%
UNEMPLOYMENT RATE
Income in North Grosvenor Dale
Income Overview in North Grosvenor Dale
Per Capita Income in North Grosvenor Dale is $34,770, while median incomes of families and households are $86,780 and $85,982 respectively.
| Characteristic | Number | Measure |
| Per Capita Income | 1,281 | $34,770 |
| Median Family Income | 394 | $86,780 |
| Mean Family Income | 394 | $84,889 |
| Median Household Income | 585 | $85,982 |
| Mean Household Income | 585 | $83,514 |
| Income Deficit | 394 | $0 |
| Wage / Income Gap (%) | 1,281 | 6.41% |
| Wage / Income Gap ($) | 1,281 | 93.59¢ per $1 |
| Gini / Inequality Index | 1,281 | 0.36 |
Earnings by Sex in North Grosvenor Dale
Average Earnings in North Grosvenor Dale are $56,170, $57,367 for men and $53,692 for women, a difference of 6.4%.
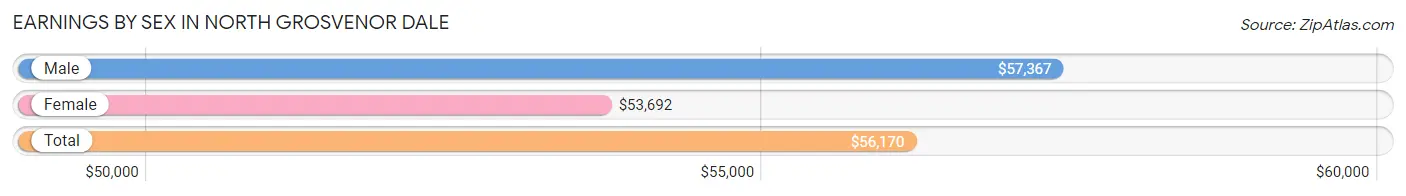
| Sex | Number | Average Earnings |
| Male | 295 (46.2%) | $57,367 |
| Female | 343 (53.8%) | $53,692 |
| Total | 638 (100.0%) | $56,170 |
Earnings by Sex by Income Bracket in North Grosvenor Dale
The most common earnings brackets in North Grosvenor Dale are $55,000 to $64,999 for men (100 | 33.9%) and $2,500 to $4,999 for women (69 | 20.1%).
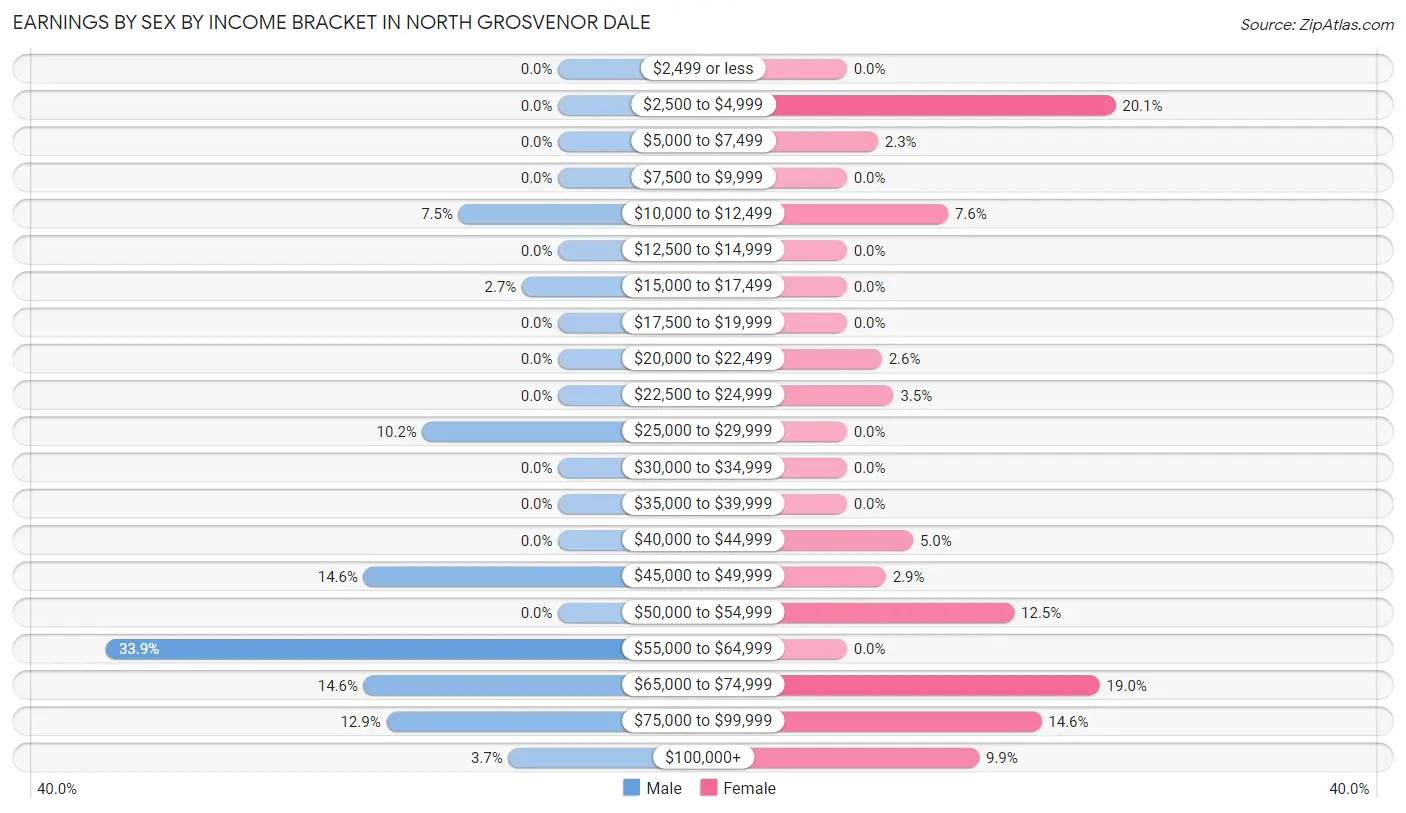
| Income | Male | Female |
| $2,499 or less | 0 (0.0%) | 0 (0.0%) |
| $2,500 to $4,999 | 0 (0.0%) | 69 (20.1%) |
| $5,000 to $7,499 | 0 (0.0%) | 8 (2.3%) |
| $7,500 to $9,999 | 0 (0.0%) | 0 (0.0%) |
| $10,000 to $12,499 | 22 (7.5%) | 26 (7.6%) |
| $12,500 to $14,999 | 0 (0.0%) | 0 (0.0%) |
| $15,000 to $17,499 | 8 (2.7%) | 0 (0.0%) |
| $17,500 to $19,999 | 0 (0.0%) | 0 (0.0%) |
| $20,000 to $22,499 | 0 (0.0%) | 9 (2.6%) |
| $22,500 to $24,999 | 0 (0.0%) | 12 (3.5%) |
| $25,000 to $29,999 | 30 (10.2%) | 0 (0.0%) |
| $30,000 to $34,999 | 0 (0.0%) | 0 (0.0%) |
| $35,000 to $39,999 | 0 (0.0%) | 0 (0.0%) |
| $40,000 to $44,999 | 0 (0.0%) | 17 (5.0%) |
| $45,000 to $49,999 | 43 (14.6%) | 10 (2.9%) |
| $50,000 to $54,999 | 0 (0.0%) | 43 (12.5%) |
| $55,000 to $64,999 | 100 (33.9%) | 0 (0.0%) |
| $65,000 to $74,999 | 43 (14.6%) | 65 (19.0%) |
| $75,000 to $99,999 | 38 (12.9%) | 50 (14.6%) |
| $100,000+ | 11 (3.7%) | 34 (9.9%) |
| Total | 295 (100.0%) | 343 (100.0%) |
Earnings by Sex by Educational Attainment in North Grosvenor Dale
Average earnings in North Grosvenor Dale are $62,763 for men and $68,750 for women, a difference of 8.7%. Men with an educational attainment of high school diploma enjoy the highest average annual earnings of $67,132, while those with college or associate's degree education earn the least with $47,560. Women with an educational attainment of graduate degree earn the most with the average annual earnings of $85,722, while those with high school diploma education have the smallest earnings of $54,593.
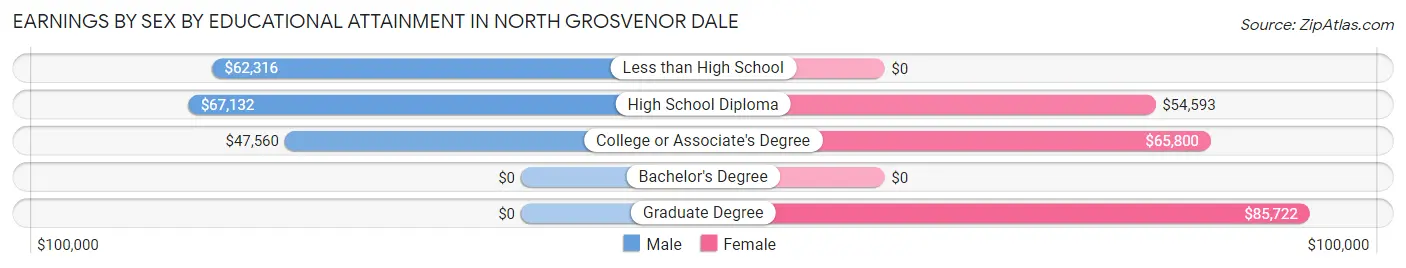
| Educational Attainment | Male Income | Female Income |
| Less than High School | $62,316 | $0 |
| High School Diploma | $67,132 | $54,593 |
| College or Associate's Degree | $47,560 | $65,800 |
| Bachelor's Degree | - | - |
| Graduate Degree | - | - |
| Total | $62,763 | $68,750 |
Family Income in North Grosvenor Dale
Family Income Brackets in North Grosvenor Dale
According to the North Grosvenor Dale family income data, there are 118 families falling into the $75,000 to $99,999 income range, which is the most common income bracket and makes up 29.9% of all families.
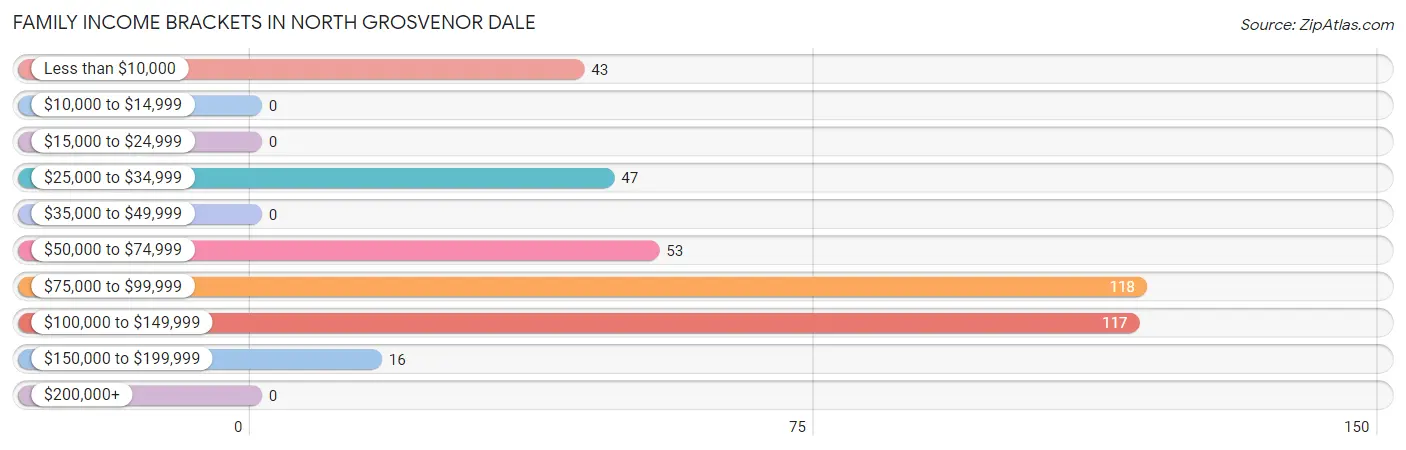
| Income Bracket | # Families | % Families |
| Less than $10,000 | 43 | 10.9% |
| $10,000 to $14,999 | 0 | 0.0% |
| $15,000 to $24,999 | 0 | 0.0% |
| $25,000 to $34,999 | 47 | 11.9% |
| $35,000 to $49,999 | 0 | 0.0% |
| $50,000 to $74,999 | 53 | 13.5% |
| $75,000 to $99,999 | 118 | 29.9% |
| $100,000 to $149,999 | 117 | 29.7% |
| $150,000 to $199,999 | 16 | 4.1% |
| $200,000+ | 0 | 0.0% |
Family Income by Famaliy Size in North Grosvenor Dale
3-person families (160 | 40.6%) account for the highest median family income in North Grosvenor Dale with $96,436 per family, while 2-person families (162 | 41.1%) have the highest median income of $42,670 per family member.
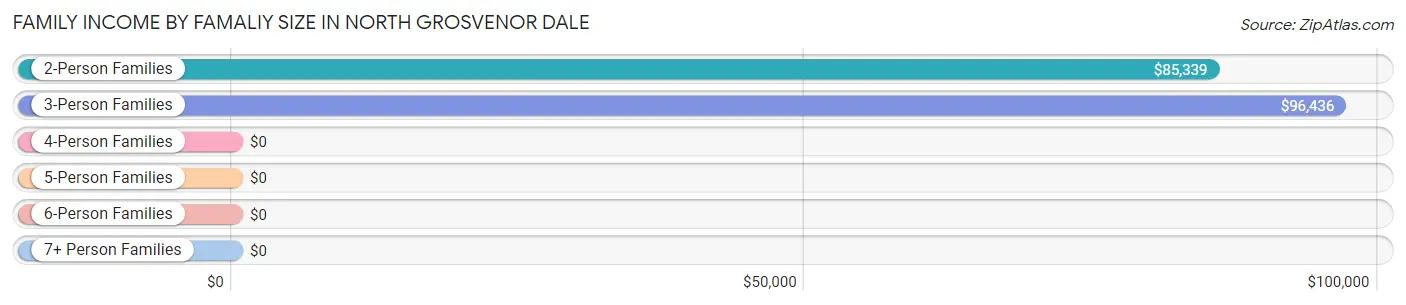
| Income Bracket | # Families | Median Income |
| 2-Person Families | 162 (41.1%) | $85,339 |
| 3-Person Families | 160 (40.6%) | $96,436 |
| 4-Person Families | 72 (18.3%) | $0 |
| 5-Person Families | 0 (0.0%) | $0 |
| 6-Person Families | 0 (0.0%) | $0 |
| 7+ Person Families | 0 (0.0%) | $0 |
| Total | 394 (100.0%) | $86,780 |
Family Income by Number of Earners in North Grosvenor Dale
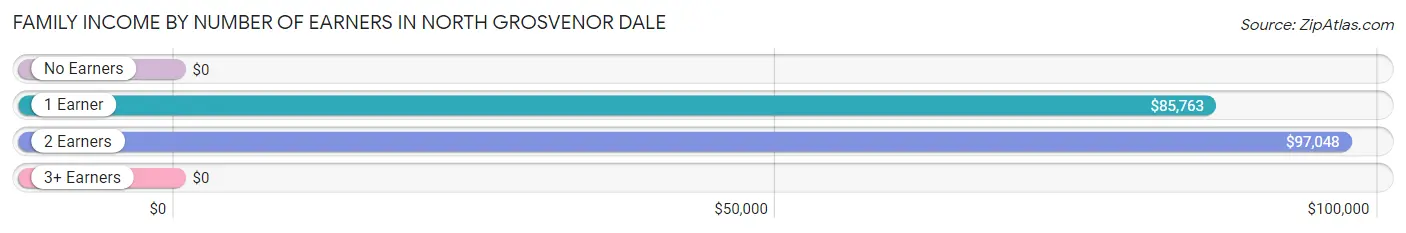
| Number of Earners | # Families | Median Income |
| No Earners | 73 (18.5%) | $0 |
| 1 Earner | 142 (36.0%) | $85,763 |
| 2 Earners | 135 (34.3%) | $97,048 |
| 3+ Earners | 44 (11.2%) | $0 |
| Total | 394 (100.0%) | $86,780 |
Household Income in North Grosvenor Dale
Household Income Brackets in North Grosvenor Dale
With 157 households falling in the category, the $100,000 to $149,999 income range is the most frequent in North Grosvenor Dale, accounting for 26.8% of all households.
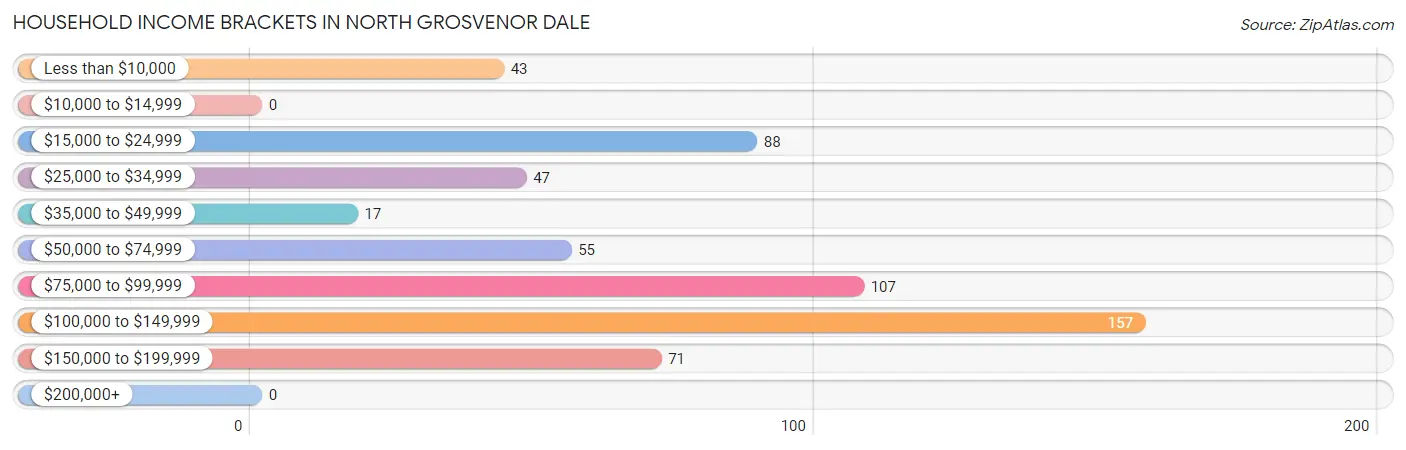
| Income Bracket | # Households | % Households |
| Less than $10,000 | 43 | 7.4% |
| $10,000 to $14,999 | 0 | 0.0% |
| $15,000 to $24,999 | 88 | 15.0% |
| $25,000 to $34,999 | 47 | 8.0% |
| $35,000 to $49,999 | 17 | 2.9% |
| $50,000 to $74,999 | 55 | 9.4% |
| $75,000 to $99,999 | 107 | 18.3% |
| $100,000 to $149,999 | 157 | 26.8% |
| $150,000 to $199,999 | 71 | 12.1% |
| $200,000+ | 0 | 0.0% |
Household Income by Householder Age in North Grosvenor Dale
The median household income in North Grosvenor Dale is $85,982, with the highest median household income of $122,813 found in the 65+ years age bracket for the primary householder. A total of 79 households (13.5%) fall into this category. Meanwhile, the 15 to 24 years age bracket for the primary householder has the lowest median household income of $0, with 47 households (8.0%) in this group.
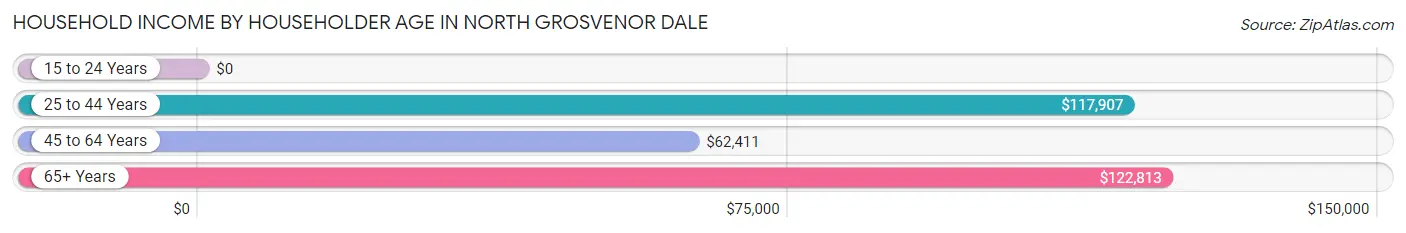
| Income Bracket | # Households | Median Income |
| 15 to 24 Years | 47 (8.0%) | $0 |
| 25 to 44 Years | 162 (27.7%) | $117,907 |
| 45 to 64 Years | 297 (50.8%) | $62,411 |
| 65+ Years | 79 (13.5%) | $122,813 |
| Total | 585 (100.0%) | $85,982 |
Poverty in North Grosvenor Dale
Income Below Poverty by Sex and Age in North Grosvenor Dale
With 13.0% poverty level for males and 5.9% for females among the residents of North Grosvenor Dale, 6 to 11 year old males and 25 to 34 year old females are the most vulnerable to poverty, with 37 males (50.7%) and 35 females (20.2%) in their respective age groups living below the poverty level.
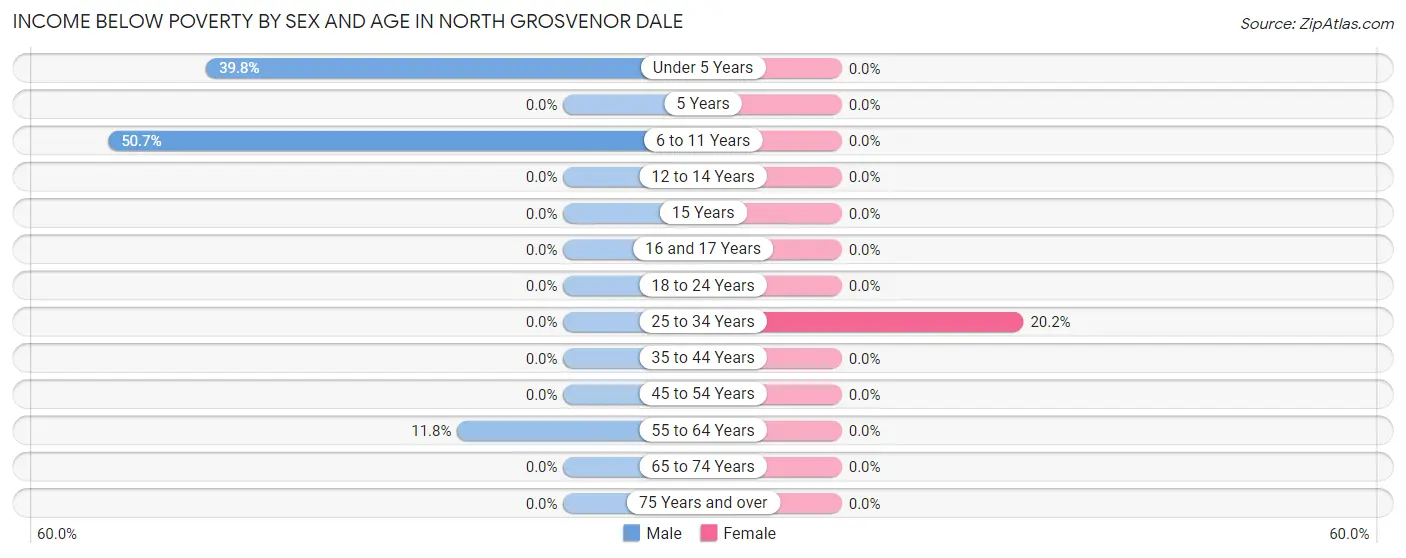
| Age Bracket | Male | Female |
| Under 5 Years | 37 (39.8%) | 0 (0.0%) |
| 5 Years | 0 (0.0%) | 0 (0.0%) |
| 6 to 11 Years | 37 (50.7%) | 0 (0.0%) |
| 12 to 14 Years | 0 (0.0%) | 0 (0.0%) |
| 15 Years | 0 (0.0%) | 0 (0.0%) |
| 16 and 17 Years | 0 (0.0%) | 0 (0.0%) |
| 18 to 24 Years | 0 (0.0%) | 0 (0.0%) |
| 25 to 34 Years | 0 (0.0%) | 35 (20.2%) |
| 35 to 44 Years | 0 (0.0%) | 0 (0.0%) |
| 45 to 54 Years | 0 (0.0%) | 0 (0.0%) |
| 55 to 64 Years | 15 (11.8%) | 0 (0.0%) |
| 65 to 74 Years | 0 (0.0%) | 0 (0.0%) |
| 75 Years and over | 0 (0.0%) | 0 (0.0%) |
| Total | 89 (13.0%) | 35 (5.9%) |
Income Above Poverty by Sex and Age in North Grosvenor Dale
According to the poverty statistics in North Grosvenor Dale, males aged 16 and 17 years and females aged under 5 years are the age groups that are most secure financially, with 100.0% of males and 100.0% of females in these age groups living above the poverty line.
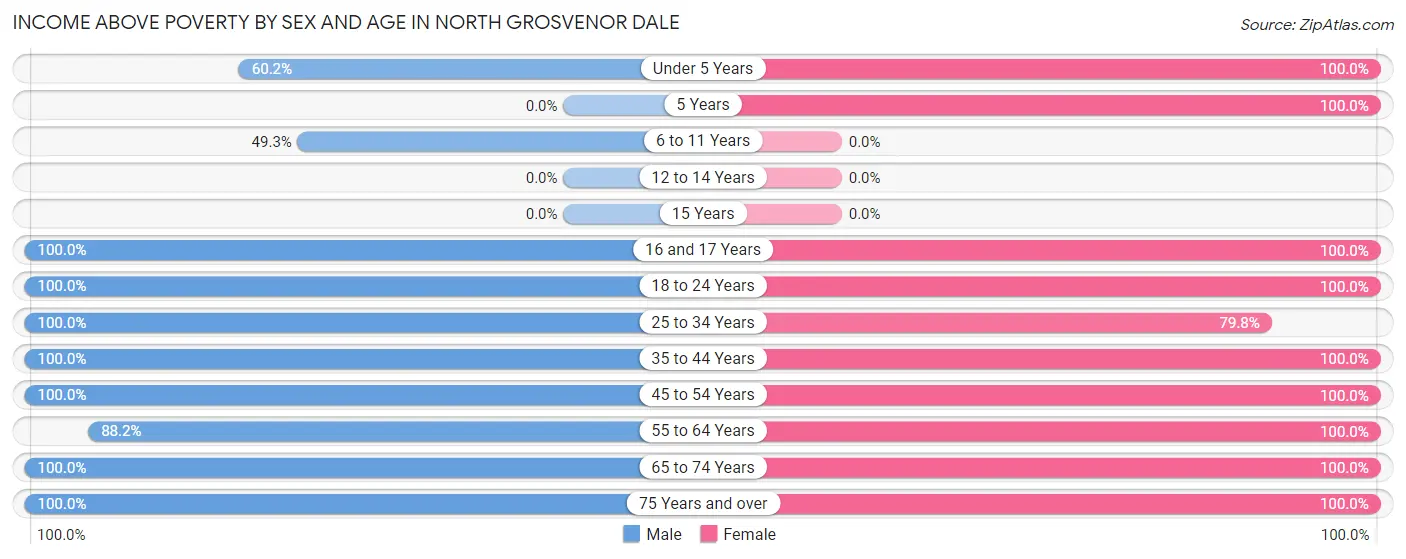
| Age Bracket | Male | Female |
| Under 5 Years | 56 (60.2%) | 50 (100.0%) |
| 5 Years | 0 (0.0%) | 16 (100.0%) |
| 6 to 11 Years | 36 (49.3%) | 0 (0.0%) |
| 12 to 14 Years | 0 (0.0%) | 0 (0.0%) |
| 15 Years | 0 (0.0%) | 0 (0.0%) |
| 16 and 17 Years | 42 (100.0%) | 33 (100.0%) |
| 18 to 24 Years | 117 (100.0%) | 67 (100.0%) |
| 25 to 34 Years | 21 (100.0%) | 138 (79.8%) |
| 35 to 44 Years | 85 (100.0%) | 8 (100.0%) |
| 45 to 54 Years | 54 (100.0%) | 96 (100.0%) |
| 55 to 64 Years | 112 (88.2%) | 97 (100.0%) |
| 65 to 74 Years | 35 (100.0%) | 39 (100.0%) |
| 75 Years and over | 40 (100.0%) | 15 (100.0%) |
| Total | 598 (87.1%) | 559 (94.1%) |
Income Below Poverty Among Married-Couple Families in North Grosvenor Dale
The poverty statistics for married-couple families in North Grosvenor Dale show that 6.0% or 8 of the total 134 families live below the poverty line. Families with no children have the highest poverty rate of 10.4%, comprising of 8 families. On the other hand, families with 1 or 2 children have the lowest poverty rate of 0.0%, which includes 0 families.
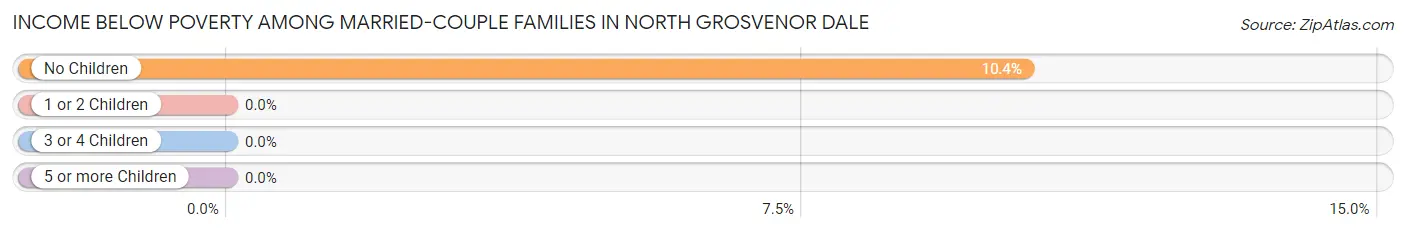
| Children | Above Poverty | Below Poverty |
| No Children | 69 (89.6%) | 8 (10.4%) |
| 1 or 2 Children | 57 (100.0%) | 0 (0.0%) |
| 3 or 4 Children | 0 (0.0%) | 0 (0.0%) |
| 5 or more Children | 0 (0.0%) | 0 (0.0%) |
| Total | 126 (94.0%) | 8 (6.0%) |
Income Below Poverty Among Single-Parent Households in North Grosvenor Dale
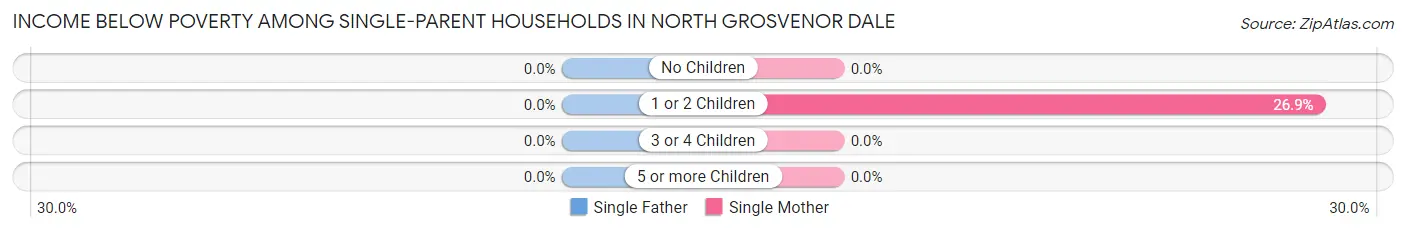
| Children | Single Father | Single Mother |
| No Children | 0 (0.0%) | 0 (0.0%) |
| 1 or 2 Children | 0 (0.0%) | 35 (26.9%) |
| 3 or 4 Children | 0 (0.0%) | 0 (0.0%) |
| 5 or more Children | 0 (0.0%) | 0 (0.0%) |
| Total | 0 (0.0%) | 35 (18.2%) |
Income Below Poverty Among Married-Couple vs Single-Parent Households in North Grosvenor Dale
The poverty data for North Grosvenor Dale shows that 8 of the married-couple family households (6.0%) and 35 of the single-parent households (13.5%) are living below the poverty level. Within the married-couple family households, those with no children have the highest poverty rate, with 8 households (10.4%) falling below the poverty line. Among the single-parent households, those with 1 or 2 children have the highest poverty rate, with 35 household (25.2%) living below poverty.
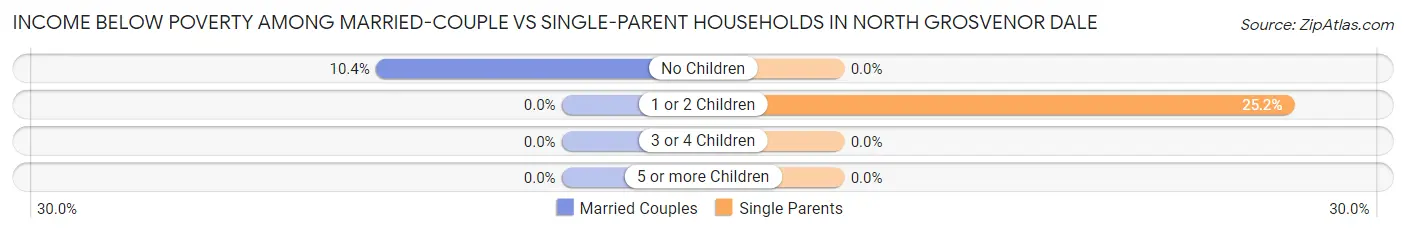
| Children | Married-Couple Families | Single-Parent Households |
| No Children | 8 (10.4%) | 0 (0.0%) |
| 1 or 2 Children | 0 (0.0%) | 35 (25.2%) |
| 3 or 4 Children | 0 (0.0%) | 0 (0.0%) |
| 5 or more Children | 0 (0.0%) | 0 (0.0%) |
| Total | 8 (6.0%) | 35 (13.5%) |
Race in North Grosvenor Dale
The most populous races in North Grosvenor Dale are White / Caucasian (1,281 | 100.0%), and Hispanic or Latino (87 | 6.8%).
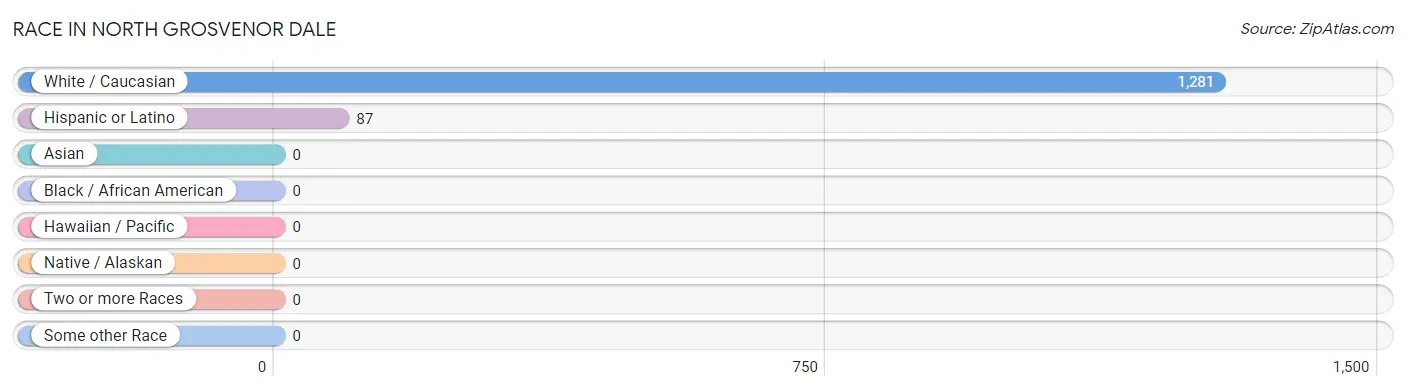
| Race | # Population | % Population |
| Asian | 0 | 0.0% |
| Black / African American | 0 | 0.0% |
| Hawaiian / Pacific | 0 | 0.0% |
| Hispanic or Latino | 87 | 6.8% |
| Native / Alaskan | 0 | 0.0% |
| White / Caucasian | 1,281 | 100.0% |
| Two or more Races | 0 | 0.0% |
| Some other Race | 0 | 0.0% |
| Total | 1,281 | 100.0% |
Ancestry in North Grosvenor Dale
The most populous ancestries reported in North Grosvenor Dale are French (468 | 36.5%), Irish (224 | 17.5%), Polish (166 | 13.0%), German (122 | 9.5%), and English (113 | 8.8%), together accounting for 85.3% of all North Grosvenor Dale residents.
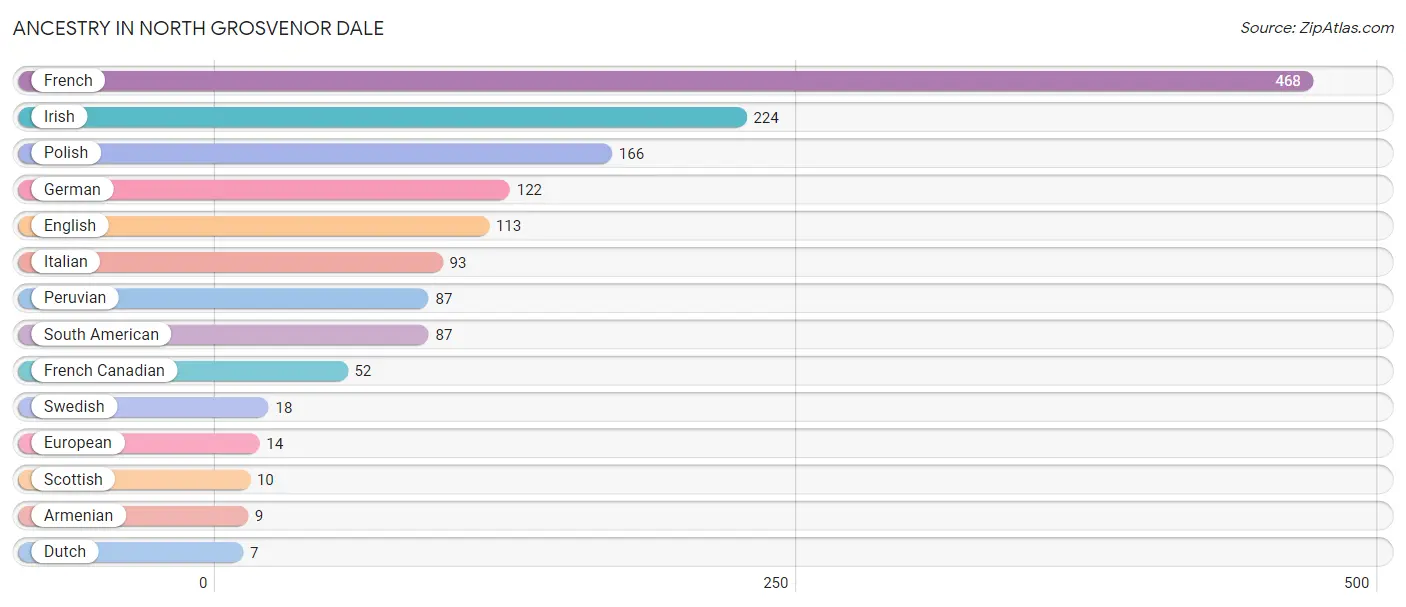
| Ancestry | # Population | % Population |
| Armenian | 9 | 0.7% |
| Dutch | 7 | 0.5% |
| English | 113 | 8.8% |
| European | 14 | 1.1% |
| French | 468 | 36.5% |
| French Canadian | 52 | 4.1% |
| German | 122 | 9.5% |
| Irish | 224 | 17.5% |
| Italian | 93 | 7.3% |
| Peruvian | 87 | 6.8% |
| Polish | 166 | 13.0% |
| Scottish | 10 | 0.8% |
| South American | 87 | 6.8% |
| Swedish | 18 | 1.4% | View All 14 Rows |
Immigrants in North Grosvenor Dale
The most numerous immigrant groups reported in North Grosvenor Dale came from , and Canada (54 | 4.2%), together accounting for 4.2% of all North Grosvenor Dale residents.

| Immigration Origin | # Population | % Population |
| Canada | 54 | 4.2% | View All 1 Rows |
Sex and Age in North Grosvenor Dale
Sex and Age in North Grosvenor Dale
The most populous age groups in North Grosvenor Dale are 15 to 19 Years (112 | 16.3%) for men and 30 to 34 Years (121 | 20.4%) for women.
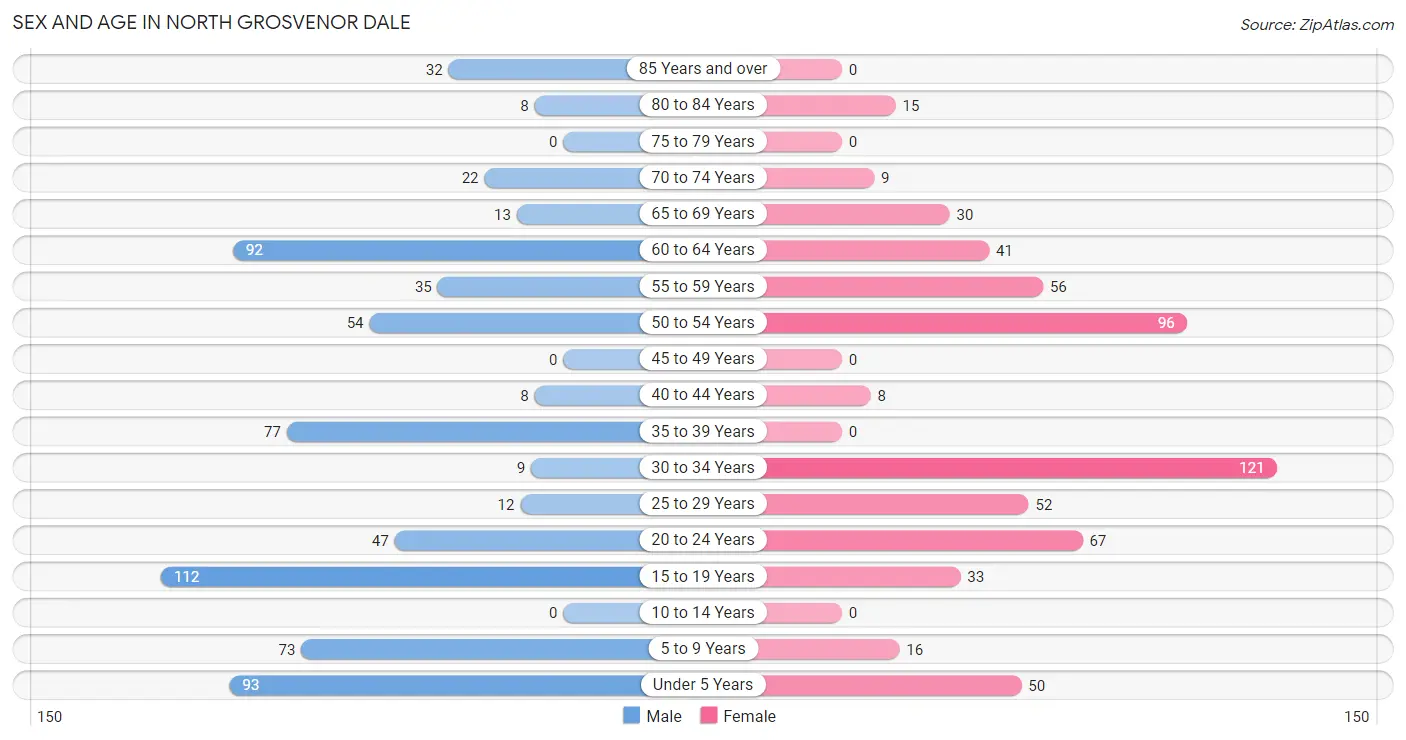
| Age Bracket | Male | Female |
| Under 5 Years | 93 (13.5%) | 50 (8.4%) |
| 5 to 9 Years | 73 (10.6%) | 16 (2.7%) |
| 10 to 14 Years | 0 (0.0%) | 0 (0.0%) |
| 15 to 19 Years | 112 (16.3%) | 33 (5.6%) |
| 20 to 24 Years | 47 (6.8%) | 67 (11.3%) |
| 25 to 29 Years | 12 (1.8%) | 52 (8.7%) |
| 30 to 34 Years | 9 (1.3%) | 121 (20.4%) |
| 35 to 39 Years | 77 (11.2%) | 0 (0.0%) |
| 40 to 44 Years | 8 (1.2%) | 8 (1.3%) |
| 45 to 49 Years | 0 (0.0%) | 0 (0.0%) |
| 50 to 54 Years | 54 (7.9%) | 96 (16.2%) |
| 55 to 59 Years | 35 (5.1%) | 56 (9.4%) |
| 60 to 64 Years | 92 (13.4%) | 41 (6.9%) |
| 65 to 69 Years | 13 (1.9%) | 30 (5.1%) |
| 70 to 74 Years | 22 (3.2%) | 9 (1.5%) |
| 75 to 79 Years | 0 (0.0%) | 0 (0.0%) |
| 80 to 84 Years | 8 (1.2%) | 15 (2.5%) |
| 85 Years and over | 32 (4.7%) | 0 (0.0%) |
| Total | 687 (100.0%) | 594 (100.0%) |
Families and Households in North Grosvenor Dale
Median Family Size in North Grosvenor Dale
The median family size in North Grosvenor Dale is 2.58 persons per family, with single female/mother families (192 | 48.7%) accounting for the largest median family size of 2.72 persons per family. On the other hand, single male/father families (68 | 17.3%) represent the smallest median family size with 2.16 persons per family.
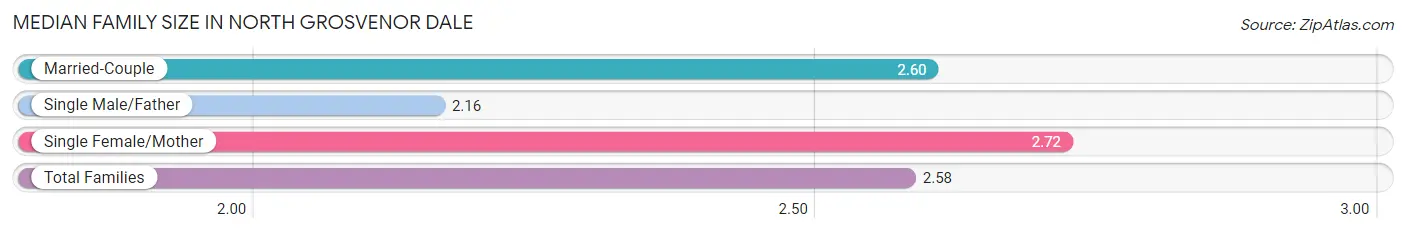
| Family Type | # Families | Family Size |
| Married-Couple | 134 (34.0%) | 2.60 |
| Single Male/Father | 68 (17.3%) | 2.16 |
| Single Female/Mother | 192 (48.7%) | 2.72 |
| Total Families | 394 (100.0%) | 2.58 |
Median Household Size in North Grosvenor Dale
The median household size in North Grosvenor Dale is 2.19 persons per household, with single female/mother households (192 | 32.8%) accounting for the largest median household size of 2.95 persons per household. non-family households (191 | 32.7%) represent the smallest median household size with 1.09 persons per household.
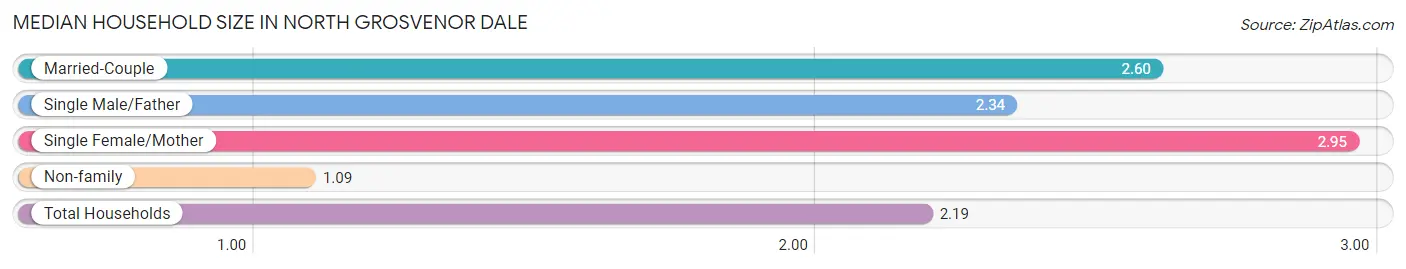
| Household Type | # Households | Household Size |
| Married-Couple | 134 (22.9%) | 2.60 |
| Single Male/Father | 68 (11.6%) | 2.34 |
| Single Female/Mother | 192 (32.8%) | 2.95 |
| Non-family | 191 (32.7%) | 1.09 |
| Total Households | 585 (100.0%) | 2.19 |
Household Size by Marriage Status in North Grosvenor Dale
Out of a total of 585 households in North Grosvenor Dale, 394 (67.3%) are family households, while 191 (32.7%) are nonfamily households. The most numerous type of family households are 3-person households, comprising 186, and the most common type of nonfamily households are 1-person households, comprising 161.
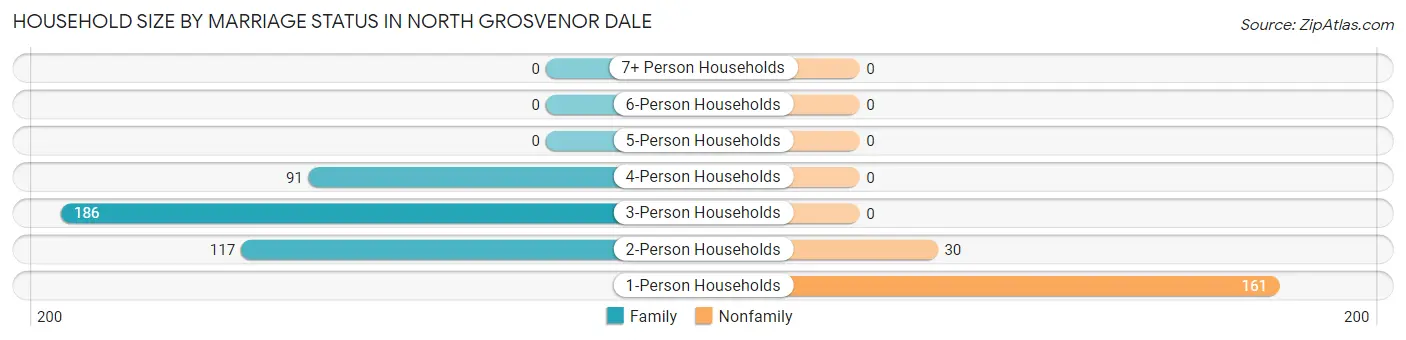
| Household Size | Family Households | Nonfamily Households |
| 1-Person Households | - | 161 (27.5%) |
| 2-Person Households | 117 (20.0%) | 30 (5.1%) |
| 3-Person Households | 186 (31.8%) | 0 (0.0%) |
| 4-Person Households | 91 (15.6%) | 0 (0.0%) |
| 5-Person Households | 0 (0.0%) | 0 (0.0%) |
| 6-Person Households | 0 (0.0%) | 0 (0.0%) |
| 7+ Person Households | 0 (0.0%) | 0 (0.0%) |
| Total | 394 (67.3%) | 191 (32.7%) |
Female Fertility in North Grosvenor Dale
Fertility by Age in North Grosvenor Dale
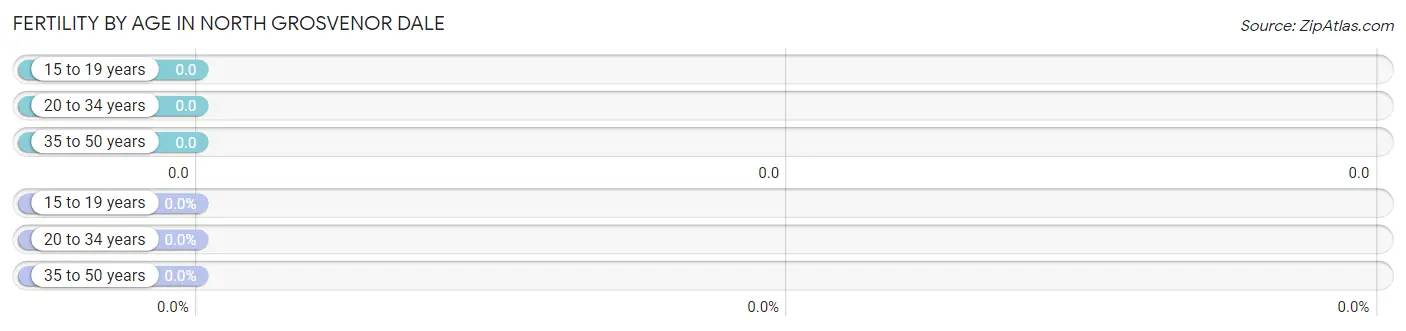
| Age Bracket | Women with Births | Births / 1,000 Women |
| 15 to 19 years | 0 (0.0%) | 0.0 |
| 20 to 34 years | 0 (0.0%) | 0.0 |
| 35 to 50 years | 0 (0.0%) | 0.0 |
| Total | 0 (0.0%) | 0.0 |
Fertility by Age by Marriage Status in North Grosvenor Dale
| Age Bracket | Married | Unmarried |
| 15 to 19 years | 0 (0.0%) | 0 (0.0%) |
| 20 to 34 years | 0 (0.0%) | 0 (0.0%) |
| 35 to 50 years | 0 (0.0%) | 0 (0.0%) |
| Total | 0 (0.0%) | 0 (0.0%) |
Fertility by Education in North Grosvenor Dale
| Educational Attainment | Women with Births | Births / 1,000 Women |
| Less than High School | 0 (0.0%) | 0.0 |
| High School Diploma | 0 (0.0%) | 0.0 |
| College or Associate's Degree | 0 (0.0%) | 0.0 |
| Bachelor's Degree | 0 (0.0%) | 0.0 |
| Graduate Degree | 0 (0.0%) | 0.0 |
| Total | 0 (0.0%) | 0.0 |
Fertility by Education by Marriage Status in North Grosvenor Dale
| Educational Attainment | Married | Unmarried |
| Less than High School | 0 (0.0%) | 0 (0.0%) |
| High School Diploma | 0 (0.0%) | 0 (0.0%) |
| College or Associate's Degree | 0 (0.0%) | 0 (0.0%) |
| Bachelor's Degree | 0 (0.0%) | 0 (0.0%) |
| Graduate Degree | 0 (0.0%) | 0 (0.0%) |
| Total | 0 (0.0%) | 0 (0.0%) |
Employment Characteristics in North Grosvenor Dale
Employment by Class of Employer in North Grosvenor Dale
Among the 525 employed individuals in North Grosvenor Dale, private company employees (361 | 68.8%), self-employed (incorporated) (89 | 17.0%), and federal government employees (44 | 8.4%) make up the most common classes of employment.
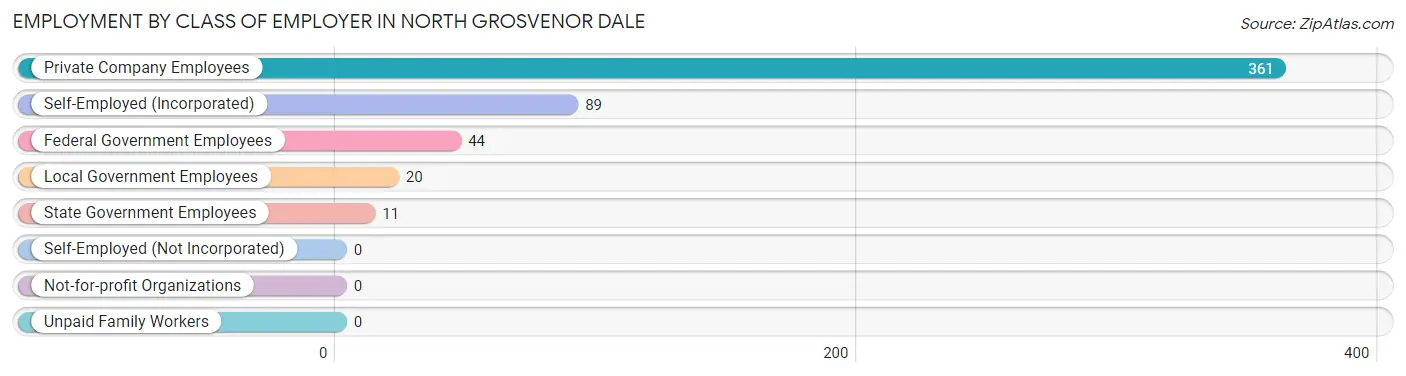
| Employer Class | # Employees | % Employees |
| Private Company Employees | 361 | 68.8% |
| Self-Employed (Incorporated) | 89 | 17.0% |
| Self-Employed (Not Incorporated) | 0 | 0.0% |
| Not-for-profit Organizations | 0 | 0.0% |
| Local Government Employees | 20 | 3.8% |
| State Government Employees | 11 | 2.1% |
| Federal Government Employees | 44 | 8.4% |
| Unpaid Family Workers | 0 | 0.0% |
| Total | 525 | 100.0% |
Employment Status by Age in North Grosvenor Dale
According to the labor force statistics for North Grosvenor Dale, out of the total population over 16 years of age (1,049), 61.7% or 647 individuals are in the labor force, with 11.3% or 73 of them unemployed. The age group with the highest labor force participation rate is 30 to 34 years, with 100.0% or 130 individuals in the labor force. Within the labor force, the 25 to 29 years age range has the highest percentage of unemployed individuals, with 62.5% or 35 of them being unemployed.
| Age Bracket | In Labor Force | Unemployed |
| 16 to 19 Years | 58 (40.0%) | 30 (51.7%) |
| 20 to 24 Years | 88 (77.2%) | 0 (0.0%) |
| 25 to 29 Years | 56 (87.5%) | 35 (62.5%) |
| 30 to 34 Years | 130 (100.0%) | 0 (0.0%) |
| 35 to 44 Years | 93 (100.0%) | 0 (0.0%) |
| 45 to 54 Years | 65 (43.3%) | 0 (0.0%) |
| 55 to 59 Years | 66 (72.5%) | 8 (12.1%) |
| 60 to 64 Years | 40 (30.1%) | 0 (0.0%) |
| 65 to 74 Years | 43 (58.1%) | 0 (0.0%) |
| 75 Years and over | 8 (14.5%) | 0 (0.0%) |
| Total | 647 (61.7%) | 73 (11.3%) |
Employment Status by Educational Attainment in North Grosvenor Dale
According to labor force statistics for North Grosvenor Dale, 68.1% of individuals (450) out of the total population between 25 and 64 years of age (661) are in the labor force, with 9.6% or 43 of them being unemployed. The group with the highest labor force participation rate are those with the educational attainment of bachelor's degree or higher, with 88.9% or 64 individuals in the labor force. Within the labor force, individuals with high school diploma education have the highest percentage of unemployment, with 26.1% or 43 of them being unemployed.
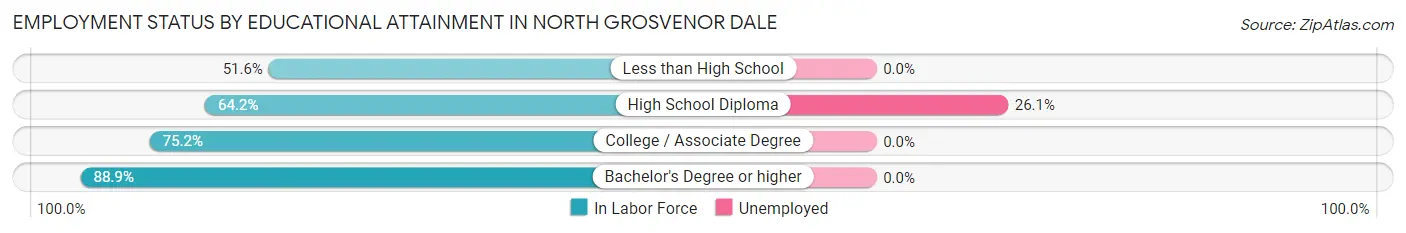
| Educational Attainment | In Labor Force | Unemployed |
| Less than High School | 63 (51.6%) | 0 (0.0%) |
| High School Diploma | 165 (64.2%) | 67 (26.1%) |
| College / Associate Degree | 158 (75.2%) | 0 (0.0%) |
| Bachelor's Degree or higher | 64 (88.9%) | 0 (0.0%) |
| Total | 450 (68.1%) | 63 (9.6%) |
Employment Occupations by Sex in North Grosvenor Dale
Management, Business, Science and Arts Occupations
The most common Management, Business, Science and Arts occupations in North Grosvenor Dale are Community & Social Service (45 | 7.8%), Education, Arts & Media (45 | 7.8%), Health Diagnosing & Treating (42 | 7.3%), Health Technologists (42 | 7.3%), and Management (34 | 5.9%).
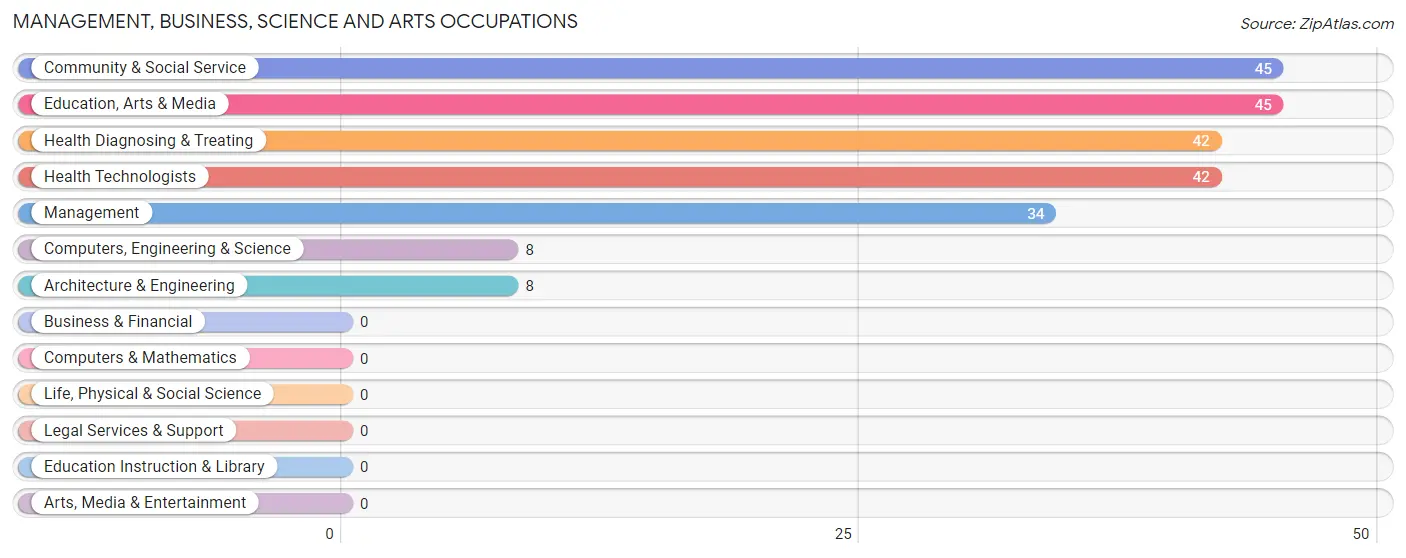
Management, Business, Science and Arts Occupations by Sex
Within the Management, Business, Science and Arts occupations in North Grosvenor Dale, the most male-oriented occupations are Computers, Engineering & Science (100.0%), and Architecture & Engineering (100.0%), while the most female-oriented occupations are Management (100.0%), Community & Social Service (100.0%), and Education, Arts & Media (100.0%).
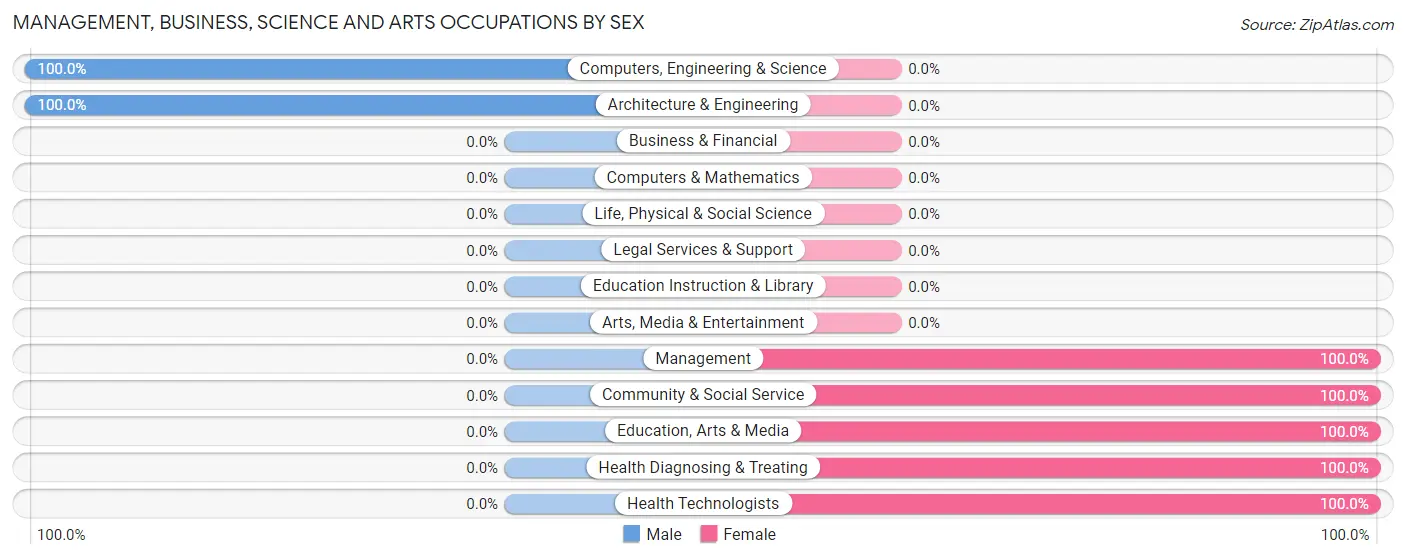
| Occupation | Male | Female |
| Management | 0 (0.0%) | 34 (100.0%) |
| Business & Financial | 0 (0.0%) | 0 (0.0%) |
| Computers, Engineering & Science | 8 (100.0%) | 0 (0.0%) |
| Computers & Mathematics | 0 (0.0%) | 0 (0.0%) |
| Architecture & Engineering | 8 (100.0%) | 0 (0.0%) |
| Life, Physical & Social Science | 0 (0.0%) | 0 (0.0%) |
| Community & Social Service | 0 (0.0%) | 45 (100.0%) |
| Education, Arts & Media | 0 (0.0%) | 45 (100.0%) |
| Legal Services & Support | 0 (0.0%) | 0 (0.0%) |
| Education Instruction & Library | 0 (0.0%) | 0 (0.0%) |
| Arts, Media & Entertainment | 0 (0.0%) | 0 (0.0%) |
| Health Diagnosing & Treating | 0 (0.0%) | 42 (100.0%) |
| Health Technologists | 0 (0.0%) | 42 (100.0%) |
| Total (Category) | 8 (6.2%) | 121 (93.8%) |
| Total (Overall) | 265 (46.2%) | 309 (53.8%) |
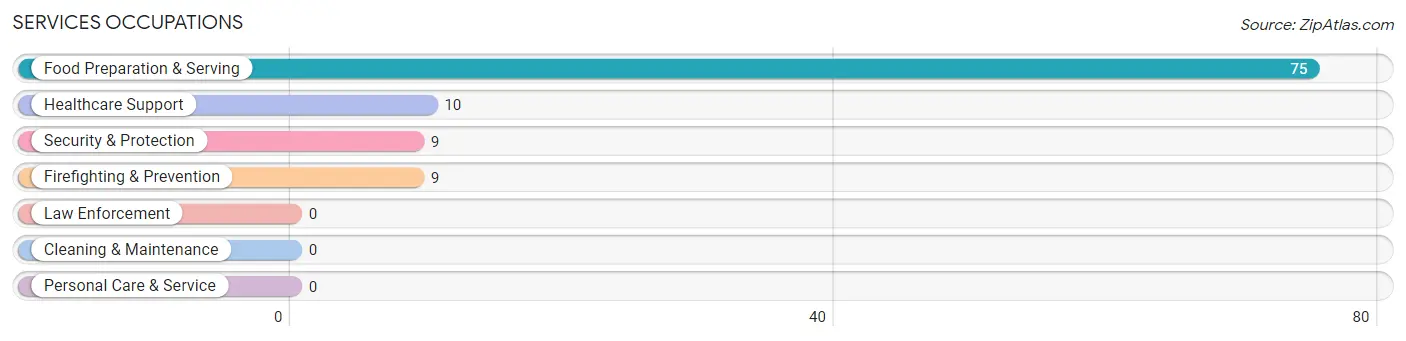
Services Occupations
The most common Services occupations in North Grosvenor Dale are Food Preparation & Serving (75 | 13.1%), Healthcare Support (10 | 1.7%), Security & Protection (9 | 1.6%), and Firefighting & Prevention (9 | 1.6%).
Services Occupations by Sex
Within the Services occupations in North Grosvenor Dale, the most male-oriented occupations are Security & Protection (100.0%), Firefighting & Prevention (100.0%), and Food Preparation & Serving (29.3%), while the most female-oriented occupations are Healthcare Support (100.0%), and Food Preparation & Serving (70.7%).
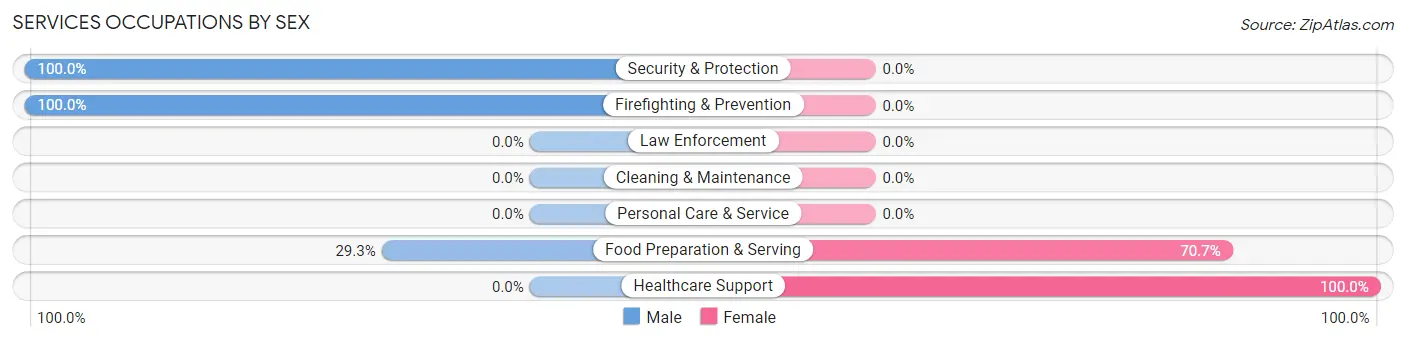
| Occupation | Male | Female |
| Healthcare Support | 0 (0.0%) | 10 (100.0%) |
| Security & Protection | 9 (100.0%) | 0 (0.0%) |
| Firefighting & Prevention | 9 (100.0%) | 0 (0.0%) |
| Law Enforcement | 0 (0.0%) | 0 (0.0%) |
| Food Preparation & Serving | 22 (29.3%) | 53 (70.7%) |
| Cleaning & Maintenance | 0 (0.0%) | 0 (0.0%) |
| Personal Care & Service | 0 (0.0%) | 0 (0.0%) |
| Total (Category) | 31 (33.0%) | 63 (67.0%) |
| Total (Overall) | 265 (46.2%) | 309 (53.8%) |
Sales and Office Occupations
The most common Sales and Office occupations in North Grosvenor Dale are Sales & Related (92 | 16.0%), and Office & Administration (67 | 11.7%).
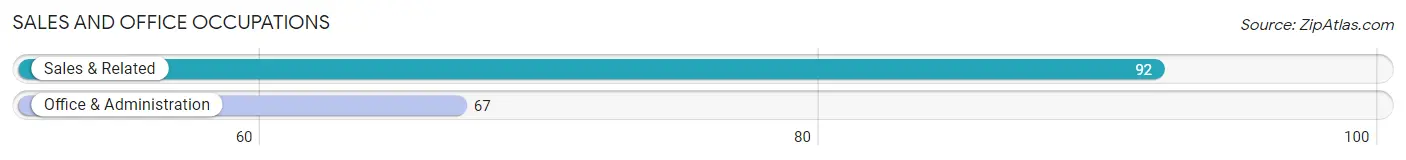
Sales and Office Occupations by Sex
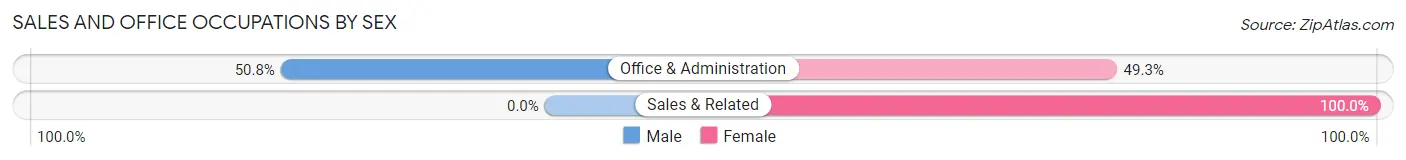
| Occupation | Male | Female |
| Sales & Related | 0 (0.0%) | 92 (100.0%) |
| Office & Administration | 34 (50.7%) | 33 (49.2%) |
| Total (Category) | 34 (21.4%) | 125 (78.6%) |
| Total (Overall) | 265 (46.2%) | 309 (53.8%) |
Natural Resources, Construction and Maintenance Occupations
The most common Natural Resources, Construction and Maintenance occupations in North Grosvenor Dale are Installation, Maintenance & Repair (70 | 12.2%), and Construction & Extraction (44 | 7.7%).
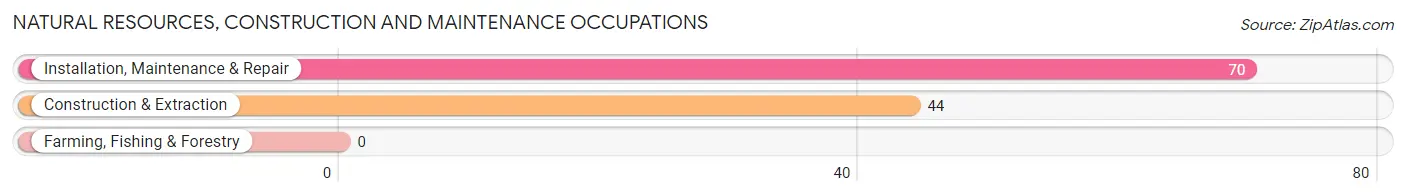
Natural Resources, Construction and Maintenance Occupations by Sex

| Occupation | Male | Female |
| Farming, Fishing & Forestry | 0 (0.0%) | 0 (0.0%) |
| Construction & Extraction | 44 (100.0%) | 0 (0.0%) |
| Installation, Maintenance & Repair | 70 (100.0%) | 0 (0.0%) |
| Total (Category) | 114 (100.0%) | 0 (0.0%) |
| Total (Overall) | 265 (46.2%) | 309 (53.8%) |
Production, Transportation and Moving Occupations
The most common Production, Transportation and Moving occupations in North Grosvenor Dale are Production (51 | 8.9%), Material Moving (19 | 3.3%), and Transportation (8 | 1.4%).
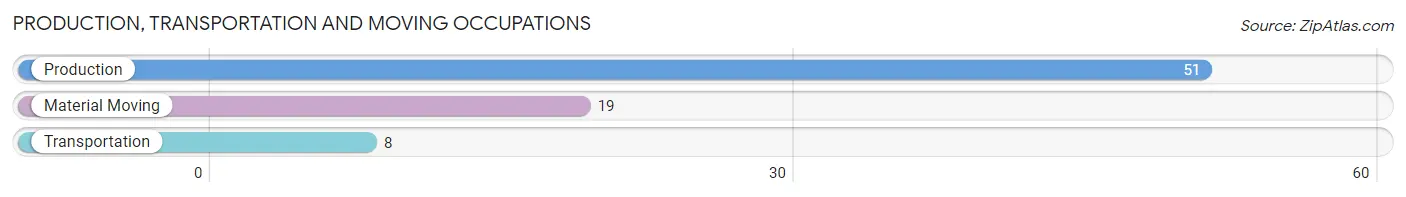
Production, Transportation and Moving Occupations by Sex
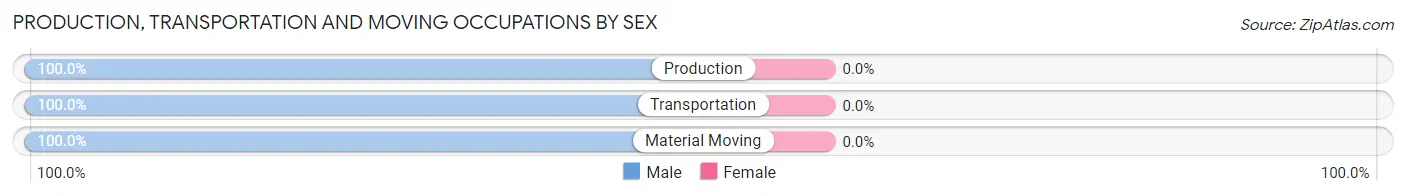
| Occupation | Male | Female |
| Production | 51 (100.0%) | 0 (0.0%) |
| Transportation | 8 (100.0%) | 0 (0.0%) |
| Material Moving | 19 (100.0%) | 0 (0.0%) |
| Total (Category) | 78 (100.0%) | 0 (0.0%) |
| Total (Overall) | 265 (46.2%) | 309 (53.8%) |
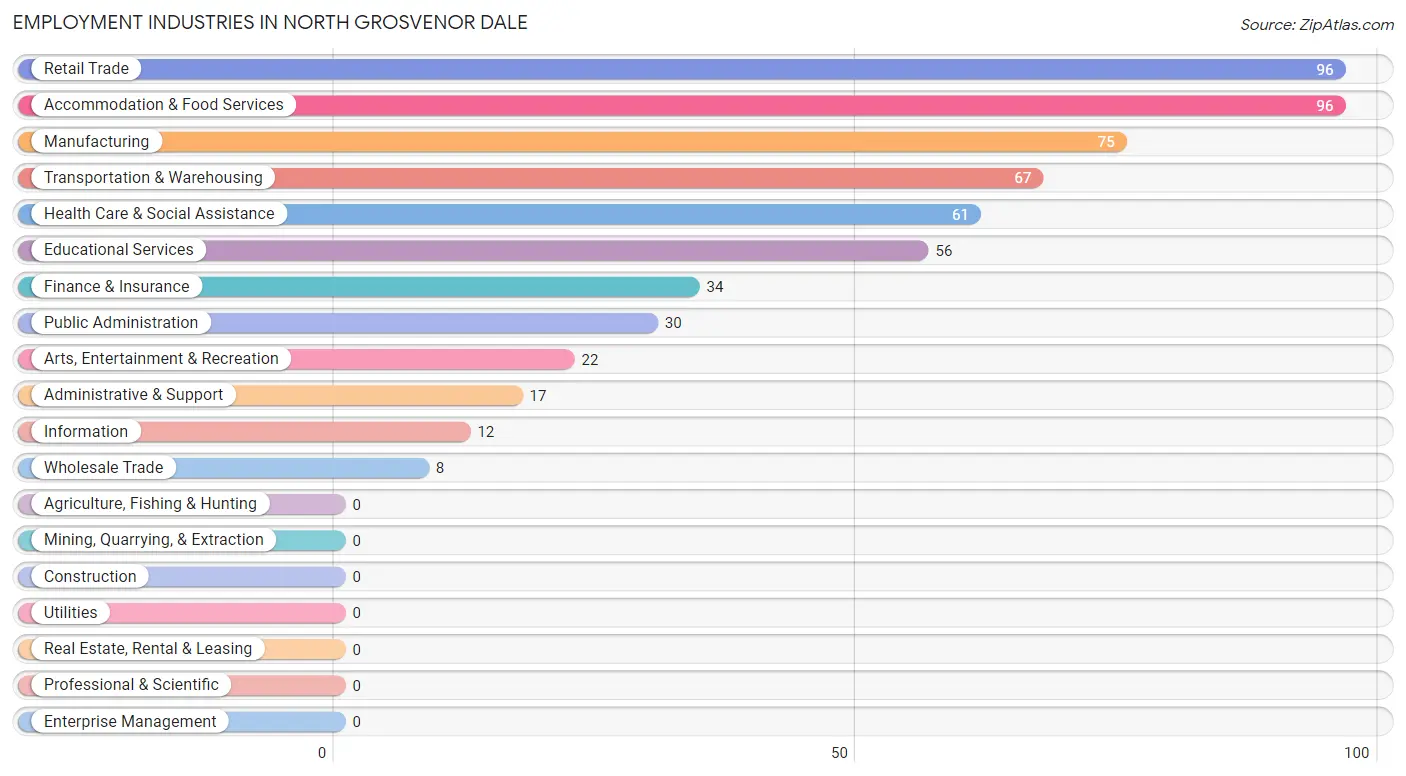
Employment Industries by Sex in North Grosvenor Dale
Employment Industries in North Grosvenor Dale
The major employment industries in North Grosvenor Dale include Retail Trade (96 | 16.7%), Accommodation & Food Services (96 | 16.7%), Manufacturing (75 | 13.1%), Transportation & Warehousing (67 | 11.7%), and Health Care & Social Assistance (61 | 10.6%).
Employment Industries by Sex in North Grosvenor Dale
The North Grosvenor Dale industries that see more men than women are Wholesale Trade (100.0%), Transportation & Warehousing (100.0%), and Information (100.0%), whereas the industries that tend to have a higher number of women are Finance & Insurance (100.0%), Educational Services (100.0%), and Health Care & Social Assistance (100.0%).
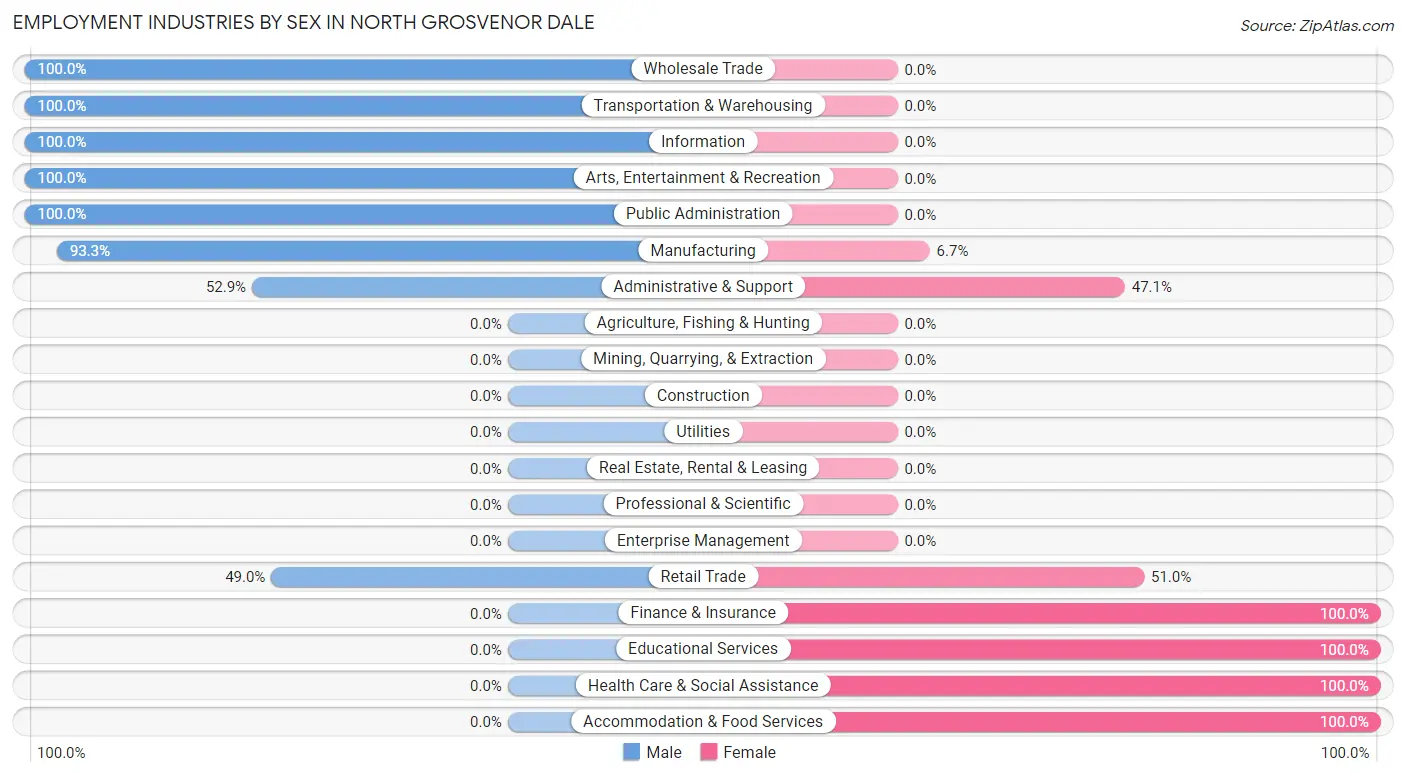
| Industry | Male | Female |
| Agriculture, Fishing & Hunting | 0 (0.0%) | 0 (0.0%) |
| Mining, Quarrying, & Extraction | 0 (0.0%) | 0 (0.0%) |
| Construction | 0 (0.0%) | 0 (0.0%) |
| Manufacturing | 70 (93.3%) | 5 (6.7%) |
| Wholesale Trade | 8 (100.0%) | 0 (0.0%) |
| Retail Trade | 47 (49.0%) | 49 (51.0%) |
| Transportation & Warehousing | 67 (100.0%) | 0 (0.0%) |
| Utilities | 0 (0.0%) | 0 (0.0%) |
| Information | 12 (100.0%) | 0 (0.0%) |
| Finance & Insurance | 0 (0.0%) | 34 (100.0%) |
| Real Estate, Rental & Leasing | 0 (0.0%) | 0 (0.0%) |
| Professional & Scientific | 0 (0.0%) | 0 (0.0%) |
| Enterprise Management | 0 (0.0%) | 0 (0.0%) |
| Administrative & Support | 9 (52.9%) | 8 (47.1%) |
| Educational Services | 0 (0.0%) | 56 (100.0%) |
| Health Care & Social Assistance | 0 (0.0%) | 61 (100.0%) |
| Arts, Entertainment & Recreation | 22 (100.0%) | 0 (0.0%) |
| Accommodation & Food Services | 0 (0.0%) | 96 (100.0%) |
| Public Administration | 30 (100.0%) | 0 (0.0%) |
| Total | 265 (46.2%) | 309 (53.8%) |
Education in North Grosvenor Dale
School Enrollment in North Grosvenor Dale
The most common levels of schooling among the 227 students in North Grosvenor Dale are high school (115 | 50.7%), kindergarten (53 | 23.4%), and elementary school (36 | 15.9%).
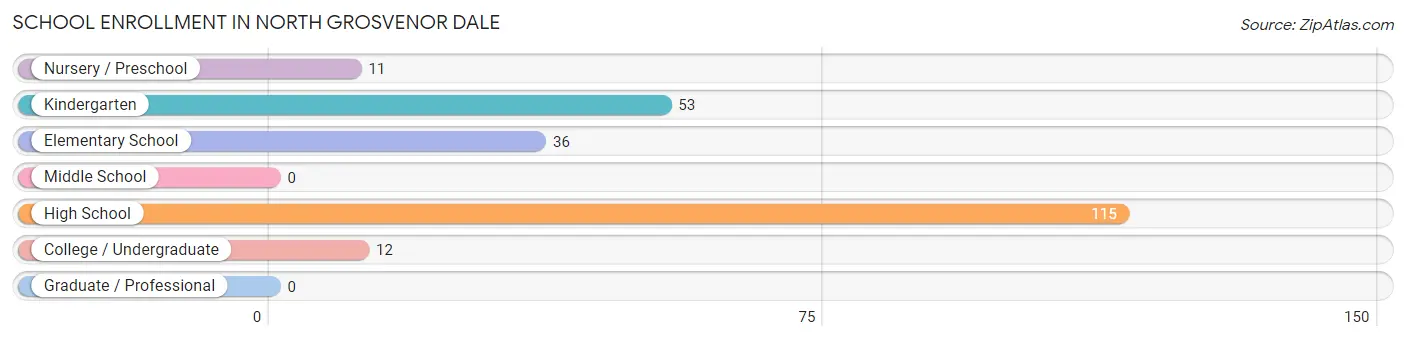
| School Level | # Students | % Students |
| Nursery / Preschool | 11 | 4.9% |
| Kindergarten | 53 | 23.4% |
| Elementary School | 36 | 15.9% |
| Middle School | 0 | 0.0% |
| High School | 115 | 50.7% |
| College / Undergraduate | 12 | 5.3% |
| Graduate / Professional | 0 | 0.0% |
| Total | 227 | 100.0% |
School Enrollment by Age by Funding Source in North Grosvenor Dale
Out of a total of 227 students who are enrolled in schools in North Grosvenor Dale, 81 (35.7%) attend a private institution, while the remaining 146 (64.3%) are enrolled in public schools. The age group of 3 to 4 year olds has the highest likelihood of being enrolled in private schools, with 11 (100.0% in the age bracket) enrolled. Conversely, the age group of 5 to 9 year old has the lowest likelihood of being enrolled in a private school, with 89 (100.0% in the age bracket) attending a public institution.
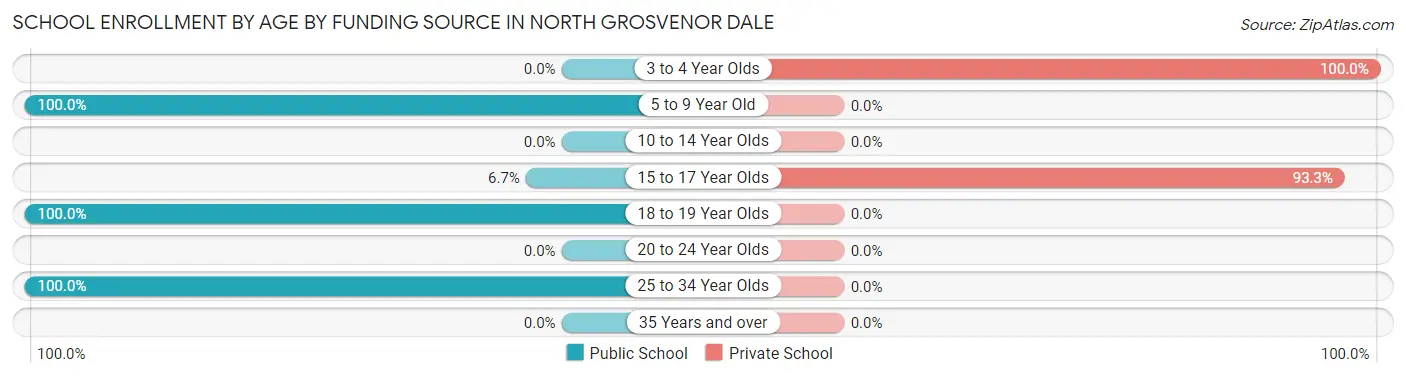
| Age Bracket | Public School | Private School |
| 3 to 4 Year Olds | 0 (0.0%) | 11 (100.0%) |
| 5 to 9 Year Old | 89 (100.0%) | 0 (0.0%) |
| 10 to 14 Year Olds | 0 (0.0%) | 0 (0.0%) |
| 15 to 17 Year Olds | 5 (6.7%) | 70 (93.3%) |
| 18 to 19 Year Olds | 40 (100.0%) | 0 (0.0%) |
| 20 to 24 Year Olds | 0 (0.0%) | 0 (0.0%) |
| 25 to 34 Year Olds | 12 (100.0%) | 0 (0.0%) |
| 35 Years and over | 0 (0.0%) | 0 (0.0%) |
| Total | 146 (64.3%) | 81 (35.7%) |
Educational Attainment by Field of Study in North Grosvenor Dale
Psychology (56 | 42.1%), education (20 | 15.0%), bio, nature & agricultural (12 | 9.0%), physical & health sciences (12 | 9.0%), and business (9 | 6.8%) are the most common fields of study among 133 individuals in North Grosvenor Dale who have obtained a bachelor's degree or higher.
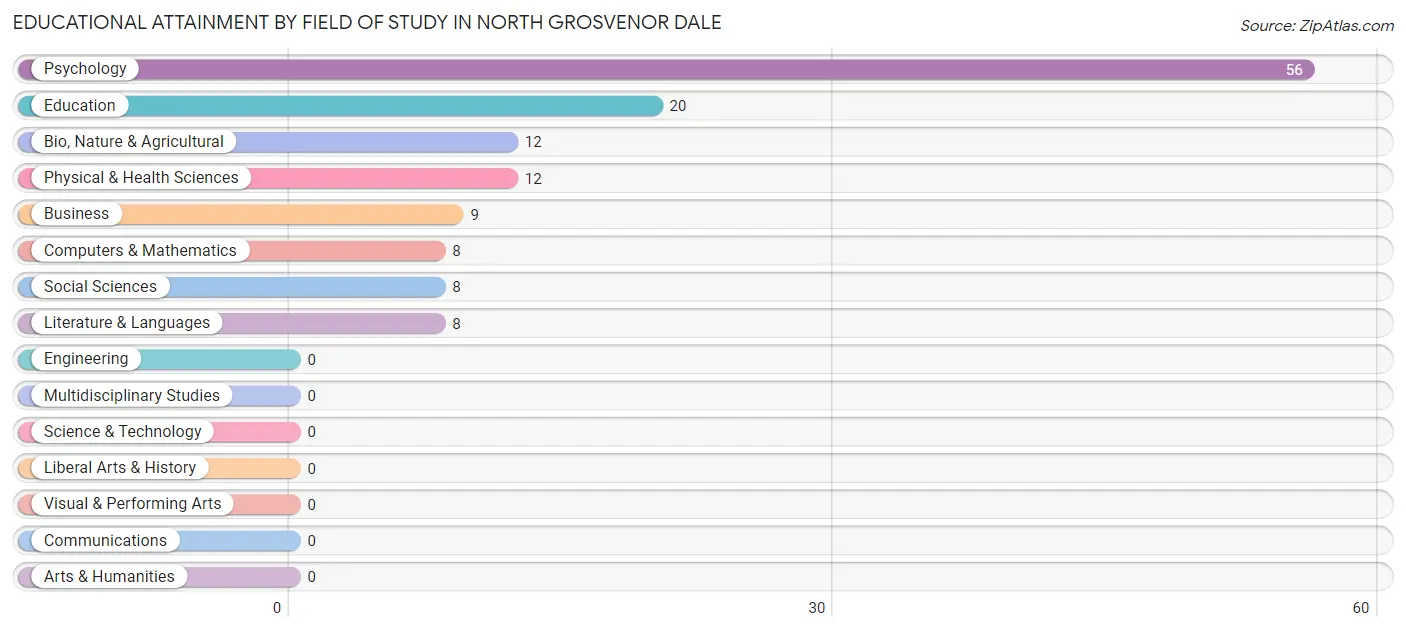
| Field of Study | # Graduates | % Graduates |
| Computers & Mathematics | 8 | 6.0% |
| Bio, Nature & Agricultural | 12 | 9.0% |
| Physical & Health Sciences | 12 | 9.0% |
| Psychology | 56 | 42.1% |
| Social Sciences | 8 | 6.0% |
| Engineering | 0 | 0.0% |
| Multidisciplinary Studies | 0 | 0.0% |
| Science & Technology | 0 | 0.0% |
| Business | 9 | 6.8% |
| Education | 20 | 15.0% |
| Literature & Languages | 8 | 6.0% |
| Liberal Arts & History | 0 | 0.0% |
| Visual & Performing Arts | 0 | 0.0% |
| Communications | 0 | 0.0% |
| Arts & Humanities | 0 | 0.0% |
| Total | 133 | 100.0% |
Transportation & Commute in North Grosvenor Dale
Vehicle Availability by Sex in North Grosvenor Dale
The most prevalent vehicle ownership categories in North Grosvenor Dale are males with 2 vehicles (74, accounting for 30.1%) and females with 2 vehicles (157, making up 26.5%).
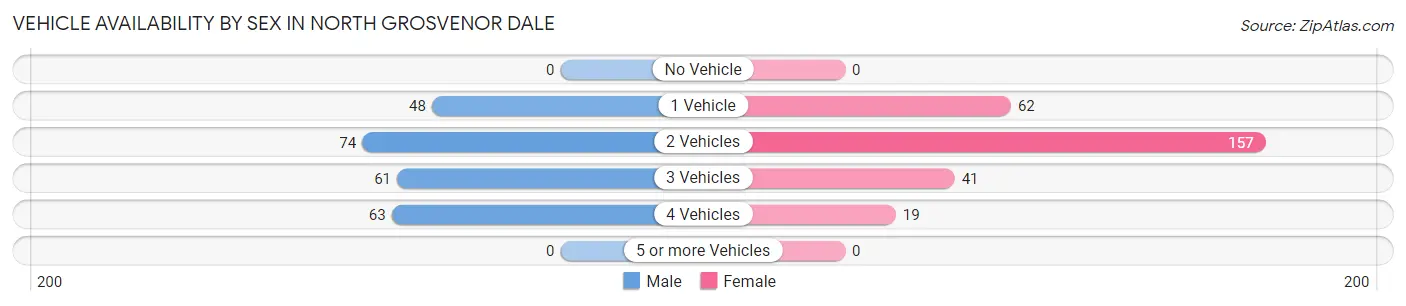
| Vehicles Available | Male | Female |
| No Vehicle | 0 (0.0%) | 0 (0.0%) |
| 1 Vehicle | 48 (19.5%) | 62 (22.2%) |
| 2 Vehicles | 74 (30.1%) | 157 (56.3%) |
| 3 Vehicles | 61 (24.8%) | 41 (14.7%) |
| 4 Vehicles | 63 (25.6%) | 19 (6.8%) |
| 5 or more Vehicles | 0 (0.0%) | 0 (0.0%) |
| Total | 246 (100.0%) | 279 (100.0%) |
Commute Time in North Grosvenor Dale
The most frequently occuring commute durations in North Grosvenor Dale are 25 to 29 minutes (101 commuters, 19.5%), 60 to 89 minutes (81 commuters, 15.7%), and 20 to 24 minutes (75 commuters, 14.5%).
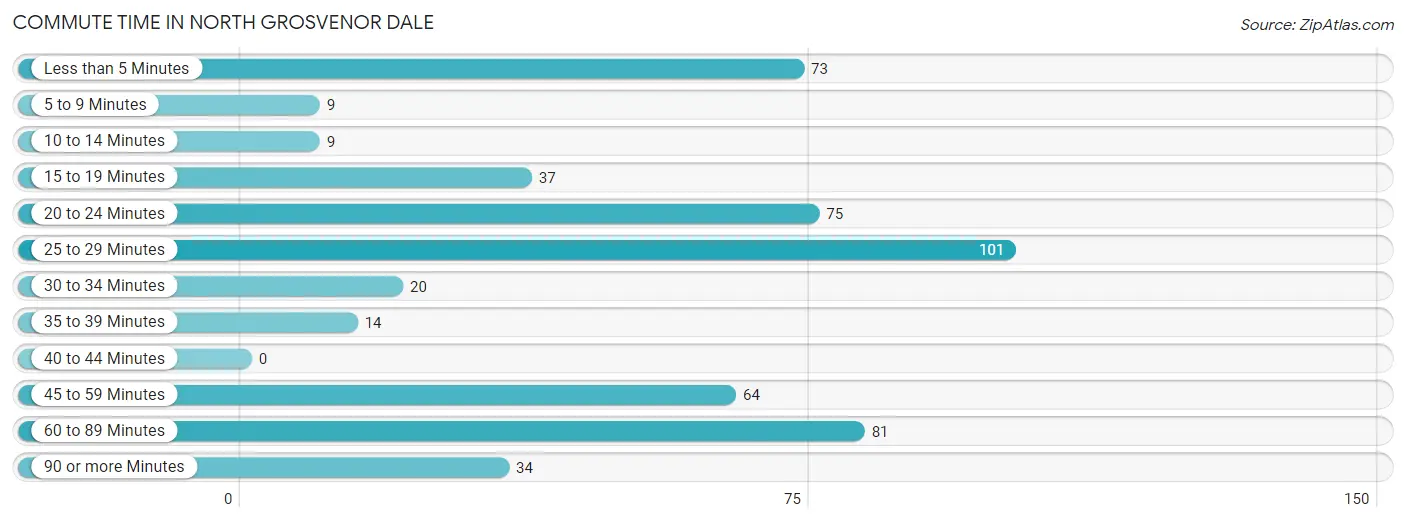
| Commute Time | # Commuters | % Commuters |
| Less than 5 Minutes | 73 | 14.1% |
| 5 to 9 Minutes | 9 | 1.7% |
| 10 to 14 Minutes | 9 | 1.7% |
| 15 to 19 Minutes | 37 | 7.2% |
| 20 to 24 Minutes | 75 | 14.5% |
| 25 to 29 Minutes | 101 | 19.5% |
| 30 to 34 Minutes | 20 | 3.9% |
| 35 to 39 Minutes | 14 | 2.7% |
| 40 to 44 Minutes | 0 | 0.0% |
| 45 to 59 Minutes | 64 | 12.4% |
| 60 to 89 Minutes | 81 | 15.7% |
| 90 or more Minutes | 34 | 6.6% |
Commute Time by Sex in North Grosvenor Dale
The most common commute times in North Grosvenor Dale are 60 to 89 minutes (81 commuters, 32.9%) for males and 25 to 29 minutes (89 commuters, 32.8%) for females.
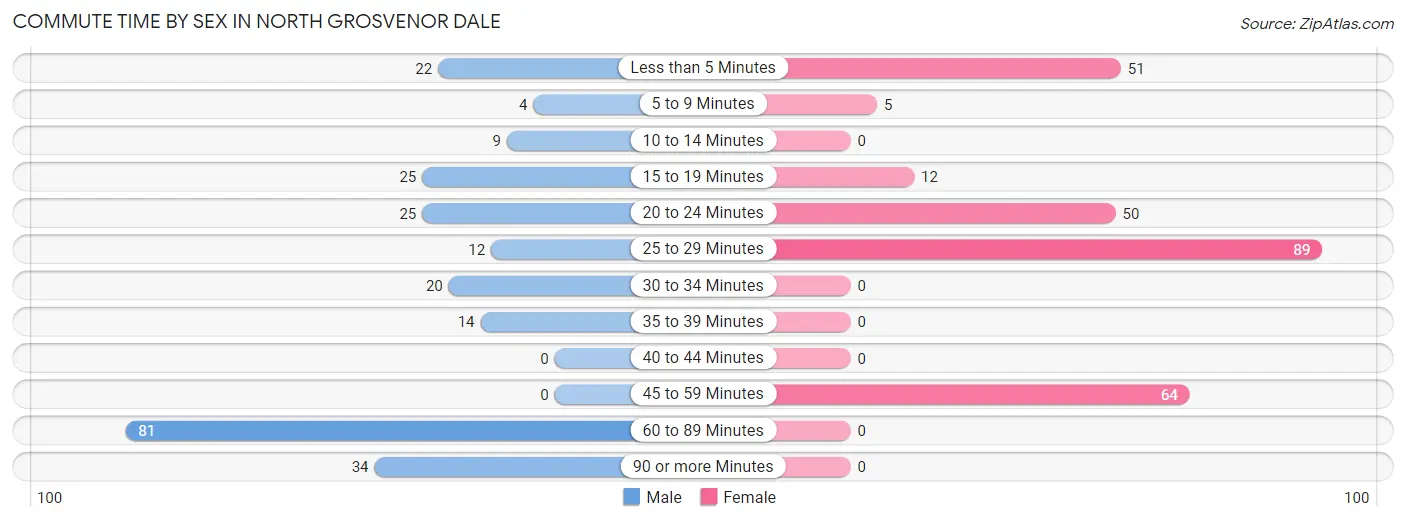
| Commute Time | Male | Female |
| Less than 5 Minutes | 22 (8.9%) | 51 (18.8%) |
| 5 to 9 Minutes | 4 (1.6%) | 5 (1.8%) |
| 10 to 14 Minutes | 9 (3.7%) | 0 (0.0%) |
| 15 to 19 Minutes | 25 (10.2%) | 12 (4.4%) |
| 20 to 24 Minutes | 25 (10.2%) | 50 (18.4%) |
| 25 to 29 Minutes | 12 (4.9%) | 89 (32.8%) |
| 30 to 34 Minutes | 20 (8.1%) | 0 (0.0%) |
| 35 to 39 Minutes | 14 (5.7%) | 0 (0.0%) |
| 40 to 44 Minutes | 0 (0.0%) | 0 (0.0%) |
| 45 to 59 Minutes | 0 (0.0%) | 64 (23.6%) |
| 60 to 89 Minutes | 81 (32.9%) | 0 (0.0%) |
| 90 or more Minutes | 34 (13.8%) | 0 (0.0%) |
Time of Departure to Work by Sex in North Grosvenor Dale
The most frequent times of departure to work in North Grosvenor Dale are 6:30 AM to 6:59 AM (67, 27.2%) for males and 8:00 AM to 8:29 AM (92, 34.0%) for females.
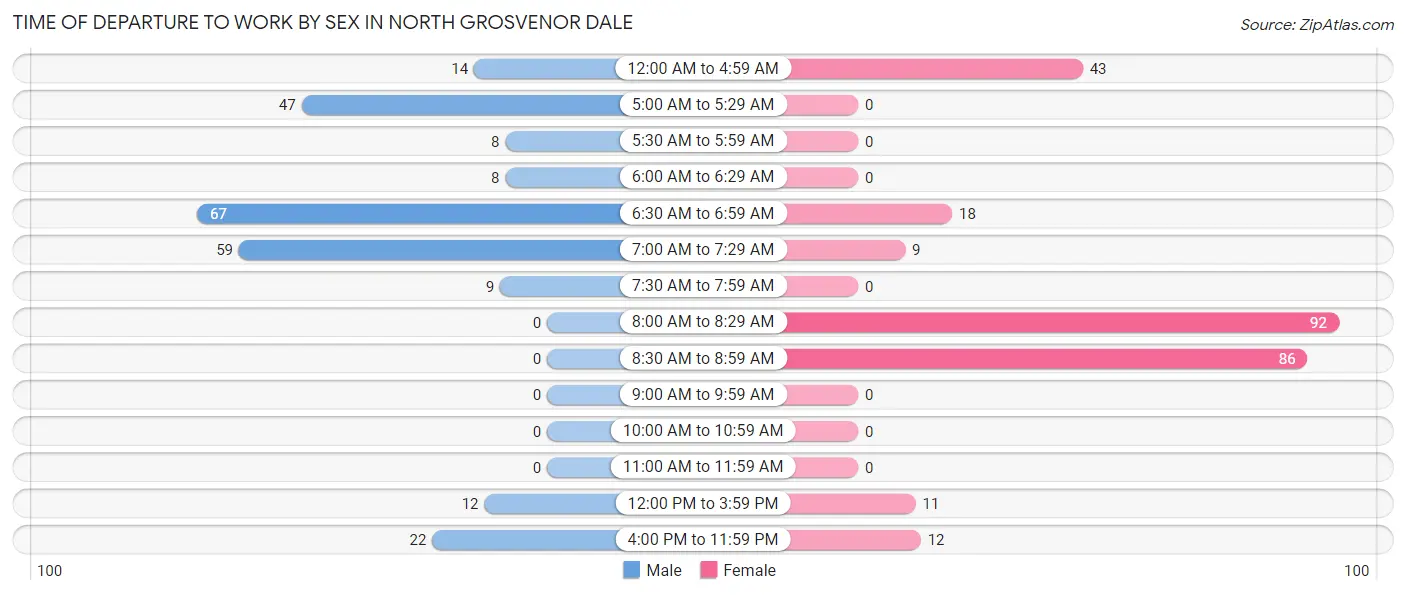
| Time of Departure | Male | Female |
| 12:00 AM to 4:59 AM | 14 (5.7%) | 43 (15.9%) |
| 5:00 AM to 5:29 AM | 47 (19.1%) | 0 (0.0%) |
| 5:30 AM to 5:59 AM | 8 (3.3%) | 0 (0.0%) |
| 6:00 AM to 6:29 AM | 8 (3.3%) | 0 (0.0%) |
| 6:30 AM to 6:59 AM | 67 (27.2%) | 18 (6.6%) |
| 7:00 AM to 7:29 AM | 59 (24.0%) | 9 (3.3%) |
| 7:30 AM to 7:59 AM | 9 (3.7%) | 0 (0.0%) |
| 8:00 AM to 8:29 AM | 0 (0.0%) | 92 (34.0%) |
| 8:30 AM to 8:59 AM | 0 (0.0%) | 86 (31.7%) |
| 9:00 AM to 9:59 AM | 0 (0.0%) | 0 (0.0%) |
| 10:00 AM to 10:59 AM | 0 (0.0%) | 0 (0.0%) |
| 11:00 AM to 11:59 AM | 0 (0.0%) | 0 (0.0%) |
| 12:00 PM to 3:59 PM | 12 (4.9%) | 11 (4.1%) |
| 4:00 PM to 11:59 PM | 22 (8.9%) | 12 (4.4%) |
| Total | 246 (100.0%) | 271 (100.0%) |
Housing Occupancy in North Grosvenor Dale
Occupancy by Ownership in North Grosvenor Dale
Of the total 585 dwellings in North Grosvenor Dale, owner-occupied units account for 399 (68.2%), while renter-occupied units make up 186 (31.8%).
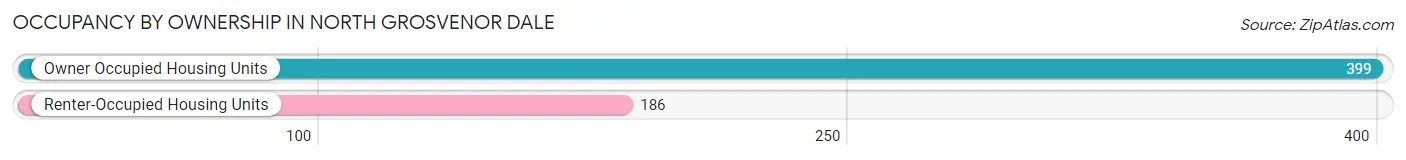
| Occupancy | # Housing Units | % Housing Units |
| Owner Occupied Housing Units | 399 | 68.2% |
| Renter-Occupied Housing Units | 186 | 31.8% |
| Total Occupied Housing Units | 585 | 100.0% |
Occupancy by Household Size in North Grosvenor Dale
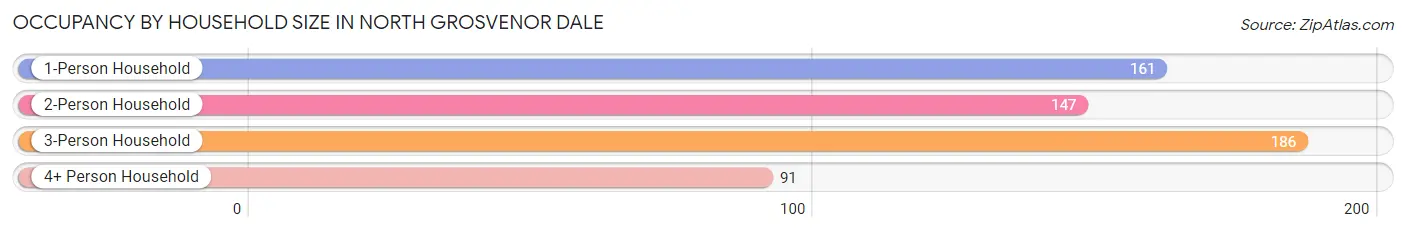
| Household Size | # Housing Units | % Housing Units |
| 1-Person Household | 161 | 27.5% |
| 2-Person Household | 147 | 25.1% |
| 3-Person Household | 186 | 31.8% |
| 4+ Person Household | 91 | 15.6% |
| Total Housing Units | 585 | 100.0% |
Occupancy by Ownership by Household Size in North Grosvenor Dale
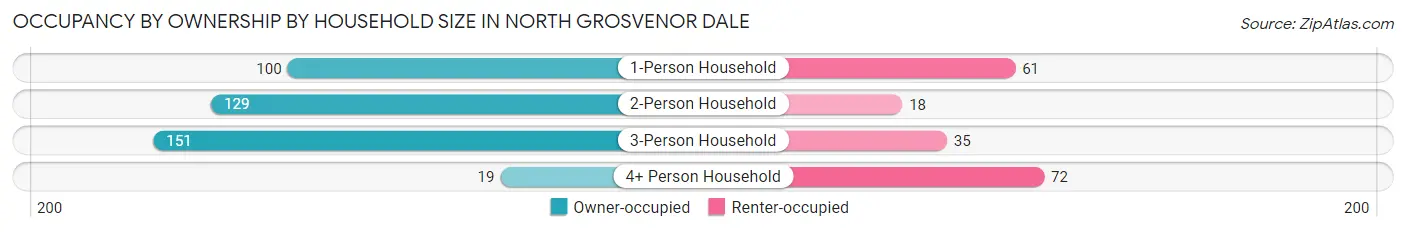
| Household Size | Owner-occupied | Renter-occupied |
| 1-Person Household | 100 (62.1%) | 61 (37.9%) |
| 2-Person Household | 129 (87.8%) | 18 (12.2%) |
| 3-Person Household | 151 (81.2%) | 35 (18.8%) |
| 4+ Person Household | 19 (20.9%) | 72 (79.1%) |
| Total Housing Units | 399 (68.2%) | 186 (31.8%) |
Occupancy by Educational Attainment in North Grosvenor Dale
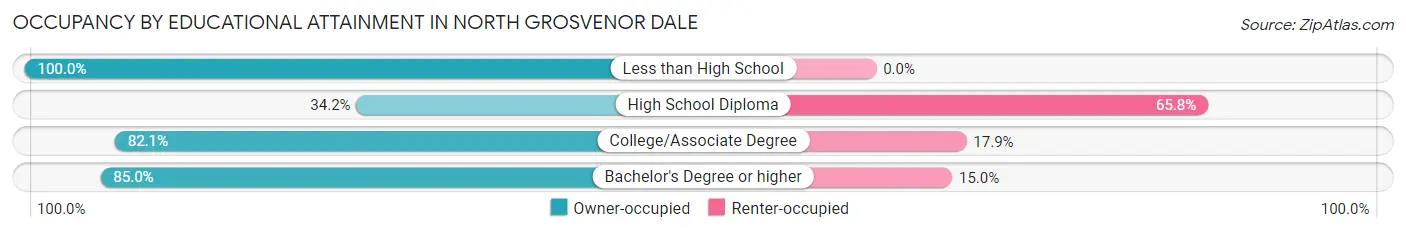
| Household Size | Owner-occupied | Renter-occupied |
| Less than High School | 36 (100.0%) | 0 (0.0%) |
| High School Diploma | 65 (34.2%) | 125 (65.8%) |
| College/Associate Degree | 202 (82.1%) | 44 (17.9%) |
| Bachelor's Degree or higher | 96 (85.0%) | 17 (15.0%) |
Occupancy by Age of Householder in North Grosvenor Dale
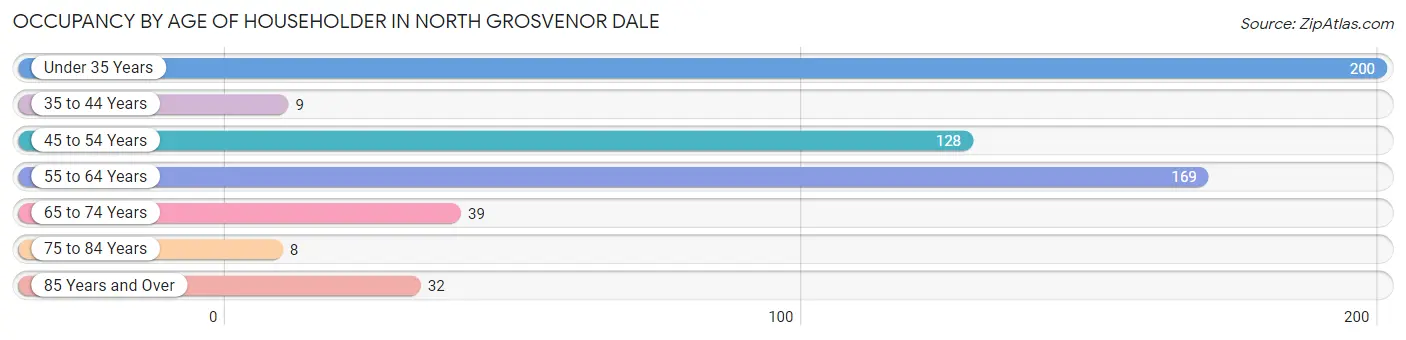
| Age Bracket | # Households | % Households |
| Under 35 Years | 200 | 34.2% |
| 35 to 44 Years | 9 | 1.5% |
| 45 to 54 Years | 128 | 21.9% |
| 55 to 64 Years | 169 | 28.9% |
| 65 to 74 Years | 39 | 6.7% |
| 75 to 84 Years | 8 | 1.4% |
| 85 Years and Over | 32 | 5.5% |
| Total | 585 | 100.0% |
Housing Finances in North Grosvenor Dale
Median Income by Occupancy in North Grosvenor Dale
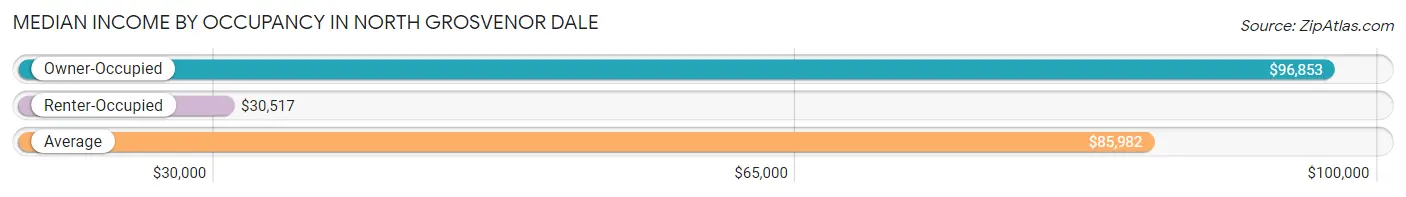
| Occupancy Type | # Households | Median Income |
| Owner-Occupied | 399 (68.2%) | $96,853 |
| Renter-Occupied | 186 (31.8%) | $30,517 |
| Average | 585 (100.0%) | $85,982 |
Occupancy by Householder Income Bracket in North Grosvenor Dale
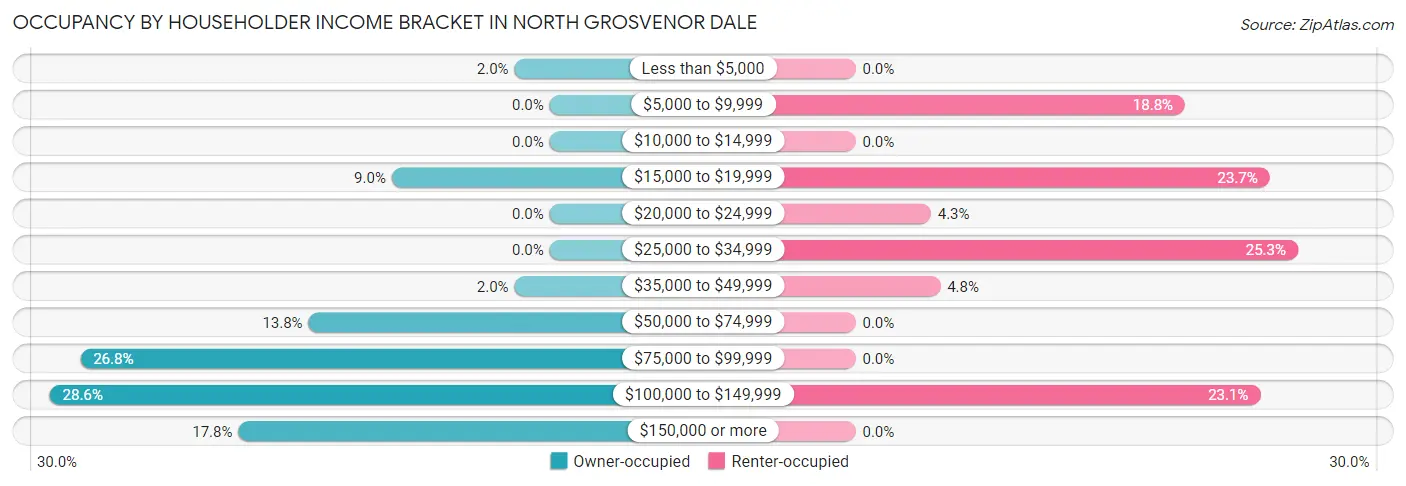
| Income Bracket | Owner-occupied | Renter-occupied |
| Less than $5,000 | 8 (2.0%) | 0 (0.0%) |
| $5,000 to $9,999 | 0 (0.0%) | 35 (18.8%) |
| $10,000 to $14,999 | 0 (0.0%) | 0 (0.0%) |
| $15,000 to $19,999 | 36 (9.0%) | 44 (23.7%) |
| $20,000 to $24,999 | 0 (0.0%) | 8 (4.3%) |
| $25,000 to $34,999 | 0 (0.0%) | 47 (25.3%) |
| $35,000 to $49,999 | 8 (2.0%) | 9 (4.8%) |
| $50,000 to $74,999 | 55 (13.8%) | 0 (0.0%) |
| $75,000 to $99,999 | 107 (26.8%) | 0 (0.0%) |
| $100,000 to $149,999 | 114 (28.6%) | 43 (23.1%) |
| $150,000 or more | 71 (17.8%) | 0 (0.0%) |
| Total | 399 (100.0%) | 186 (100.0%) |
Monthly Housing Cost Tiers in North Grosvenor Dale
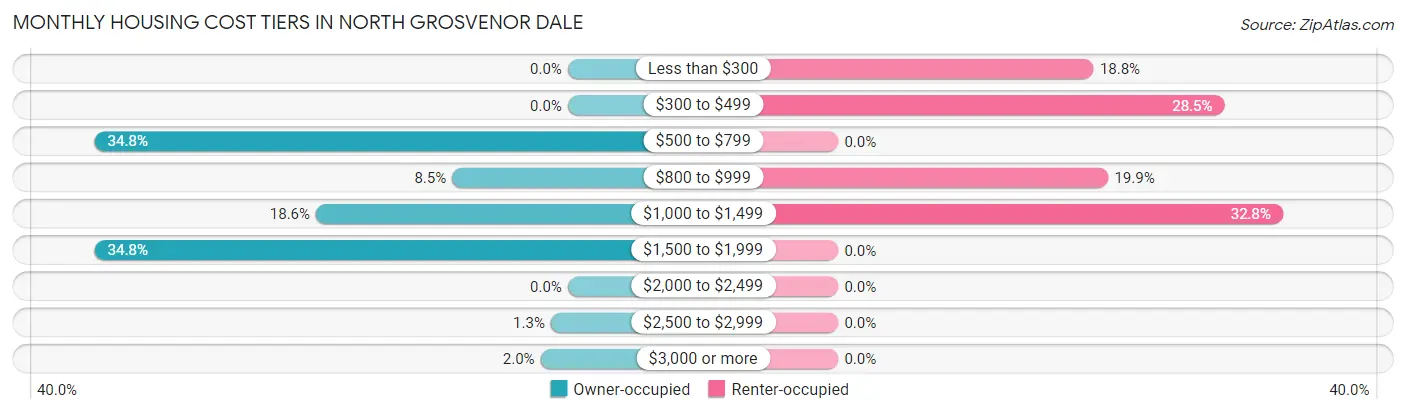
| Monthly Cost | Owner-occupied | Renter-occupied |
| Less than $300 | 0 (0.0%) | 35 (18.8%) |
| $300 to $499 | 0 (0.0%) | 53 (28.5%) |
| $500 to $799 | 139 (34.8%) | 0 (0.0%) |
| $800 to $999 | 34 (8.5%) | 37 (19.9%) |
| $1,000 to $1,499 | 74 (18.5%) | 61 (32.8%) |
| $1,500 to $1,999 | 139 (34.8%) | 0 (0.0%) |
| $2,000 to $2,499 | 0 (0.0%) | 0 (0.0%) |
| $2,500 to $2,999 | 5 (1.3%) | 0 (0.0%) |
| $3,000 or more | 8 (2.0%) | 0 (0.0%) |
| Total | 399 (100.0%) | 186 (100.0%) |
Physical Housing Characteristics in North Grosvenor Dale
Housing Structures in North Grosvenor Dale
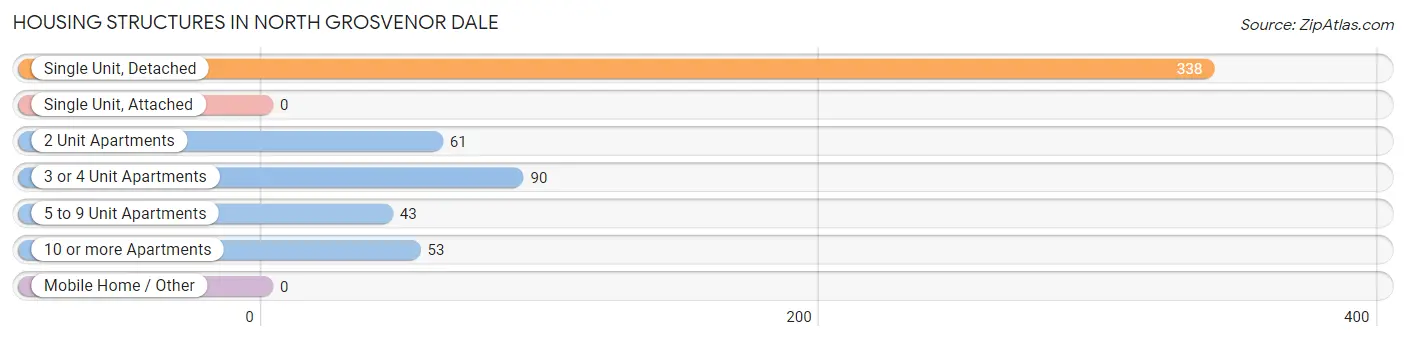
| Structure Type | # Housing Units | % Housing Units |
| Single Unit, Detached | 338 | 57.8% |
| Single Unit, Attached | 0 | 0.0% |
| 2 Unit Apartments | 61 | 10.4% |
| 3 or 4 Unit Apartments | 90 | 15.4% |
| 5 to 9 Unit Apartments | 43 | 7.3% |
| 10 or more Apartments | 53 | 9.1% |
| Mobile Home / Other | 0 | 0.0% |
| Total | 585 | 100.0% |
Housing Structures by Occupancy in North Grosvenor Dale
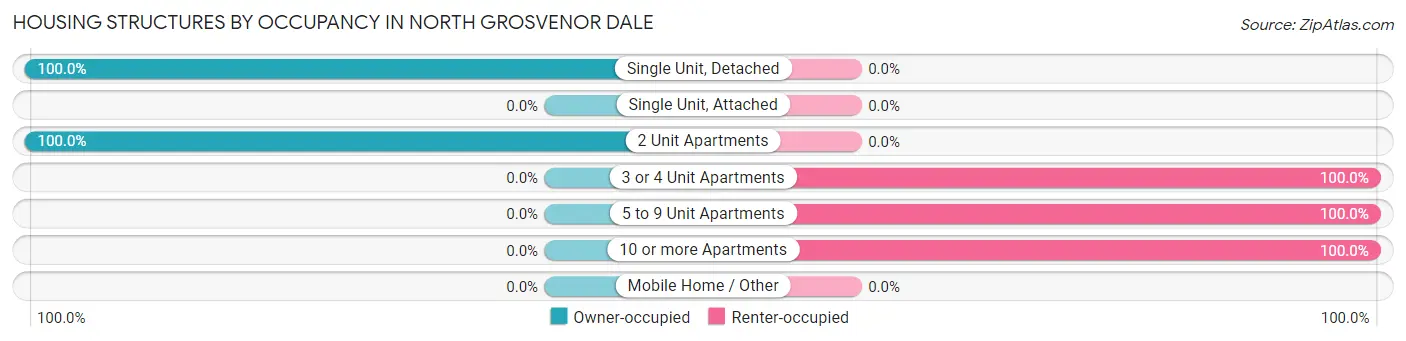
| Structure Type | Owner-occupied | Renter-occupied |
| Single Unit, Detached | 338 (100.0%) | 0 (0.0%) |
| Single Unit, Attached | 0 (0.0%) | 0 (0.0%) |
| 2 Unit Apartments | 61 (100.0%) | 0 (0.0%) |
| 3 or 4 Unit Apartments | 0 (0.0%) | 90 (100.0%) |
| 5 to 9 Unit Apartments | 0 (0.0%) | 43 (100.0%) |
| 10 or more Apartments | 0 (0.0%) | 53 (100.0%) |
| Mobile Home / Other | 0 (0.0%) | 0 (0.0%) |
| Total | 399 (68.2%) | 186 (31.8%) |
Housing Structures by Number of Rooms in North Grosvenor Dale
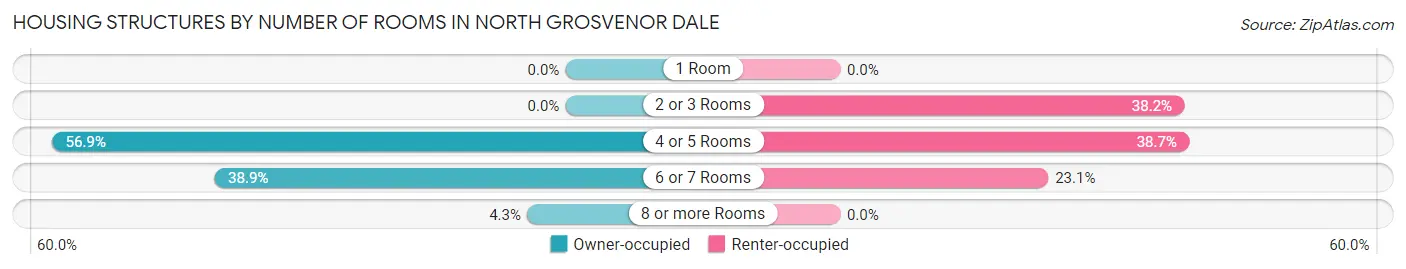
| Number of Rooms | Owner-occupied | Renter-occupied |
| 1 Room | 0 (0.0%) | 0 (0.0%) |
| 2 or 3 Rooms | 0 (0.0%) | 71 (38.2%) |
| 4 or 5 Rooms | 227 (56.9%) | 72 (38.7%) |
| 6 or 7 Rooms | 155 (38.9%) | 43 (23.1%) |
| 8 or more Rooms | 17 (4.3%) | 0 (0.0%) |
| Total | 399 (100.0%) | 186 (100.0%) |
Housing Structure by Heating Type in North Grosvenor Dale
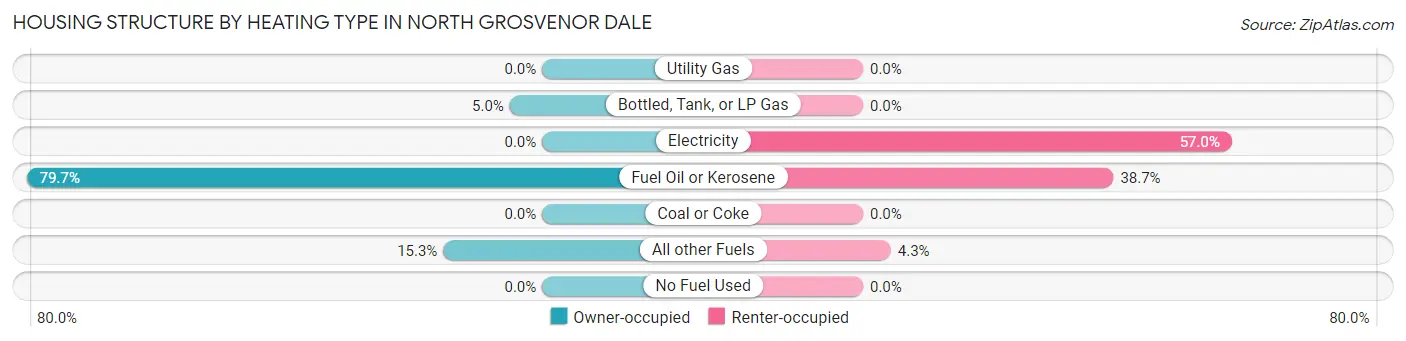
| Heating Type | Owner-occupied | Renter-occupied |
| Utility Gas | 0 (0.0%) | 0 (0.0%) |
| Bottled, Tank, or LP Gas | 20 (5.0%) | 0 (0.0%) |
| Electricity | 0 (0.0%) | 106 (57.0%) |
| Fuel Oil or Kerosene | 318 (79.7%) | 72 (38.7%) |
| Coal or Coke | 0 (0.0%) | 0 (0.0%) |
| All other Fuels | 61 (15.3%) | 8 (4.3%) |
| No Fuel Used | 0 (0.0%) | 0 (0.0%) |
| Total | 399 (100.0%) | 186 (100.0%) |
Household Vehicle Usage in North Grosvenor Dale
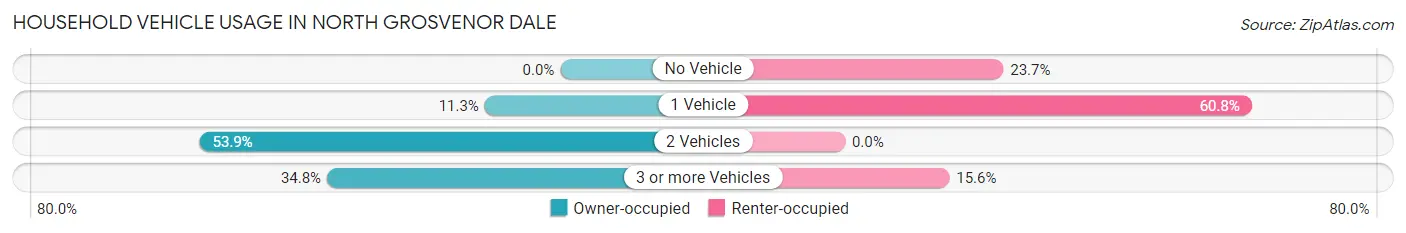
| Vehicles per Household | Owner-occupied | Renter-occupied |
| No Vehicle | 0 (0.0%) | 44 (23.7%) |
| 1 Vehicle | 45 (11.3%) | 113 (60.8%) |
| 2 Vehicles | 215 (53.9%) | 0 (0.0%) |
| 3 or more Vehicles | 139 (34.8%) | 29 (15.6%) |
| Total | 399 (100.0%) | 186 (100.0%) |
Real Estate & Mortgages in North Grosvenor Dale
Real Estate and Mortgage Overview in North Grosvenor Dale
| Characteristic | Without Mortgage | With Mortgage |
| Housing Units | 112 | 287 |
| Median Property Value | $170,600 | $218,500 |
| Median Household Income | - | - |
| Monthly Housing Costs | $671 | $8 |
| Real Estate Taxes | $4,040 | $47 |
Property Value by Mortgage Status in North Grosvenor Dale
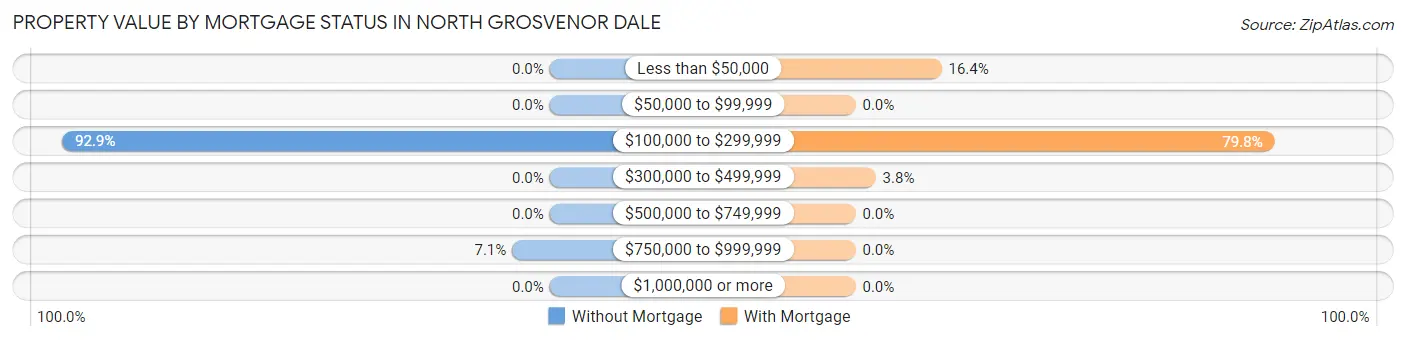
| Property Value | Without Mortgage | With Mortgage |
| Less than $50,000 | 0 (0.0%) | 47 (16.4%) |
| $50,000 to $99,999 | 0 (0.0%) | 0 (0.0%) |
| $100,000 to $299,999 | 104 (92.9%) | 229 (79.8%) |
| $300,000 to $499,999 | 0 (0.0%) | 11 (3.8%) |
| $500,000 to $749,999 | 0 (0.0%) | 0 (0.0%) |
| $750,000 to $999,999 | 8 (7.1%) | 0 (0.0%) |
| $1,000,000 or more | 0 (0.0%) | 0 (0.0%) |
| Total | 112 (100.0%) | 287 (100.0%) |
Household Income by Mortgage Status in North Grosvenor Dale
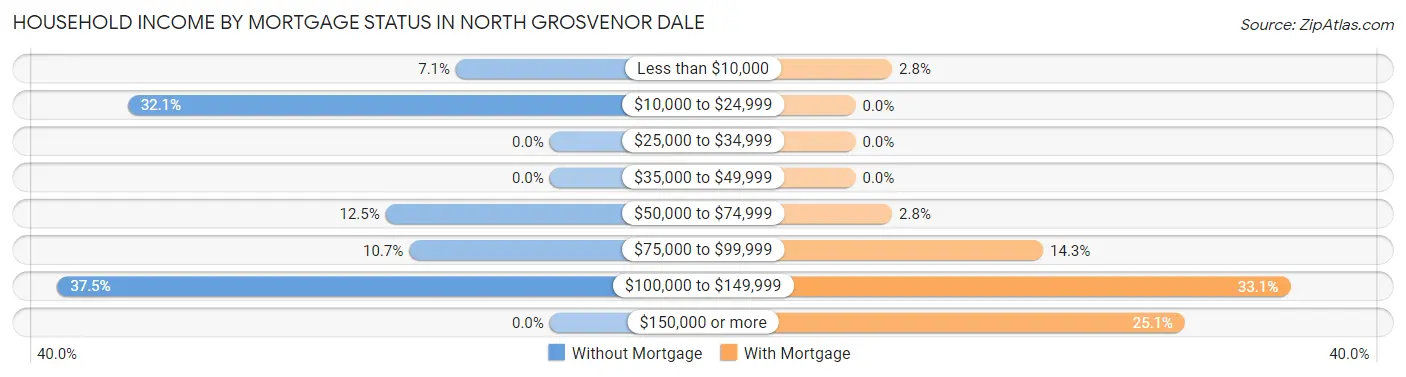
| Household Income | Without Mortgage | With Mortgage |
| Less than $10,000 | 8 (7.1%) | 8 (2.8%) |
| $10,000 to $24,999 | 36 (32.1%) | 0 (0.0%) |
| $25,000 to $34,999 | 0 (0.0%) | 0 (0.0%) |
| $35,000 to $49,999 | 0 (0.0%) | 0 (0.0%) |
| $50,000 to $74,999 | 14 (12.5%) | 8 (2.8%) |
| $75,000 to $99,999 | 12 (10.7%) | 41 (14.3%) |
| $100,000 to $149,999 | 42 (37.5%) | 95 (33.1%) |
| $150,000 or more | 0 (0.0%) | 72 (25.1%) |
| Total | 112 (100.0%) | 287 (100.0%) |
Property Value to Household Income Ratio in North Grosvenor Dale
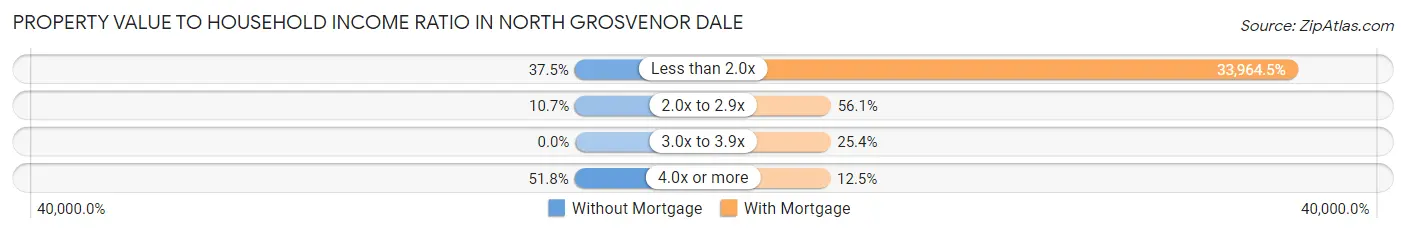
| Value-to-Income Ratio | Without Mortgage | With Mortgage |
| Less than 2.0x | 42 (37.5%) | 97,478 (33,964.5%) |
| 2.0x to 2.9x | 12 (10.7%) | 161 (56.1%) |
| 3.0x to 3.9x | 0 (0.0%) | 73 (25.4%) |
| 4.0x or more | 58 (51.8%) | 36 (12.5%) |
| Total | 112 (100.0%) | 287 (100.0%) |
Real Estate Taxes by Mortgage Status in North Grosvenor Dale
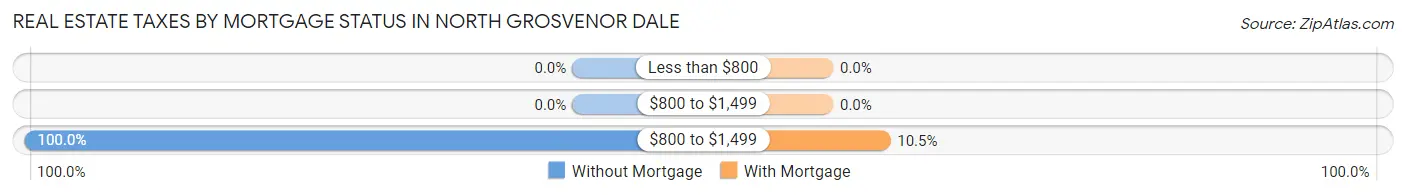
| Property Taxes | Without Mortgage | With Mortgage |
| Less than $800 | 0 (0.0%) | 0 (0.0%) |
| $800 to $1,499 | 0 (0.0%) | 0 (0.0%) |
| $800 to $1,499 | 112 (100.0%) | 30 (10.4%) |
| Total | 112 (100.0%) | 287 (100.0%) |
Health & Disability in North Grosvenor Dale
Health Insurance Coverage by Age in North Grosvenor Dale
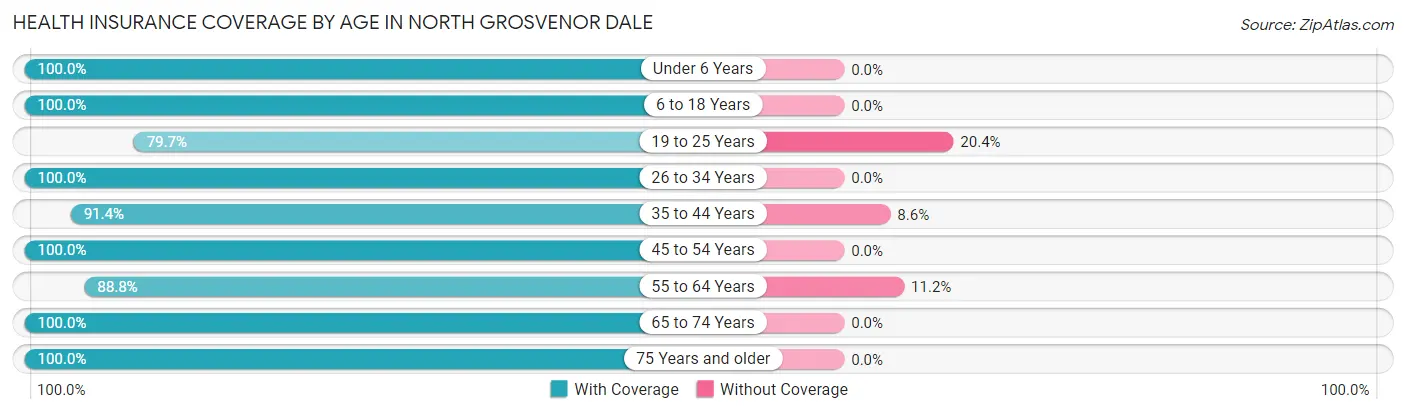
| Age Bracket | With Coverage | Without Coverage |
| Under 6 Years | 159 (100.0%) | 0 (0.0%) |
| 6 to 18 Years | 148 (100.0%) | 0 (0.0%) |
| 19 to 25 Years | 184 (79.6%) | 47 (20.3%) |
| 26 to 34 Years | 147 (100.0%) | 0 (0.0%) |
| 35 to 44 Years | 85 (91.4%) | 8 (8.6%) |
| 45 to 54 Years | 150 (100.0%) | 0 (0.0%) |
| 55 to 64 Years | 199 (88.8%) | 25 (11.2%) |
| 65 to 74 Years | 74 (100.0%) | 0 (0.0%) |
| 75 Years and older | 55 (100.0%) | 0 (0.0%) |
| Total | 1,201 (93.8%) | 80 (6.2%) |
Health Insurance Coverage by Citizenship Status in North Grosvenor Dale
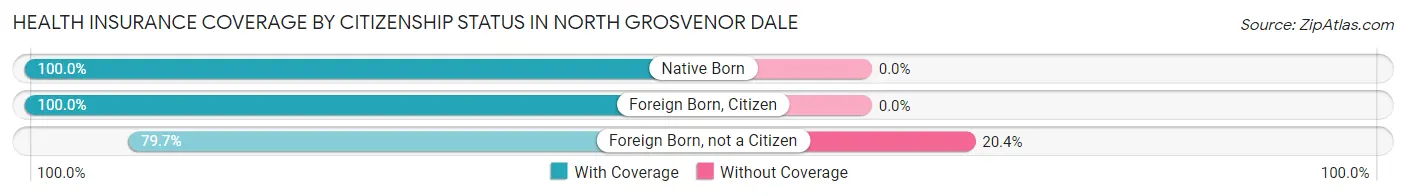
| Citizenship Status | With Coverage | Without Coverage |
| Native Born | 159 (100.0%) | 0 (0.0%) |
| Foreign Born, Citizen | 148 (100.0%) | 0 (0.0%) |
| Foreign Born, not a Citizen | 184 (79.6%) | 47 (20.3%) |
Health Insurance Coverage by Household Income in North Grosvenor Dale
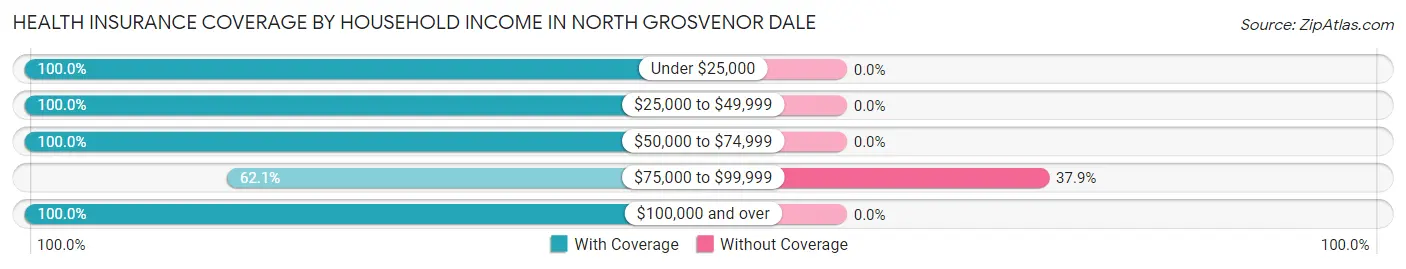
| Household Income | With Coverage | Without Coverage |
| Under $25,000 | 212 (100.0%) | 0 (0.0%) |
| $25,000 to $49,999 | 175 (100.0%) | 0 (0.0%) |
| $50,000 to $74,999 | 99 (100.0%) | 0 (0.0%) |
| $75,000 to $99,999 | 131 (62.1%) | 80 (37.9%) |
| $100,000 and over | 584 (100.0%) | 0 (0.0%) |
Public vs Private Health Insurance Coverage by Age in North Grosvenor Dale
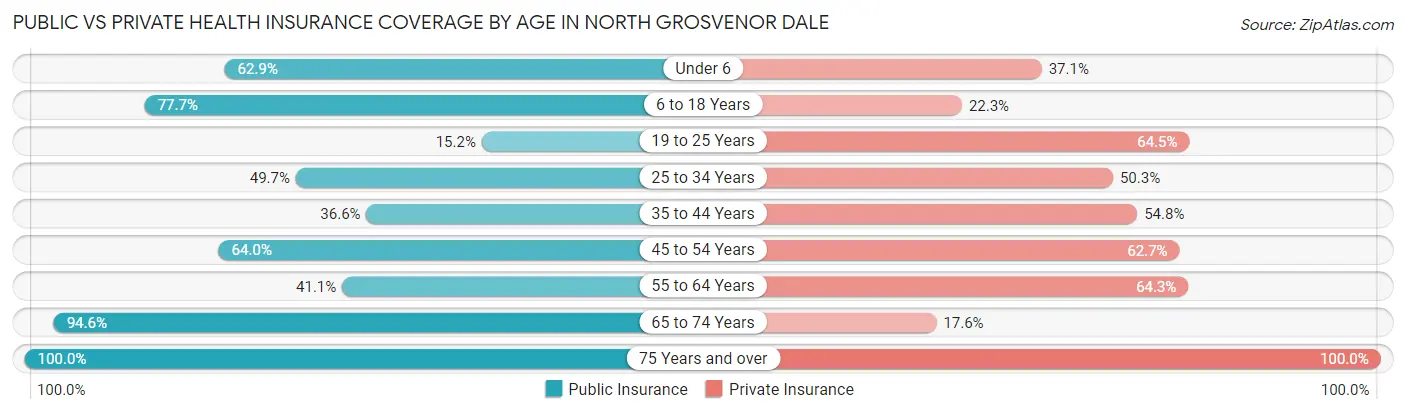
| Age Bracket | Public Insurance | Private Insurance |
| Under 6 | 100 (62.9%) | 59 (37.1%) |
| 6 to 18 Years | 115 (77.7%) | 33 (22.3%) |
| 19 to 25 Years | 35 (15.1%) | 149 (64.5%) |
| 25 to 34 Years | 73 (49.7%) | 74 (50.3%) |
| 35 to 44 Years | 34 (36.6%) | 51 (54.8%) |
| 45 to 54 Years | 96 (64.0%) | 94 (62.7%) |
| 55 to 64 Years | 92 (41.1%) | 144 (64.3%) |
| 65 to 74 Years | 70 (94.6%) | 13 (17.6%) |
| 75 Years and over | 55 (100.0%) | 55 (100.0%) |
| Total | 670 (52.3%) | 672 (52.5%) |
Disability Status by Sex by Age in North Grosvenor Dale
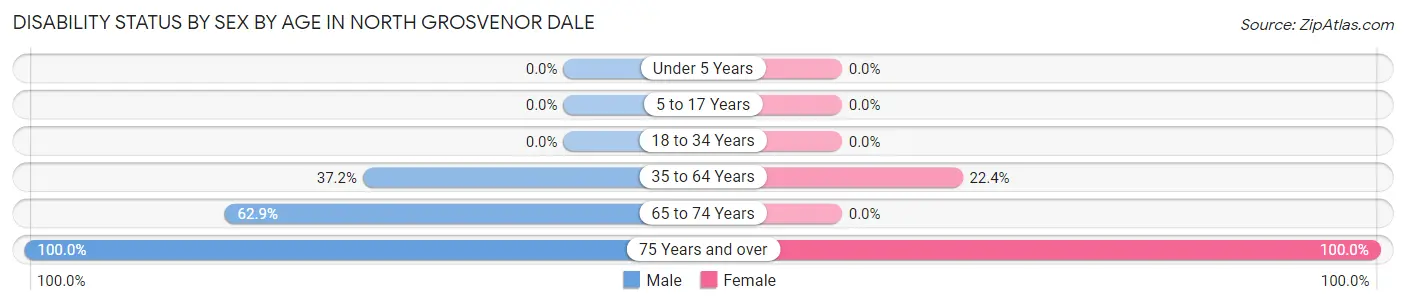
| Age Bracket | Male | Female |
| Under 5 Years | 0 (0.0%) | 0 (0.0%) |
| 5 to 17 Years | 0 (0.0%) | 0 (0.0%) |
| 18 to 34 Years | 0 (0.0%) | 0 (0.0%) |
| 35 to 64 Years | 99 (37.2%) | 45 (22.4%) |
| 65 to 74 Years | 22 (62.9%) | 0 (0.0%) |
| 75 Years and over | 40 (100.0%) | 15 (100.0%) |
Disability Class by Sex by Age in North Grosvenor Dale
Disability Class: Hearing Difficulty
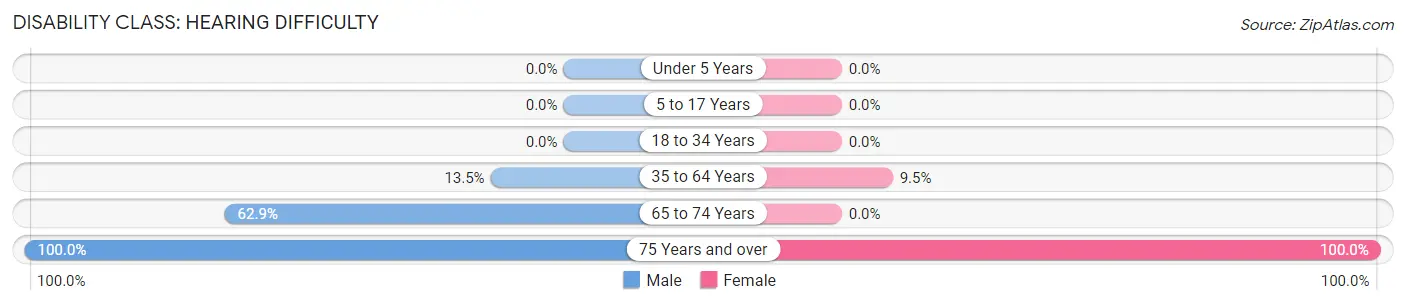
| Age Bracket | Male | Female |
| Under 5 Years | 0 (0.0%) | 0 (0.0%) |
| 5 to 17 Years | 0 (0.0%) | 0 (0.0%) |
| 18 to 34 Years | 0 (0.0%) | 0 (0.0%) |
| 35 to 64 Years | 36 (13.5%) | 19 (9.5%) |
| 65 to 74 Years | 22 (62.9%) | 0 (0.0%) |
| 75 Years and over | 40 (100.0%) | 15 (100.0%) |
Disability Class: Vision Difficulty
| Age Bracket | Male | Female |
| Under 5 Years | 0 (0.0%) | 0 (0.0%) |
| 5 to 17 Years | 0 (0.0%) | 0 (0.0%) |
| 18 to 34 Years | 0 (0.0%) | 0 (0.0%) |
| 35 to 64 Years | 0 (0.0%) | 0 (0.0%) |
| 65 to 74 Years | 0 (0.0%) | 0 (0.0%) |
| 75 Years and over | 0 (0.0%) | 0 (0.0%) |
Disability Class: Cognitive Difficulty
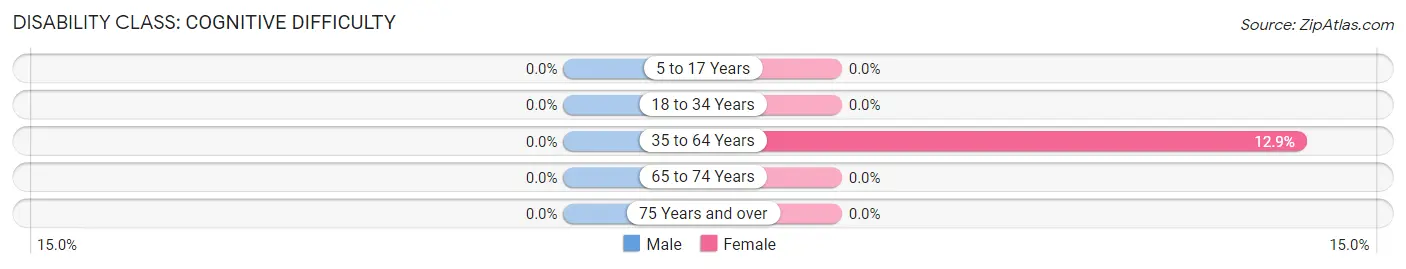
| Age Bracket | Male | Female |
| 5 to 17 Years | 0 (0.0%) | 0 (0.0%) |
| 18 to 34 Years | 0 (0.0%) | 0 (0.0%) |
| 35 to 64 Years | 0 (0.0%) | 26 (12.9%) |
| 65 to 74 Years | 0 (0.0%) | 0 (0.0%) |
| 75 Years and over | 0 (0.0%) | 0 (0.0%) |
Disability Class: Ambulatory Difficulty
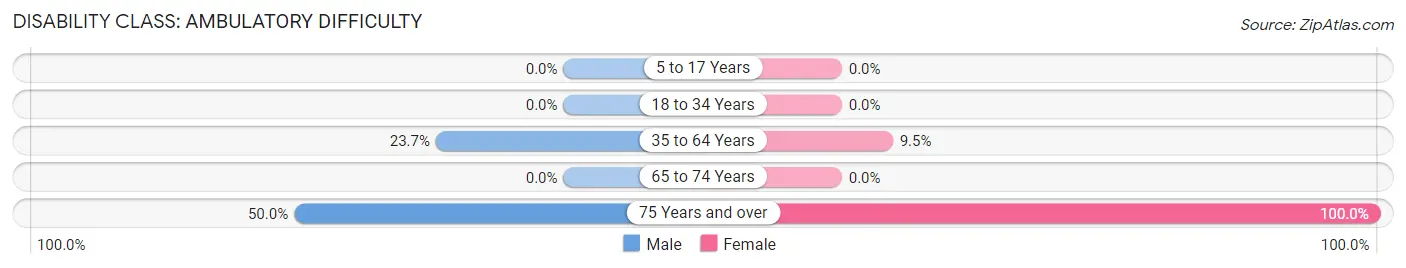
| Age Bracket | Male | Female |
| 5 to 17 Years | 0 (0.0%) | 0 (0.0%) |
| 18 to 34 Years | 0 (0.0%) | 0 (0.0%) |
| 35 to 64 Years | 63 (23.7%) | 19 (9.5%) |
| 65 to 74 Years | 0 (0.0%) | 0 (0.0%) |
| 75 Years and over | 20 (50.0%) | 15 (100.0%) |
Disability Class: Self-Care Difficulty
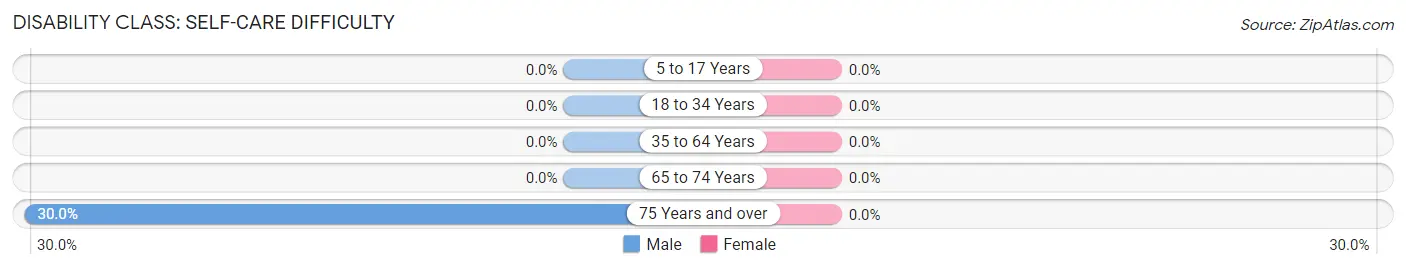
| Age Bracket | Male | Female |
| 5 to 17 Years | 0 (0.0%) | 0 (0.0%) |
| 18 to 34 Years | 0 (0.0%) | 0 (0.0%) |
| 35 to 64 Years | 0 (0.0%) | 0 (0.0%) |
| 65 to 74 Years | 0 (0.0%) | 0 (0.0%) |
| 75 Years and over | 12 (30.0%) | 0 (0.0%) |
Technology Access in North Grosvenor Dale
Computing Device Access in North Grosvenor Dale
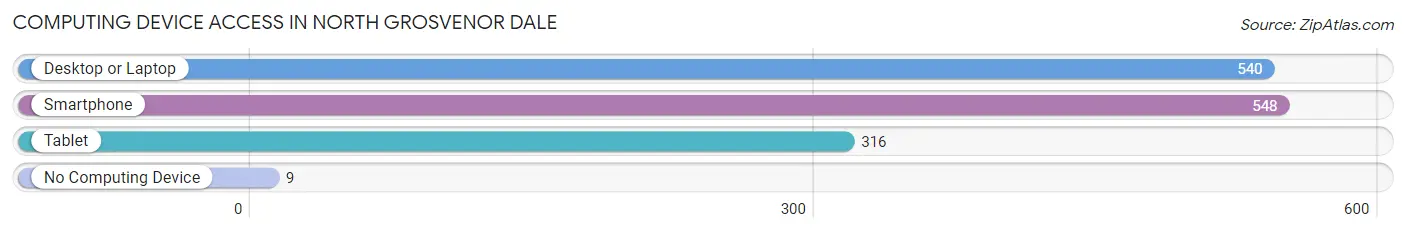
| Device Type | # Households | % Households |
| Desktop or Laptop | 540 | 92.3% |
| Smartphone | 548 | 93.7% |
| Tablet | 316 | 54.0% |
| No Computing Device | 9 | 1.5% |
| Total | 585 | 100.0% |
Internet Access in North Grosvenor Dale
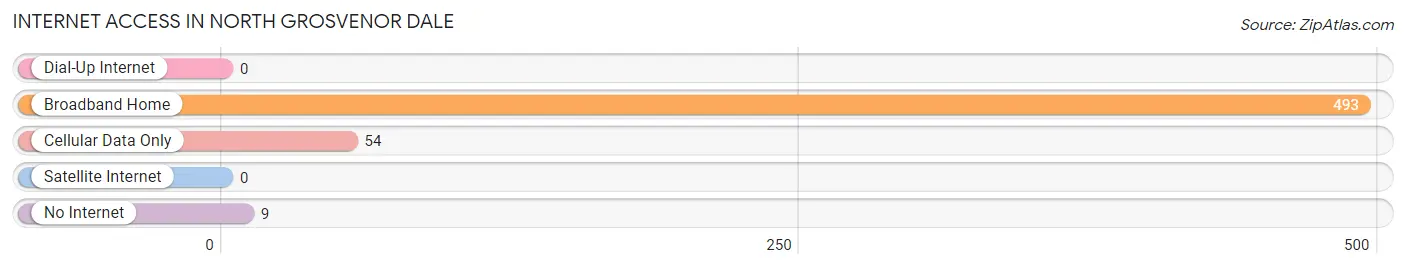
| Internet Type | # Households | % Households |
| Dial-Up Internet | 0 | 0.0% |
| Broadband Home | 493 | 84.3% |
| Cellular Data Only | 54 | 9.2% |
| Satellite Internet | 0 | 0.0% |
| No Internet | 9 | 1.5% |
| Total | 585 | 100.0% |
North Grosvenor Dale Summary
North Grosvenor Dale is a small village located in the town of Thompson in Windham County, Connecticut. It is situated on the Quinebaug River, which is a tributary of the Thames River. The village is located in the northeast corner of the state, about 10 miles from the Rhode Island border. The population of North Grosvenor Dale was 1,845 at the 2010 census.
History
North Grosvenor Dale was first settled in 1720 by a group of settlers from Massachusetts. The village was originally known as Grosvenor Dale, named after the Grosvenor family who owned the land. The village was incorporated in 1855 and the name was changed to North Grosvenor Dale to distinguish it from the nearby village of South Grosvenor Dale.
The village was an important industrial center in the 19th century, with several mills located along the Quinebaug River. The mills produced textiles, paper, and other goods. The village also had a railroad station, which was used to transport goods to and from the mills.
Geography
North Grosvenor Dale is located at 41°55'N, 71°59'W (41.917, -71.983). The village is situated on the Quinebaug River, which is a tributary of the Thames River. The village is located in the northeast corner of the state, about 10 miles from the Rhode Island border.
The village has a total area of 1.2 square miles, all of which is land. The terrain is mostly flat, with some hills in the northern part of the village. The village is located in a rural area, with forests and farmland surrounding it.
Economy
The economy of North Grosvenor Dale is largely based on agriculture and tourism. The village is home to several farms, which produce a variety of crops, including corn, soybeans, and hay. The village also has several small businesses, including restaurants, shops, and a bed and breakfast.
Tourism is an important part of the local economy. The village is home to several historic sites, including the Grosvenor Dale Historic District, which is listed on the National Register of Historic Places. The village also has several parks and recreational areas, including the Quinebaug River State Park.
Demographics
As of the 2010 census, the population of North Grosvenor Dale was 1,845. The racial makeup of the village was 95.3% White, 0.9% African American, 0.3% Native American, 0.7% Asian, 0.1% Pacific Islander, 0.7% from other races, and 2.0% from two or more races. Hispanic or Latino of any race were 2.2% of the population.
The median household income in the village was $50,938, and the median family income was $60,938. The per capita income was $25,938. About 8.3% of families and 10.3% of the population were below the poverty line, including 14.3% of those under age 18 and 5.3% of those age 65 or over.
Common Questions
What is Per Capita Income in North Grosvenor Dale?
Per Capita income in North Grosvenor Dale is $34,770.
What is the Median Family Income in North Grosvenor Dale?
Median Family Income in North Grosvenor Dale is $86,780.
What is the Median Household income in North Grosvenor Dale?
Median Household Income in North Grosvenor Dale is $85,982.
What is Income or Wage Gap in North Grosvenor Dale?
Income or Wage Gap in North Grosvenor Dale is 6.4%.
Women in North Grosvenor Dale earn 93.6 cents for every dollar earned by a man.
What is Inequality or Gini Index in North Grosvenor Dale?
Inequality or Gini Index in North Grosvenor Dale is 0.36.
What is the Total Population of North Grosvenor Dale?
Total Population of North Grosvenor Dale is 1,281.
What is the Total Male Population of North Grosvenor Dale?
Total Male Population of North Grosvenor Dale is 687.
What is the Total Female Population of North Grosvenor Dale?
Total Female Population of North Grosvenor Dale is 594.
What is the Ratio of Males per 100 Females in North Grosvenor Dale?
There are 115.66 Males per 100 Females in North Grosvenor Dale.
What is the Ratio of Females per 100 Males in North Grosvenor Dale?
There are 86.46 Females per 100 Males in North Grosvenor Dale.
What is the Median Population Age in North Grosvenor Dale?
Median Population Age in North Grosvenor Dale is 34.4 Years.
What is the Average Family Size in North Grosvenor Dale
Average Family Size in North Grosvenor Dale is 2.6 People.
What is the Average Household Size in North Grosvenor Dale
Average Household Size in North Grosvenor Dale is 2.2 People.
How Large is the Labor Force in North Grosvenor Dale?
There are 647 People in the Labor Forcein in North Grosvenor Dale.
What is the Percentage of People in the Labor Force in North Grosvenor Dale?
61.7% of People are in the Labor Force in North Grosvenor Dale.
What is the Unemployment Rate in North Grosvenor Dale?
Unemployment Rate in North Grosvenor Dale is 11.3%.