Georgetown, CT Map & Demographics
Georgetown Map
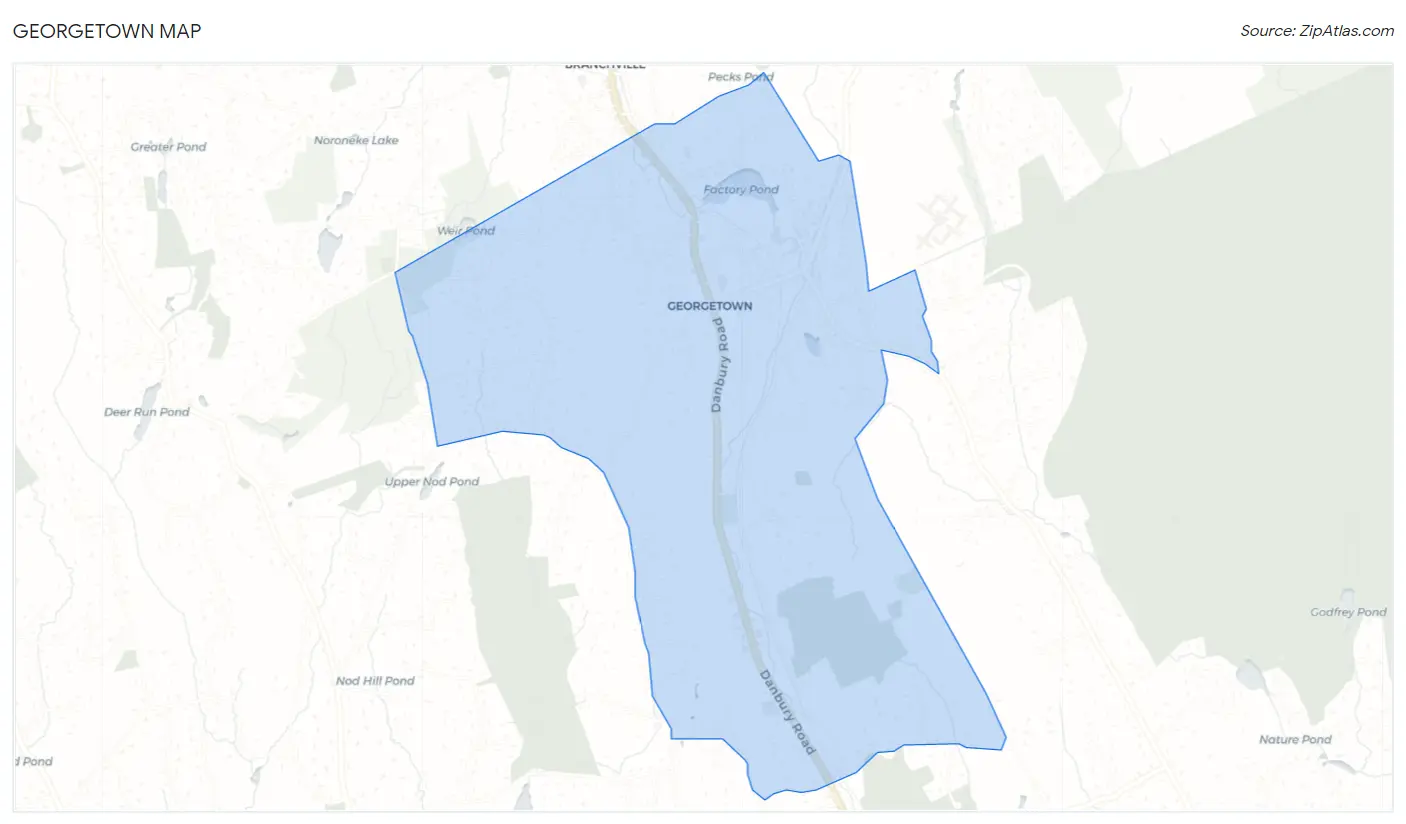
Georgetown Overview
$93,989
PER CAPITA INCOME
$216,375
AVG FAMILY INCOME
$159,242
AVG HOUSEHOLD INCOME
58.7%
WAGE / INCOME GAP [ % ]
41.3¢/ $1
WAGE / INCOME GAP [ $ ]
0.49
INEQUALITY / GINI INDEX
1,656
TOTAL POPULATION
807
MALE POPULATION
849
FEMALE POPULATION
95.05
MALES / 100 FEMALES
105.20
FEMALES / 100 MALES
47.5
MEDIAN AGE
3.1
AVG FAMILY SIZE
2.8
AVG HOUSEHOLD SIZE
1,132
LABOR FORCE [ PEOPLE ]
75.9%
PERCENT IN LABOR FORCE
8.4%
UNEMPLOYMENT RATE
Georgetown Area Codes
Income in Georgetown
Income Overview in Georgetown
Per Capita Income in Georgetown is $93,989, while median incomes of families and households are $216,375 and $159,242 respectively.
| Characteristic | Number | Measure |
| Per Capita Income | 1,656 | $93,989 |
| Median Family Income | 433 | $216,375 |
| Mean Family Income | 433 | $299,143 |
| Median Household Income | 590 | $159,242 |
| Mean Household Income | 590 | $251,350 |
| Income Deficit | 433 | $0 |
| Wage / Income Gap (%) | 1,656 | 58.65% |
| Wage / Income Gap ($) | 1,656 | 41.35¢ per $1 |
| Gini / Inequality Index | 1,656 | 0.49 |
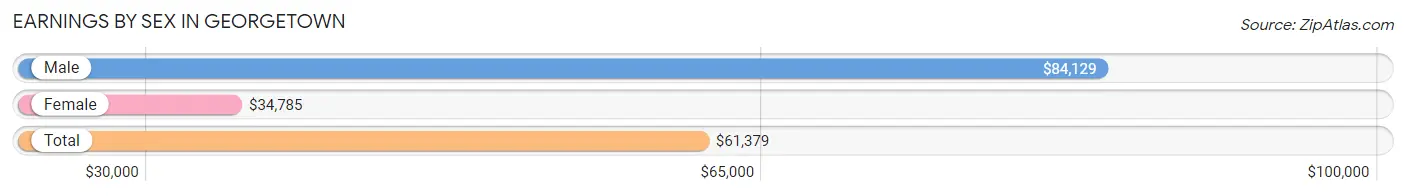
Earnings by Sex in Georgetown
Average Earnings in Georgetown are $61,379, $84,129 for men and $34,785 for women, a difference of 58.7%.
| Sex | Number | Average Earnings |
| Male | 503 (45.0%) | $84,129 |
| Female | 615 (55.0%) | $34,785 |
| Total | 1,118 (100.0%) | $61,379 |
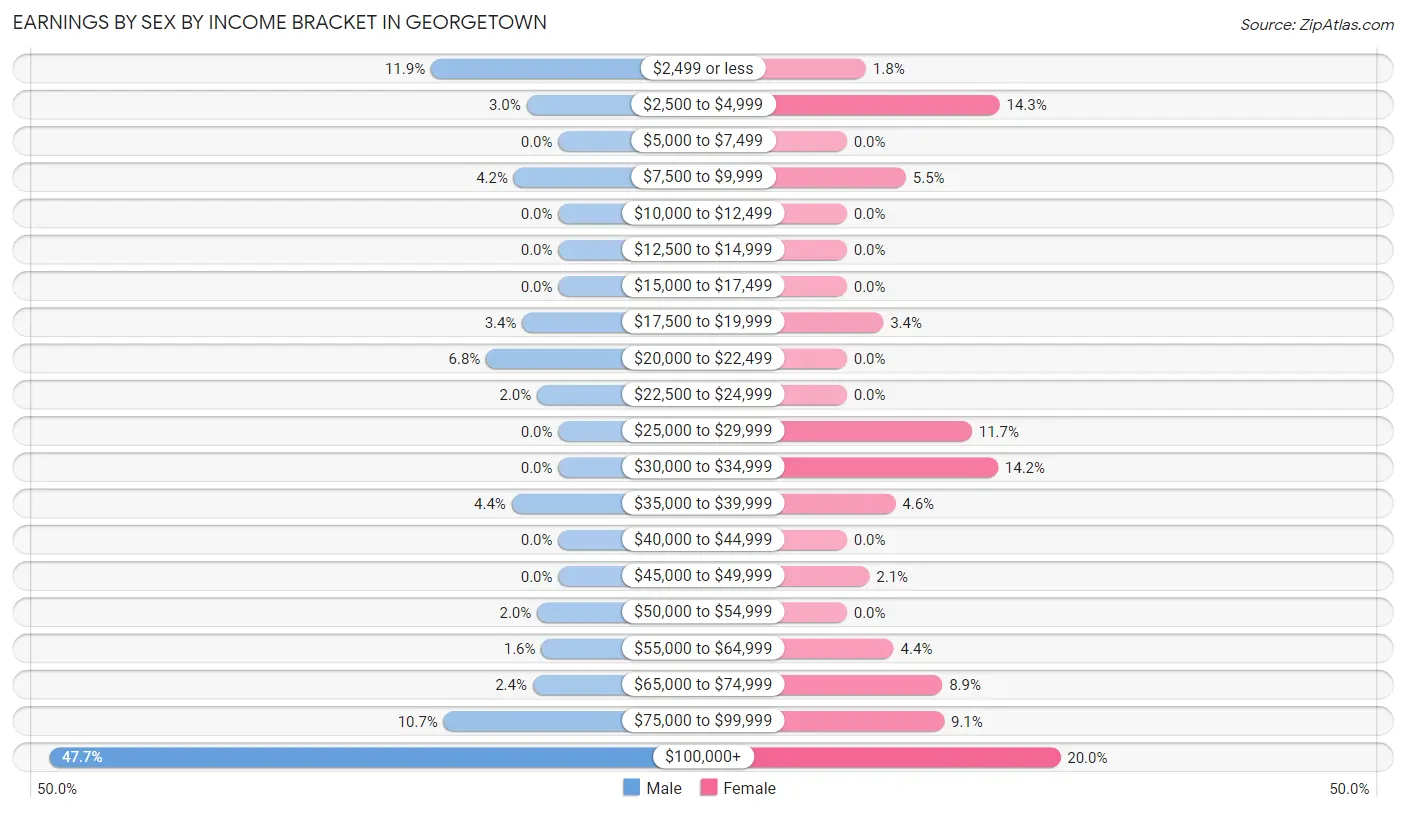
Earnings by Sex by Income Bracket in Georgetown
The most common earnings brackets in Georgetown are $100,000+ for men (240 | 47.7%) and $100,000+ for women (123 | 20.0%).
| Income | Male | Female |
| $2,499 or less | 60 (11.9%) | 11 (1.8%) |
| $2,500 to $4,999 | 15 (3.0%) | 88 (14.3%) |
| $5,000 to $7,499 | 0 (0.0%) | 0 (0.0%) |
| $7,500 to $9,999 | 21 (4.2%) | 34 (5.5%) |
| $10,000 to $12,499 | 0 (0.0%) | 0 (0.0%) |
| $12,500 to $14,999 | 0 (0.0%) | 0 (0.0%) |
| $15,000 to $17,499 | 0 (0.0%) | 0 (0.0%) |
| $17,500 to $19,999 | 17 (3.4%) | 21 (3.4%) |
| $20,000 to $22,499 | 34 (6.8%) | 0 (0.0%) |
| $22,500 to $24,999 | 10 (2.0%) | 0 (0.0%) |
| $25,000 to $29,999 | 0 (0.0%) | 72 (11.7%) |
| $30,000 to $34,999 | 0 (0.0%) | 87 (14.1%) |
| $35,000 to $39,999 | 22 (4.4%) | 28 (4.5%) |
| $40,000 to $44,999 | 0 (0.0%) | 0 (0.0%) |
| $45,000 to $49,999 | 0 (0.0%) | 13 (2.1%) |
| $50,000 to $54,999 | 10 (2.0%) | 0 (0.0%) |
| $55,000 to $64,999 | 8 (1.6%) | 27 (4.4%) |
| $65,000 to $74,999 | 12 (2.4%) | 55 (8.9%) |
| $75,000 to $99,999 | 54 (10.7%) | 56 (9.1%) |
| $100,000+ | 240 (47.7%) | 123 (20.0%) |
| Total | 503 (100.0%) | 615 (100.0%) |
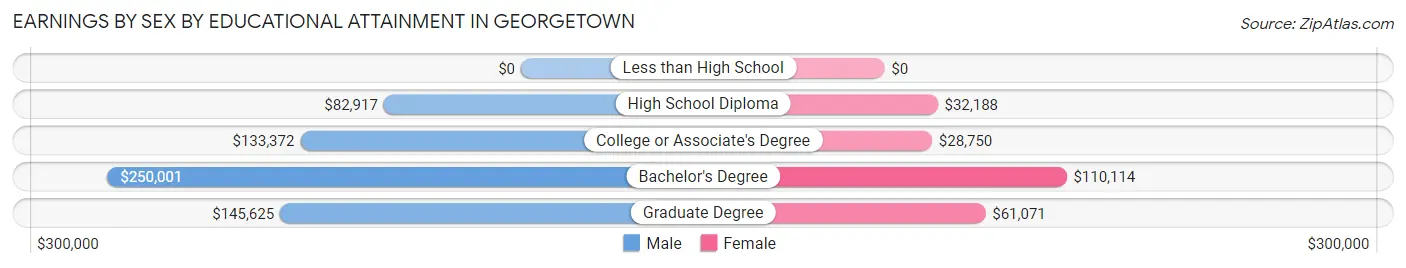
Earnings by Sex by Educational Attainment in Georgetown
| Educational Attainment | Male Income | Female Income |
| Less than High School | - | - |
| High School Diploma | $82,917 | $32,188 |
| College or Associate's Degree | $133,372 | $28,750 |
| Bachelor's Degree | $250,001 | $110,114 |
| Graduate Degree | $145,625 | $61,071 |
| Total | $133,605 | $0 |
Family Income in Georgetown
Family Income Brackets in Georgetown
According to the Georgetown family income data, there are 222 families falling into the $200,000+ income range, which is the most common income bracket and makes up 51.3% of all families.
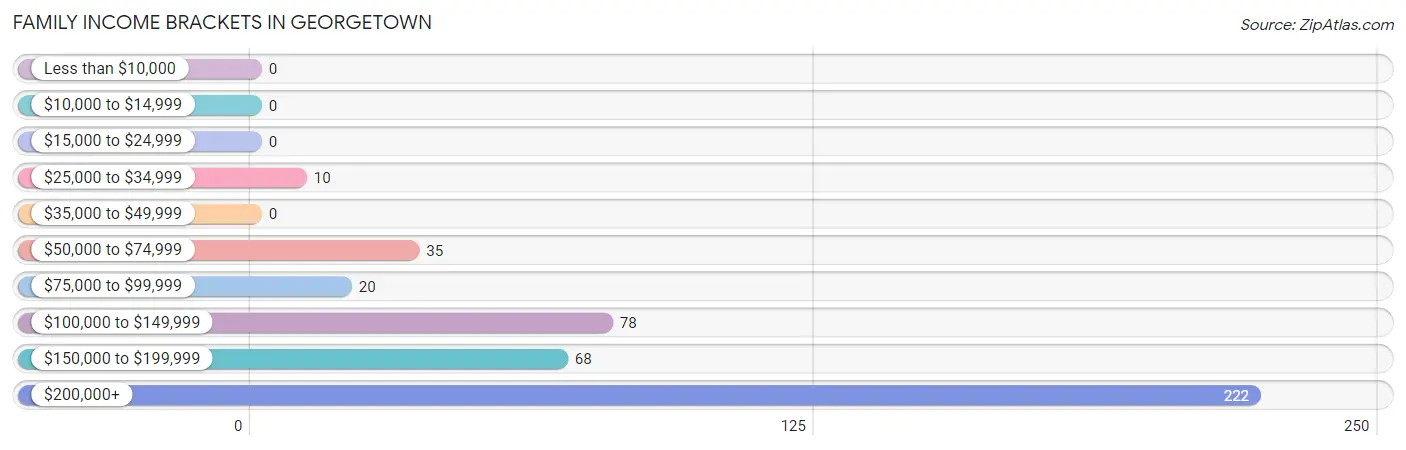
| Income Bracket | # Families | % Families |
| Less than $10,000 | 0 | 0.0% |
| $10,000 to $14,999 | 0 | 0.0% |
| $15,000 to $24,999 | 0 | 0.0% |
| $25,000 to $34,999 | 10 | 2.3% |
| $35,000 to $49,999 | 0 | 0.0% |
| $50,000 to $74,999 | 35 | 8.1% |
| $75,000 to $99,999 | 20 | 4.6% |
| $100,000 to $149,999 | 78 | 18.0% |
| $150,000 to $199,999 | 68 | 15.7% |
| $200,000+ | 222 | 51.3% |
Family Income by Famaliy Size in Georgetown
4-person families (82 | 18.9%) account for the highest median family income in Georgetown with $250,001 per family, while 4-person families (82 | 18.9%) have the highest median income of $62,500 per family member.
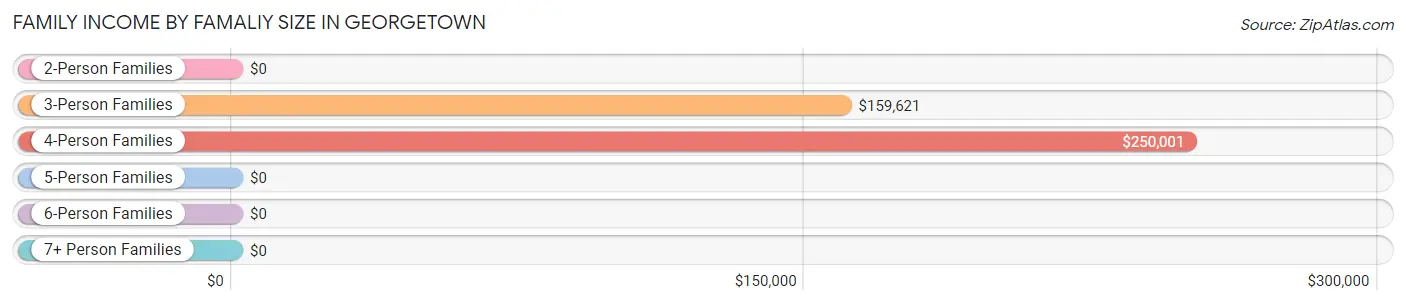
| Income Bracket | # Families | Median Income |
| 2-Person Families | 187 (43.2%) | $0 |
| 3-Person Families | 154 (35.6%) | $159,621 |
| 4-Person Families | 82 (18.9%) | $250,001 |
| 5-Person Families | 10 (2.3%) | $0 |
| 6-Person Families | 0 (0.0%) | $0 |
| 7+ Person Families | 0 (0.0%) | $0 |
| Total | 433 (100.0%) | $216,375 |
Family Income by Number of Earners in Georgetown
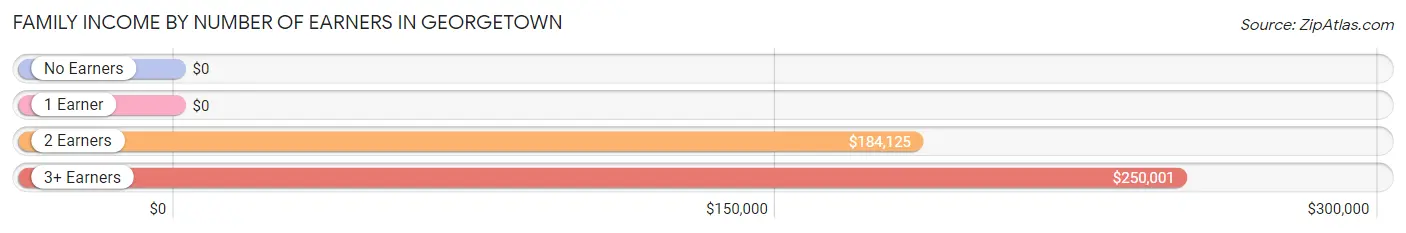
| Number of Earners | # Families | Median Income |
| No Earners | 75 (17.3%) | $0 |
| 1 Earner | 130 (30.0%) | $0 |
| 2 Earners | 83 (19.2%) | $184,125 |
| 3+ Earners | 145 (33.5%) | $250,001 |
| Total | 433 (100.0%) | $216,375 |
Household Income in Georgetown
Household Income Brackets in Georgetown
With 222 households falling in the category, the $200,000+ income range is the most frequent in Georgetown, accounting for 37.6% of all households.
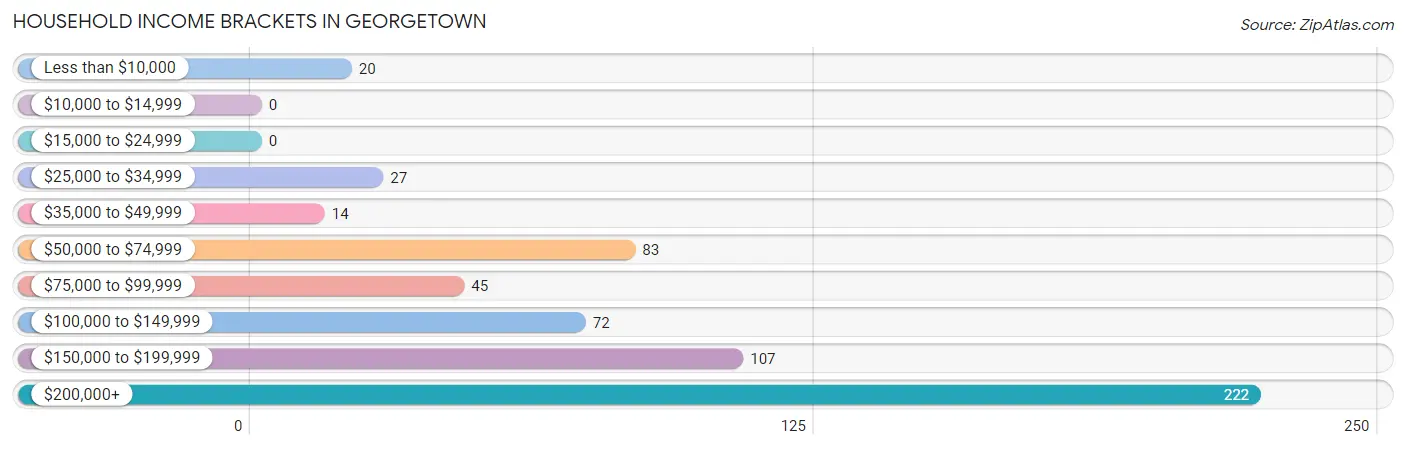
| Income Bracket | # Households | % Households |
| Less than $10,000 | 20 | 3.4% |
| $10,000 to $14,999 | 0 | 0.0% |
| $15,000 to $24,999 | 0 | 0.0% |
| $25,000 to $34,999 | 27 | 4.6% |
| $35,000 to $49,999 | 14 | 2.4% |
| $50,000 to $74,999 | 83 | 14.1% |
| $75,000 to $99,999 | 45 | 7.6% |
| $100,000 to $149,999 | 72 | 12.2% |
| $150,000 to $199,999 | 107 | 18.1% |
| $200,000+ | 222 | 37.6% |
Household Income by Householder Age in Georgetown
The median household income in Georgetown is $159,242, with the highest median household income of $185,625 found in the 45 to 64 years age bracket for the primary householder. A total of 282 households (47.8%) fall into this category.
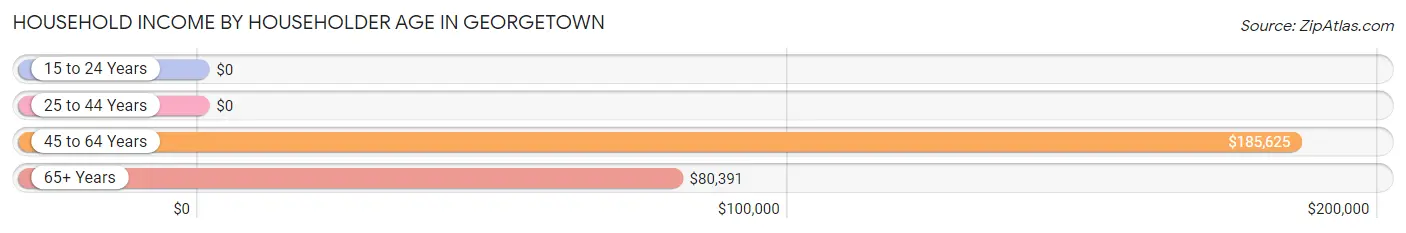
| Income Bracket | # Households | Median Income |
| 15 to 24 Years | 0 (0.0%) | $0 |
| 25 to 44 Years | 139 (23.6%) | $0 |
| 45 to 64 Years | 282 (47.8%) | $185,625 |
| 65+ Years | 169 (28.6%) | $80,391 |
| Total | 590 (100.0%) | $159,242 |
Poverty in Georgetown
Income Below Poverty by Sex and Age in Georgetown
With 1.4% poverty level for males and 1.2% for females among the residents of Georgetown, 45 to 54 year old males and 75 year old and over females are the most vulnerable to poverty, with 10 males (7.1%) and 10 females (12.8%) in their respective age groups living below the poverty level.
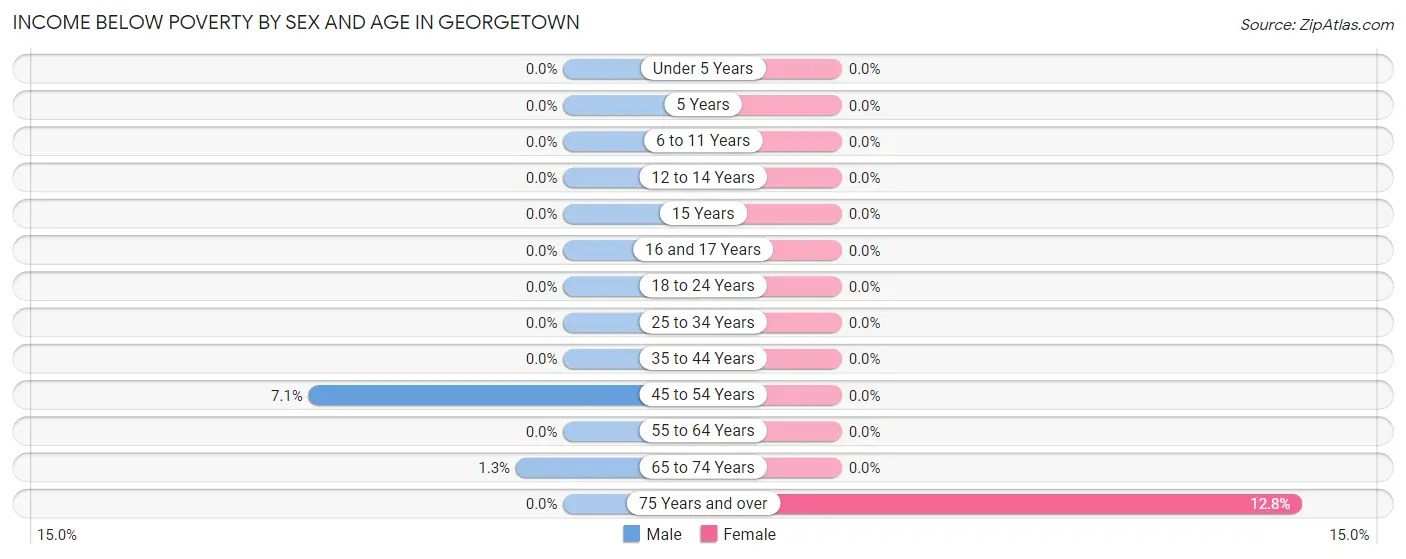
| Age Bracket | Male | Female |
| Under 5 Years | 0 (0.0%) | 0 (0.0%) |
| 5 Years | 0 (0.0%) | 0 (0.0%) |
| 6 to 11 Years | 0 (0.0%) | 0 (0.0%) |
| 12 to 14 Years | 0 (0.0%) | 0 (0.0%) |
| 15 Years | 0 (0.0%) | 0 (0.0%) |
| 16 and 17 Years | 0 (0.0%) | 0 (0.0%) |
| 18 to 24 Years | 0 (0.0%) | 0 (0.0%) |
| 25 to 34 Years | 0 (0.0%) | 0 (0.0%) |
| 35 to 44 Years | 0 (0.0%) | 0 (0.0%) |
| 45 to 54 Years | 10 (7.1%) | 0 (0.0%) |
| 55 to 64 Years | 0 (0.0%) | 0 (0.0%) |
| 65 to 74 Years | 1 (1.3%) | 0 (0.0%) |
| 75 Years and over | 0 (0.0%) | 10 (12.8%) |
| Total | 11 (1.4%) | 10 (1.2%) |
Income Above Poverty by Sex and Age in Georgetown
According to the poverty statistics in Georgetown, males aged under 5 years and females aged 5 years are the age groups that are most secure financially, with 100.0% of males and 100.0% of females in these age groups living above the poverty line.
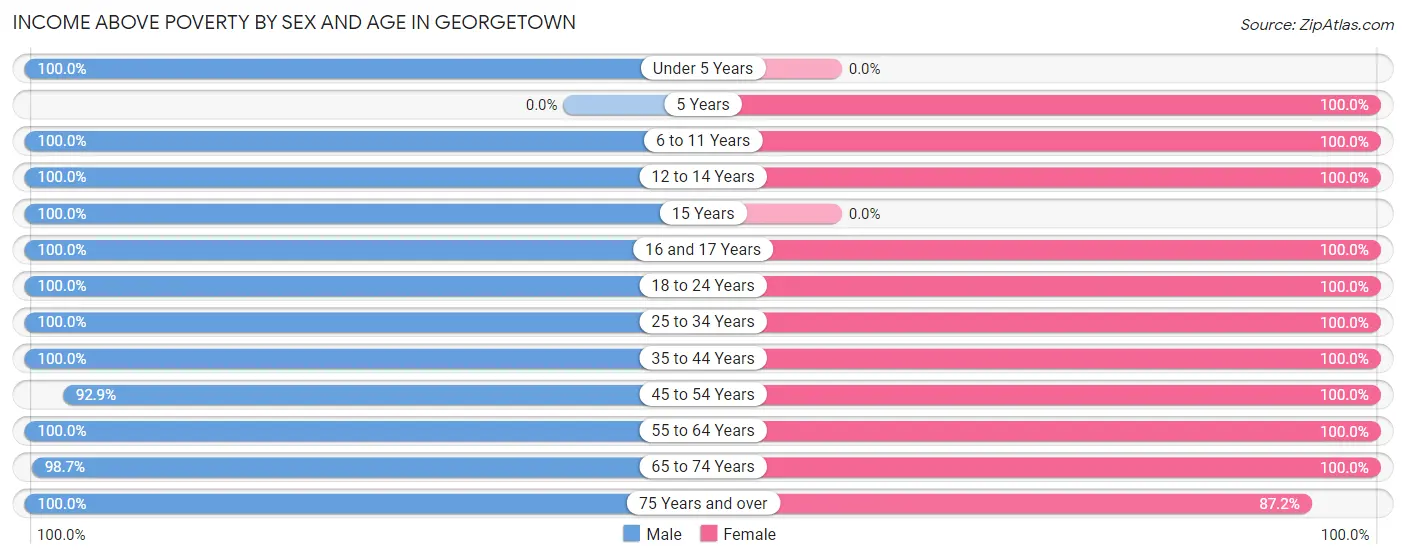
| Age Bracket | Male | Female |
| Under 5 Years | 86 (100.0%) | 0 (0.0%) |
| 5 Years | 0 (0.0%) | 10 (100.0%) |
| 6 to 11 Years | 22 (100.0%) | 5 (100.0%) |
| 12 to 14 Years | 14 (100.0%) | 21 (100.0%) |
| 15 Years | 6 (100.0%) | 0 (0.0%) |
| 16 and 17 Years | 60 (100.0%) | 22 (100.0%) |
| 18 to 24 Years | 53 (100.0%) | 224 (100.0%) |
| 25 to 34 Years | 53 (100.0%) | 67 (100.0%) |
| 35 to 44 Years | 92 (100.0%) | 83 (100.0%) |
| 45 to 54 Years | 131 (92.9%) | 158 (100.0%) |
| 55 to 64 Years | 82 (100.0%) | 125 (100.0%) |
| 65 to 74 Years | 75 (98.7%) | 56 (100.0%) |
| 75 Years and over | 122 (100.0%) | 68 (87.2%) |
| Total | 796 (98.6%) | 839 (98.8%) |
Income Below Poverty Among Married-Couple Families in Georgetown
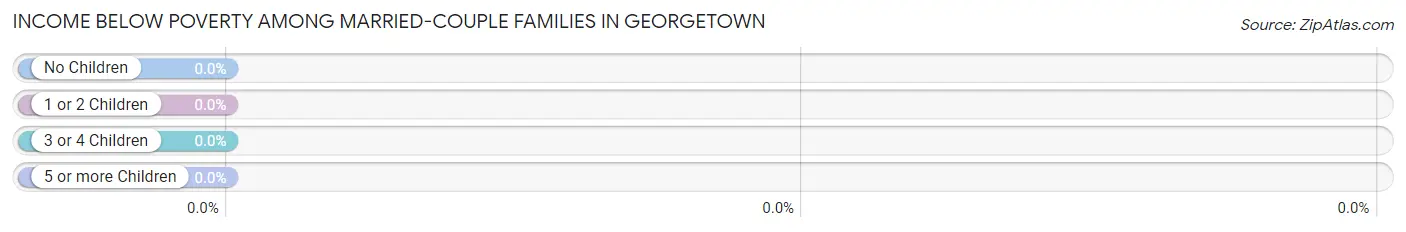
| Children | Above Poverty | Below Poverty |
| No Children | 202 (100.0%) | 0 (0.0%) |
| 1 or 2 Children | 39 (100.0%) | 0 (0.0%) |
| 3 or 4 Children | 0 (0.0%) | 0 (0.0%) |
| 5 or more Children | 0 (0.0%) | 0 (0.0%) |
| Total | 241 (100.0%) | 0 (0.0%) |
Income Below Poverty Among Single-Parent Households in Georgetown
| Children | Single Father | Single Mother |
| No Children | 0 (0.0%) | 0 (0.0%) |
| 1 or 2 Children | 0 (0.0%) | 0 (0.0%) |
| 3 or 4 Children | 0 (0.0%) | 0 (0.0%) |
| 5 or more Children | 0 (0.0%) | 0 (0.0%) |
| Total | 0 (0.0%) | 0 (0.0%) |
Income Below Poverty Among Married-Couple vs Single-Parent Households in Georgetown
| Children | Married-Couple Families | Single-Parent Households |
| No Children | 0 (0.0%) | 0 (0.0%) |
| 1 or 2 Children | 0 (0.0%) | 0 (0.0%) |
| 3 or 4 Children | 0 (0.0%) | 0 (0.0%) |
| 5 or more Children | 0 (0.0%) | 0 (0.0%) |
| Total | 0 (0.0%) | 0 (0.0%) |
Race in Georgetown
The most populous races in Georgetown are White / Caucasian (1,473 | 88.9%), Two or more Races (153 | 9.2%), and Hispanic or Latino (63 | 3.8%).
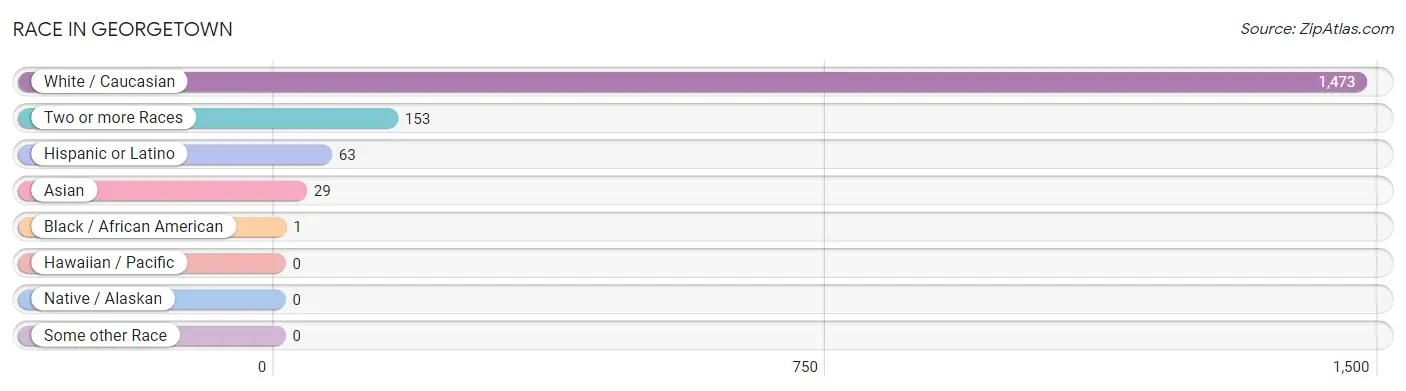
| Race | # Population | % Population |
| Asian | 29 | 1.8% |
| Black / African American | 1 | 0.1% |
| Hawaiian / Pacific | 0 | 0.0% |
| Hispanic or Latino | 63 | 3.8% |
| Native / Alaskan | 0 | 0.0% |
| White / Caucasian | 1,473 | 88.9% |
| Two or more Races | 153 | 9.2% |
| Some other Race | 0 | 0.0% |
| Total | 1,656 | 100.0% |
Ancestry in Georgetown
The most populous ancestries reported in Georgetown are Irish (414 | 25.0%), Italian (402 | 24.3%), German (262 | 15.8%), Albanian (122 | 7.4%), and Korean (107 | 6.5%), together accounting for 78.9% of all Georgetown residents.
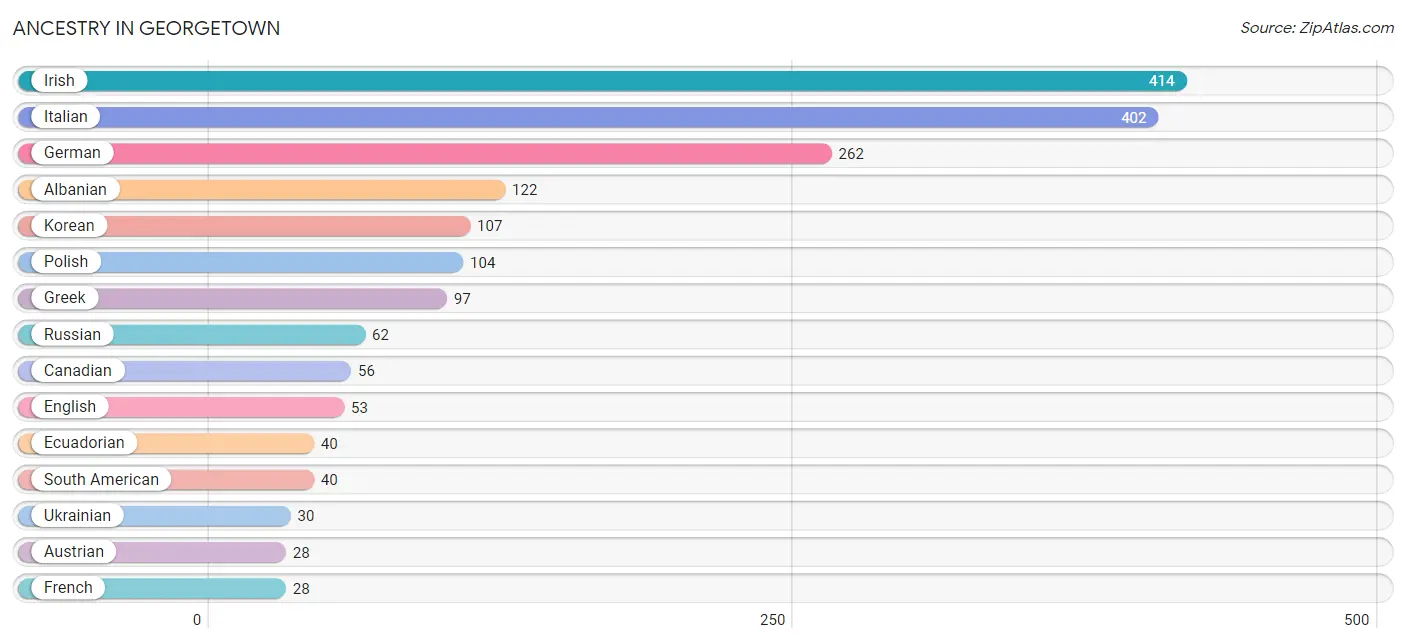
| Ancestry | # Population | % Population |
| Albanian | 122 | 7.4% |
| American | 9 | 0.5% |
| Austrian | 28 | 1.7% |
| Belgian | 19 | 1.1% |
| Burmese | 14 | 0.9% |
| Canadian | 56 | 3.4% |
| Ecuadorian | 40 | 2.4% |
| English | 53 | 3.2% |
| European | 10 | 0.6% |
| French | 28 | 1.7% |
| German | 262 | 15.8% |
| Greek | 97 | 5.9% |
| Hungarian | 26 | 1.6% |
| Irish | 414 | 25.0% |
| Italian | 402 | 24.3% |
| Japanese | 13 | 0.8% |
| Korean | 107 | 6.5% |
| Northern European | 17 | 1.0% |
| Norwegian | 15 | 0.9% |
| Polish | 104 | 6.3% |
| Puerto Rican | 23 | 1.4% |
| Russian | 62 | 3.7% |
| Scotch-Irish | 9 | 0.5% |
| Scottish | 8 | 0.5% |
| South American | 40 | 2.4% |
| Swedish | 7 | 0.4% |
| Swiss | 19 | 1.1% |
| Trinidadian and Tobagonian | 1 | 0.1% |
| Ukrainian | 30 | 1.8% | View All 29 Rows |
Immigrants in Georgetown
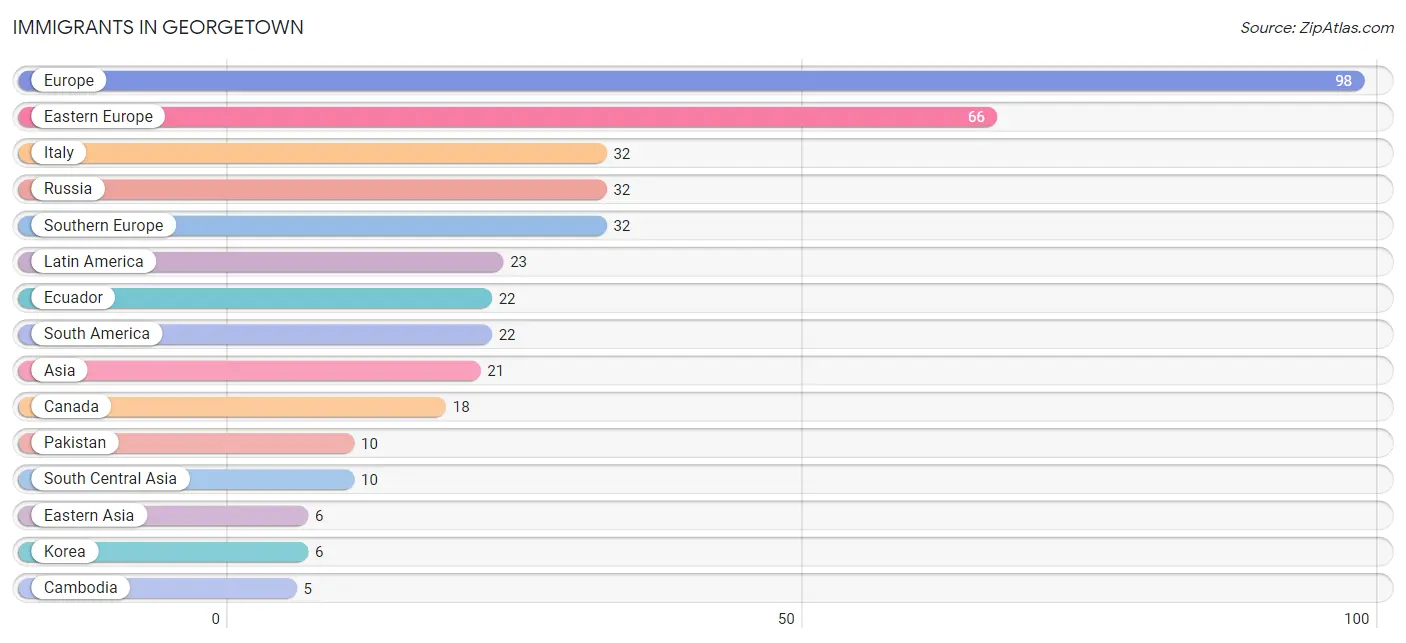
The most numerous immigrant groups reported in Georgetown came from Europe (98 | 5.9%), Eastern Europe (66 | 4.0%), Italy (32 | 1.9%), Russia (32 | 1.9%), and Southern Europe (32 | 1.9%), together accounting for 15.7% of all Georgetown residents.
| Immigration Origin | # Population | % Population |
| Asia | 21 | 1.3% |
| Cambodia | 5 | 0.3% |
| Canada | 18 | 1.1% |
| Caribbean | 1 | 0.1% |
| Eastern Asia | 6 | 0.4% |
| Eastern Europe | 66 | 4.0% |
| Ecuador | 22 | 1.3% |
| Europe | 98 | 5.9% |
| Italy | 32 | 1.9% |
| Korea | 6 | 0.4% |
| Latin America | 23 | 1.4% |
| Pakistan | 10 | 0.6% |
| Russia | 32 | 1.9% |
| South America | 22 | 1.3% |
| South Central Asia | 10 | 0.6% |
| South Eastern Asia | 5 | 0.3% |
| Southern Europe | 32 | 1.9% |
| Trinidad and Tobago | 1 | 0.1% | View All 18 Rows |
Sex and Age in Georgetown
Sex and Age in Georgetown
The most populous age groups in Georgetown are Under 5 Years (86 | 10.7%) for men and 20 to 24 Years (224 | 26.4%) for women.
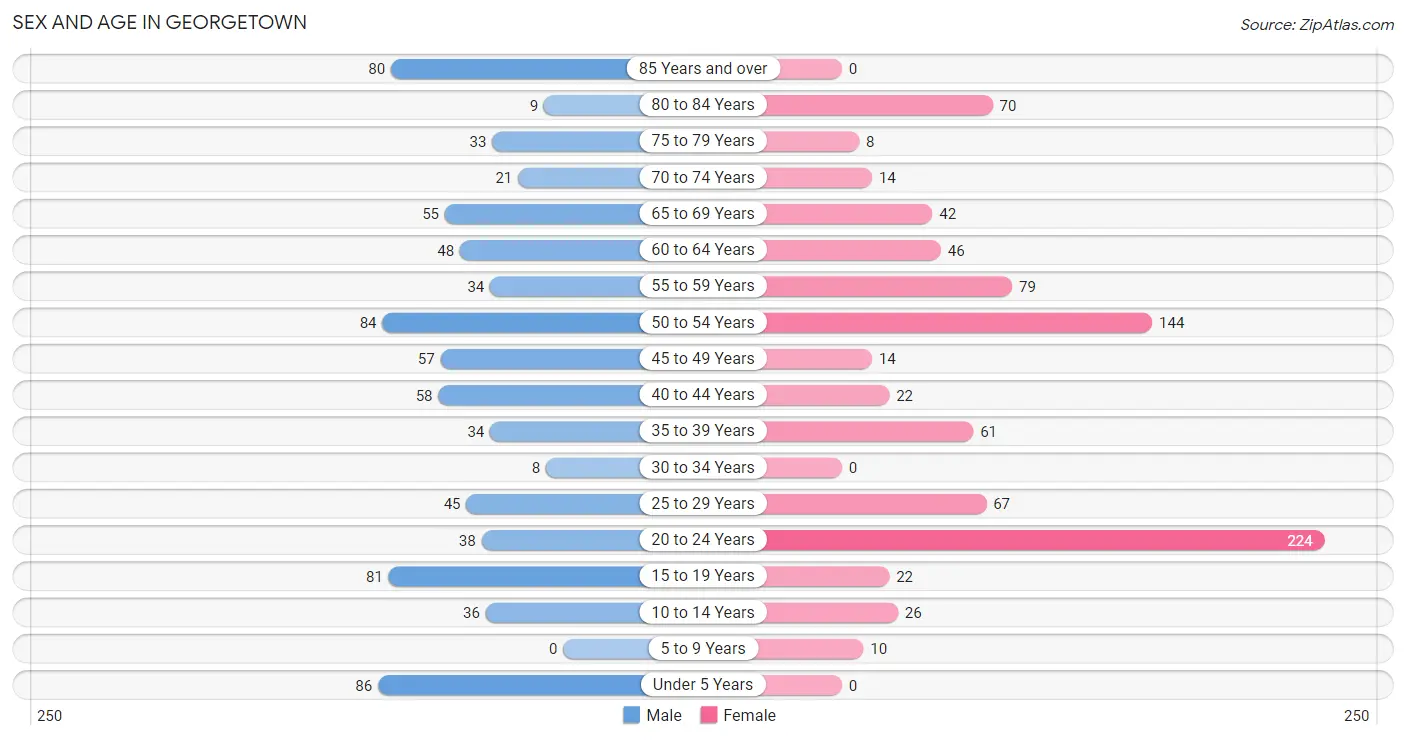
| Age Bracket | Male | Female |
| Under 5 Years | 86 (10.7%) | 0 (0.0%) |
| 5 to 9 Years | 0 (0.0%) | 10 (1.2%) |
| 10 to 14 Years | 36 (4.5%) | 26 (3.1%) |
| 15 to 19 Years | 81 (10.0%) | 22 (2.6%) |
| 20 to 24 Years | 38 (4.7%) | 224 (26.4%) |
| 25 to 29 Years | 45 (5.6%) | 67 (7.9%) |
| 30 to 34 Years | 8 (1.0%) | 0 (0.0%) |
| 35 to 39 Years | 34 (4.2%) | 61 (7.2%) |
| 40 to 44 Years | 58 (7.2%) | 22 (2.6%) |
| 45 to 49 Years | 57 (7.1%) | 14 (1.7%) |
| 50 to 54 Years | 84 (10.4%) | 144 (17.0%) |
| 55 to 59 Years | 34 (4.2%) | 79 (9.3%) |
| 60 to 64 Years | 48 (5.9%) | 46 (5.4%) |
| 65 to 69 Years | 55 (6.8%) | 42 (5.0%) |
| 70 to 74 Years | 21 (2.6%) | 14 (1.7%) |
| 75 to 79 Years | 33 (4.1%) | 8 (0.9%) |
| 80 to 84 Years | 9 (1.1%) | 70 (8.2%) |
| 85 Years and over | 80 (9.9%) | 0 (0.0%) |
| Total | 807 (100.0%) | 849 (100.0%) |
Families and Households in Georgetown
Median Family Size in Georgetown
The median family size in Georgetown is 3.15 persons per family, with single male/father families (154 | 35.6%) accounting for the largest median family size of 3.29 persons per family. On the other hand, single female/mother families (38 | 8.8%) represent the smallest median family size with 2.89 persons per family.
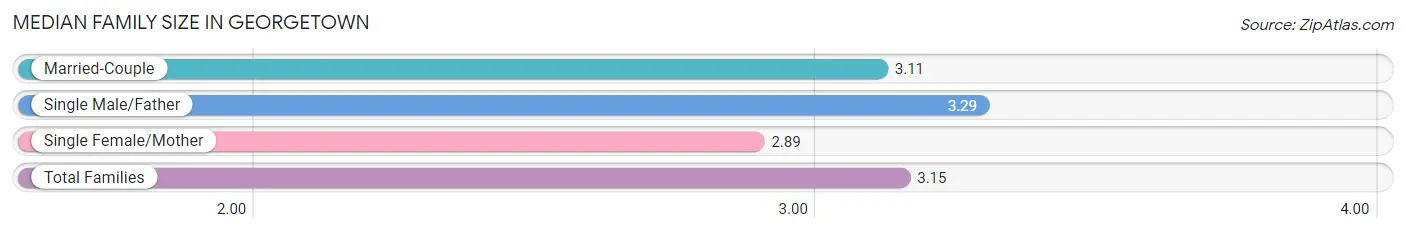
| Family Type | # Families | Family Size |
| Married-Couple | 241 (55.7%) | 3.11 |
| Single Male/Father | 154 (35.6%) | 3.29 |
| Single Female/Mother | 38 (8.8%) | 2.89 |
| Total Families | 433 (100.0%) | 3.15 |
Median Household Size in Georgetown
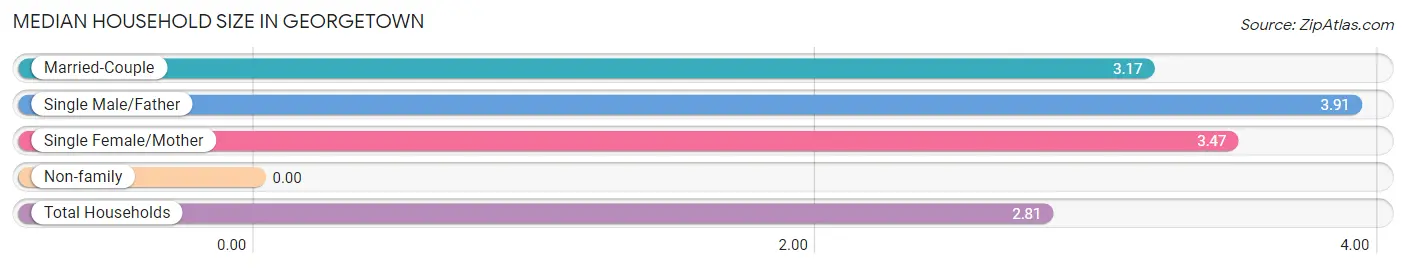
| Household Type | # Households | Household Size |
| Married-Couple | 241 (40.8%) | 3.17 |
| Single Male/Father | 154 (26.1%) | 3.91 |
| Single Female/Mother | 38 (6.4%) | 3.47 |
| Non-family | 157 (26.6%) | - |
| Total Households | 590 (100.0%) | 2.81 |
Household Size by Marriage Status in Georgetown
Out of a total of 590 households in Georgetown, 433 (73.4%) are family households, while 157 (26.6%) are nonfamily households. The most numerous type of family households are 4-person households, comprising 145, and the most common type of nonfamily households are 1-person households, comprising 157.
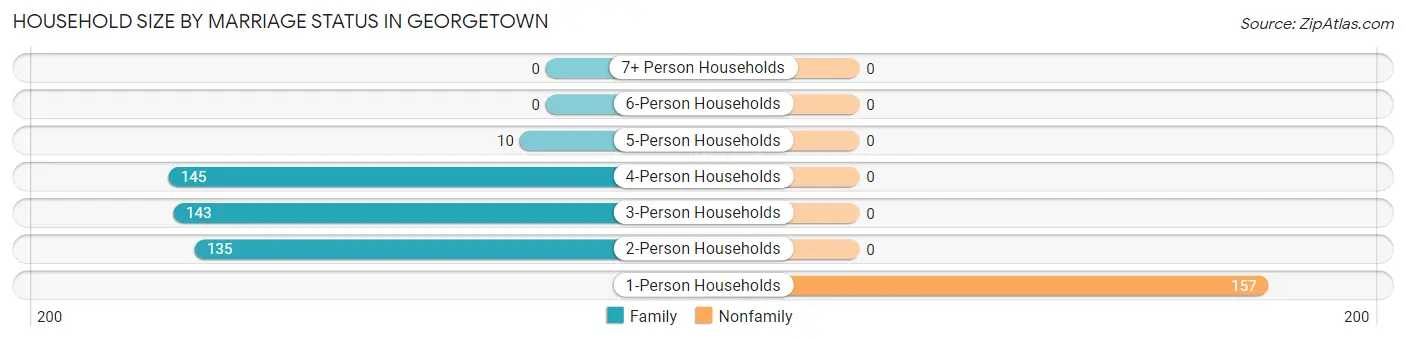
| Household Size | Family Households | Nonfamily Households |
| 1-Person Households | - | 157 (26.6%) |
| 2-Person Households | 135 (22.9%) | 0 (0.0%) |
| 3-Person Households | 143 (24.2%) | 0 (0.0%) |
| 4-Person Households | 145 (24.6%) | 0 (0.0%) |
| 5-Person Households | 10 (1.7%) | 0 (0.0%) |
| 6-Person Households | 0 (0.0%) | 0 (0.0%) |
| 7+ Person Households | 0 (0.0%) | 0 (0.0%) |
| Total | 433 (73.4%) | 157 (26.6%) |
Female Fertility in Georgetown
Fertility by Age in Georgetown
| Age Bracket | Women with Births | Births / 1,000 Women |
| 15 to 19 years | 0 (0.0%) | 0.0 |
| 20 to 34 years | 0 (0.0%) | 0.0 |
| 35 to 50 years | 0 (0.0%) | 0.0 |
| Total | 0 (0.0%) | 0.0 |
Fertility by Age by Marriage Status in Georgetown
| Age Bracket | Married | Unmarried |
| 15 to 19 years | 0 (0.0%) | 0 (0.0%) |
| 20 to 34 years | 0 (0.0%) | 0 (0.0%) |
| 35 to 50 years | 0 (0.0%) | 0 (0.0%) |
| Total | 0 (0.0%) | 0 (0.0%) |
Fertility by Education in Georgetown
| Educational Attainment | Women with Births | Births / 1,000 Women |
| Less than High School | 0 (0.0%) | 0.0 |
| High School Diploma | 0 (0.0%) | 0.0 |
| College or Associate's Degree | 0 (0.0%) | 0.0 |
| Bachelor's Degree | 0 (0.0%) | 0.0 |
| Graduate Degree | 0 (0.0%) | 0.0 |
| Total | 0 (0.0%) | 0.0 |
Fertility by Education by Marriage Status in Georgetown
| Educational Attainment | Married | Unmarried |
| Less than High School | 0 (0.0%) | 0 (0.0%) |
| High School Diploma | 0 (0.0%) | 0 (0.0%) |
| College or Associate's Degree | 0 (0.0%) | 0 (0.0%) |
| Bachelor's Degree | 0 (0.0%) | 0 (0.0%) |
| Graduate Degree | 0 (0.0%) | 0 (0.0%) |
| Total | 0 (0.0%) | 0 (0.0%) |
Employment Characteristics in Georgetown
Employment by Class of Employer in Georgetown
Among the 1,037 employed individuals in Georgetown, private company employees (817 | 78.8%), self-employed (not incorporated) (102 | 9.8%), and self-employed (incorporated) (44 | 4.2%) make up the most common classes of employment.
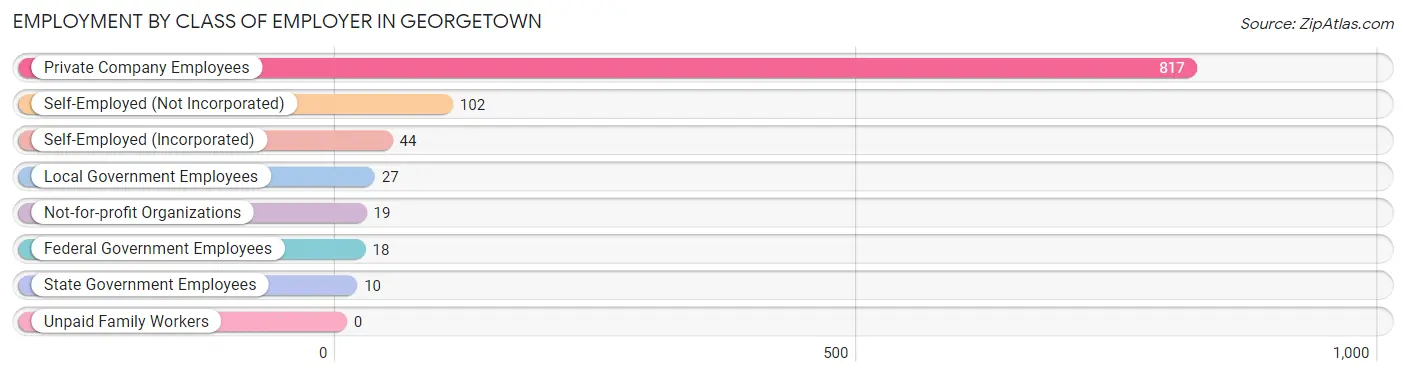
| Employer Class | # Employees | % Employees |
| Private Company Employees | 817 | 78.8% |
| Self-Employed (Incorporated) | 44 | 4.2% |
| Self-Employed (Not Incorporated) | 102 | 9.8% |
| Not-for-profit Organizations | 19 | 1.8% |
| Local Government Employees | 27 | 2.6% |
| State Government Employees | 10 | 1.0% |
| Federal Government Employees | 18 | 1.7% |
| Unpaid Family Workers | 0 | 0.0% |
| Total | 1,037 | 100.0% |
Employment Status by Age in Georgetown
According to the labor force statistics for Georgetown, out of the total population over 16 years of age (1,492), 75.9% or 1,132 individuals are in the labor force, with 8.4% or 95 of them unemployed. The age group with the highest labor force participation rate is 30 to 34 years, with 100.0% or 8 individuals in the labor force. Within the labor force, the 20 to 24 years age range has the highest percentage of unemployed individuals, with 30.0% or 73 of them being unemployed.
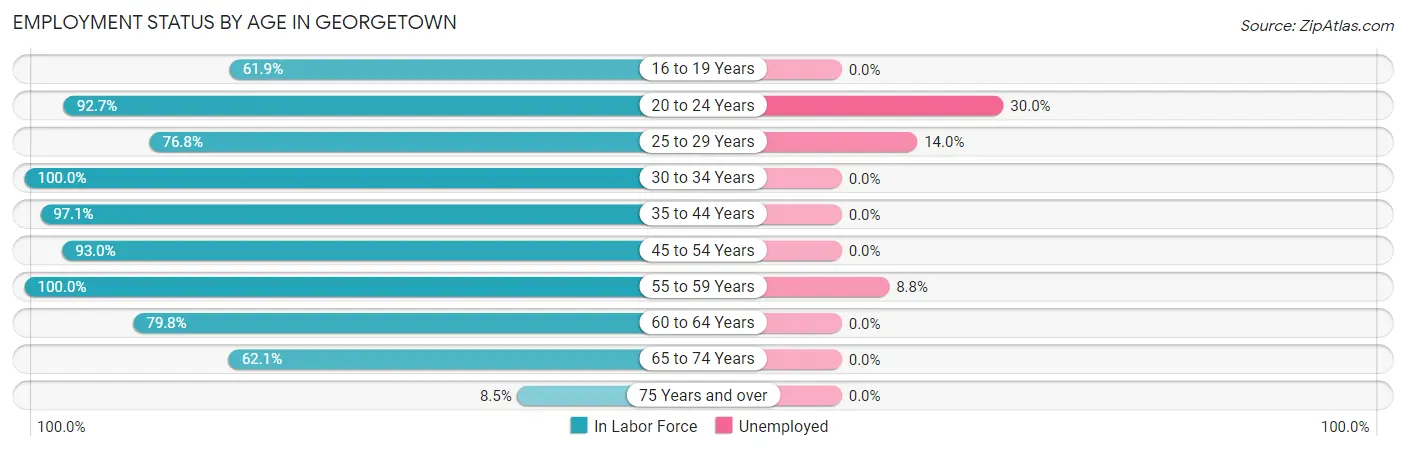
| Age Bracket | In Labor Force | Unemployed |
| 16 to 19 Years | 60 (61.9%) | 0 (0.0%) |
| 20 to 24 Years | 243 (92.7%) | 73 (30.0%) |
| 25 to 29 Years | 86 (76.8%) | 12 (14.0%) |
| 30 to 34 Years | 8 (100.0%) | 0 (0.0%) |
| 35 to 44 Years | 170 (97.1%) | 0 (0.0%) |
| 45 to 54 Years | 278 (93.0%) | 0 (0.0%) |
| 55 to 59 Years | 113 (100.0%) | 10 (8.8%) |
| 60 to 64 Years | 75 (79.8%) | 0 (0.0%) |
| 65 to 74 Years | 82 (62.1%) | 0 (0.0%) |
| 75 Years and over | 17 (8.5%) | 0 (0.0%) |
| Total | 1,132 (75.9%) | 95 (8.4%) |
Employment Status by Educational Attainment in Georgetown
According to labor force statistics for Georgetown, 91.1% of individuals (730) out of the total population between 25 and 64 years of age (801) are in the labor force, with 3.0% or 22 of them being unemployed. The group with the highest labor force participation rate are those with the educational attainment of less than high school, with 100.0% or 34 individuals in the labor force. Within the labor force, individuals with bachelor's degree or higher education have the highest percentage of unemployment, with 5.7% or 22 of them being unemployed.
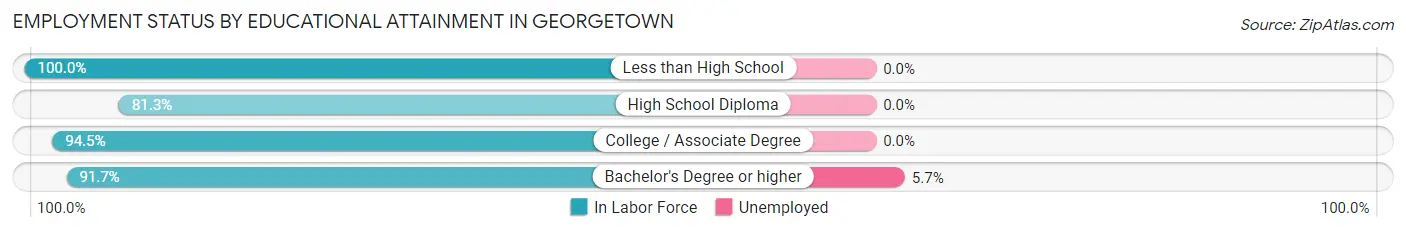
| Educational Attainment | In Labor Force | Unemployed |
| Less than High School | 34 (100.0%) | 0 (0.0%) |
| High School Diploma | 104 (81.3%) | 0 (0.0%) |
| College / Associate Degree | 206 (94.5%) | 0 (0.0%) |
| Bachelor's Degree or higher | 386 (91.7%) | 24 (5.7%) |
| Total | 730 (91.1%) | 24 (3.0%) |
Employment Occupations by Sex in Georgetown
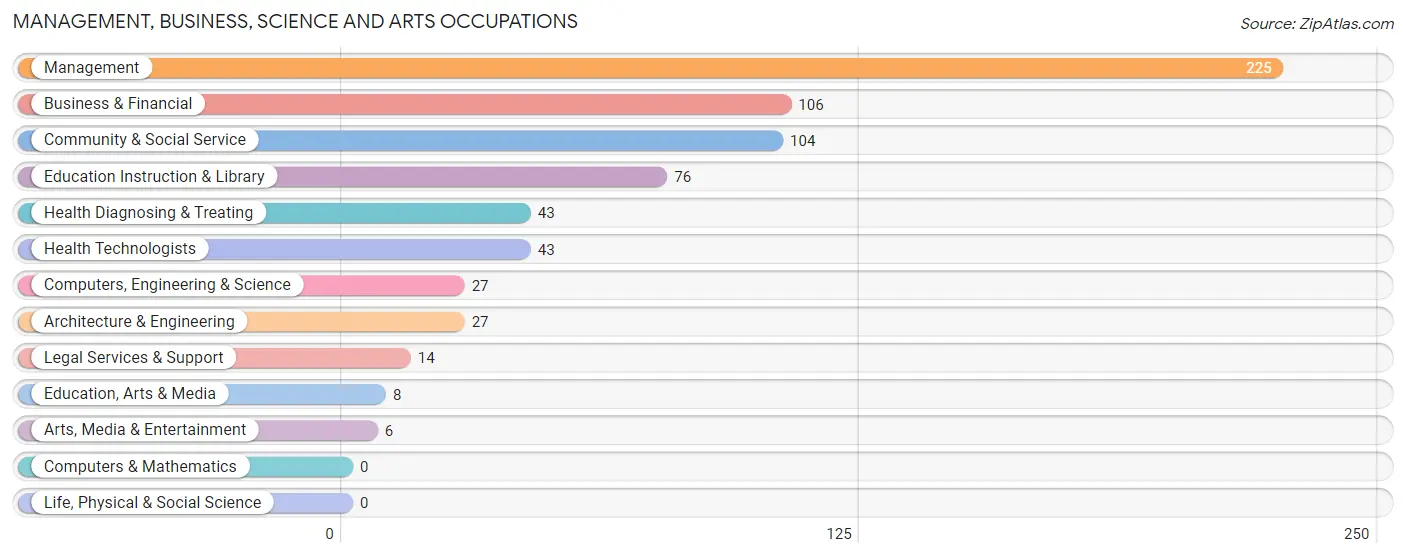
Management, Business, Science and Arts Occupations
The most common Management, Business, Science and Arts occupations in Georgetown are Management (225 | 21.7%), Business & Financial (106 | 10.2%), Community & Social Service (104 | 10.0%), Education Instruction & Library (76 | 7.3%), and Health Diagnosing & Treating (43 | 4.2%).
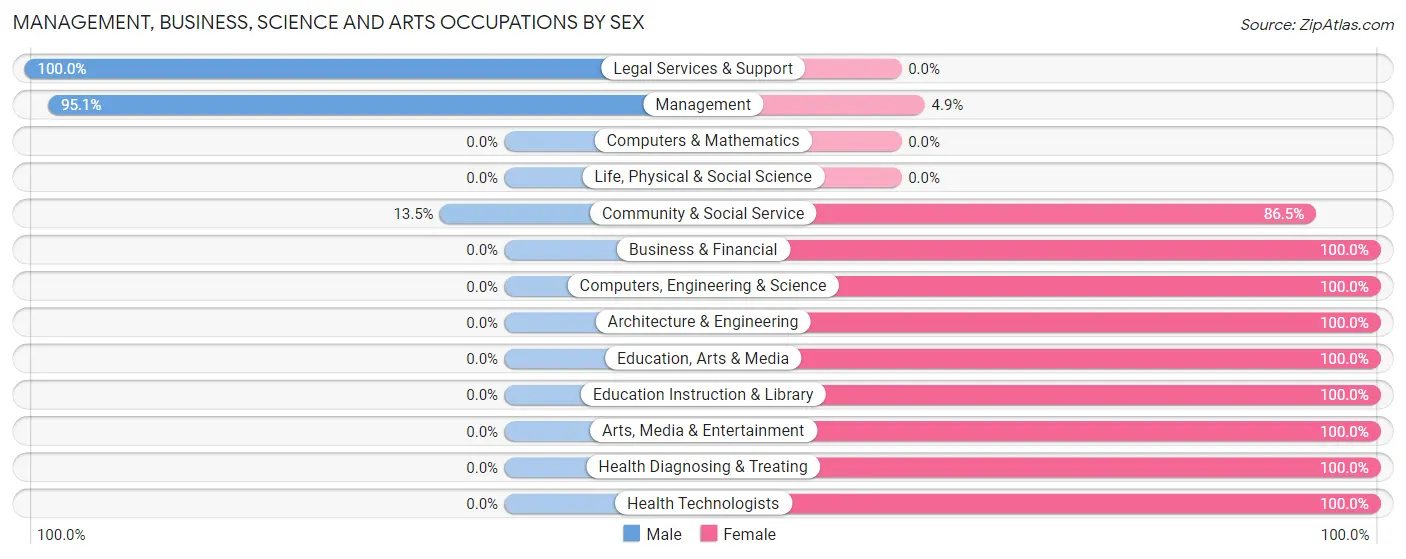
Management, Business, Science and Arts Occupations by Sex
Within the Management, Business, Science and Arts occupations in Georgetown, the most male-oriented occupations are Legal Services & Support (100.0%), Management (95.1%), and Community & Social Service (13.5%), while the most female-oriented occupations are Business & Financial (100.0%), Computers, Engineering & Science (100.0%), and Architecture & Engineering (100.0%).
| Occupation | Male | Female |
| Management | 214 (95.1%) | 11 (4.9%) |
| Business & Financial | 0 (0.0%) | 106 (100.0%) |
| Computers, Engineering & Science | 0 (0.0%) | 27 (100.0%) |
| Computers & Mathematics | 0 (0.0%) | 0 (0.0%) |
| Architecture & Engineering | 0 (0.0%) | 27 (100.0%) |
| Life, Physical & Social Science | 0 (0.0%) | 0 (0.0%) |
| Community & Social Service | 14 (13.5%) | 90 (86.5%) |
| Education, Arts & Media | 0 (0.0%) | 8 (100.0%) |
| Legal Services & Support | 14 (100.0%) | 0 (0.0%) |
| Education Instruction & Library | 0 (0.0%) | 76 (100.0%) |
| Arts, Media & Entertainment | 0 (0.0%) | 6 (100.0%) |
| Health Diagnosing & Treating | 0 (0.0%) | 43 (100.0%) |
| Health Technologists | 0 (0.0%) | 43 (100.0%) |
| Total (Category) | 228 (45.2%) | 277 (54.8%) |
| Total (Overall) | 488 (47.1%) | 549 (52.9%) |
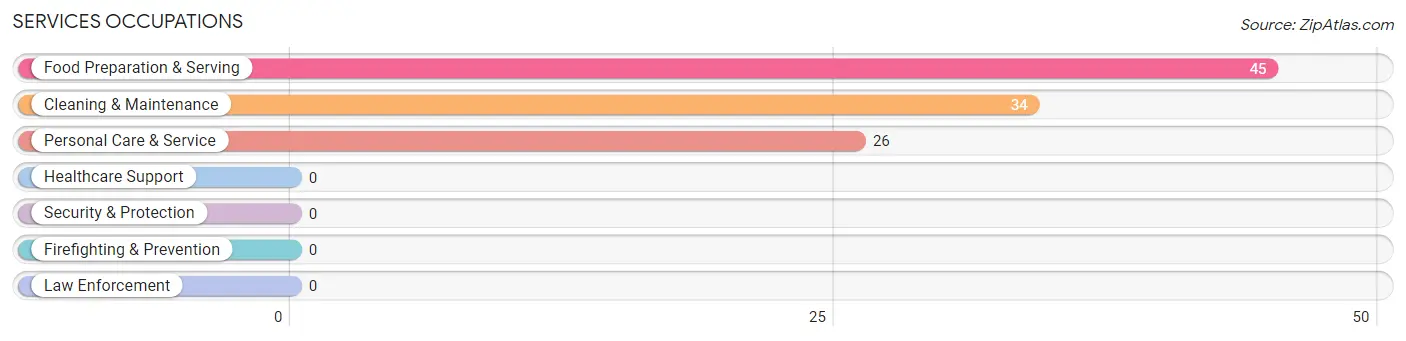
Services Occupations
The most common Services occupations in Georgetown are Food Preparation & Serving (45 | 4.3%), Cleaning & Maintenance (34 | 3.3%), and Personal Care & Service (26 | 2.5%).
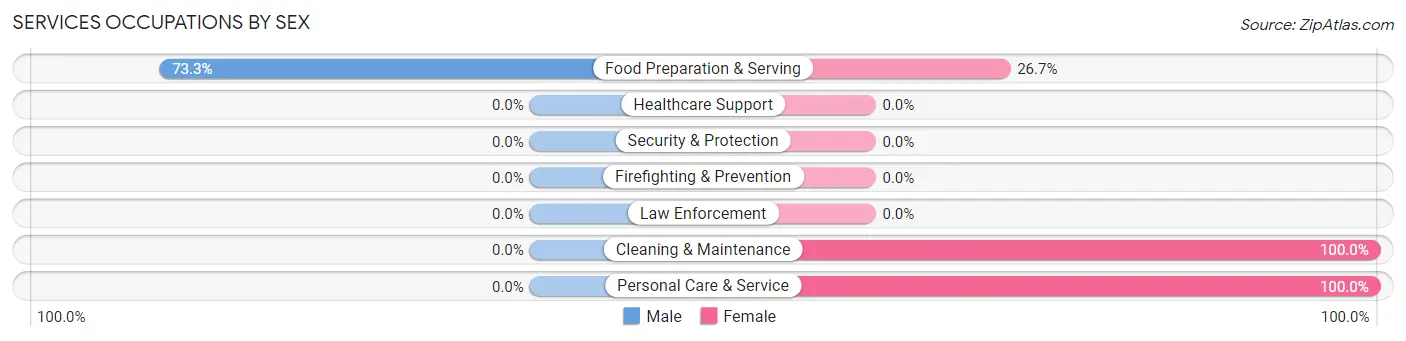
Services Occupations by Sex
| Occupation | Male | Female |
| Healthcare Support | 0 (0.0%) | 0 (0.0%) |
| Security & Protection | 0 (0.0%) | 0 (0.0%) |
| Firefighting & Prevention | 0 (0.0%) | 0 (0.0%) |
| Law Enforcement | 0 (0.0%) | 0 (0.0%) |
| Food Preparation & Serving | 33 (73.3%) | 12 (26.7%) |
| Cleaning & Maintenance | 0 (0.0%) | 34 (100.0%) |
| Personal Care & Service | 0 (0.0%) | 26 (100.0%) |
| Total (Category) | 33 (31.4%) | 72 (68.6%) |
| Total (Overall) | 488 (47.1%) | 549 (52.9%) |
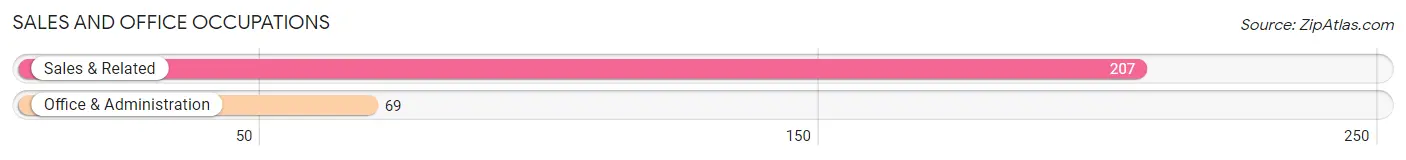
Sales and Office Occupations
The most common Sales and Office occupations in Georgetown are Sales & Related (207 | 20.0%), and Office & Administration (69 | 6.7%).
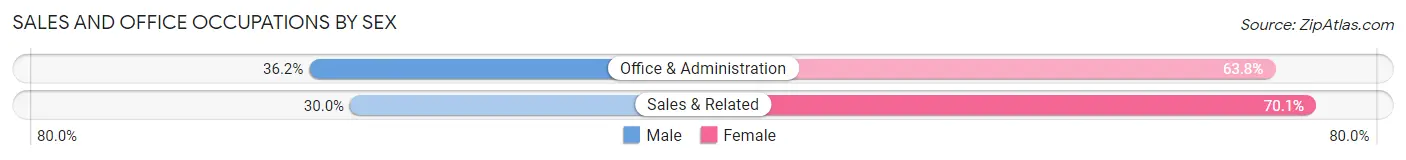
Sales and Office Occupations by Sex
| Occupation | Male | Female |
| Sales & Related | 62 (29.9%) | 145 (70.1%) |
| Office & Administration | 25 (36.2%) | 44 (63.8%) |
| Total (Category) | 87 (31.5%) | 189 (68.5%) |
| Total (Overall) | 488 (47.1%) | 549 (52.9%) |
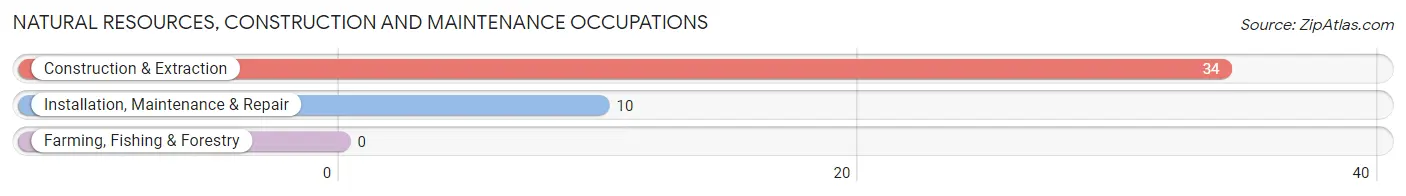
Natural Resources, Construction and Maintenance Occupations
The most common Natural Resources, Construction and Maintenance occupations in Georgetown are Construction & Extraction (34 | 3.3%), and Installation, Maintenance & Repair (10 | 1.0%).
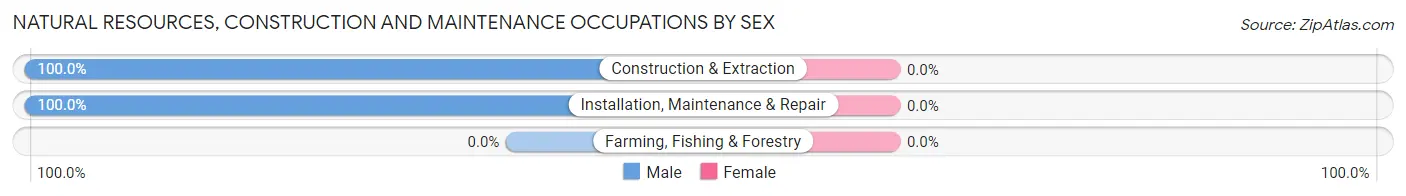
Natural Resources, Construction and Maintenance Occupations by Sex
| Occupation | Male | Female |
| Farming, Fishing & Forestry | 0 (0.0%) | 0 (0.0%) |
| Construction & Extraction | 34 (100.0%) | 0 (0.0%) |
| Installation, Maintenance & Repair | 10 (100.0%) | 0 (0.0%) |
| Total (Category) | 44 (100.0%) | 0 (0.0%) |
| Total (Overall) | 488 (47.1%) | 549 (52.9%) |
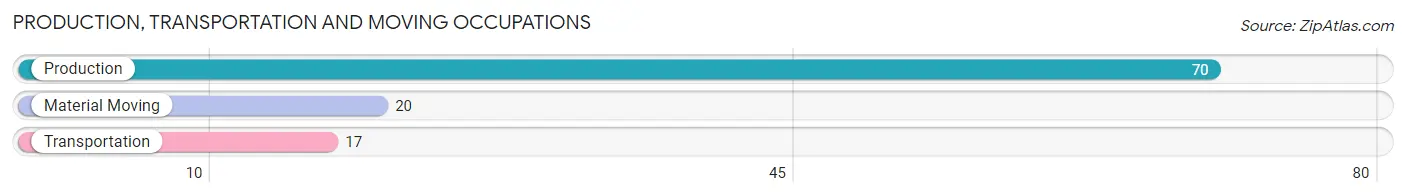
Production, Transportation and Moving Occupations
The most common Production, Transportation and Moving occupations in Georgetown are Production (70 | 6.8%), Material Moving (20 | 1.9%), and Transportation (17 | 1.6%).
Production, Transportation and Moving Occupations by Sex
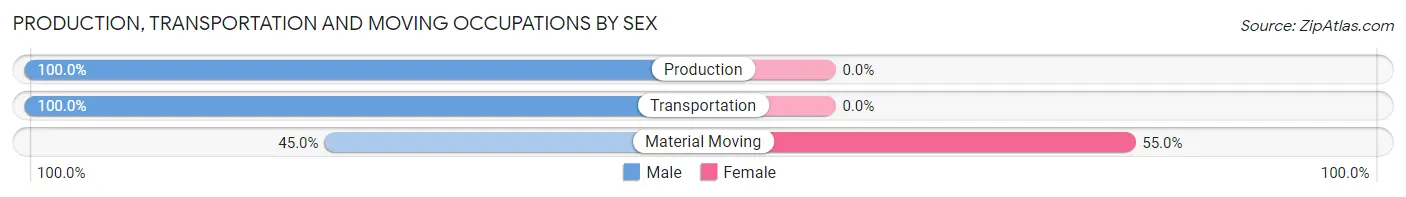
| Occupation | Male | Female |
| Production | 70 (100.0%) | 0 (0.0%) |
| Transportation | 17 (100.0%) | 0 (0.0%) |
| Material Moving | 9 (45.0%) | 11 (55.0%) |
| Total (Category) | 96 (89.7%) | 11 (10.3%) |
| Total (Overall) | 488 (47.1%) | 549 (52.9%) |
Employment Industries by Sex in Georgetown
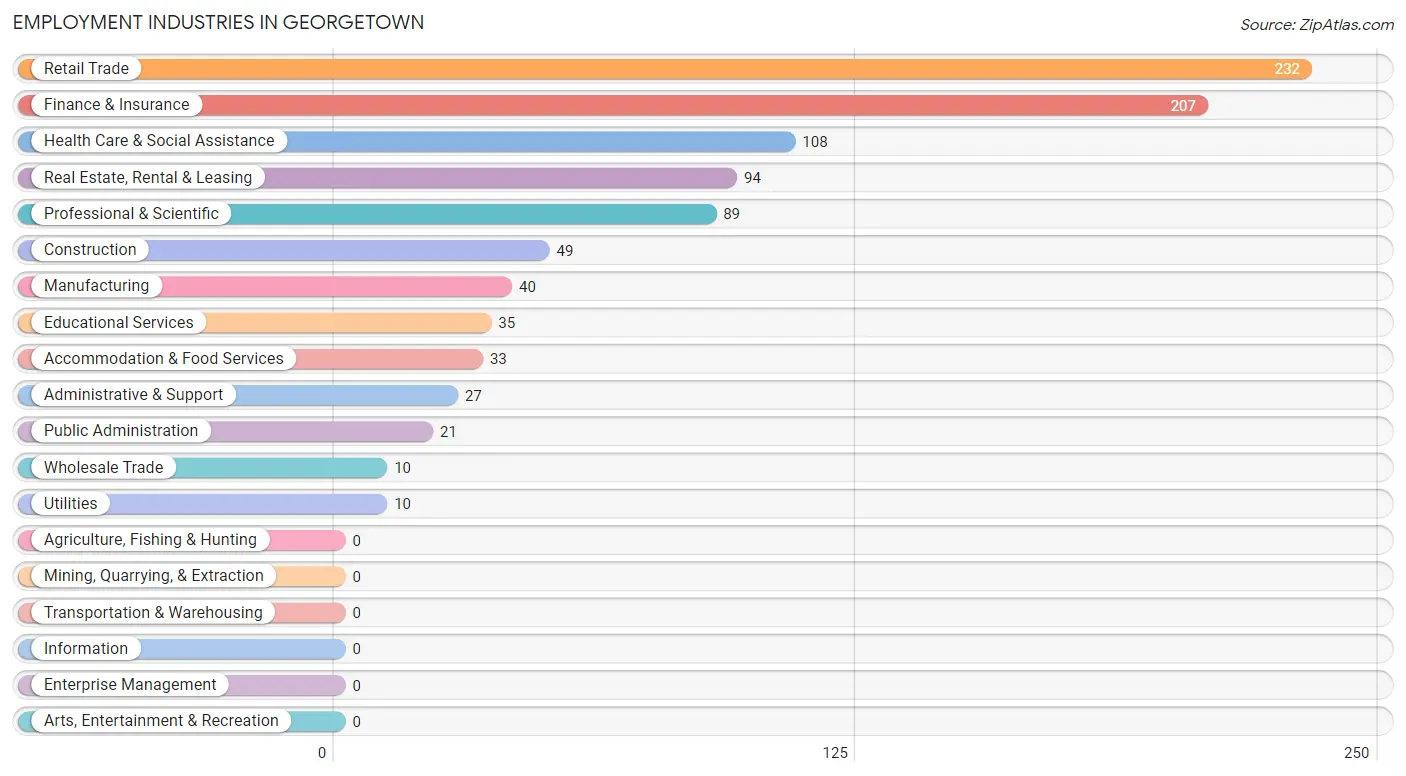
Employment Industries in Georgetown
The major employment industries in Georgetown include Retail Trade (232 | 22.4%), Finance & Insurance (207 | 20.0%), Health Care & Social Assistance (108 | 10.4%), Real Estate, Rental & Leasing (94 | 9.1%), and Professional & Scientific (89 | 8.6%).
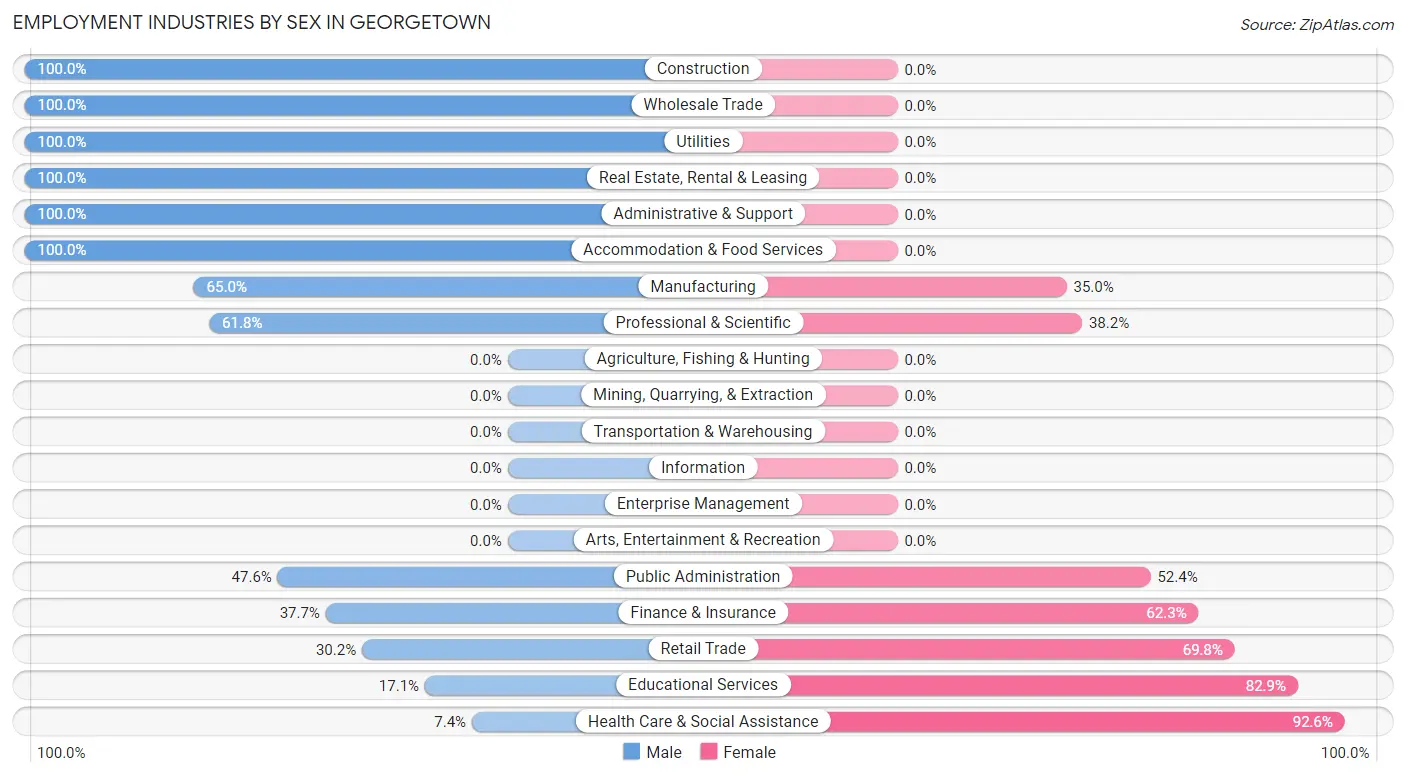
Employment Industries by Sex in Georgetown
The Georgetown industries that see more men than women are Construction (100.0%), Wholesale Trade (100.0%), and Utilities (100.0%), whereas the industries that tend to have a higher number of women are Health Care & Social Assistance (92.6%), Educational Services (82.9%), and Retail Trade (69.8%).
| Industry | Male | Female |
| Agriculture, Fishing & Hunting | 0 (0.0%) | 0 (0.0%) |
| Mining, Quarrying, & Extraction | 0 (0.0%) | 0 (0.0%) |
| Construction | 49 (100.0%) | 0 (0.0%) |
| Manufacturing | 26 (65.0%) | 14 (35.0%) |
| Wholesale Trade | 10 (100.0%) | 0 (0.0%) |
| Retail Trade | 70 (30.2%) | 162 (69.8%) |
| Transportation & Warehousing | 0 (0.0%) | 0 (0.0%) |
| Utilities | 10 (100.0%) | 0 (0.0%) |
| Information | 0 (0.0%) | 0 (0.0%) |
| Finance & Insurance | 78 (37.7%) | 129 (62.3%) |
| Real Estate, Rental & Leasing | 94 (100.0%) | 0 (0.0%) |
| Professional & Scientific | 55 (61.8%) | 34 (38.2%) |
| Enterprise Management | 0 (0.0%) | 0 (0.0%) |
| Administrative & Support | 27 (100.0%) | 0 (0.0%) |
| Educational Services | 6 (17.1%) | 29 (82.9%) |
| Health Care & Social Assistance | 8 (7.4%) | 100 (92.6%) |
| Arts, Entertainment & Recreation | 0 (0.0%) | 0 (0.0%) |
| Accommodation & Food Services | 33 (100.0%) | 0 (0.0%) |
| Public Administration | 10 (47.6%) | 11 (52.4%) |
| Total | 488 (47.1%) | 549 (52.9%) |
Education in Georgetown
School Enrollment in Georgetown
The most common levels of schooling among the 285 students in Georgetown are college / undergraduate (112 | 39.3%), high school (77 | 27.0%), and middle school (51 | 17.9%).
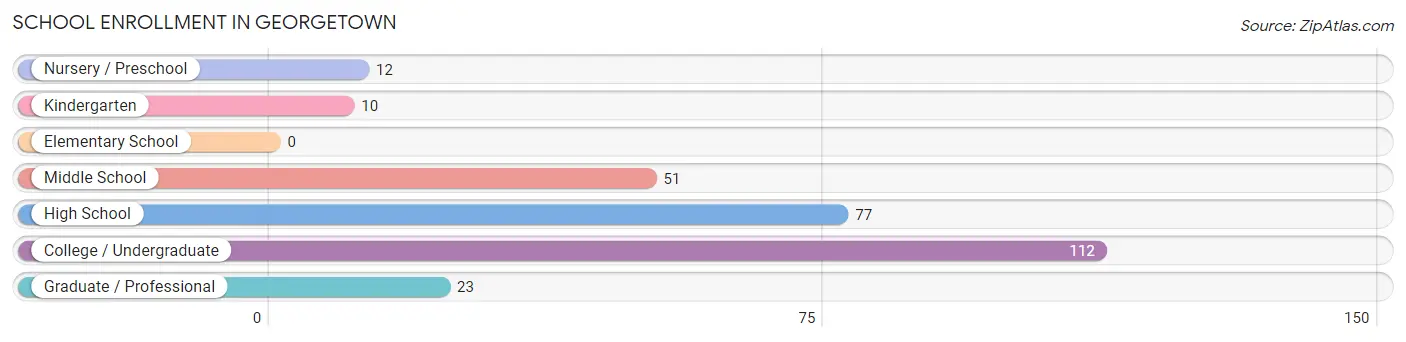
| School Level | # Students | % Students |
| Nursery / Preschool | 12 | 4.2% |
| Kindergarten | 10 | 3.5% |
| Elementary School | 0 | 0.0% |
| Middle School | 51 | 17.9% |
| High School | 77 | 27.0% |
| College / Undergraduate | 112 | 39.3% |
| Graduate / Professional | 23 | 8.1% |
| Total | 285 | 100.0% |
School Enrollment by Age by Funding Source in Georgetown
Out of a total of 285 students who are enrolled in schools in Georgetown, 41 (14.4%) attend a private institution, while the remaining 244 (85.6%) are enrolled in public schools. The age group of 3 to 4 year olds has the highest likelihood of being enrolled in private schools, with 12 (100.0% in the age bracket) enrolled. Conversely, the age group of 5 to 9 year old has the lowest likelihood of being enrolled in a private school, with 10 (100.0% in the age bracket) attending a public institution.
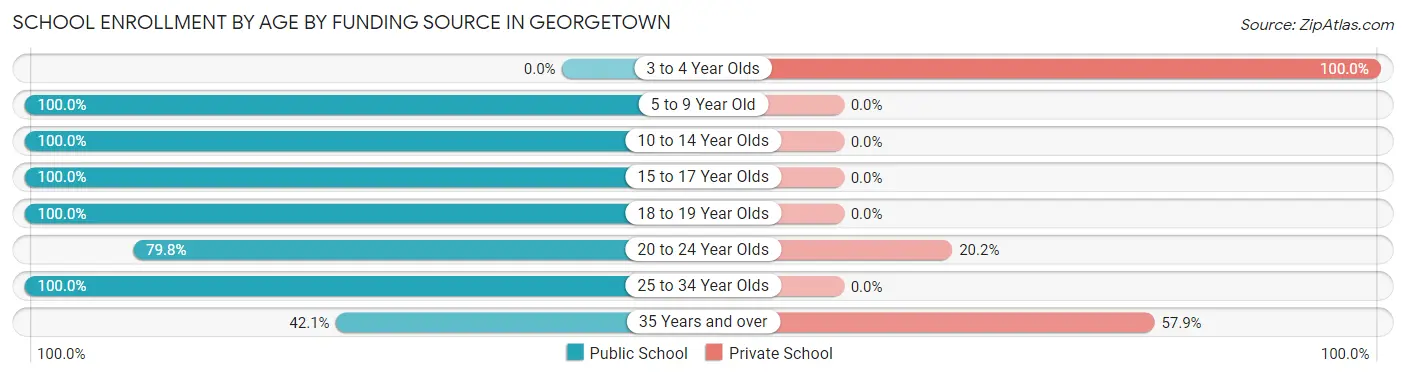
| Age Bracket | Public School | Private School |
| 3 to 4 Year Olds | 0 (0.0%) | 12 (100.0%) |
| 5 to 9 Year Old | 10 (100.0%) | 0 (0.0%) |
| 10 to 14 Year Olds | 51 (100.0%) | 0 (0.0%) |
| 15 to 17 Year Olds | 77 (100.0%) | 0 (0.0%) |
| 18 to 19 Year Olds | 15 (100.0%) | 0 (0.0%) |
| 20 to 24 Year Olds | 71 (79.8%) | 18 (20.2%) |
| 25 to 34 Year Olds | 12 (100.0%) | 0 (0.0%) |
| 35 Years and over | 8 (42.1%) | 11 (57.9%) |
| Total | 244 (85.6%) | 41 (14.4%) |
Educational Attainment by Field of Study in Georgetown
Business (104 | 16.0%), communications (99 | 15.2%), literature & languages (81 | 12.5%), education (67 | 10.3%), and arts & humanities (58 | 8.9%) are the most common fields of study among 650 individuals in Georgetown who have obtained a bachelor's degree or higher.
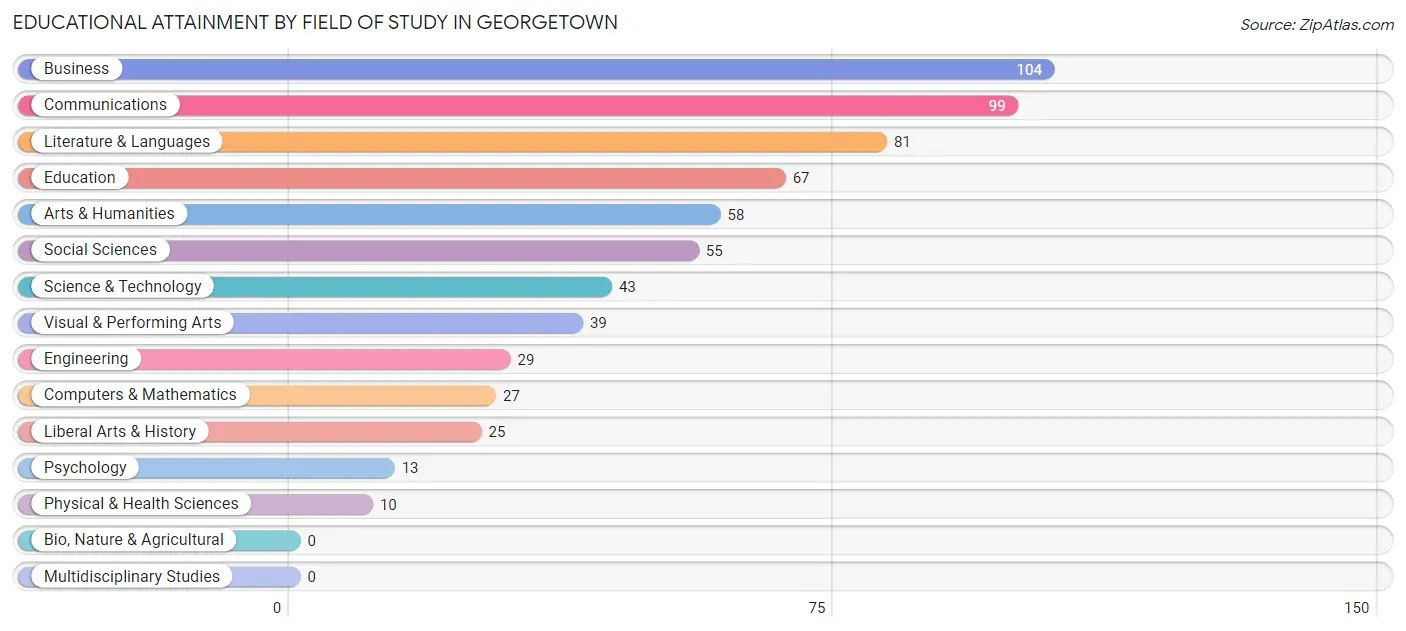
| Field of Study | # Graduates | % Graduates |
| Computers & Mathematics | 27 | 4.2% |
| Bio, Nature & Agricultural | 0 | 0.0% |
| Physical & Health Sciences | 10 | 1.5% |
| Psychology | 13 | 2.0% |
| Social Sciences | 55 | 8.5% |
| Engineering | 29 | 4.5% |
| Multidisciplinary Studies | 0 | 0.0% |
| Science & Technology | 43 | 6.6% |
| Business | 104 | 16.0% |
| Education | 67 | 10.3% |
| Literature & Languages | 81 | 12.5% |
| Liberal Arts & History | 25 | 3.8% |
| Visual & Performing Arts | 39 | 6.0% |
| Communications | 99 | 15.2% |
| Arts & Humanities | 58 | 8.9% |
| Total | 650 | 100.0% |
Transportation & Commute in Georgetown
Vehicle Availability by Sex in Georgetown
The most prevalent vehicle ownership categories in Georgetown are males with 2 vehicles (228, accounting for 46.7%) and females with 2 vehicles (223, making up 41.5%).
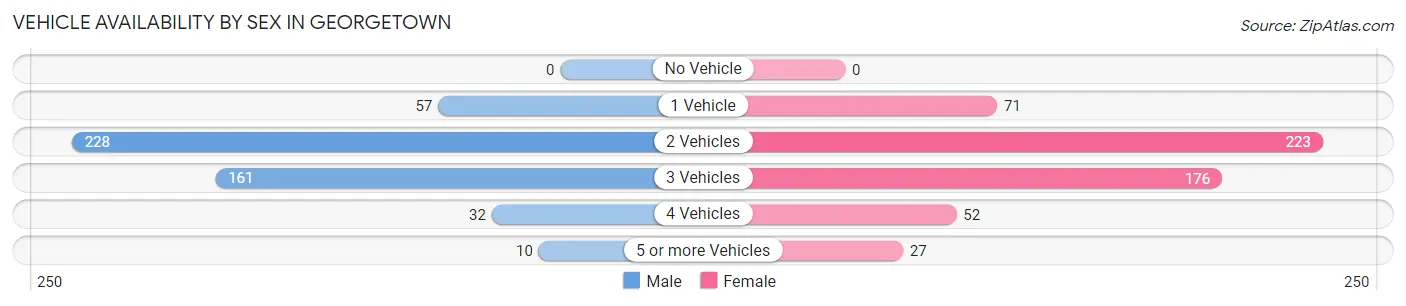
| Vehicles Available | Male | Female |
| No Vehicle | 0 (0.0%) | 0 (0.0%) |
| 1 Vehicle | 57 (11.7%) | 71 (12.9%) |
| 2 Vehicles | 228 (46.7%) | 223 (40.6%) |
| 3 Vehicles | 161 (33.0%) | 176 (32.1%) |
| 4 Vehicles | 32 (6.6%) | 52 (9.5%) |
| 5 or more Vehicles | 10 (2.1%) | 27 (4.9%) |
| Total | 488 (100.0%) | 549 (100.0%) |
Commute Time in Georgetown
The most frequently occuring commute durations in Georgetown are 45 to 59 minutes (259 commuters, 30.3%), 15 to 19 minutes (136 commuters, 15.9%), and 30 to 34 minutes (131 commuters, 15.3%).
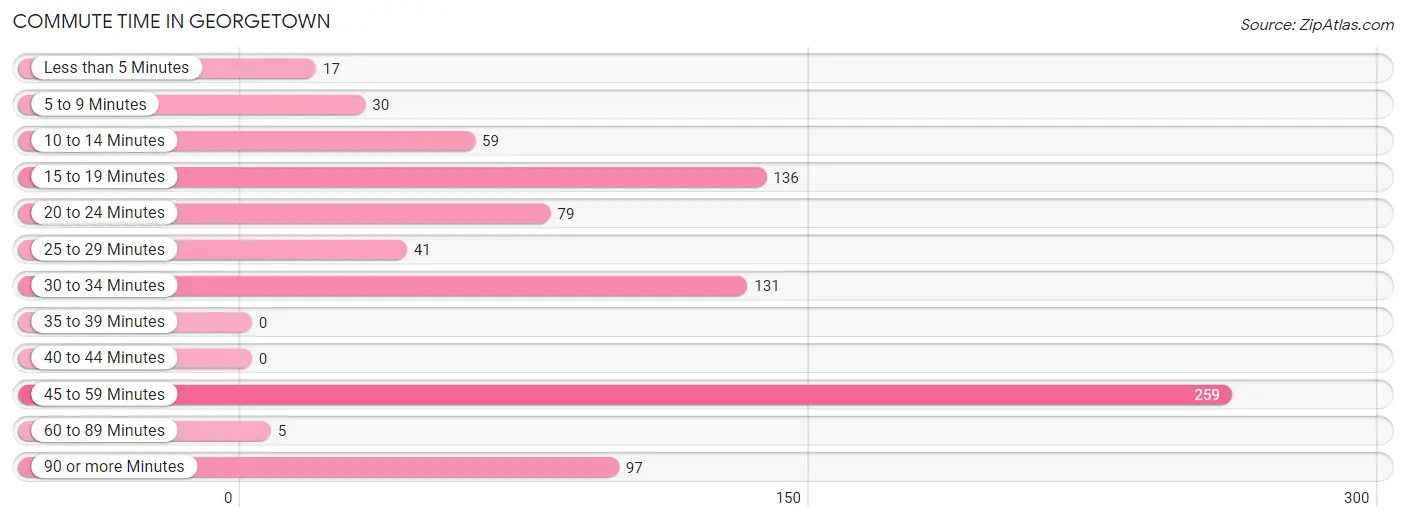
| Commute Time | # Commuters | % Commuters |
| Less than 5 Minutes | 17 | 2.0% |
| 5 to 9 Minutes | 30 | 3.5% |
| 10 to 14 Minutes | 59 | 6.9% |
| 15 to 19 Minutes | 136 | 15.9% |
| 20 to 24 Minutes | 79 | 9.2% |
| 25 to 29 Minutes | 41 | 4.8% |
| 30 to 34 Minutes | 131 | 15.3% |
| 35 to 39 Minutes | 0 | 0.0% |
| 40 to 44 Minutes | 0 | 0.0% |
| 45 to 59 Minutes | 259 | 30.3% |
| 60 to 89 Minutes | 5 | 0.6% |
| 90 or more Minutes | 97 | 11.4% |
Commute Time by Sex in Georgetown
The most common commute times in Georgetown are 45 to 59 minutes (117 commuters, 28.2%) for males and 45 to 59 minutes (142 commuters, 32.4%) for females.
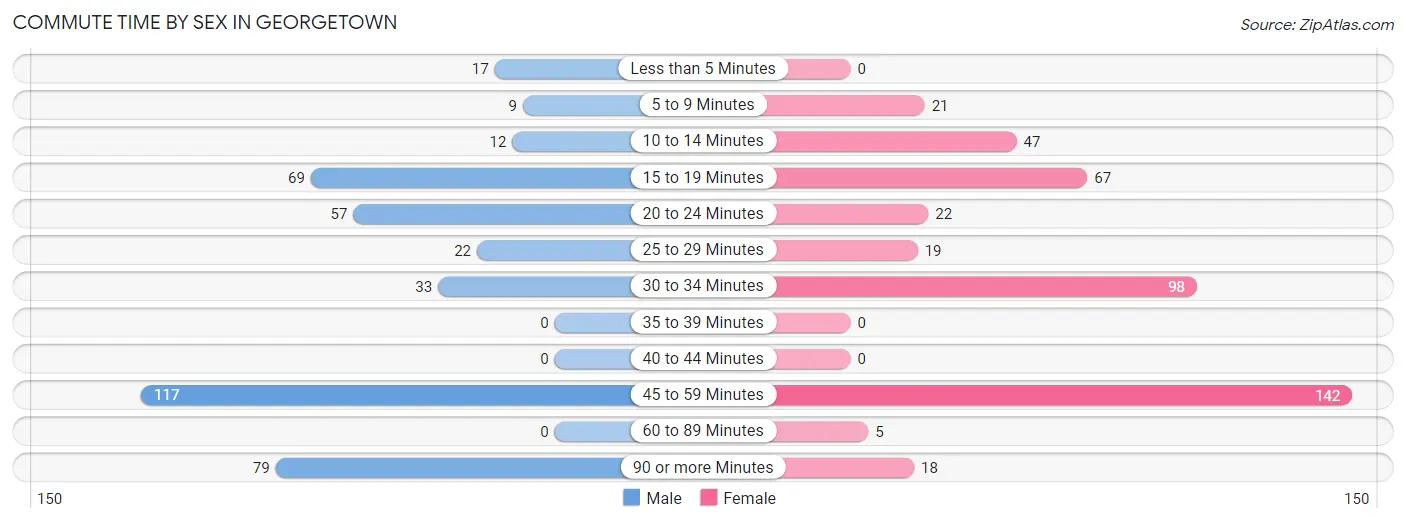
| Commute Time | Male | Female |
| Less than 5 Minutes | 17 (4.1%) | 0 (0.0%) |
| 5 to 9 Minutes | 9 (2.2%) | 21 (4.8%) |
| 10 to 14 Minutes | 12 (2.9%) | 47 (10.7%) |
| 15 to 19 Minutes | 69 (16.6%) | 67 (15.3%) |
| 20 to 24 Minutes | 57 (13.7%) | 22 (5.0%) |
| 25 to 29 Minutes | 22 (5.3%) | 19 (4.3%) |
| 30 to 34 Minutes | 33 (8.0%) | 98 (22.3%) |
| 35 to 39 Minutes | 0 (0.0%) | 0 (0.0%) |
| 40 to 44 Minutes | 0 (0.0%) | 0 (0.0%) |
| 45 to 59 Minutes | 117 (28.2%) | 142 (32.4%) |
| 60 to 89 Minutes | 0 (0.0%) | 5 (1.1%) |
| 90 or more Minutes | 79 (19.0%) | 18 (4.1%) |
Time of Departure to Work by Sex in Georgetown
The most frequent times of departure to work in Georgetown are 8:00 AM to 8:29 AM (218, 52.5%) for males and 9:00 AM to 9:59 AM (111, 25.3%) for females.
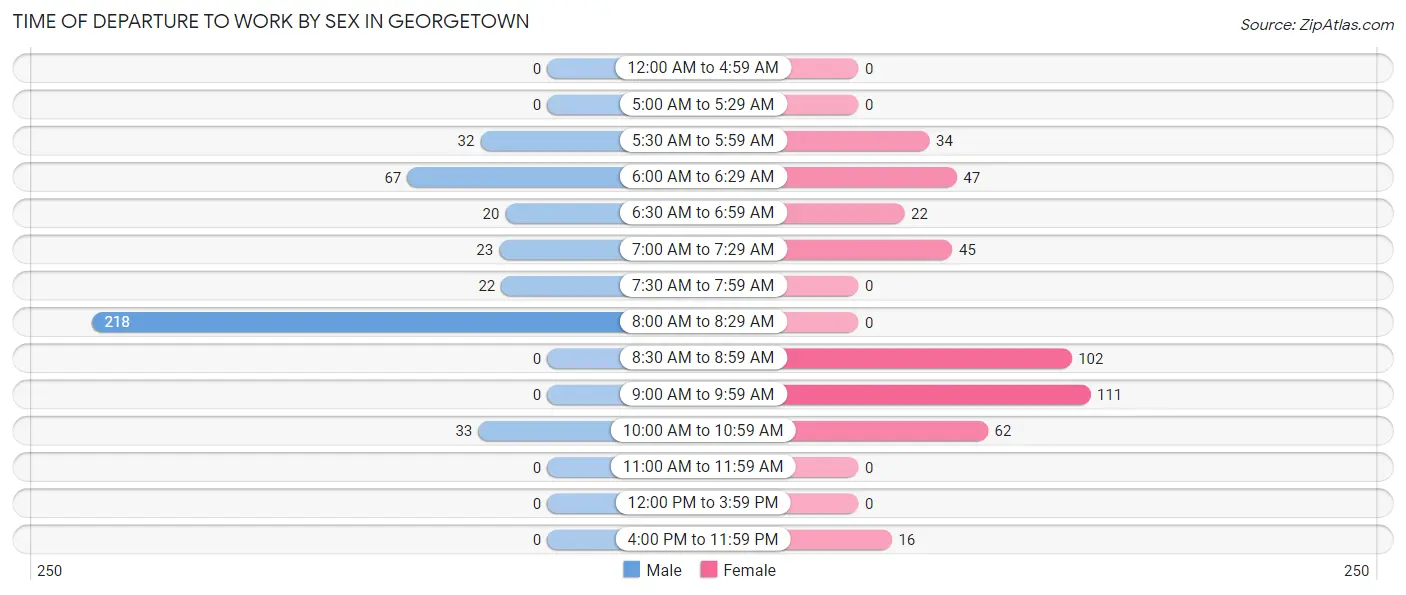
| Time of Departure | Male | Female |
| 12:00 AM to 4:59 AM | 0 (0.0%) | 0 (0.0%) |
| 5:00 AM to 5:29 AM | 0 (0.0%) | 0 (0.0%) |
| 5:30 AM to 5:59 AM | 32 (7.7%) | 34 (7.7%) |
| 6:00 AM to 6:29 AM | 67 (16.1%) | 47 (10.7%) |
| 6:30 AM to 6:59 AM | 20 (4.8%) | 22 (5.0%) |
| 7:00 AM to 7:29 AM | 23 (5.5%) | 45 (10.2%) |
| 7:30 AM to 7:59 AM | 22 (5.3%) | 0 (0.0%) |
| 8:00 AM to 8:29 AM | 218 (52.5%) | 0 (0.0%) |
| 8:30 AM to 8:59 AM | 0 (0.0%) | 102 (23.2%) |
| 9:00 AM to 9:59 AM | 0 (0.0%) | 111 (25.3%) |
| 10:00 AM to 10:59 AM | 33 (8.0%) | 62 (14.1%) |
| 11:00 AM to 11:59 AM | 0 (0.0%) | 0 (0.0%) |
| 12:00 PM to 3:59 PM | 0 (0.0%) | 0 (0.0%) |
| 4:00 PM to 11:59 PM | 0 (0.0%) | 16 (3.6%) |
| Total | 415 (100.0%) | 439 (100.0%) |
Housing Occupancy in Georgetown
Occupancy by Ownership in Georgetown
Of the total 590 dwellings in Georgetown, owner-occupied units account for 517 (87.6%), while renter-occupied units make up 73 (12.4%).
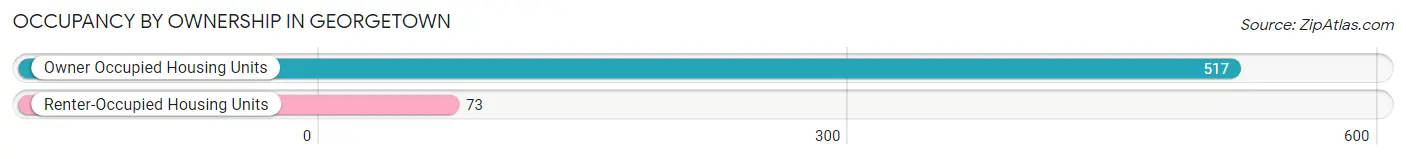
| Occupancy | # Housing Units | % Housing Units |
| Owner Occupied Housing Units | 517 | 87.6% |
| Renter-Occupied Housing Units | 73 | 12.4% |
| Total Occupied Housing Units | 590 | 100.0% |
Occupancy by Household Size in Georgetown
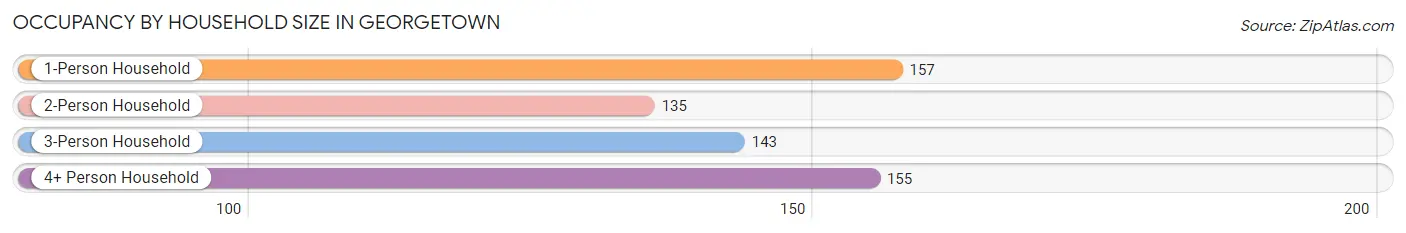
| Household Size | # Housing Units | % Housing Units |
| 1-Person Household | 157 | 26.6% |
| 2-Person Household | 135 | 22.9% |
| 3-Person Household | 143 | 24.2% |
| 4+ Person Household | 155 | 26.3% |
| Total Housing Units | 590 | 100.0% |
Occupancy by Ownership by Household Size in Georgetown
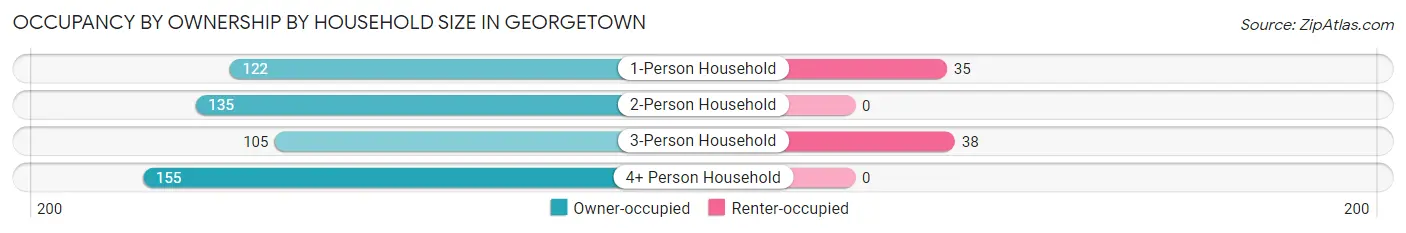
| Household Size | Owner-occupied | Renter-occupied |
| 1-Person Household | 122 (77.7%) | 35 (22.3%) |
| 2-Person Household | 135 (100.0%) | 0 (0.0%) |
| 3-Person Household | 105 (73.4%) | 38 (26.6%) |
| 4+ Person Household | 155 (100.0%) | 0 (0.0%) |
| Total Housing Units | 517 (87.6%) | 73 (12.4%) |
Occupancy by Educational Attainment in Georgetown
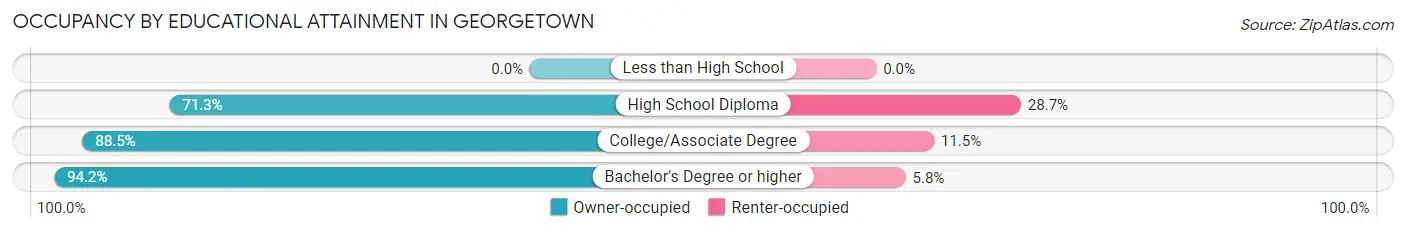
| Household Size | Owner-occupied | Renter-occupied |
| Less than High School | 0 (0.0%) | 0 (0.0%) |
| High School Diploma | 82 (71.3%) | 33 (28.7%) |
| College/Associate Degree | 193 (88.5%) | 25 (11.5%) |
| Bachelor's Degree or higher | 242 (94.2%) | 15 (5.8%) |
Occupancy by Age of Householder in Georgetown
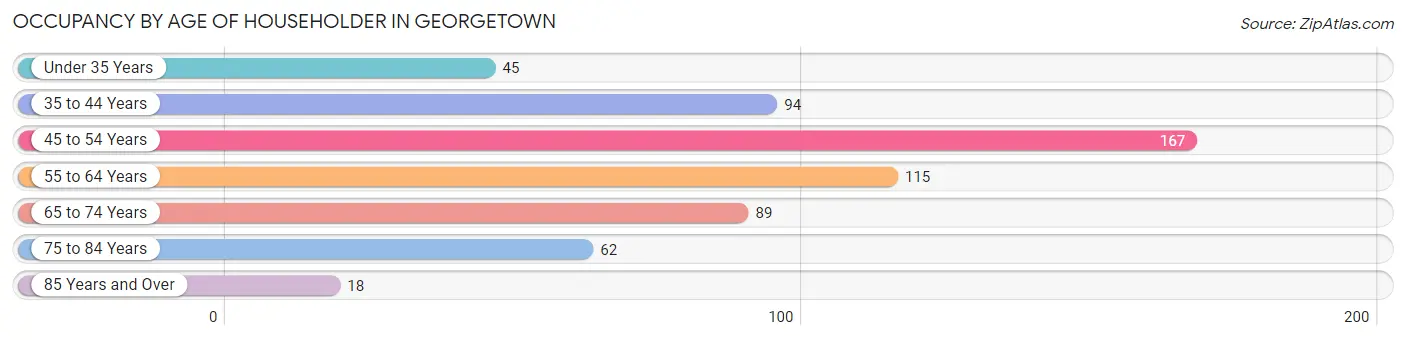
| Age Bracket | # Households | % Households |
| Under 35 Years | 45 | 7.6% |
| 35 to 44 Years | 94 | 15.9% |
| 45 to 54 Years | 167 | 28.3% |
| 55 to 64 Years | 115 | 19.5% |
| 65 to 74 Years | 89 | 15.1% |
| 75 to 84 Years | 62 | 10.5% |
| 85 Years and Over | 18 | 3.0% |
| Total | 590 | 100.0% |
Housing Finances in Georgetown
Median Income by Occupancy in Georgetown
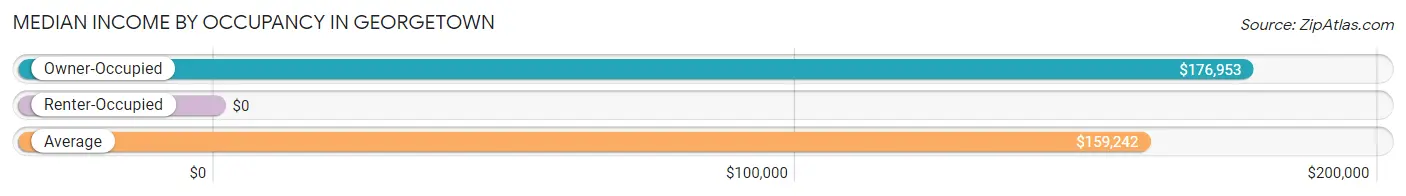
| Occupancy Type | # Households | Median Income |
| Owner-Occupied | 517 (87.6%) | $176,953 |
| Renter-Occupied | 73 (12.4%) | $0 |
| Average | 590 (100.0%) | $159,242 |
Occupancy by Householder Income Bracket in Georgetown
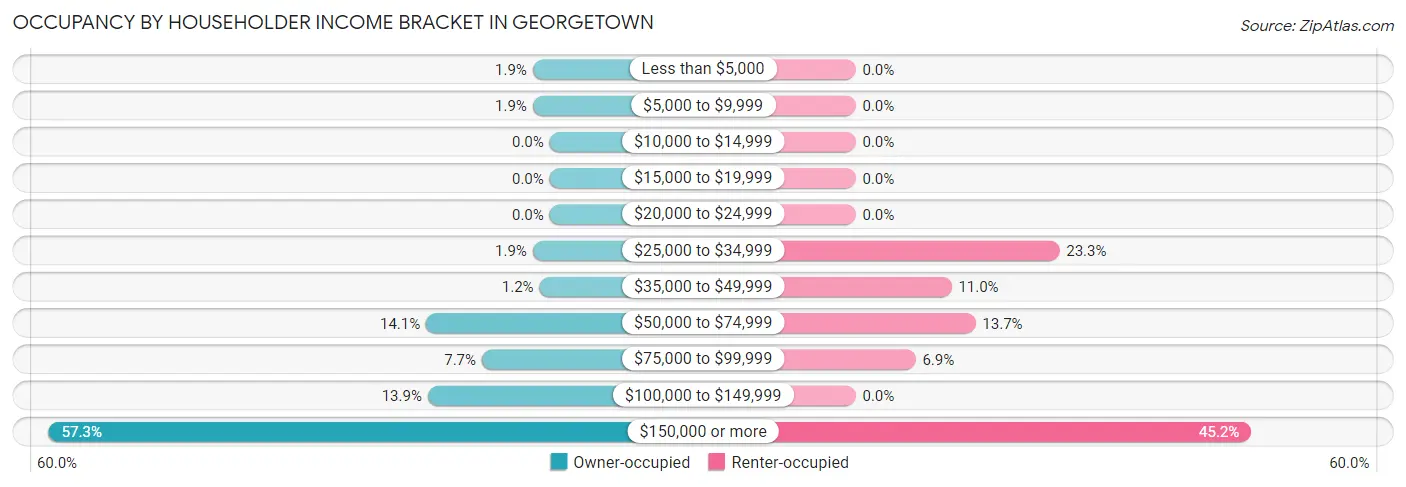
| Income Bracket | Owner-occupied | Renter-occupied |
| Less than $5,000 | 10 (1.9%) | 0 (0.0%) |
| $5,000 to $9,999 | 10 (1.9%) | 0 (0.0%) |
| $10,000 to $14,999 | 0 (0.0%) | 0 (0.0%) |
| $15,000 to $19,999 | 0 (0.0%) | 0 (0.0%) |
| $20,000 to $24,999 | 0 (0.0%) | 0 (0.0%) |
| $25,000 to $34,999 | 10 (1.9%) | 17 (23.3%) |
| $35,000 to $49,999 | 6 (1.2%) | 8 (11.0%) |
| $50,000 to $74,999 | 73 (14.1%) | 10 (13.7%) |
| $75,000 to $99,999 | 40 (7.7%) | 5 (6.9%) |
| $100,000 to $149,999 | 72 (13.9%) | 0 (0.0%) |
| $150,000 or more | 296 (57.3%) | 33 (45.2%) |
| Total | 517 (100.0%) | 73 (100.0%) |
Monthly Housing Cost Tiers in Georgetown
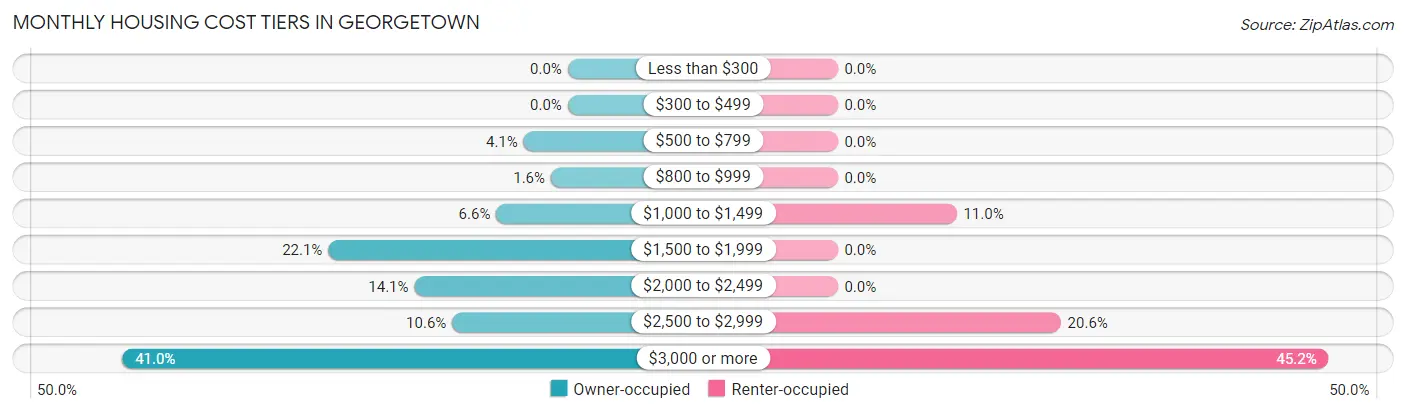
| Monthly Cost | Owner-occupied | Renter-occupied |
| Less than $300 | 0 (0.0%) | 0 (0.0%) |
| $300 to $499 | 0 (0.0%) | 0 (0.0%) |
| $500 to $799 | 21 (4.1%) | 0 (0.0%) |
| $800 to $999 | 8 (1.5%) | 0 (0.0%) |
| $1,000 to $1,499 | 34 (6.6%) | 8 (11.0%) |
| $1,500 to $1,999 | 114 (22.1%) | 0 (0.0%) |
| $2,000 to $2,499 | 73 (14.1%) | 0 (0.0%) |
| $2,500 to $2,999 | 55 (10.6%) | 15 (20.5%) |
| $3,000 or more | 212 (41.0%) | 33 (45.2%) |
| Total | 517 (100.0%) | 73 (100.0%) |
Physical Housing Characteristics in Georgetown
Housing Structures in Georgetown
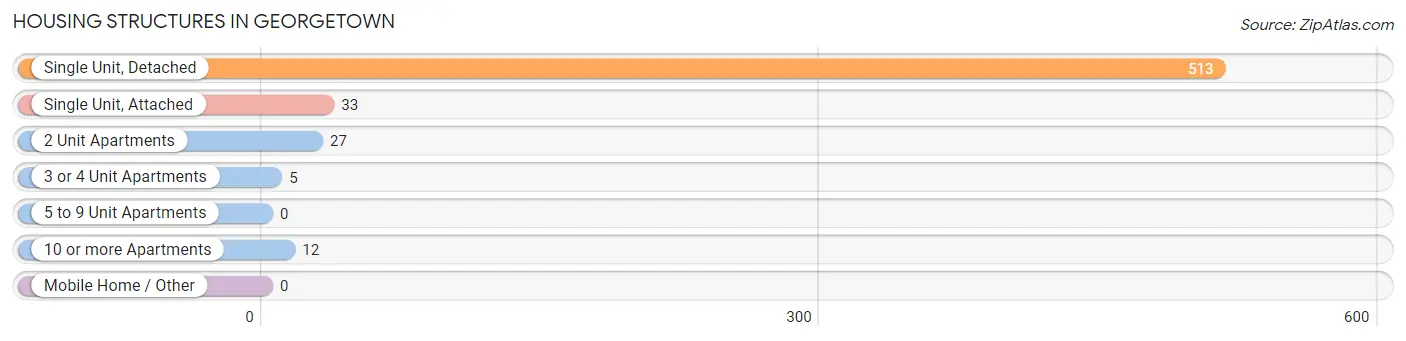
| Structure Type | # Housing Units | % Housing Units |
| Single Unit, Detached | 513 | 87.0% |
| Single Unit, Attached | 33 | 5.6% |
| 2 Unit Apartments | 27 | 4.6% |
| 3 or 4 Unit Apartments | 5 | 0.9% |
| 5 to 9 Unit Apartments | 0 | 0.0% |
| 10 or more Apartments | 12 | 2.0% |
| Mobile Home / Other | 0 | 0.0% |
| Total | 590 | 100.0% |
Housing Structures by Occupancy in Georgetown
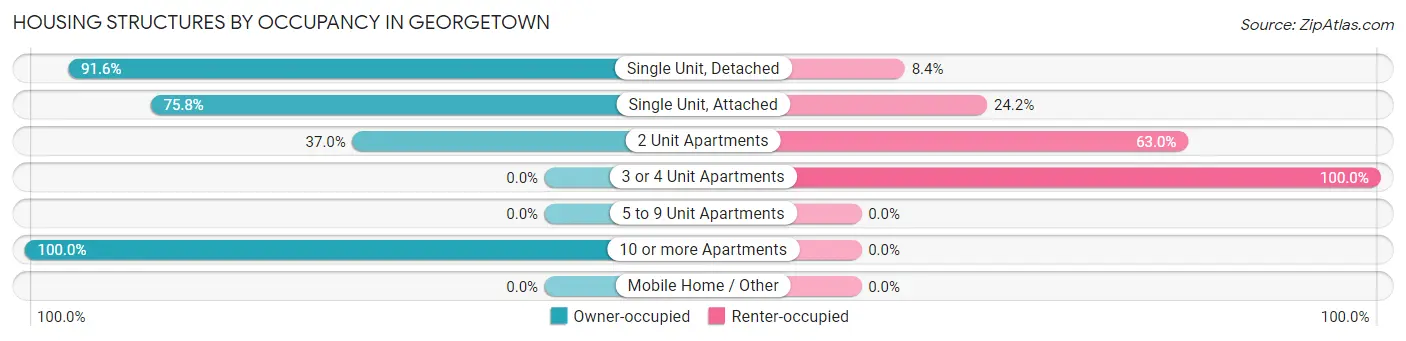
| Structure Type | Owner-occupied | Renter-occupied |
| Single Unit, Detached | 470 (91.6%) | 43 (8.4%) |
| Single Unit, Attached | 25 (75.8%) | 8 (24.2%) |
| 2 Unit Apartments | 10 (37.0%) | 17 (63.0%) |
| 3 or 4 Unit Apartments | 0 (0.0%) | 5 (100.0%) |
| 5 to 9 Unit Apartments | 0 (0.0%) | 0 (0.0%) |
| 10 or more Apartments | 12 (100.0%) | 0 (0.0%) |
| Mobile Home / Other | 0 (0.0%) | 0 (0.0%) |
| Total | 517 (87.6%) | 73 (12.4%) |
Housing Structures by Number of Rooms in Georgetown
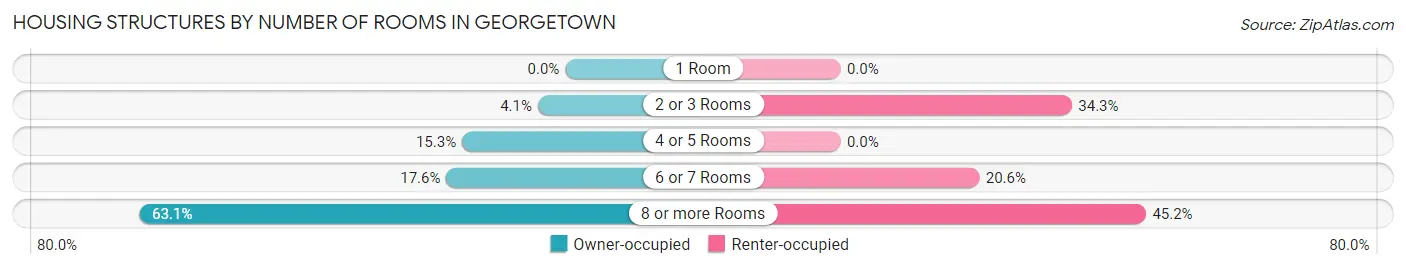
| Number of Rooms | Owner-occupied | Renter-occupied |
| 1 Room | 0 (0.0%) | 0 (0.0%) |
| 2 or 3 Rooms | 21 (4.1%) | 25 (34.3%) |
| 4 or 5 Rooms | 79 (15.3%) | 0 (0.0%) |
| 6 or 7 Rooms | 91 (17.6%) | 15 (20.5%) |
| 8 or more Rooms | 326 (63.1%) | 33 (45.2%) |
| Total | 517 (100.0%) | 73 (100.0%) |
Housing Structure by Heating Type in Georgetown
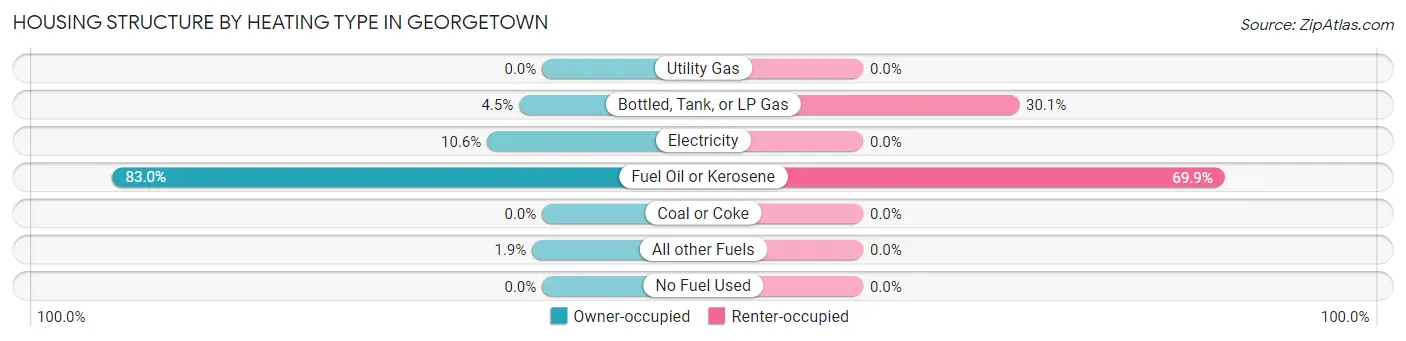
| Heating Type | Owner-occupied | Renter-occupied |
| Utility Gas | 0 (0.0%) | 0 (0.0%) |
| Bottled, Tank, or LP Gas | 23 (4.4%) | 22 (30.1%) |
| Electricity | 55 (10.6%) | 0 (0.0%) |
| Fuel Oil or Kerosene | 429 (83.0%) | 51 (69.9%) |
| Coal or Coke | 0 (0.0%) | 0 (0.0%) |
| All other Fuels | 10 (1.9%) | 0 (0.0%) |
| No Fuel Used | 0 (0.0%) | 0 (0.0%) |
| Total | 517 (100.0%) | 73 (100.0%) |
Household Vehicle Usage in Georgetown
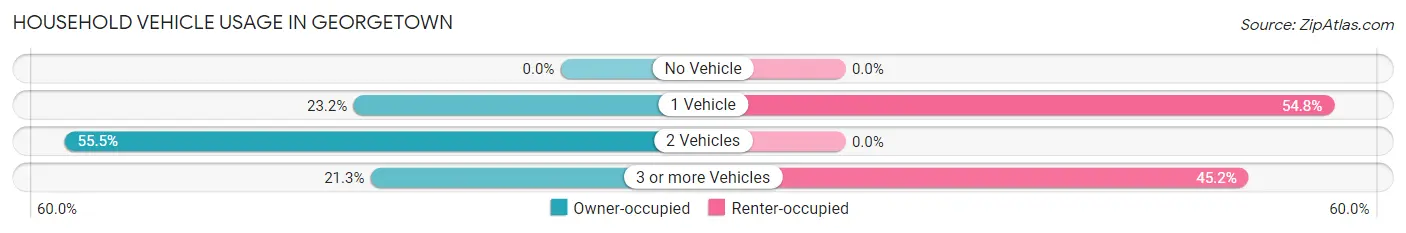
| Vehicles per Household | Owner-occupied | Renter-occupied |
| No Vehicle | 0 (0.0%) | 0 (0.0%) |
| 1 Vehicle | 120 (23.2%) | 40 (54.8%) |
| 2 Vehicles | 287 (55.5%) | 0 (0.0%) |
| 3 or more Vehicles | 110 (21.3%) | 33 (45.2%) |
| Total | 517 (100.0%) | 73 (100.0%) |
Real Estate & Mortgages in Georgetown
Real Estate and Mortgage Overview in Georgetown
| Characteristic | Without Mortgage | With Mortgage |
| Housing Units | 221 | 296 |
| Median Property Value | $648,600 | $614,700 |
| Median Household Income | $185,521 | $183 |
| Monthly Housing Costs | $1,501 | $200 |
| Real Estate Taxes | $10,001 | $12 |
Property Value by Mortgage Status in Georgetown
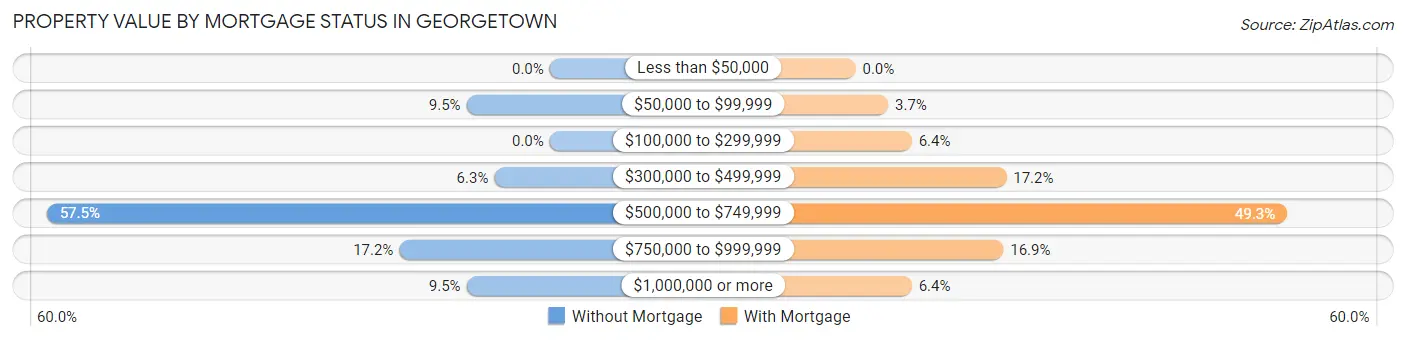
| Property Value | Without Mortgage | With Mortgage |
| Less than $50,000 | 0 (0.0%) | 0 (0.0%) |
| $50,000 to $99,999 | 21 (9.5%) | 11 (3.7%) |
| $100,000 to $299,999 | 0 (0.0%) | 19 (6.4%) |
| $300,000 to $499,999 | 14 (6.3%) | 51 (17.2%) |
| $500,000 to $749,999 | 127 (57.5%) | 146 (49.3%) |
| $750,000 to $999,999 | 38 (17.2%) | 50 (16.9%) |
| $1,000,000 or more | 21 (9.5%) | 19 (6.4%) |
| Total | 221 (100.0%) | 296 (100.0%) |
Household Income by Mortgage Status in Georgetown
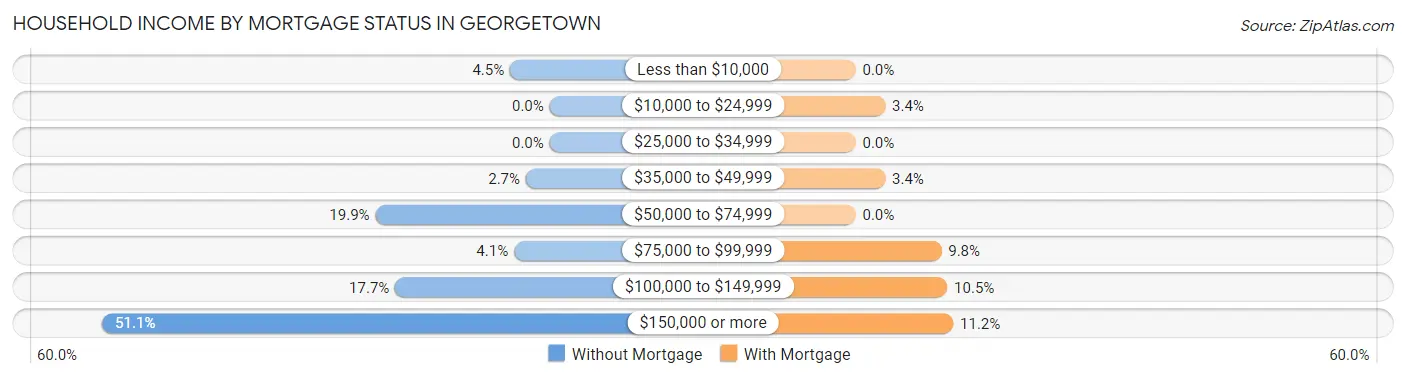
| Household Income | Without Mortgage | With Mortgage |
| Less than $10,000 | 10 (4.5%) | 0 (0.0%) |
| $10,000 to $24,999 | 0 (0.0%) | 10 (3.4%) |
| $25,000 to $34,999 | 0 (0.0%) | 0 (0.0%) |
| $35,000 to $49,999 | 6 (2.7%) | 10 (3.4%) |
| $50,000 to $74,999 | 44 (19.9%) | 0 (0.0%) |
| $75,000 to $99,999 | 9 (4.1%) | 29 (9.8%) |
| $100,000 to $149,999 | 39 (17.6%) | 31 (10.5%) |
| $150,000 or more | 113 (51.1%) | 33 (11.2%) |
| Total | 221 (100.0%) | 296 (100.0%) |
Property Value to Household Income Ratio in Georgetown
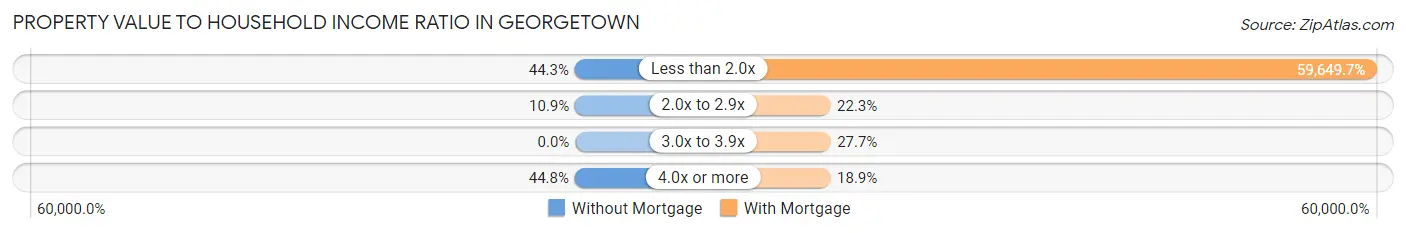
| Value-to-Income Ratio | Without Mortgage | With Mortgage |
| Less than 2.0x | 98 (44.3%) | 176,563 (59,649.7%) |
| 2.0x to 2.9x | 24 (10.9%) | 66 (22.3%) |
| 3.0x to 3.9x | 0 (0.0%) | 82 (27.7%) |
| 4.0x or more | 99 (44.8%) | 56 (18.9%) |
| Total | 221 (100.0%) | 296 (100.0%) |
Real Estate Taxes by Mortgage Status in Georgetown
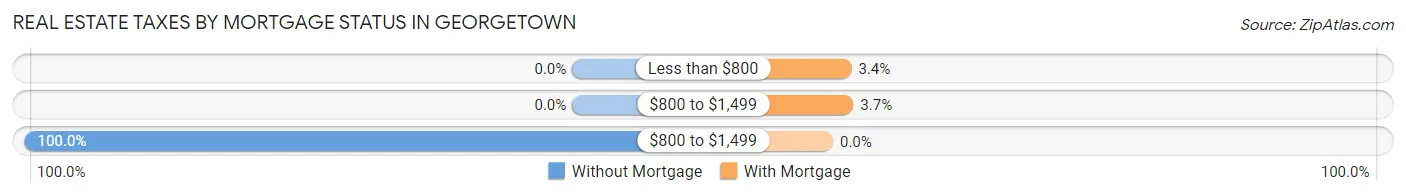
| Property Taxes | Without Mortgage | With Mortgage |
| Less than $800 | 0 (0.0%) | 10 (3.4%) |
| $800 to $1,499 | 0 (0.0%) | 11 (3.7%) |
| $800 to $1,499 | 221 (100.0%) | 0 (0.0%) |
| Total | 221 (100.0%) | 296 (100.0%) |
Health & Disability in Georgetown
Health Insurance Coverage by Age in Georgetown
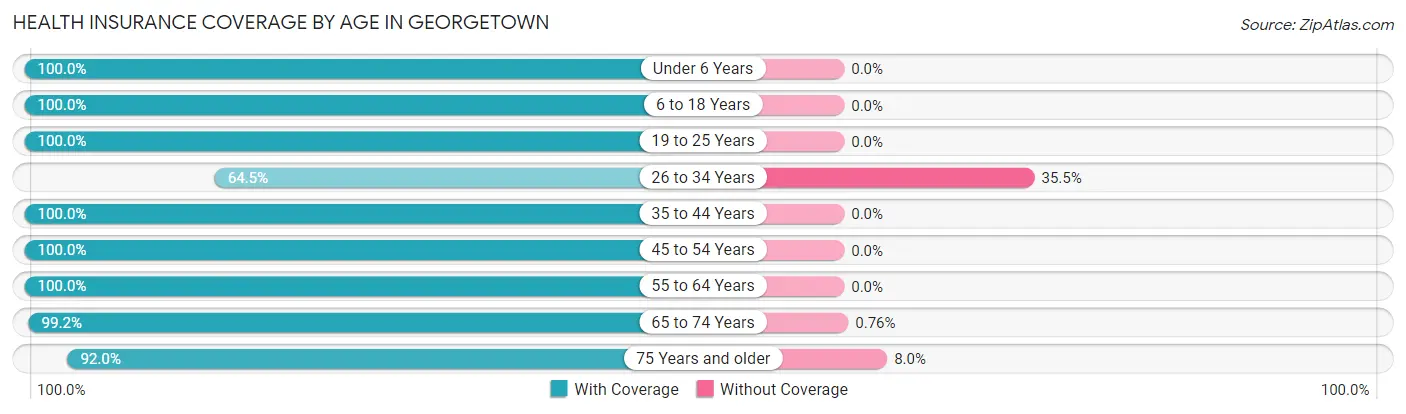
| Age Bracket | With Coverage | Without Coverage |
| Under 6 Years | 96 (100.0%) | 0 (0.0%) |
| 6 to 18 Years | 150 (100.0%) | 0 (0.0%) |
| 19 to 25 Years | 304 (100.0%) | 0 (0.0%) |
| 26 to 34 Years | 60 (64.5%) | 33 (35.5%) |
| 35 to 44 Years | 175 (100.0%) | 0 (0.0%) |
| 45 to 54 Years | 299 (100.0%) | 0 (0.0%) |
| 55 to 64 Years | 207 (100.0%) | 0 (0.0%) |
| 65 to 74 Years | 131 (99.2%) | 1 (0.8%) |
| 75 Years and older | 184 (92.0%) | 16 (8.0%) |
| Total | 1,606 (97.0%) | 50 (3.0%) |
Health Insurance Coverage by Citizenship Status in Georgetown
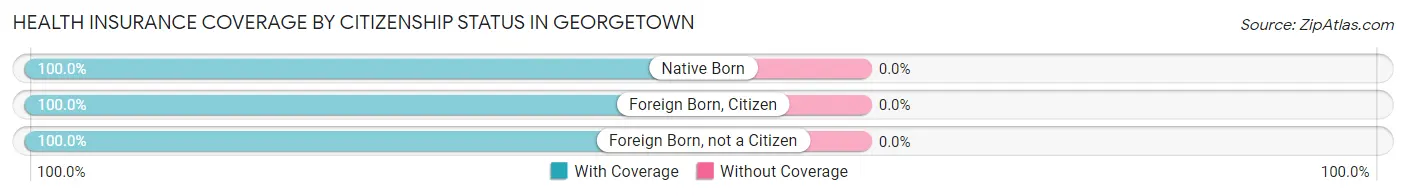
| Citizenship Status | With Coverage | Without Coverage |
| Native Born | 96 (100.0%) | 0 (0.0%) |
| Foreign Born, Citizen | 150 (100.0%) | 0 (0.0%) |
| Foreign Born, not a Citizen | 304 (100.0%) | 0 (0.0%) |
Health Insurance Coverage by Household Income in Georgetown
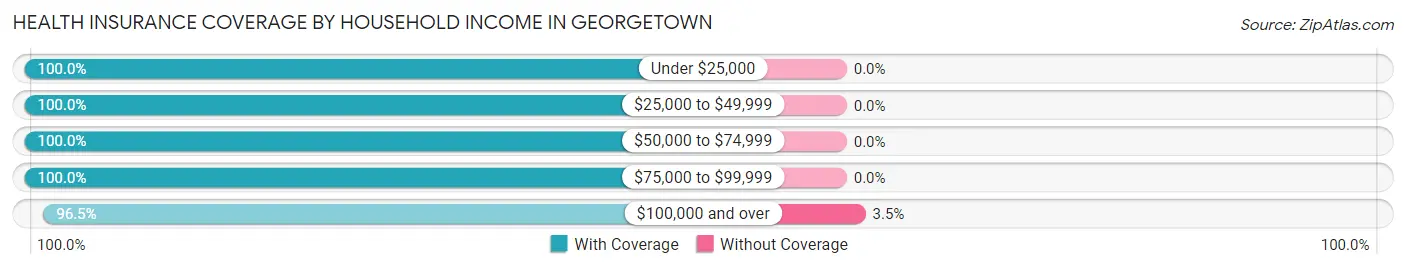
| Household Income | With Coverage | Without Coverage |
| Under $25,000 | 20 (100.0%) | 0 (0.0%) |
| $25,000 to $49,999 | 52 (100.0%) | 0 (0.0%) |
| $50,000 to $74,999 | 115 (100.0%) | 0 (0.0%) |
| $75,000 to $99,999 | 74 (100.0%) | 0 (0.0%) |
| $100,000 and over | 1,345 (96.5%) | 49 (3.5%) |
Public vs Private Health Insurance Coverage by Age in Georgetown
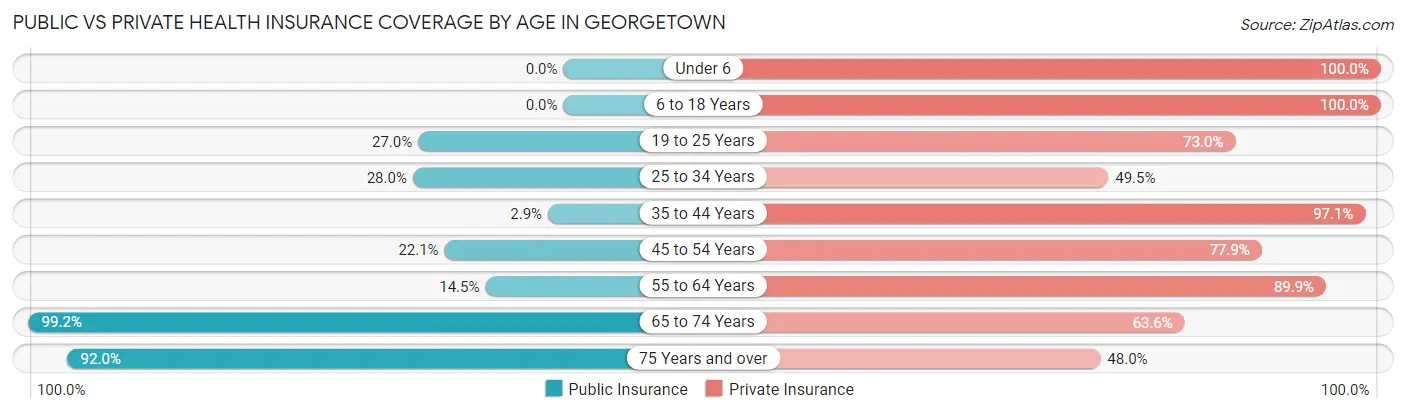
| Age Bracket | Public Insurance | Private Insurance |
| Under 6 | 0 (0.0%) | 96 (100.0%) |
| 6 to 18 Years | 0 (0.0%) | 150 (100.0%) |
| 19 to 25 Years | 82 (27.0%) | 222 (73.0%) |
| 25 to 34 Years | 26 (28.0%) | 46 (49.5%) |
| 35 to 44 Years | 5 (2.9%) | 170 (97.1%) |
| 45 to 54 Years | 66 (22.1%) | 233 (77.9%) |
| 55 to 64 Years | 30 (14.5%) | 186 (89.9%) |
| 65 to 74 Years | 131 (99.2%) | 84 (63.6%) |
| 75 Years and over | 184 (92.0%) | 96 (48.0%) |
| Total | 524 (31.6%) | 1,283 (77.5%) |
Disability Status by Sex by Age in Georgetown
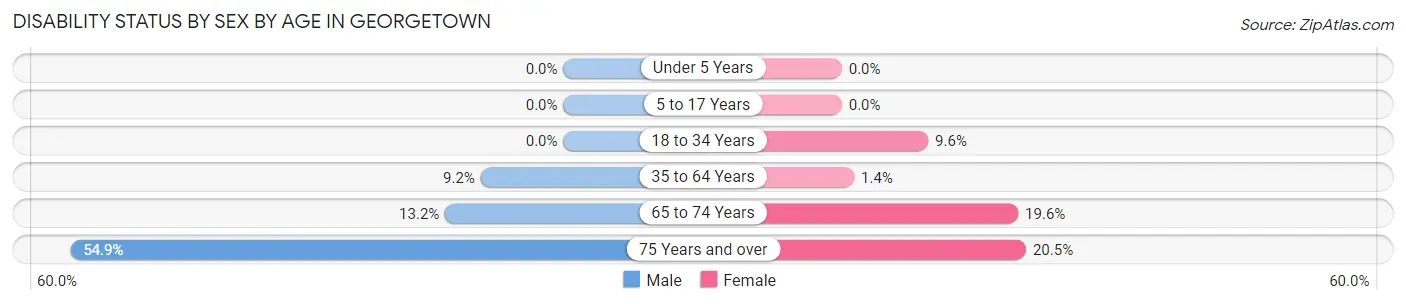
| Age Bracket | Male | Female |
| Under 5 Years | 0 (0.0%) | 0 (0.0%) |
| 5 to 17 Years | 0 (0.0%) | 0 (0.0%) |
| 18 to 34 Years | 0 (0.0%) | 28 (9.6%) |
| 35 to 64 Years | 29 (9.2%) | 5 (1.4%) |
| 65 to 74 Years | 10 (13.2%) | 11 (19.6%) |
| 75 Years and over | 67 (54.9%) | 16 (20.5%) |
Disability Class by Sex by Age in Georgetown
Disability Class: Hearing Difficulty
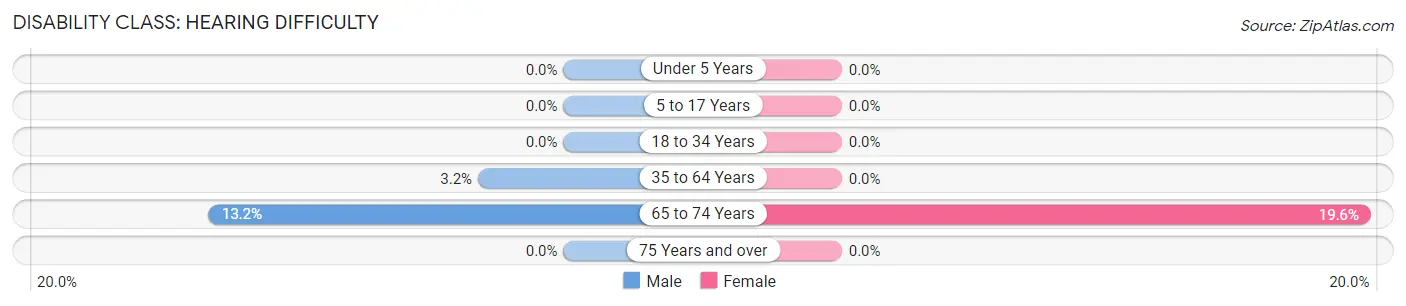
| Age Bracket | Male | Female |
| Under 5 Years | 0 (0.0%) | 0 (0.0%) |
| 5 to 17 Years | 0 (0.0%) | 0 (0.0%) |
| 18 to 34 Years | 0 (0.0%) | 0 (0.0%) |
| 35 to 64 Years | 10 (3.2%) | 0 (0.0%) |
| 65 to 74 Years | 10 (13.2%) | 11 (19.6%) |
| 75 Years and over | 0 (0.0%) | 0 (0.0%) |
Disability Class: Vision Difficulty
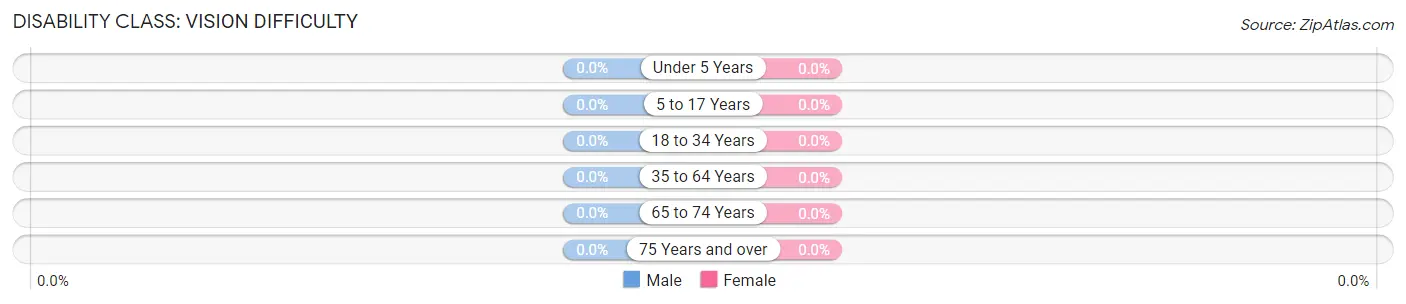
| Age Bracket | Male | Female |
| Under 5 Years | 0 (0.0%) | 0 (0.0%) |
| 5 to 17 Years | 0 (0.0%) | 0 (0.0%) |
| 18 to 34 Years | 0 (0.0%) | 0 (0.0%) |
| 35 to 64 Years | 0 (0.0%) | 0 (0.0%) |
| 65 to 74 Years | 0 (0.0%) | 0 (0.0%) |
| 75 Years and over | 0 (0.0%) | 0 (0.0%) |
Disability Class: Cognitive Difficulty
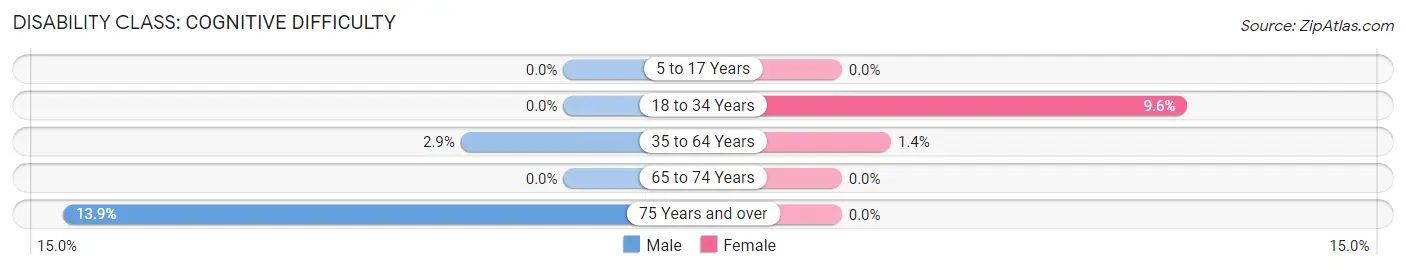
| Age Bracket | Male | Female |
| 5 to 17 Years | 0 (0.0%) | 0 (0.0%) |
| 18 to 34 Years | 0 (0.0%) | 28 (9.6%) |
| 35 to 64 Years | 9 (2.9%) | 5 (1.4%) |
| 65 to 74 Years | 0 (0.0%) | 0 (0.0%) |
| 75 Years and over | 17 (13.9%) | 0 (0.0%) |
Disability Class: Ambulatory Difficulty
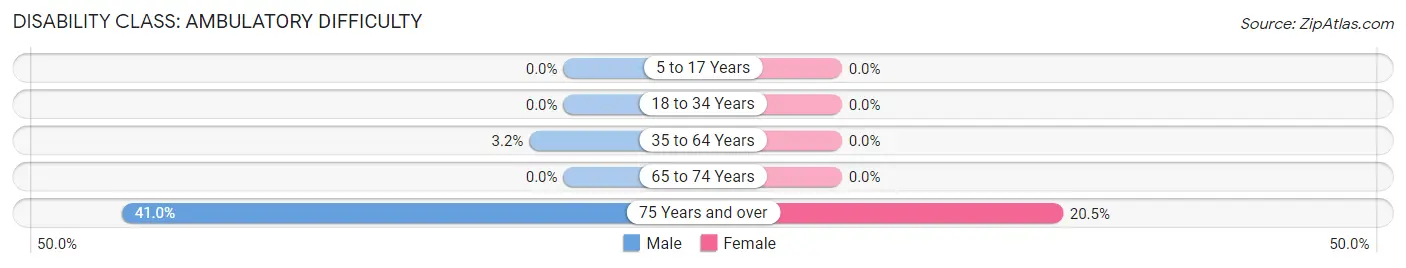
| Age Bracket | Male | Female |
| 5 to 17 Years | 0 (0.0%) | 0 (0.0%) |
| 18 to 34 Years | 0 (0.0%) | 0 (0.0%) |
| 35 to 64 Years | 10 (3.2%) | 0 (0.0%) |
| 65 to 74 Years | 0 (0.0%) | 0 (0.0%) |
| 75 Years and over | 50 (41.0%) | 16 (20.5%) |
Disability Class: Self-Care Difficulty
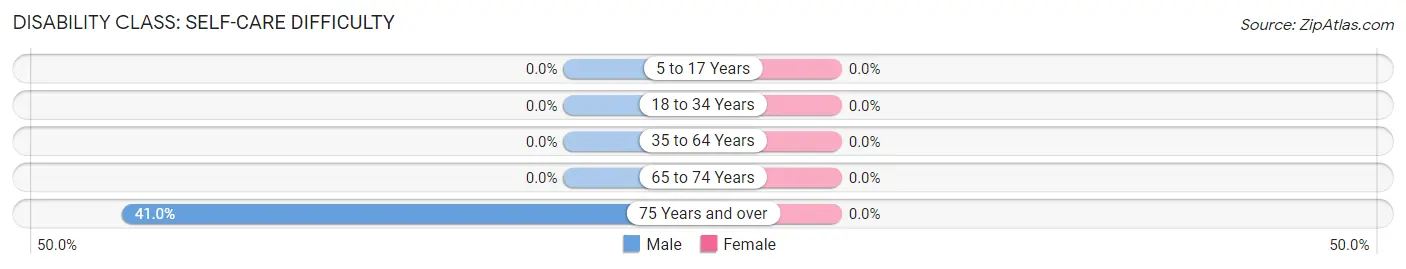
| Age Bracket | Male | Female |
| 5 to 17 Years | 0 (0.0%) | 0 (0.0%) |
| 18 to 34 Years | 0 (0.0%) | 0 (0.0%) |
| 35 to 64 Years | 0 (0.0%) | 0 (0.0%) |
| 65 to 74 Years | 0 (0.0%) | 0 (0.0%) |
| 75 Years and over | 50 (41.0%) | 0 (0.0%) |
Technology Access in Georgetown
Computing Device Access in Georgetown
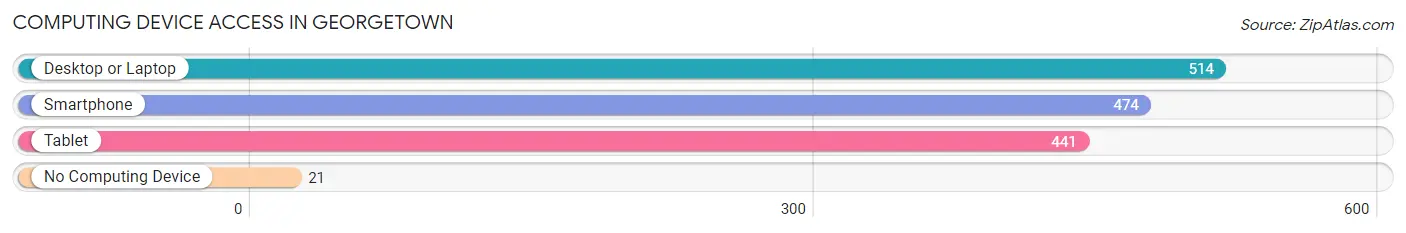
| Device Type | # Households | % Households |
| Desktop or Laptop | 514 | 87.1% |
| Smartphone | 474 | 80.3% |
| Tablet | 441 | 74.8% |
| No Computing Device | 21 | 3.6% |
| Total | 590 | 100.0% |
Internet Access in Georgetown
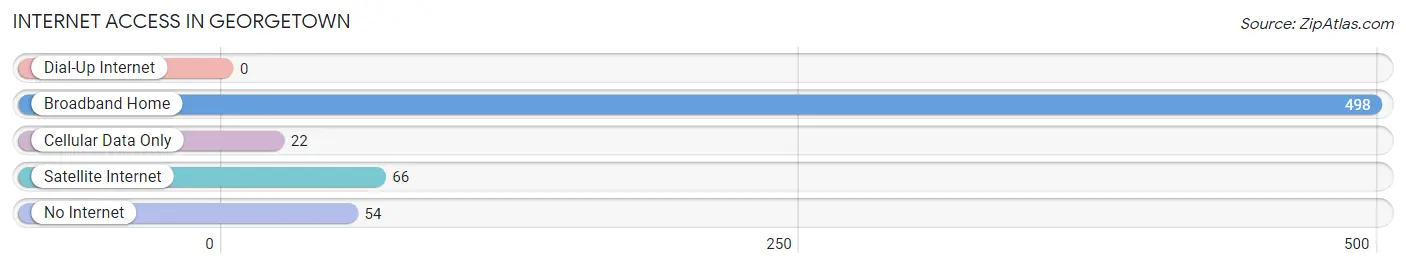
| Internet Type | # Households | % Households |
| Dial-Up Internet | 0 | 0.0% |
| Broadband Home | 498 | 84.4% |
| Cellular Data Only | 22 | 3.7% |
| Satellite Internet | 66 | 11.2% |
| No Internet | 54 | 9.1% |
| Total | 590 | 100.0% |
Georgetown Summary
Georgetown is a town located in Fairfield County, Connecticut. It is situated in the southwestern corner of the state, and is bordered by the towns of Redding, Wilton, Weston, and Ridgefield. The population of Georgetown was 8,183 as of the 2010 census.
Geography
Georgetown is located in southwestern Connecticut, in Fairfield County. It is bordered by the towns of Redding to the north, Wilton to the east, Weston to the south, and Ridgefield to the west. The town is situated on the banks of the Saugatuck River, which flows through the center of town. The terrain of Georgetown is mostly hilly, with some flat areas in the northern and southern parts of town. The highest point in Georgetown is the summit of Bald Hill, which rises to an elevation of 590 feet (180 m).
Climate
Georgetown has a humid continental climate, with warm summers and cold winters. The average annual temperature is 48°F (9°C), and the average annual precipitation is 45 inches (114 cm).
Demographics
As of the 2010 census, the population of Georgetown was 8,183. The racial makeup of the town was 94.3% White, 1.2% African American, 0.2% Native American, 2.2% Asian, 0.1% Pacific Islander, 0.7% from other races, and 1.3% from two or more races. Hispanic or Latino of any race were 3.2% of the population.
Economy
Georgetown is primarily a residential community, with a small commercial center located in the center of town. The town is home to several small businesses, including a grocery store, a hardware store, a pharmacy, and a few restaurants. The town is also home to several corporate offices, including a regional office of the Connecticut Department of Transportation.
History
Georgetown was first settled in 1730 by a group of settlers from Fairfield. The town was originally known as Saugatuck, after the river that runs through it. The town was renamed Georgetown in 1732, after King George II of England.
In the 19th century, Georgetown was a center of the iron industry, with several iron foundries located in the town. The iron industry declined in the late 19th century, and the town shifted to a more residential focus.
Georgetown was home to several notable residents in the 19th and 20th centuries, including the author Mark Twain, who lived in the town for several years.
Georgetown is also home to the Georgetown Fair, which has been held annually since 1871. The fair is held on the first Saturday in August, and features a variety of activities, including a parade, a carnival, and a variety of food and craft vendors.
Common Questions
What is Per Capita Income in Georgetown?
Per Capita income in Georgetown is $93,989.
What is the Median Family Income in Georgetown?
Median Family Income in Georgetown is $216,375.
What is the Median Household income in Georgetown?
Median Household Income in Georgetown is $159,242.
What is Income or Wage Gap in Georgetown?
Income or Wage Gap in Georgetown is 58.7%.
Women in Georgetown earn 41.3 cents for every dollar earned by a man.
What is Inequality or Gini Index in Georgetown?
Inequality or Gini Index in Georgetown is 0.49.
What is the Total Population of Georgetown?
Total Population of Georgetown is 1,656.
What is the Total Male Population of Georgetown?
Total Male Population of Georgetown is 807.
What is the Total Female Population of Georgetown?
Total Female Population of Georgetown is 849.
What is the Ratio of Males per 100 Females in Georgetown?
There are 95.05 Males per 100 Females in Georgetown.
What is the Ratio of Females per 100 Males in Georgetown?
There are 105.20 Females per 100 Males in Georgetown.
What is the Median Population Age in Georgetown?
Median Population Age in Georgetown is 47.5 Years.
What is the Average Family Size in Georgetown
Average Family Size in Georgetown is 3.1 People.
What is the Average Household Size in Georgetown
Average Household Size in Georgetown is 2.8 People.
How Large is the Labor Force in Georgetown?
There are 1,132 People in the Labor Forcein in Georgetown.
What is the Percentage of People in the Labor Force in Georgetown?
75.9% of People are in the Labor Force in Georgetown.
What is the Unemployment Rate in Georgetown?
Unemployment Rate in Georgetown is 8.4%.