Ridgefield, CT Map & Demographics
Ridgefield Map
Ridgefield Overview
$99,341
PER CAPITA INCOME
$197,357
AVG FAMILY INCOME
$139,490
AVG HOUSEHOLD INCOME
47.3%
WAGE / INCOME GAP [ % ]
52.7¢/ $1
WAGE / INCOME GAP [ $ ]
0.56
INEQUALITY / GINI INDEX
7,655
TOTAL POPULATION
3,495
MALE POPULATION
4,160
FEMALE POPULATION
84.01
MALES / 100 FEMALES
119.03
FEMALES / 100 MALES
44.9
MEDIAN AGE
3.2
AVG FAMILY SIZE
2.6
AVG HOUSEHOLD SIZE
3,864
LABOR FORCE [ PEOPLE ]
62.9%
PERCENT IN LABOR FORCE
5.7%
UNEMPLOYMENT RATE
Ridgefield Zip Codes
Ridgefield Area Codes
Income in Ridgefield
Income Overview in Ridgefield
Per Capita Income in Ridgefield is $99,341, while median incomes of families and households are $197,357 and $139,490 respectively.
| Characteristic | Number | Measure |
| Per Capita Income | 7,655 | $99,341 |
| Median Family Income | 2,064 | $197,357 |
| Mean Family Income | 2,064 | $310,943 |
| Median Household Income | 2,980 | $139,490 |
| Mean Household Income | 2,980 | $252,844 |
| Income Deficit | 2,064 | $0 |
| Wage / Income Gap (%) | 7,655 | 47.30% |
| Wage / Income Gap ($) | 7,655 | 52.70¢ per $1 |
| Gini / Inequality Index | 7,655 | 0.56 |
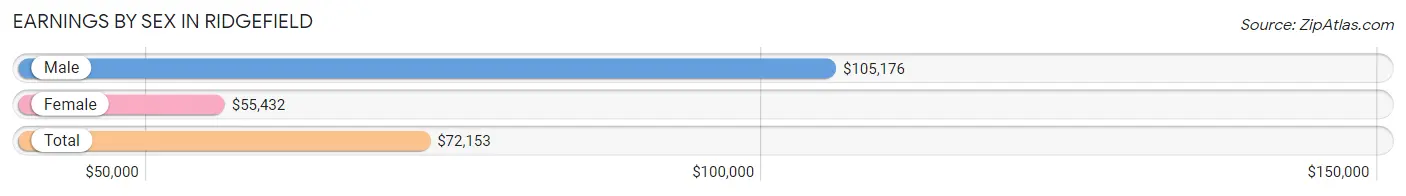
Earnings by Sex in Ridgefield
Average Earnings in Ridgefield are $72,153, $105,176 for men and $55,432 for women, a difference of 47.3%.
| Sex | Number | Average Earnings |
| Male | 2,070 (52.3%) | $105,176 |
| Female | 1,885 (47.7%) | $55,432 |
| Total | 3,955 (100.0%) | $72,153 |
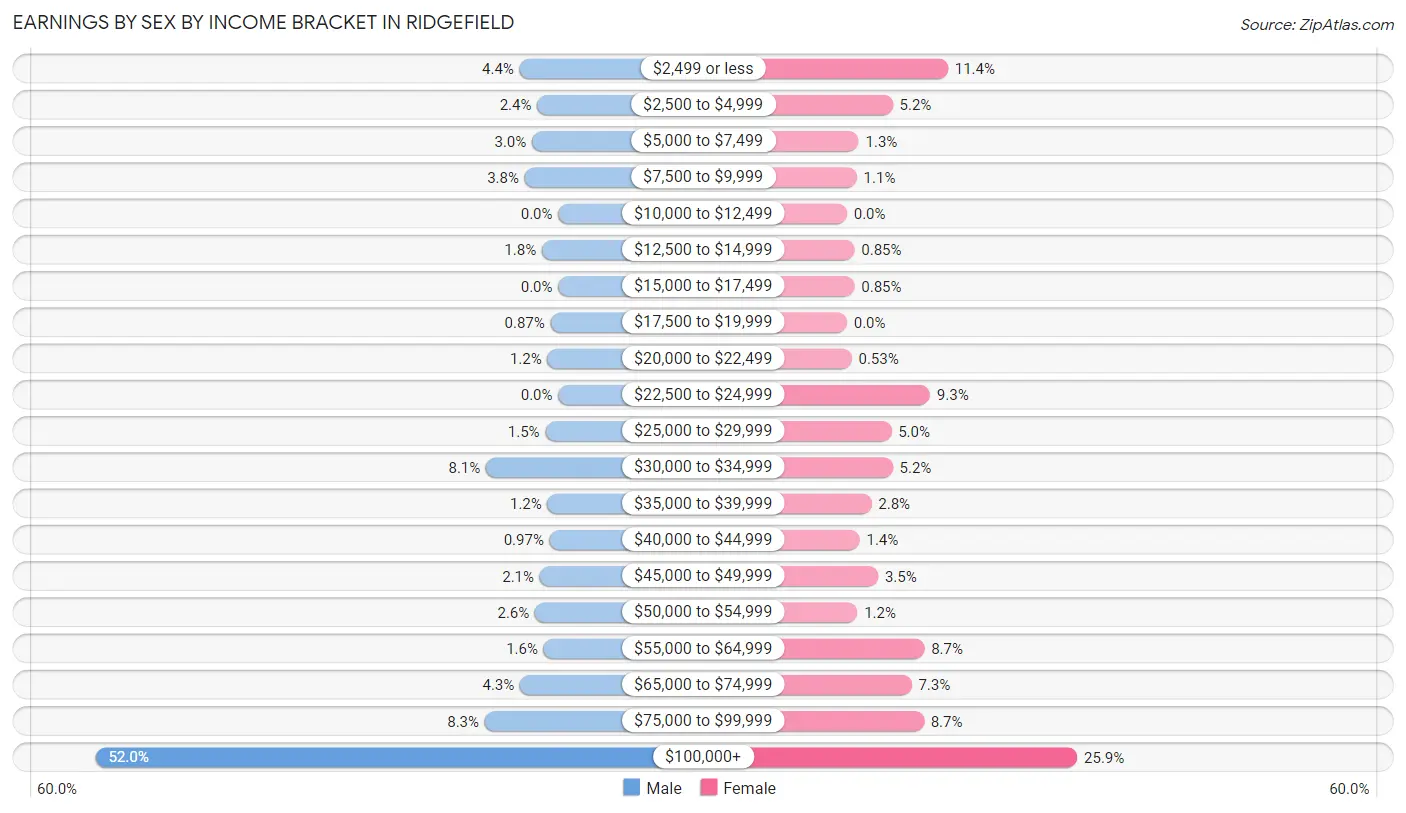
Earnings by Sex by Income Bracket in Ridgefield
The most common earnings brackets in Ridgefield are $100,000+ for men (1,077 | 52.0%) and $100,000+ for women (488 | 25.9%).
| Income | Male | Female |
| $2,499 or less | 90 (4.3%) | 214 (11.4%) |
| $2,500 to $4,999 | 49 (2.4%) | 97 (5.1%) |
| $5,000 to $7,499 | 61 (2.9%) | 25 (1.3%) |
| $7,500 to $9,999 | 78 (3.8%) | 21 (1.1%) |
| $10,000 to $12,499 | 0 (0.0%) | 0 (0.0%) |
| $12,500 to $14,999 | 38 (1.8%) | 16 (0.9%) |
| $15,000 to $17,499 | 0 (0.0%) | 16 (0.9%) |
| $17,500 to $19,999 | 18 (0.9%) | 0 (0.0%) |
| $20,000 to $22,499 | 25 (1.2%) | 10 (0.5%) |
| $22,500 to $24,999 | 0 (0.0%) | 176 (9.3%) |
| $25,000 to $29,999 | 30 (1.5%) | 94 (5.0%) |
| $30,000 to $34,999 | 168 (8.1%) | 97 (5.1%) |
| $35,000 to $39,999 | 25 (1.2%) | 52 (2.8%) |
| $40,000 to $44,999 | 20 (1.0%) | 27 (1.4%) |
| $45,000 to $49,999 | 43 (2.1%) | 66 (3.5%) |
| $50,000 to $54,999 | 54 (2.6%) | 22 (1.2%) |
| $55,000 to $64,999 | 34 (1.6%) | 164 (8.7%) |
| $65,000 to $74,999 | 89 (4.3%) | 137 (7.3%) |
| $75,000 to $99,999 | 171 (8.3%) | 163 (8.6%) |
| $100,000+ | 1,077 (52.0%) | 488 (25.9%) |
| Total | 2,070 (100.0%) | 1,885 (100.0%) |
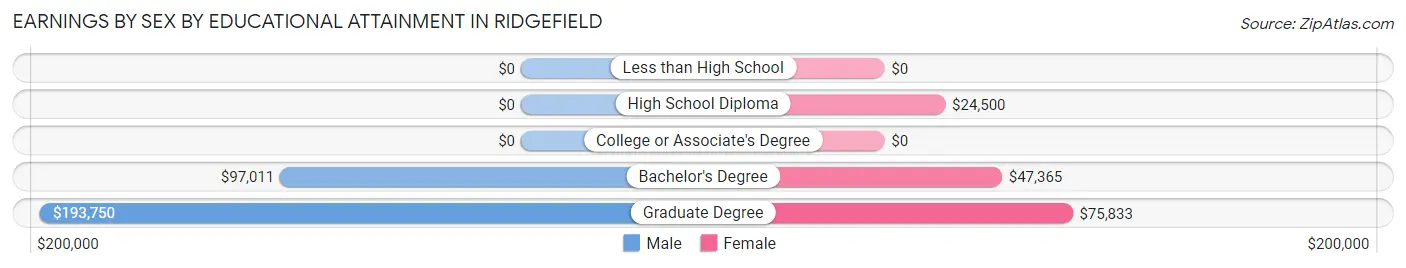
Earnings by Sex by Educational Attainment in Ridgefield
Average earnings in Ridgefield are $110,469 for men and $59,832 for women, a difference of 45.8%. Men with an educational attainment of graduate degree enjoy the highest average annual earnings of $193,750, while those with bachelor's degree education earn the least with $97,011. Women with an educational attainment of graduate degree earn the most with the average annual earnings of $75,833, while those with high school diploma education have the smallest earnings of $24,500.
| Educational Attainment | Male Income | Female Income |
| Less than High School | - | - |
| High School Diploma | - | - |
| College or Associate's Degree | - | - |
| Bachelor's Degree | $97,011 | $47,365 |
| Graduate Degree | $193,750 | $75,833 |
| Total | $110,469 | $59,832 |
Family Income in Ridgefield
Family Income Brackets in Ridgefield
According to the Ridgefield family income data, there are 1,001 families falling into the $200,000+ income range, which is the most common income bracket and makes up 48.5% of all families.
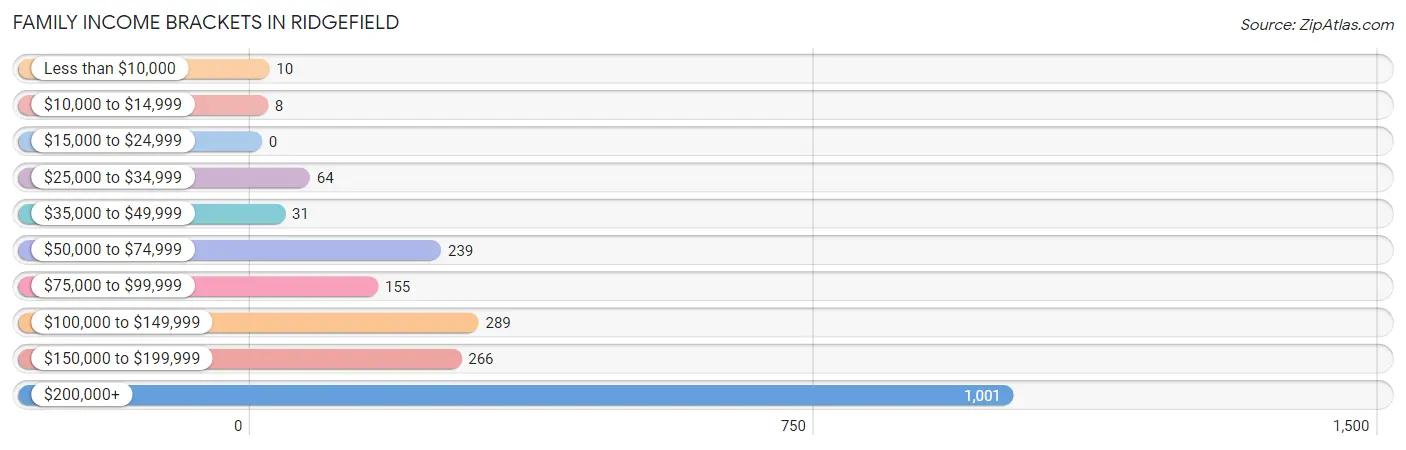
| Income Bracket | # Families | % Families |
| Less than $10,000 | 10 | 0.5% |
| $10,000 to $14,999 | 8 | 0.4% |
| $15,000 to $24,999 | 0 | 0.0% |
| $25,000 to $34,999 | 64 | 3.1% |
| $35,000 to $49,999 | 31 | 1.5% |
| $50,000 to $74,999 | 239 | 11.6% |
| $75,000 to $99,999 | 155 | 7.5% |
| $100,000 to $149,999 | 289 | 14.0% |
| $150,000 to $199,999 | 266 | 12.9% |
| $200,000+ | 1,001 | 48.5% |
Family Income by Famaliy Size in Ridgefield
5-person families (171 | 8.3%) account for the highest median family income in Ridgefield with $250,001 per family, while 2-person families (865 | 41.9%) have the highest median income of $73,304 per family member.
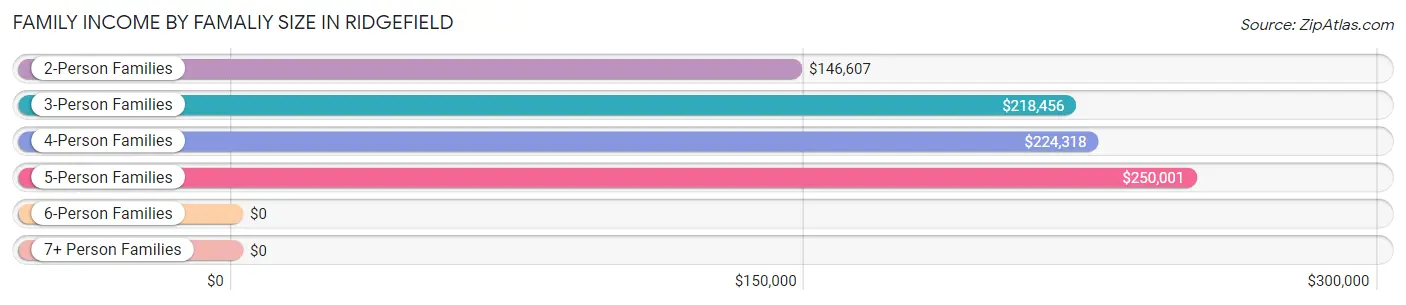
| Income Bracket | # Families | Median Income |
| 2-Person Families | 865 (41.9%) | $146,607 |
| 3-Person Families | 507 (24.6%) | $218,456 |
| 4-Person Families | 456 (22.1%) | $224,318 |
| 5-Person Families | 171 (8.3%) | $250,001 |
| 6-Person Families | 65 (3.2%) | $0 |
| 7+ Person Families | 0 (0.0%) | $0 |
| Total | 2,064 (100.0%) | $197,357 |
Family Income by Number of Earners in Ridgefield
The median family income in Ridgefield is $197,357, with families comprising 3+ earners (186) having the highest median family income of $250,001, while families with no earners (217) have the lowest median family income of $119,844, accounting for 9.0% and 10.5% of families, respectively.
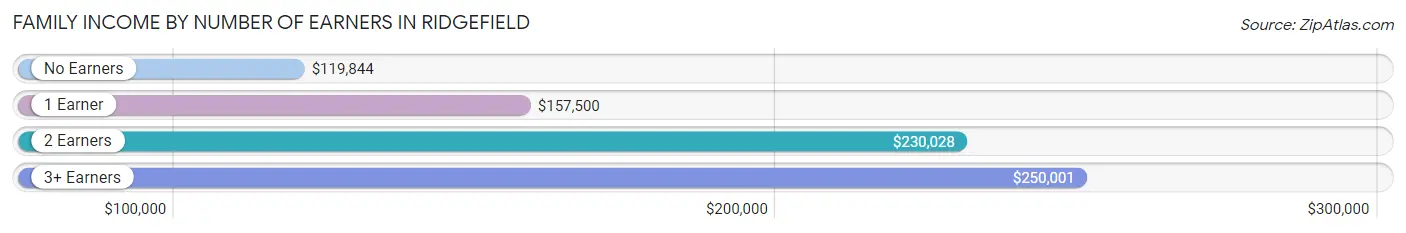
| Number of Earners | # Families | Median Income |
| No Earners | 217 (10.5%) | $119,844 |
| 1 Earner | 586 (28.4%) | $157,500 |
| 2 Earners | 1,075 (52.1%) | $230,028 |
| 3+ Earners | 186 (9.0%) | $250,001 |
| Total | 2,064 (100.0%) | $197,357 |
Household Income in Ridgefield
Household Income Brackets in Ridgefield
With 1,079 households falling in the category, the $200,000+ income range is the most frequent in Ridgefield, accounting for 36.2% of all households. In contrast, only 33 households (1.1%) fall into the $10,000 to $14,999 income bracket, making it the least populous group.
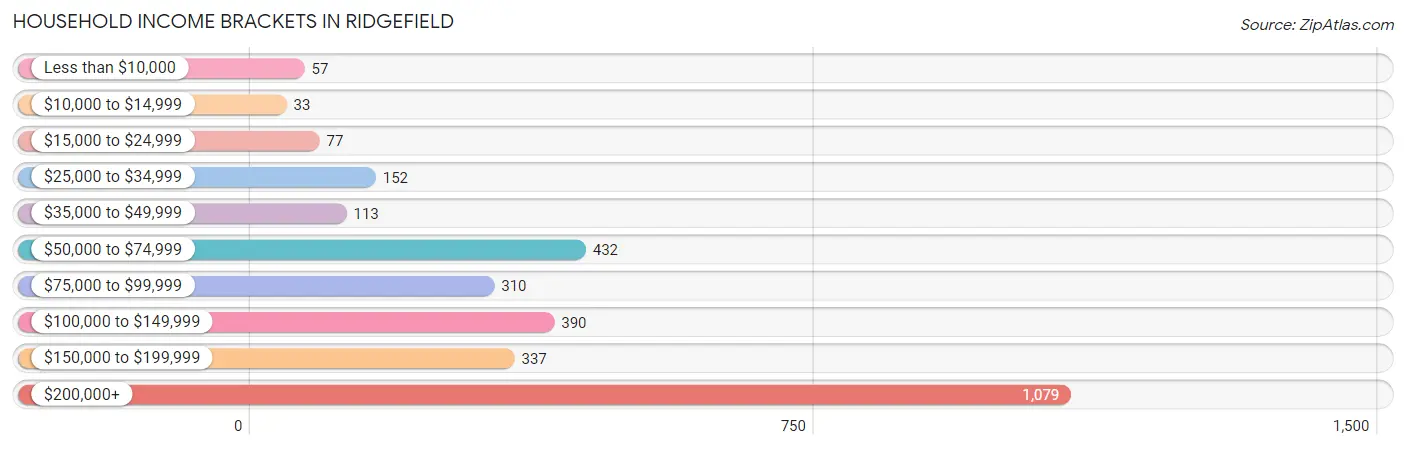
| Income Bracket | # Households | % Households |
| Less than $10,000 | 57 | 1.9% |
| $10,000 to $14,999 | 33 | 1.1% |
| $15,000 to $24,999 | 77 | 2.6% |
| $25,000 to $34,999 | 152 | 5.1% |
| $35,000 to $49,999 | 113 | 3.8% |
| $50,000 to $74,999 | 432 | 14.5% |
| $75,000 to $99,999 | 310 | 10.4% |
| $100,000 to $149,999 | 390 | 13.1% |
| $150,000 to $199,999 | 337 | 11.3% |
| $200,000+ | 1,079 | 36.2% |
Household Income by Householder Age in Ridgefield
The median household income in Ridgefield is $139,490, with the highest median household income of $208,516 found in the 25 to 44 years age bracket for the primary householder. A total of 679 households (22.8%) fall into this category.
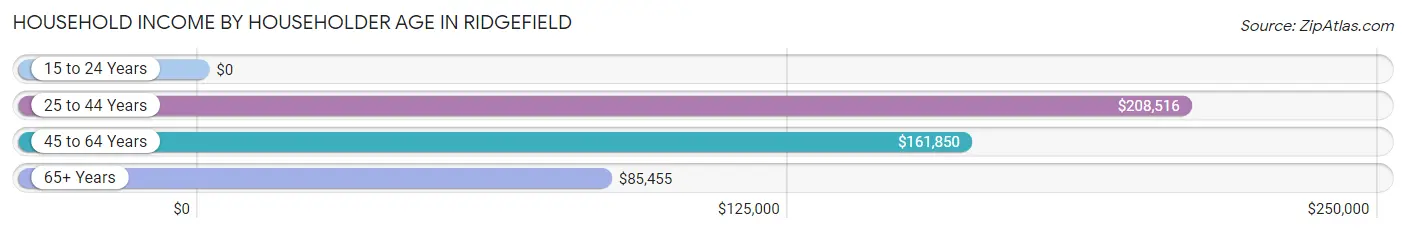
| Income Bracket | # Households | Median Income |
| 15 to 24 Years | 0 (0.0%) | $0 |
| 25 to 44 Years | 679 (22.8%) | $208,516 |
| 45 to 64 Years | 1,345 (45.1%) | $161,850 |
| 65+ Years | 956 (32.1%) | $85,455 |
| Total | 2,980 (100.0%) | $139,490 |
Poverty in Ridgefield
Income Below Poverty by Sex and Age in Ridgefield
With 1.8% poverty level for males and 2.0% for females among the residents of Ridgefield, 18 to 24 year old males and 65 to 74 year old females are the most vulnerable to poverty, with 15 males (10.0%) and 23 females (6.8%) in their respective age groups living below the poverty level.
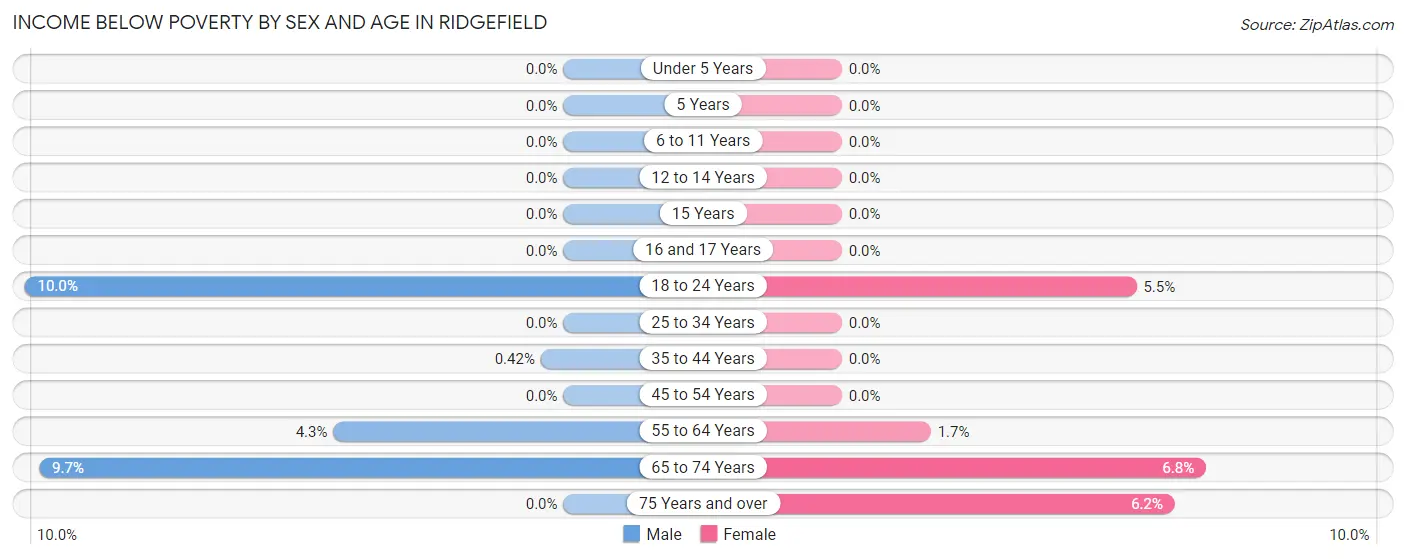
| Age Bracket | Male | Female |
| Under 5 Years | 0 (0.0%) | 0 (0.0%) |
| 5 Years | 0 (0.0%) | 0 (0.0%) |
| 6 to 11 Years | 0 (0.0%) | 0 (0.0%) |
| 12 to 14 Years | 0 (0.0%) | 0 (0.0%) |
| 15 Years | 0 (0.0%) | 0 (0.0%) |
| 16 and 17 Years | 0 (0.0%) | 0 (0.0%) |
| 18 to 24 Years | 15 (10.0%) | 17 (5.5%) |
| 25 to 34 Years | 0 (0.0%) | 0 (0.0%) |
| 35 to 44 Years | 2 (0.4%) | 0 (0.0%) |
| 45 to 54 Years | 0 (0.0%) | 0 (0.0%) |
| 55 to 64 Years | 19 (4.3%) | 9 (1.7%) |
| 65 to 74 Years | 25 (9.7%) | 23 (6.8%) |
| 75 Years and over | 0 (0.0%) | 35 (6.2%) |
| Total | 61 (1.8%) | 84 (2.0%) |
Income Above Poverty by Sex and Age in Ridgefield
According to the poverty statistics in Ridgefield, males aged under 5 years and females aged under 5 years are the age groups that are most secure financially, with 100.0% of males and 100.0% of females in these age groups living above the poverty line.
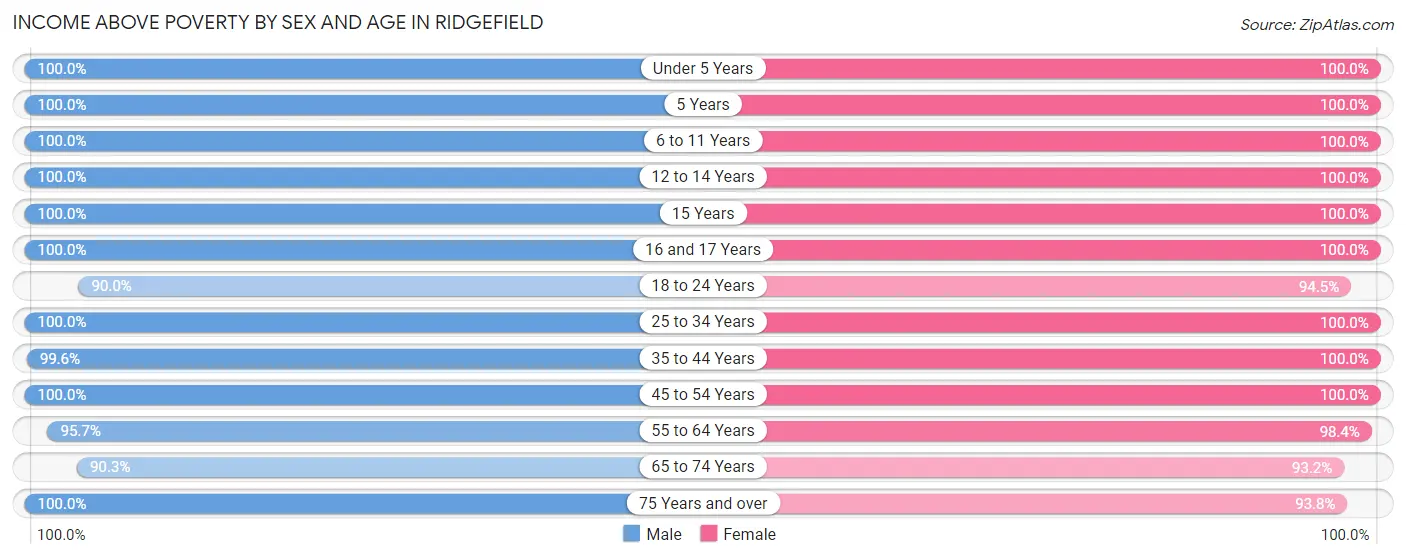
| Age Bracket | Male | Female |
| Under 5 Years | 155 (100.0%) | 267 (100.0%) |
| 5 Years | 27 (100.0%) | 57 (100.0%) |
| 6 to 11 Years | 317 (100.0%) | 270 (100.0%) |
| 12 to 14 Years | 217 (100.0%) | 157 (100.0%) |
| 15 Years | 24 (100.0%) | 21 (100.0%) |
| 16 and 17 Years | 183 (100.0%) | 178 (100.0%) |
| 18 to 24 Years | 135 (90.0%) | 294 (94.5%) |
| 25 to 34 Years | 252 (100.0%) | 275 (100.0%) |
| 35 to 44 Years | 474 (99.6%) | 507 (100.0%) |
| 45 to 54 Years | 610 (100.0%) | 666 (100.0%) |
| 55 to 64 Years | 426 (95.7%) | 536 (98.4%) |
| 65 to 74 Years | 232 (90.3%) | 317 (93.2%) |
| 75 Years and over | 382 (100.0%) | 531 (93.8%) |
| Total | 3,434 (98.3%) | 4,076 (98.0%) |
Income Below Poverty Among Married-Couple Families in Ridgefield
The poverty statistics for married-couple families in Ridgefield show that 0.5% or 9 of the total 1,845 families live below the poverty line. Families with no children have the highest poverty rate of 0.9%, comprising of 9 families. On the other hand, families with 1 or 2 children have the lowest poverty rate of 0.0%, which includes 0 families.
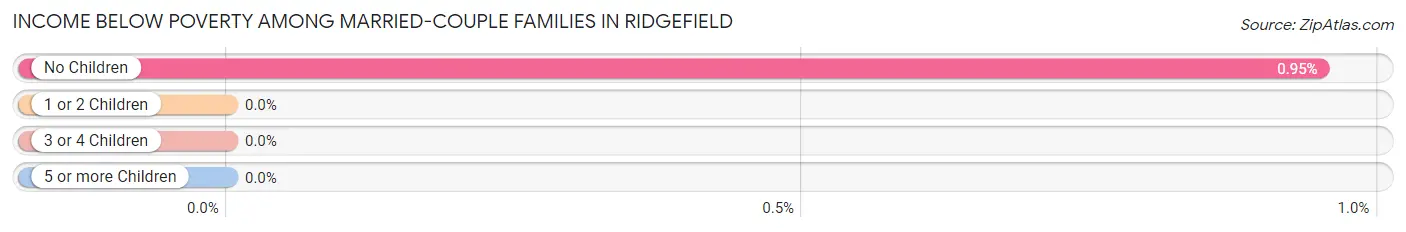
| Children | Above Poverty | Below Poverty |
| No Children | 942 (99.1%) | 9 (0.9%) |
| 1 or 2 Children | 716 (100.0%) | 0 (0.0%) |
| 3 or 4 Children | 178 (100.0%) | 0 (0.0%) |
| 5 or more Children | 0 (0.0%) | 0 (0.0%) |
| Total | 1,836 (99.5%) | 9 (0.5%) |
Income Below Poverty Among Single-Parent Households in Ridgefield
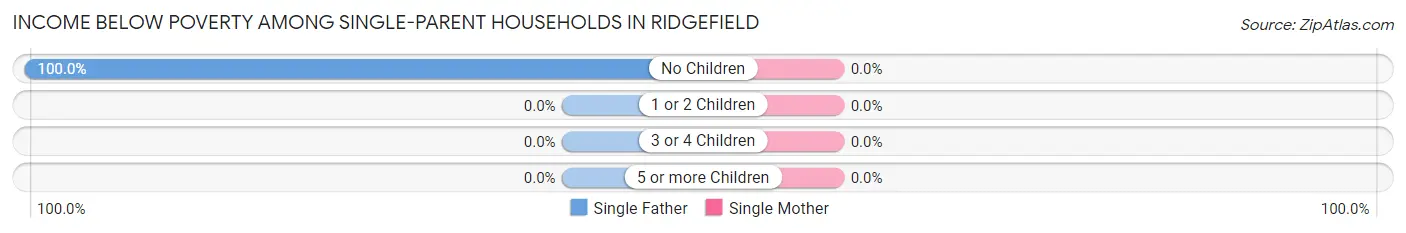
| Children | Single Father | Single Mother |
| No Children | 10 (100.0%) | 0 (0.0%) |
| 1 or 2 Children | 0 (0.0%) | 0 (0.0%) |
| 3 or 4 Children | 0 (0.0%) | 0 (0.0%) |
| 5 or more Children | 0 (0.0%) | 0 (0.0%) |
| Total | 10 (50.0%) | 0 (0.0%) |
Income Below Poverty Among Married-Couple vs Single-Parent Households in Ridgefield
The poverty data for Ridgefield shows that 9 of the married-couple family households (0.5%) and 10 of the single-parent households (4.6%) are living below the poverty level. Within the married-couple family households, those with no children have the highest poverty rate, with 9 households (0.9%) falling below the poverty line. Among the single-parent households, those with no children have the highest poverty rate, with 10 household (10.1%) living below poverty.
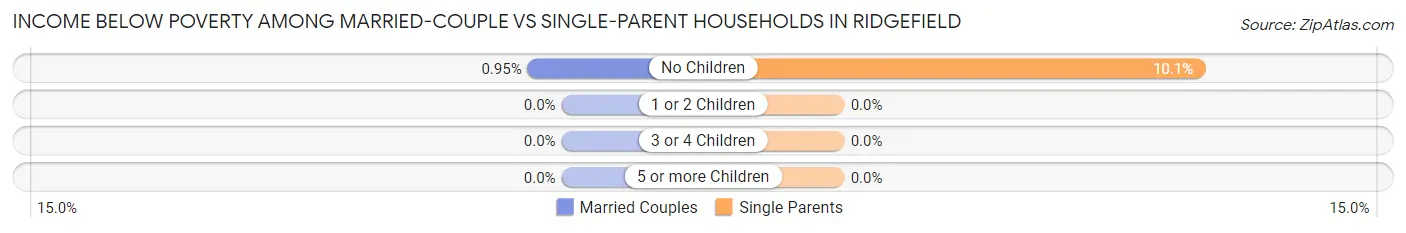
| Children | Married-Couple Families | Single-Parent Households |
| No Children | 9 (0.9%) | 10 (10.1%) |
| 1 or 2 Children | 0 (0.0%) | 0 (0.0%) |
| 3 or 4 Children | 0 (0.0%) | 0 (0.0%) |
| 5 or more Children | 0 (0.0%) | 0 (0.0%) |
| Total | 9 (0.5%) | 10 (4.6%) |
Race in Ridgefield
The most populous races in Ridgefield are White / Caucasian (7,080 | 92.5%), Hispanic or Latino (394 | 5.1%), and Black / African American (280 | 3.7%).
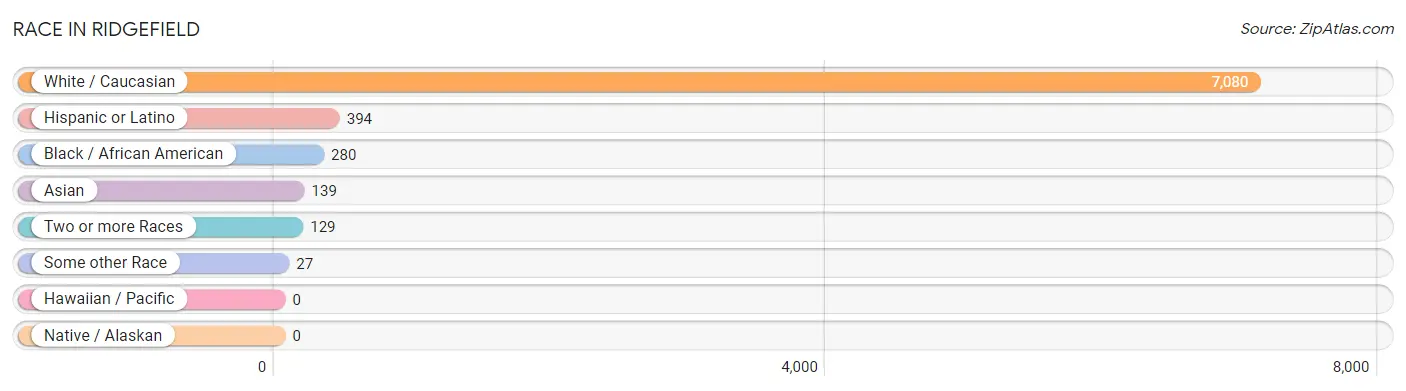
| Race | # Population | % Population |
| Asian | 139 | 1.8% |
| Black / African American | 280 | 3.7% |
| Hawaiian / Pacific | 0 | 0.0% |
| Hispanic or Latino | 394 | 5.1% |
| Native / Alaskan | 0 | 0.0% |
| White / Caucasian | 7,080 | 92.5% |
| Two or more Races | 129 | 1.7% |
| Some other Race | 27 | 0.4% |
| Total | 7,655 | 100.0% |
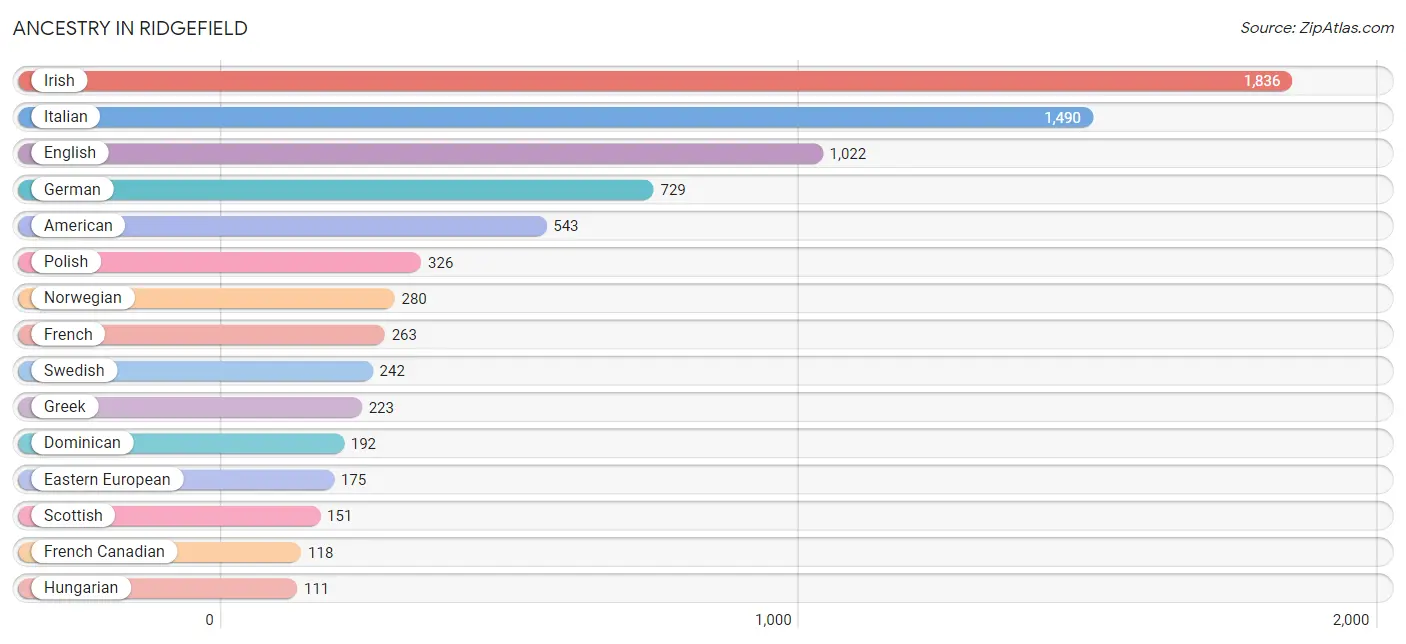
Ancestry in Ridgefield
The most populous ancestries reported in Ridgefield are Irish (1,836 | 24.0%), Italian (1,490 | 19.5%), English (1,022 | 13.4%), German (729 | 9.5%), and American (543 | 7.1%), together accounting for 73.4% of all Ridgefield residents.
| Ancestry | # Population | % Population |
| American | 543 | 7.1% |
| Arab | 25 | 0.3% |
| Armenian | 57 | 0.7% |
| Australian | 36 | 0.5% |
| Austrian | 48 | 0.6% |
| British | 65 | 0.9% |
| Burmese | 36 | 0.5% |
| Canadian | 69 | 0.9% |
| Central American | 58 | 0.8% |
| Cuban | 12 | 0.2% |
| Czech | 11 | 0.1% |
| Danish | 28 | 0.4% |
| Dominican | 192 | 2.5% |
| Dutch | 12 | 0.2% |
| Eastern European | 175 | 2.3% |
| Egyptian | 14 | 0.2% |
| English | 1,022 | 13.4% |
| European | 56 | 0.7% |
| Finnish | 31 | 0.4% |
| French | 263 | 3.4% |
| French Canadian | 118 | 1.5% |
| German | 729 | 9.5% |
| Greek | 223 | 2.9% |
| Guatemalan | 26 | 0.3% |
| Hungarian | 111 | 1.5% |
| Indian (Asian) | 99 | 1.3% |
| Irish | 1,836 | 24.0% |
| Italian | 1,490 | 19.5% |
| Jamaican | 22 | 0.3% |
| Lebanese | 11 | 0.1% |
| Lithuanian | 45 | 0.6% |
| Northern European | 65 | 0.9% |
| Norwegian | 280 | 3.7% |
| Peruvian | 52 | 0.7% |
| Polish | 326 | 4.3% |
| Portuguese | 79 | 1.0% |
| Puerto Rican | 49 | 0.6% |
| Romanian | 11 | 0.1% |
| Russian | 76 | 1.0% |
| Salvadoran | 32 | 0.4% |
| Scandinavian | 38 | 0.5% |
| Scotch-Irish | 44 | 0.6% |
| Scottish | 151 | 2.0% |
| Slovak | 62 | 0.8% |
| South American | 52 | 0.7% |
| Spaniard | 31 | 0.4% |
| Subsaharan African | 41 | 0.5% |
| Swedish | 242 | 3.2% |
| Thai | 16 | 0.2% |
| Ukrainian | 24 | 0.3% |
| Welsh | 28 | 0.4% | View All 51 Rows |
Immigrants in Ridgefield
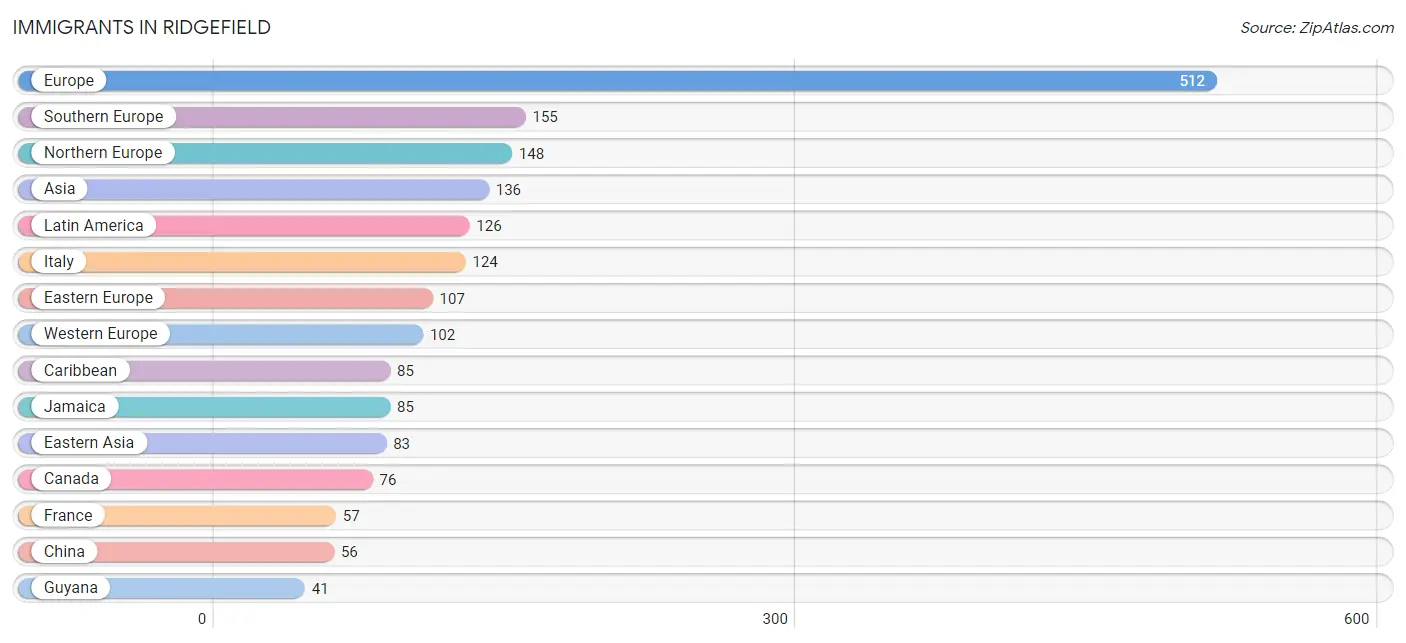
The most numerous immigrant groups reported in Ridgefield came from Europe (512 | 6.7%), Southern Europe (155 | 2.0%), Northern Europe (148 | 1.9%), Asia (136 | 1.8%), and Latin America (126 | 1.7%), together accounting for 14.1% of all Ridgefield residents.
| Immigration Origin | # Population | % Population |
| Africa | 8 | 0.1% |
| Armenia | 19 | 0.3% |
| Asia | 136 | 1.8% |
| Australia | 12 | 0.2% |
| Belarus | 16 | 0.2% |
| Canada | 76 | 1.0% |
| Caribbean | 85 | 1.1% |
| China | 56 | 0.7% |
| Denmark | 15 | 0.2% |
| Eastern Asia | 83 | 1.1% |
| Eastern Europe | 107 | 1.4% |
| England | 17 | 0.2% |
| Europe | 512 | 6.7% |
| France | 57 | 0.7% |
| Germany | 33 | 0.4% |
| Guyana | 41 | 0.5% |
| Hungary | 14 | 0.2% |
| India | 16 | 0.2% |
| Italy | 124 | 1.6% |
| Jamaica | 85 | 1.1% |
| Korea | 27 | 0.4% |
| Latin America | 126 | 1.7% |
| Latvia | 16 | 0.2% |
| Lithuania | 17 | 0.2% |
| Netherlands | 12 | 0.2% |
| Northern Europe | 148 | 1.9% |
| Oceania | 20 | 0.3% |
| Pakistan | 18 | 0.2% |
| Poland | 21 | 0.3% |
| Scotland | 7 | 0.1% |
| South Africa | 8 | 0.1% |
| South America | 41 | 0.5% |
| South Central Asia | 34 | 0.4% |
| Southern Europe | 155 | 2.0% |
| Spain | 31 | 0.4% |
| Ukraine | 23 | 0.3% |
| Western Asia | 19 | 0.3% |
| Western Europe | 102 | 1.3% | View All 38 Rows |
Sex and Age in Ridgefield
Sex and Age in Ridgefield
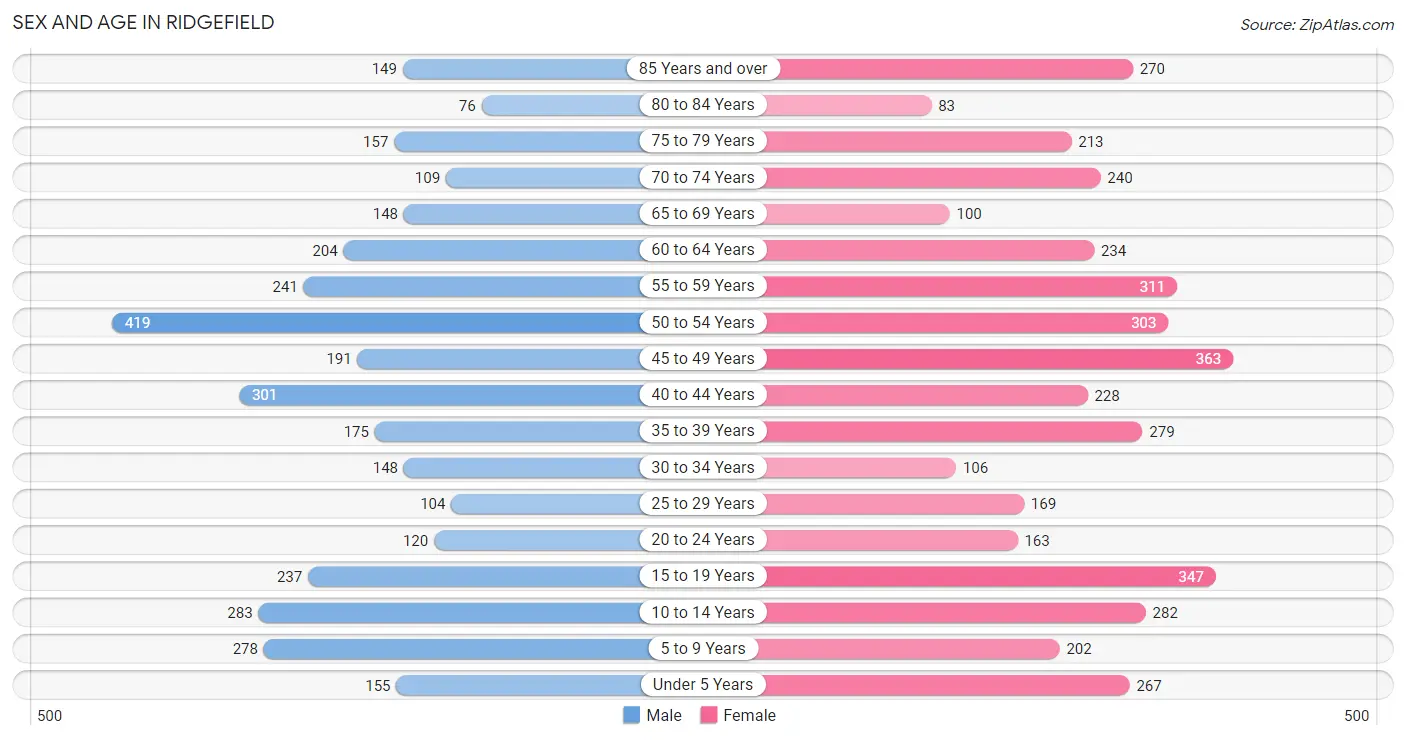
The most populous age groups in Ridgefield are 50 to 54 Years (419 | 12.0%) for men and 45 to 49 Years (363 | 8.7%) for women.
| Age Bracket | Male | Female |
| Under 5 Years | 155 (4.4%) | 267 (6.4%) |
| 5 to 9 Years | 278 (8.0%) | 202 (4.9%) |
| 10 to 14 Years | 283 (8.1%) | 282 (6.8%) |
| 15 to 19 Years | 237 (6.8%) | 347 (8.3%) |
| 20 to 24 Years | 120 (3.4%) | 163 (3.9%) |
| 25 to 29 Years | 104 (3.0%) | 169 (4.1%) |
| 30 to 34 Years | 148 (4.2%) | 106 (2.5%) |
| 35 to 39 Years | 175 (5.0%) | 279 (6.7%) |
| 40 to 44 Years | 301 (8.6%) | 228 (5.5%) |
| 45 to 49 Years | 191 (5.5%) | 363 (8.7%) |
| 50 to 54 Years | 419 (12.0%) | 303 (7.3%) |
| 55 to 59 Years | 241 (6.9%) | 311 (7.5%) |
| 60 to 64 Years | 204 (5.8%) | 234 (5.6%) |
| 65 to 69 Years | 148 (4.2%) | 100 (2.4%) |
| 70 to 74 Years | 109 (3.1%) | 240 (5.8%) |
| 75 to 79 Years | 157 (4.5%) | 213 (5.1%) |
| 80 to 84 Years | 76 (2.2%) | 83 (2.0%) |
| 85 Years and over | 149 (4.3%) | 270 (6.5%) |
| Total | 3,495 (100.0%) | 4,160 (100.0%) |
Families and Households in Ridgefield
Median Family Size in Ridgefield
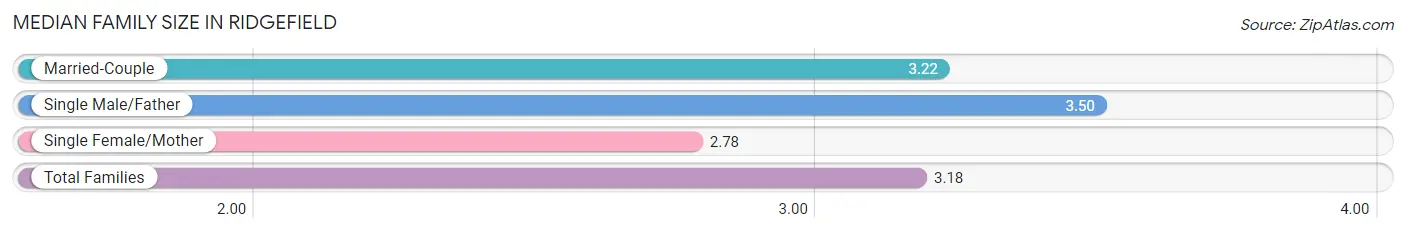
The median family size in Ridgefield is 3.18 persons per family, with single male/father families (20 | 1.0%) accounting for the largest median family size of 3.5 persons per family. On the other hand, single female/mother families (199 | 9.6%) represent the smallest median family size with 2.78 persons per family.
| Family Type | # Families | Family Size |
| Married-Couple | 1,845 (89.4%) | 3.22 |
| Single Male/Father | 20 (1.0%) | 3.50 |
| Single Female/Mother | 199 (9.6%) | 2.78 |
| Total Families | 2,064 (100.0%) | 3.18 |
Median Household Size in Ridgefield
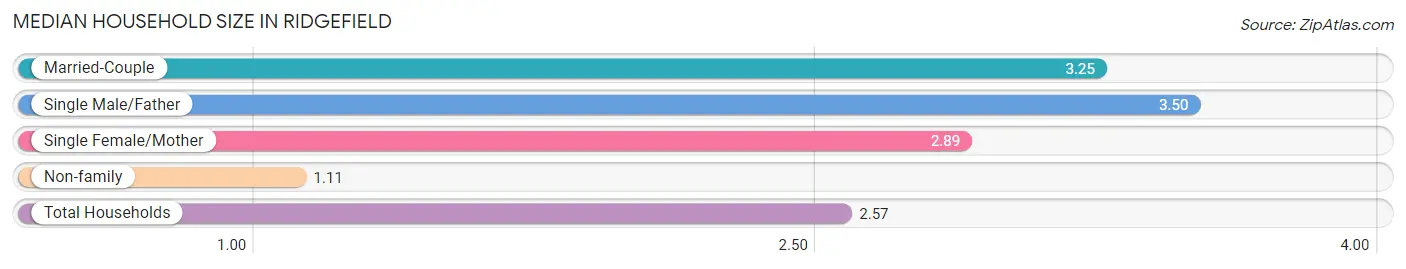
The median household size in Ridgefield is 2.57 persons per household, with single male/father households (20 | 0.7%) accounting for the largest median household size of 3.5 persons per household. non-family households (916 | 30.7%) represent the smallest median household size with 1.11 persons per household.
| Household Type | # Households | Household Size |
| Married-Couple | 1,845 (61.9%) | 3.25 |
| Single Male/Father | 20 (0.7%) | 3.50 |
| Single Female/Mother | 199 (6.7%) | 2.89 |
| Non-family | 916 (30.7%) | 1.11 |
| Total Households | 2,980 (100.0%) | 2.57 |
Household Size by Marriage Status in Ridgefield
Out of a total of 2,980 households in Ridgefield, 2,064 (69.3%) are family households, while 916 (30.7%) are nonfamily households. The most numerous type of family households are 2-person households, comprising 814, and the most common type of nonfamily households are 1-person households, comprising 825.
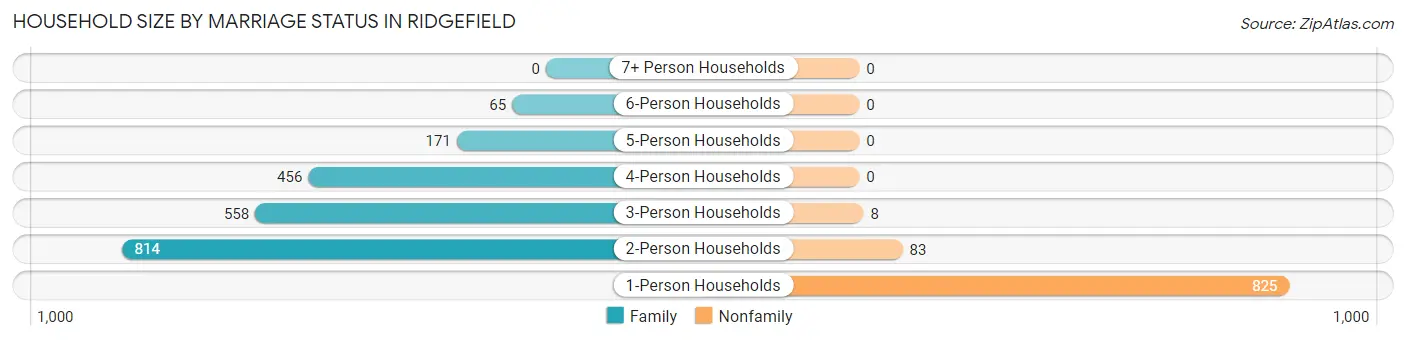
| Household Size | Family Households | Nonfamily Households |
| 1-Person Households | - | 825 (27.7%) |
| 2-Person Households | 814 (27.3%) | 83 (2.8%) |
| 3-Person Households | 558 (18.7%) | 8 (0.3%) |
| 4-Person Households | 456 (15.3%) | 0 (0.0%) |
| 5-Person Households | 171 (5.7%) | 0 (0.0%) |
| 6-Person Households | 65 (2.2%) | 0 (0.0%) |
| 7+ Person Households | 0 (0.0%) | 0 (0.0%) |
| Total | 2,064 (69.3%) | 916 (30.7%) |
Female Fertility in Ridgefield
Fertility by Age in Ridgefield
Average fertility rate in Ridgefield is 52.0 births per 1,000 women. Women in the age bracket of 20 to 34 years have the highest fertility rate with 146.0 births per 1,000 women. Women in the age bracket of 20 to 34 years acount for 70.3% of all women with births.
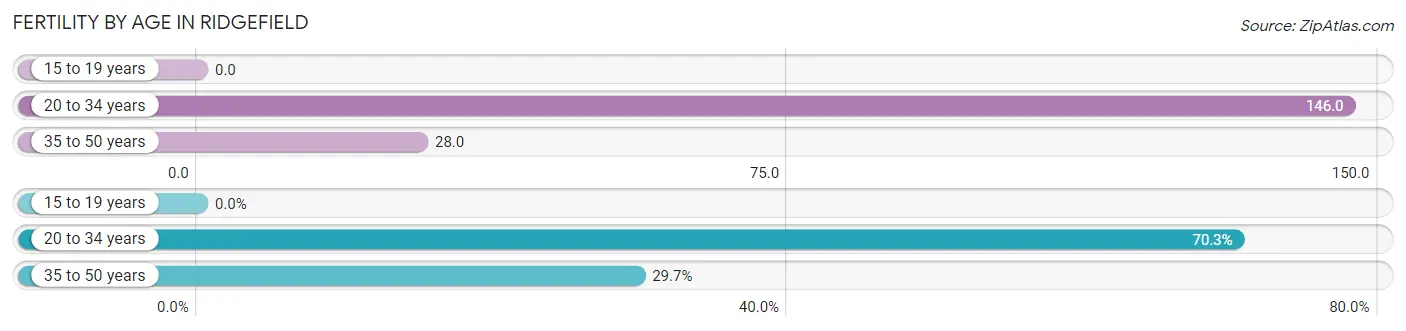
| Age Bracket | Women with Births | Births / 1,000 Women |
| 15 to 19 years | 0 (0.0%) | 0.0 |
| 20 to 34 years | 64 (70.3%) | 146.0 |
| 35 to 50 years | 27 (29.7%) | 28.0 |
| Total | 91 (100.0%) | 52.0 |
Fertility by Age by Marriage Status in Ridgefield
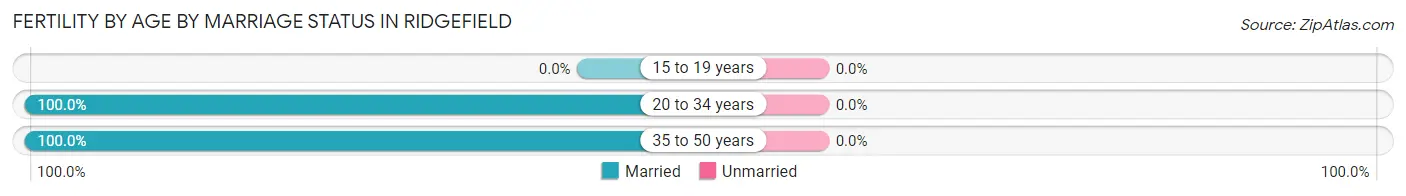
| Age Bracket | Married | Unmarried |
| 15 to 19 years | 0 (0.0%) | 0 (0.0%) |
| 20 to 34 years | 64 (100.0%) | 0 (0.0%) |
| 35 to 50 years | 27 (100.0%) | 0 (0.0%) |
| Total | 91 (100.0%) | 0 (0.0%) |
Fertility by Education in Ridgefield
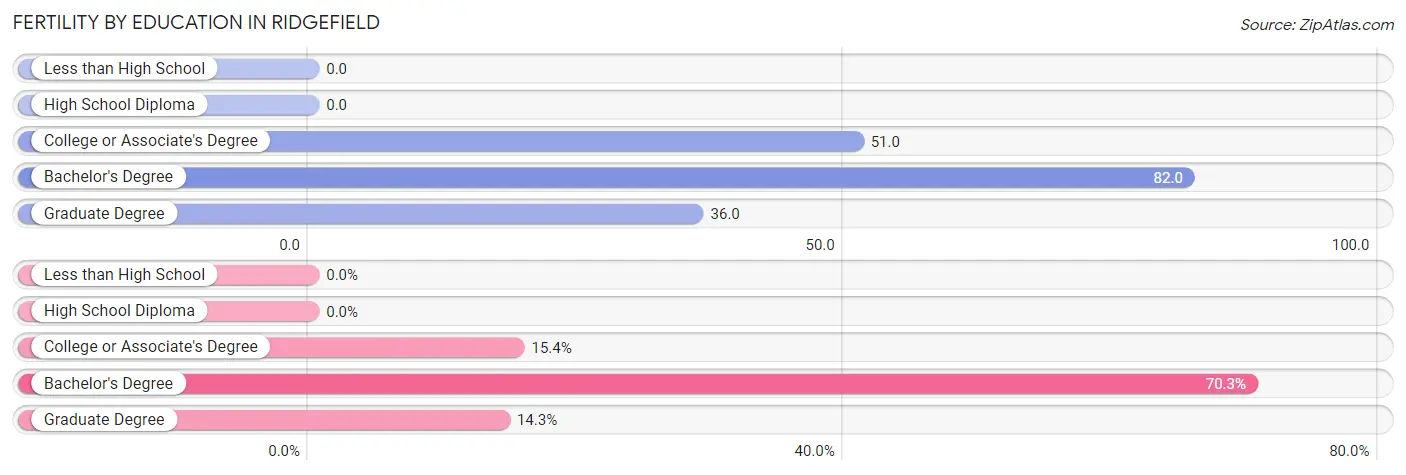
| Educational Attainment | Women with Births | Births / 1,000 Women |
| Less than High School | 0 (0.0%) | 0.0 |
| High School Diploma | 0 (0.0%) | 0.0 |
| College or Associate's Degree | 14 (15.4%) | 51.0 |
| Bachelor's Degree | 64 (70.3%) | 82.0 |
| Graduate Degree | 13 (14.3%) | 36.0 |
| Total | 91 (100.0%) | 52.0 |
Fertility by Education by Marriage Status in Ridgefield
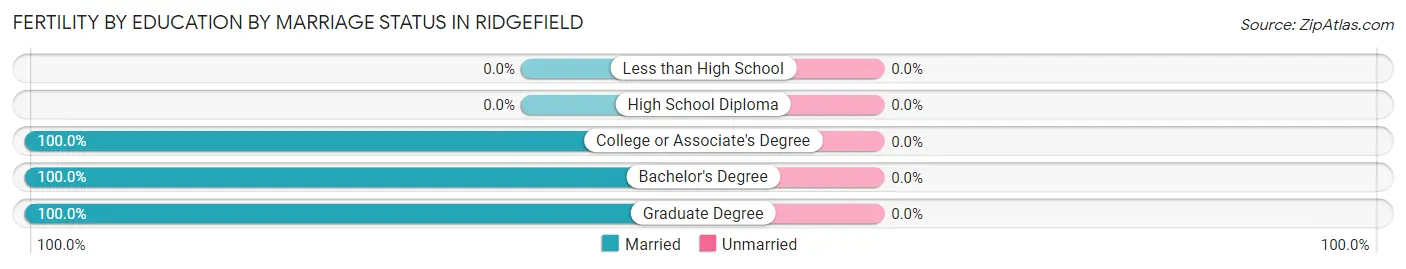
| Educational Attainment | Married | Unmarried |
| Less than High School | 0 (0.0%) | 0 (0.0%) |
| High School Diploma | 0 (0.0%) | 0 (0.0%) |
| College or Associate's Degree | 14 (100.0%) | 0 (0.0%) |
| Bachelor's Degree | 64 (100.0%) | 0 (0.0%) |
| Graduate Degree | 13 (100.0%) | 0 (0.0%) |
| Total | 91 (100.0%) | 0 (0.0%) |
Employment Characteristics in Ridgefield
Employment by Class of Employer in Ridgefield
Among the 3,593 employed individuals in Ridgefield, private company employees (2,342 | 65.2%), self-employed (not incorporated) (530 | 14.7%), and not-for-profit organizations (328 | 9.1%) make up the most common classes of employment.
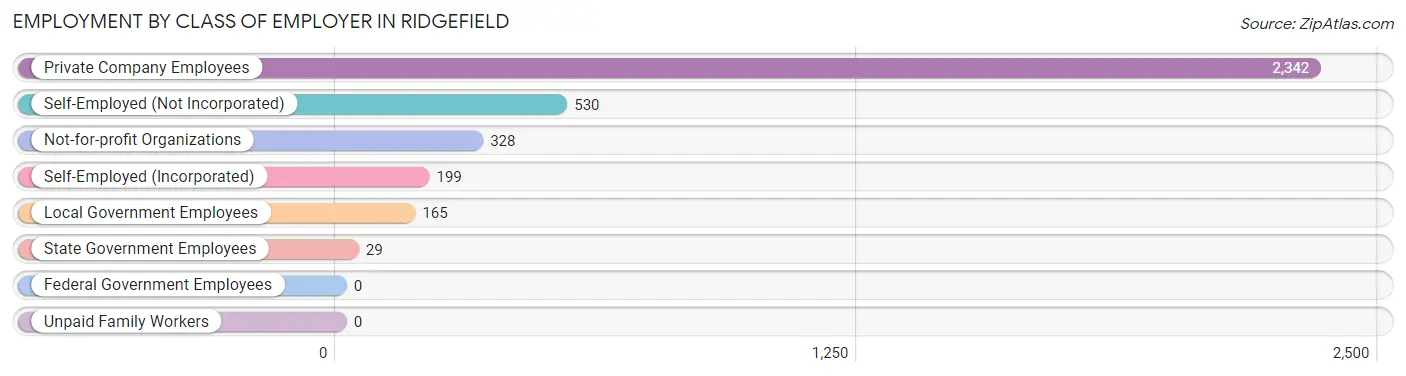
| Employer Class | # Employees | % Employees |
| Private Company Employees | 2,342 | 65.2% |
| Self-Employed (Incorporated) | 199 | 5.5% |
| Self-Employed (Not Incorporated) | 530 | 14.7% |
| Not-for-profit Organizations | 328 | 9.1% |
| Local Government Employees | 165 | 4.6% |
| State Government Employees | 29 | 0.8% |
| Federal Government Employees | 0 | 0.0% |
| Unpaid Family Workers | 0 | 0.0% |
| Total | 3,593 | 100.0% |
Employment Status by Age in Ridgefield
According to the labor force statistics for Ridgefield, out of the total population over 16 years of age (6,143), 62.9% or 3,864 individuals are in the labor force, with 5.7% or 220 of them unemployed. The age group with the highest labor force participation rate is 35 to 44 years, with 90.9% or 894 individuals in the labor force. Within the labor force, the 55 to 59 years age range has the highest percentage of unemployed individuals, with 27.6% or 108 of them being unemployed.
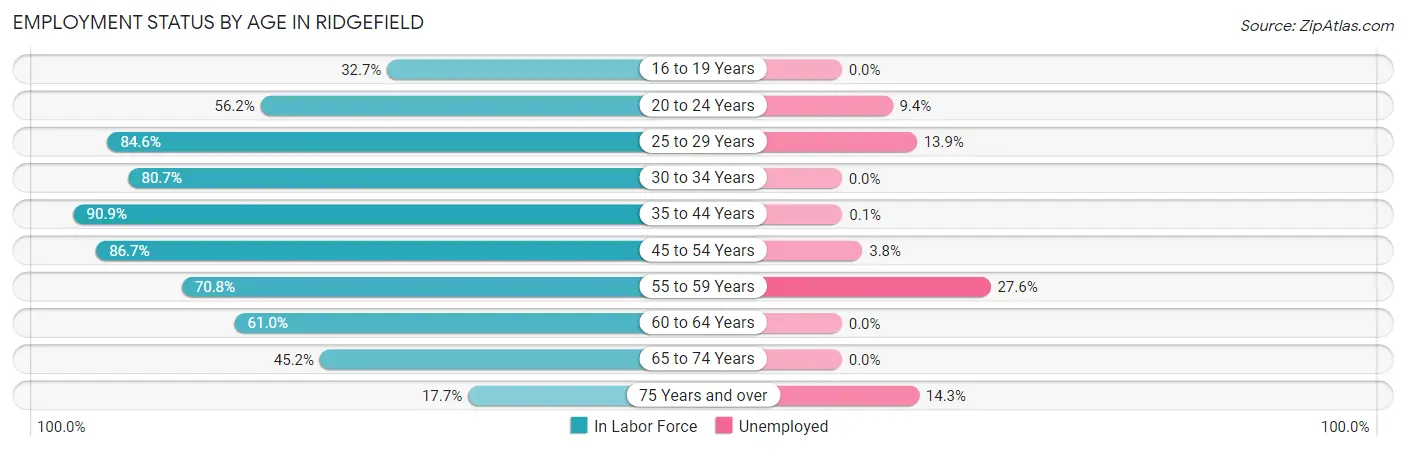
| Age Bracket | In Labor Force | Unemployed |
| 16 to 19 Years | 176 (32.7%) | 0 (0.0%) |
| 20 to 24 Years | 159 (56.2%) | 15 (9.4%) |
| 25 to 29 Years | 231 (84.6%) | 32 (13.9%) |
| 30 to 34 Years | 205 (80.7%) | 0 (0.0%) |
| 35 to 44 Years | 894 (90.9%) | 1 (0.1%) |
| 45 to 54 Years | 1,106 (86.7%) | 42 (3.8%) |
| 55 to 59 Years | 391 (70.8%) | 108 (27.6%) |
| 60 to 64 Years | 267 (61.0%) | 0 (0.0%) |
| 65 to 74 Years | 270 (45.2%) | 0 (0.0%) |
| 75 Years and over | 168 (17.7%) | 24 (14.3%) |
| Total | 3,864 (62.9%) | 220 (5.7%) |
Employment Status by Educational Attainment in Ridgefield
According to labor force statistics for Ridgefield, 81.9% of individuals (3,093) out of the total population between 25 and 64 years of age (3,776) are in the labor force, with 5.9% or 182 of them being unemployed. The group with the highest labor force participation rate are those with the educational attainment of bachelor's degree or higher, with 85.4% or 2,607 individuals in the labor force. Within the labor force, individuals with bachelor's degree or higher education have the highest percentage of unemployment, with 7.0% or 182 of them being unemployed.
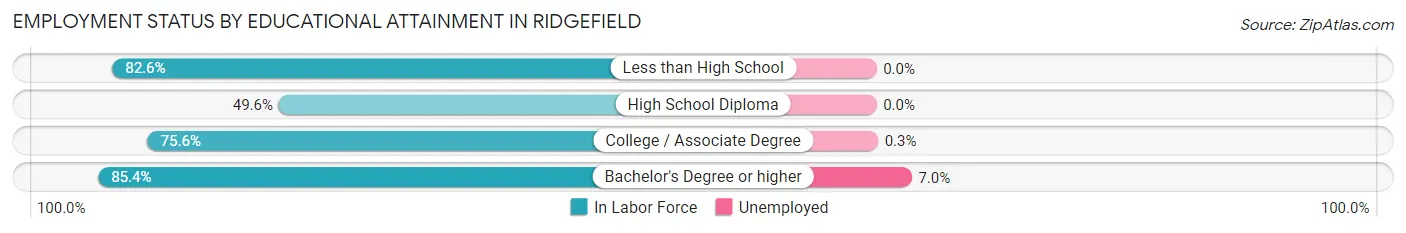
| Educational Attainment | In Labor Force | Unemployed |
| Less than High School | 19 (82.6%) | 0 (0.0%) |
| High School Diploma | 115 (49.6%) | 0 (0.0%) |
| College / Associate Degree | 354 (75.6%) | 1 (0.3%) |
| Bachelor's Degree or higher | 2,607 (85.4%) | 214 (7.0%) |
| Total | 3,093 (81.9%) | 223 (5.9%) |
Employment Occupations by Sex in Ridgefield
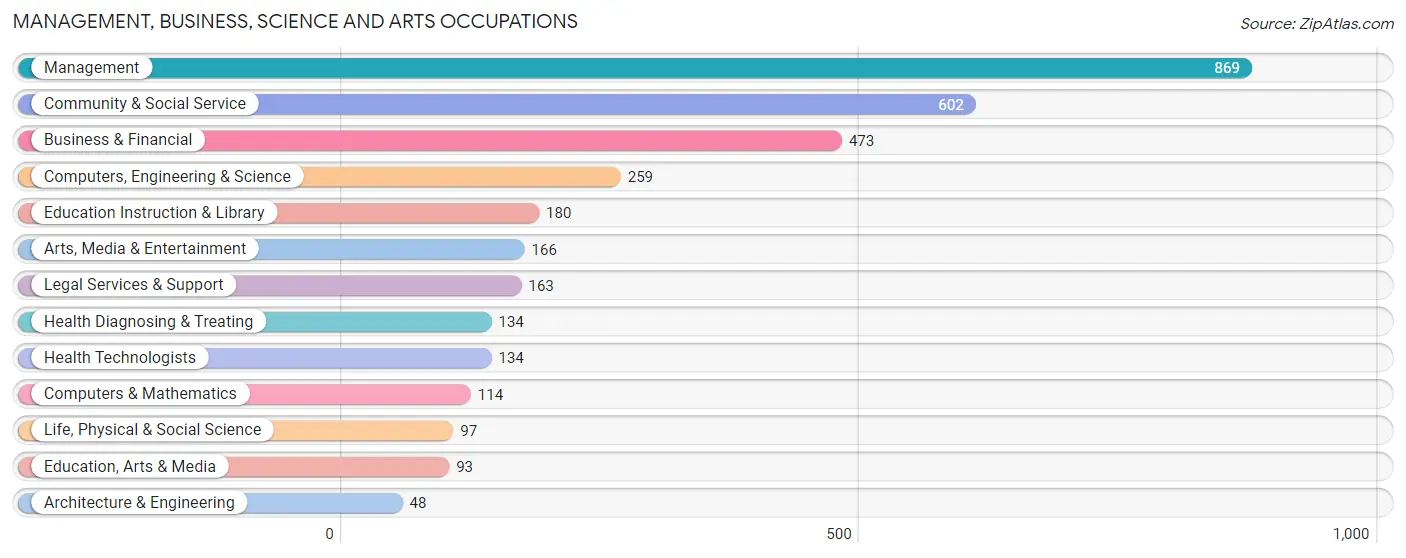
Management, Business, Science and Arts Occupations
The most common Management, Business, Science and Arts occupations in Ridgefield are Management (869 | 23.8%), Community & Social Service (602 | 16.5%), Business & Financial (473 | 13.0%), Computers, Engineering & Science (259 | 7.1%), and Education Instruction & Library (180 | 4.9%).
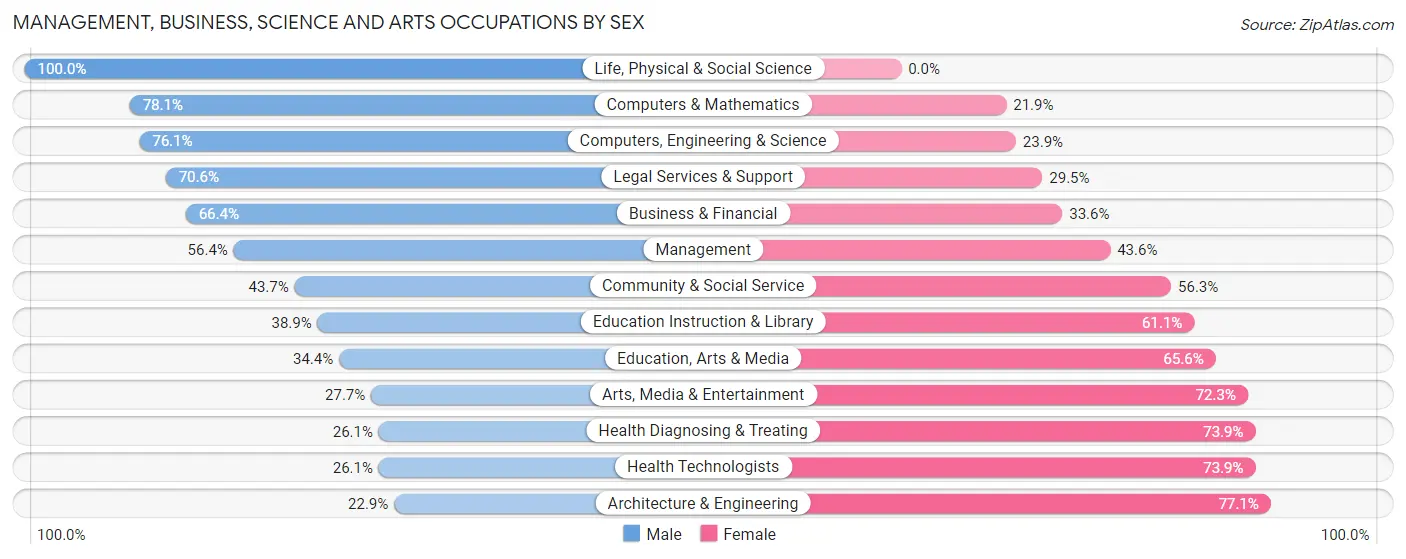
Management, Business, Science and Arts Occupations by Sex
Within the Management, Business, Science and Arts occupations in Ridgefield, the most male-oriented occupations are Life, Physical & Social Science (100.0%), Computers & Mathematics (78.1%), and Computers, Engineering & Science (76.1%), while the most female-oriented occupations are Architecture & Engineering (77.1%), Health Diagnosing & Treating (73.9%), and Health Technologists (73.9%).
| Occupation | Male | Female |
| Management | 490 (56.4%) | 379 (43.6%) |
| Business & Financial | 314 (66.4%) | 159 (33.6%) |
| Computers, Engineering & Science | 197 (76.1%) | 62 (23.9%) |
| Computers & Mathematics | 89 (78.1%) | 25 (21.9%) |
| Architecture & Engineering | 11 (22.9%) | 37 (77.1%) |
| Life, Physical & Social Science | 97 (100.0%) | 0 (0.0%) |
| Community & Social Service | 263 (43.7%) | 339 (56.3%) |
| Education, Arts & Media | 32 (34.4%) | 61 (65.6%) |
| Legal Services & Support | 115 (70.6%) | 48 (29.4%) |
| Education Instruction & Library | 70 (38.9%) | 110 (61.1%) |
| Arts, Media & Entertainment | 46 (27.7%) | 120 (72.3%) |
| Health Diagnosing & Treating | 35 (26.1%) | 99 (73.9%) |
| Health Technologists | 35 (26.1%) | 99 (73.9%) |
| Total (Category) | 1,299 (55.6%) | 1,038 (44.4%) |
| Total (Overall) | 1,951 (53.5%) | 1,694 (46.5%) |
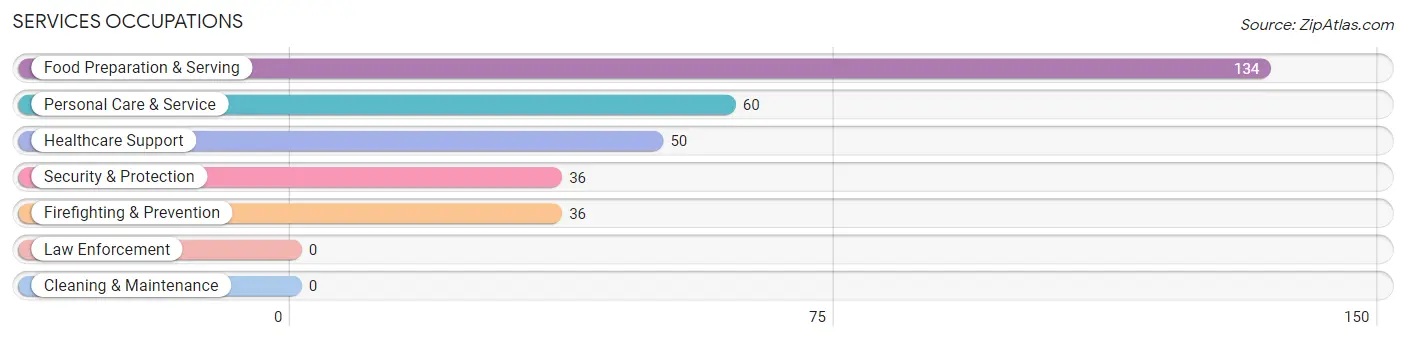
Services Occupations
The most common Services occupations in Ridgefield are Food Preparation & Serving (134 | 3.7%), Personal Care & Service (60 | 1.7%), Healthcare Support (50 | 1.4%), Security & Protection (36 | 1.0%), and Firefighting & Prevention (36 | 1.0%).
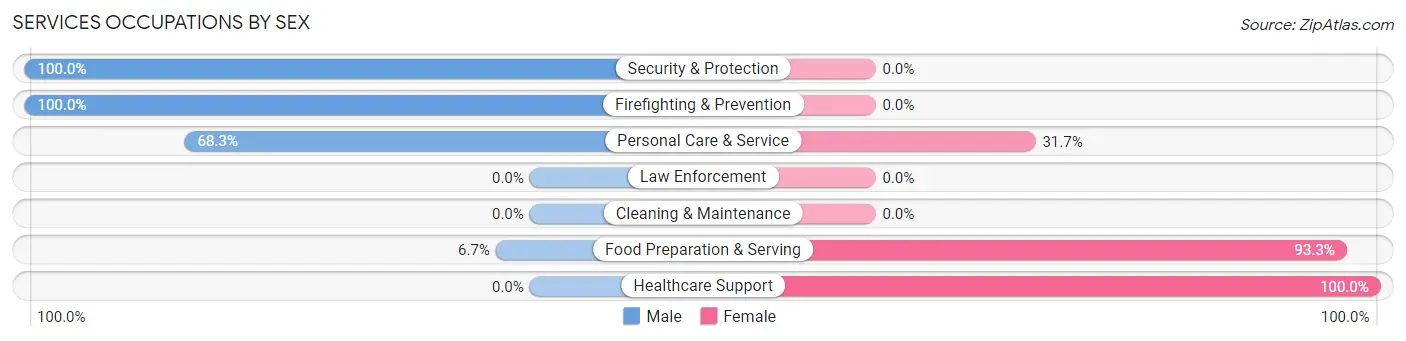
Services Occupations by Sex
Within the Services occupations in Ridgefield, the most male-oriented occupations are Security & Protection (100.0%), Firefighting & Prevention (100.0%), and Personal Care & Service (68.3%), while the most female-oriented occupations are Healthcare Support (100.0%), Food Preparation & Serving (93.3%), and Personal Care & Service (31.7%).
| Occupation | Male | Female |
| Healthcare Support | 0 (0.0%) | 50 (100.0%) |
| Security & Protection | 36 (100.0%) | 0 (0.0%) |
| Firefighting & Prevention | 36 (100.0%) | 0 (0.0%) |
| Law Enforcement | 0 (0.0%) | 0 (0.0%) |
| Food Preparation & Serving | 9 (6.7%) | 125 (93.3%) |
| Cleaning & Maintenance | 0 (0.0%) | 0 (0.0%) |
| Personal Care & Service | 41 (68.3%) | 19 (31.7%) |
| Total (Category) | 86 (30.7%) | 194 (69.3%) |
| Total (Overall) | 1,951 (53.5%) | 1,694 (46.5%) |
Sales and Office Occupations
The most common Sales and Office occupations in Ridgefield are Sales & Related (606 | 16.6%), and Office & Administration (206 | 5.7%).
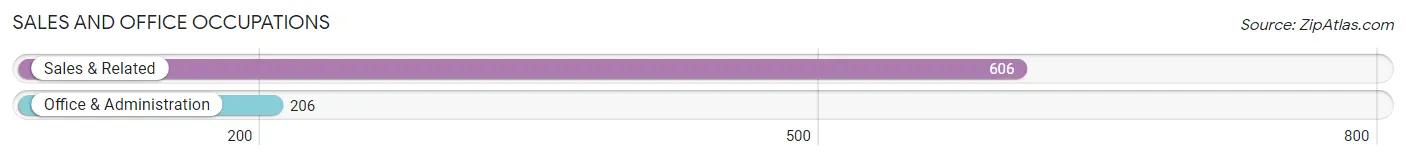
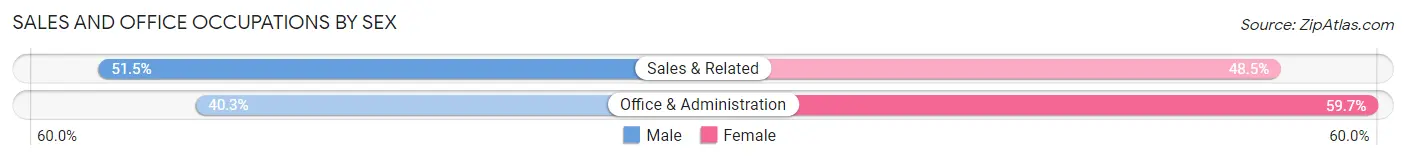
Sales and Office Occupations by Sex
| Occupation | Male | Female |
| Sales & Related | 312 (51.5%) | 294 (48.5%) |
| Office & Administration | 83 (40.3%) | 123 (59.7%) |
| Total (Category) | 395 (48.6%) | 417 (51.3%) |
| Total (Overall) | 1,951 (53.5%) | 1,694 (46.5%) |
Natural Resources, Construction and Maintenance Occupations
The most common Natural Resources, Construction and Maintenance occupations in Ridgefield are Construction & Extraction (78 | 2.1%), and Installation, Maintenance & Repair (11 | 0.3%).
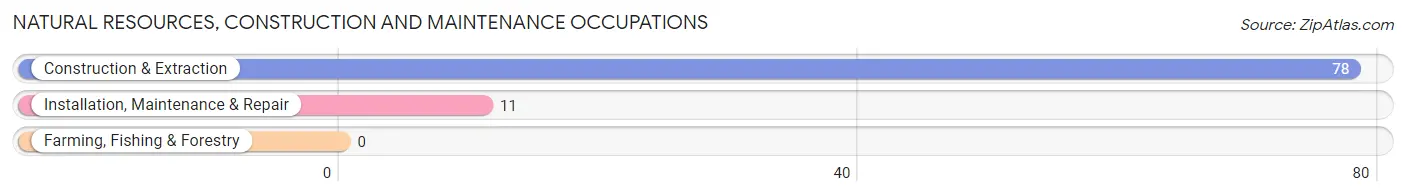
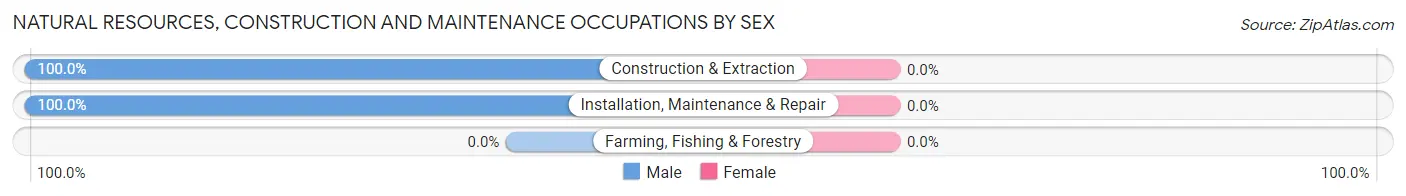
Natural Resources, Construction and Maintenance Occupations by Sex
| Occupation | Male | Female |
| Farming, Fishing & Forestry | 0 (0.0%) | 0 (0.0%) |
| Construction & Extraction | 78 (100.0%) | 0 (0.0%) |
| Installation, Maintenance & Repair | 11 (100.0%) | 0 (0.0%) |
| Total (Category) | 89 (100.0%) | 0 (0.0%) |
| Total (Overall) | 1,951 (53.5%) | 1,694 (46.5%) |
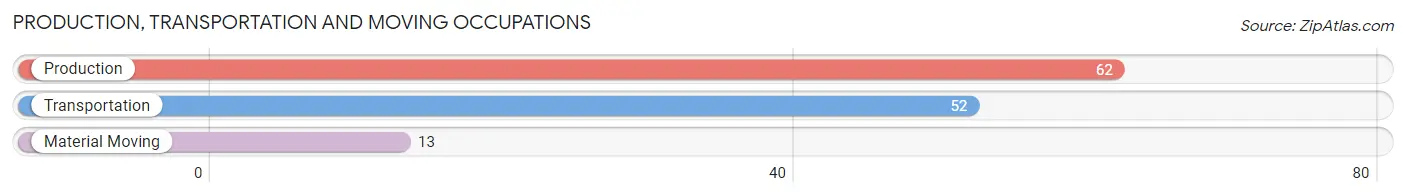
Production, Transportation and Moving Occupations
The most common Production, Transportation and Moving occupations in Ridgefield are Production (62 | 1.7%), Transportation (52 | 1.4%), and Material Moving (13 | 0.4%).
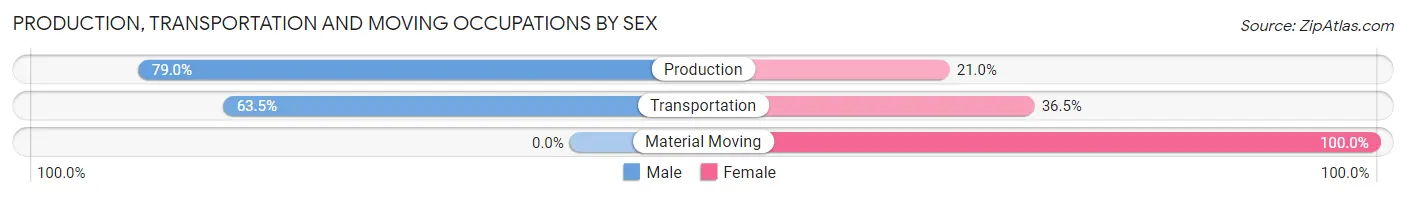
Production, Transportation and Moving Occupations by Sex
| Occupation | Male | Female |
| Production | 49 (79.0%) | 13 (21.0%) |
| Transportation | 33 (63.5%) | 19 (36.5%) |
| Material Moving | 0 (0.0%) | 13 (100.0%) |
| Total (Category) | 82 (64.6%) | 45 (35.4%) |
| Total (Overall) | 1,951 (53.5%) | 1,694 (46.5%) |
Employment Industries by Sex in Ridgefield
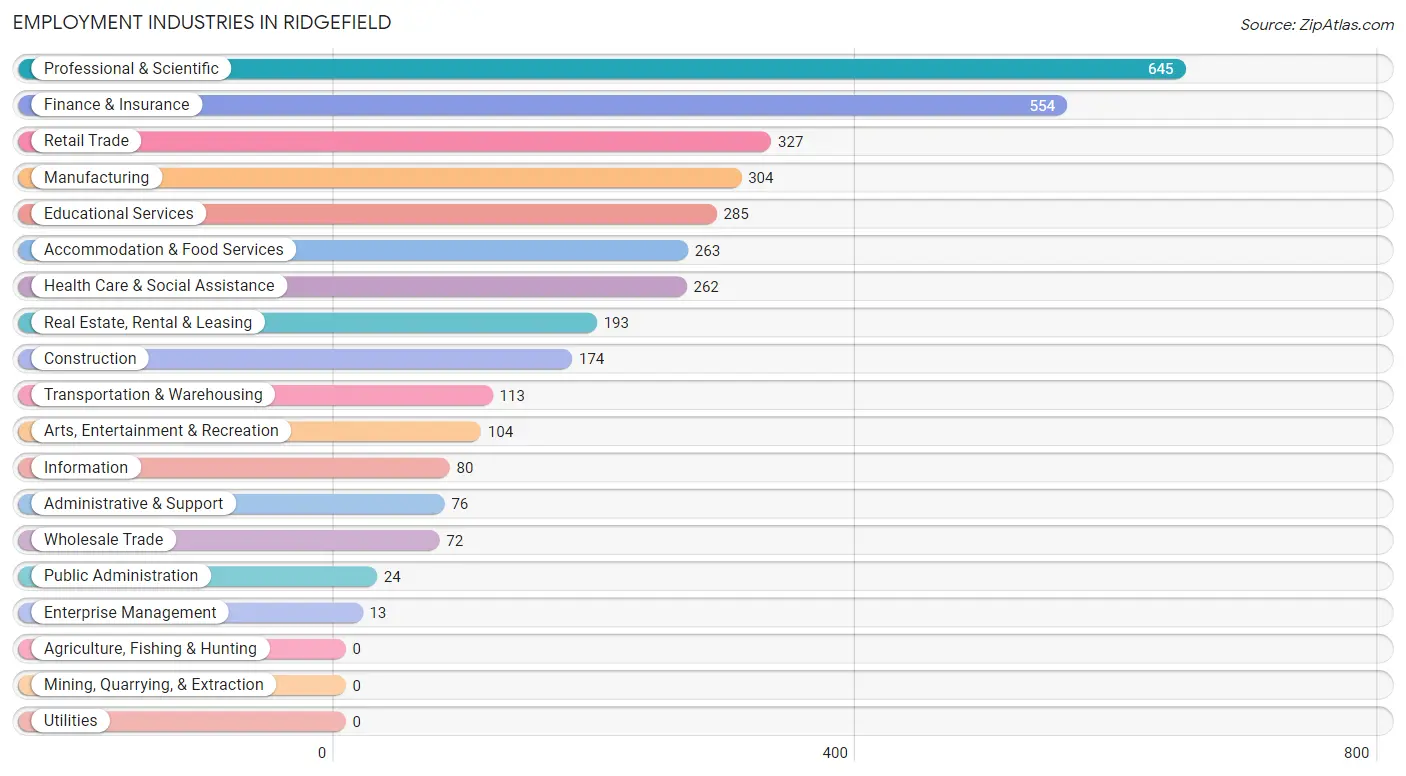
Employment Industries in Ridgefield
The major employment industries in Ridgefield include Professional & Scientific (645 | 17.7%), Finance & Insurance (554 | 15.2%), Retail Trade (327 | 9.0%), Manufacturing (304 | 8.3%), and Educational Services (285 | 7.8%).
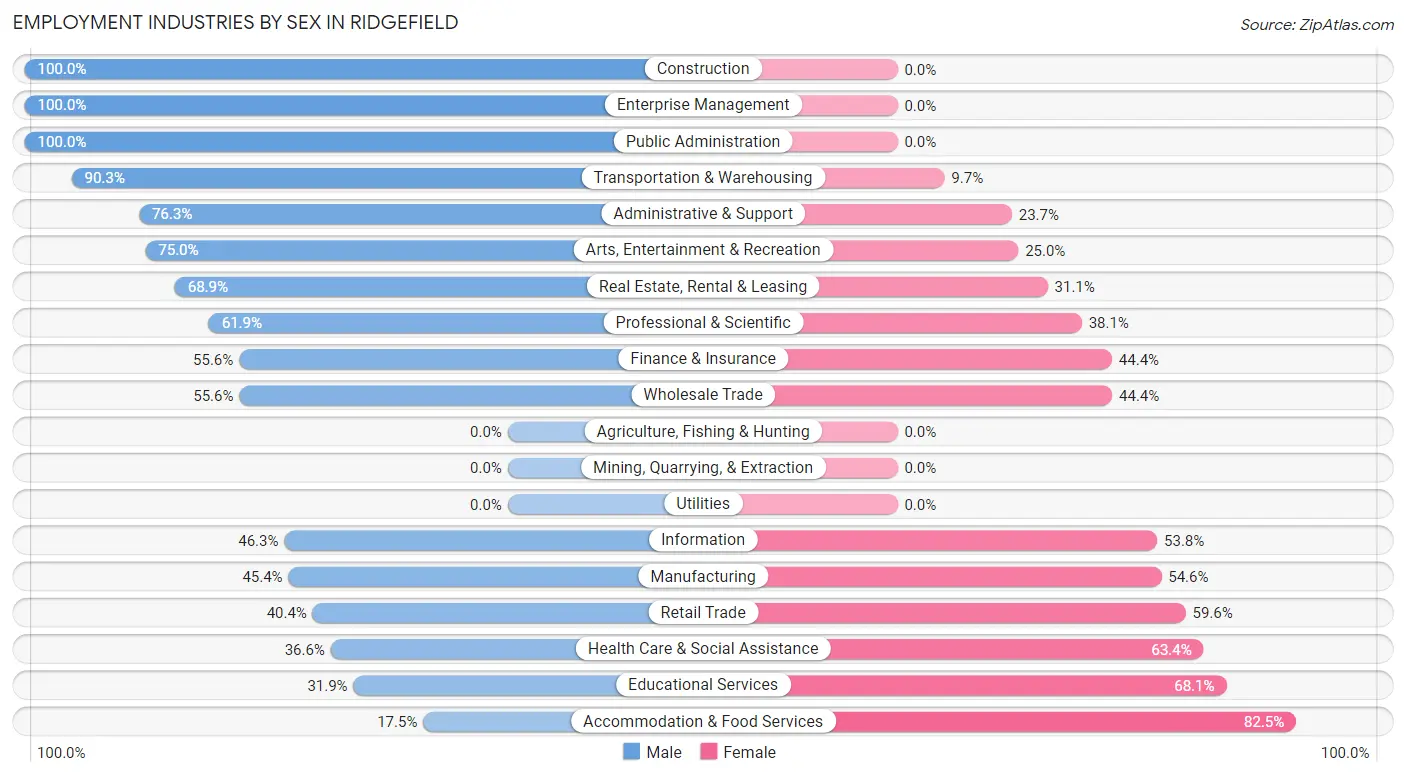
Employment Industries by Sex in Ridgefield
The Ridgefield industries that see more men than women are Construction (100.0%), Enterprise Management (100.0%), and Public Administration (100.0%), whereas the industries that tend to have a higher number of women are Accommodation & Food Services (82.5%), Educational Services (68.1%), and Health Care & Social Assistance (63.4%).
| Industry | Male | Female |
| Agriculture, Fishing & Hunting | 0 (0.0%) | 0 (0.0%) |
| Mining, Quarrying, & Extraction | 0 (0.0%) | 0 (0.0%) |
| Construction | 174 (100.0%) | 0 (0.0%) |
| Manufacturing | 138 (45.4%) | 166 (54.6%) |
| Wholesale Trade | 40 (55.6%) | 32 (44.4%) |
| Retail Trade | 132 (40.4%) | 195 (59.6%) |
| Transportation & Warehousing | 102 (90.3%) | 11 (9.7%) |
| Utilities | 0 (0.0%) | 0 (0.0%) |
| Information | 37 (46.3%) | 43 (53.7%) |
| Finance & Insurance | 308 (55.6%) | 246 (44.4%) |
| Real Estate, Rental & Leasing | 133 (68.9%) | 60 (31.1%) |
| Professional & Scientific | 399 (61.9%) | 246 (38.1%) |
| Enterprise Management | 13 (100.0%) | 0 (0.0%) |
| Administrative & Support | 58 (76.3%) | 18 (23.7%) |
| Educational Services | 91 (31.9%) | 194 (68.1%) |
| Health Care & Social Assistance | 96 (36.6%) | 166 (63.4%) |
| Arts, Entertainment & Recreation | 78 (75.0%) | 26 (25.0%) |
| Accommodation & Food Services | 46 (17.5%) | 217 (82.5%) |
| Public Administration | 24 (100.0%) | 0 (0.0%) |
| Total | 1,951 (53.5%) | 1,694 (46.5%) |
Education in Ridgefield
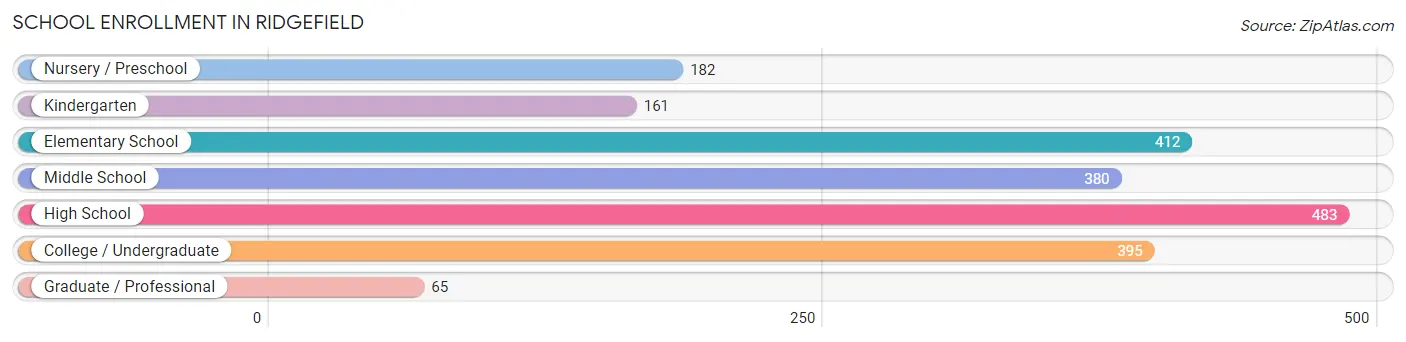
School Enrollment in Ridgefield
The most common levels of schooling among the 2,078 students in Ridgefield are high school (483 | 23.2%), elementary school (412 | 19.8%), and college / undergraduate (395 | 19.0%).
| School Level | # Students | % Students |
| Nursery / Preschool | 182 | 8.8% |
| Kindergarten | 161 | 7.7% |
| Elementary School | 412 | 19.8% |
| Middle School | 380 | 18.3% |
| High School | 483 | 23.2% |
| College / Undergraduate | 395 | 19.0% |
| Graduate / Professional | 65 | 3.1% |
| Total | 2,078 | 100.0% |
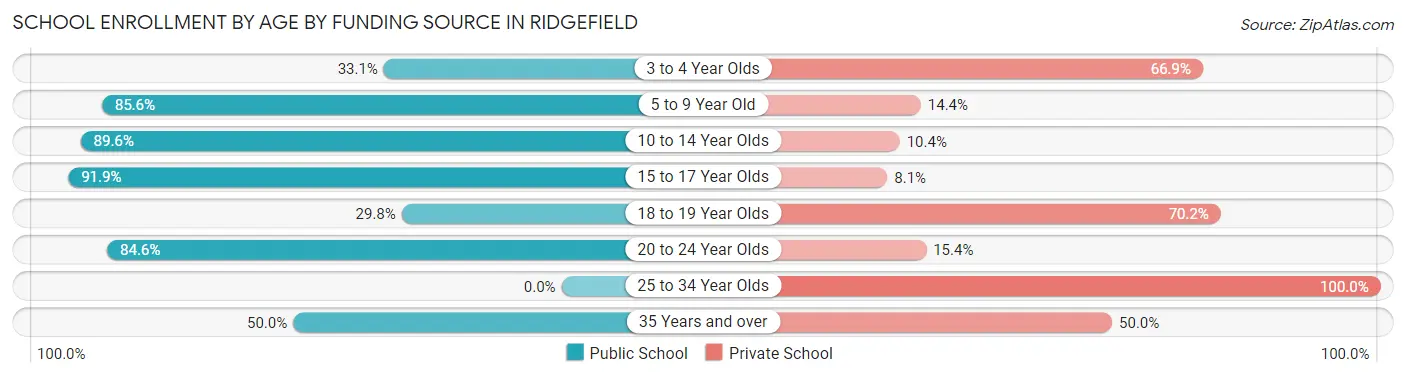
School Enrollment by Age by Funding Source in Ridgefield
Out of a total of 2,078 students who are enrolled in schools in Ridgefield, 484 (23.3%) attend a private institution, while the remaining 1,594 (76.7%) are enrolled in public schools. The age group of 25 to 34 year olds has the highest likelihood of being enrolled in private schools, with 24 (100.0% in the age bracket) enrolled. Conversely, the age group of 15 to 17 year olds has the lowest likelihood of being enrolled in a private school, with 373 (91.9% in the age bracket) attending a public institution.
| Age Bracket | Public School | Private School |
| 3 to 4 Year Olds | 50 (33.1%) | 101 (66.9%) |
| 5 to 9 Year Old | 411 (85.6%) | 69 (14.4%) |
| 10 to 14 Year Olds | 506 (89.6%) | 59 (10.4%) |
| 15 to 17 Year Olds | 373 (91.9%) | 33 (8.1%) |
| 18 to 19 Year Olds | 53 (29.8%) | 125 (70.2%) |
| 20 to 24 Year Olds | 154 (84.6%) | 28 (15.4%) |
| 25 to 34 Year Olds | 0 (0.0%) | 24 (100.0%) |
| 35 Years and over | 46 (50.0%) | 46 (50.0%) |
| Total | 1,594 (76.7%) | 484 (23.3%) |
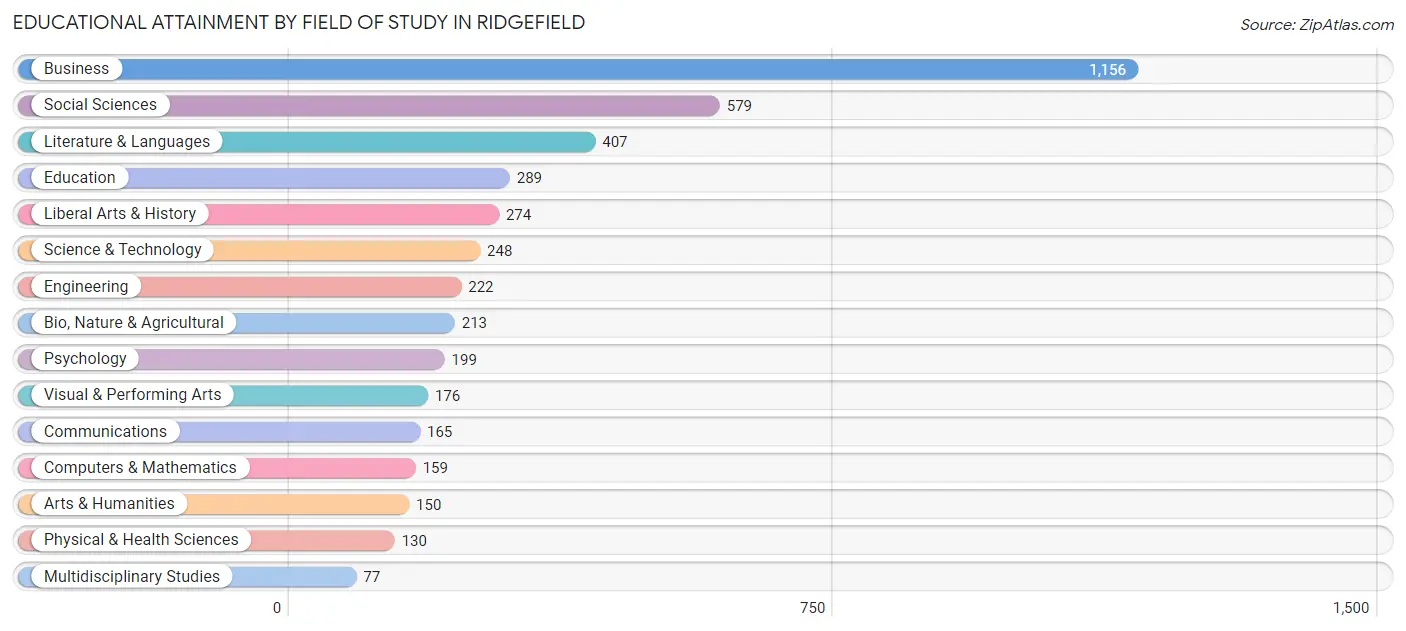
Educational Attainment by Field of Study in Ridgefield
Business (1,156 | 26.0%), social sciences (579 | 13.0%), literature & languages (407 | 9.2%), education (289 | 6.5%), and liberal arts & history (274 | 6.2%) are the most common fields of study among 4,444 individuals in Ridgefield who have obtained a bachelor's degree or higher.
| Field of Study | # Graduates | % Graduates |
| Computers & Mathematics | 159 | 3.6% |
| Bio, Nature & Agricultural | 213 | 4.8% |
| Physical & Health Sciences | 130 | 2.9% |
| Psychology | 199 | 4.5% |
| Social Sciences | 579 | 13.0% |
| Engineering | 222 | 5.0% |
| Multidisciplinary Studies | 77 | 1.7% |
| Science & Technology | 248 | 5.6% |
| Business | 1,156 | 26.0% |
| Education | 289 | 6.5% |
| Literature & Languages | 407 | 9.2% |
| Liberal Arts & History | 274 | 6.2% |
| Visual & Performing Arts | 176 | 4.0% |
| Communications | 165 | 3.7% |
| Arts & Humanities | 150 | 3.4% |
| Total | 4,444 | 100.0% |
Transportation & Commute in Ridgefield
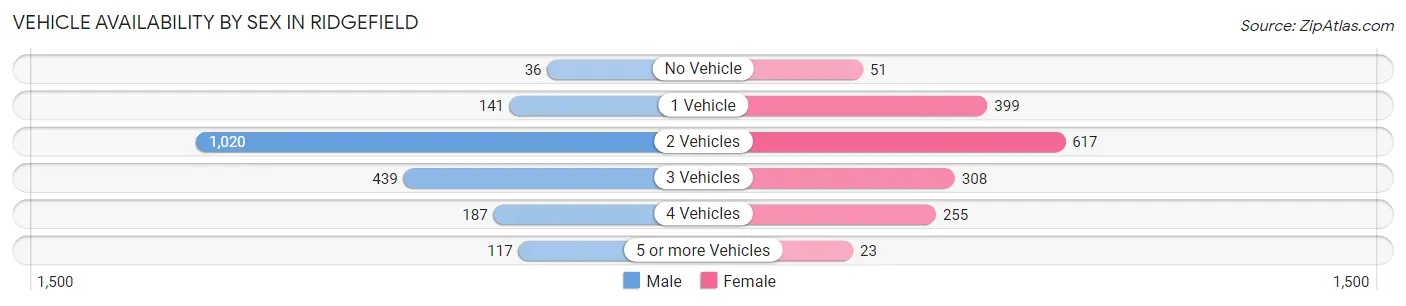
Vehicle Availability by Sex in Ridgefield
The most prevalent vehicle ownership categories in Ridgefield are males with 2 vehicles (1,020, accounting for 52.6%) and females with 2 vehicles (617, making up 61.7%).
| Vehicles Available | Male | Female |
| No Vehicle | 36 (1.9%) | 51 (3.1%) |
| 1 Vehicle | 141 (7.3%) | 399 (24.1%) |
| 2 Vehicles | 1,020 (52.6%) | 617 (37.3%) |
| 3 Vehicles | 439 (22.6%) | 308 (18.6%) |
| 4 Vehicles | 187 (9.6%) | 255 (15.4%) |
| 5 or more Vehicles | 117 (6.0%) | 23 (1.4%) |
| Total | 1,940 (100.0%) | 1,653 (100.0%) |
Commute Time in Ridgefield
The most frequently occuring commute durations in Ridgefield are 45 to 59 minutes (409 commuters, 15.1%), 30 to 34 minutes (379 commuters, 14.0%), and 5 to 9 minutes (278 commuters, 10.2%).
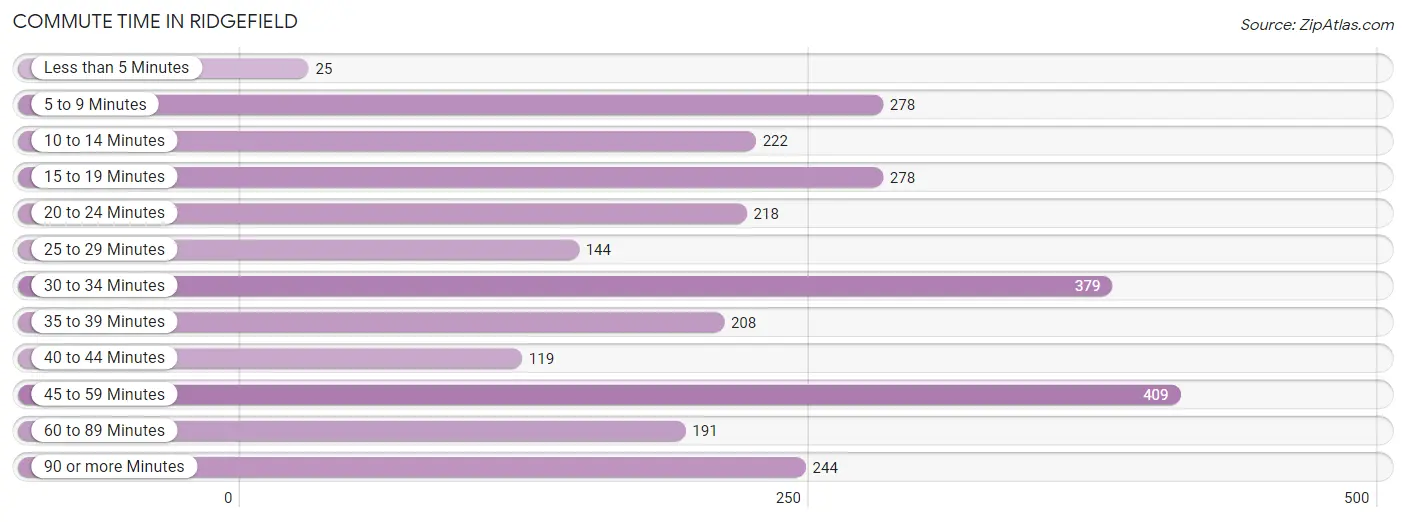
| Commute Time | # Commuters | % Commuters |
| Less than 5 Minutes | 25 | 0.9% |
| 5 to 9 Minutes | 278 | 10.2% |
| 10 to 14 Minutes | 222 | 8.2% |
| 15 to 19 Minutes | 278 | 10.2% |
| 20 to 24 Minutes | 218 | 8.0% |
| 25 to 29 Minutes | 144 | 5.3% |
| 30 to 34 Minutes | 379 | 14.0% |
| 35 to 39 Minutes | 208 | 7.7% |
| 40 to 44 Minutes | 119 | 4.4% |
| 45 to 59 Minutes | 409 | 15.1% |
| 60 to 89 Minutes | 191 | 7.0% |
| 90 or more Minutes | 244 | 9.0% |
Commute Time by Sex in Ridgefield
The most common commute times in Ridgefield are 30 to 34 minutes (294 commuters, 19.9%) for males and 5 to 9 minutes (216 commuters, 17.5%) for females.
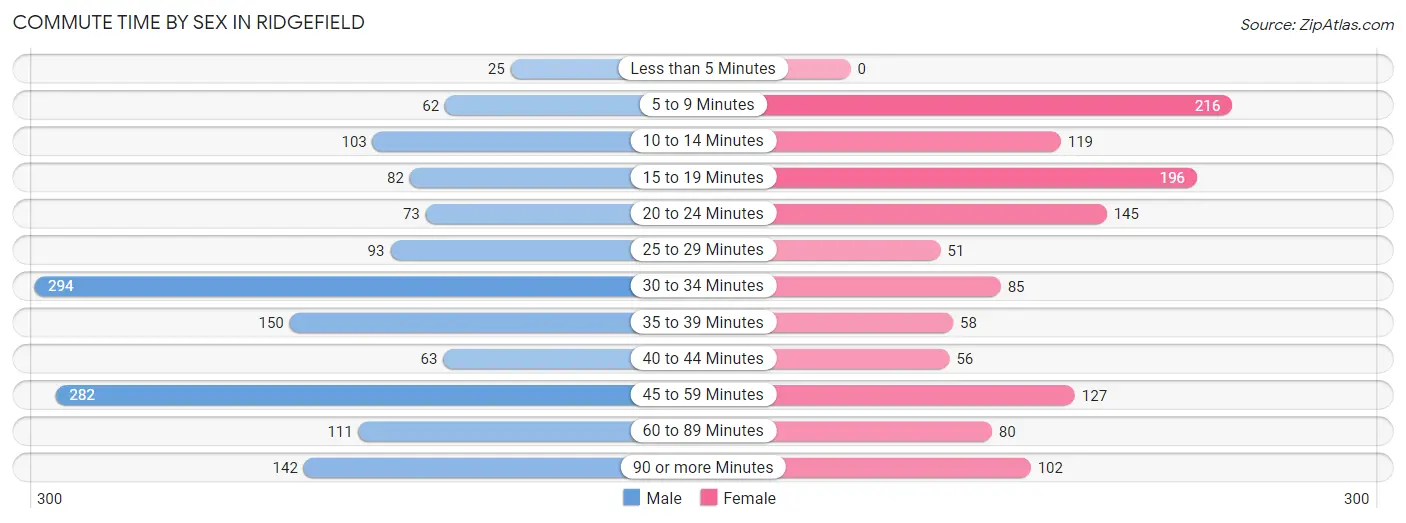
| Commute Time | Male | Female |
| Less than 5 Minutes | 25 (1.7%) | 0 (0.0%) |
| 5 to 9 Minutes | 62 (4.2%) | 216 (17.5%) |
| 10 to 14 Minutes | 103 (7.0%) | 119 (9.6%) |
| 15 to 19 Minutes | 82 (5.5%) | 196 (15.9%) |
| 20 to 24 Minutes | 73 (4.9%) | 145 (11.7%) |
| 25 to 29 Minutes | 93 (6.3%) | 51 (4.1%) |
| 30 to 34 Minutes | 294 (19.9%) | 85 (6.9%) |
| 35 to 39 Minutes | 150 (10.1%) | 58 (4.7%) |
| 40 to 44 Minutes | 63 (4.3%) | 56 (4.5%) |
| 45 to 59 Minutes | 282 (19.1%) | 127 (10.3%) |
| 60 to 89 Minutes | 111 (7.5%) | 80 (6.5%) |
| 90 or more Minutes | 142 (9.6%) | 102 (8.3%) |
Time of Departure to Work by Sex in Ridgefield
The most frequent times of departure to work in Ridgefield are 7:00 AM to 7:29 AM (432, 29.2%) for males and 8:00 AM to 8:29 AM (259, 21.0%) for females.
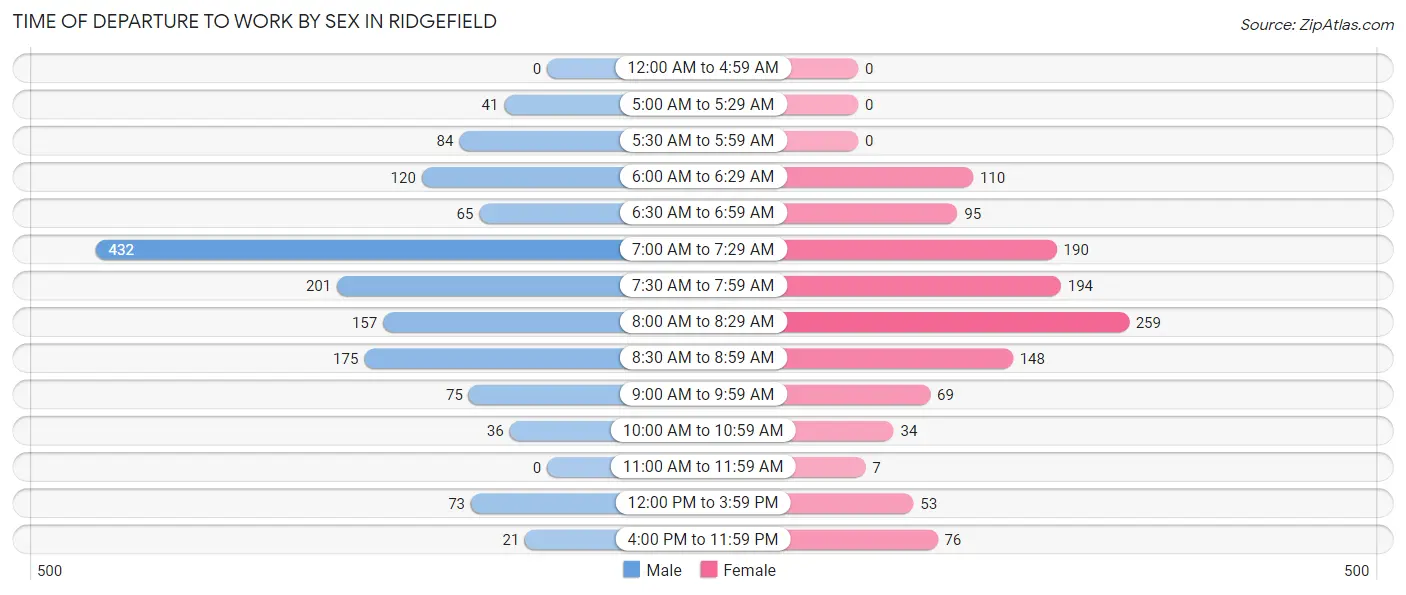
| Time of Departure | Male | Female |
| 12:00 AM to 4:59 AM | 0 (0.0%) | 0 (0.0%) |
| 5:00 AM to 5:29 AM | 41 (2.8%) | 0 (0.0%) |
| 5:30 AM to 5:59 AM | 84 (5.7%) | 0 (0.0%) |
| 6:00 AM to 6:29 AM | 120 (8.1%) | 110 (8.9%) |
| 6:30 AM to 6:59 AM | 65 (4.4%) | 95 (7.7%) |
| 7:00 AM to 7:29 AM | 432 (29.2%) | 190 (15.4%) |
| 7:30 AM to 7:59 AM | 201 (13.6%) | 194 (15.7%) |
| 8:00 AM to 8:29 AM | 157 (10.6%) | 259 (21.0%) |
| 8:30 AM to 8:59 AM | 175 (11.8%) | 148 (12.0%) |
| 9:00 AM to 9:59 AM | 75 (5.1%) | 69 (5.6%) |
| 10:00 AM to 10:59 AM | 36 (2.4%) | 34 (2.8%) |
| 11:00 AM to 11:59 AM | 0 (0.0%) | 7 (0.6%) |
| 12:00 PM to 3:59 PM | 73 (4.9%) | 53 (4.3%) |
| 4:00 PM to 11:59 PM | 21 (1.4%) | 76 (6.1%) |
| Total | 1,480 (100.0%) | 1,235 (100.0%) |
Housing Occupancy in Ridgefield
Occupancy by Ownership in Ridgefield
Of the total 2,980 dwellings in Ridgefield, owner-occupied units account for 2,296 (77.0%), while renter-occupied units make up 684 (23.0%).
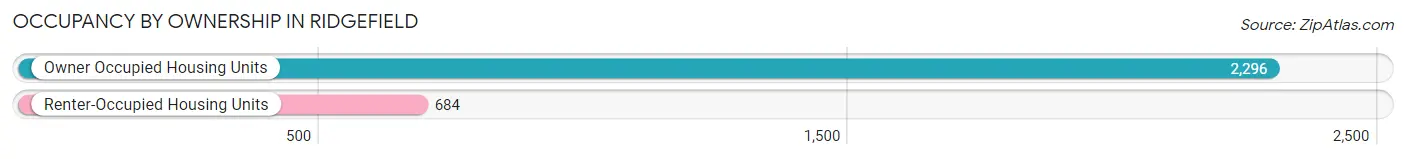
| Occupancy | # Housing Units | % Housing Units |
| Owner Occupied Housing Units | 2,296 | 77.0% |
| Renter-Occupied Housing Units | 684 | 23.0% |
| Total Occupied Housing Units | 2,980 | 100.0% |
Occupancy by Household Size in Ridgefield
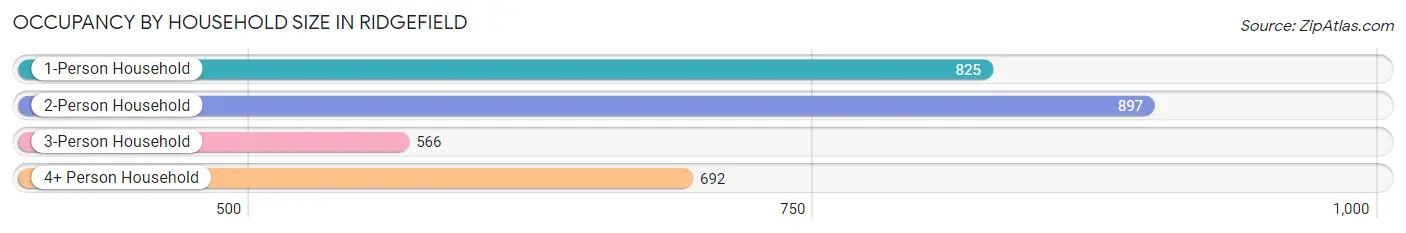
| Household Size | # Housing Units | % Housing Units |
| 1-Person Household | 825 | 27.7% |
| 2-Person Household | 897 | 30.1% |
| 3-Person Household | 566 | 19.0% |
| 4+ Person Household | 692 | 23.2% |
| Total Housing Units | 2,980 | 100.0% |
Occupancy by Ownership by Household Size in Ridgefield
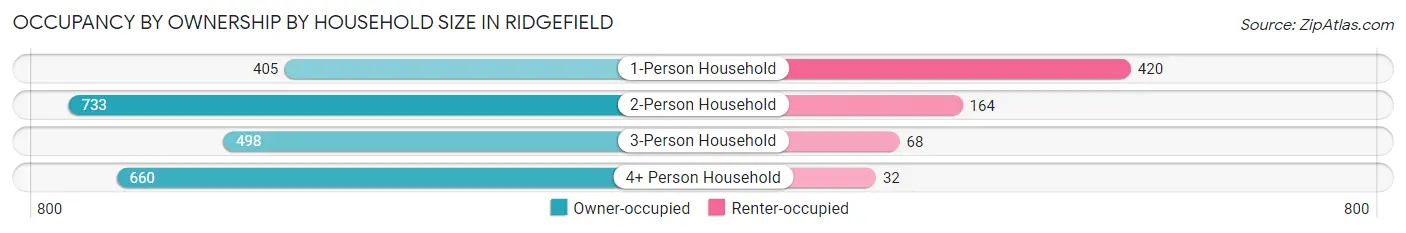
| Household Size | Owner-occupied | Renter-occupied |
| 1-Person Household | 405 (49.1%) | 420 (50.9%) |
| 2-Person Household | 733 (81.7%) | 164 (18.3%) |
| 3-Person Household | 498 (88.0%) | 68 (12.0%) |
| 4+ Person Household | 660 (95.4%) | 32 (4.6%) |
| Total Housing Units | 2,296 (77.0%) | 684 (23.0%) |
Occupancy by Educational Attainment in Ridgefield
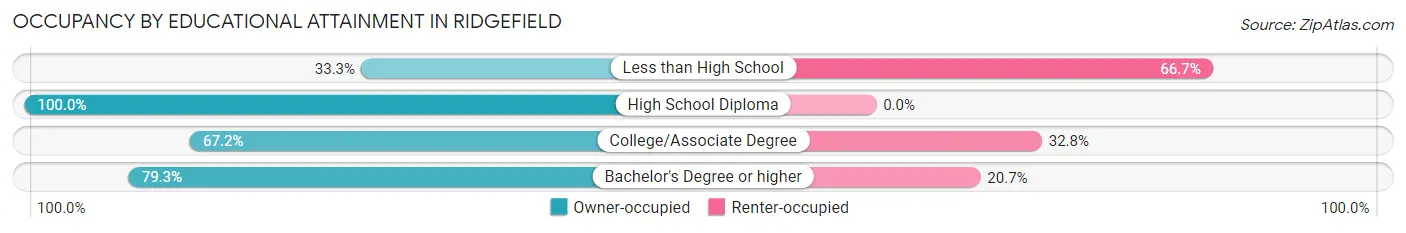
| Household Size | Owner-occupied | Renter-occupied |
| Less than High School | 27 (33.3%) | 54 (66.7%) |
| High School Diploma | 122 (100.0%) | 0 (0.0%) |
| College/Associate Degree | 309 (67.2%) | 151 (32.8%) |
| Bachelor's Degree or higher | 1,838 (79.3%) | 479 (20.7%) |
Occupancy by Age of Householder in Ridgefield
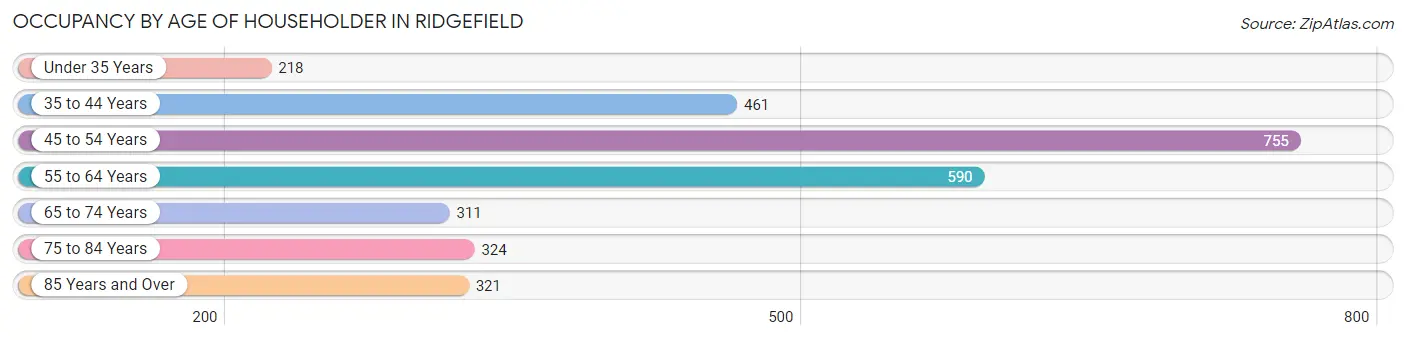
| Age Bracket | # Households | % Households |
| Under 35 Years | 218 | 7.3% |
| 35 to 44 Years | 461 | 15.5% |
| 45 to 54 Years | 755 | 25.3% |
| 55 to 64 Years | 590 | 19.8% |
| 65 to 74 Years | 311 | 10.4% |
| 75 to 84 Years | 324 | 10.9% |
| 85 Years and Over | 321 | 10.8% |
| Total | 2,980 | 100.0% |
Housing Finances in Ridgefield
Median Income by Occupancy in Ridgefield
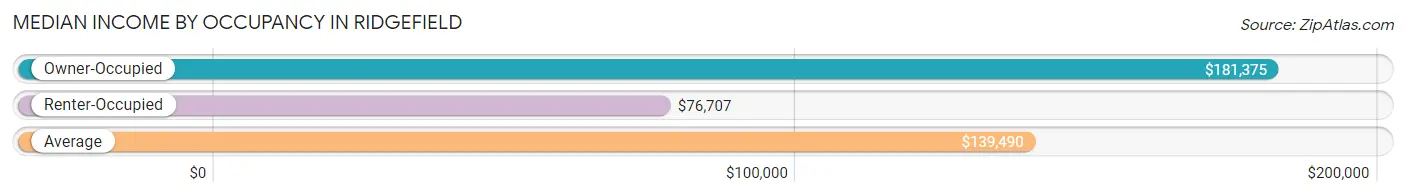
| Occupancy Type | # Households | Median Income |
| Owner-Occupied | 2,296 (77.0%) | $181,375 |
| Renter-Occupied | 684 (23.0%) | $76,707 |
| Average | 2,980 (100.0%) | $139,490 |
Occupancy by Householder Income Bracket in Ridgefield
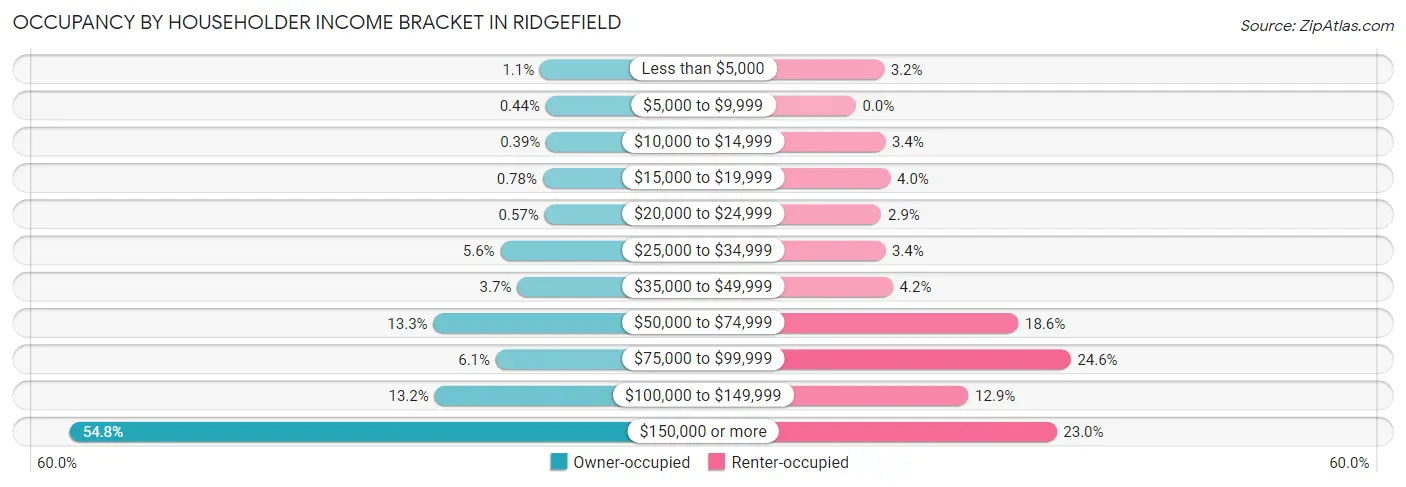
| Income Bracket | Owner-occupied | Renter-occupied |
| Less than $5,000 | 25 (1.1%) | 22 (3.2%) |
| $5,000 to $9,999 | 10 (0.4%) | 0 (0.0%) |
| $10,000 to $14,999 | 9 (0.4%) | 23 (3.4%) |
| $15,000 to $19,999 | 18 (0.8%) | 27 (4.0%) |
| $20,000 to $24,999 | 13 (0.6%) | 20 (2.9%) |
| $25,000 to $34,999 | 129 (5.6%) | 23 (3.4%) |
| $35,000 to $49,999 | 85 (3.7%) | 29 (4.2%) |
| $50,000 to $74,999 | 305 (13.3%) | 127 (18.6%) |
| $75,000 to $99,999 | 141 (6.1%) | 168 (24.6%) |
| $100,000 to $149,999 | 302 (13.2%) | 88 (12.9%) |
| $150,000 or more | 1,259 (54.8%) | 157 (23.0%) |
| Total | 2,296 (100.0%) | 684 (100.0%) |
Monthly Housing Cost Tiers in Ridgefield
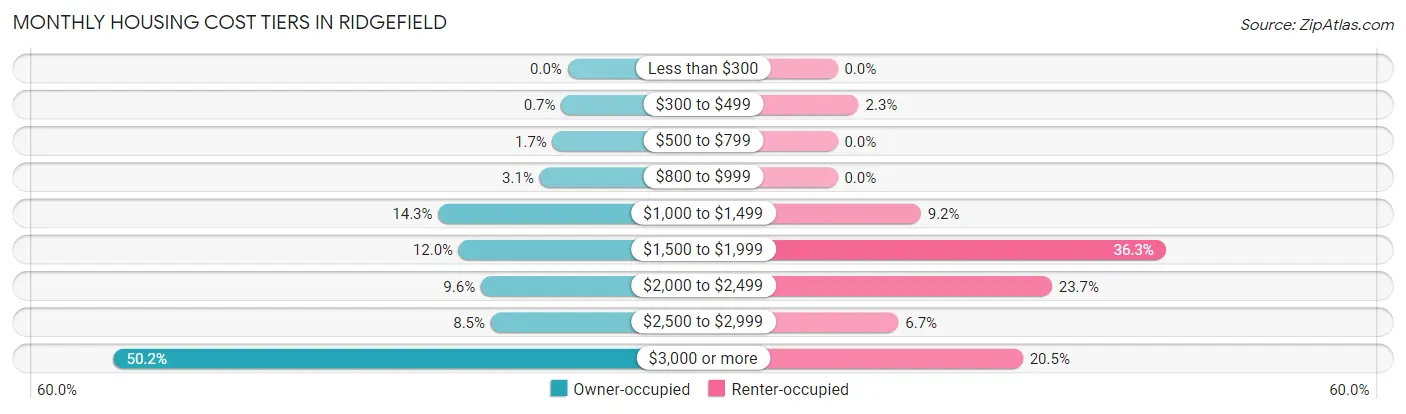
| Monthly Cost | Owner-occupied | Renter-occupied |
| Less than $300 | 0 (0.0%) | 0 (0.0%) |
| $300 to $499 | 16 (0.7%) | 16 (2.3%) |
| $500 to $799 | 38 (1.7%) | 0 (0.0%) |
| $800 to $999 | 71 (3.1%) | 0 (0.0%) |
| $1,000 to $1,499 | 328 (14.3%) | 63 (9.2%) |
| $1,500 to $1,999 | 276 (12.0%) | 248 (36.3%) |
| $2,000 to $2,499 | 220 (9.6%) | 162 (23.7%) |
| $2,500 to $2,999 | 195 (8.5%) | 46 (6.7%) |
| $3,000 or more | 1,152 (50.2%) | 140 (20.5%) |
| Total | 2,296 (100.0%) | 684 (100.0%) |
Physical Housing Characteristics in Ridgefield
Housing Structures in Ridgefield
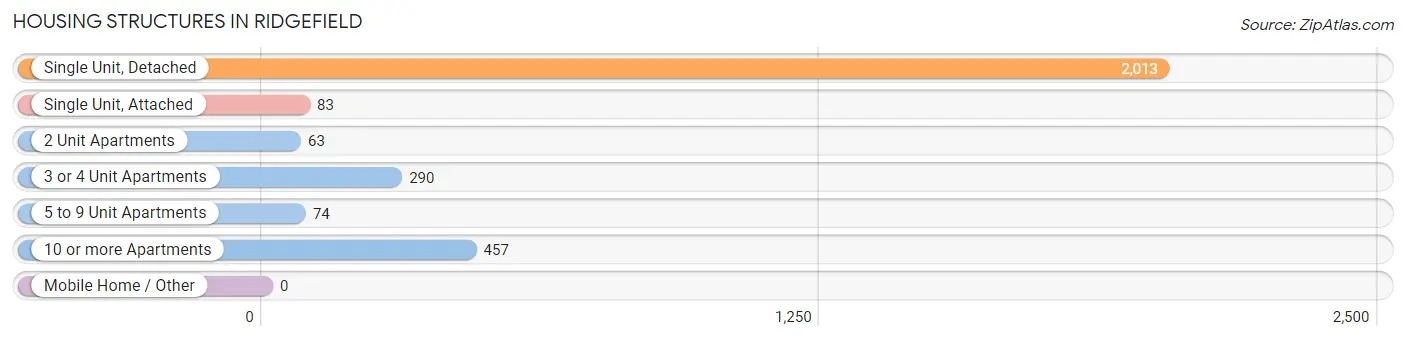
| Structure Type | # Housing Units | % Housing Units |
| Single Unit, Detached | 2,013 | 67.5% |
| Single Unit, Attached | 83 | 2.8% |
| 2 Unit Apartments | 63 | 2.1% |
| 3 or 4 Unit Apartments | 290 | 9.7% |
| 5 to 9 Unit Apartments | 74 | 2.5% |
| 10 or more Apartments | 457 | 15.3% |
| Mobile Home / Other | 0 | 0.0% |
| Total | 2,980 | 100.0% |
Housing Structures by Occupancy in Ridgefield
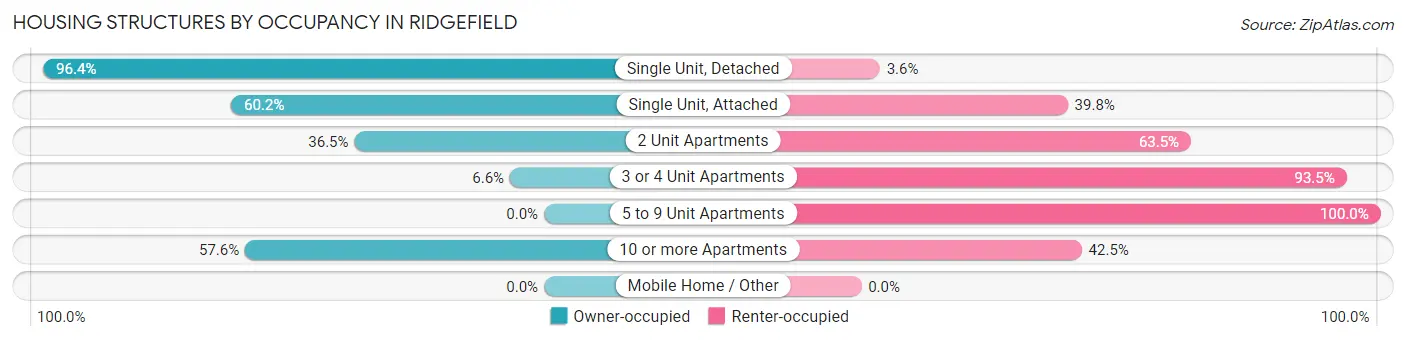
| Structure Type | Owner-occupied | Renter-occupied |
| Single Unit, Detached | 1,941 (96.4%) | 72 (3.6%) |
| Single Unit, Attached | 50 (60.2%) | 33 (39.8%) |
| 2 Unit Apartments | 23 (36.5%) | 40 (63.5%) |
| 3 or 4 Unit Apartments | 19 (6.6%) | 271 (93.4%) |
| 5 to 9 Unit Apartments | 0 (0.0%) | 74 (100.0%) |
| 10 or more Apartments | 263 (57.6%) | 194 (42.4%) |
| Mobile Home / Other | 0 (0.0%) | 0 (0.0%) |
| Total | 2,296 (77.0%) | 684 (23.0%) |
Housing Structures by Number of Rooms in Ridgefield

| Number of Rooms | Owner-occupied | Renter-occupied |
| 1 Room | 0 (0.0%) | 52 (7.6%) |
| 2 or 3 Rooms | 37 (1.6%) | 288 (42.1%) |
| 4 or 5 Rooms | 289 (12.6%) | 159 (23.3%) |
| 6 or 7 Rooms | 670 (29.2%) | 136 (19.9%) |
| 8 or more Rooms | 1,300 (56.6%) | 49 (7.2%) |
| Total | 2,296 (100.0%) | 684 (100.0%) |
Housing Structure by Heating Type in Ridgefield
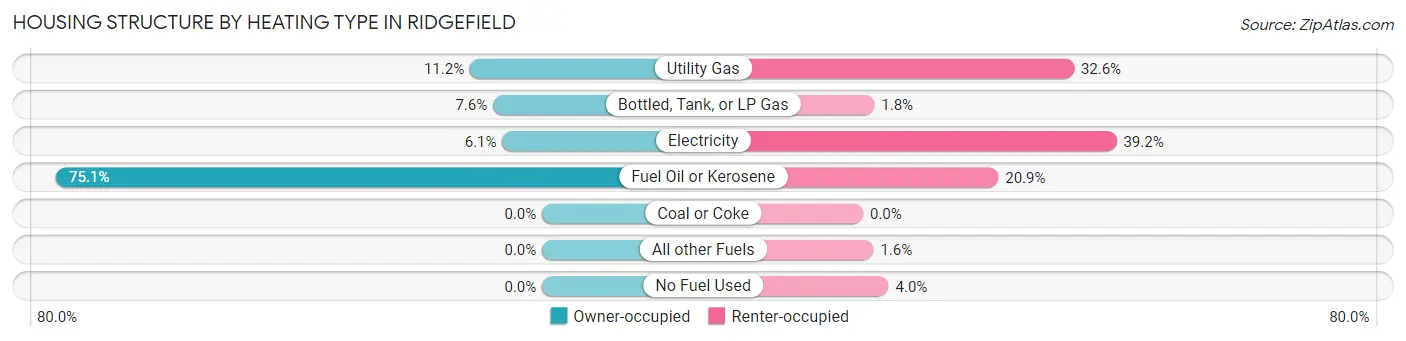
| Heating Type | Owner-occupied | Renter-occupied |
| Utility Gas | 256 (11.2%) | 223 (32.6%) |
| Bottled, Tank, or LP Gas | 174 (7.6%) | 12 (1.8%) |
| Electricity | 141 (6.1%) | 268 (39.2%) |
| Fuel Oil or Kerosene | 1,725 (75.1%) | 143 (20.9%) |
| Coal or Coke | 0 (0.0%) | 0 (0.0%) |
| All other Fuels | 0 (0.0%) | 11 (1.6%) |
| No Fuel Used | 0 (0.0%) | 27 (4.0%) |
| Total | 2,296 (100.0%) | 684 (100.0%) |
Household Vehicle Usage in Ridgefield
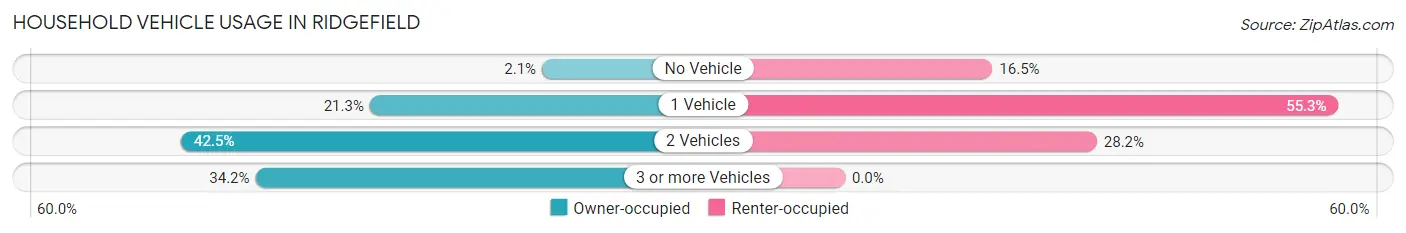
| Vehicles per Household | Owner-occupied | Renter-occupied |
| No Vehicle | 47 (2.1%) | 113 (16.5%) |
| 1 Vehicle | 490 (21.3%) | 378 (55.3%) |
| 2 Vehicles | 975 (42.5%) | 193 (28.2%) |
| 3 or more Vehicles | 784 (34.2%) | 0 (0.0%) |
| Total | 2,296 (100.0%) | 684 (100.0%) |
Real Estate & Mortgages in Ridgefield
Real Estate and Mortgage Overview in Ridgefield
| Characteristic | Without Mortgage | With Mortgage |
| Housing Units | 918 | 1,378 |
| Median Property Value | $714,000 | $841,200 |
| Median Household Income | $136,563 | $894 |
| Monthly Housing Costs | $1,501 | $1,050 |
| Real Estate Taxes | $10,001 | $0 |
Property Value by Mortgage Status in Ridgefield
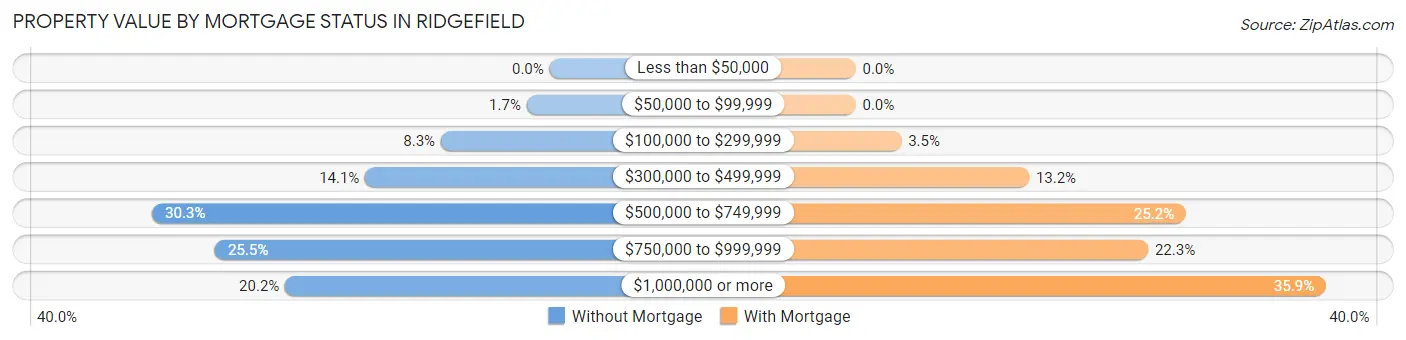
| Property Value | Without Mortgage | With Mortgage |
| Less than $50,000 | 0 (0.0%) | 0 (0.0%) |
| $50,000 to $99,999 | 16 (1.7%) | 0 (0.0%) |
| $100,000 to $299,999 | 76 (8.3%) | 48 (3.5%) |
| $300,000 to $499,999 | 129 (14.1%) | 182 (13.2%) |
| $500,000 to $749,999 | 278 (30.3%) | 347 (25.2%) |
| $750,000 to $999,999 | 234 (25.5%) | 307 (22.3%) |
| $1,000,000 or more | 185 (20.2%) | 494 (35.8%) |
| Total | 918 (100.0%) | 1,378 (100.0%) |
Household Income by Mortgage Status in Ridgefield
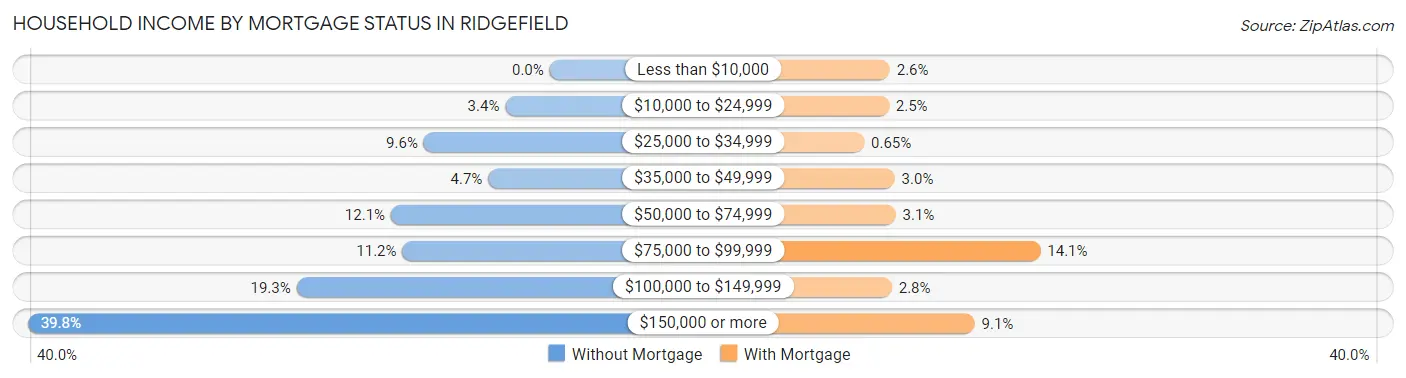
| Household Income | Without Mortgage | With Mortgage |
| Less than $10,000 | 0 (0.0%) | 36 (2.6%) |
| $10,000 to $24,999 | 31 (3.4%) | 35 (2.5%) |
| $25,000 to $34,999 | 88 (9.6%) | 9 (0.6%) |
| $35,000 to $49,999 | 43 (4.7%) | 41 (3.0%) |
| $50,000 to $74,999 | 111 (12.1%) | 42 (3.0%) |
| $75,000 to $99,999 | 103 (11.2%) | 194 (14.1%) |
| $100,000 to $149,999 | 177 (19.3%) | 38 (2.8%) |
| $150,000 or more | 365 (39.8%) | 125 (9.1%) |
| Total | 918 (100.0%) | 1,378 (100.0%) |
Property Value to Household Income Ratio in Ridgefield
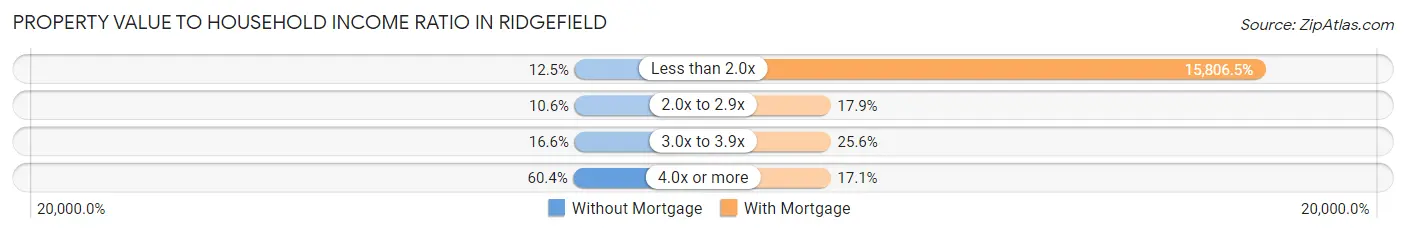
| Value-to-Income Ratio | Without Mortgage | With Mortgage |
| Less than 2.0x | 115 (12.5%) | 217,813 (15,806.5%) |
| 2.0x to 2.9x | 97 (10.6%) | 246 (17.8%) |
| 3.0x to 3.9x | 152 (16.6%) | 353 (25.6%) |
| 4.0x or more | 554 (60.4%) | 236 (17.1%) |
| Total | 918 (100.0%) | 1,378 (100.0%) |
Real Estate Taxes by Mortgage Status in Ridgefield
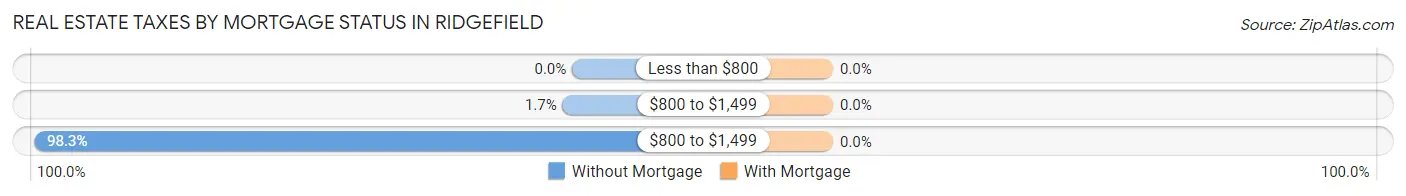
| Property Taxes | Without Mortgage | With Mortgage |
| Less than $800 | 0 (0.0%) | 0 (0.0%) |
| $800 to $1,499 | 16 (1.7%) | 0 (0.0%) |
| $800 to $1,499 | 902 (98.3%) | 0 (0.0%) |
| Total | 918 (100.0%) | 1,378 (100.0%) |
Health & Disability in Ridgefield
Health Insurance Coverage by Age in Ridgefield
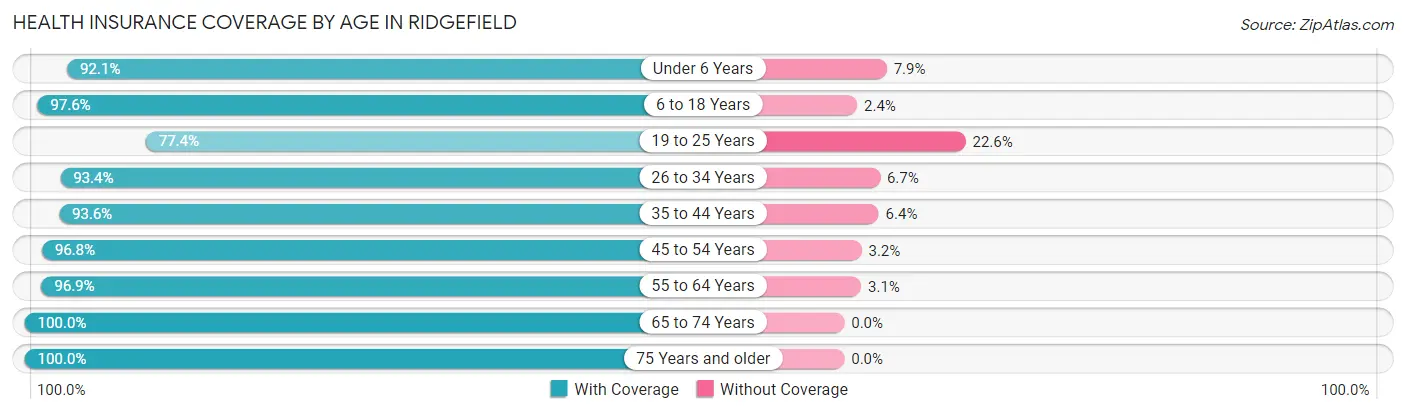
| Age Bracket | With Coverage | Without Coverage |
| Under 6 Years | 466 (92.1%) | 40 (7.9%) |
| 6 to 18 Years | 1,350 (97.6%) | 33 (2.4%) |
| 19 to 25 Years | 380 (77.4%) | 111 (22.6%) |
| 26 to 34 Years | 449 (93.3%) | 32 (6.7%) |
| 35 to 44 Years | 920 (93.6%) | 63 (6.4%) |
| 45 to 54 Years | 1,235 (96.8%) | 41 (3.2%) |
| 55 to 64 Years | 959 (96.9%) | 31 (3.1%) |
| 65 to 74 Years | 597 (100.0%) | 0 (0.0%) |
| 75 Years and older | 948 (100.0%) | 0 (0.0%) |
| Total | 7,304 (95.4%) | 351 (4.6%) |
Health Insurance Coverage by Citizenship Status in Ridgefield
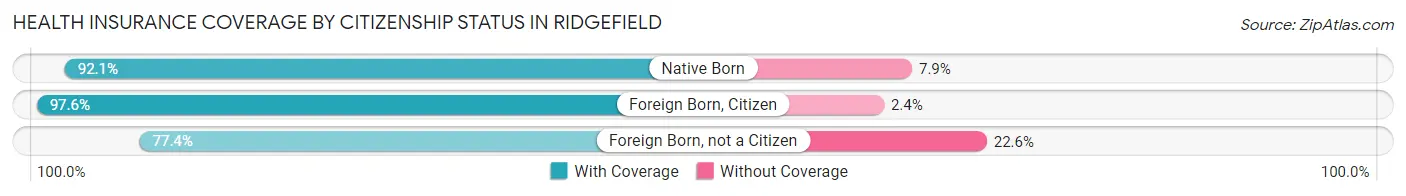
| Citizenship Status | With Coverage | Without Coverage |
| Native Born | 466 (92.1%) | 40 (7.9%) |
| Foreign Born, Citizen | 1,350 (97.6%) | 33 (2.4%) |
| Foreign Born, not a Citizen | 380 (77.4%) | 111 (22.6%) |
Health Insurance Coverage by Household Income in Ridgefield
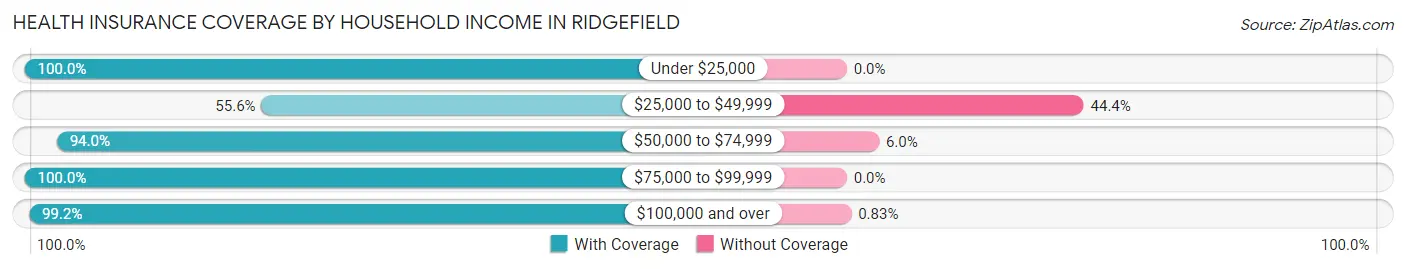
| Household Income | With Coverage | Without Coverage |
| Under $25,000 | 208 (100.0%) | 0 (0.0%) |
| $25,000 to $49,999 | 321 (55.6%) | 256 (44.4%) |
| $50,000 to $74,999 | 764 (94.0%) | 49 (6.0%) |
| $75,000 to $99,999 | 528 (100.0%) | 0 (0.0%) |
| $100,000 and over | 5,477 (99.2%) | 46 (0.8%) |
Public vs Private Health Insurance Coverage by Age in Ridgefield
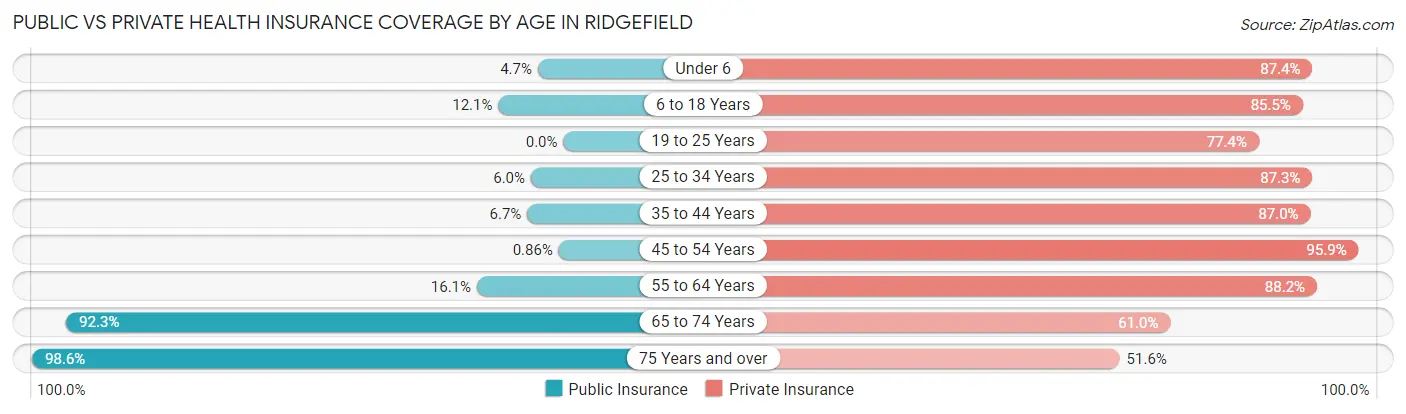
| Age Bracket | Public Insurance | Private Insurance |
| Under 6 | 24 (4.7%) | 442 (87.4%) |
| 6 to 18 Years | 167 (12.1%) | 1,183 (85.5%) |
| 19 to 25 Years | 0 (0.0%) | 380 (77.4%) |
| 25 to 34 Years | 29 (6.0%) | 420 (87.3%) |
| 35 to 44 Years | 66 (6.7%) | 855 (87.0%) |
| 45 to 54 Years | 11 (0.9%) | 1,224 (95.9%) |
| 55 to 64 Years | 159 (16.1%) | 873 (88.2%) |
| 65 to 74 Years | 551 (92.3%) | 364 (61.0%) |
| 75 Years and over | 935 (98.6%) | 489 (51.6%) |
| Total | 1,942 (25.4%) | 6,230 (81.4%) |
Disability Status by Sex by Age in Ridgefield
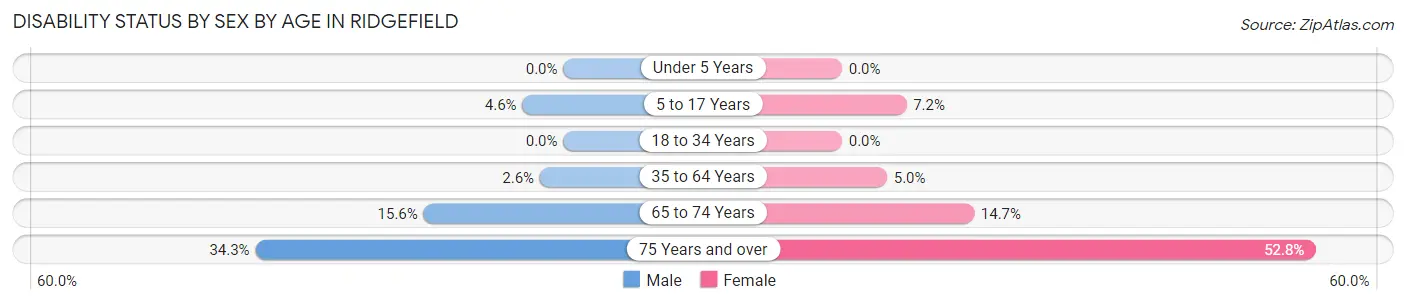
| Age Bracket | Male | Female |
| Under 5 Years | 0 (0.0%) | 0 (0.0%) |
| 5 to 17 Years | 35 (4.6%) | 49 (7.2%) |
| 18 to 34 Years | 0 (0.0%) | 0 (0.0%) |
| 35 to 64 Years | 40 (2.6%) | 86 (5.0%) |
| 65 to 74 Years | 40 (15.6%) | 50 (14.7%) |
| 75 Years and over | 131 (34.3%) | 299 (52.8%) |
Disability Class by Sex by Age in Ridgefield
Disability Class: Hearing Difficulty
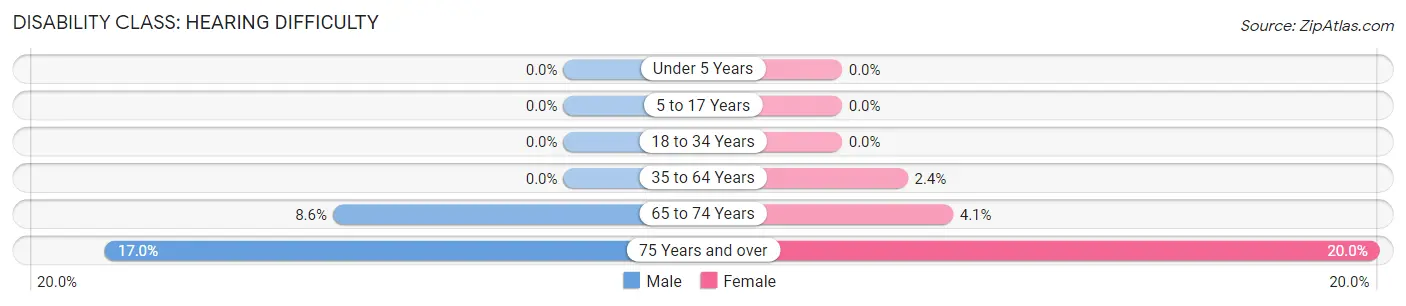
| Age Bracket | Male | Female |
| Under 5 Years | 0 (0.0%) | 0 (0.0%) |
| 5 to 17 Years | 0 (0.0%) | 0 (0.0%) |
| 18 to 34 Years | 0 (0.0%) | 0 (0.0%) |
| 35 to 64 Years | 0 (0.0%) | 42 (2.4%) |
| 65 to 74 Years | 22 (8.6%) | 14 (4.1%) |
| 75 Years and over | 65 (17.0%) | 113 (20.0%) |
Disability Class: Vision Difficulty
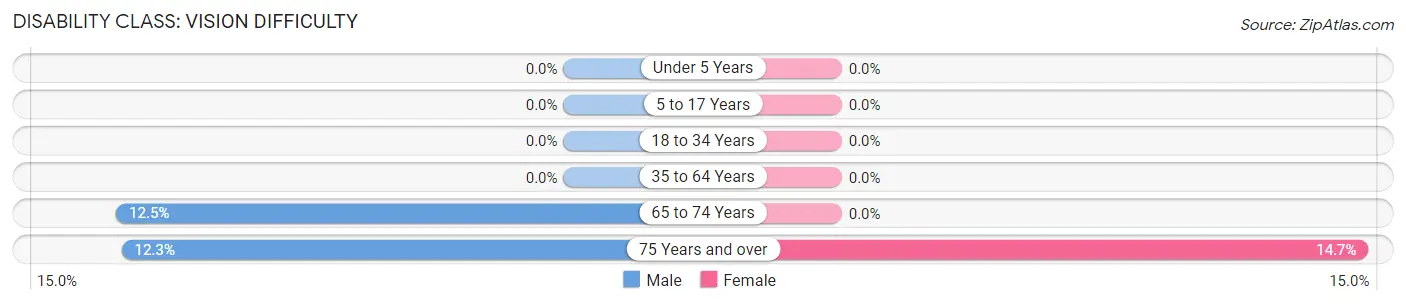
| Age Bracket | Male | Female |
| Under 5 Years | 0 (0.0%) | 0 (0.0%) |
| 5 to 17 Years | 0 (0.0%) | 0 (0.0%) |
| 18 to 34 Years | 0 (0.0%) | 0 (0.0%) |
| 35 to 64 Years | 0 (0.0%) | 0 (0.0%) |
| 65 to 74 Years | 32 (12.4%) | 0 (0.0%) |
| 75 Years and over | 47 (12.3%) | 83 (14.7%) |
Disability Class: Cognitive Difficulty
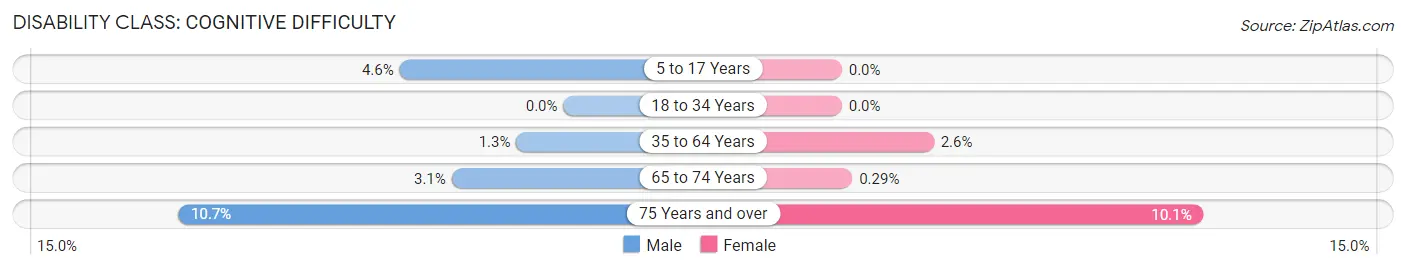
| Age Bracket | Male | Female |
| 5 to 17 Years | 35 (4.6%) | 0 (0.0%) |
| 18 to 34 Years | 0 (0.0%) | 0 (0.0%) |
| 35 to 64 Years | 20 (1.3%) | 44 (2.6%) |
| 65 to 74 Years | 8 (3.1%) | 1 (0.3%) |
| 75 Years and over | 41 (10.7%) | 57 (10.1%) |
Disability Class: Ambulatory Difficulty
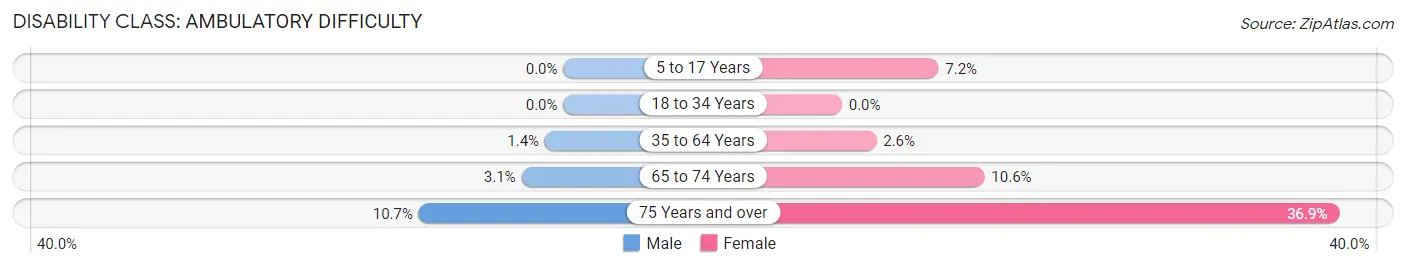
| Age Bracket | Male | Female |
| 5 to 17 Years | 0 (0.0%) | 49 (7.2%) |
| 18 to 34 Years | 0 (0.0%) | 0 (0.0%) |
| 35 to 64 Years | 21 (1.4%) | 44 (2.6%) |
| 65 to 74 Years | 8 (3.1%) | 36 (10.6%) |
| 75 Years and over | 41 (10.7%) | 209 (36.9%) |
Disability Class: Self-Care Difficulty
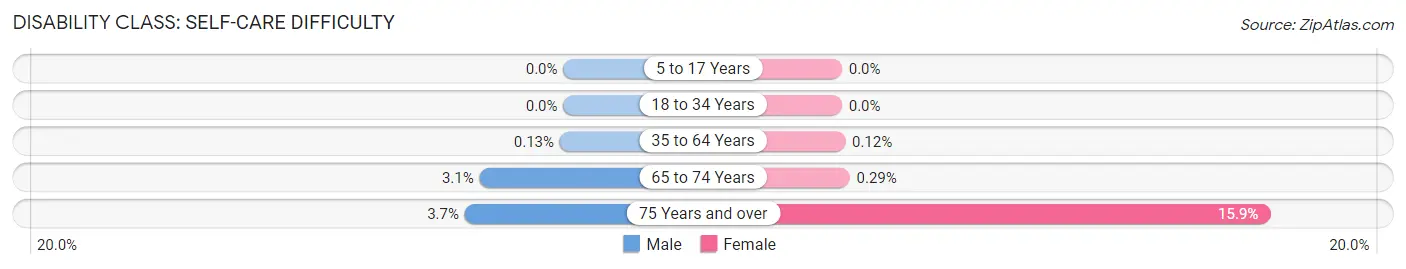
| Age Bracket | Male | Female |
| 5 to 17 Years | 0 (0.0%) | 0 (0.0%) |
| 18 to 34 Years | 0 (0.0%) | 0 (0.0%) |
| 35 to 64 Years | 2 (0.1%) | 2 (0.1%) |
| 65 to 74 Years | 8 (3.1%) | 1 (0.3%) |
| 75 Years and over | 14 (3.7%) | 90 (15.9%) |
Technology Access in Ridgefield
Computing Device Access in Ridgefield
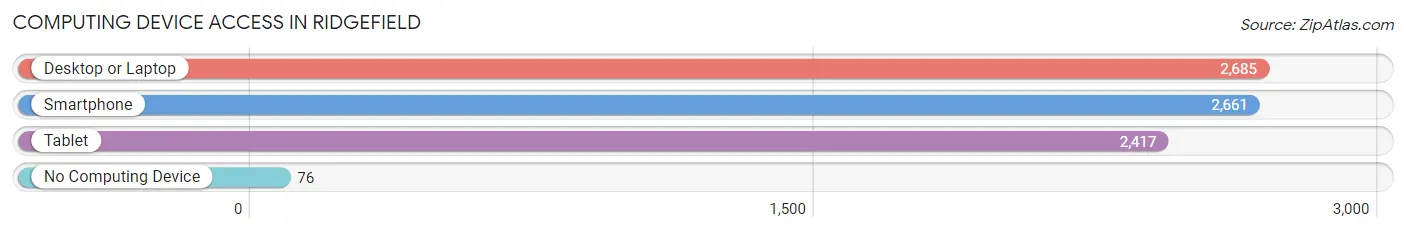
| Device Type | # Households | % Households |
| Desktop or Laptop | 2,685 | 90.1% |
| Smartphone | 2,661 | 89.3% |
| Tablet | 2,417 | 81.1% |
| No Computing Device | 76 | 2.5% |
| Total | 2,980 | 100.0% |
Internet Access in Ridgefield
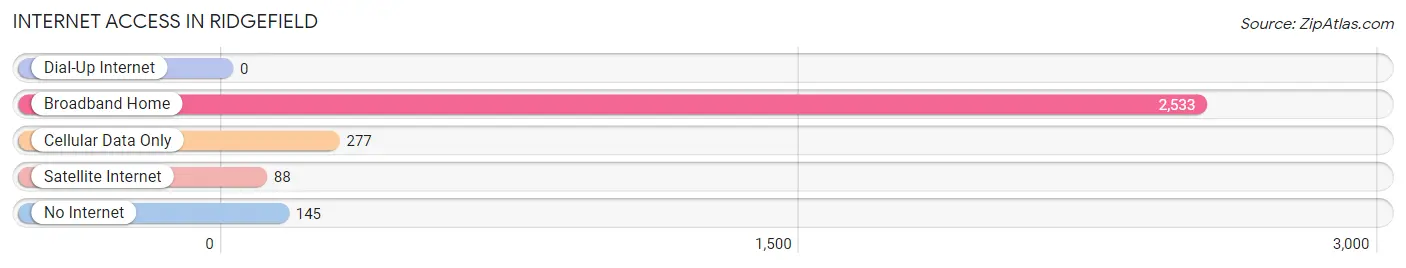
| Internet Type | # Households | % Households |
| Dial-Up Internet | 0 | 0.0% |
| Broadband Home | 2,533 | 85.0% |
| Cellular Data Only | 277 | 9.3% |
| Satellite Internet | 88 | 2.9% |
| No Internet | 145 | 4.9% |
| Total | 2,980 | 100.0% |
Ridgefield Summary
Ridgefield is a town located in Fairfield County, Connecticut, United States. It is situated in the foothills of the Berkshire Mountains, approximately 50 miles northeast of New York City. The town has a population of approximately 24,000 people and covers an area of approximately 28 square miles.
History
Ridgefield was first settled in 1708 by a group of English settlers from Norwalk, Connecticut. The town was originally known as “Reading” and was part of the Norwalk Township. In 1709, the town was renamed “Ridgefield” after the ridge of land that runs through the town.
In the late 1700s, the town was a major center for the production of iron. The iron industry was so successful that the town was nicknamed “Iron Town”. The iron industry declined in the early 1800s and the town shifted its focus to agriculture.
In the mid-1800s, the town began to attract wealthy New Yorkers who built large estates in the area. This influx of wealthy residents helped to spur the development of the town and the construction of many of the town’s historic buildings.
Geography
Ridgefield is located in the foothills of the Berkshire Mountains in Fairfield County, Connecticut. The town is bordered by the towns of Wilton to the north, Redding to the east, Danbury to the south, and Lewisboro, New York to the west.
The town is situated on a ridge of land that runs through the town from north to south. The town is divided into two distinct sections: the northern section is hilly and wooded, while the southern section is more level and open.
The town is home to several lakes, including Lake Mamanasco, Lake Windwing, and Lake Kitchawan. The town is also home to several parks, including the Ridgefield Wildlife Refuge, the Great Swamp, and the Ridgefield National Wildlife Refuge.
Economy
Ridgefield’s economy is largely based on the service industry. The town is home to several large corporations, including Boehringer Ingelheim, PepsiCo, and Nestle. The town is also home to several small businesses, including restaurants, retail stores, and professional services.
The town is also home to several educational institutions, including the Ridgefield Academy, the Ridgefield Library, and the Ridgefield Playhouse.
Demographics
As of the 2010 census, the town had a population of 24,638 people. The racial makeup of the town was 94.3% White, 1.2% African American, 0.2% Native American, 2.3% Asian, 0.1% Pacific Islander, 0.7% from other races, and 1.2% from two or more races. Hispanic or Latino of any race were 3.3% of the population.
The median income for a household in the town was $97,817, and the median income for a family was $118,817. The per capita income for the town was $50,945. About 2.7% of families and 4.2% of the population were below the poverty line, including 4.3% of those under age 18 and 4.2% of those age 65 or over.
Common Questions
What is Per Capita Income in Ridgefield?
Per Capita income in Ridgefield is $99,341.
What is the Median Family Income in Ridgefield?
Median Family Income in Ridgefield is $197,357.
What is the Median Household income in Ridgefield?
Median Household Income in Ridgefield is $139,490.
What is Income or Wage Gap in Ridgefield?
Income or Wage Gap in Ridgefield is 47.3%.
Women in Ridgefield earn 52.7 cents for every dollar earned by a man.
What is Inequality or Gini Index in Ridgefield?
Inequality or Gini Index in Ridgefield is 0.56.
What is the Total Population of Ridgefield?
Total Population of Ridgefield is 7,655.
What is the Total Male Population of Ridgefield?
Total Male Population of Ridgefield is 3,495.
What is the Total Female Population of Ridgefield?
Total Female Population of Ridgefield is 4,160.
What is the Ratio of Males per 100 Females in Ridgefield?
There are 84.01 Males per 100 Females in Ridgefield.
What is the Ratio of Females per 100 Males in Ridgefield?
There are 119.03 Females per 100 Males in Ridgefield.
What is the Median Population Age in Ridgefield?
Median Population Age in Ridgefield is 44.9 Years.
What is the Average Family Size in Ridgefield
Average Family Size in Ridgefield is 3.2 People.
What is the Average Household Size in Ridgefield
Average Household Size in Ridgefield is 2.6 People.
How Large is the Labor Force in Ridgefield?
There are 3,864 People in the Labor Forcein in Ridgefield.
What is the Percentage of People in the Labor Force in Ridgefield?
62.9% of People are in the Labor Force in Ridgefield.
What is the Unemployment Rate in Ridgefield?
Unemployment Rate in Ridgefield is 5.7%.