Sharon, CT Map & Demographics
Sharon Map
Sharon Overview
$136,692
PER CAPITA INCOME
$250,001
AVG FAMILY INCOME
$153,431
AVG HOUSEHOLD INCOME
0.43
INEQUALITY / GINI INDEX
403
TOTAL POPULATION
148
MALE POPULATION
255
FEMALE POPULATION
58.04
MALES / 100 FEMALES
172.30
FEMALES / 100 MALES
68.4
MEDIAN AGE
3.3
AVG FAMILY SIZE
1.3
AVG HOUSEHOLD SIZE
204
LABOR FORCE [ PEOPLE ]
50.6%
PERCENT IN LABOR FORCE
2.5%
UNEMPLOYMENT RATE
Sharon Zip Codes
Sharon Area Codes
Income in Sharon
Income Overview in Sharon
Per Capita Income in Sharon is $136,692, while median incomes of families and households are $250,001 and $153,431 respectively.
| Characteristic | Number | Measure |
| Per Capita Income | 403 | $136,692 |
| Median Family Income | 24 | $250,001 |
| Mean Family Income | 24 | $372,413 |
| Median Household Income | 298 | $153,431 |
| Mean Household Income | 298 | $184,271 |
| Income Deficit | 24 | $0 |
| Wage / Income Gap (%) | 403 | 0.00% |
| Wage / Income Gap ($) | 403 | 100.00¢ per $1 |
| Gini / Inequality Index | 403 | 0.43 |
Earnings by Sex in Sharon
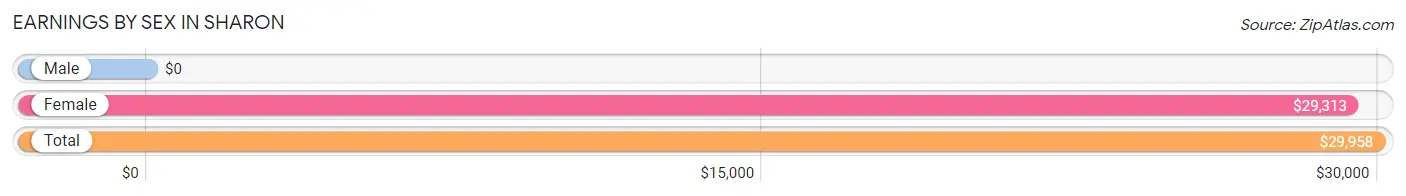
| Sex | Number | Average Earnings |
| Male | 139 (57.4%) | $0 |
| Female | 103 (42.6%) | $29,313 |
| Total | 242 (100.0%) | $29,958 |
Earnings by Sex by Income Bracket in Sharon
The most common earnings brackets in Sharon are $100,000+ for men (41 | 29.5%) and $25,000 to $29,999 for women (60 | 58.3%).
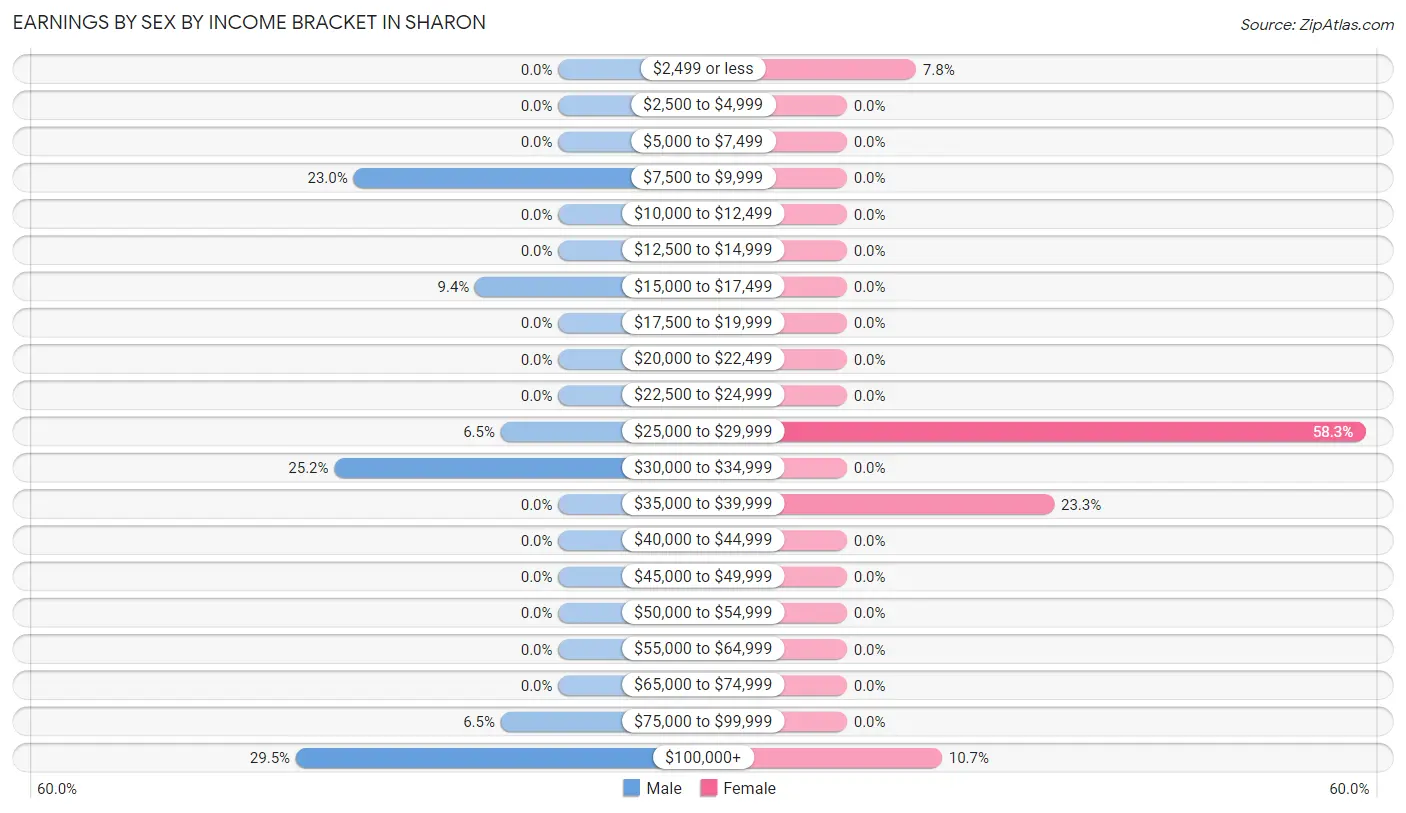
| Income | Male | Female |
| $2,499 or less | 0 (0.0%) | 8 (7.8%) |
| $2,500 to $4,999 | 0 (0.0%) | 0 (0.0%) |
| $5,000 to $7,499 | 0 (0.0%) | 0 (0.0%) |
| $7,500 to $9,999 | 32 (23.0%) | 0 (0.0%) |
| $10,000 to $12,499 | 0 (0.0%) | 0 (0.0%) |
| $12,500 to $14,999 | 0 (0.0%) | 0 (0.0%) |
| $15,000 to $17,499 | 13 (9.3%) | 0 (0.0%) |
| $17,500 to $19,999 | 0 (0.0%) | 0 (0.0%) |
| $20,000 to $22,499 | 0 (0.0%) | 0 (0.0%) |
| $22,500 to $24,999 | 0 (0.0%) | 0 (0.0%) |
| $25,000 to $29,999 | 9 (6.5%) | 60 (58.3%) |
| $30,000 to $34,999 | 35 (25.2%) | 0 (0.0%) |
| $35,000 to $39,999 | 0 (0.0%) | 24 (23.3%) |
| $40,000 to $44,999 | 0 (0.0%) | 0 (0.0%) |
| $45,000 to $49,999 | 0 (0.0%) | 0 (0.0%) |
| $50,000 to $54,999 | 0 (0.0%) | 0 (0.0%) |
| $55,000 to $64,999 | 0 (0.0%) | 0 (0.0%) |
| $65,000 to $74,999 | 0 (0.0%) | 0 (0.0%) |
| $75,000 to $99,999 | 9 (6.5%) | 0 (0.0%) |
| $100,000+ | 41 (29.5%) | 11 (10.7%) |
| Total | 139 (100.0%) | 103 (100.0%) |
Earnings by Sex by Educational Attainment in Sharon
| Educational Attainment | Male Income | Female Income |
| Less than High School | - | - |
| High School Diploma | - | - |
| College or Associate's Degree | - | - |
| Bachelor's Degree | - | - |
| Graduate Degree | - | - |
| Total | - | - |
Family Income in Sharon
Family Income Brackets in Sharon
According to the Sharon family income data, there are 19 families falling into the $200,000+ income range, which is the most common income bracket and makes up 79.2% of all families.
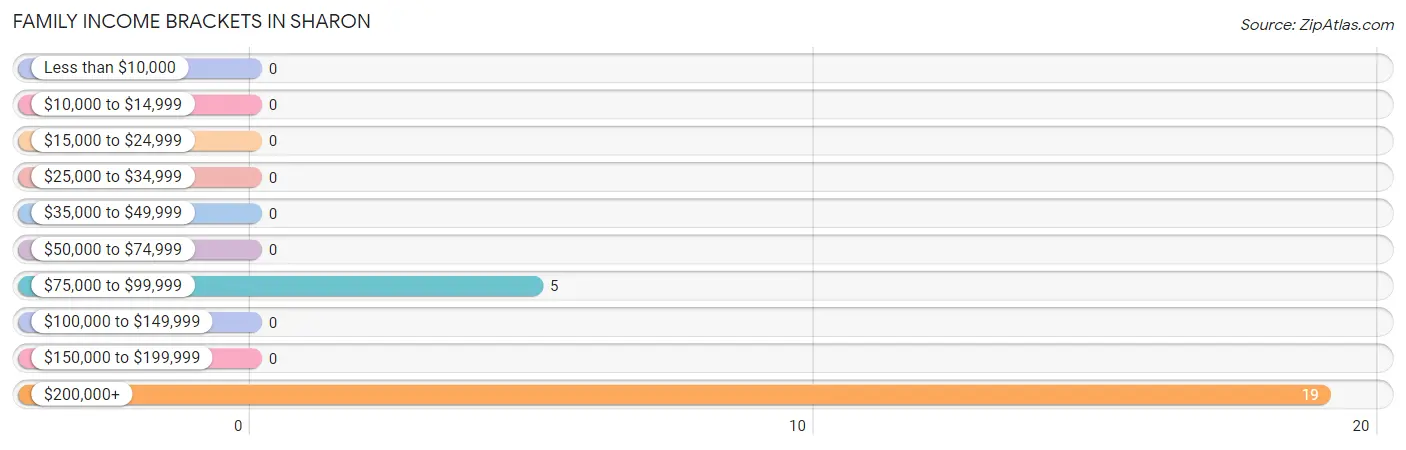
| Income Bracket | # Families | % Families |
| Less than $10,000 | 0 | 0.0% |
| $10,000 to $14,999 | 0 | 0.0% |
| $15,000 to $24,999 | 0 | 0.0% |
| $25,000 to $34,999 | 0 | 0.0% |
| $35,000 to $49,999 | 0 | 0.0% |
| $50,000 to $74,999 | 0 | 0.0% |
| $75,000 to $99,999 | 5 | 20.8% |
| $100,000 to $149,999 | 0 | 0.0% |
| $150,000 to $199,999 | 0 | 0.0% |
| $200,000+ | 19 | 79.2% |
Family Income by Famaliy Size in Sharon
| Income Bracket | # Families | Median Income |
| 2-Person Families | 16 (66.7%) | $0 |
| 3-Person Families | 0 (0.0%) | $0 |
| 4-Person Families | 0 (0.0%) | $0 |
| 5-Person Families | 8 (33.3%) | $0 |
| 6-Person Families | 0 (0.0%) | $0 |
| 7+ Person Families | 0 (0.0%) | $0 |
| Total | 24 (100.0%) | $250,001 |
Family Income by Number of Earners in Sharon
| Number of Earners | # Families | Median Income |
| No Earners | 0 (0.0%) | $0 |
| 1 Earner | 5 (20.8%) | $0 |
| 2 Earners | 11 (45.8%) | $0 |
| 3+ Earners | 8 (33.3%) | $0 |
| Total | 24 (100.0%) | $250,001 |
Household Income in Sharon
Household Income Brackets in Sharon
With 153 households falling in the category, the $150,000 to $199,999 income range is the most frequent in Sharon, accounting for 51.3% of all households.
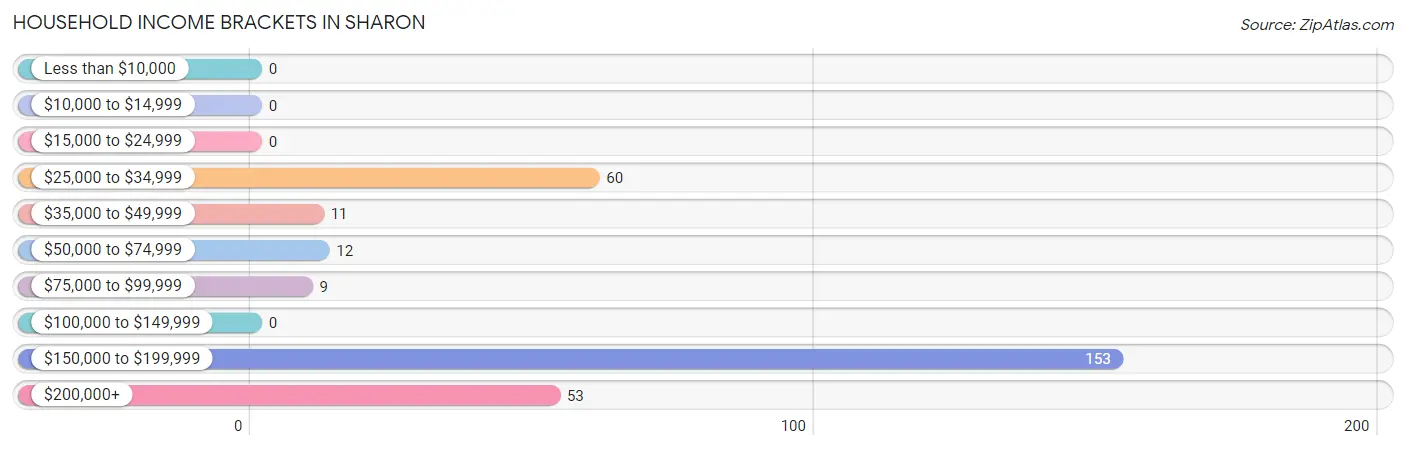
| Income Bracket | # Households | % Households |
| Less than $10,000 | 0 | 0.0% |
| $10,000 to $14,999 | 0 | 0.0% |
| $15,000 to $24,999 | 0 | 0.0% |
| $25,000 to $34,999 | 60 | 20.1% |
| $35,000 to $49,999 | 11 | 3.7% |
| $50,000 to $74,999 | 12 | 4.0% |
| $75,000 to $99,999 | 9 | 3.0% |
| $100,000 to $149,999 | 0 | 0.0% |
| $150,000 to $199,999 | 153 | 51.3% |
| $200,000+ | 53 | 17.8% |
Household Income by Householder Age in Sharon
The median household income in Sharon is $153,431, with the highest median household income of $153,930 found in the 65+ years age bracket for the primary householder. A total of 221 households (74.2%) fall into this category.
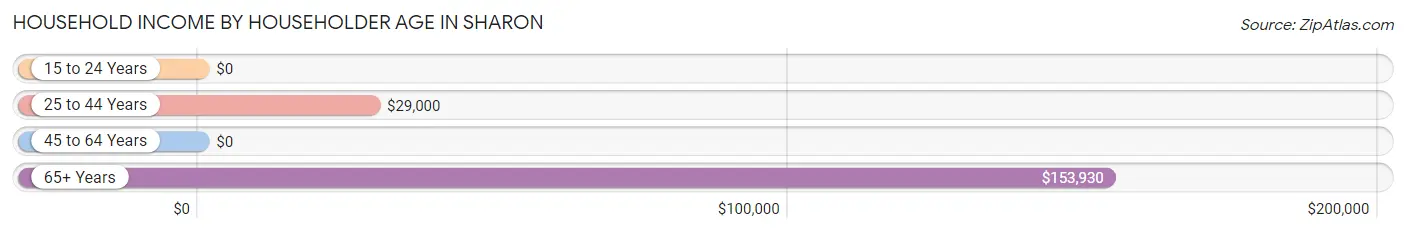
| Income Bracket | # Households | Median Income |
| 15 to 24 Years | 0 (0.0%) | $0 |
| 25 to 44 Years | 72 (24.2%) | $29,000 |
| 45 to 64 Years | 5 (1.7%) | $0 |
| 65+ Years | 221 (74.2%) | $153,930 |
| Total | 298 (100.0%) | $153,431 |
Poverty in Sharon
Income Below Poverty by Sex and Age in Sharon
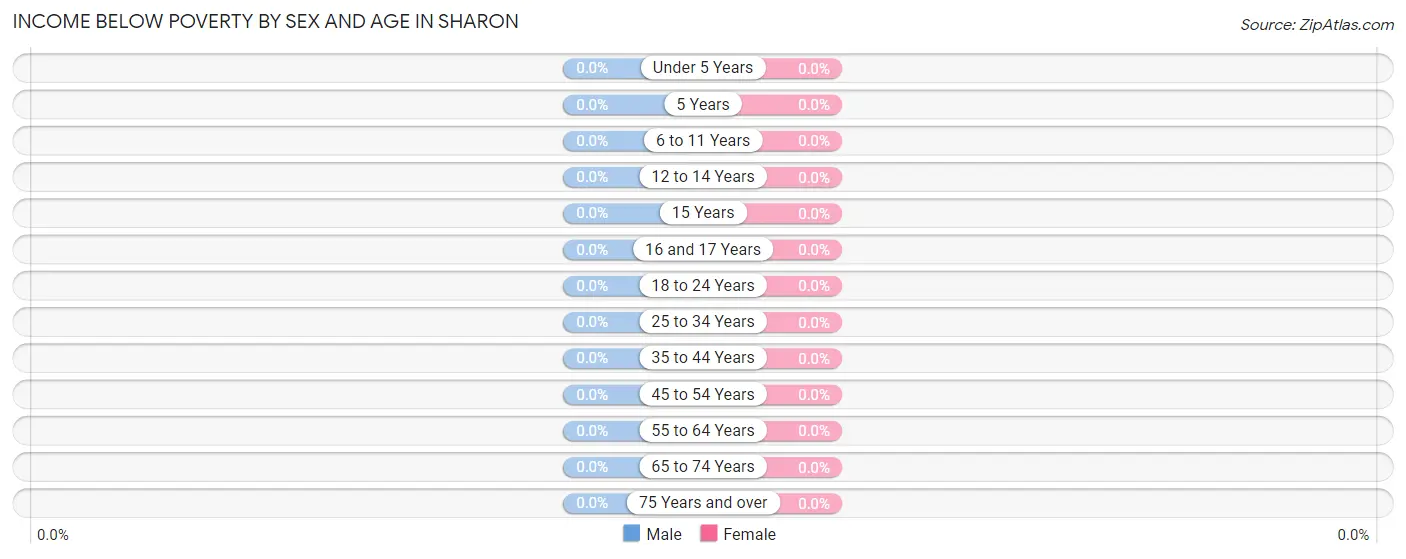
| Age Bracket | Male | Female |
| Under 5 Years | 0 (0.0%) | 0 (0.0%) |
| 5 Years | 0 (0.0%) | 0 (0.0%) |
| 6 to 11 Years | 0 (0.0%) | 0 (0.0%) |
| 12 to 14 Years | 0 (0.0%) | 0 (0.0%) |
| 15 Years | 0 (0.0%) | 0 (0.0%) |
| 16 and 17 Years | 0 (0.0%) | 0 (0.0%) |
| 18 to 24 Years | 0 (0.0%) | 0 (0.0%) |
| 25 to 34 Years | 0 (0.0%) | 0 (0.0%) |
| 35 to 44 Years | 0 (0.0%) | 0 (0.0%) |
| 45 to 54 Years | 0 (0.0%) | 0 (0.0%) |
| 55 to 64 Years | 0 (0.0%) | 0 (0.0%) |
| 65 to 74 Years | 0 (0.0%) | 0 (0.0%) |
| 75 Years and over | 0 (0.0%) | 0 (0.0%) |
| Total | 0 (0.0%) | 0 (0.0%) |
Income Above Poverty by Sex and Age in Sharon
According to the poverty statistics in Sharon, males aged 18 to 24 years and females aged 16 and 17 years are the age groups that are most secure financially, with 100.0% of males and 100.0% of females in these age groups living above the poverty line.
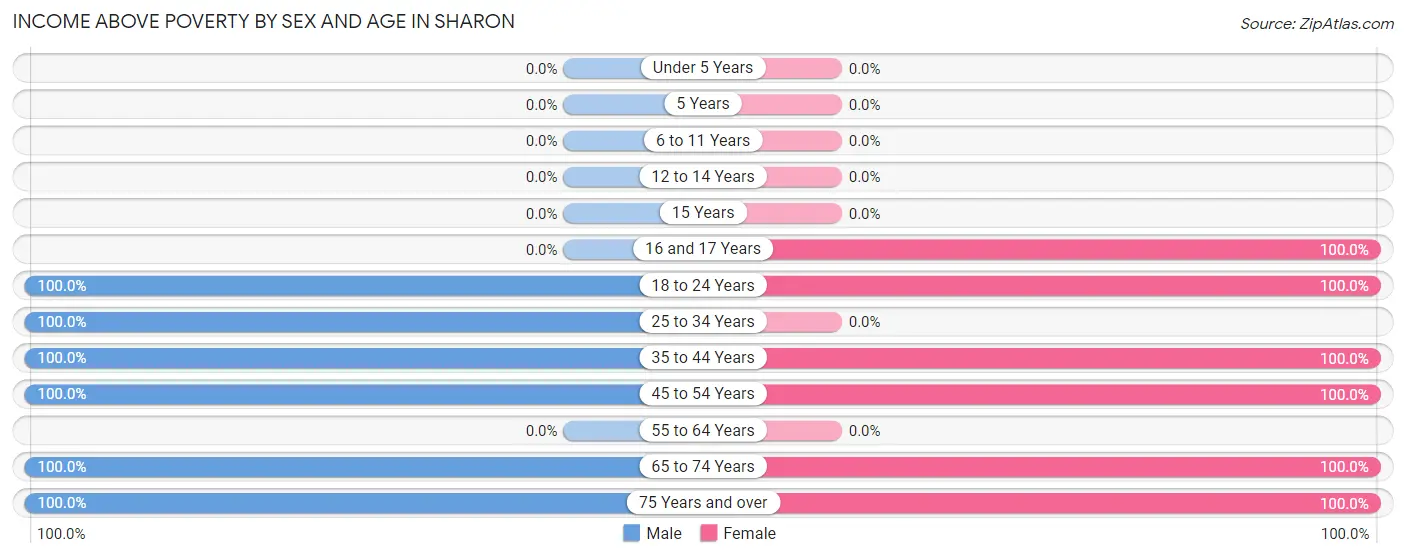
| Age Bracket | Male | Female |
| Under 5 Years | 0 (0.0%) | 0 (0.0%) |
| 5 Years | 0 (0.0%) | 0 (0.0%) |
| 6 to 11 Years | 0 (0.0%) | 0 (0.0%) |
| 12 to 14 Years | 0 (0.0%) | 0 (0.0%) |
| 15 Years | 0 (0.0%) | 0 (0.0%) |
| 16 and 17 Years | 0 (0.0%) | 9 (100.0%) |
| 18 to 24 Years | 9 (100.0%) | 12 (100.0%) |
| 25 to 34 Years | 4 (100.0%) | 0 (0.0%) |
| 35 to 44 Years | 20 (100.0%) | 68 (100.0%) |
| 45 to 54 Years | 5 (100.0%) | 5 (100.0%) |
| 55 to 64 Years | 0 (0.0%) | 0 (0.0%) |
| 65 to 74 Years | 66 (100.0%) | 129 (100.0%) |
| 75 Years and over | 35 (100.0%) | 23 (100.0%) |
| Total | 139 (100.0%) | 246 (100.0%) |
Income Below Poverty Among Married-Couple Families in Sharon
| Children | Above Poverty | Below Poverty |
| No Children | 5 (100.0%) | 0 (0.0%) |
| 1 or 2 Children | 8 (100.0%) | 0 (0.0%) |
| 3 or 4 Children | 0 (0.0%) | 0 (0.0%) |
| 5 or more Children | 0 (0.0%) | 0 (0.0%) |
| Total | 13 (100.0%) | 0 (0.0%) |
Income Below Poverty Among Single-Parent Households in Sharon
| Children | Single Father | Single Mother |
| No Children | 0 (0.0%) | 0 (0.0%) |
| 1 or 2 Children | 0 (0.0%) | 0 (0.0%) |
| 3 or 4 Children | 0 (0.0%) | 0 (0.0%) |
| 5 or more Children | 0 (0.0%) | 0 (0.0%) |
| Total | 0 (0.0%) | 0 (0.0%) |
Income Below Poverty Among Married-Couple vs Single-Parent Households in Sharon
| Children | Married-Couple Families | Single-Parent Households |
| No Children | 0 (0.0%) | 0 (0.0%) |
| 1 or 2 Children | 0 (0.0%) | 0 (0.0%) |
| 3 or 4 Children | 0 (0.0%) | 0 (0.0%) |
| 5 or more Children | 0 (0.0%) | 0 (0.0%) |
| Total | 0 (0.0%) | 0 (0.0%) |
Race in Sharon
The most populous races in Sharon are White / Caucasian (343 | 85.1%), and Asian (60 | 14.9%).
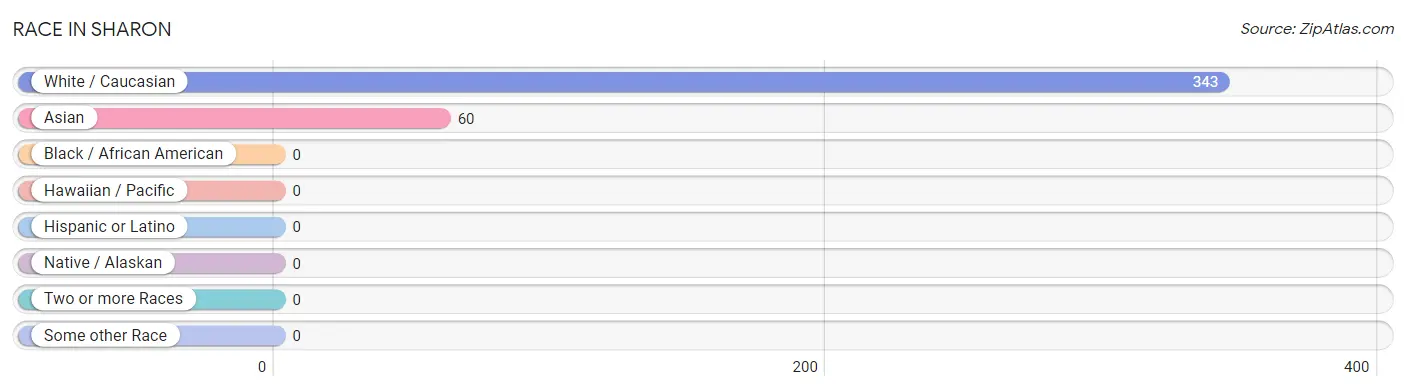
| Race | # Population | % Population |
| Asian | 60 | 14.9% |
| Black / African American | 0 | 0.0% |
| Hawaiian / Pacific | 0 | 0.0% |
| Hispanic or Latino | 0 | 0.0% |
| Native / Alaskan | 0 | 0.0% |
| White / Caucasian | 343 | 85.1% |
| Two or more Races | 0 | 0.0% |
| Some other Race | 0 | 0.0% |
| Total | 403 | 100.0% |
Ancestry in Sharon
The most populous ancestries reported in Sharon are English (112 | 27.8%), Burmese (60 | 14.9%), Irish (51 | 12.7%), Italian (24 | 6.0%), and Polish (12 | 3.0%), together accounting for 64.3% of all Sharon residents.
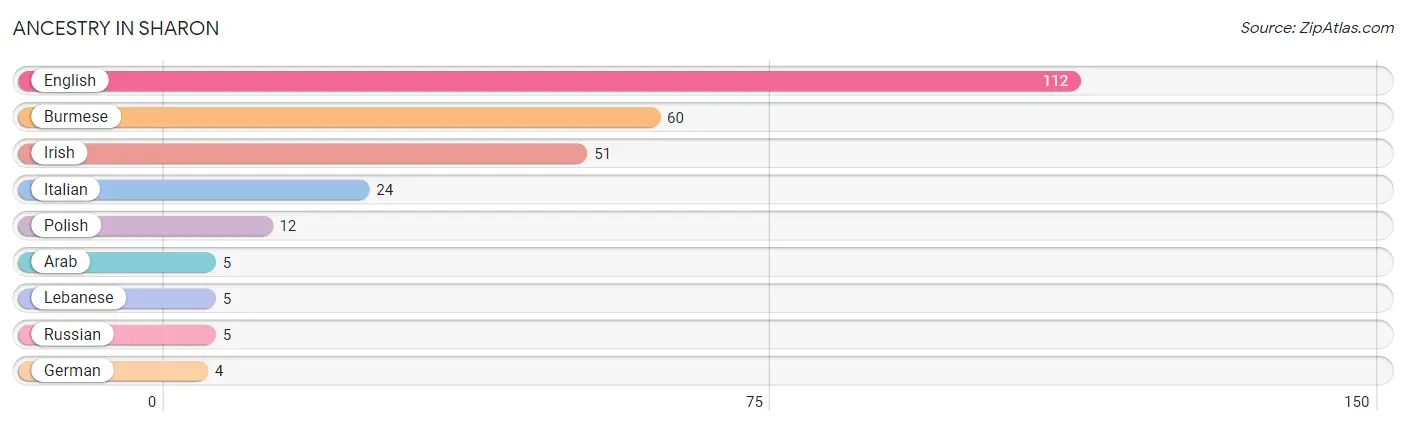
| Ancestry | # Population | % Population |
| Arab | 5 | 1.2% |
| Burmese | 60 | 14.9% |
| English | 112 | 27.8% |
| German | 4 | 1.0% |
| Irish | 51 | 12.7% |
| Italian | 24 | 6.0% |
| Lebanese | 5 | 1.2% |
| Polish | 12 | 3.0% |
| Russian | 5 | 1.2% | View All 9 Rows |
Immigrants in Sharon
The most numerous immigrant groups reported in Sharon came from Asia (70 | 17.4%), Eastern Asia (60 | 14.9%), Korea (60 | 14.9%), Lebanon (5 | 1.2%), and South Central Asia (5 | 1.2%), together accounting for 49.6% of all Sharon residents.
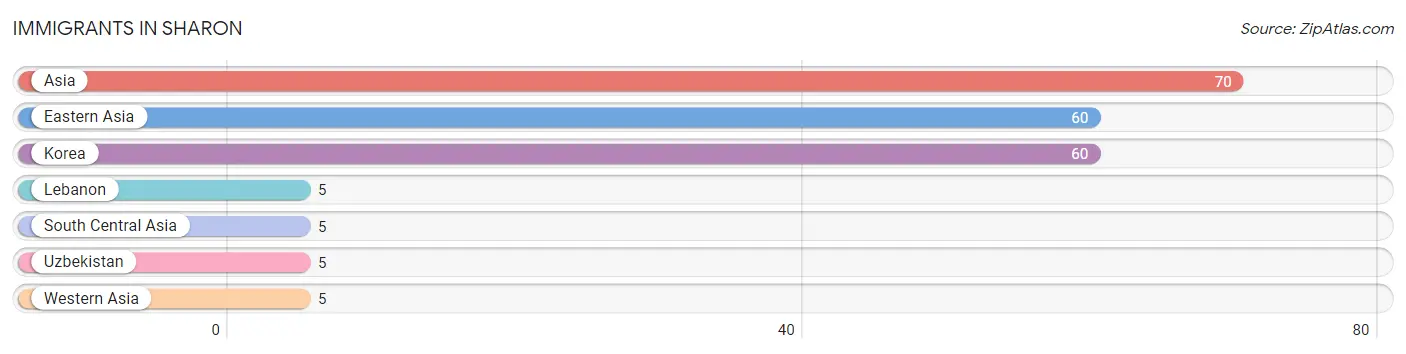
| Immigration Origin | # Population | % Population |
| Asia | 70 | 17.4% |
| Eastern Asia | 60 | 14.9% |
| Korea | 60 | 14.9% |
| Lebanon | 5 | 1.2% |
| South Central Asia | 5 | 1.2% |
| Uzbekistan | 5 | 1.2% |
| Western Asia | 5 | 1.2% | View All 7 Rows |
Sex and Age in Sharon
Sex and Age in Sharon
The most populous age groups in Sharon are 70 to 74 Years (66 | 44.6%) for men and 65 to 69 Years (129 | 50.6%) for women.
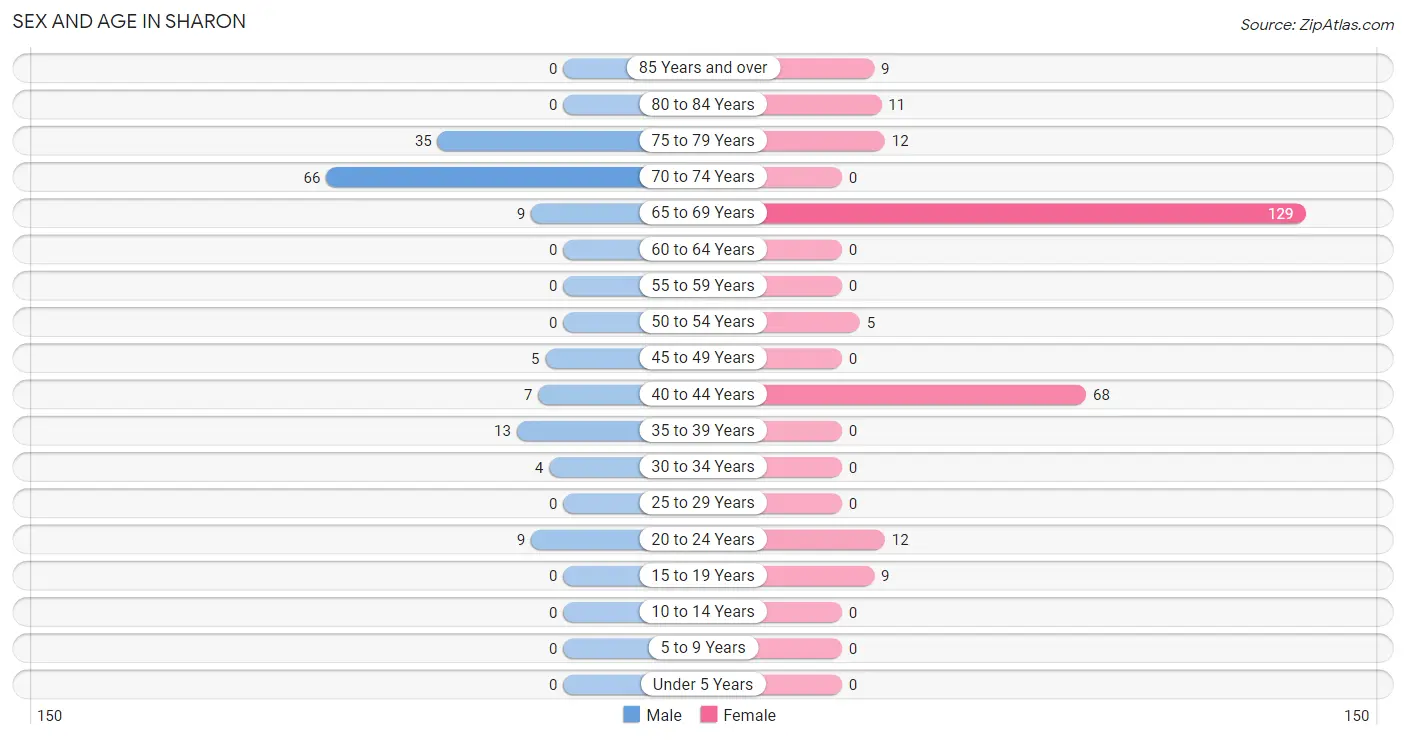
| Age Bracket | Male | Female |
| Under 5 Years | 0 (0.0%) | 0 (0.0%) |
| 5 to 9 Years | 0 (0.0%) | 0 (0.0%) |
| 10 to 14 Years | 0 (0.0%) | 0 (0.0%) |
| 15 to 19 Years | 0 (0.0%) | 9 (3.5%) |
| 20 to 24 Years | 9 (6.1%) | 12 (4.7%) |
| 25 to 29 Years | 0 (0.0%) | 0 (0.0%) |
| 30 to 34 Years | 4 (2.7%) | 0 (0.0%) |
| 35 to 39 Years | 13 (8.8%) | 0 (0.0%) |
| 40 to 44 Years | 7 (4.7%) | 68 (26.7%) |
| 45 to 49 Years | 5 (3.4%) | 0 (0.0%) |
| 50 to 54 Years | 0 (0.0%) | 5 (2.0%) |
| 55 to 59 Years | 0 (0.0%) | 0 (0.0%) |
| 60 to 64 Years | 0 (0.0%) | 0 (0.0%) |
| 65 to 69 Years | 9 (6.1%) | 129 (50.6%) |
| 70 to 74 Years | 66 (44.6%) | 0 (0.0%) |
| 75 to 79 Years | 35 (23.6%) | 12 (4.7%) |
| 80 to 84 Years | 0 (0.0%) | 11 (4.3%) |
| 85 Years and over | 0 (0.0%) | 9 (3.5%) |
| Total | 148 (100.0%) | 255 (100.0%) |
Families and Households in Sharon
Median Family Size in Sharon
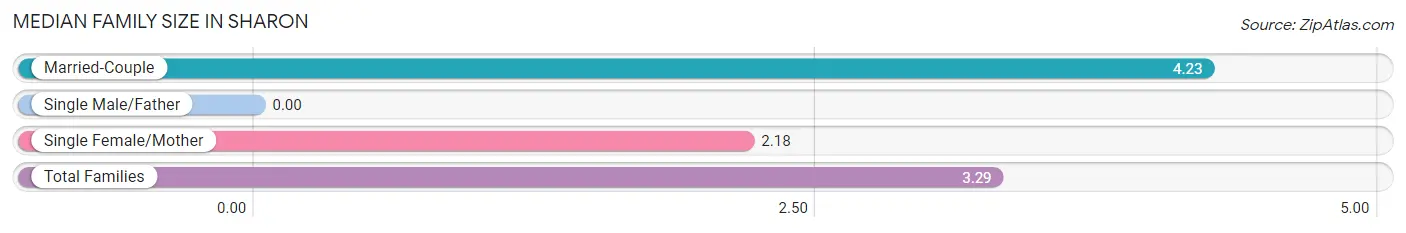
| Family Type | # Families | Family Size |
| Married-Couple | 13 (54.2%) | 4.23 |
| Single Male/Father | 0 (0.0%) | - |
| Single Female/Mother | 11 (45.8%) | 2.18 |
| Total Families | 24 (100.0%) | 3.29 |
Median Household Size in Sharon
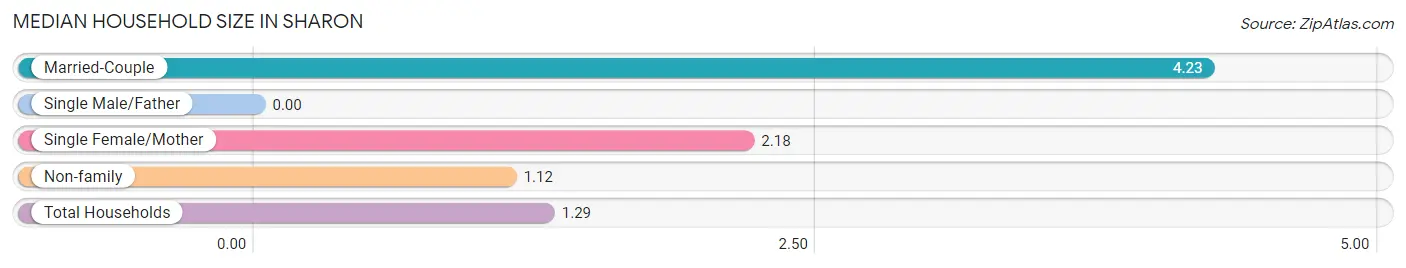
| Household Type | # Households | Household Size |
| Married-Couple | 13 (4.4%) | 4.23 |
| Single Male/Father | 0 (0.0%) | - |
| Single Female/Mother | 11 (3.7%) | 2.18 |
| Non-family | 274 (91.9%) | 1.12 |
| Total Households | 298 (100.0%) | 1.29 |
Household Size by Marriage Status in Sharon
Out of a total of 298 households in Sharon, 24 (8.1%) are family households, while 274 (91.9%) are nonfamily households. The most numerous type of family households are 2-person households, comprising 16, and the most common type of nonfamily households are 1-person households, comprising 239.
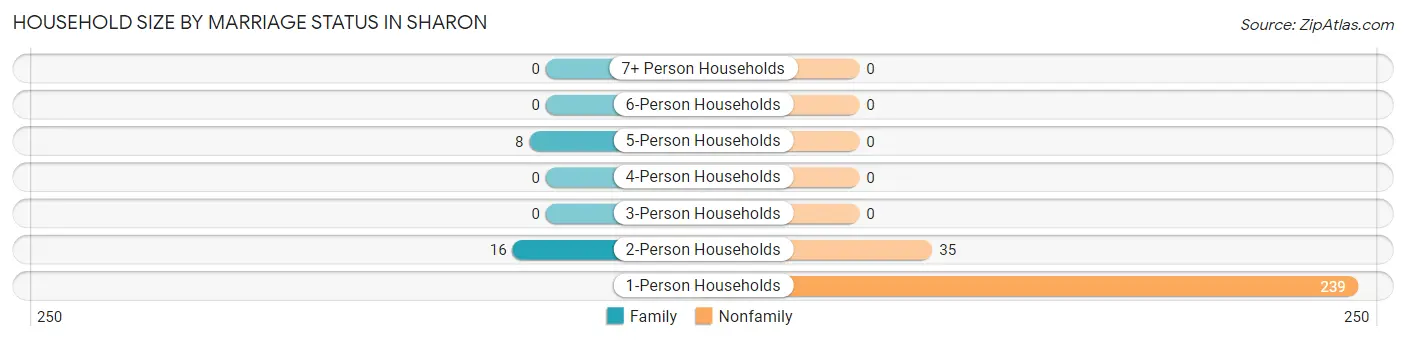
| Household Size | Family Households | Nonfamily Households |
| 1-Person Households | - | 239 (80.2%) |
| 2-Person Households | 16 (5.4%) | 35 (11.7%) |
| 3-Person Households | 0 (0.0%) | 0 (0.0%) |
| 4-Person Households | 0 (0.0%) | 0 (0.0%) |
| 5-Person Households | 8 (2.7%) | 0 (0.0%) |
| 6-Person Households | 0 (0.0%) | 0 (0.0%) |
| 7+ Person Households | 0 (0.0%) | 0 (0.0%) |
| Total | 24 (8.1%) | 274 (91.9%) |
Female Fertility in Sharon
Fertility by Age in Sharon
| Age Bracket | Women with Births | Births / 1,000 Women |
| 15 to 19 years | 0 (0.0%) | 0.0 |
| 20 to 34 years | 0 (0.0%) | 0.0 |
| 35 to 50 years | 0 (0.0%) | 0.0 |
| Total | 0 (0.0%) | 0.0 |
Fertility by Age by Marriage Status in Sharon
| Age Bracket | Married | Unmarried |
| 15 to 19 years | 0 (0.0%) | 0 (0.0%) |
| 20 to 34 years | 0 (0.0%) | 0 (0.0%) |
| 35 to 50 years | 0 (0.0%) | 0 (0.0%) |
| Total | 0 (0.0%) | 0 (0.0%) |
Fertility by Education in Sharon
| Educational Attainment | Women with Births | Births / 1,000 Women |
| Less than High School | 0 (0.0%) | 0.0 |
| High School Diploma | 0 (0.0%) | 0.0 |
| College or Associate's Degree | 0 (0.0%) | 0.0 |
| Bachelor's Degree | 0 (0.0%) | 0.0 |
| Graduate Degree | 0 (0.0%) | 0.0 |
| Total | 0 (0.0%) | 0.0 |
Fertility by Education by Marriage Status in Sharon

| Educational Attainment | Married | Unmarried |
| Less than High School | 0 (0.0%) | 0 (0.0%) |
| High School Diploma | 0 (0.0%) | 0 (0.0%) |
| College or Associate's Degree | 0 (0.0%) | 0 (0.0%) |
| Bachelor's Degree | 0 (0.0%) | 0 (0.0%) |
| Graduate Degree | 0 (0.0%) | 0 (0.0%) |
| Total | 0 (0.0%) | 0 (0.0%) |
Employment Characteristics in Sharon
Employment by Class of Employer in Sharon
Among the 199 employed individuals in Sharon, private company employees (112 | 56.3%), not-for-profit organizations (72 | 36.2%), and self-employed (not incorporated) (11 | 5.5%) make up the most common classes of employment.
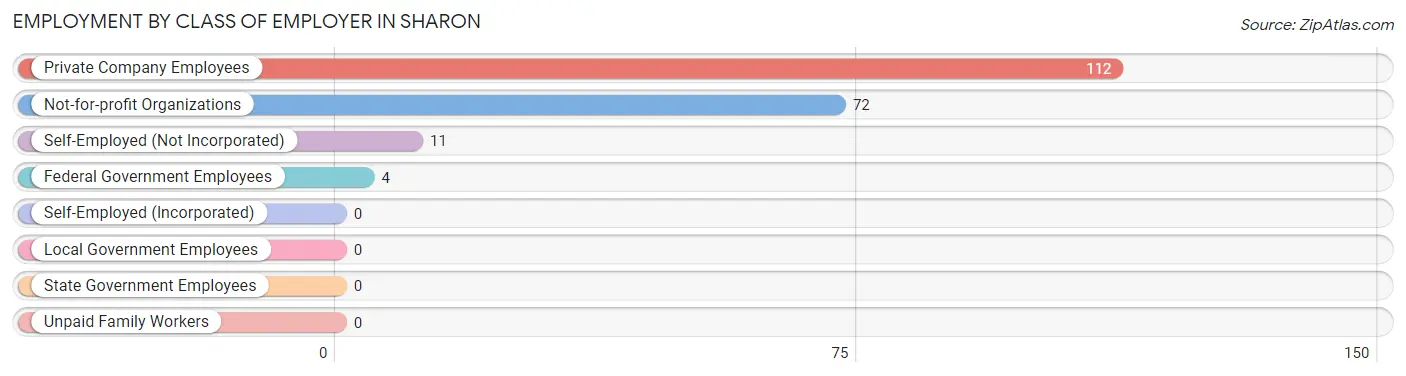
| Employer Class | # Employees | % Employees |
| Private Company Employees | 112 | 56.3% |
| Self-Employed (Incorporated) | 0 | 0.0% |
| Self-Employed (Not Incorporated) | 11 | 5.5% |
| Not-for-profit Organizations | 72 | 36.2% |
| Local Government Employees | 0 | 0.0% |
| State Government Employees | 0 | 0.0% |
| Federal Government Employees | 4 | 2.0% |
| Unpaid Family Workers | 0 | 0.0% |
| Total | 199 | 100.0% |
Employment Status by Age in Sharon
According to the labor force statistics for Sharon, out of the total population over 16 years of age (403), 50.6% or 204 individuals are in the labor force, with 2.5% or 5 of them unemployed. The age group with the highest labor force participation rate is 20 to 24 years, with 100.0% or 21 individuals in the labor force. Within the labor force, the 45 to 54 years age range has the highest percentage of unemployed individuals, with 50.0% or 5 of them being unemployed.
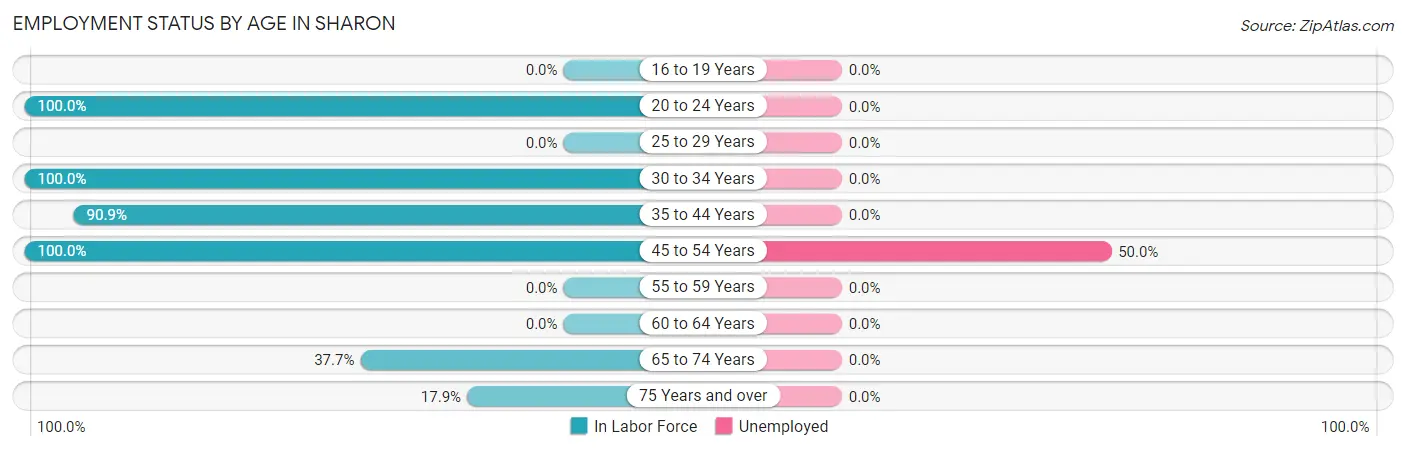
| Age Bracket | In Labor Force | Unemployed |
| 16 to 19 Years | 0 (0.0%) | 0 (0.0%) |
| 20 to 24 Years | 21 (100.0%) | 0 (0.0%) |
| 25 to 29 Years | 0 (0.0%) | 0 (0.0%) |
| 30 to 34 Years | 4 (100.0%) | 0 (0.0%) |
| 35 to 44 Years | 80 (90.9%) | 0 (0.0%) |
| 45 to 54 Years | 10 (100.0%) | 5 (50.0%) |
| 55 to 59 Years | 0 (0.0%) | 0 (0.0%) |
| 60 to 64 Years | 0 (0.0%) | 0 (0.0%) |
| 65 to 74 Years | 77 (37.7%) | 0 (0.0%) |
| 75 Years and over | 12 (17.9%) | 0 (0.0%) |
| Total | 204 (50.6%) | 5 (2.5%) |
Employment Status by Educational Attainment in Sharon
According to labor force statistics for Sharon, 92.2% of individuals (94) out of the total population between 25 and 64 years of age (102) are in the labor force, with 5.3% or 5 of them being unemployed. The group with the highest labor force participation rate are those with the educational attainment of bachelor's degree or higher, with 100.0% or 70 individuals in the labor force. Within the labor force, individuals with bachelor's degree or higher education have the highest percentage of unemployment, with 7.1% or 5 of them being unemployed.
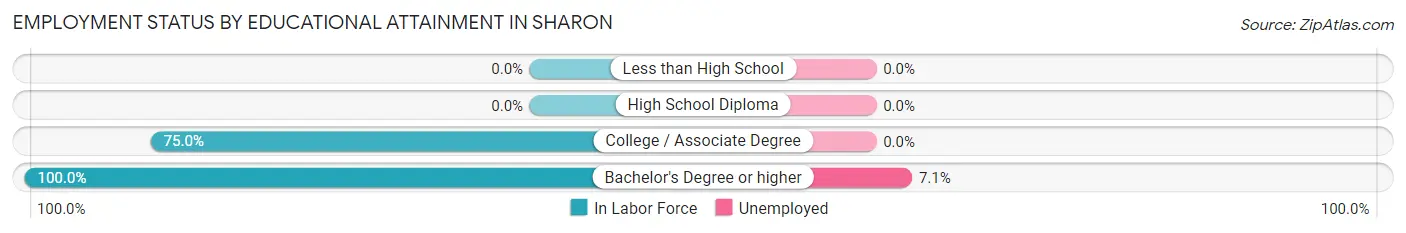
| Educational Attainment | In Labor Force | Unemployed |
| Less than High School | 0 (0.0%) | 0 (0.0%) |
| High School Diploma | 0 (0.0%) | 0 (0.0%) |
| College / Associate Degree | 24 (75.0%) | 0 (0.0%) |
| Bachelor's Degree or higher | 70 (100.0%) | 5 (7.1%) |
| Total | 94 (92.2%) | 5 (5.3%) |
Employment Occupations by Sex in Sharon
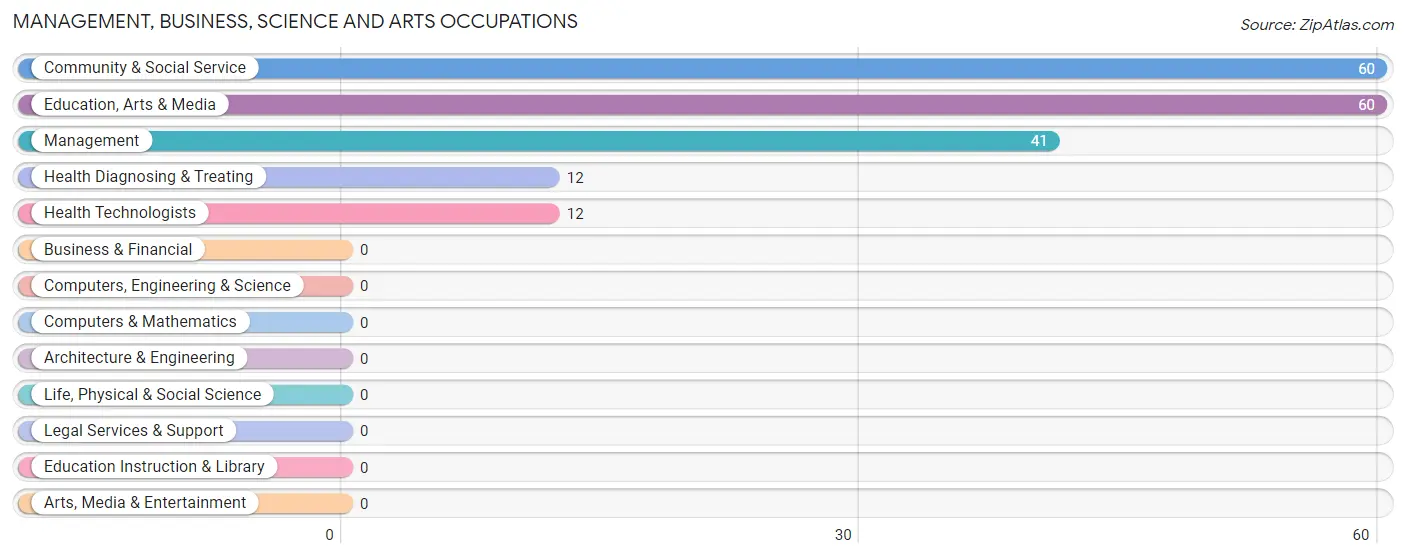
Management, Business, Science and Arts Occupations
The most common Management, Business, Science and Arts occupations in Sharon are Community & Social Service (60 | 30.1%), Education, Arts & Media (60 | 30.1%), Management (41 | 20.6%), Health Diagnosing & Treating (12 | 6.0%), and Health Technologists (12 | 6.0%).
Management, Business, Science and Arts Occupations by Sex
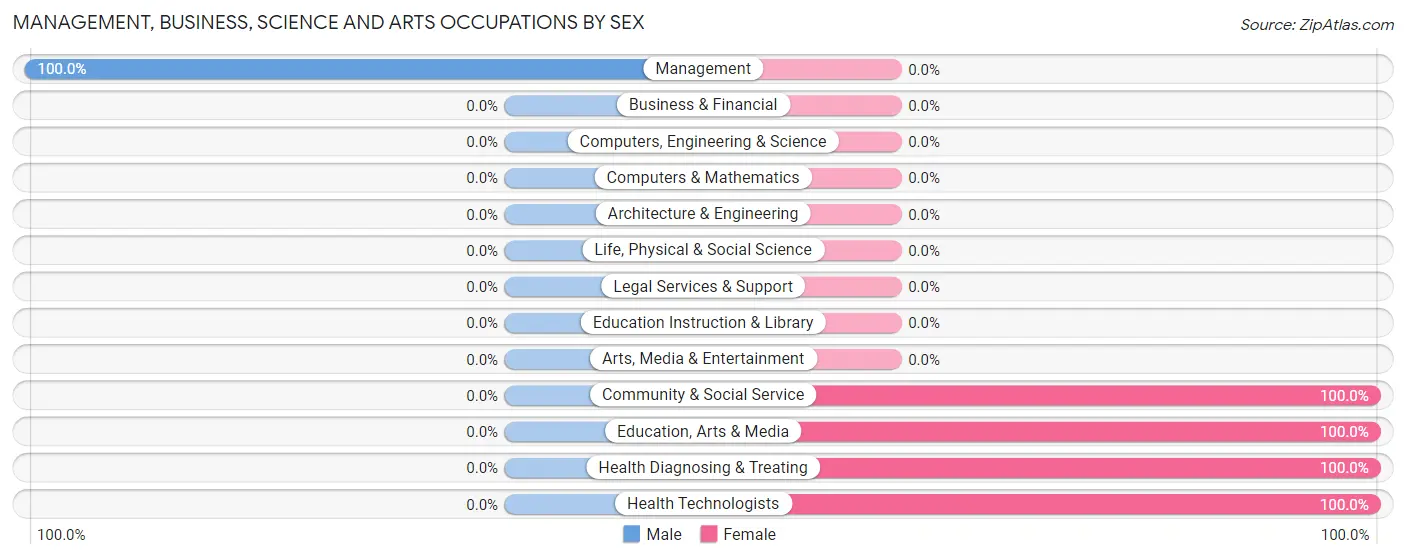
| Occupation | Male | Female |
| Management | 41 (100.0%) | 0 (0.0%) |
| Business & Financial | 0 (0.0%) | 0 (0.0%) |
| Computers, Engineering & Science | 0 (0.0%) | 0 (0.0%) |
| Computers & Mathematics | 0 (0.0%) | 0 (0.0%) |
| Architecture & Engineering | 0 (0.0%) | 0 (0.0%) |
| Life, Physical & Social Science | 0 (0.0%) | 0 (0.0%) |
| Community & Social Service | 0 (0.0%) | 60 (100.0%) |
| Education, Arts & Media | 0 (0.0%) | 60 (100.0%) |
| Legal Services & Support | 0 (0.0%) | 0 (0.0%) |
| Education Instruction & Library | 0 (0.0%) | 0 (0.0%) |
| Arts, Media & Entertainment | 0 (0.0%) | 0 (0.0%) |
| Health Diagnosing & Treating | 0 (0.0%) | 12 (100.0%) |
| Health Technologists | 0 (0.0%) | 12 (100.0%) |
| Total (Category) | 41 (36.3%) | 72 (63.7%) |
| Total (Overall) | 104 (52.3%) | 95 (47.7%) |
Services Occupations
The most common Services occupations in Sharon are Food Preparation & Serving (32 | 16.1%), and Personal Care & Service (21 | 10.5%).
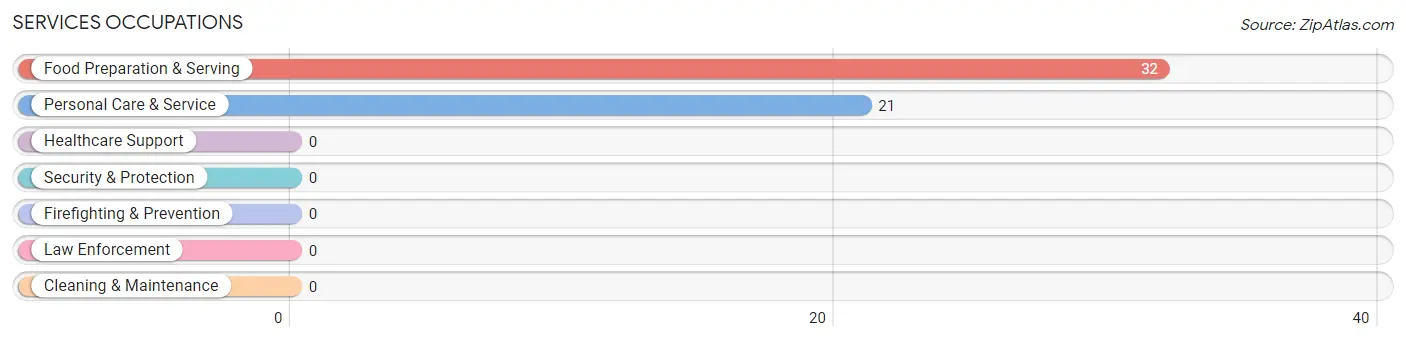
Services Occupations by Sex
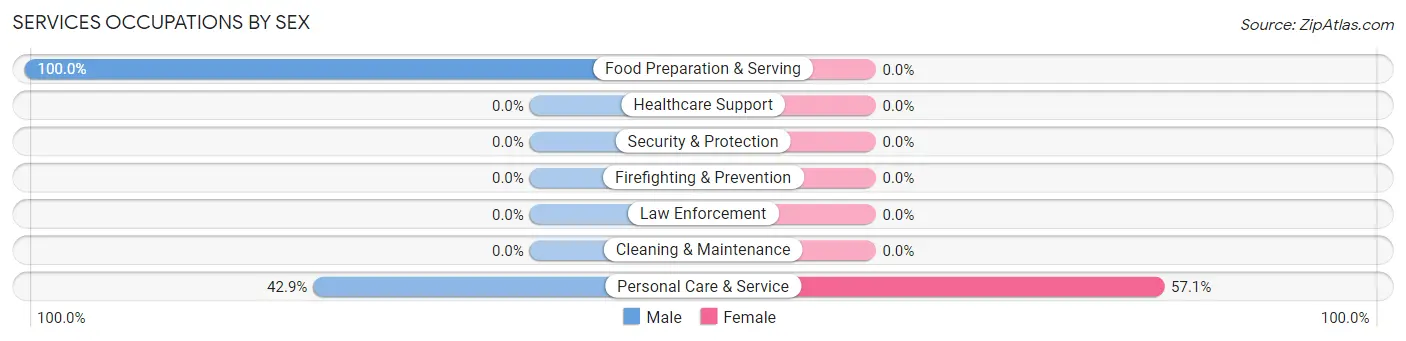
| Occupation | Male | Female |
| Healthcare Support | 0 (0.0%) | 0 (0.0%) |
| Security & Protection | 0 (0.0%) | 0 (0.0%) |
| Firefighting & Prevention | 0 (0.0%) | 0 (0.0%) |
| Law Enforcement | 0 (0.0%) | 0 (0.0%) |
| Food Preparation & Serving | 32 (100.0%) | 0 (0.0%) |
| Cleaning & Maintenance | 0 (0.0%) | 0 (0.0%) |
| Personal Care & Service | 9 (42.9%) | 12 (57.1%) |
| Total (Category) | 41 (77.4%) | 12 (22.6%) |
| Total (Overall) | 104 (52.3%) | 95 (47.7%) |
Sales and Office Occupations
The most common Sales and Office occupations in Sharon are Office & Administration (22 | 11.1%), and Sales & Related (11 | 5.5%).
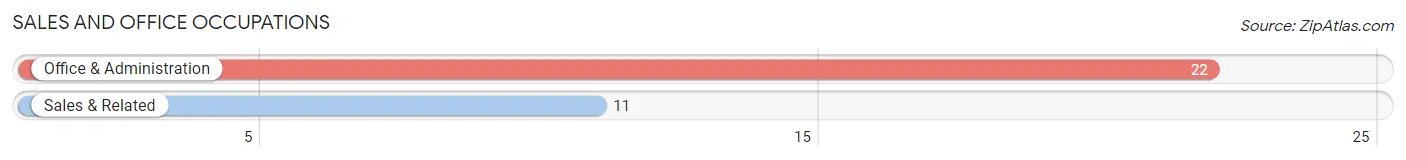
Sales and Office Occupations by Sex
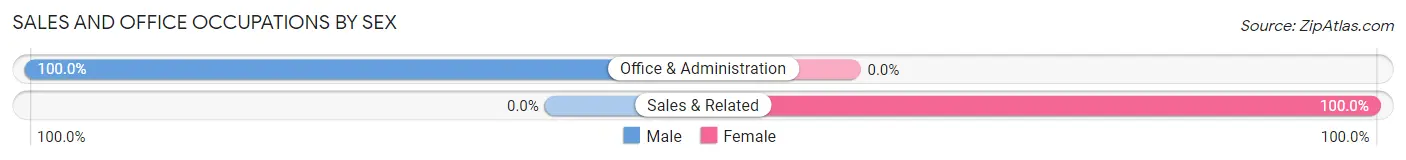
| Occupation | Male | Female |
| Sales & Related | 0 (0.0%) | 11 (100.0%) |
| Office & Administration | 22 (100.0%) | 0 (0.0%) |
| Total (Category) | 22 (66.7%) | 11 (33.3%) |
| Total (Overall) | 104 (52.3%) | 95 (47.7%) |
Natural Resources, Construction and Maintenance Occupations
Natural Resources, Construction and Maintenance Occupations by Sex
| Occupation | Male | Female |
| Farming, Fishing & Forestry | 0 (0.0%) | 0 (0.0%) |
| Construction & Extraction | 0 (0.0%) | 0 (0.0%) |
| Installation, Maintenance & Repair | 0 (0.0%) | 0 (0.0%) |
| Total (Category) | 0 (0.0%) | 0 (0.0%) |
| Total (Overall) | 104 (52.3%) | 95 (47.7%) |
Production, Transportation and Moving Occupations
Production, Transportation and Moving Occupations by Sex
| Occupation | Male | Female |
| Production | 0 (0.0%) | 0 (0.0%) |
| Transportation | 0 (0.0%) | 0 (0.0%) |
| Material Moving | 0 (0.0%) | 0 (0.0%) |
| Total (Category) | 0 (0.0%) | 0 (0.0%) |
| Total (Overall) | 104 (52.3%) | 95 (47.7%) |
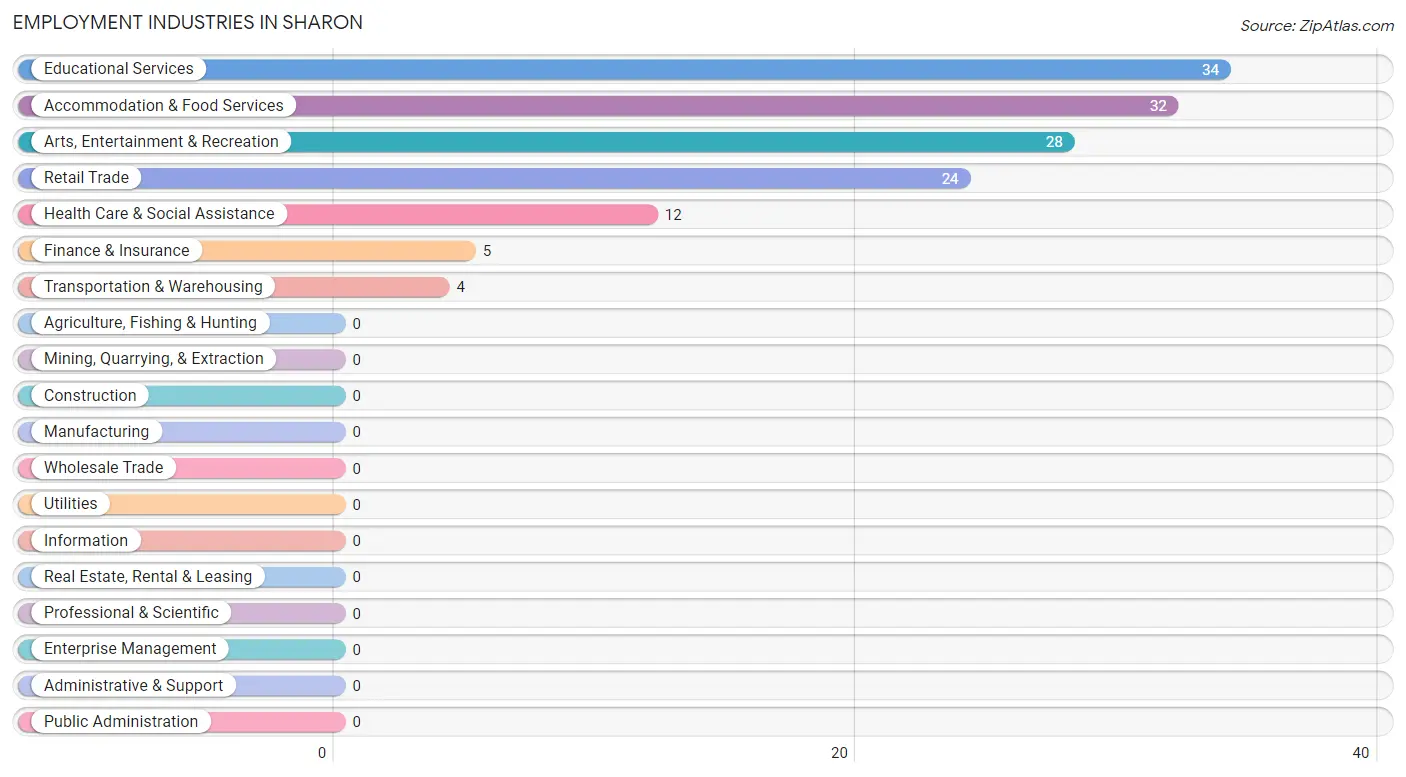
Employment Industries by Sex in Sharon
Employment Industries in Sharon
The major employment industries in Sharon include Educational Services (34 | 17.1%), Accommodation & Food Services (32 | 16.1%), Arts, Entertainment & Recreation (28 | 14.1%), Retail Trade (24 | 12.1%), and Health Care & Social Assistance (12 | 6.0%).
Employment Industries by Sex in Sharon
The Sharon industries that see more men than women are Transportation & Warehousing (100.0%), Finance & Insurance (100.0%), and Educational Services (100.0%), whereas the industries that tend to have a higher number of women are Health Care & Social Assistance (100.0%), Retail Trade (45.8%), and Arts, Entertainment & Recreation (42.9%).
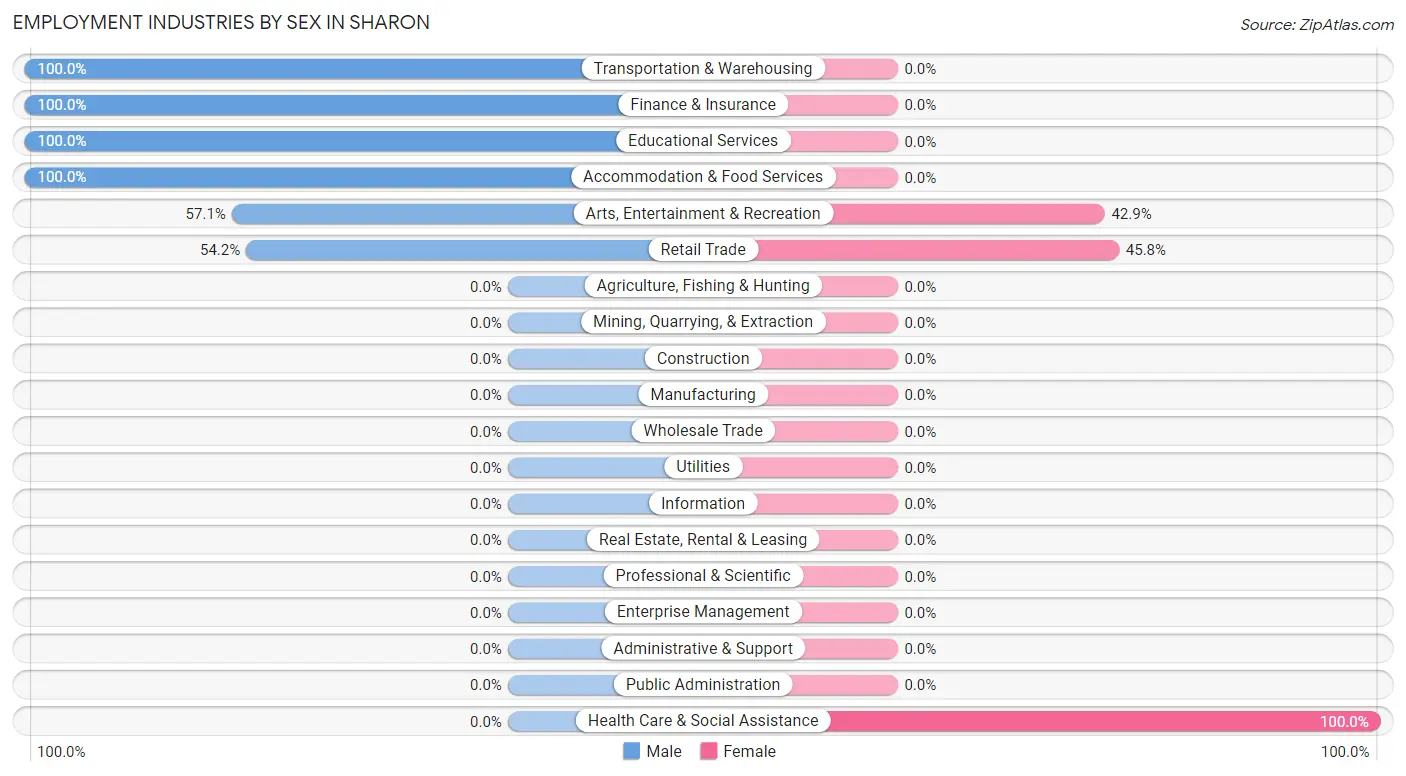
| Industry | Male | Female |
| Agriculture, Fishing & Hunting | 0 (0.0%) | 0 (0.0%) |
| Mining, Quarrying, & Extraction | 0 (0.0%) | 0 (0.0%) |
| Construction | 0 (0.0%) | 0 (0.0%) |
| Manufacturing | 0 (0.0%) | 0 (0.0%) |
| Wholesale Trade | 0 (0.0%) | 0 (0.0%) |
| Retail Trade | 13 (54.2%) | 11 (45.8%) |
| Transportation & Warehousing | 4 (100.0%) | 0 (0.0%) |
| Utilities | 0 (0.0%) | 0 (0.0%) |
| Information | 0 (0.0%) | 0 (0.0%) |
| Finance & Insurance | 5 (100.0%) | 0 (0.0%) |
| Real Estate, Rental & Leasing | 0 (0.0%) | 0 (0.0%) |
| Professional & Scientific | 0 (0.0%) | 0 (0.0%) |
| Enterprise Management | 0 (0.0%) | 0 (0.0%) |
| Administrative & Support | 0 (0.0%) | 0 (0.0%) |
| Educational Services | 34 (100.0%) | 0 (0.0%) |
| Health Care & Social Assistance | 0 (0.0%) | 12 (100.0%) |
| Arts, Entertainment & Recreation | 16 (57.1%) | 12 (42.9%) |
| Accommodation & Food Services | 32 (100.0%) | 0 (0.0%) |
| Public Administration | 0 (0.0%) | 0 (0.0%) |
| Total | 104 (52.3%) | 95 (47.7%) |
Education in Sharon
School Enrollment in Sharon
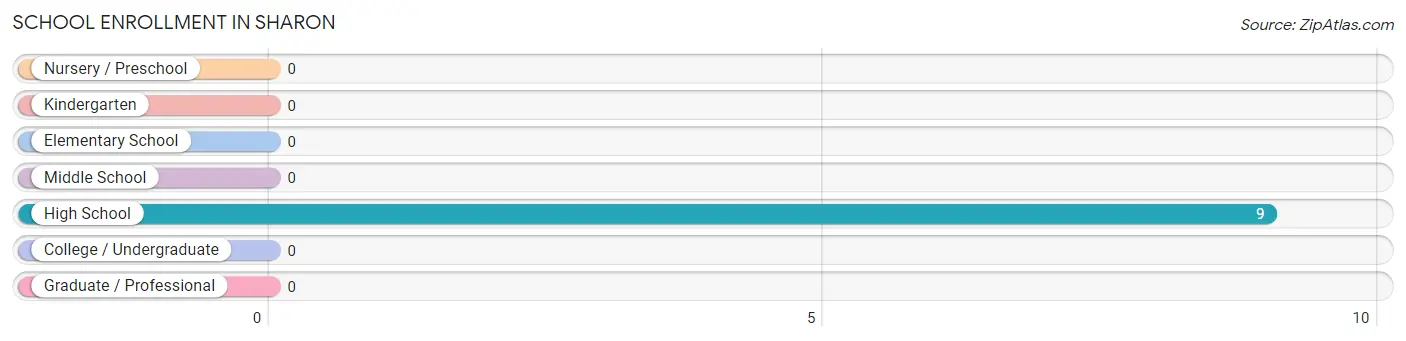
| School Level | # Students | % Students |
| Nursery / Preschool | 0 | 0.0% |
| Kindergarten | 0 | 0.0% |
| Elementary School | 0 | 0.0% |
| Middle School | 0 | 0.0% |
| High School | 9 | 100.0% |
| College / Undergraduate | 0 | 0.0% |
| Graduate / Professional | 0 | 0.0% |
| Total | 9 | 100.0% |
School Enrollment by Age by Funding Source in Sharon
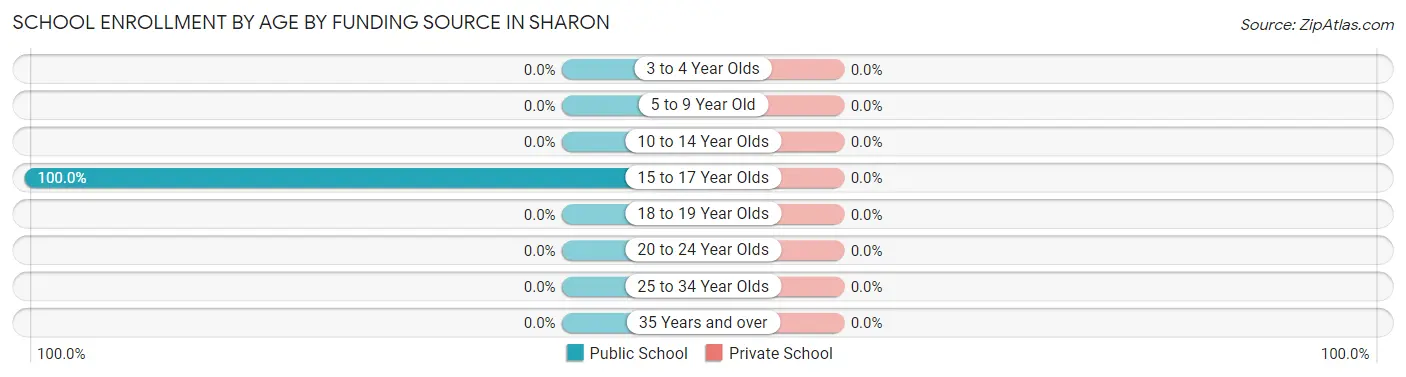
| Age Bracket | Public School | Private School |
| 3 to 4 Year Olds | 0 (0.0%) | 0 (0.0%) |
| 5 to 9 Year Old | 0 (0.0%) | 0 (0.0%) |
| 10 to 14 Year Olds | 0 (0.0%) | 0 (0.0%) |
| 15 to 17 Year Olds | 9 (100.0%) | 0 (0.0%) |
| 18 to 19 Year Olds | 0 (0.0%) | 0 (0.0%) |
| 20 to 24 Year Olds | 0 (0.0%) | 0 (0.0%) |
| 25 to 34 Year Olds | 0 (0.0%) | 0 (0.0%) |
| 35 Years and over | 0 (0.0%) | 0 (0.0%) |
| Total | 9 (100.0%) | 0 (0.0%) |
Educational Attainment by Field of Study in Sharon
Visual & performing arts (118 | 39.2%), communications (92 | 30.6%), social sciences (69 | 22.9%), science & technology (12 | 4.0%), and physical & health sciences (5 | 1.7%) are the most common fields of study among 301 individuals in Sharon who have obtained a bachelor's degree or higher.
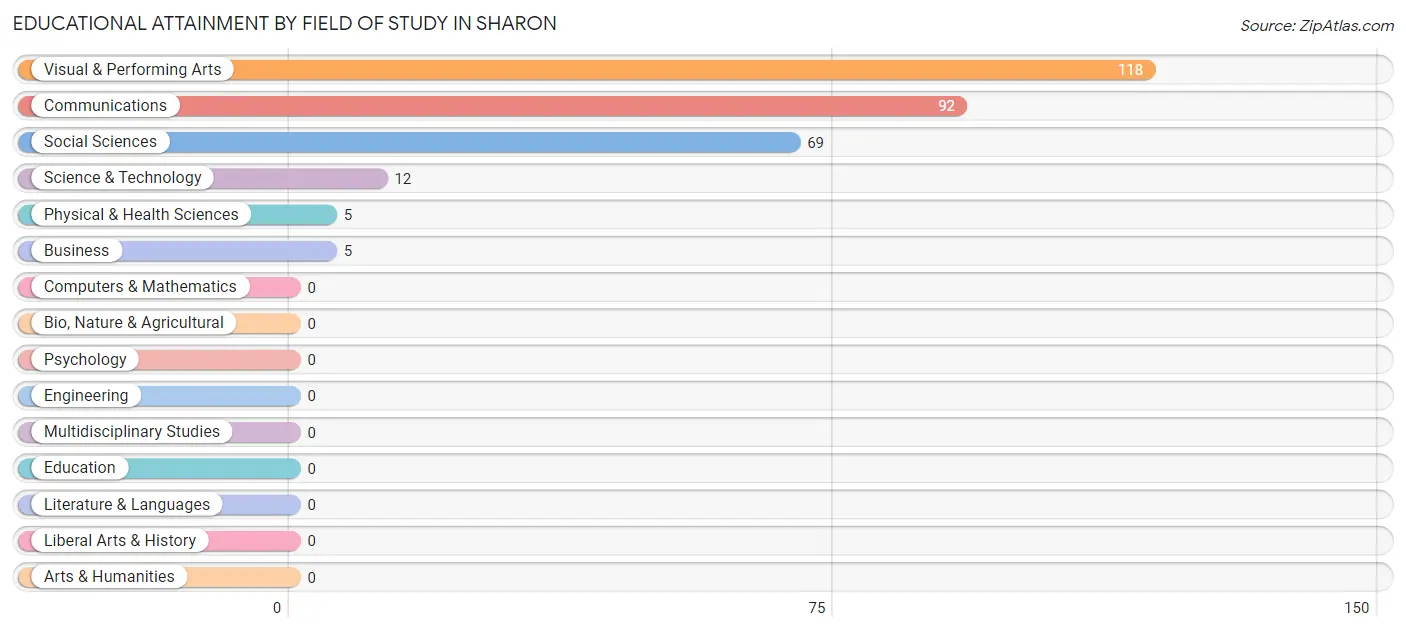
| Field of Study | # Graduates | % Graduates |
| Computers & Mathematics | 0 | 0.0% |
| Bio, Nature & Agricultural | 0 | 0.0% |
| Physical & Health Sciences | 5 | 1.7% |
| Psychology | 0 | 0.0% |
| Social Sciences | 69 | 22.9% |
| Engineering | 0 | 0.0% |
| Multidisciplinary Studies | 0 | 0.0% |
| Science & Technology | 12 | 4.0% |
| Business | 5 | 1.7% |
| Education | 0 | 0.0% |
| Literature & Languages | 0 | 0.0% |
| Liberal Arts & History | 0 | 0.0% |
| Visual & Performing Arts | 118 | 39.2% |
| Communications | 92 | 30.6% |
| Arts & Humanities | 0 | 0.0% |
| Total | 301 | 100.0% |
Transportation & Commute in Sharon
Vehicle Availability by Sex in Sharon
The most prevalent vehicle ownership categories in Sharon are males with 2 vehicles (66, accounting for 63.5%) and females with 2 vehicles (0, making up 69.5%).
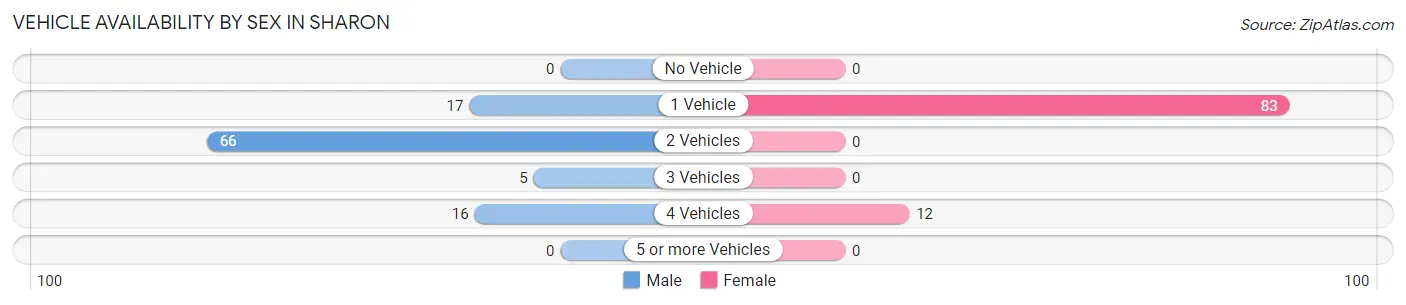
| Vehicles Available | Male | Female |
| No Vehicle | 0 (0.0%) | 0 (0.0%) |
| 1 Vehicle | 17 (16.4%) | 83 (87.4%) |
| 2 Vehicles | 66 (63.5%) | 0 (0.0%) |
| 3 Vehicles | 5 (4.8%) | 0 (0.0%) |
| 4 Vehicles | 16 (15.4%) | 12 (12.6%) |
| 5 or more Vehicles | 0 (0.0%) | 0 (0.0%) |
| Total | 104 (100.0%) | 95 (100.0%) |
Commute Time in Sharon
The most frequently occuring commute durations in Sharon are 5 to 9 minutes (85 commuters, 51.5%), 15 to 19 minutes (37 commuters, 22.4%), and 10 to 14 minutes (28 commuters, 17.0%).
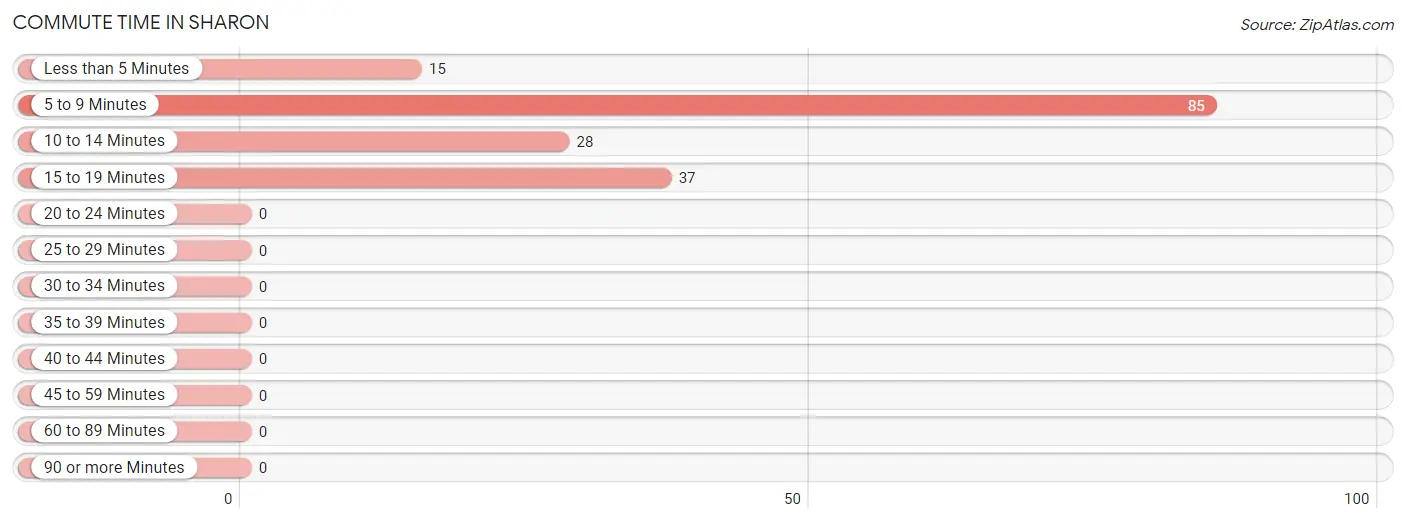
| Commute Time | # Commuters | % Commuters |
| Less than 5 Minutes | 15 | 9.1% |
| 5 to 9 Minutes | 85 | 51.5% |
| 10 to 14 Minutes | 28 | 17.0% |
| 15 to 19 Minutes | 37 | 22.4% |
| 20 to 24 Minutes | 0 | 0.0% |
| 25 to 29 Minutes | 0 | 0.0% |
| 30 to 34 Minutes | 0 | 0.0% |
| 35 to 39 Minutes | 0 | 0.0% |
| 40 to 44 Minutes | 0 | 0.0% |
| 45 to 59 Minutes | 0 | 0.0% |
| 60 to 89 Minutes | 0 | 0.0% |
| 90 or more Minutes | 0 | 0.0% |
Commute Time by Sex in Sharon
The most common commute times in Sharon are 15 to 19 minutes (37 commuters, 52.9%) for males and 5 to 9 minutes (72 commuters, 75.8%) for females.
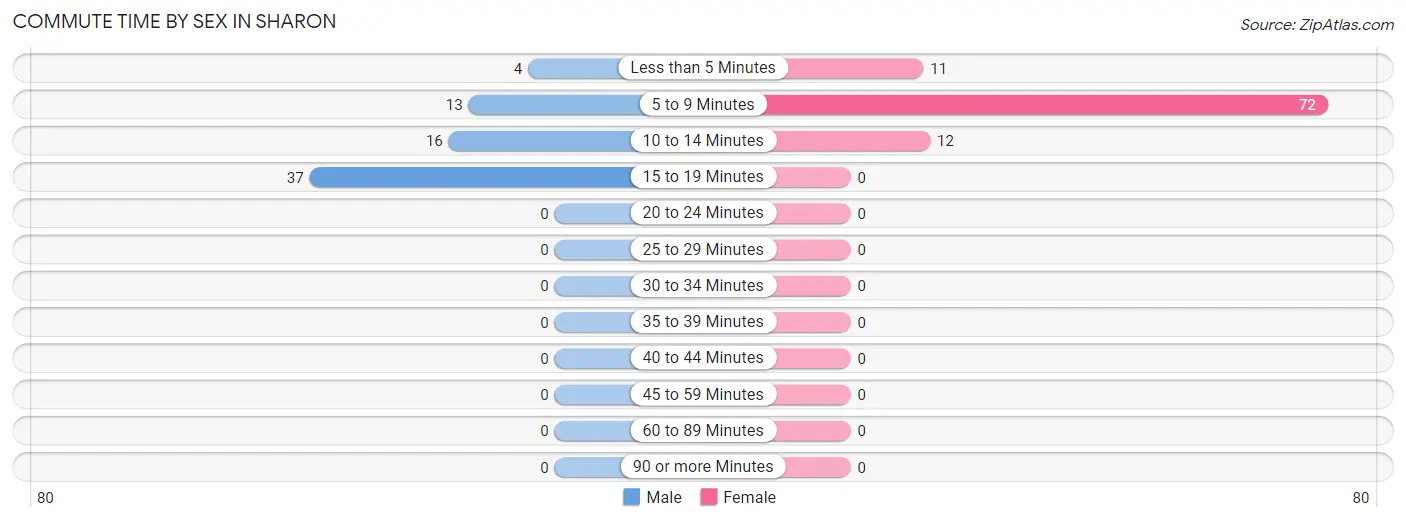
| Commute Time | Male | Female |
| Less than 5 Minutes | 4 (5.7%) | 11 (11.6%) |
| 5 to 9 Minutes | 13 (18.6%) | 72 (75.8%) |
| 10 to 14 Minutes | 16 (22.9%) | 12 (12.6%) |
| 15 to 19 Minutes | 37 (52.9%) | 0 (0.0%) |
| 20 to 24 Minutes | 0 (0.0%) | 0 (0.0%) |
| 25 to 29 Minutes | 0 (0.0%) | 0 (0.0%) |
| 30 to 34 Minutes | 0 (0.0%) | 0 (0.0%) |
| 35 to 39 Minutes | 0 (0.0%) | 0 (0.0%) |
| 40 to 44 Minutes | 0 (0.0%) | 0 (0.0%) |
| 45 to 59 Minutes | 0 (0.0%) | 0 (0.0%) |
| 60 to 89 Minutes | 0 (0.0%) | 0 (0.0%) |
| 90 or more Minutes | 0 (0.0%) | 0 (0.0%) |
Time of Departure to Work by Sex in Sharon
The most frequent times of departure to work in Sharon are 8:00 AM to 8:29 AM (36, 51.4%) for males and 7:30 AM to 7:59 AM (72, 75.8%) for females.
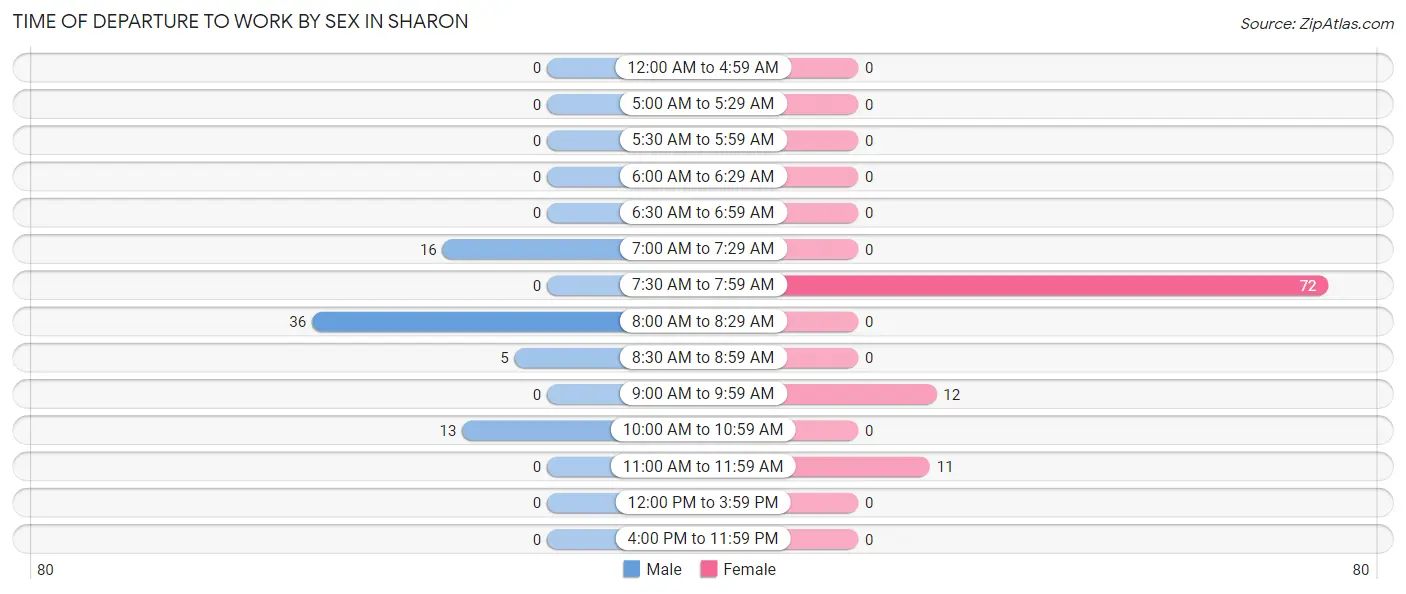
| Time of Departure | Male | Female |
| 12:00 AM to 4:59 AM | 0 (0.0%) | 0 (0.0%) |
| 5:00 AM to 5:29 AM | 0 (0.0%) | 0 (0.0%) |
| 5:30 AM to 5:59 AM | 0 (0.0%) | 0 (0.0%) |
| 6:00 AM to 6:29 AM | 0 (0.0%) | 0 (0.0%) |
| 6:30 AM to 6:59 AM | 0 (0.0%) | 0 (0.0%) |
| 7:00 AM to 7:29 AM | 16 (22.9%) | 0 (0.0%) |
| 7:30 AM to 7:59 AM | 0 (0.0%) | 72 (75.8%) |
| 8:00 AM to 8:29 AM | 36 (51.4%) | 0 (0.0%) |
| 8:30 AM to 8:59 AM | 5 (7.1%) | 0 (0.0%) |
| 9:00 AM to 9:59 AM | 0 (0.0%) | 12 (12.6%) |
| 10:00 AM to 10:59 AM | 13 (18.6%) | 0 (0.0%) |
| 11:00 AM to 11:59 AM | 0 (0.0%) | 11 (11.6%) |
| 12:00 PM to 3:59 PM | 0 (0.0%) | 0 (0.0%) |
| 4:00 PM to 11:59 PM | 0 (0.0%) | 0 (0.0%) |
| Total | 70 (100.0%) | 95 (100.0%) |
Housing Occupancy in Sharon
Occupancy by Ownership in Sharon
Of the total 298 dwellings in Sharon, owner-occupied units account for 189 (63.4%), while renter-occupied units make up 109 (36.6%).
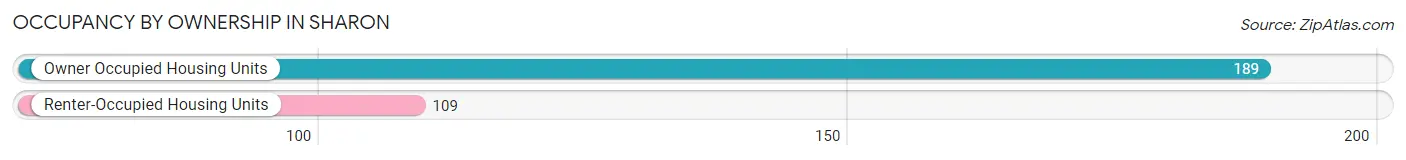
| Occupancy | # Housing Units | % Housing Units |
| Owner Occupied Housing Units | 189 | 63.4% |
| Renter-Occupied Housing Units | 109 | 36.6% |
| Total Occupied Housing Units | 298 | 100.0% |
Occupancy by Household Size in Sharon
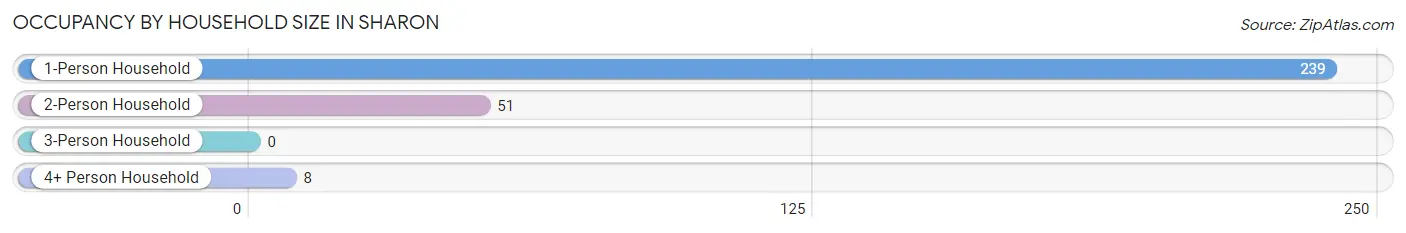
| Household Size | # Housing Units | % Housing Units |
| 1-Person Household | 239 | 80.2% |
| 2-Person Household | 51 | 17.1% |
| 3-Person Household | 0 | 0.0% |
| 4+ Person Household | 8 | 2.7% |
| Total Housing Units | 298 | 100.0% |
Occupancy by Ownership by Household Size in Sharon
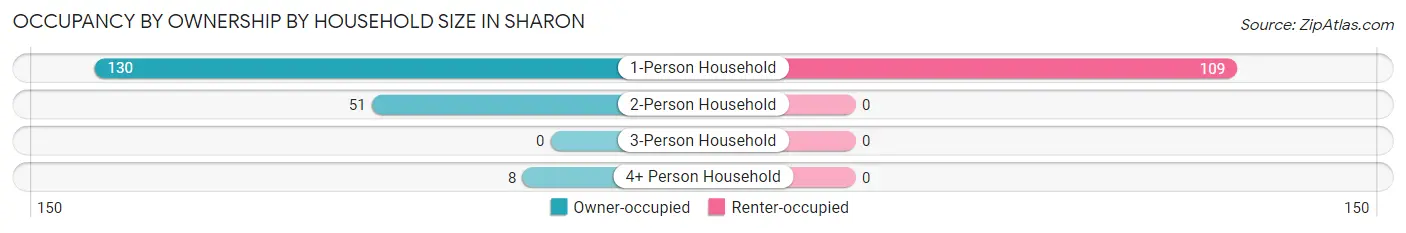
| Household Size | Owner-occupied | Renter-occupied |
| 1-Person Household | 130 (54.4%) | 109 (45.6%) |
| 2-Person Household | 51 (100.0%) | 0 (0.0%) |
| 3-Person Household | 0 (0.0%) | 0 (0.0%) |
| 4+ Person Household | 8 (100.0%) | 0 (0.0%) |
| Total Housing Units | 189 (63.4%) | 109 (36.6%) |
Occupancy by Educational Attainment in Sharon
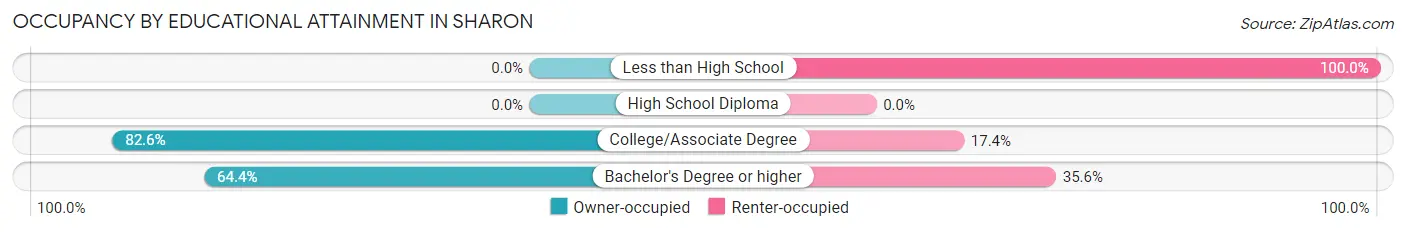
| Household Size | Owner-occupied | Renter-occupied |
| Less than High School | 0 (0.0%) | 11 (100.0%) |
| High School Diploma | 0 (0.0%) | 0 (0.0%) |
| College/Associate Degree | 19 (82.6%) | 4 (17.4%) |
| Bachelor's Degree or higher | 170 (64.4%) | 94 (35.6%) |
Occupancy by Age of Householder in Sharon
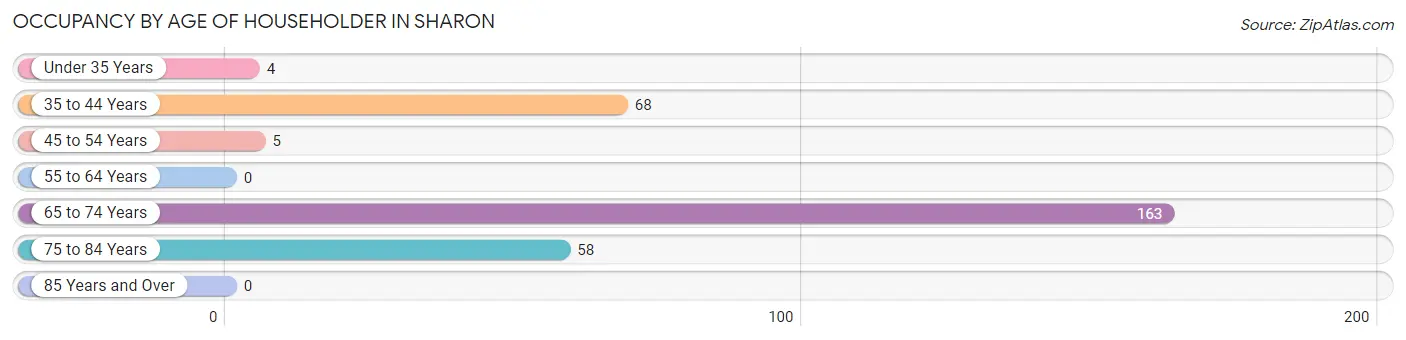
| Age Bracket | # Households | % Households |
| Under 35 Years | 4 | 1.3% |
| 35 to 44 Years | 68 | 22.8% |
| 45 to 54 Years | 5 | 1.7% |
| 55 to 64 Years | 0 | 0.0% |
| 65 to 74 Years | 163 | 54.7% |
| 75 to 84 Years | 58 | 19.5% |
| 85 Years and Over | 0 | 0.0% |
| Total | 298 | 100.0% |
Housing Finances in Sharon
Median Income by Occupancy in Sharon
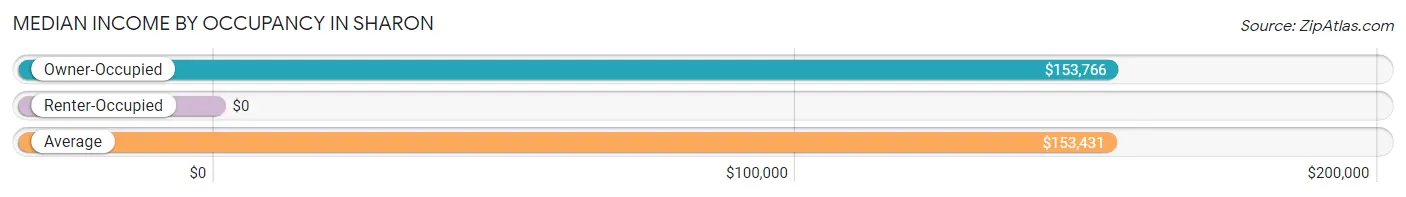
| Occupancy Type | # Households | Median Income |
| Owner-Occupied | 189 (63.4%) | $153,766 |
| Renter-Occupied | 109 (36.6%) | $0 |
| Average | 298 (100.0%) | $153,431 |
Occupancy by Householder Income Bracket in Sharon
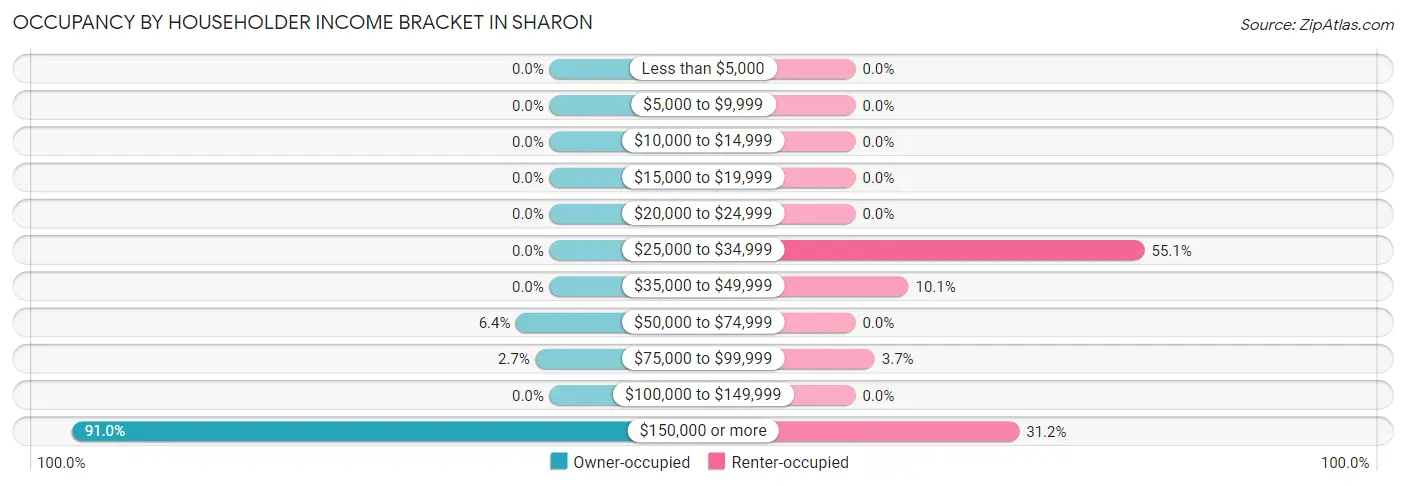
| Income Bracket | Owner-occupied | Renter-occupied |
| Less than $5,000 | 0 (0.0%) | 0 (0.0%) |
| $5,000 to $9,999 | 0 (0.0%) | 0 (0.0%) |
| $10,000 to $14,999 | 0 (0.0%) | 0 (0.0%) |
| $15,000 to $19,999 | 0 (0.0%) | 0 (0.0%) |
| $20,000 to $24,999 | 0 (0.0%) | 0 (0.0%) |
| $25,000 to $34,999 | 0 (0.0%) | 60 (55.0%) |
| $35,000 to $49,999 | 0 (0.0%) | 11 (10.1%) |
| $50,000 to $74,999 | 12 (6.4%) | 0 (0.0%) |
| $75,000 to $99,999 | 5 (2.6%) | 4 (3.7%) |
| $100,000 to $149,999 | 0 (0.0%) | 0 (0.0%) |
| $150,000 or more | 172 (91.0%) | 34 (31.2%) |
| Total | 189 (100.0%) | 109 (100.0%) |
Monthly Housing Cost Tiers in Sharon
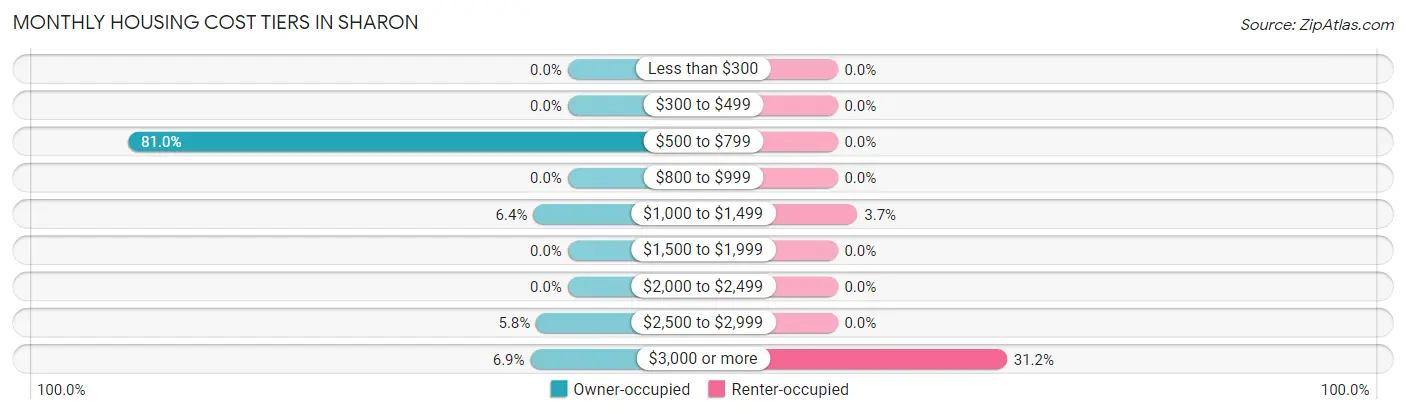
| Monthly Cost | Owner-occupied | Renter-occupied |
| Less than $300 | 0 (0.0%) | 0 (0.0%) |
| $300 to $499 | 0 (0.0%) | 0 (0.0%) |
| $500 to $799 | 153 (80.9%) | 0 (0.0%) |
| $800 to $999 | 0 (0.0%) | 0 (0.0%) |
| $1,000 to $1,499 | 12 (6.4%) | 4 (3.7%) |
| $1,500 to $1,999 | 0 (0.0%) | 0 (0.0%) |
| $2,000 to $2,499 | 0 (0.0%) | 0 (0.0%) |
| $2,500 to $2,999 | 11 (5.8%) | 0 (0.0%) |
| $3,000 or more | 13 (6.9%) | 34 (31.2%) |
| Total | 189 (100.0%) | 109 (100.0%) |
Physical Housing Characteristics in Sharon
Housing Structures in Sharon
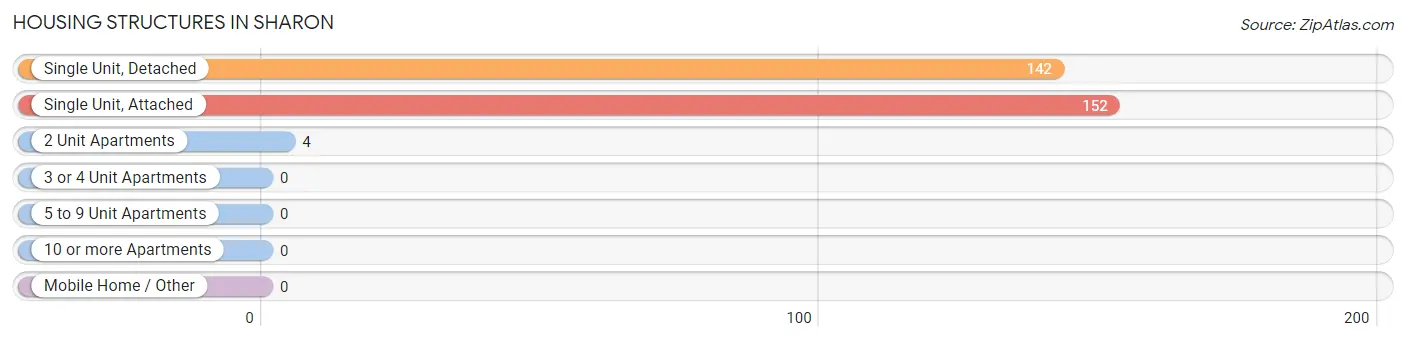
| Structure Type | # Housing Units | % Housing Units |
| Single Unit, Detached | 142 | 47.6% |
| Single Unit, Attached | 152 | 51.0% |
| 2 Unit Apartments | 4 | 1.3% |
| 3 or 4 Unit Apartments | 0 | 0.0% |
| 5 to 9 Unit Apartments | 0 | 0.0% |
| 10 or more Apartments | 0 | 0.0% |
| Mobile Home / Other | 0 | 0.0% |
| Total | 298 | 100.0% |
Housing Structures by Occupancy in Sharon
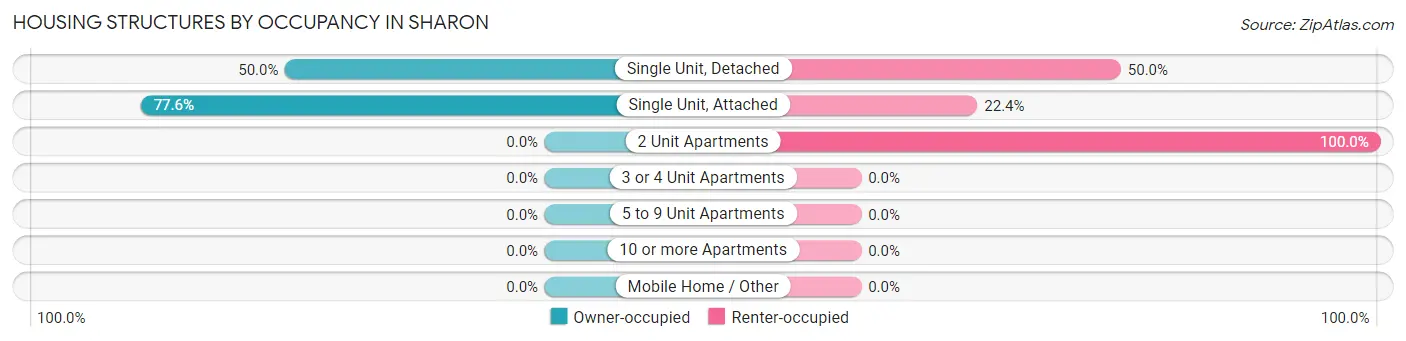
| Structure Type | Owner-occupied | Renter-occupied |
| Single Unit, Detached | 71 (50.0%) | 71 (50.0%) |
| Single Unit, Attached | 118 (77.6%) | 34 (22.4%) |
| 2 Unit Apartments | 0 (0.0%) | 4 (100.0%) |
| 3 or 4 Unit Apartments | 0 (0.0%) | 0 (0.0%) |
| 5 to 9 Unit Apartments | 0 (0.0%) | 0 (0.0%) |
| 10 or more Apartments | 0 (0.0%) | 0 (0.0%) |
| Mobile Home / Other | 0 (0.0%) | 0 (0.0%) |
| Total | 189 (63.4%) | 109 (36.6%) |
Housing Structures by Number of Rooms in Sharon
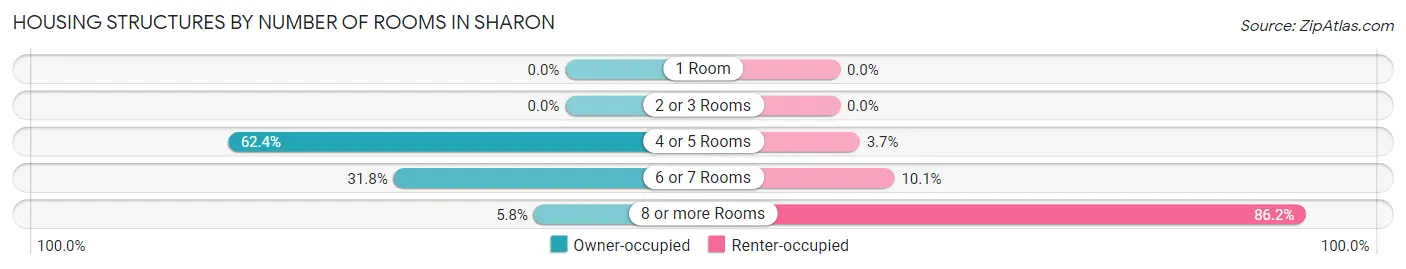
| Number of Rooms | Owner-occupied | Renter-occupied |
| 1 Room | 0 (0.0%) | 0 (0.0%) |
| 2 or 3 Rooms | 0 (0.0%) | 0 (0.0%) |
| 4 or 5 Rooms | 118 (62.4%) | 4 (3.7%) |
| 6 or 7 Rooms | 60 (31.8%) | 11 (10.1%) |
| 8 or more Rooms | 11 (5.8%) | 94 (86.2%) |
| Total | 189 (100.0%) | 109 (100.0%) |
Housing Structure by Heating Type in Sharon
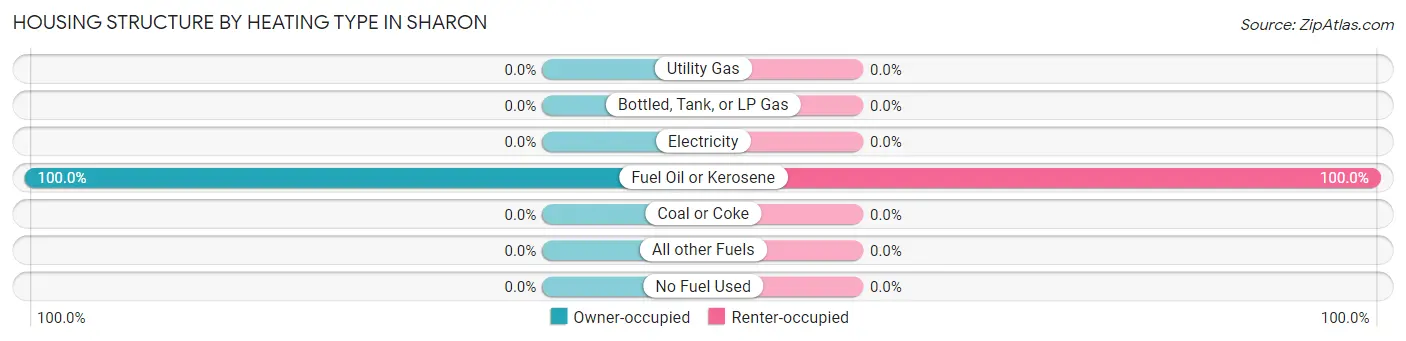
| Heating Type | Owner-occupied | Renter-occupied |
| Utility Gas | 0 (0.0%) | 0 (0.0%) |
| Bottled, Tank, or LP Gas | 0 (0.0%) | 0 (0.0%) |
| Electricity | 0 (0.0%) | 0 (0.0%) |
| Fuel Oil or Kerosene | 189 (100.0%) | 109 (100.0%) |
| Coal or Coke | 0 (0.0%) | 0 (0.0%) |
| All other Fuels | 0 (0.0%) | 0 (0.0%) |
| No Fuel Used | 0 (0.0%) | 0 (0.0%) |
| Total | 189 (100.0%) | 109 (100.0%) |
Household Vehicle Usage in Sharon
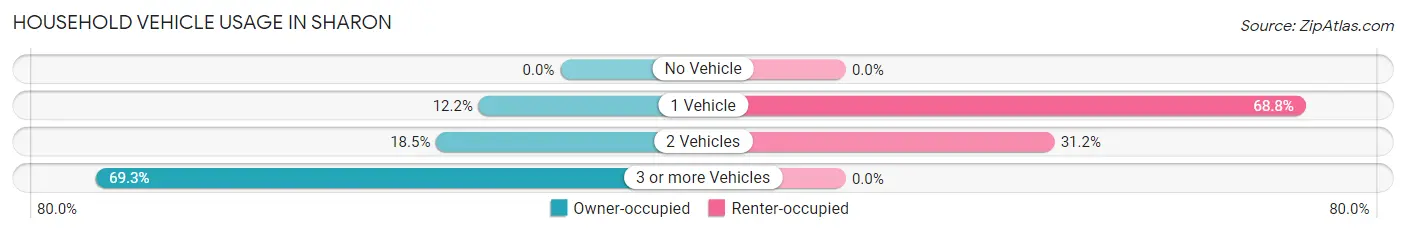
| Vehicles per Household | Owner-occupied | Renter-occupied |
| No Vehicle | 0 (0.0%) | 0 (0.0%) |
| 1 Vehicle | 23 (12.2%) | 75 (68.8%) |
| 2 Vehicles | 35 (18.5%) | 34 (31.2%) |
| 3 or more Vehicles | 131 (69.3%) | 0 (0.0%) |
| Total | 189 (100.0%) | 109 (100.0%) |
Real Estate & Mortgages in Sharon
Real Estate and Mortgage Overview in Sharon
| Characteristic | Without Mortgage | With Mortgage |
| Housing Units | 118 | 71 |
| Median Property Value | - | - |
| Median Household Income | - | - |
| Monthly Housing Costs | - | - |
| Real Estate Taxes | - | - |
Property Value by Mortgage Status in Sharon
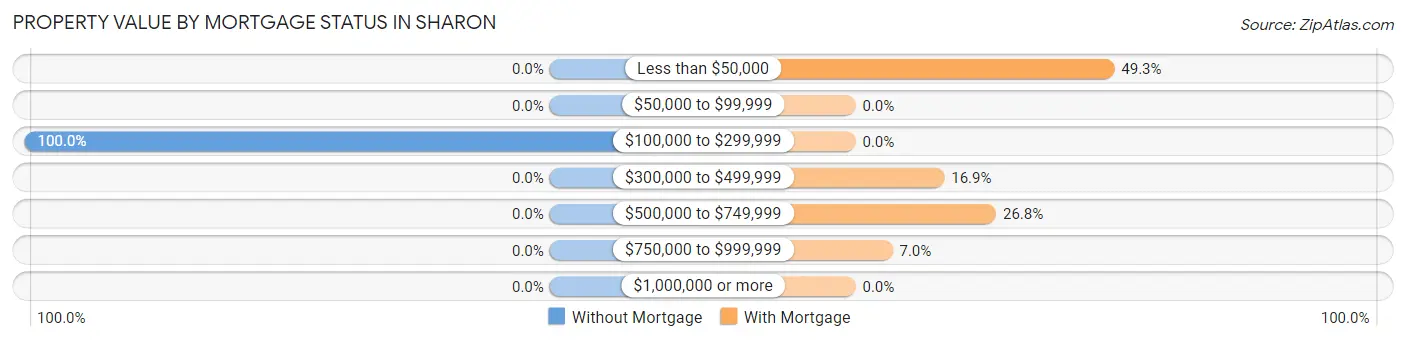
| Property Value | Without Mortgage | With Mortgage |
| Less than $50,000 | 0 (0.0%) | 35 (49.3%) |
| $50,000 to $99,999 | 0 (0.0%) | 0 (0.0%) |
| $100,000 to $299,999 | 118 (100.0%) | 0 (0.0%) |
| $300,000 to $499,999 | 0 (0.0%) | 12 (16.9%) |
| $500,000 to $749,999 | 0 (0.0%) | 19 (26.8%) |
| $750,000 to $999,999 | 0 (0.0%) | 5 (7.0%) |
| $1,000,000 or more | 0 (0.0%) | 0 (0.0%) |
| Total | 118 (100.0%) | 71 (100.0%) |
Household Income by Mortgage Status in Sharon
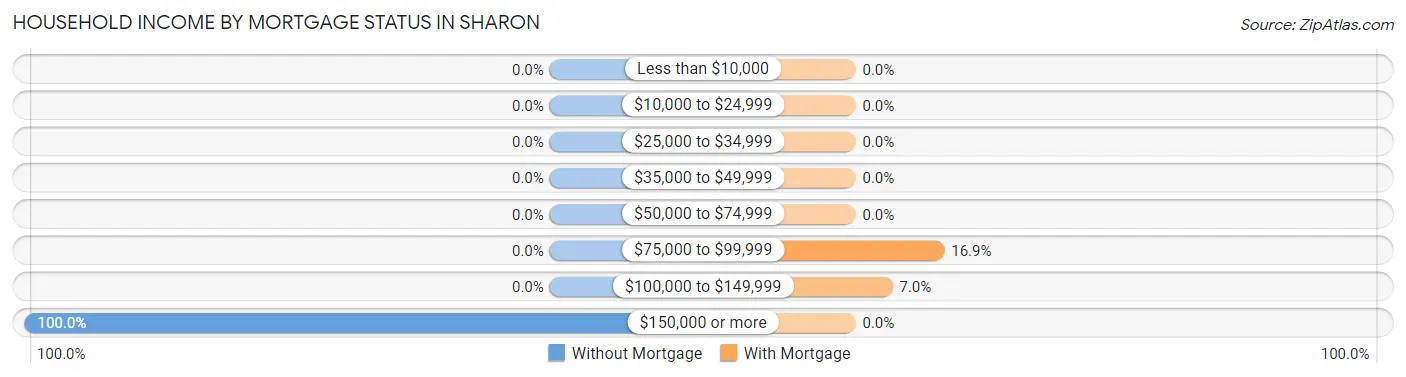
| Household Income | Without Mortgage | With Mortgage |
| Less than $10,000 | 0 (0.0%) | 0 (0.0%) |
| $10,000 to $24,999 | 0 (0.0%) | 0 (0.0%) |
| $25,000 to $34,999 | 0 (0.0%) | 0 (0.0%) |
| $35,000 to $49,999 | 0 (0.0%) | 0 (0.0%) |
| $50,000 to $74,999 | 0 (0.0%) | 0 (0.0%) |
| $75,000 to $99,999 | 0 (0.0%) | 12 (16.9%) |
| $100,000 to $149,999 | 0 (0.0%) | 5 (7.0%) |
| $150,000 or more | 118 (100.0%) | 0 (0.0%) |
| Total | 118 (100.0%) | 71 (100.0%) |
Property Value to Household Income Ratio in Sharon
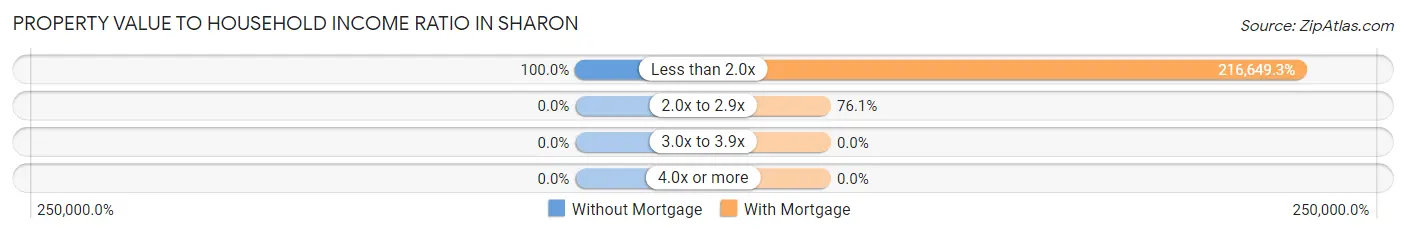
| Value-to-Income Ratio | Without Mortgage | With Mortgage |
| Less than 2.0x | 118 (100.0%) | 153,821 (216,649.3%) |
| 2.0x to 2.9x | 0 (0.0%) | 54 (76.1%) |
| 3.0x to 3.9x | 0 (0.0%) | 0 (0.0%) |
| 4.0x or more | 0 (0.0%) | 0 (0.0%) |
| Total | 118 (100.0%) | 71 (100.0%) |
Real Estate Taxes by Mortgage Status in Sharon
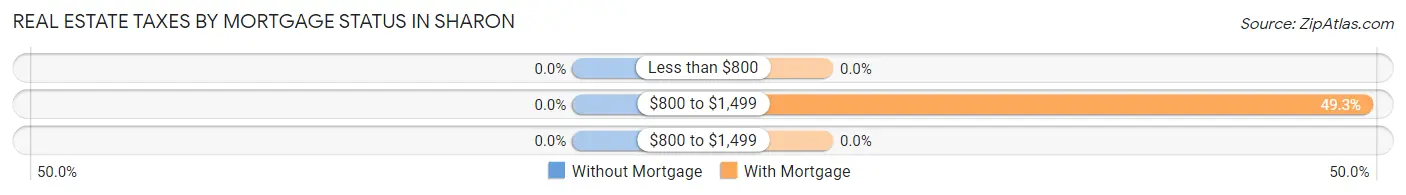
| Property Taxes | Without Mortgage | With Mortgage |
| Less than $800 | 0 (0.0%) | 0 (0.0%) |
| $800 to $1,499 | 0 (0.0%) | 35 (49.3%) |
| $800 to $1,499 | 0 (0.0%) | 0 (0.0%) |
| Total | 118 (100.0%) | 71 (100.0%) |
Health & Disability in Sharon
Health Insurance Coverage by Age in Sharon
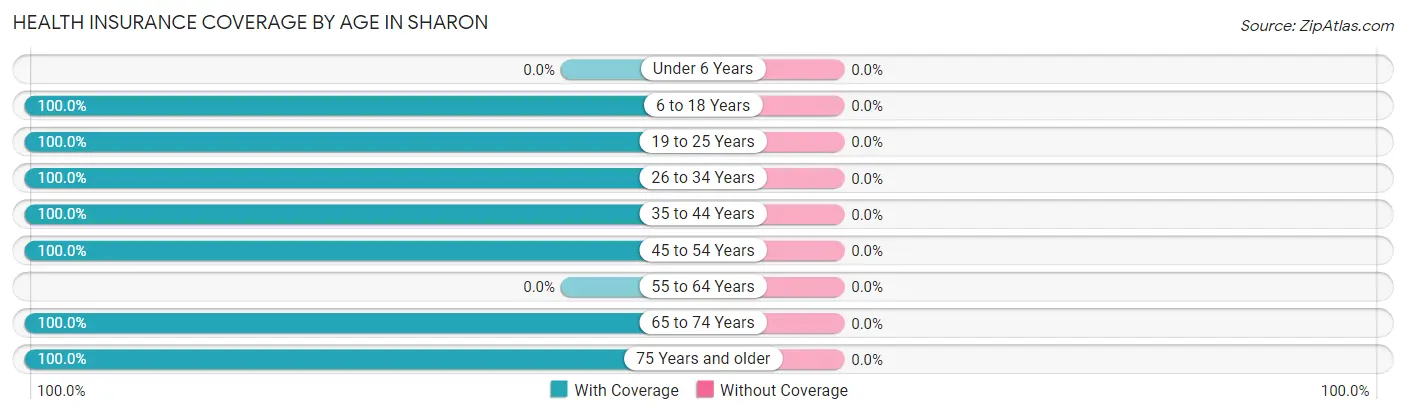
| Age Bracket | With Coverage | Without Coverage |
| Under 6 Years | 0 (0.0%) | 0 (0.0%) |
| 6 to 18 Years | 9 (100.0%) | 0 (0.0%) |
| 19 to 25 Years | 21 (100.0%) | 0 (0.0%) |
| 26 to 34 Years | 4 (100.0%) | 0 (0.0%) |
| 35 to 44 Years | 88 (100.0%) | 0 (0.0%) |
| 45 to 54 Years | 10 (100.0%) | 0 (0.0%) |
| 55 to 64 Years | 0 (0.0%) | 0 (0.0%) |
| 65 to 74 Years | 195 (100.0%) | 0 (0.0%) |
| 75 Years and older | 58 (100.0%) | 0 (0.0%) |
| Total | 385 (100.0%) | 0 (0.0%) |
Health Insurance Coverage by Citizenship Status in Sharon
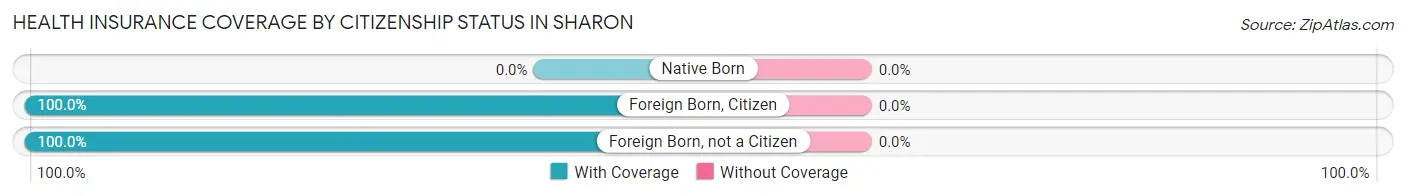
| Citizenship Status | With Coverage | Without Coverage |
| Native Born | 0 (0.0%) | 0 (0.0%) |
| Foreign Born, Citizen | 9 (100.0%) | 0 (0.0%) |
| Foreign Born, not a Citizen | 21 (100.0%) | 0 (0.0%) |
Health Insurance Coverage by Household Income in Sharon
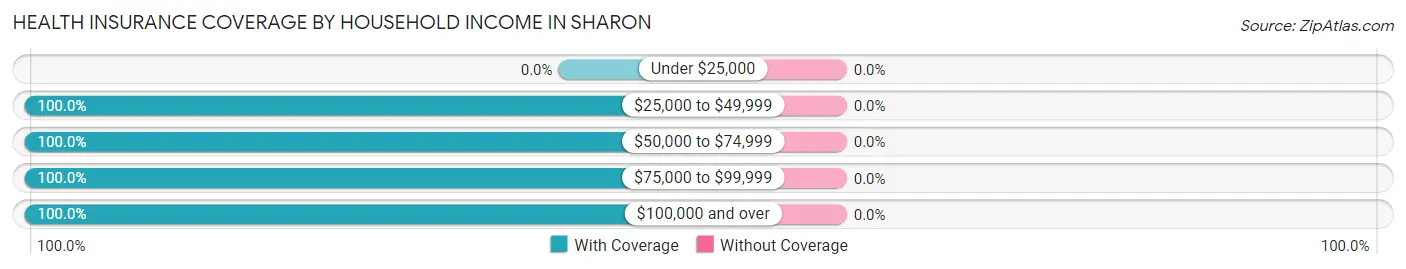
| Household Income | With Coverage | Without Coverage |
| Under $25,000 | 0 (0.0%) | 0 (0.0%) |
| $25,000 to $49,999 | 71 (100.0%) | 0 (0.0%) |
| $50,000 to $74,999 | 12 (100.0%) | 0 (0.0%) |
| $75,000 to $99,999 | 14 (100.0%) | 0 (0.0%) |
| $100,000 and over | 288 (100.0%) | 0 (0.0%) |
Public vs Private Health Insurance Coverage by Age in Sharon
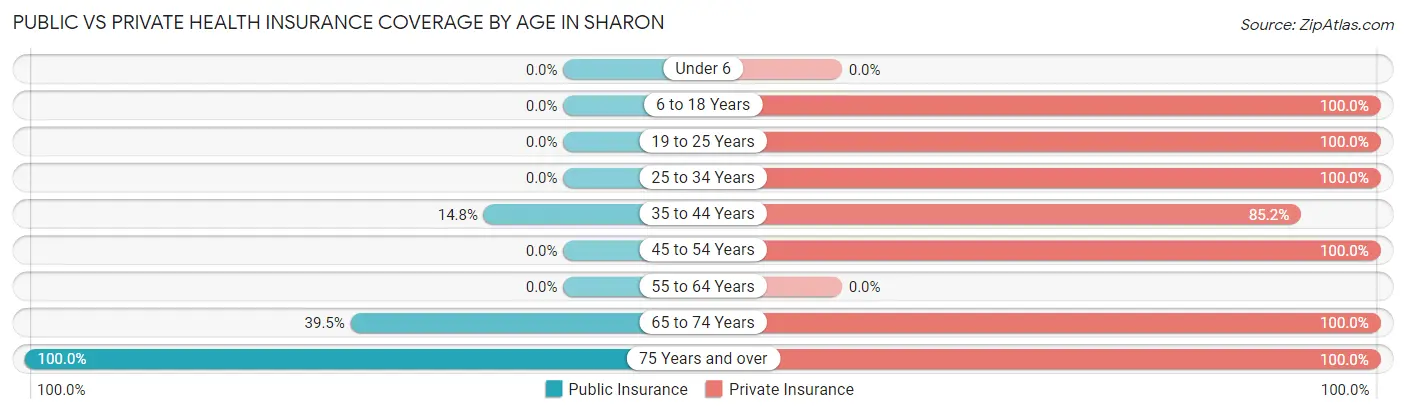
| Age Bracket | Public Insurance | Private Insurance |
| Under 6 | 0 (0.0%) | 0 (0.0%) |
| 6 to 18 Years | 0 (0.0%) | 9 (100.0%) |
| 19 to 25 Years | 0 (0.0%) | 21 (100.0%) |
| 25 to 34 Years | 0 (0.0%) | 4 (100.0%) |
| 35 to 44 Years | 13 (14.8%) | 75 (85.2%) |
| 45 to 54 Years | 0 (0.0%) | 10 (100.0%) |
| 55 to 64 Years | 0 (0.0%) | 0 (0.0%) |
| 65 to 74 Years | 77 (39.5%) | 195 (100.0%) |
| 75 Years and over | 58 (100.0%) | 58 (100.0%) |
| Total | 148 (38.4%) | 372 (96.6%) |
Disability Status by Sex by Age in Sharon
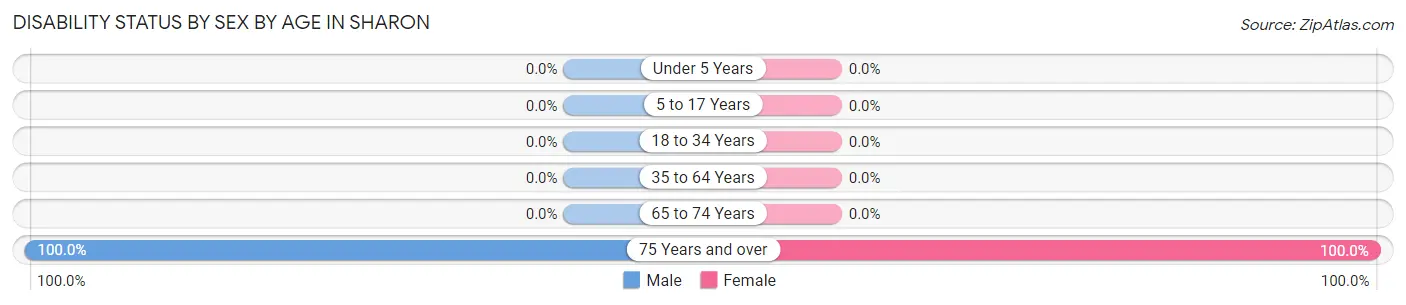
| Age Bracket | Male | Female |
| Under 5 Years | 0 (0.0%) | 0 (0.0%) |
| 5 to 17 Years | 0 (0.0%) | 0 (0.0%) |
| 18 to 34 Years | 0 (0.0%) | 0 (0.0%) |
| 35 to 64 Years | 0 (0.0%) | 0 (0.0%) |
| 65 to 74 Years | 0 (0.0%) | 0 (0.0%) |
| 75 Years and over | 35 (100.0%) | 23 (100.0%) |
Disability Class by Sex by Age in Sharon
Disability Class: Hearing Difficulty
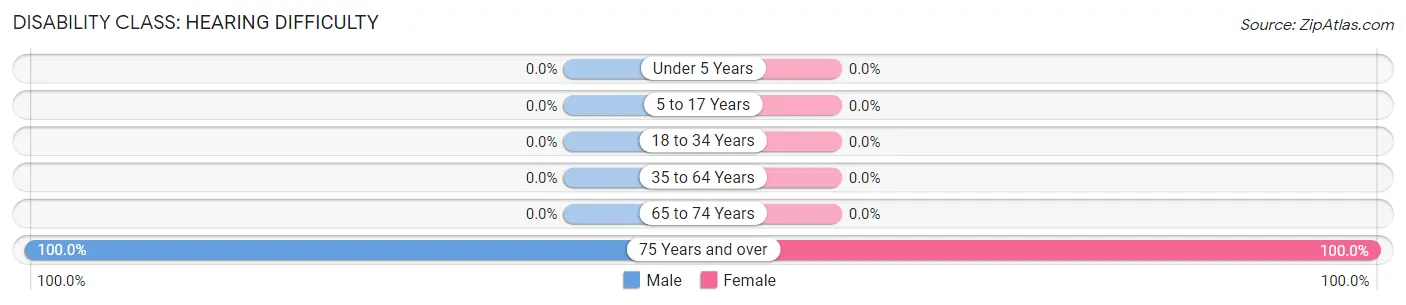
| Age Bracket | Male | Female |
| Under 5 Years | 0 (0.0%) | 0 (0.0%) |
| 5 to 17 Years | 0 (0.0%) | 0 (0.0%) |
| 18 to 34 Years | 0 (0.0%) | 0 (0.0%) |
| 35 to 64 Years | 0 (0.0%) | 0 (0.0%) |
| 65 to 74 Years | 0 (0.0%) | 0 (0.0%) |
| 75 Years and over | 35 (100.0%) | 23 (100.0%) |
Disability Class: Vision Difficulty
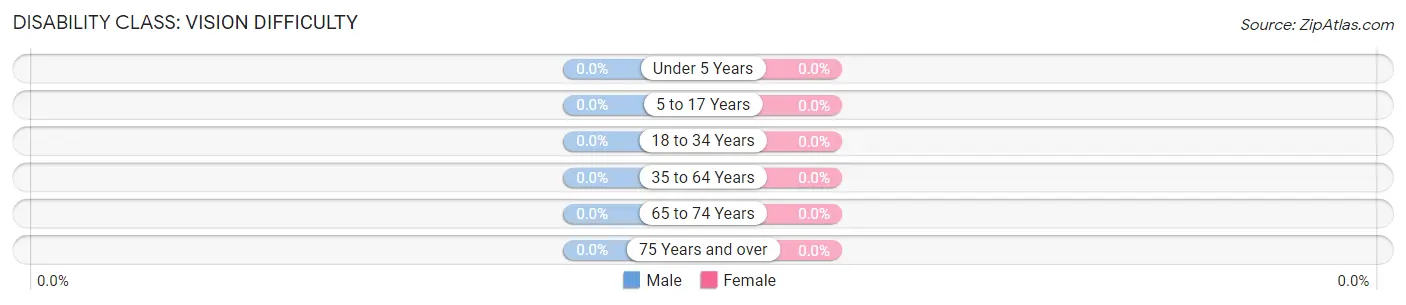
| Age Bracket | Male | Female |
| Under 5 Years | 0 (0.0%) | 0 (0.0%) |
| 5 to 17 Years | 0 (0.0%) | 0 (0.0%) |
| 18 to 34 Years | 0 (0.0%) | 0 (0.0%) |
| 35 to 64 Years | 0 (0.0%) | 0 (0.0%) |
| 65 to 74 Years | 0 (0.0%) | 0 (0.0%) |
| 75 Years and over | 0 (0.0%) | 0 (0.0%) |
Disability Class: Cognitive Difficulty
| Age Bracket | Male | Female |
| 5 to 17 Years | 0 (0.0%) | 0 (0.0%) |
| 18 to 34 Years | 0 (0.0%) | 0 (0.0%) |
| 35 to 64 Years | 0 (0.0%) | 0 (0.0%) |
| 65 to 74 Years | 0 (0.0%) | 0 (0.0%) |
| 75 Years and over | 0 (0.0%) | 0 (0.0%) |
Disability Class: Ambulatory Difficulty
| Age Bracket | Male | Female |
| 5 to 17 Years | 0 (0.0%) | 0 (0.0%) |
| 18 to 34 Years | 0 (0.0%) | 0 (0.0%) |
| 35 to 64 Years | 0 (0.0%) | 0 (0.0%) |
| 65 to 74 Years | 0 (0.0%) | 0 (0.0%) |
| 75 Years and over | 0 (0.0%) | 0 (0.0%) |
Disability Class: Self-Care Difficulty
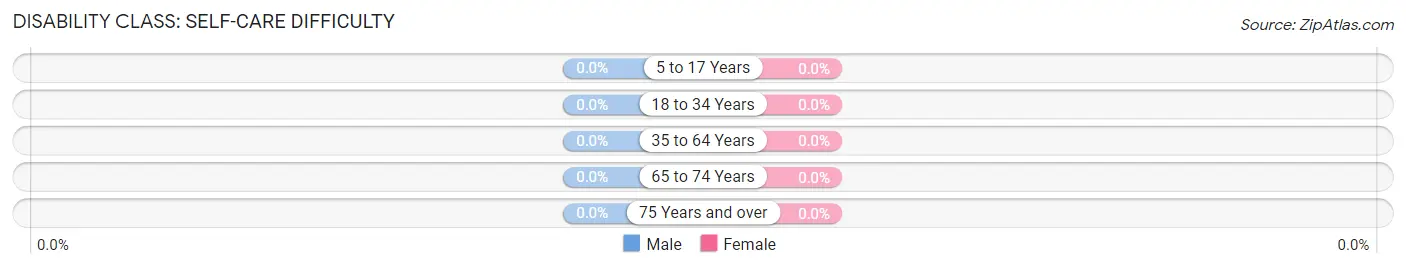
| Age Bracket | Male | Female |
| 5 to 17 Years | 0 (0.0%) | 0 (0.0%) |
| 18 to 34 Years | 0 (0.0%) | 0 (0.0%) |
| 35 to 64 Years | 0 (0.0%) | 0 (0.0%) |
| 65 to 74 Years | 0 (0.0%) | 0 (0.0%) |
| 75 Years and over | 0 (0.0%) | 0 (0.0%) |
Technology Access in Sharon
Computing Device Access in Sharon
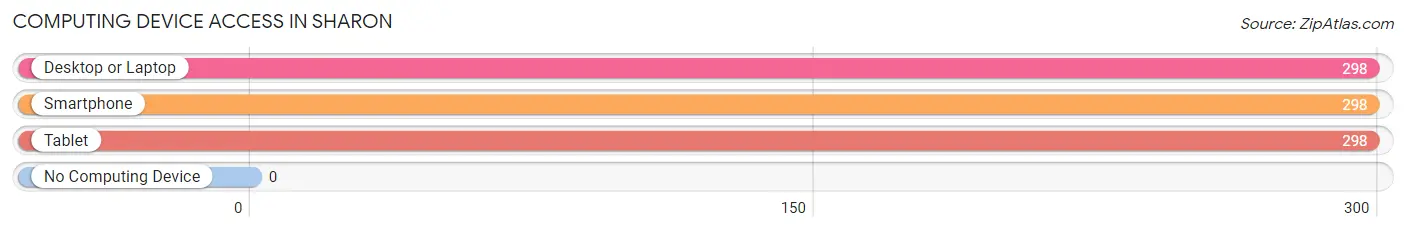
| Device Type | # Households | % Households |
| Desktop or Laptop | 298 | 100.0% |
| Smartphone | 298 | 100.0% |
| Tablet | 298 | 100.0% |
| No Computing Device | 0 | 0.0% |
| Total | 298 | 100.0% |
Internet Access in Sharon
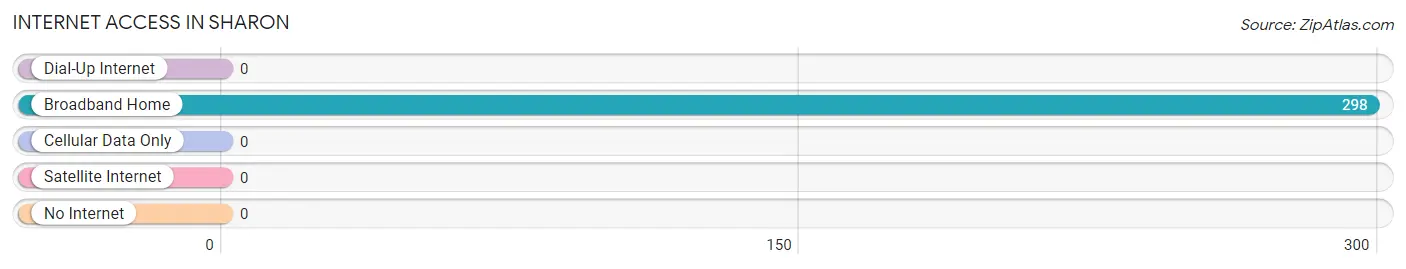
| Internet Type | # Households | % Households |
| Dial-Up Internet | 0 | 0.0% |
| Broadband Home | 298 | 100.0% |
| Cellular Data Only | 0 | 0.0% |
| Satellite Internet | 0 | 0.0% |
| No Internet | 0 | 0.0% |
| Total | 298 | 100.0% |
Sharon Summary
Sharon, Connecticut is a small town located in the northwest corner of the state, bordering New York and Massachusetts. It is part of the Litchfield Hills region of the state and is known for its rural charm and natural beauty. The town was founded in 1739 and has a population of 2,743 as of the 2010 census.
Geography
Sharon is located in the northwest corner of Connecticut, bordering New York and Massachusetts. It is part of the Litchfield Hills region of the state and is known for its rural charm and natural beauty. The town is situated in the Housatonic River Valley and is surrounded by rolling hills and forests. The town covers an area of 24.3 square miles and is home to several lakes, including Lake Wononscopomuc, Lake Washinee, and Lake Wononpakook.
History
Sharon was founded in 1739 and was originally part of the town of Kent. It was incorporated as a separate town in 1739 and was named after the biblical city of Sharon. The town was originally a farming community and was known for its dairy farms and apple orchards. In the 19th century, the town became a popular summer resort destination for wealthy New Yorkers. The town was also home to several factories, including a paper mill, a woolen mill, and a sawmill.
Economy
Sharon’s economy is largely based on tourism and agriculture. The town is home to several farms, including dairy farms, apple orchards, and vegetable farms. The town is also home to several small businesses, including restaurants, shops, and galleries. The town is also home to several large employers, including Sharon Hospital, Sharon Country Club, and Sharon Manufacturing.
Demographics
As of the 2010 census, Sharon had a population of 2,743. The racial makeup of the town was 94.3% White, 1.2% African American, 0.3% Native American, 1.2% Asian, 0.1% Pacific Islander, 1.2% from other races, and 1.9% from two or more races. The median household income was $68,750 and the median family income was $77,917. The per capita income was $35,945.
Sharon is a small town with a rich history and a unique culture. It is known for its rural charm and natural beauty, and is home to several farms, businesses, and employers. The town has a diverse population and a strong economy, and is a great place to live and work.
Common Questions
What is Per Capita Income in Sharon?
Per Capita income in Sharon is $136,692.
What is the Median Family Income in Sharon?
Median Family Income in Sharon is $250,001.
What is the Median Household income in Sharon?
Median Household Income in Sharon is $153,431.
What is Inequality or Gini Index in Sharon?
Inequality or Gini Index in Sharon is 0.43.
What is the Total Population of Sharon?
Total Population of Sharon is 403.
What is the Total Male Population of Sharon?
Total Male Population of Sharon is 148.
What is the Total Female Population of Sharon?
Total Female Population of Sharon is 255.
What is the Ratio of Males per 100 Females in Sharon?
There are 58.04 Males per 100 Females in Sharon.
What is the Ratio of Females per 100 Males in Sharon?
There are 172.30 Females per 100 Males in Sharon.
What is the Median Population Age in Sharon?
Median Population Age in Sharon is 68.4 Years.
What is the Average Family Size in Sharon
Average Family Size in Sharon is 3.3 People.
What is the Average Household Size in Sharon
Average Household Size in Sharon is 1.3 People.
How Large is the Labor Force in Sharon?
There are 204 People in the Labor Forcein in Sharon.
What is the Percentage of People in the Labor Force in Sharon?
50.6% of People are in the Labor Force in Sharon.
What is the Unemployment Rate in Sharon?
Unemployment Rate in Sharon is 2.5%.