Thompsonville, CT Map & Demographics
Thompsonville Map
Thompsonville Overview
$32,465
PER CAPITA INCOME
$76,750
AVG FAMILY INCOME
$57,662
AVG HOUSEHOLD INCOME
25.9%
WAGE / INCOME GAP [ % ]
74.1¢/ $1
WAGE / INCOME GAP [ $ ]
0.51
INEQUALITY / GINI INDEX
8,097
TOTAL POPULATION
4,098
MALE POPULATION
3,999
FEMALE POPULATION
102.48
MALES / 100 FEMALES
97.58
FEMALES / 100 MALES
35.0
MEDIAN AGE
3.3
AVG FAMILY SIZE
2.4
AVG HOUSEHOLD SIZE
4,100
LABOR FORCE [ PEOPLE ]
66.1%
PERCENT IN LABOR FORCE
17.5%
UNEMPLOYMENT RATE
Income in Thompsonville
Income Overview in Thompsonville
Per Capita Income in Thompsonville is $32,465, while median incomes of families and households are $76,750 and $57,662 respectively.
| Characteristic | Number | Measure |
| Per Capita Income | 8,097 | $32,465 |
| Median Family Income | 1,687 | $76,750 |
| Mean Family Income | 1,687 | $96,329 |
| Median Household Income | 3,261 | $57,662 |
| Mean Household Income | 3,261 | $77,429 |
| Income Deficit | 1,687 | $0 |
| Wage / Income Gap (%) | 8,097 | 25.85% |
| Wage / Income Gap ($) | 8,097 | 74.15¢ per $1 |
| Gini / Inequality Index | 8,097 | 0.51 |
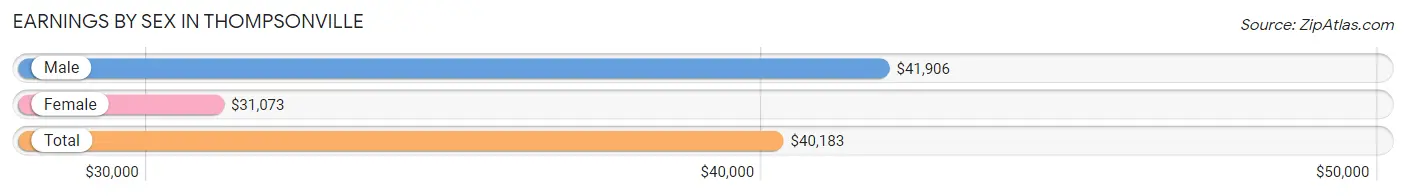
Earnings by Sex in Thompsonville
Average Earnings in Thompsonville are $40,183, $41,906 for men and $31,073 for women, a difference of 25.9%.
| Sex | Number | Average Earnings |
| Male | 2,112 (52.7%) | $41,906 |
| Female | 1,893 (47.3%) | $31,073 |
| Total | 4,005 (100.0%) | $40,183 |
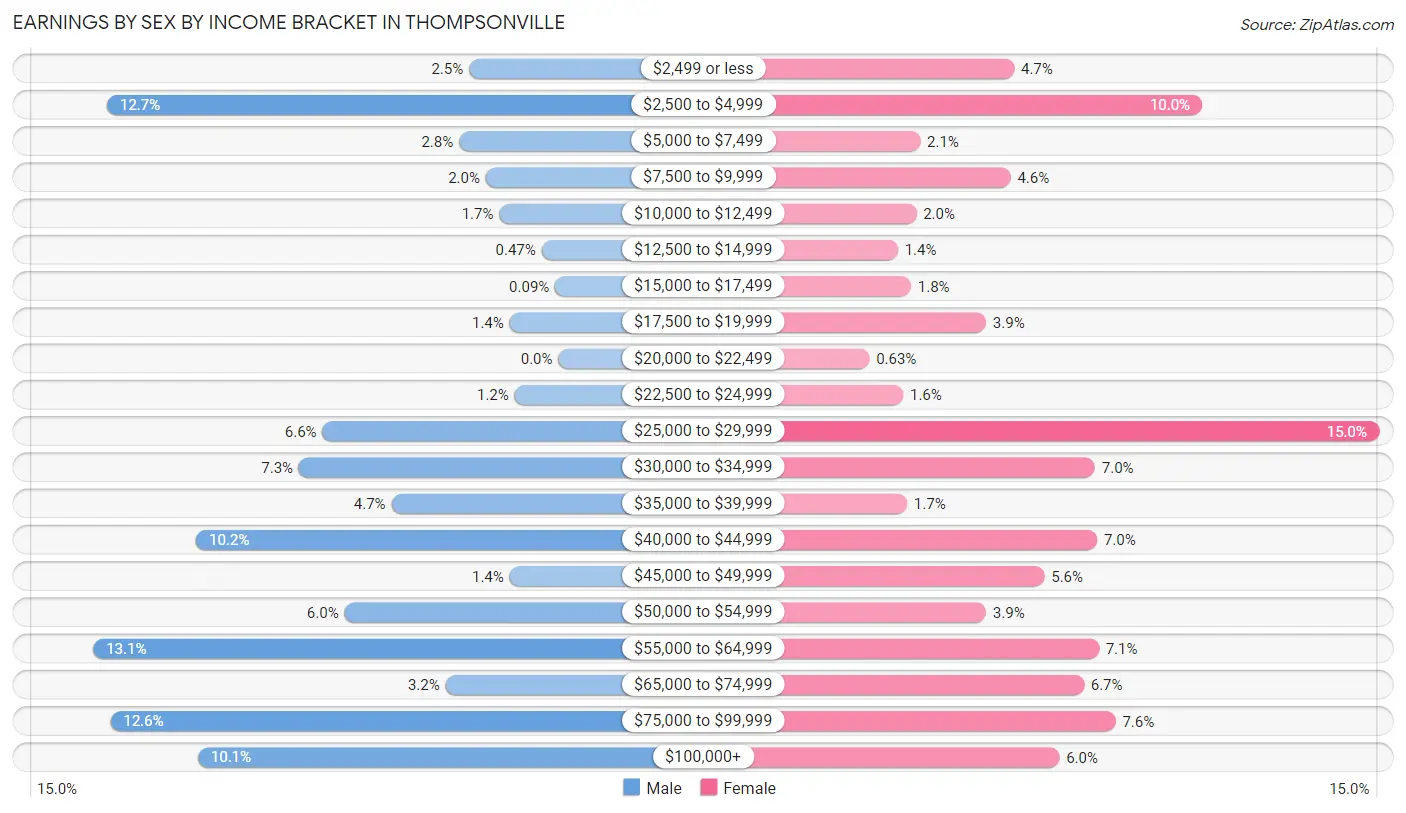
Earnings by Sex by Income Bracket in Thompsonville
The most common earnings brackets in Thompsonville are $55,000 to $64,999 for men (276 | 13.1%) and $25,000 to $29,999 for women (283 | 14.9%).
| Income | Male | Female |
| $2,499 or less | 53 (2.5%) | 89 (4.7%) |
| $2,500 to $4,999 | 268 (12.7%) | 189 (10.0%) |
| $5,000 to $7,499 | 59 (2.8%) | 39 (2.1%) |
| $7,500 to $9,999 | 43 (2.0%) | 87 (4.6%) |
| $10,000 to $12,499 | 35 (1.7%) | 37 (1.9%) |
| $12,500 to $14,999 | 10 (0.5%) | 27 (1.4%) |
| $15,000 to $17,499 | 2 (0.1%) | 34 (1.8%) |
| $17,500 to $19,999 | 29 (1.4%) | 74 (3.9%) |
| $20,000 to $22,499 | 0 (0.0%) | 12 (0.6%) |
| $22,500 to $24,999 | 26 (1.2%) | 30 (1.6%) |
| $25,000 to $29,999 | 140 (6.6%) | 283 (14.9%) |
| $30,000 to $34,999 | 154 (7.3%) | 132 (7.0%) |
| $35,000 to $39,999 | 99 (4.7%) | 32 (1.7%) |
| $40,000 to $44,999 | 215 (10.2%) | 133 (7.0%) |
| $45,000 to $49,999 | 29 (1.4%) | 105 (5.6%) |
| $50,000 to $54,999 | 127 (6.0%) | 74 (3.9%) |
| $55,000 to $64,999 | 276 (13.1%) | 134 (7.1%) |
| $65,000 to $74,999 | 67 (3.2%) | 126 (6.7%) |
| $75,000 to $99,999 | 266 (12.6%) | 143 (7.5%) |
| $100,000+ | 214 (10.1%) | 113 (6.0%) |
| Total | 2,112 (100.0%) | 1,893 (100.0%) |
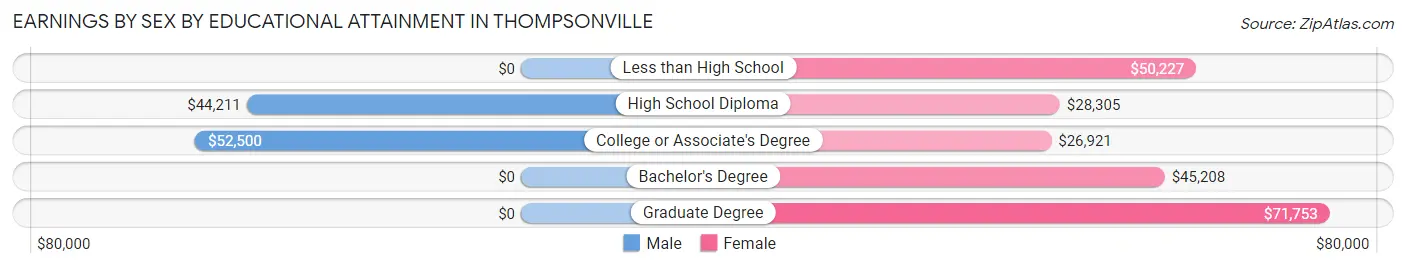
Earnings by Sex by Educational Attainment in Thompsonville
Average earnings in Thompsonville are $47,000 for men and $33,990 for women, a difference of 27.7%. Men with an educational attainment of college or associate's degree enjoy the highest average annual earnings of $52,500, while those with high school diploma education earn the least with $44,211. Women with an educational attainment of graduate degree earn the most with the average annual earnings of $71,753, while those with college or associate's degree education have the smallest earnings of $26,921.
| Educational Attainment | Male Income | Female Income |
| Less than High School | - | - |
| High School Diploma | $44,211 | $28,305 |
| College or Associate's Degree | $52,500 | $26,921 |
| Bachelor's Degree | - | - |
| Graduate Degree | - | - |
| Total | $47,000 | $33,990 |
Family Income in Thompsonville
Family Income Brackets in Thompsonville
According to the Thompsonville family income data, there are 353 families falling into the $100,000 to $149,999 income range, which is the most common income bracket and makes up 20.9% of all families. Conversely, the $10,000 to $14,999 income bracket is the least frequent group with only 13 families (0.8%) belonging to this category.
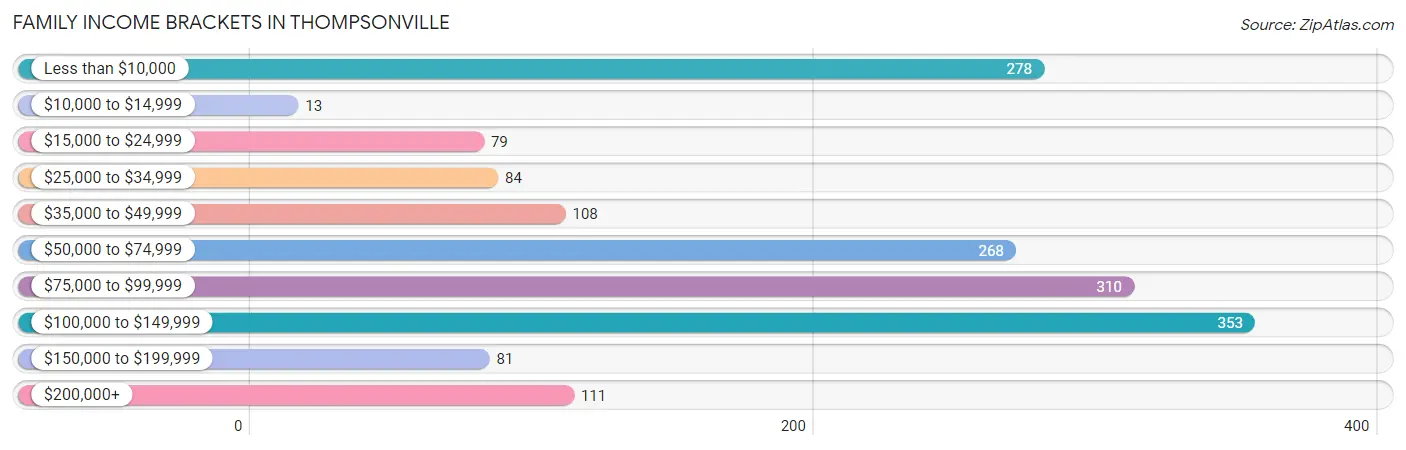
| Income Bracket | # Families | % Families |
| Less than $10,000 | 278 | 16.5% |
| $10,000 to $14,999 | 13 | 0.8% |
| $15,000 to $24,999 | 79 | 4.7% |
| $25,000 to $34,999 | 84 | 5.0% |
| $35,000 to $49,999 | 108 | 6.4% |
| $50,000 to $74,999 | 268 | 15.9% |
| $75,000 to $99,999 | 310 | 18.4% |
| $100,000 to $149,999 | 353 | 20.9% |
| $150,000 to $199,999 | 81 | 4.8% |
| $200,000+ | 111 | 6.6% |
Family Income by Famaliy Size in Thompsonville
4-person families (237 | 14.1%) account for the highest median family income in Thompsonville with $83,819 per family, while 2-person families (764 | 45.3%) have the highest median income of $41,084 per family member.
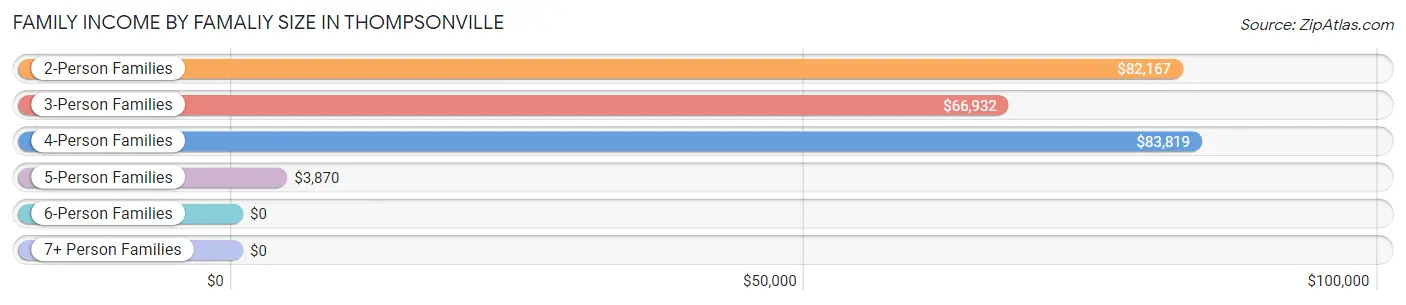
| Income Bracket | # Families | Median Income |
| 2-Person Families | 764 (45.3%) | $82,167 |
| 3-Person Families | 424 (25.1%) | $66,932 |
| 4-Person Families | 237 (14.1%) | $83,819 |
| 5-Person Families | 240 (14.2%) | $3,870 |
| 6-Person Families | 5 (0.3%) | $0 |
| 7+ Person Families | 17 (1.0%) | $0 |
| Total | 1,687 (100.0%) | $76,750 |
Family Income by Number of Earners in Thompsonville
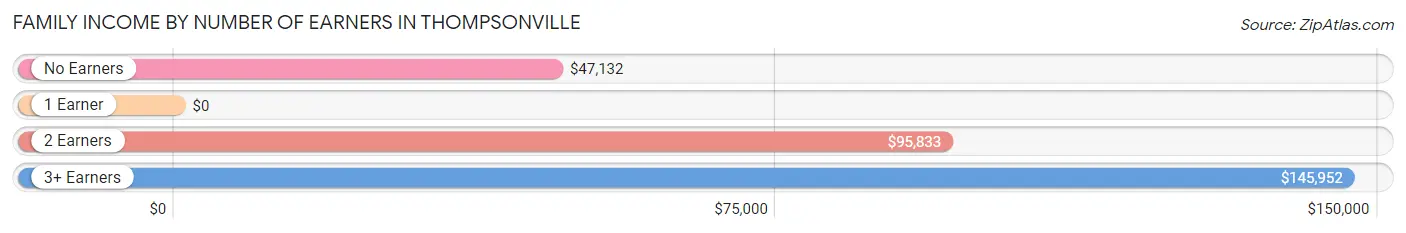
| Number of Earners | # Families | Median Income |
| No Earners | 130 (7.7%) | $47,132 |
| 1 Earner | 791 (46.9%) | $0 |
| 2 Earners | 638 (37.8%) | $95,833 |
| 3+ Earners | 128 (7.6%) | $145,952 |
| Total | 1,687 (100.0%) | $76,750 |
Household Income in Thompsonville
Household Income Brackets in Thompsonville
With 590 households falling in the category, the $50,000 to $74,999 income range is the most frequent in Thompsonville, accounting for 18.1% of all households. In contrast, only 127 households (3.9%) fall into the $150,000 to $199,999 income bracket, making it the least populous group.
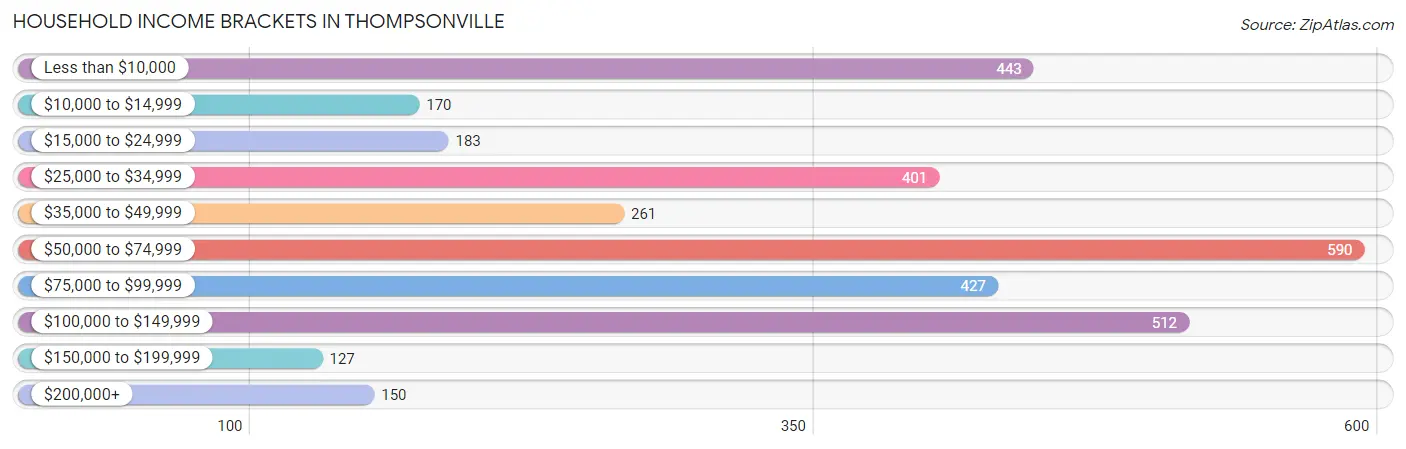
| Income Bracket | # Households | % Households |
| Less than $10,000 | 443 | 13.6% |
| $10,000 to $14,999 | 170 | 5.2% |
| $15,000 to $24,999 | 183 | 5.6% |
| $25,000 to $34,999 | 401 | 12.3% |
| $35,000 to $49,999 | 261 | 8.0% |
| $50,000 to $74,999 | 590 | 18.1% |
| $75,000 to $99,999 | 427 | 13.1% |
| $100,000 to $149,999 | 512 | 15.7% |
| $150,000 to $199,999 | 127 | 3.9% |
| $200,000+ | 150 | 4.6% |
Household Income by Householder Age in Thompsonville
The median household income in Thompsonville is $57,662, with the highest median household income of $65,938 found in the 45 to 64 years age bracket for the primary householder. A total of 1,361 households (41.7%) fall into this category. Meanwhile, the 15 to 24 years age bracket for the primary householder has the lowest median household income of $0, with 13 households (0.4%) in this group.
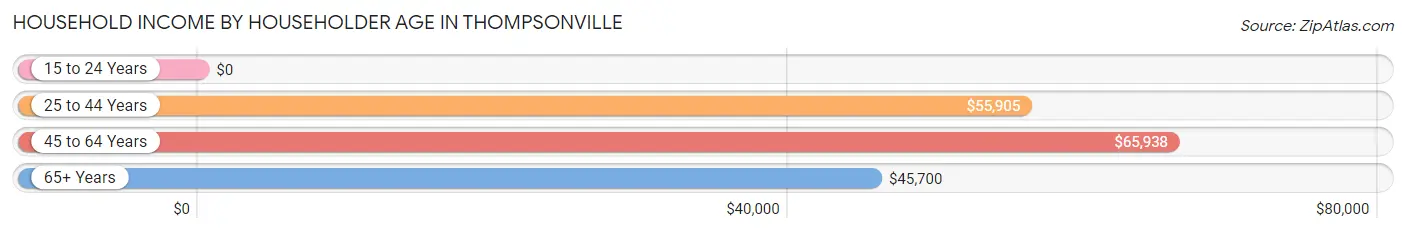
| Income Bracket | # Households | Median Income |
| 15 to 24 Years | 13 (0.4%) | $0 |
| 25 to 44 Years | 1,257 (38.6%) | $55,905 |
| 45 to 64 Years | 1,361 (41.7%) | $65,938 |
| 65+ Years | 630 (19.3%) | $45,700 |
| Total | 3,261 (100.0%) | $57,662 |
Poverty in Thompsonville
Income Below Poverty by Sex and Age in Thompsonville
With 23.6% poverty level for males and 34.0% for females among the residents of Thompsonville, 6 to 11 year old males and under 5 year old females are the most vulnerable to poverty, with 254 males (50.6%) and 294 females (89.9%) in their respective age groups living below the poverty level.
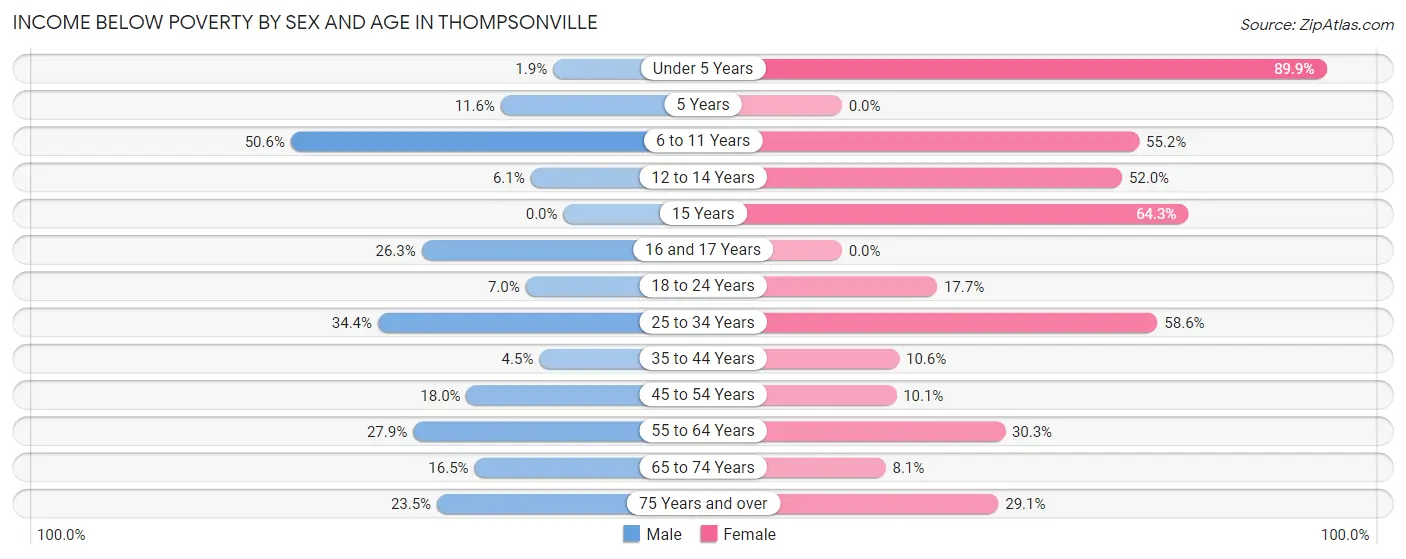
| Age Bracket | Male | Female |
| Under 5 Years | 7 (1.9%) | 294 (89.9%) |
| 5 Years | 5 (11.6%) | 0 (0.0%) |
| 6 to 11 Years | 254 (50.6%) | 250 (55.2%) |
| 12 to 14 Years | 7 (6.1%) | 13 (52.0%) |
| 15 Years | 0 (0.0%) | 9 (64.3%) |
| 16 and 17 Years | 15 (26.3%) | 0 (0.0%) |
| 18 to 24 Years | 17 (7.0%) | 53 (17.7%) |
| 25 to 34 Years | 304 (34.4%) | 355 (58.6%) |
| 35 to 44 Years | 15 (4.5%) | 49 (10.6%) |
| 45 to 54 Years | 84 (18.0%) | 52 (10.1%) |
| 55 to 64 Years | 168 (27.9%) | 162 (30.3%) |
| 65 to 74 Years | 52 (16.5%) | 29 (8.1%) |
| 75 Years and over | 19 (23.5%) | 52 (29.0%) |
| Total | 947 (23.6%) | 1,318 (34.0%) |
Income Above Poverty by Sex and Age in Thompsonville
According to the poverty statistics in Thompsonville, males aged 15 years and females aged 5 years are the age groups that are most secure financially, with 100.0% of males and 100.0% of females in these age groups living above the poverty line.
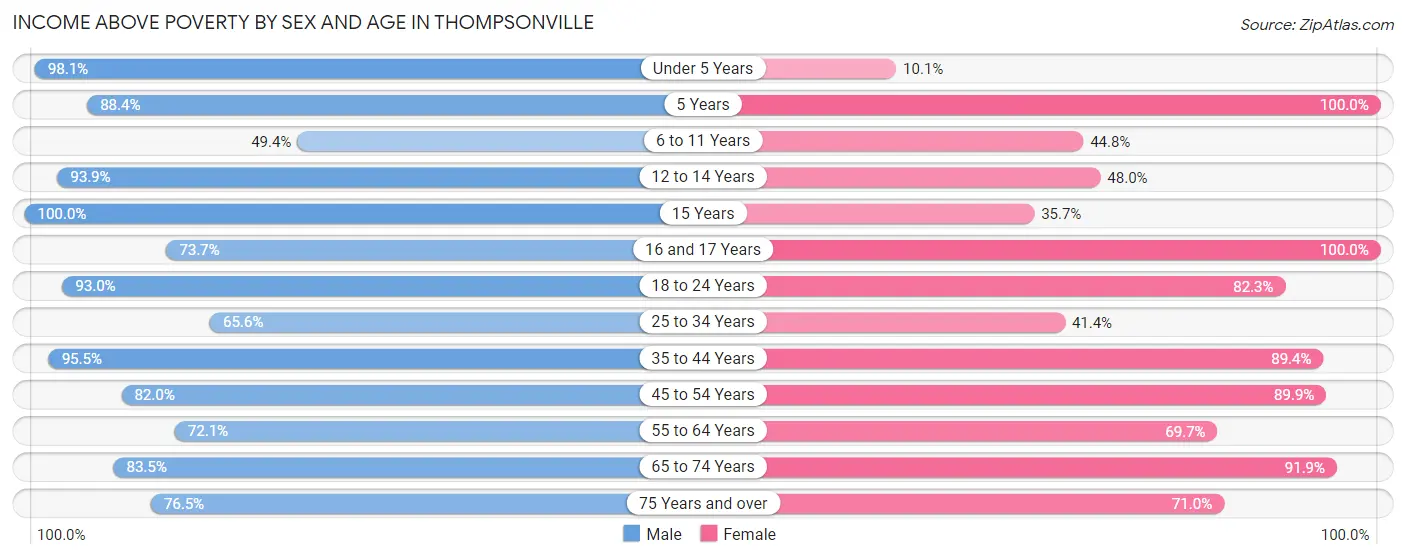
| Age Bracket | Male | Female |
| Under 5 Years | 358 (98.1%) | 33 (10.1%) |
| 5 Years | 38 (88.4%) | 44 (100.0%) |
| 6 to 11 Years | 248 (49.4%) | 203 (44.8%) |
| 12 to 14 Years | 108 (93.9%) | 12 (48.0%) |
| 15 Years | 6 (100.0%) | 5 (35.7%) |
| 16 and 17 Years | 42 (73.7%) | 63 (100.0%) |
| 18 to 24 Years | 225 (93.0%) | 247 (82.3%) |
| 25 to 34 Years | 579 (65.6%) | 251 (41.4%) |
| 35 to 44 Years | 320 (95.5%) | 412 (89.4%) |
| 45 to 54 Years | 383 (82.0%) | 463 (89.9%) |
| 55 to 64 Years | 434 (72.1%) | 373 (69.7%) |
| 65 to 74 Years | 263 (83.5%) | 328 (91.9%) |
| 75 Years and over | 62 (76.5%) | 127 (71.0%) |
| Total | 3,066 (76.4%) | 2,561 (66.0%) |
Income Below Poverty Among Married-Couple Families in Thompsonville
The poverty statistics for married-couple families in Thompsonville show that 23.2% or 267 of the total 1,153 families live below the poverty line. Families with 3 or 4 children have the highest poverty rate of 96.9%, comprising of 219 families. On the other hand, families with 5 or more children have the lowest poverty rate of 0.0%, which includes 0 families.
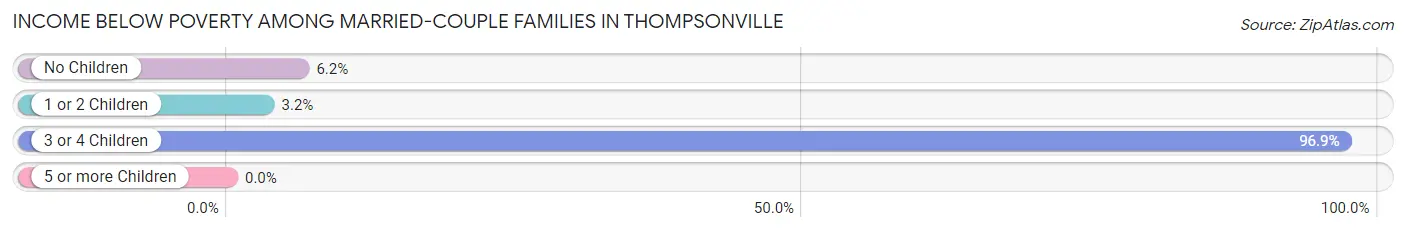
| Children | Above Poverty | Below Poverty |
| No Children | 588 (93.8%) | 39 (6.2%) |
| 1 or 2 Children | 274 (96.8%) | 9 (3.2%) |
| 3 or 4 Children | 7 (3.1%) | 219 (96.9%) |
| 5 or more Children | 17 (100.0%) | 0 (0.0%) |
| Total | 886 (76.8%) | 267 (23.2%) |
Income Below Poverty Among Single-Parent Households in Thompsonville
According to the poverty data in Thompsonville, 27.7% or 41 single-father households and 7.8% or 30 single-mother households are living below the poverty line. Among single-father households, those with no children have the highest poverty rate, with 41 households (28.5%) experiencing poverty. Likewise, among single-mother households, those with 1 or 2 children have the highest poverty rate, with 25 households (10.5%) falling below the poverty line.
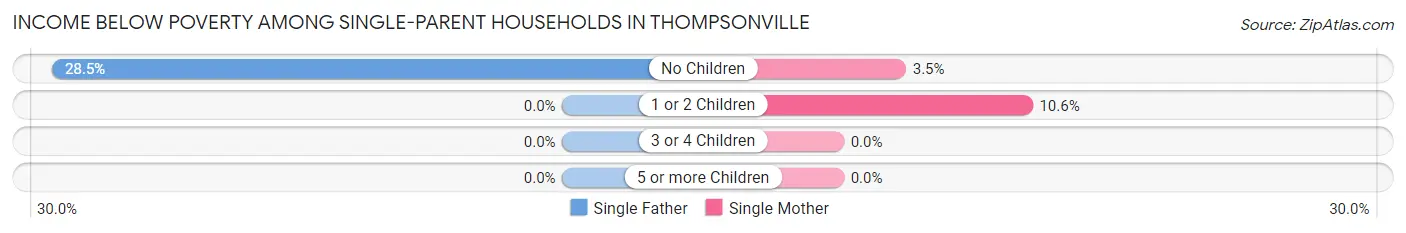
| Children | Single Father | Single Mother |
| No Children | 41 (28.5%) | 5 (3.5%) |
| 1 or 2 Children | 0 (0.0%) | 25 (10.5%) |
| 3 or 4 Children | 0 (0.0%) | 0 (0.0%) |
| 5 or more Children | 0 (0.0%) | 0 (0.0%) |
| Total | 41 (27.7%) | 30 (7.8%) |
Income Below Poverty Among Married-Couple vs Single-Parent Households in Thompsonville
The poverty data for Thompsonville shows that 267 of the married-couple family households (23.2%) and 71 of the single-parent households (13.3%) are living below the poverty level. Within the married-couple family households, those with 3 or 4 children have the highest poverty rate, with 219 households (96.9%) falling below the poverty line. Among the single-parent households, those with no children have the highest poverty rate, with 46 household (16.0%) living below poverty.
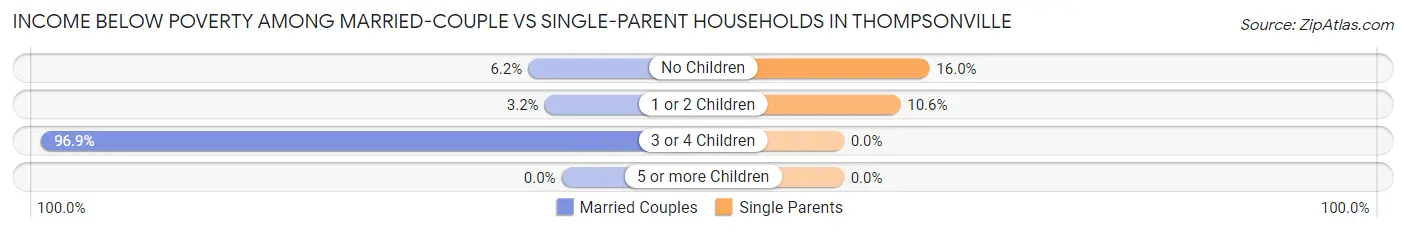
| Children | Married-Couple Families | Single-Parent Households |
| No Children | 39 (6.2%) | 46 (16.0%) |
| 1 or 2 Children | 9 (3.2%) | 25 (10.5%) |
| 3 or 4 Children | 219 (96.9%) | 0 (0.0%) |
| 5 or more Children | 0 (0.0%) | 0 (0.0%) |
| Total | 267 (23.2%) | 71 (13.3%) |
Race in Thompsonville
The most populous races in Thompsonville are White / Caucasian (5,314 | 65.6%), Hispanic or Latino (1,424 | 17.6%), and Two or more Races (1,304 | 16.1%).
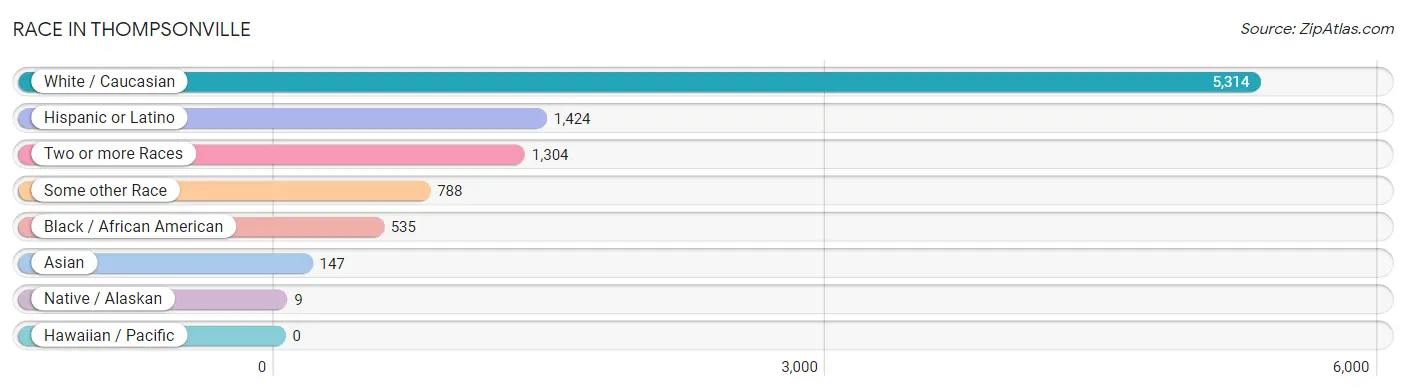
| Race | # Population | % Population |
| Asian | 147 | 1.8% |
| Black / African American | 535 | 6.6% |
| Hawaiian / Pacific | 0 | 0.0% |
| Hispanic or Latino | 1,424 | 17.6% |
| Native / Alaskan | 9 | 0.1% |
| White / Caucasian | 5,314 | 65.6% |
| Two or more Races | 1,304 | 16.1% |
| Some other Race | 788 | 9.7% |
| Total | 8,097 | 100.0% |
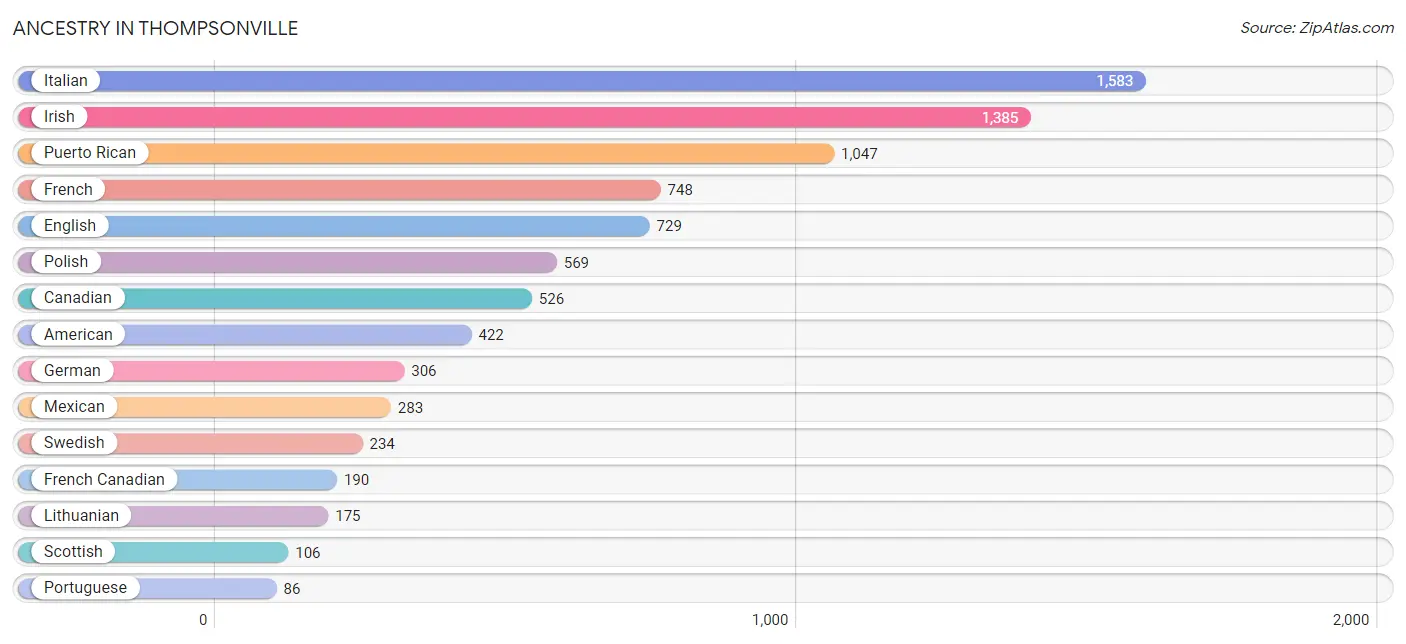
Ancestry in Thompsonville
The most populous ancestries reported in Thompsonville are Italian (1,583 | 19.6%), Irish (1,385 | 17.1%), Puerto Rican (1,047 | 12.9%), French (748 | 9.2%), and English (729 | 9.0%), together accounting for 67.8% of all Thompsonville residents.
| Ancestry | # Population | % Population |
| American | 422 | 5.2% |
| Arab | 15 | 0.2% |
| Armenian | 5 | 0.1% |
| Assyrian / Chaldean / Syriac | 10 | 0.1% |
| Austrian | 21 | 0.3% |
| British | 5 | 0.1% |
| Burmese | 20 | 0.3% |
| Canadian | 526 | 6.5% |
| Cape Verdean | 15 | 0.2% |
| Colombian | 37 | 0.5% |
| Czechoslovakian | 10 | 0.1% |
| Danish | 33 | 0.4% |
| Dutch | 7 | 0.1% |
| Eastern European | 34 | 0.4% |
| Egyptian | 10 | 0.1% |
| English | 729 | 9.0% |
| European | 56 | 0.7% |
| French | 748 | 9.2% |
| French Canadian | 190 | 2.4% |
| German | 306 | 3.8% |
| Guyanese | 19 | 0.2% |
| Haitian | 17 | 0.2% |
| Hungarian | 24 | 0.3% |
| Indian (Asian) | 8 | 0.1% |
| Irish | 1,385 | 17.1% |
| Italian | 1,583 | 19.6% |
| Jamaican | 52 | 0.6% |
| Lebanese | 5 | 0.1% |
| Lithuanian | 175 | 2.2% |
| Malaysian | 28 | 0.4% |
| Mexican | 283 | 3.5% |
| Nigerian | 9 | 0.1% |
| Norwegian | 18 | 0.2% |
| Polish | 569 | 7.0% |
| Portuguese | 86 | 1.1% |
| Puerto Rican | 1,047 | 12.9% |
| Russian | 13 | 0.2% |
| Scotch-Irish | 4 | 0.1% |
| Scottish | 106 | 1.3% |
| Somali | 18 | 0.2% |
| South American | 37 | 0.5% |
| Spaniard | 47 | 0.6% |
| Subsaharan African | 42 | 0.5% |
| Swedish | 234 | 2.9% |
| Trinidadian and Tobagonian | 21 | 0.3% | View All 45 Rows |
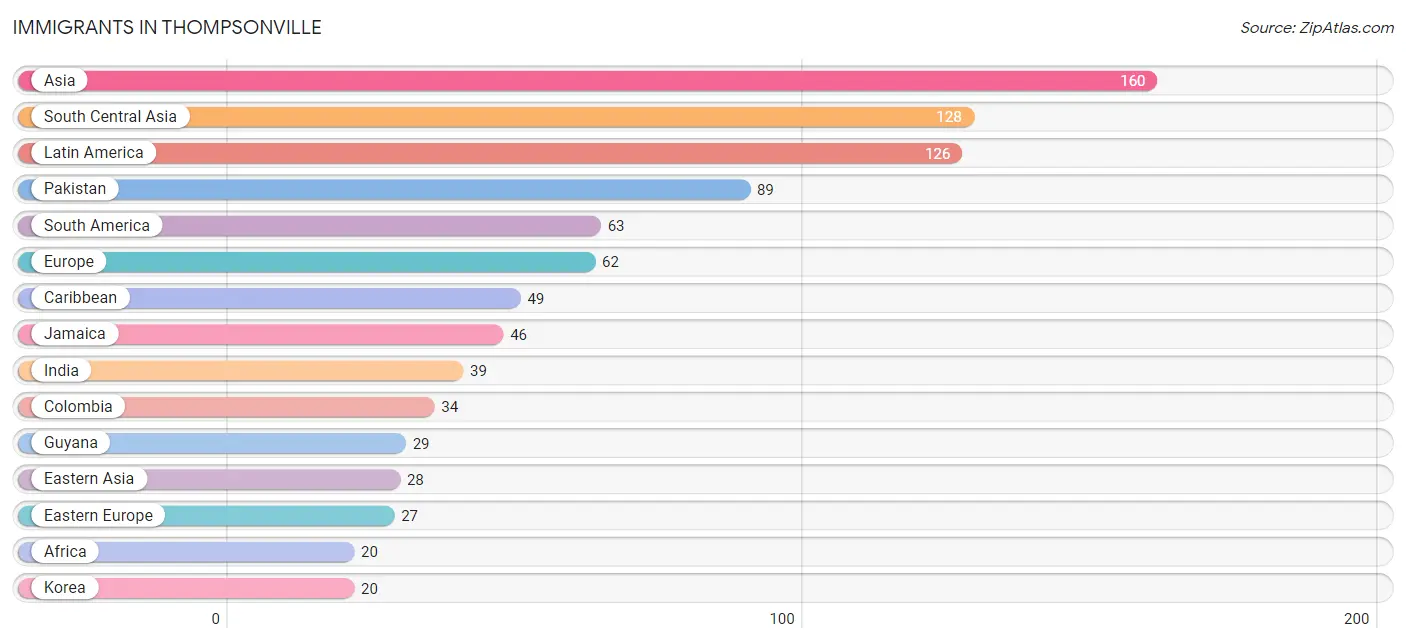
Immigrants in Thompsonville
The most numerous immigrant groups reported in Thompsonville came from Asia (160 | 2.0%), South Central Asia (128 | 1.6%), Latin America (126 | 1.6%), Pakistan (89 | 1.1%), and South America (63 | 0.8%), together accounting for 7.0% of all Thompsonville residents.
| Immigration Origin | # Population | % Population |
| Africa | 20 | 0.3% |
| Asia | 160 | 2.0% |
| Caribbean | 49 | 0.6% |
| Central America | 14 | 0.2% |
| China | 8 | 0.1% |
| Colombia | 34 | 0.4% |
| Eastern Africa | 11 | 0.1% |
| Eastern Asia | 28 | 0.4% |
| Eastern Europe | 27 | 0.3% |
| Europe | 62 | 0.8% |
| Guyana | 29 | 0.4% |
| India | 39 | 0.5% |
| Italy | 17 | 0.2% |
| Jamaica | 46 | 0.6% |
| Korea | 20 | 0.3% |
| Laos | 4 | 0.1% |
| Latin America | 126 | 1.6% |
| Mexico | 14 | 0.2% |
| Nigeria | 9 | 0.1% |
| Northern Europe | 18 | 0.2% |
| Pakistan | 89 | 1.1% |
| Poland | 19 | 0.2% |
| Russia | 8 | 0.1% |
| Somalia | 11 | 0.1% |
| South America | 63 | 0.8% |
| South Central Asia | 128 | 1.6% |
| South Eastern Asia | 4 | 0.1% |
| Southern Europe | 17 | 0.2% |
| Taiwan | 8 | 0.1% |
| Trinidad and Tobago | 3 | 0.0% |
| Western Africa | 9 | 0.1% | View All 31 Rows |
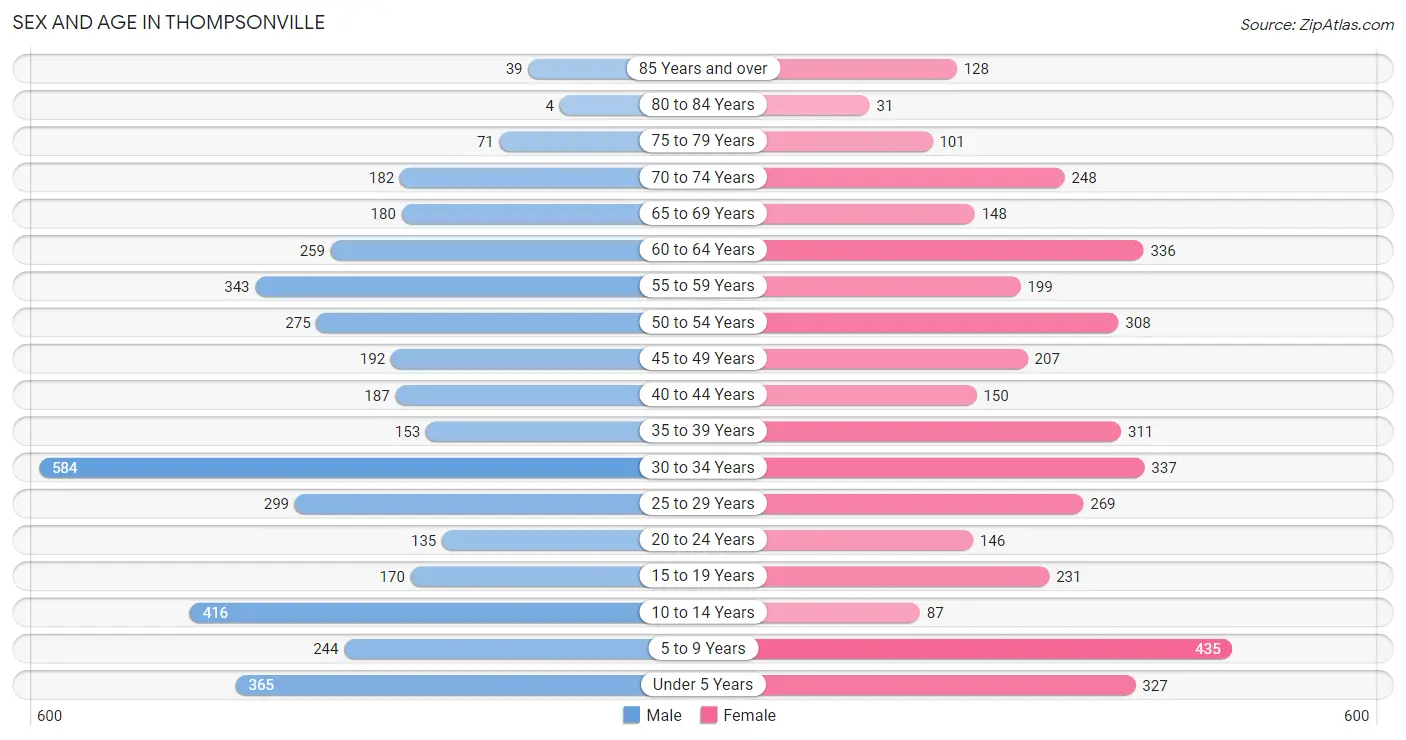
Sex and Age in Thompsonville
Sex and Age in Thompsonville
The most populous age groups in Thompsonville are 30 to 34 Years (584 | 14.2%) for men and 5 to 9 Years (435 | 10.9%) for women.
| Age Bracket | Male | Female |
| Under 5 Years | 365 (8.9%) | 327 (8.2%) |
| 5 to 9 Years | 244 (5.9%) | 435 (10.9%) |
| 10 to 14 Years | 416 (10.2%) | 87 (2.2%) |
| 15 to 19 Years | 170 (4.2%) | 231 (5.8%) |
| 20 to 24 Years | 135 (3.3%) | 146 (3.6%) |
| 25 to 29 Years | 299 (7.3%) | 269 (6.7%) |
| 30 to 34 Years | 584 (14.2%) | 337 (8.4%) |
| 35 to 39 Years | 153 (3.7%) | 311 (7.8%) |
| 40 to 44 Years | 187 (4.6%) | 150 (3.7%) |
| 45 to 49 Years | 192 (4.7%) | 207 (5.2%) |
| 50 to 54 Years | 275 (6.7%) | 308 (7.7%) |
| 55 to 59 Years | 343 (8.4%) | 199 (5.0%) |
| 60 to 64 Years | 259 (6.3%) | 336 (8.4%) |
| 65 to 69 Years | 180 (4.4%) | 148 (3.7%) |
| 70 to 74 Years | 182 (4.4%) | 248 (6.2%) |
| 75 to 79 Years | 71 (1.7%) | 101 (2.5%) |
| 80 to 84 Years | 4 (0.1%) | 31 (0.8%) |
| 85 Years and over | 39 (0.9%) | 128 (3.2%) |
| Total | 4,098 (100.0%) | 3,999 (100.0%) |
Families and Households in Thompsonville
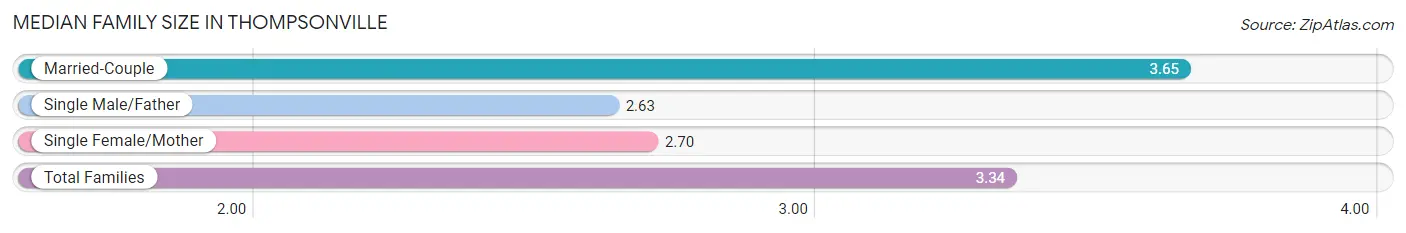
Median Family Size in Thompsonville
The median family size in Thompsonville is 3.34 persons per family, with married-couple families (1,153 | 68.3%) accounting for the largest median family size of 3.65 persons per family. On the other hand, single male/father families (148 | 8.8%) represent the smallest median family size with 2.63 persons per family.
| Family Type | # Families | Family Size |
| Married-Couple | 1,153 (68.3%) | 3.65 |
| Single Male/Father | 148 (8.8%) | 2.63 |
| Single Female/Mother | 386 (22.9%) | 2.70 |
| Total Families | 1,687 (100.0%) | 3.34 |
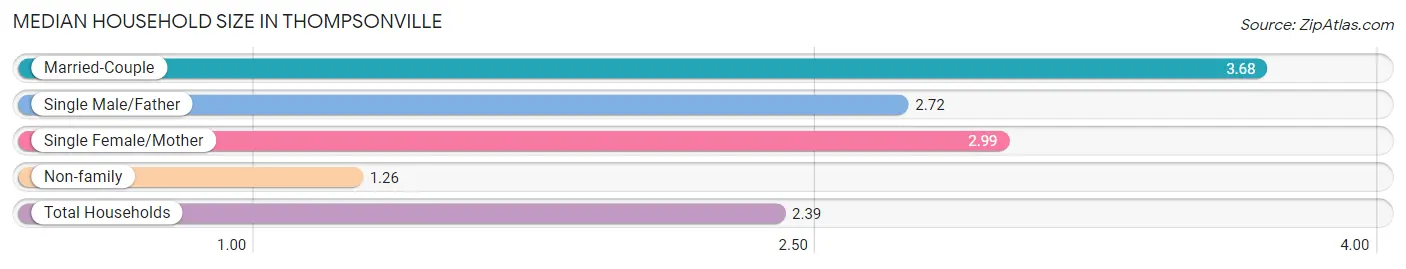
Median Household Size in Thompsonville
The median household size in Thompsonville is 2.39 persons per household, with married-couple households (1,153 | 35.4%) accounting for the largest median household size of 3.68 persons per household. non-family households (1,574 | 48.3%) represent the smallest median household size with 1.26 persons per household.
| Household Type | # Households | Household Size |
| Married-Couple | 1,153 (35.4%) | 3.68 |
| Single Male/Father | 148 (4.5%) | 2.72 |
| Single Female/Mother | 386 (11.8%) | 2.99 |
| Non-family | 1,574 (48.3%) | 1.26 |
| Total Households | 3,261 (100.0%) | 2.39 |
Household Size by Marriage Status in Thompsonville
Out of a total of 3,261 households in Thompsonville, 1,687 (51.7%) are family households, while 1,574 (48.3%) are nonfamily households. The most numerous type of family households are 2-person households, comprising 723, and the most common type of nonfamily households are 1-person households, comprising 1,213.
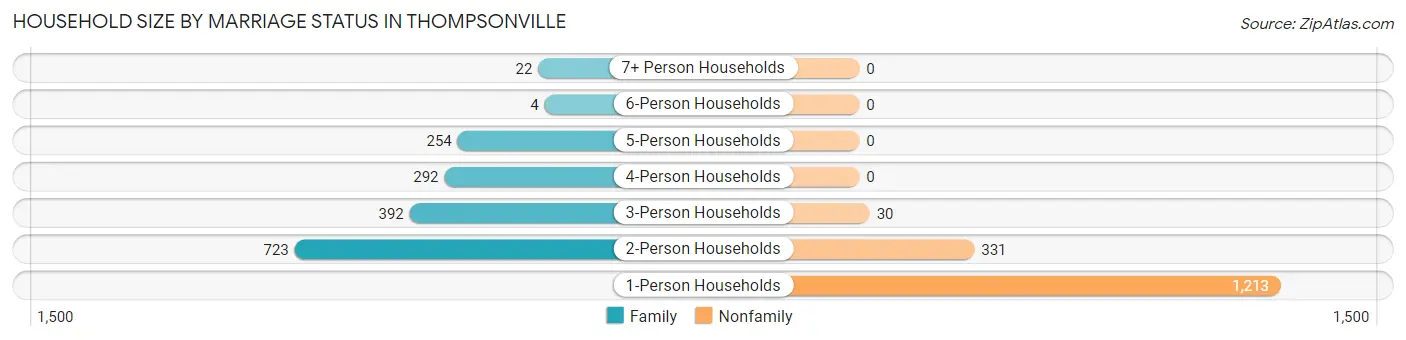
| Household Size | Family Households | Nonfamily Households |
| 1-Person Households | - | 1,213 (37.2%) |
| 2-Person Households | 723 (22.2%) | 331 (10.2%) |
| 3-Person Households | 392 (12.0%) | 30 (0.9%) |
| 4-Person Households | 292 (8.9%) | 0 (0.0%) |
| 5-Person Households | 254 (7.8%) | 0 (0.0%) |
| 6-Person Households | 4 (0.1%) | 0 (0.0%) |
| 7+ Person Households | 22 (0.7%) | 0 (0.0%) |
| Total | 1,687 (51.7%) | 1,574 (48.3%) |
Female Fertility in Thompsonville
Fertility by Age in Thompsonville
Average fertility rate in Thompsonville is 158.0 births per 1,000 women. Women in the age bracket of 20 to 34 years have the highest fertility rate with 348.0 births per 1,000 women. Women in the age bracket of 20 to 34 years acount for 97.4% of all women with births.
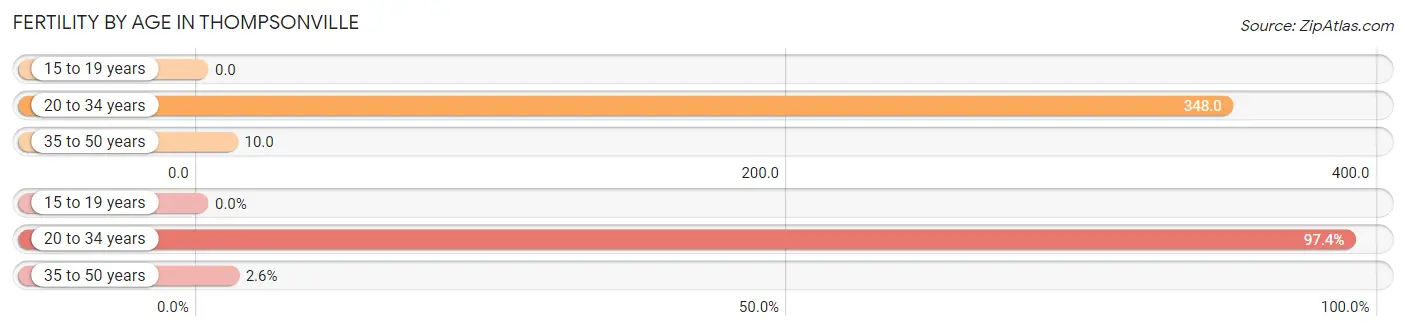
| Age Bracket | Women with Births | Births / 1,000 Women |
| 15 to 19 years | 0 (0.0%) | 0.0 |
| 20 to 34 years | 262 (97.4%) | 348.0 |
| 35 to 50 years | 7 (2.6%) | 10.0 |
| Total | 269 (100.0%) | 158.0 |
Fertility by Age by Marriage Status in Thompsonville
84.0% of women with births (269) in Thompsonville are married. The highest percentage of unmarried women with births falls into 20 to 34 years age bracket with 16.4% of them unmarried at the time of birth, while the lowest percentage of unmarried women with births belong to 35 to 50 years age bracket with 0.0% of them unmarried.
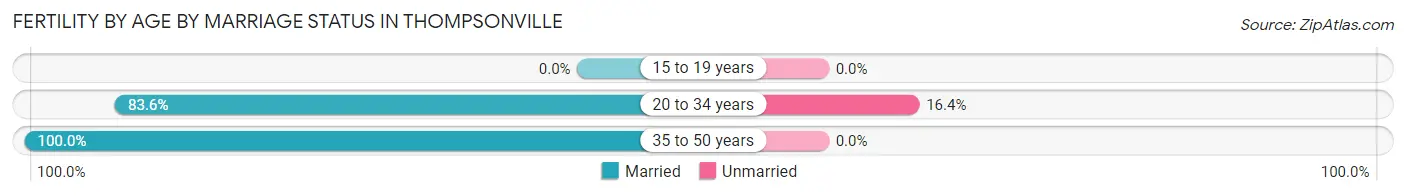
| Age Bracket | Married | Unmarried |
| 15 to 19 years | 0 (0.0%) | 0 (0.0%) |
| 20 to 34 years | 219 (83.6%) | 43 (16.4%) |
| 35 to 50 years | 7 (100.0%) | 0 (0.0%) |
| Total | 226 (84.0%) | 43 (16.0%) |
Fertility by Education in Thompsonville
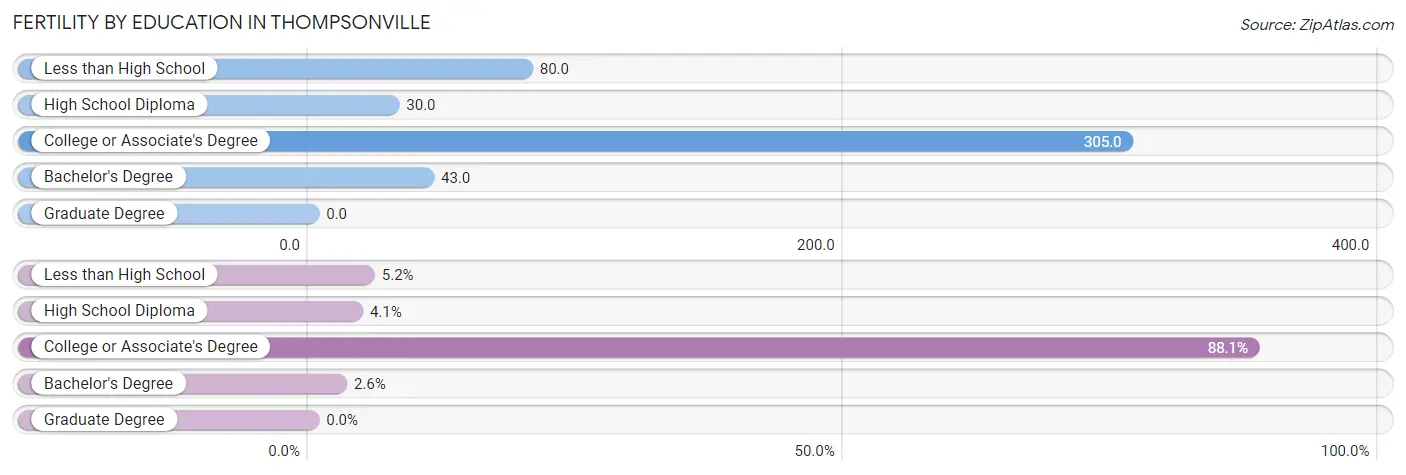
| Educational Attainment | Women with Births | Births / 1,000 Women |
| Less than High School | 14 (5.2%) | 80.0 |
| High School Diploma | 11 (4.1%) | 30.0 |
| College or Associate's Degree | 237 (88.1%) | 305.0 |
| Bachelor's Degree | 7 (2.6%) | 43.0 |
| Graduate Degree | 0 (0.0%) | 0.0 |
| Total | 269 (100.0%) | 158.0 |
Fertility by Education by Marriage Status in Thompsonville
16.0% of women with births in Thompsonville are unmarried. Women with the educational attainment of bachelor's degree are most likely to be married with 100.0% of them married at childbirth, while women with the educational attainment of less than high school are least likely to be married with 100.0% of them unmarried at childbirth.
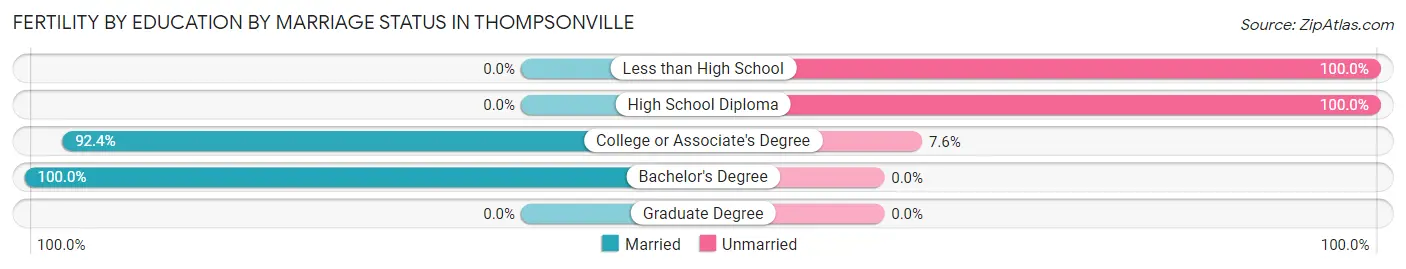
| Educational Attainment | Married | Unmarried |
| Less than High School | 0 (0.0%) | 14 (100.0%) |
| High School Diploma | 0 (0.0%) | 11 (100.0%) |
| College or Associate's Degree | 219 (92.4%) | 18 (7.6%) |
| Bachelor's Degree | 7 (100.0%) | 0 (0.0%) |
| Graduate Degree | 0 (0.0%) | 0 (0.0%) |
| Total | 226 (84.0%) | 43 (16.0%) |
Employment Characteristics in Thompsonville
Employment by Class of Employer in Thompsonville
Among the 3,297 employed individuals in Thompsonville, private company employees (2,350 | 71.3%), not-for-profit organizations (397 | 12.0%), and local government employees (315 | 9.6%) make up the most common classes of employment.
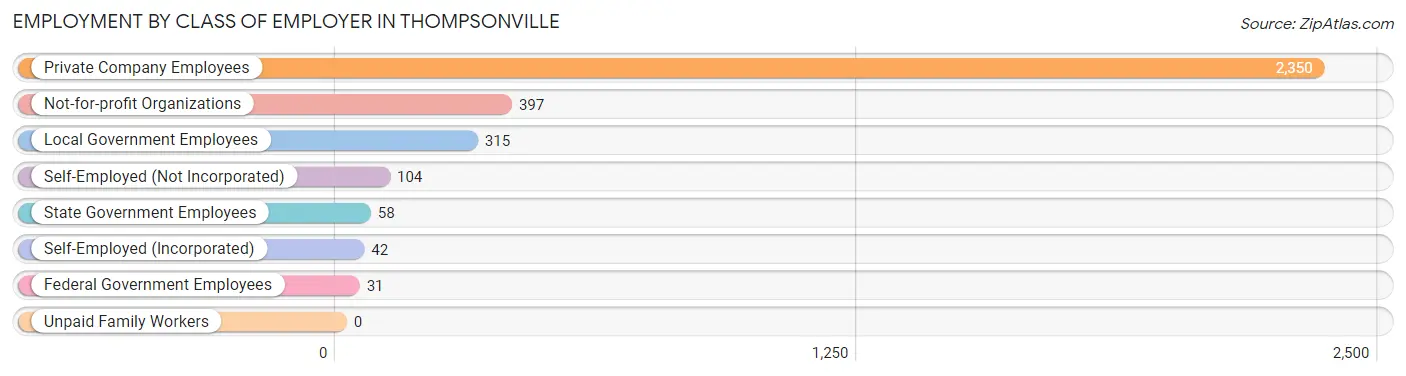
| Employer Class | # Employees | % Employees |
| Private Company Employees | 2,350 | 71.3% |
| Self-Employed (Incorporated) | 42 | 1.3% |
| Self-Employed (Not Incorporated) | 104 | 3.2% |
| Not-for-profit Organizations | 397 | 12.0% |
| Local Government Employees | 315 | 9.6% |
| State Government Employees | 58 | 1.8% |
| Federal Government Employees | 31 | 0.9% |
| Unpaid Family Workers | 0 | 0.0% |
| Total | 3,297 | 100.0% |
Employment Status by Age in Thompsonville
According to the labor force statistics for Thompsonville, out of the total population over 16 years of age (6,203), 66.1% or 4,100 individuals are in the labor force, with 17.5% or 718 of them unemployed. The age group with the highest labor force participation rate is 25 to 29 years, with 96.1% or 546 individuals in the labor force. Within the labor force, the 30 to 34 years age range has the highest percentage of unemployed individuals, with 56.0% or 483 of them being unemployed.
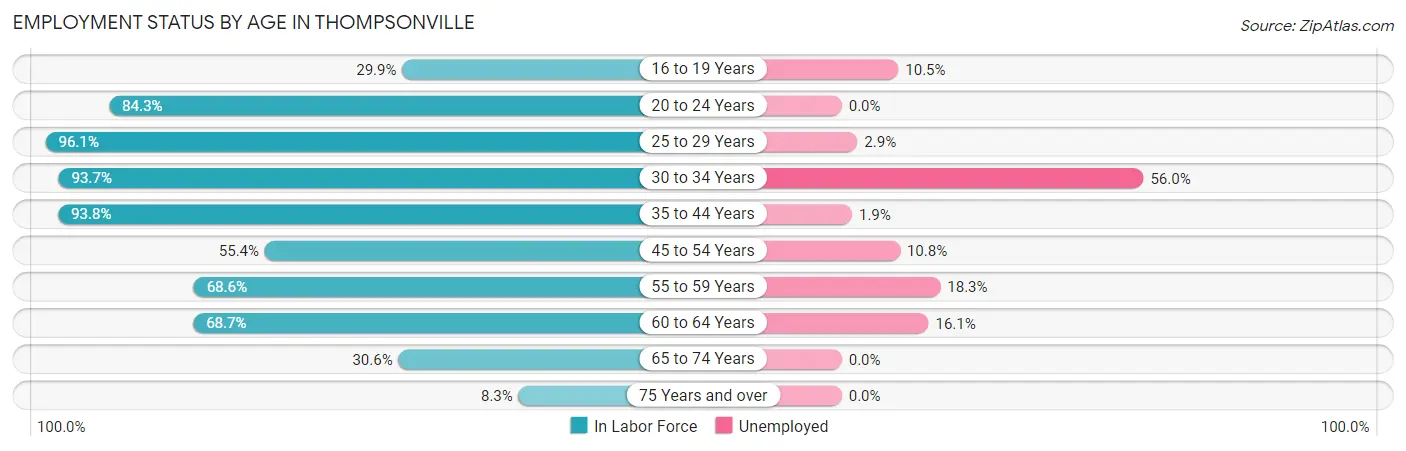
| Age Bracket | In Labor Force | Unemployed |
| 16 to 19 Years | 114 (29.9%) | 12 (10.5%) |
| 20 to 24 Years | 237 (84.3%) | 0 (0.0%) |
| 25 to 29 Years | 546 (96.1%) | 16 (2.9%) |
| 30 to 34 Years | 863 (93.7%) | 483 (56.0%) |
| 35 to 44 Years | 751 (93.8%) | 14 (1.9%) |
| 45 to 54 Years | 544 (55.4%) | 59 (10.8%) |
| 55 to 59 Years | 372 (68.6%) | 68 (18.3%) |
| 60 to 64 Years | 409 (68.7%) | 66 (16.1%) |
| 65 to 74 Years | 232 (30.6%) | 0 (0.0%) |
| 75 Years and over | 31 (8.3%) | 0 (0.0%) |
| Total | 4,100 (66.1%) | 718 (17.5%) |
Employment Status by Educational Attainment in Thompsonville
According to labor force statistics for Thompsonville, 79.0% of individuals (3,483) out of the total population between 25 and 64 years of age (4,409) are in the labor force, with 20.3% or 707 of them being unemployed. The group with the highest labor force participation rate are those with the educational attainment of bachelor's degree or higher, with 95.8% or 1,083 individuals in the labor force. Within the labor force, individuals with bachelor's degree or higher education have the highest percentage of unemployment, with 27.2% or 295 of them being unemployed.
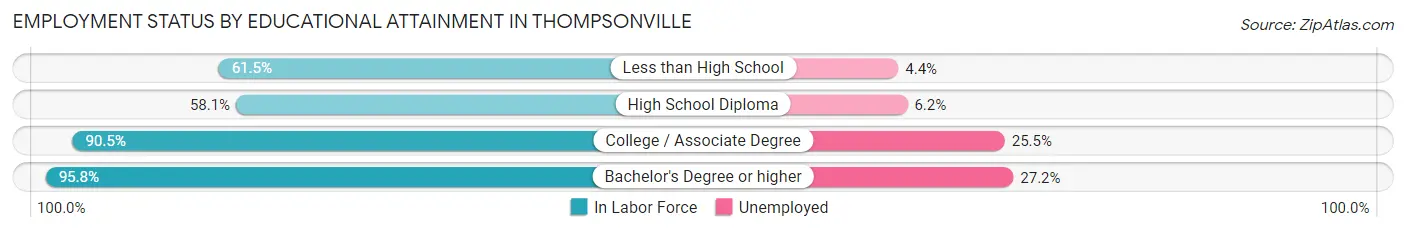
| Educational Attainment | In Labor Force | Unemployed |
| Less than High School | 136 (61.5%) | 10 (4.4%) |
| High School Diploma | 898 (58.1%) | 96 (6.2%) |
| College / Associate Degree | 1,367 (90.5%) | 385 (25.5%) |
| Bachelor's Degree or higher | 1,083 (95.8%) | 308 (27.2%) |
| Total | 3,483 (79.0%) | 895 (20.3%) |
Employment Occupations by Sex in Thompsonville
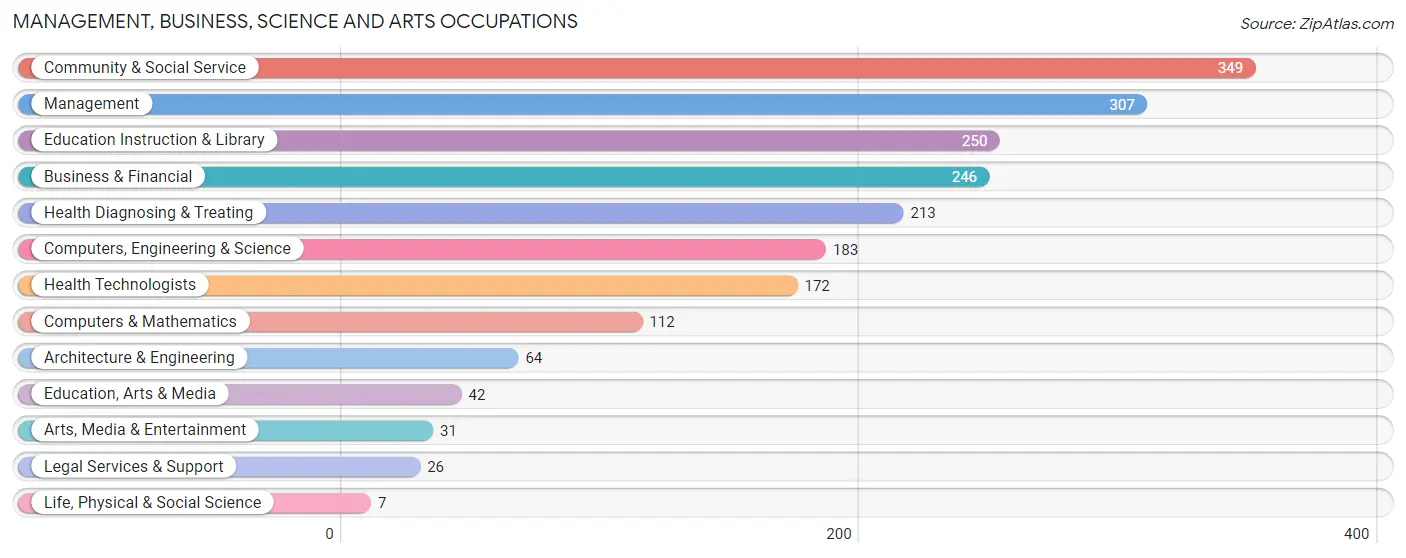
Management, Business, Science and Arts Occupations
The most common Management, Business, Science and Arts occupations in Thompsonville are Community & Social Service (349 | 10.3%), Management (307 | 9.1%), Education Instruction & Library (250 | 7.4%), Business & Financial (246 | 7.3%), and Health Diagnosing & Treating (213 | 6.3%).
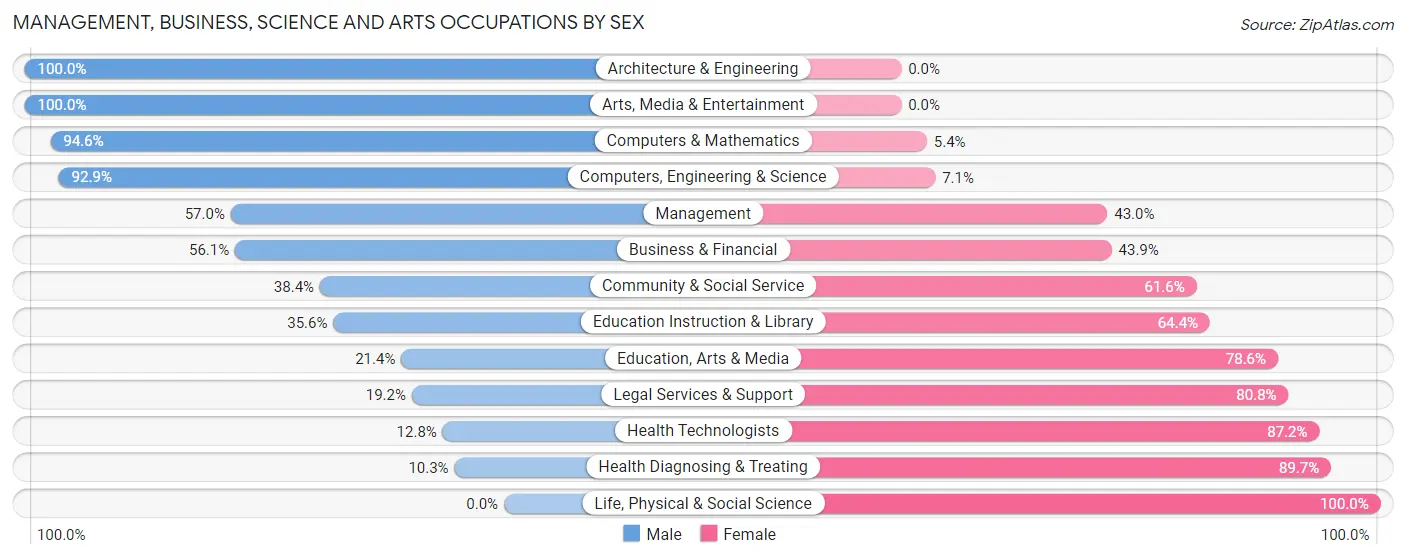
Management, Business, Science and Arts Occupations by Sex
Within the Management, Business, Science and Arts occupations in Thompsonville, the most male-oriented occupations are Architecture & Engineering (100.0%), Arts, Media & Entertainment (100.0%), and Computers & Mathematics (94.6%), while the most female-oriented occupations are Life, Physical & Social Science (100.0%), Health Diagnosing & Treating (89.7%), and Health Technologists (87.2%).
| Occupation | Male | Female |
| Management | 175 (57.0%) | 132 (43.0%) |
| Business & Financial | 138 (56.1%) | 108 (43.9%) |
| Computers, Engineering & Science | 170 (92.9%) | 13 (7.1%) |
| Computers & Mathematics | 106 (94.6%) | 6 (5.4%) |
| Architecture & Engineering | 64 (100.0%) | 0 (0.0%) |
| Life, Physical & Social Science | 0 (0.0%) | 7 (100.0%) |
| Community & Social Service | 134 (38.4%) | 215 (61.6%) |
| Education, Arts & Media | 9 (21.4%) | 33 (78.6%) |
| Legal Services & Support | 5 (19.2%) | 21 (80.8%) |
| Education Instruction & Library | 89 (35.6%) | 161 (64.4%) |
| Arts, Media & Entertainment | 31 (100.0%) | 0 (0.0%) |
| Health Diagnosing & Treating | 22 (10.3%) | 191 (89.7%) |
| Health Technologists | 22 (12.8%) | 150 (87.2%) |
| Total (Category) | 639 (49.2%) | 659 (50.8%) |
| Total (Overall) | 1,701 (50.3%) | 1,680 (49.7%) |
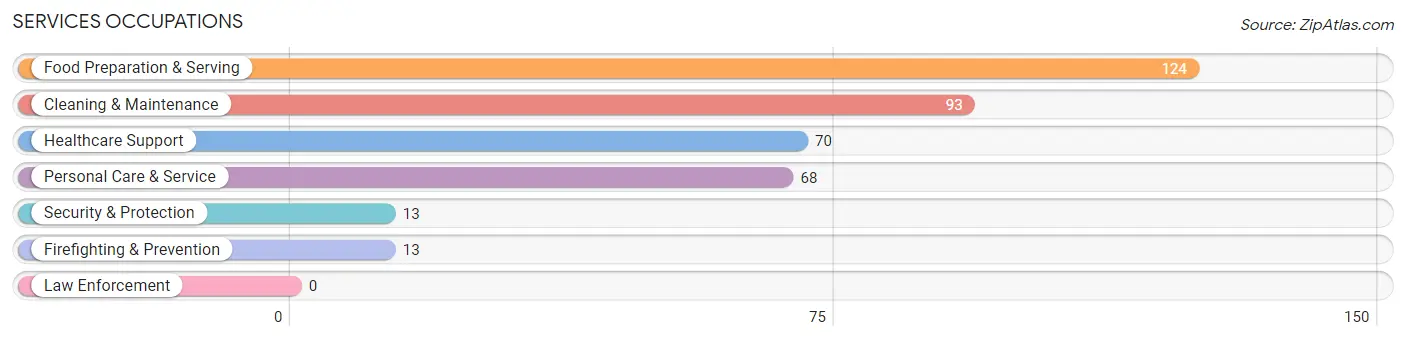
Services Occupations
The most common Services occupations in Thompsonville are Food Preparation & Serving (124 | 3.7%), Cleaning & Maintenance (93 | 2.8%), Healthcare Support (70 | 2.1%), Personal Care & Service (68 | 2.0%), and Security & Protection (13 | 0.4%).
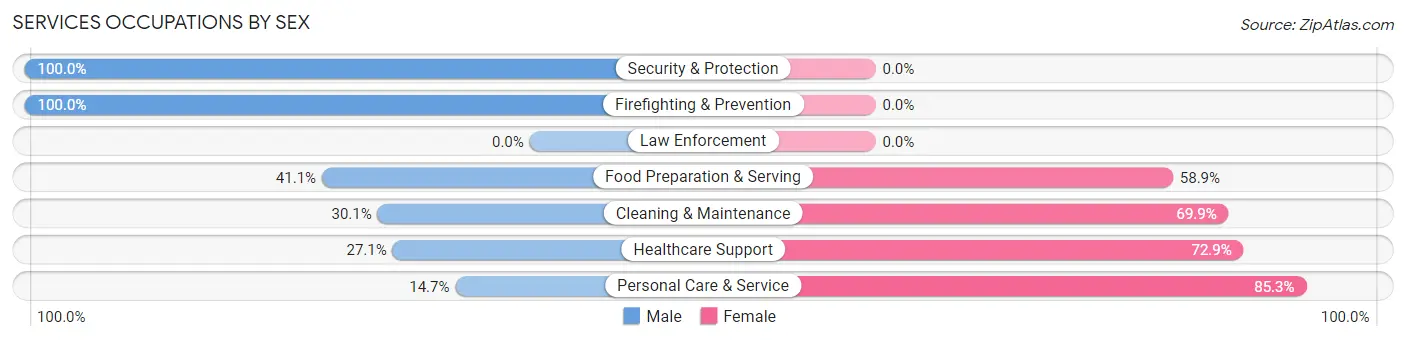
Services Occupations by Sex
Within the Services occupations in Thompsonville, the most male-oriented occupations are Security & Protection (100.0%), Firefighting & Prevention (100.0%), and Food Preparation & Serving (41.1%), while the most female-oriented occupations are Personal Care & Service (85.3%), Healthcare Support (72.9%), and Cleaning & Maintenance (69.9%).
| Occupation | Male | Female |
| Healthcare Support | 19 (27.1%) | 51 (72.9%) |
| Security & Protection | 13 (100.0%) | 0 (0.0%) |
| Firefighting & Prevention | 13 (100.0%) | 0 (0.0%) |
| Law Enforcement | 0 (0.0%) | 0 (0.0%) |
| Food Preparation & Serving | 51 (41.1%) | 73 (58.9%) |
| Cleaning & Maintenance | 28 (30.1%) | 65 (69.9%) |
| Personal Care & Service | 10 (14.7%) | 58 (85.3%) |
| Total (Category) | 121 (32.9%) | 247 (67.1%) |
| Total (Overall) | 1,701 (50.3%) | 1,680 (49.7%) |
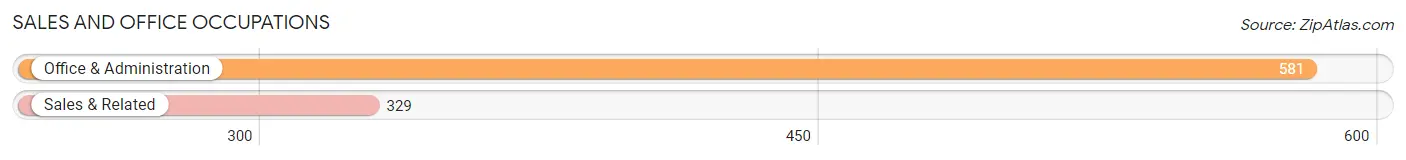
Sales and Office Occupations
The most common Sales and Office occupations in Thompsonville are Office & Administration (581 | 17.2%), and Sales & Related (329 | 9.7%).
Sales and Office Occupations by Sex
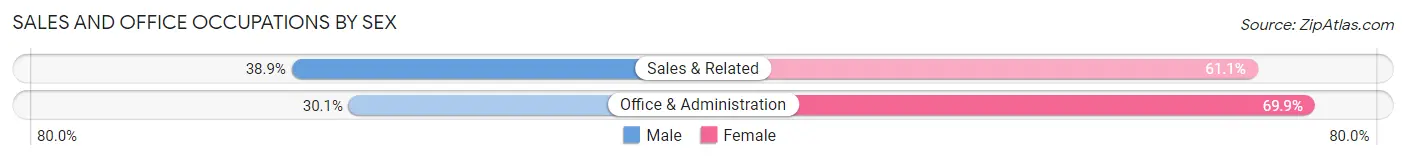
| Occupation | Male | Female |
| Sales & Related | 128 (38.9%) | 201 (61.1%) |
| Office & Administration | 175 (30.1%) | 406 (69.9%) |
| Total (Category) | 303 (33.3%) | 607 (66.7%) |
| Total (Overall) | 1,701 (50.3%) | 1,680 (49.7%) |
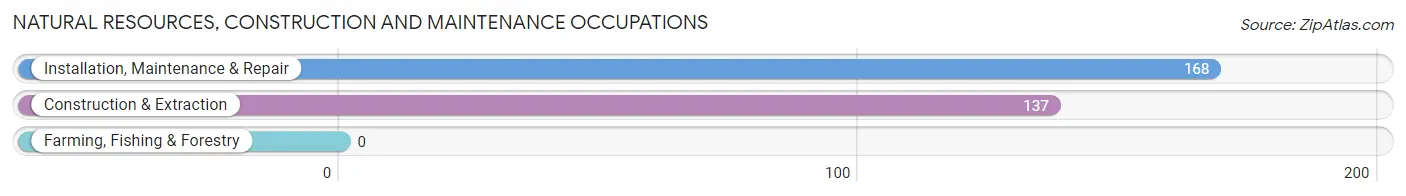
Natural Resources, Construction and Maintenance Occupations
The most common Natural Resources, Construction and Maintenance occupations in Thompsonville are Installation, Maintenance & Repair (168 | 5.0%), and Construction & Extraction (137 | 4.1%).
Natural Resources, Construction and Maintenance Occupations by Sex
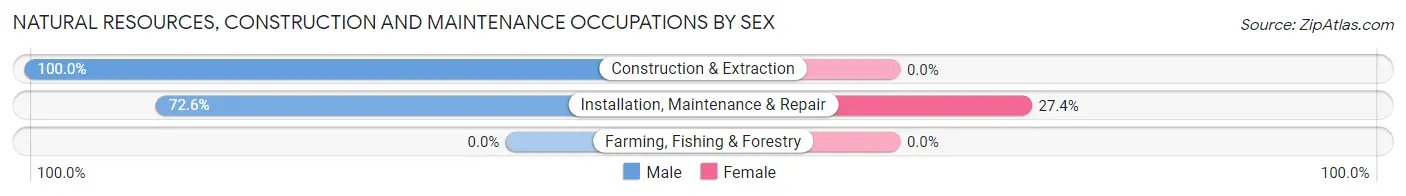
| Occupation | Male | Female |
| Farming, Fishing & Forestry | 0 (0.0%) | 0 (0.0%) |
| Construction & Extraction | 137 (100.0%) | 0 (0.0%) |
| Installation, Maintenance & Repair | 122 (72.6%) | 46 (27.4%) |
| Total (Category) | 259 (84.9%) | 46 (15.1%) |
| Total (Overall) | 1,701 (50.3%) | 1,680 (49.7%) |
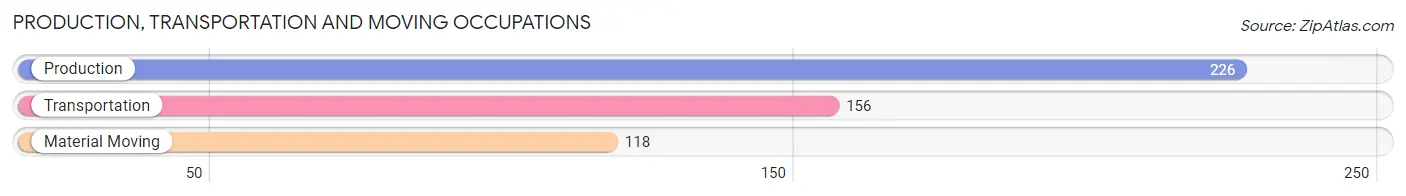
Production, Transportation and Moving Occupations
The most common Production, Transportation and Moving occupations in Thompsonville are Production (226 | 6.7%), Transportation (156 | 4.6%), and Material Moving (118 | 3.5%).
Production, Transportation and Moving Occupations by Sex
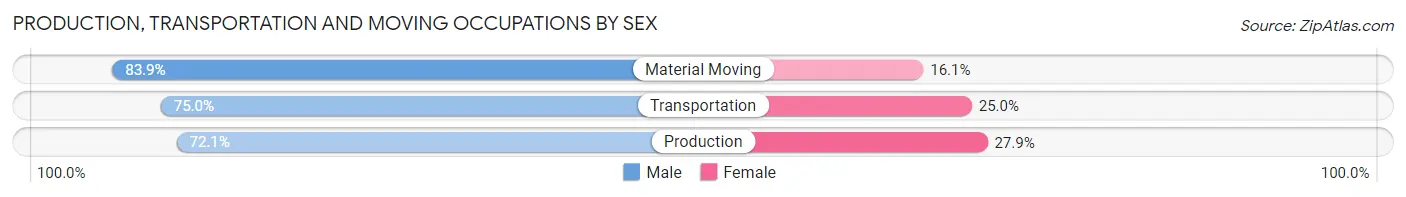
| Occupation | Male | Female |
| Production | 163 (72.1%) | 63 (27.9%) |
| Transportation | 117 (75.0%) | 39 (25.0%) |
| Material Moving | 99 (83.9%) | 19 (16.1%) |
| Total (Category) | 379 (75.8%) | 121 (24.2%) |
| Total (Overall) | 1,701 (50.3%) | 1,680 (49.7%) |
Employment Industries by Sex in Thompsonville
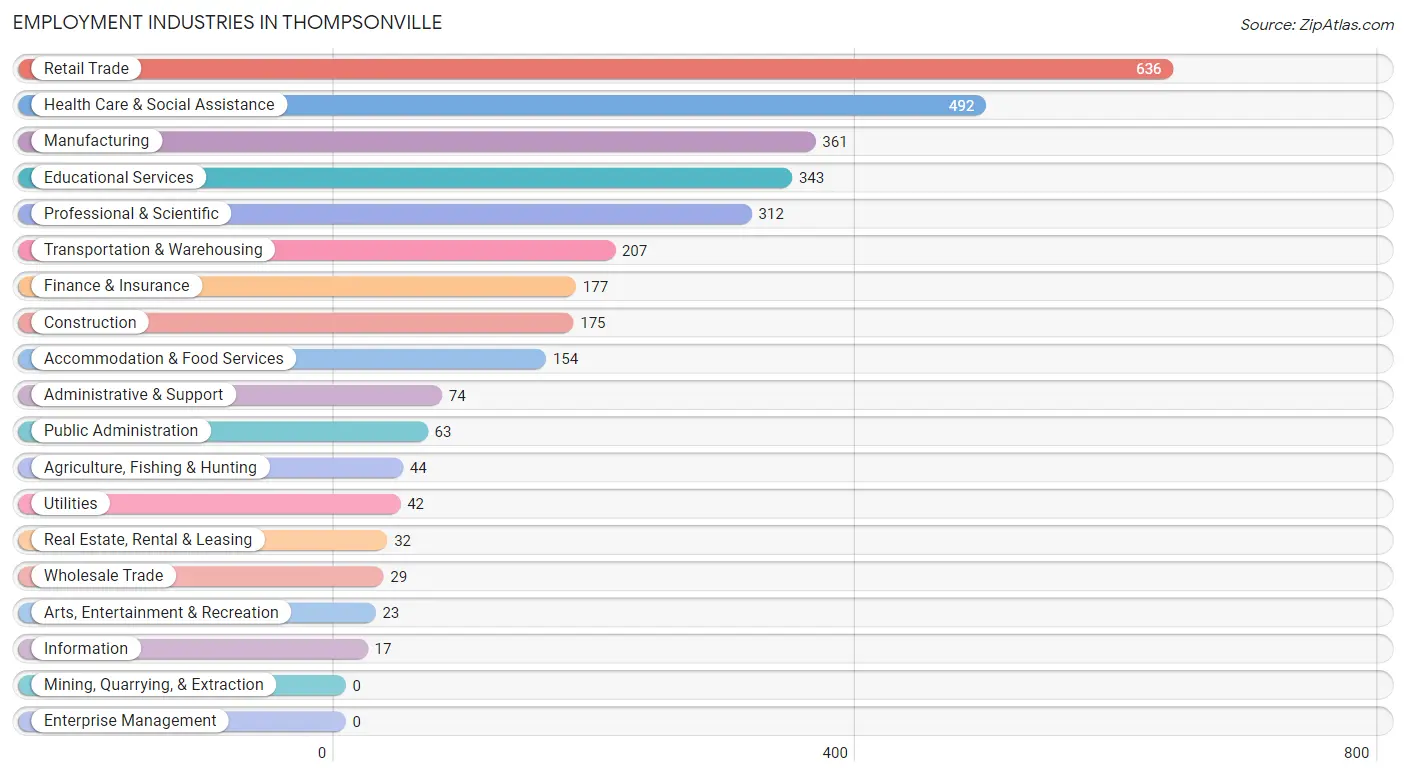
Employment Industries in Thompsonville
The major employment industries in Thompsonville include Retail Trade (636 | 18.8%), Health Care & Social Assistance (492 | 14.5%), Manufacturing (361 | 10.7%), Educational Services (343 | 10.1%), and Professional & Scientific (312 | 9.2%).
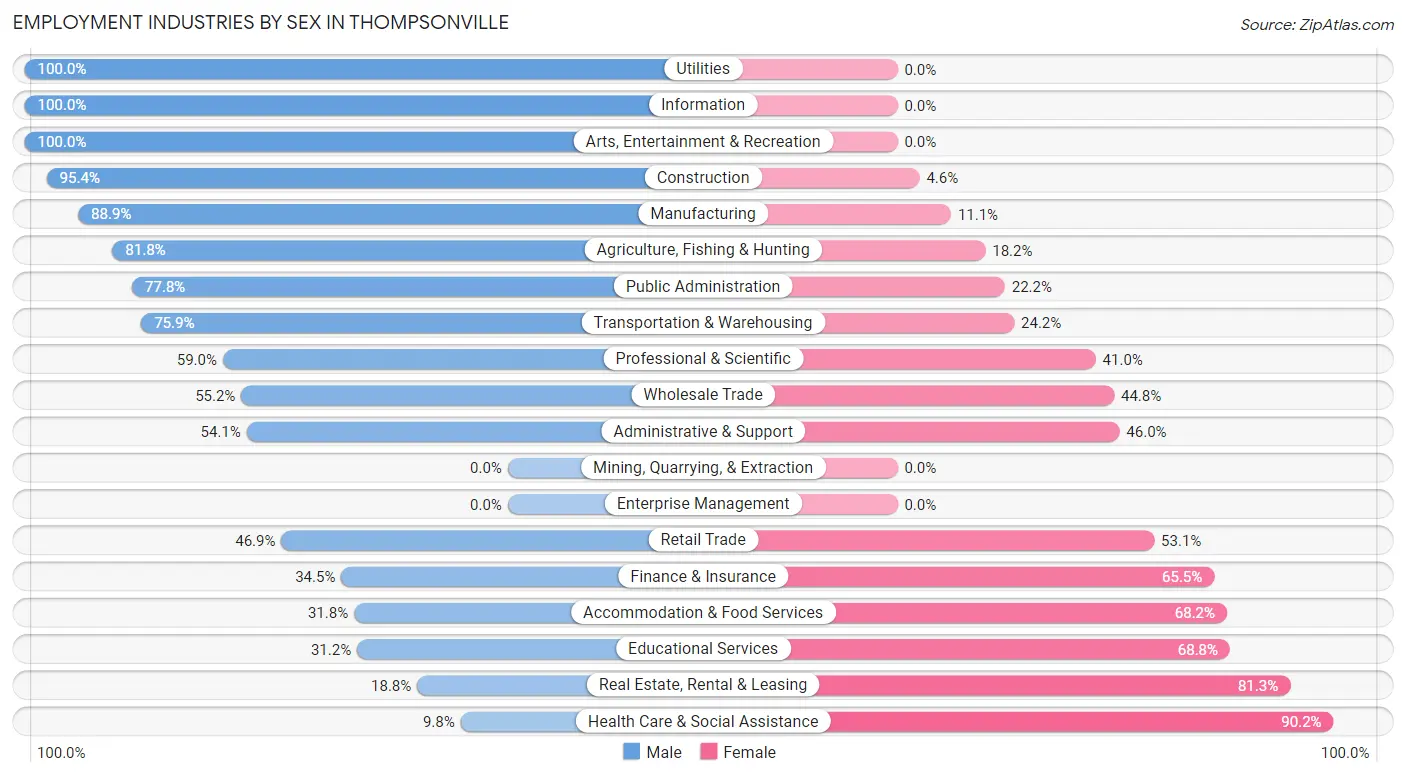
Employment Industries by Sex in Thompsonville
The Thompsonville industries that see more men than women are Utilities (100.0%), Information (100.0%), and Arts, Entertainment & Recreation (100.0%), whereas the industries that tend to have a higher number of women are Health Care & Social Assistance (90.2%), Real Estate, Rental & Leasing (81.2%), and Educational Services (68.8%).
| Industry | Male | Female |
| Agriculture, Fishing & Hunting | 36 (81.8%) | 8 (18.2%) |
| Mining, Quarrying, & Extraction | 0 (0.0%) | 0 (0.0%) |
| Construction | 167 (95.4%) | 8 (4.6%) |
| Manufacturing | 321 (88.9%) | 40 (11.1%) |
| Wholesale Trade | 16 (55.2%) | 13 (44.8%) |
| Retail Trade | 298 (46.9%) | 338 (53.1%) |
| Transportation & Warehousing | 157 (75.8%) | 50 (24.1%) |
| Utilities | 42 (100.0%) | 0 (0.0%) |
| Information | 17 (100.0%) | 0 (0.0%) |
| Finance & Insurance | 61 (34.5%) | 116 (65.5%) |
| Real Estate, Rental & Leasing | 6 (18.8%) | 26 (81.2%) |
| Professional & Scientific | 184 (59.0%) | 128 (41.0%) |
| Enterprise Management | 0 (0.0%) | 0 (0.0%) |
| Administrative & Support | 40 (54.0%) | 34 (46.0%) |
| Educational Services | 107 (31.2%) | 236 (68.8%) |
| Health Care & Social Assistance | 48 (9.8%) | 444 (90.2%) |
| Arts, Entertainment & Recreation | 23 (100.0%) | 0 (0.0%) |
| Accommodation & Food Services | 49 (31.8%) | 105 (68.2%) |
| Public Administration | 49 (77.8%) | 14 (22.2%) |
| Total | 1,701 (50.3%) | 1,680 (49.7%) |
Education in Thompsonville
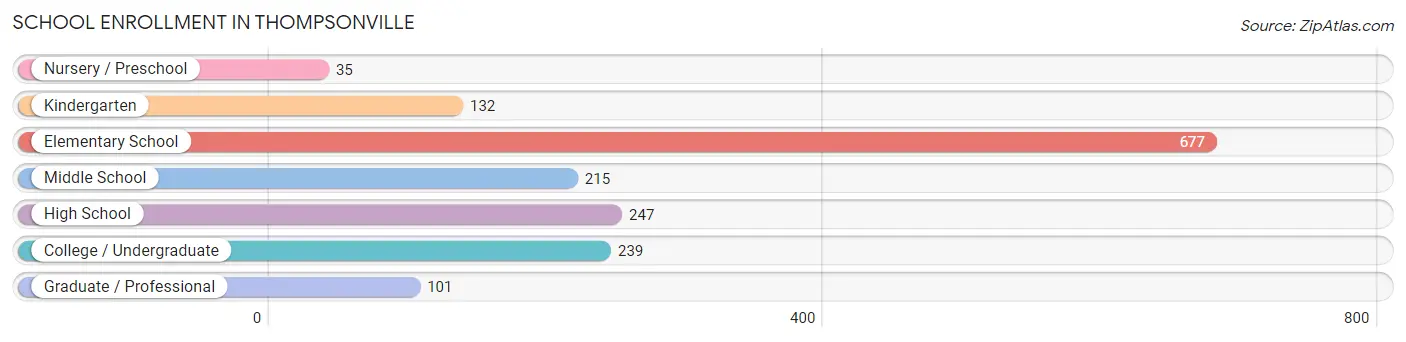
School Enrollment in Thompsonville
The most common levels of schooling among the 1,646 students in Thompsonville are elementary school (677 | 41.1%), high school (247 | 15.0%), and college / undergraduate (239 | 14.5%).
| School Level | # Students | % Students |
| Nursery / Preschool | 35 | 2.1% |
| Kindergarten | 132 | 8.0% |
| Elementary School | 677 | 41.1% |
| Middle School | 215 | 13.1% |
| High School | 247 | 15.0% |
| College / Undergraduate | 239 | 14.5% |
| Graduate / Professional | 101 | 6.1% |
| Total | 1,646 | 100.0% |
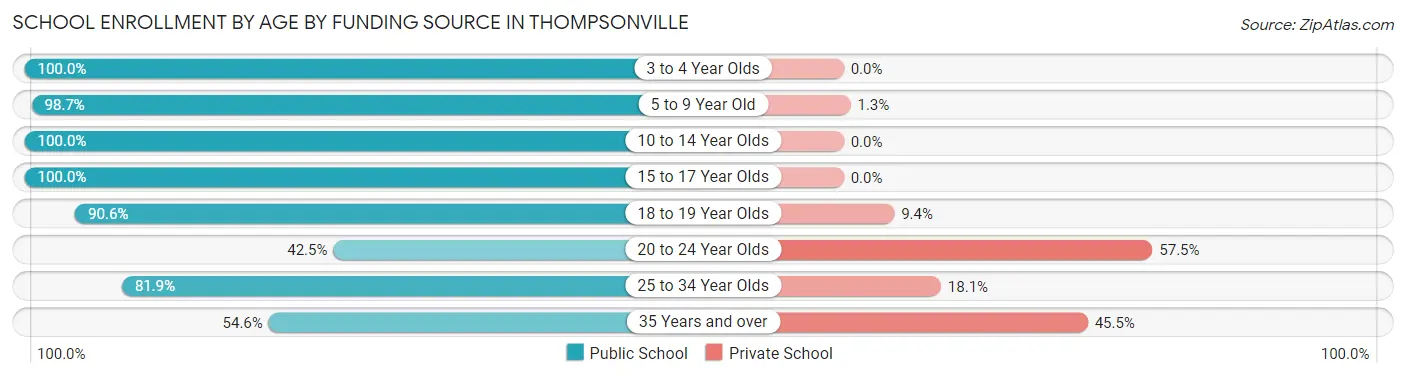
School Enrollment by Age by Funding Source in Thompsonville
Out of a total of 1,646 students who are enrolled in schools in Thompsonville, 123 (7.5%) attend a private institution, while the remaining 1,523 (92.5%) are enrolled in public schools. The age group of 20 to 24 year olds has the highest likelihood of being enrolled in private schools, with 46 (57.5% in the age bracket) enrolled. Conversely, the age group of 3 to 4 year olds has the lowest likelihood of being enrolled in a private school, with 35 (100.0% in the age bracket) attending a public institution.
| Age Bracket | Public School | Private School |
| 3 to 4 Year Olds | 35 (100.0%) | 0 (0.0%) |
| 5 to 9 Year Old | 539 (98.7%) | 7 (1.3%) |
| 10 to 14 Year Olds | 503 (100.0%) | 0 (0.0%) |
| 15 to 17 Year Olds | 140 (100.0%) | 0 (0.0%) |
| 18 to 19 Year Olds | 125 (90.6%) | 13 (9.4%) |
| 20 to 24 Year Olds | 34 (42.5%) | 46 (57.5%) |
| 25 to 34 Year Olds | 104 (81.9%) | 23 (18.1%) |
| 35 Years and over | 42 (54.5%) | 35 (45.5%) |
| Total | 1,523 (92.5%) | 123 (7.5%) |
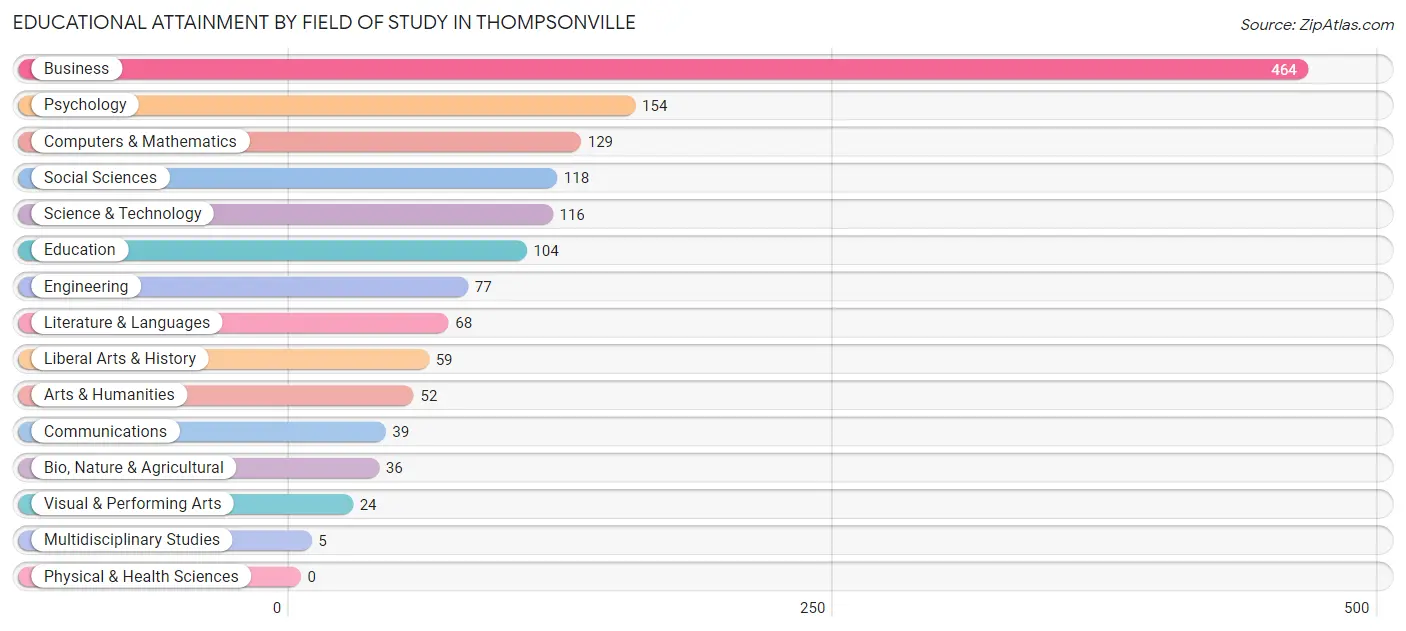
Educational Attainment by Field of Study in Thompsonville
Business (464 | 32.1%), psychology (154 | 10.7%), computers & mathematics (129 | 8.9%), social sciences (118 | 8.2%), and science & technology (116 | 8.0%) are the most common fields of study among 1,445 individuals in Thompsonville who have obtained a bachelor's degree or higher.
| Field of Study | # Graduates | % Graduates |
| Computers & Mathematics | 129 | 8.9% |
| Bio, Nature & Agricultural | 36 | 2.5% |
| Physical & Health Sciences | 0 | 0.0% |
| Psychology | 154 | 10.7% |
| Social Sciences | 118 | 8.2% |
| Engineering | 77 | 5.3% |
| Multidisciplinary Studies | 5 | 0.4% |
| Science & Technology | 116 | 8.0% |
| Business | 464 | 32.1% |
| Education | 104 | 7.2% |
| Literature & Languages | 68 | 4.7% |
| Liberal Arts & History | 59 | 4.1% |
| Visual & Performing Arts | 24 | 1.7% |
| Communications | 39 | 2.7% |
| Arts & Humanities | 52 | 3.6% |
| Total | 1,445 | 100.0% |
Transportation & Commute in Thompsonville
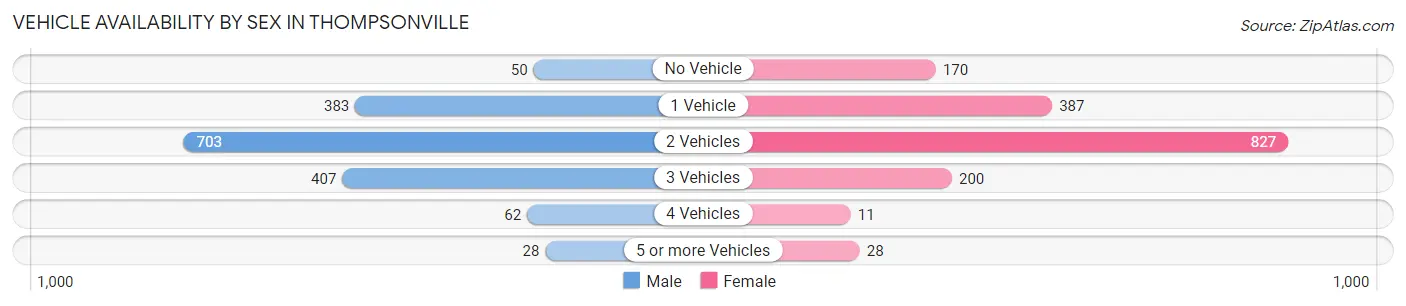
Vehicle Availability by Sex in Thompsonville
The most prevalent vehicle ownership categories in Thompsonville are males with 2 vehicles (703, accounting for 43.0%) and females with 2 vehicles (827, making up 43.3%).
| Vehicles Available | Male | Female |
| No Vehicle | 50 (3.1%) | 170 (10.5%) |
| 1 Vehicle | 383 (23.4%) | 387 (23.8%) |
| 2 Vehicles | 703 (43.0%) | 827 (51.0%) |
| 3 Vehicles | 407 (24.9%) | 200 (12.3%) |
| 4 Vehicles | 62 (3.8%) | 11 (0.7%) |
| 5 or more Vehicles | 28 (1.7%) | 28 (1.7%) |
| Total | 1,633 (100.0%) | 1,623 (100.0%) |
Commute Time in Thompsonville
The most frequently occuring commute durations in Thompsonville are 30 to 34 minutes (607 commuters, 19.7%), 10 to 14 minutes (573 commuters, 18.6%), and 5 to 9 minutes (520 commuters, 16.9%).
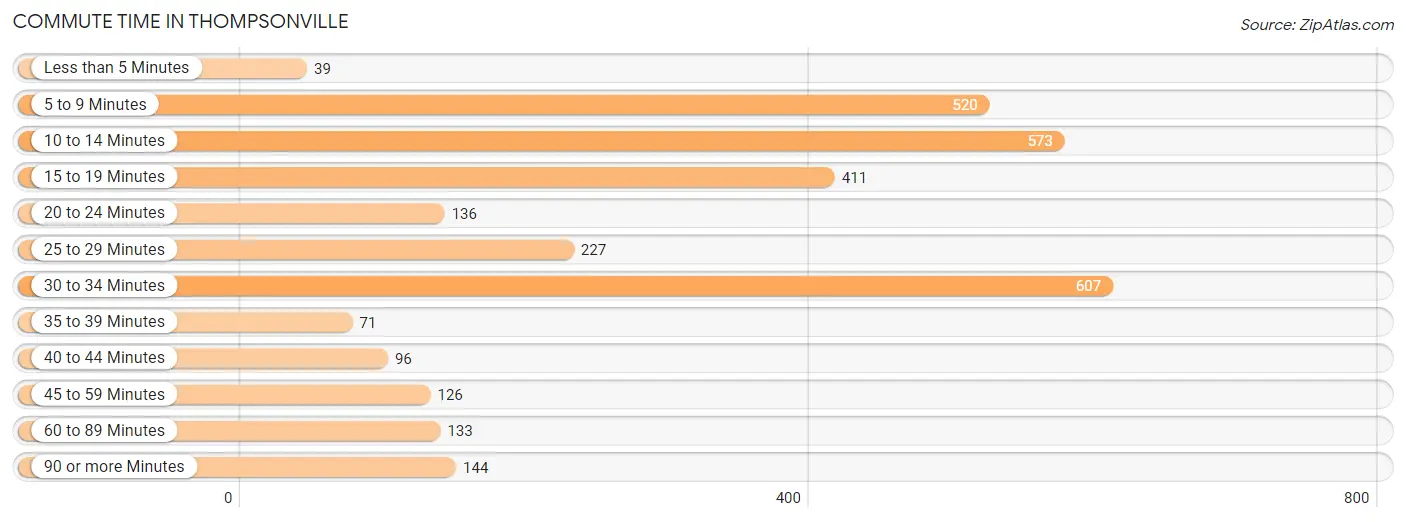
| Commute Time | # Commuters | % Commuters |
| Less than 5 Minutes | 39 | 1.3% |
| 5 to 9 Minutes | 520 | 16.9% |
| 10 to 14 Minutes | 573 | 18.6% |
| 15 to 19 Minutes | 411 | 13.3% |
| 20 to 24 Minutes | 136 | 4.4% |
| 25 to 29 Minutes | 227 | 7.4% |
| 30 to 34 Minutes | 607 | 19.7% |
| 35 to 39 Minutes | 71 | 2.3% |
| 40 to 44 Minutes | 96 | 3.1% |
| 45 to 59 Minutes | 126 | 4.1% |
| 60 to 89 Minutes | 133 | 4.3% |
| 90 or more Minutes | 144 | 4.7% |
Commute Time by Sex in Thompsonville
The most common commute times in Thompsonville are 30 to 34 minutes (400 commuters, 25.1%) for males and 5 to 9 minutes (401 commuters, 26.9%) for females.
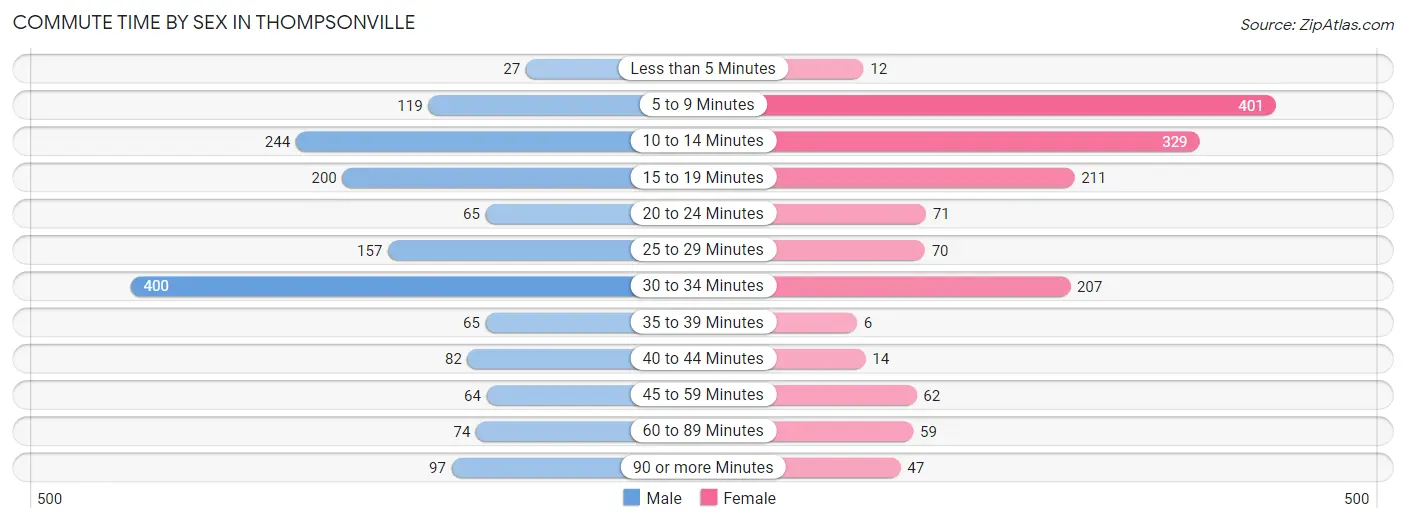
| Commute Time | Male | Female |
| Less than 5 Minutes | 27 (1.7%) | 12 (0.8%) |
| 5 to 9 Minutes | 119 (7.5%) | 401 (26.9%) |
| 10 to 14 Minutes | 244 (15.3%) | 329 (22.1%) |
| 15 to 19 Minutes | 200 (12.6%) | 211 (14.2%) |
| 20 to 24 Minutes | 65 (4.1%) | 71 (4.8%) |
| 25 to 29 Minutes | 157 (9.9%) | 70 (4.7%) |
| 30 to 34 Minutes | 400 (25.1%) | 207 (13.9%) |
| 35 to 39 Minutes | 65 (4.1%) | 6 (0.4%) |
| 40 to 44 Minutes | 82 (5.1%) | 14 (0.9%) |
| 45 to 59 Minutes | 64 (4.0%) | 62 (4.2%) |
| 60 to 89 Minutes | 74 (4.6%) | 59 (4.0%) |
| 90 or more Minutes | 97 (6.1%) | 47 (3.2%) |
Time of Departure to Work by Sex in Thompsonville
The most frequent times of departure to work in Thompsonville are 7:00 AM to 7:29 AM (349, 21.9%) for males and 7:30 AM to 7:59 AM (289, 19.4%) for females.
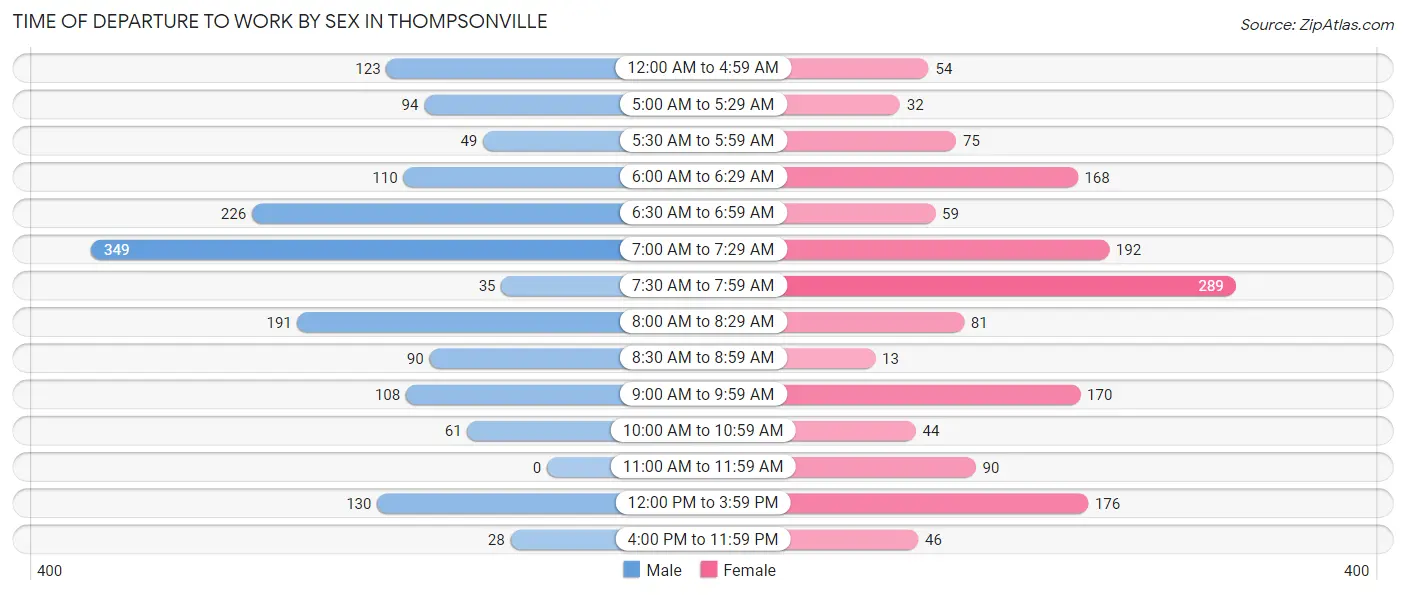
| Time of Departure | Male | Female |
| 12:00 AM to 4:59 AM | 123 (7.7%) | 54 (3.6%) |
| 5:00 AM to 5:29 AM | 94 (5.9%) | 32 (2.1%) |
| 5:30 AM to 5:59 AM | 49 (3.1%) | 75 (5.0%) |
| 6:00 AM to 6:29 AM | 110 (6.9%) | 168 (11.3%) |
| 6:30 AM to 6:59 AM | 226 (14.2%) | 59 (4.0%) |
| 7:00 AM to 7:29 AM | 349 (21.9%) | 192 (12.9%) |
| 7:30 AM to 7:59 AM | 35 (2.2%) | 289 (19.4%) |
| 8:00 AM to 8:29 AM | 191 (12.0%) | 81 (5.4%) |
| 8:30 AM to 8:59 AM | 90 (5.7%) | 13 (0.9%) |
| 9:00 AM to 9:59 AM | 108 (6.8%) | 170 (11.4%) |
| 10:00 AM to 10:59 AM | 61 (3.8%) | 44 (3.0%) |
| 11:00 AM to 11:59 AM | 0 (0.0%) | 90 (6.0%) |
| 12:00 PM to 3:59 PM | 130 (8.2%) | 176 (11.8%) |
| 4:00 PM to 11:59 PM | 28 (1.8%) | 46 (3.1%) |
| Total | 1,594 (100.0%) | 1,489 (100.0%) |
Housing Occupancy in Thompsonville
Occupancy by Ownership in Thompsonville
Of the total 3,261 dwellings in Thompsonville, owner-occupied units account for 1,421 (43.6%), while renter-occupied units make up 1,840 (56.4%).
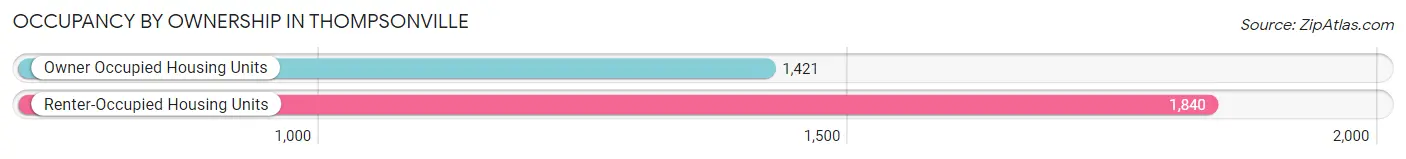
| Occupancy | # Housing Units | % Housing Units |
| Owner Occupied Housing Units | 1,421 | 43.6% |
| Renter-Occupied Housing Units | 1,840 | 56.4% |
| Total Occupied Housing Units | 3,261 | 100.0% |
Occupancy by Household Size in Thompsonville
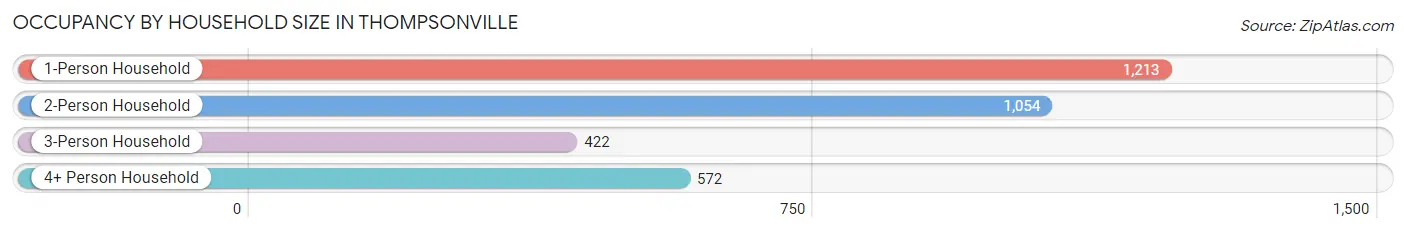
| Household Size | # Housing Units | % Housing Units |
| 1-Person Household | 1,213 | 37.2% |
| 2-Person Household | 1,054 | 32.3% |
| 3-Person Household | 422 | 12.9% |
| 4+ Person Household | 572 | 17.5% |
| Total Housing Units | 3,261 | 100.0% |
Occupancy by Ownership by Household Size in Thompsonville
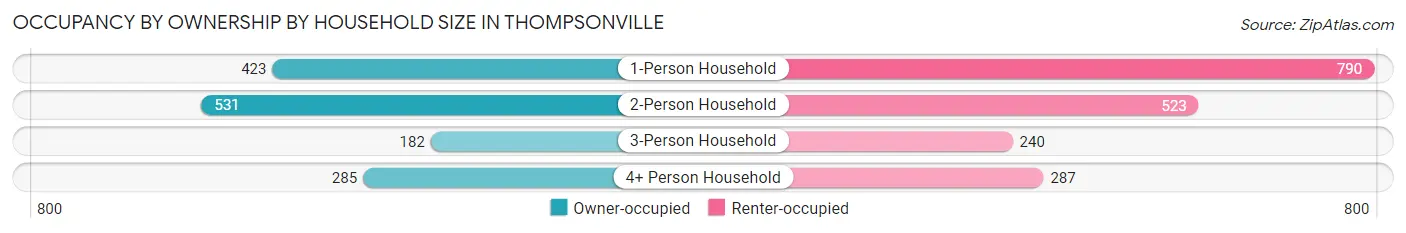
| Household Size | Owner-occupied | Renter-occupied |
| 1-Person Household | 423 (34.9%) | 790 (65.1%) |
| 2-Person Household | 531 (50.4%) | 523 (49.6%) |
| 3-Person Household | 182 (43.1%) | 240 (56.9%) |
| 4+ Person Household | 285 (49.8%) | 287 (50.2%) |
| Total Housing Units | 1,421 (43.6%) | 1,840 (56.4%) |
Occupancy by Educational Attainment in Thompsonville
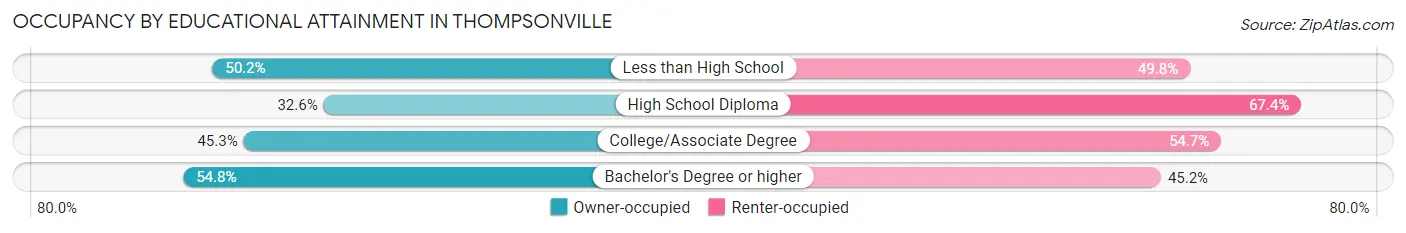
| Household Size | Owner-occupied | Renter-occupied |
| Less than High School | 114 (50.2%) | 113 (49.8%) |
| High School Diploma | 352 (32.6%) | 728 (67.4%) |
| College/Associate Degree | 552 (45.3%) | 667 (54.7%) |
| Bachelor's Degree or higher | 403 (54.8%) | 332 (45.2%) |
Occupancy by Age of Householder in Thompsonville
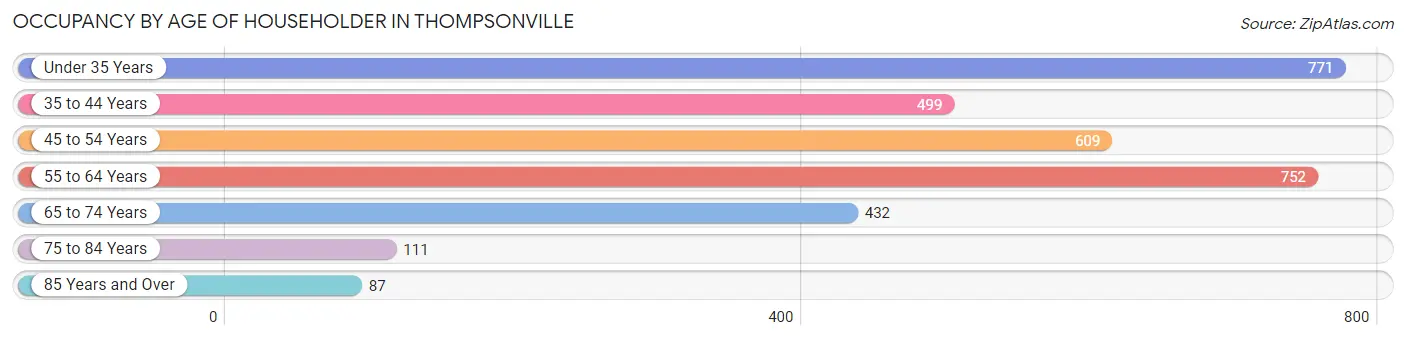
| Age Bracket | # Households | % Households |
| Under 35 Years | 771 | 23.6% |
| 35 to 44 Years | 499 | 15.3% |
| 45 to 54 Years | 609 | 18.7% |
| 55 to 64 Years | 752 | 23.1% |
| 65 to 74 Years | 432 | 13.3% |
| 75 to 84 Years | 111 | 3.4% |
| 85 Years and Over | 87 | 2.7% |
| Total | 3,261 | 100.0% |
Housing Finances in Thompsonville
Median Income by Occupancy in Thompsonville
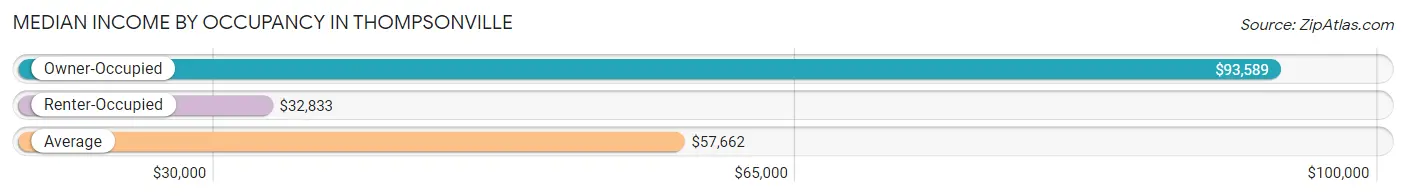
| Occupancy Type | # Households | Median Income |
| Owner-Occupied | 1,421 (43.6%) | $93,589 |
| Renter-Occupied | 1,840 (56.4%) | $32,833 |
| Average | 3,261 (100.0%) | $57,662 |
Occupancy by Householder Income Bracket in Thompsonville
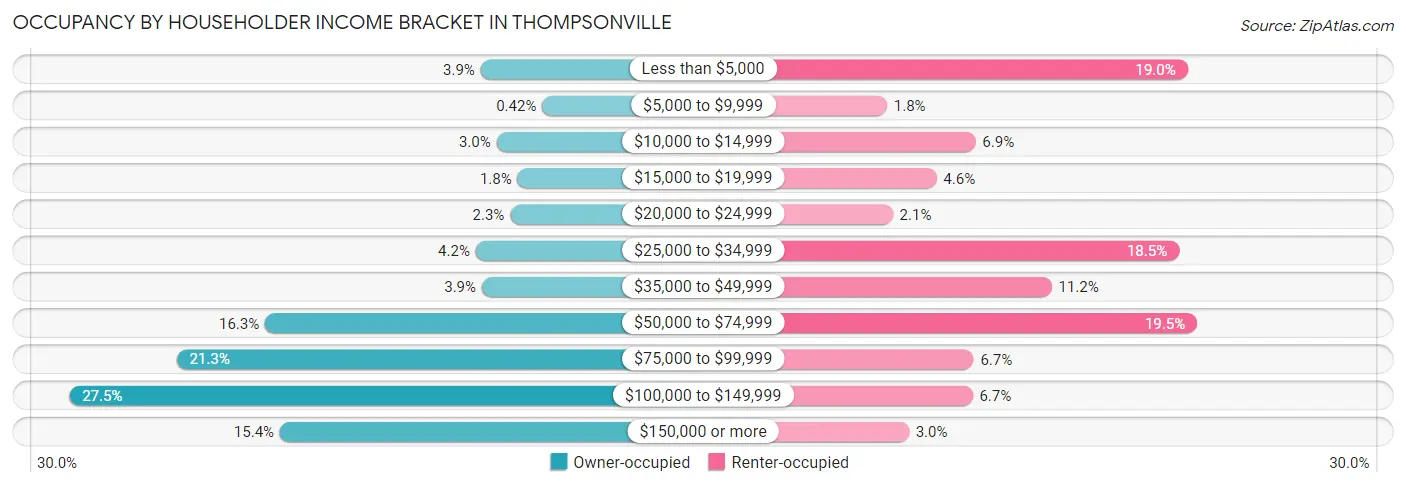
| Income Bracket | Owner-occupied | Renter-occupied |
| Less than $5,000 | 56 (3.9%) | 349 (19.0%) |
| $5,000 to $9,999 | 6 (0.4%) | 33 (1.8%) |
| $10,000 to $14,999 | 43 (3.0%) | 126 (6.9%) |
| $15,000 to $19,999 | 26 (1.8%) | 85 (4.6%) |
| $20,000 to $24,999 | 32 (2.2%) | 39 (2.1%) |
| $25,000 to $34,999 | 60 (4.2%) | 340 (18.5%) |
| $35,000 to $49,999 | 55 (3.9%) | 206 (11.2%) |
| $50,000 to $74,999 | 231 (16.3%) | 359 (19.5%) |
| $75,000 to $99,999 | 303 (21.3%) | 124 (6.7%) |
| $100,000 to $149,999 | 390 (27.5%) | 123 (6.7%) |
| $150,000 or more | 219 (15.4%) | 56 (3.0%) |
| Total | 1,421 (100.0%) | 1,840 (100.0%) |
Monthly Housing Cost Tiers in Thompsonville
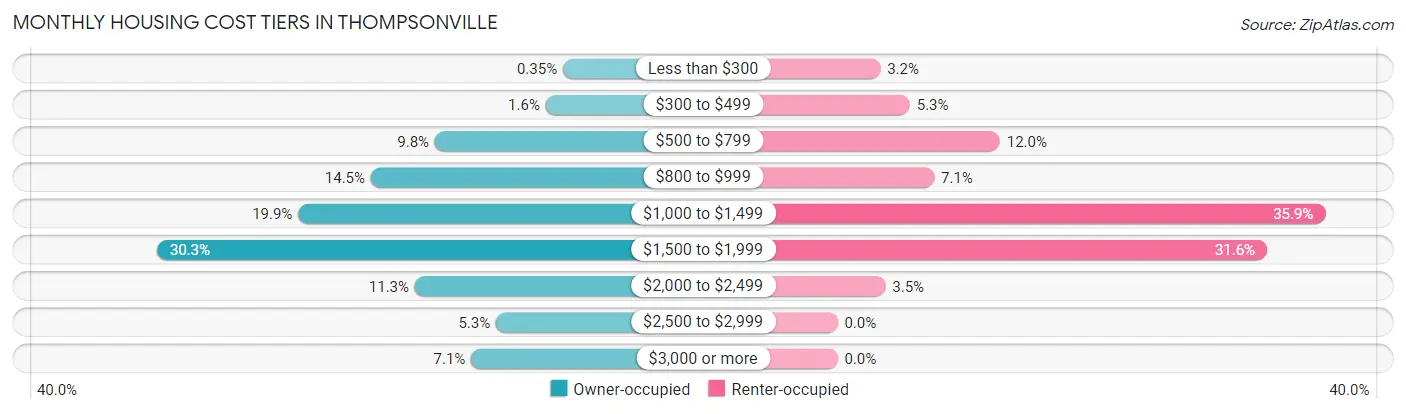
| Monthly Cost | Owner-occupied | Renter-occupied |
| Less than $300 | 5 (0.4%) | 58 (3.2%) |
| $300 to $499 | 23 (1.6%) | 98 (5.3%) |
| $500 to $799 | 139 (9.8%) | 220 (12.0%) |
| $800 to $999 | 206 (14.5%) | 131 (7.1%) |
| $1,000 to $1,499 | 282 (19.9%) | 661 (35.9%) |
| $1,500 to $1,999 | 430 (30.3%) | 582 (31.6%) |
| $2,000 to $2,499 | 160 (11.3%) | 65 (3.5%) |
| $2,500 to $2,999 | 75 (5.3%) | 0 (0.0%) |
| $3,000 or more | 101 (7.1%) | 0 (0.0%) |
| Total | 1,421 (100.0%) | 1,840 (100.0%) |
Physical Housing Characteristics in Thompsonville
Housing Structures in Thompsonville
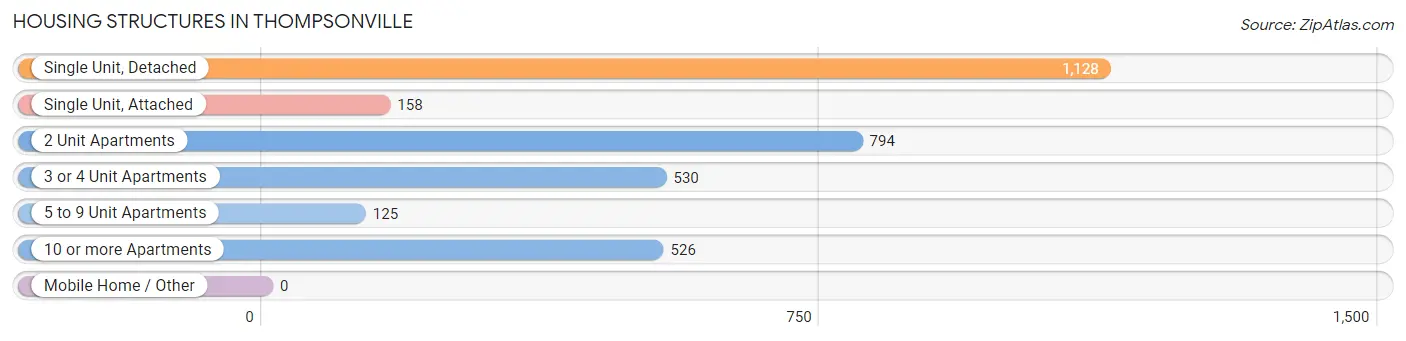
| Structure Type | # Housing Units | % Housing Units |
| Single Unit, Detached | 1,128 | 34.6% |
| Single Unit, Attached | 158 | 4.9% |
| 2 Unit Apartments | 794 | 24.3% |
| 3 or 4 Unit Apartments | 530 | 16.3% |
| 5 to 9 Unit Apartments | 125 | 3.8% |
| 10 or more Apartments | 526 | 16.1% |
| Mobile Home / Other | 0 | 0.0% |
| Total | 3,261 | 100.0% |
Housing Structures by Occupancy in Thompsonville
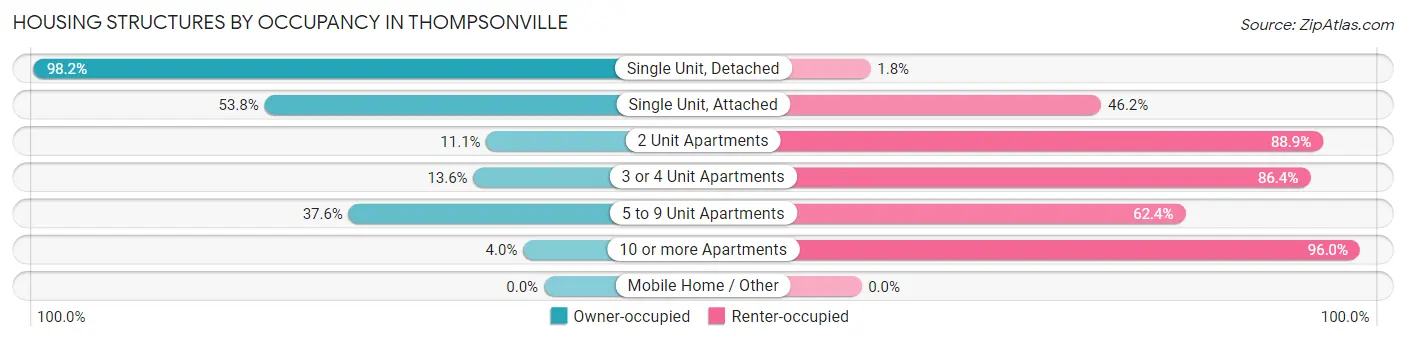
| Structure Type | Owner-occupied | Renter-occupied |
| Single Unit, Detached | 1,108 (98.2%) | 20 (1.8%) |
| Single Unit, Attached | 85 (53.8%) | 73 (46.2%) |
| 2 Unit Apartments | 88 (11.1%) | 706 (88.9%) |
| 3 or 4 Unit Apartments | 72 (13.6%) | 458 (86.4%) |
| 5 to 9 Unit Apartments | 47 (37.6%) | 78 (62.4%) |
| 10 or more Apartments | 21 (4.0%) | 505 (96.0%) |
| Mobile Home / Other | 0 (0.0%) | 0 (0.0%) |
| Total | 1,421 (43.6%) | 1,840 (56.4%) |
Housing Structures by Number of Rooms in Thompsonville
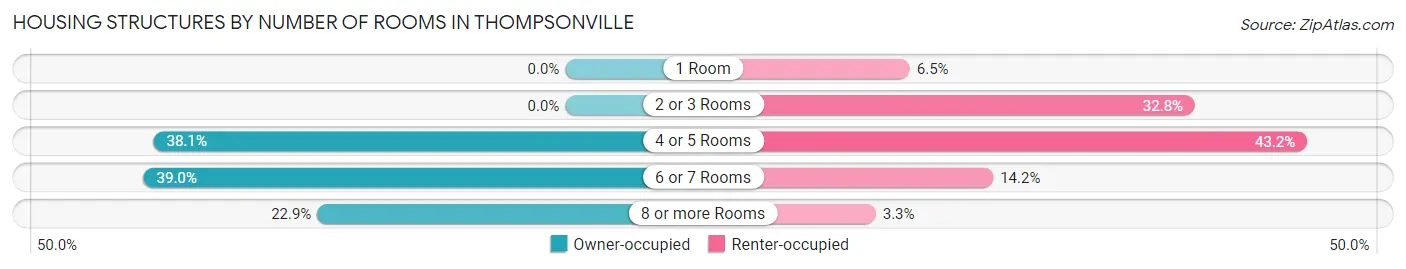
| Number of Rooms | Owner-occupied | Renter-occupied |
| 1 Room | 0 (0.0%) | 119 (6.5%) |
| 2 or 3 Rooms | 0 (0.0%) | 604 (32.8%) |
| 4 or 5 Rooms | 541 (38.1%) | 795 (43.2%) |
| 6 or 7 Rooms | 554 (39.0%) | 261 (14.2%) |
| 8 or more Rooms | 326 (22.9%) | 61 (3.3%) |
| Total | 1,421 (100.0%) | 1,840 (100.0%) |
Housing Structure by Heating Type in Thompsonville
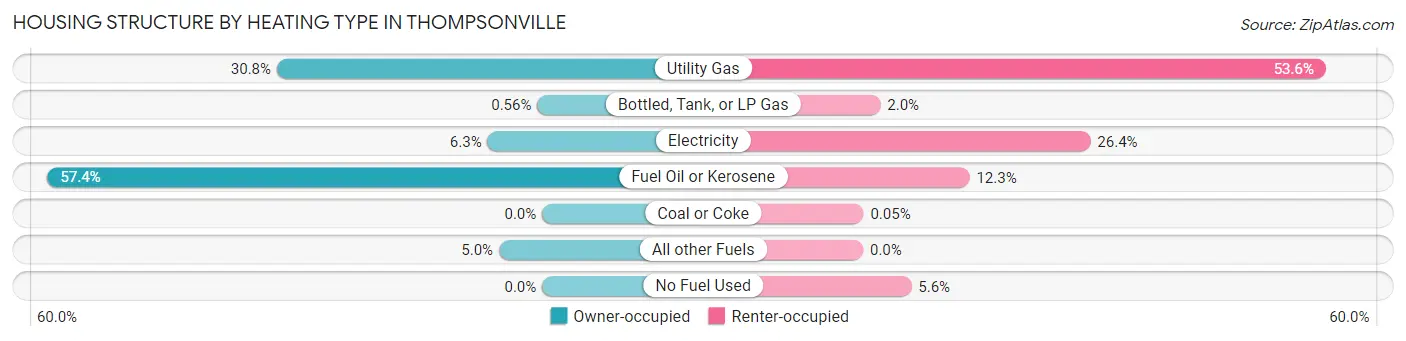
| Heating Type | Owner-occupied | Renter-occupied |
| Utility Gas | 437 (30.7%) | 987 (53.6%) |
| Bottled, Tank, or LP Gas | 8 (0.6%) | 37 (2.0%) |
| Electricity | 90 (6.3%) | 485 (26.4%) |
| Fuel Oil or Kerosene | 815 (57.4%) | 227 (12.3%) |
| Coal or Coke | 0 (0.0%) | 1 (0.1%) |
| All other Fuels | 71 (5.0%) | 0 (0.0%) |
| No Fuel Used | 0 (0.0%) | 103 (5.6%) |
| Total | 1,421 (100.0%) | 1,840 (100.0%) |
Household Vehicle Usage in Thompsonville
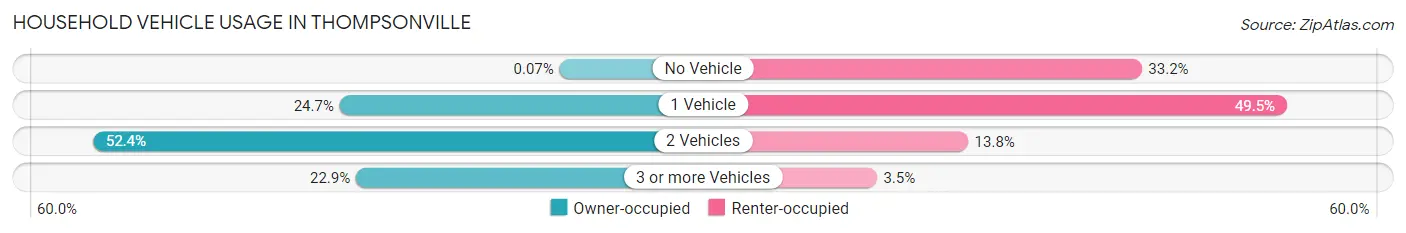
| Vehicles per Household | Owner-occupied | Renter-occupied |
| No Vehicle | 1 (0.1%) | 611 (33.2%) |
| 1 Vehicle | 351 (24.7%) | 911 (49.5%) |
| 2 Vehicles | 744 (52.4%) | 253 (13.8%) |
| 3 or more Vehicles | 325 (22.9%) | 65 (3.5%) |
| Total | 1,421 (100.0%) | 1,840 (100.0%) |
Real Estate & Mortgages in Thompsonville
Real Estate and Mortgage Overview in Thompsonville
| Characteristic | Without Mortgage | With Mortgage |
| Housing Units | 505 | 916 |
| Median Property Value | $226,900 | $216,700 |
| Median Household Income | $78,573 | $136 |
| Monthly Housing Costs | $916 | $51 |
| Real Estate Taxes | $5,865 | $10 |
Property Value by Mortgage Status in Thompsonville
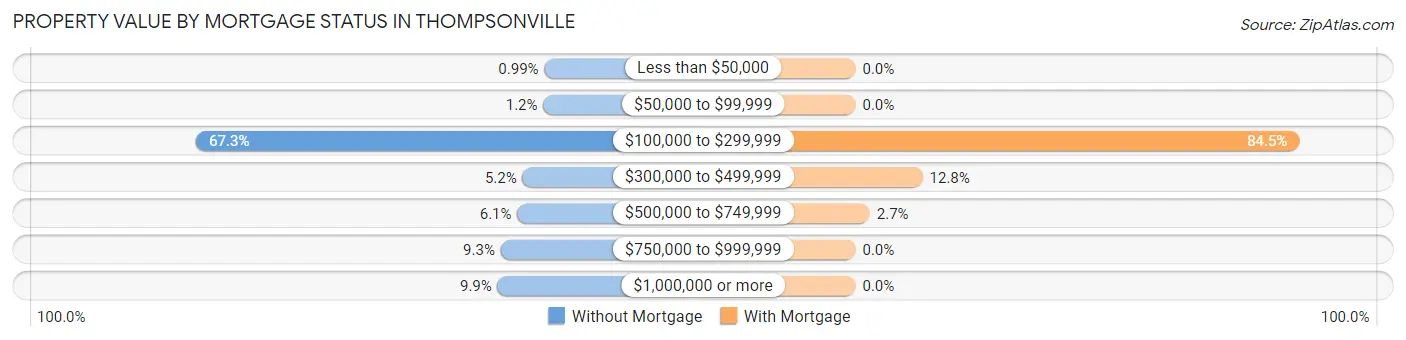
| Property Value | Without Mortgage | With Mortgage |
| Less than $50,000 | 5 (1.0%) | 0 (0.0%) |
| $50,000 to $99,999 | 6 (1.2%) | 0 (0.0%) |
| $100,000 to $299,999 | 340 (67.3%) | 774 (84.5%) |
| $300,000 to $499,999 | 26 (5.1%) | 117 (12.8%) |
| $500,000 to $749,999 | 31 (6.1%) | 25 (2.7%) |
| $750,000 to $999,999 | 47 (9.3%) | 0 (0.0%) |
| $1,000,000 or more | 50 (9.9%) | 0 (0.0%) |
| Total | 505 (100.0%) | 916 (100.0%) |
Household Income by Mortgage Status in Thompsonville
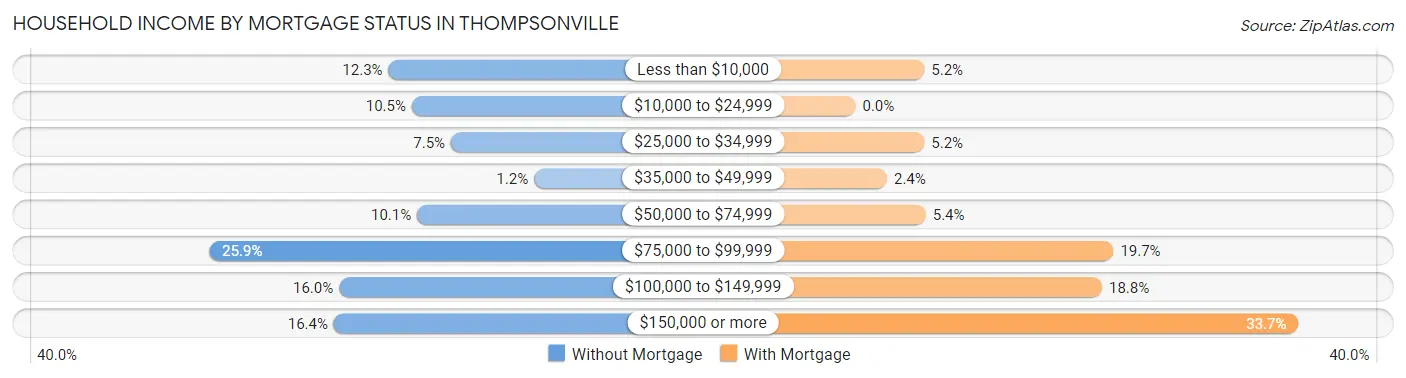
| Household Income | Without Mortgage | With Mortgage |
| Less than $10,000 | 62 (12.3%) | 48 (5.2%) |
| $10,000 to $24,999 | 53 (10.5%) | 0 (0.0%) |
| $25,000 to $34,999 | 38 (7.5%) | 48 (5.2%) |
| $35,000 to $49,999 | 6 (1.2%) | 22 (2.4%) |
| $50,000 to $74,999 | 51 (10.1%) | 49 (5.3%) |
| $75,000 to $99,999 | 131 (25.9%) | 180 (19.7%) |
| $100,000 to $149,999 | 81 (16.0%) | 172 (18.8%) |
| $150,000 or more | 83 (16.4%) | 309 (33.7%) |
| Total | 505 (100.0%) | 916 (100.0%) |
Property Value to Household Income Ratio in Thompsonville
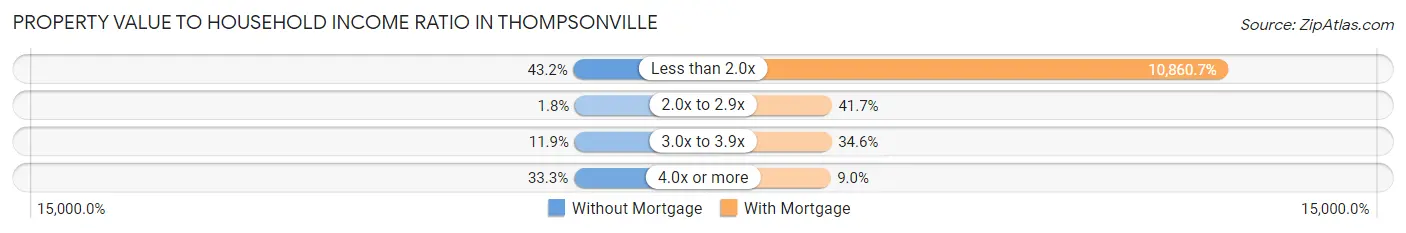
| Value-to-Income Ratio | Without Mortgage | With Mortgage |
| Less than 2.0x | 218 (43.2%) | 99,484 (10,860.7%) |
| 2.0x to 2.9x | 9 (1.8%) | 382 (41.7%) |
| 3.0x to 3.9x | 60 (11.9%) | 317 (34.6%) |
| 4.0x or more | 168 (33.3%) | 82 (8.9%) |
| Total | 505 (100.0%) | 916 (100.0%) |
Real Estate Taxes by Mortgage Status in Thompsonville
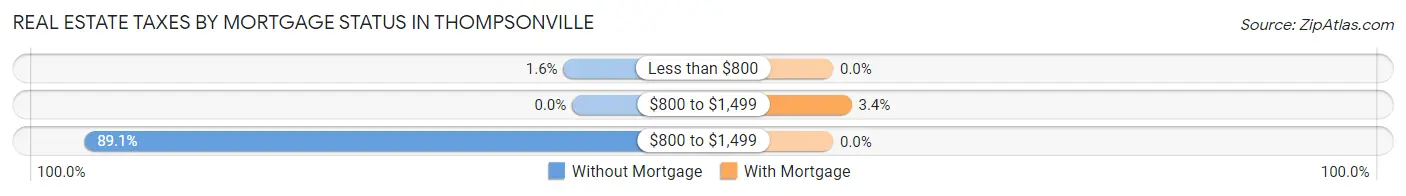
| Property Taxes | Without Mortgage | With Mortgage |
| Less than $800 | 8 (1.6%) | 0 (0.0%) |
| $800 to $1,499 | 0 (0.0%) | 31 (3.4%) |
| $800 to $1,499 | 450 (89.1%) | 0 (0.0%) |
| Total | 505 (100.0%) | 916 (100.0%) |
Health & Disability in Thompsonville
Health Insurance Coverage by Age in Thompsonville
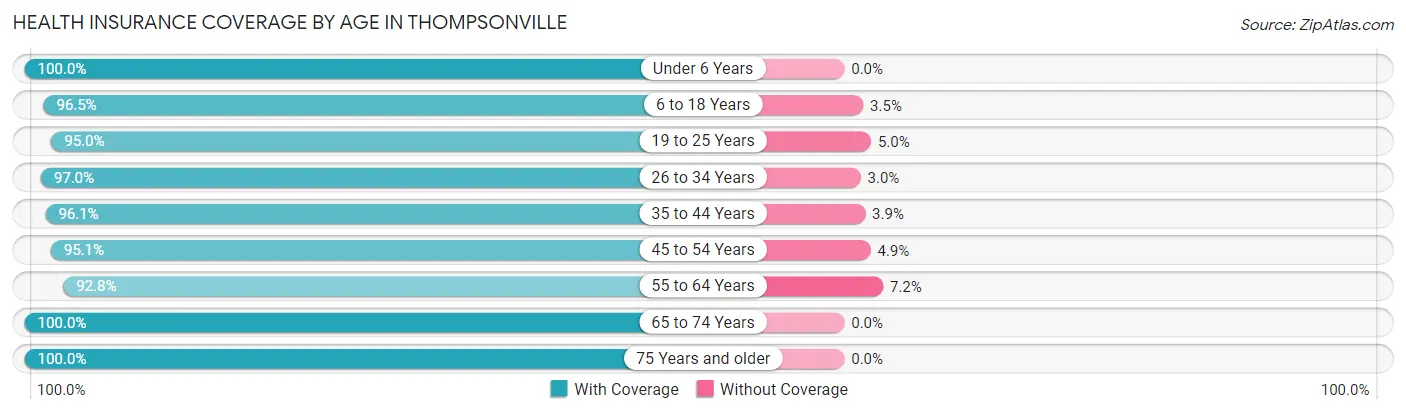
| Age Bracket | With Coverage | Without Coverage |
| Under 6 Years | 779 (100.0%) | 0 (0.0%) |
| 6 to 18 Years | 1,287 (96.5%) | 47 (3.5%) |
| 19 to 25 Years | 553 (95.0%) | 29 (5.0%) |
| 26 to 34 Years | 1,309 (97.0%) | 41 (3.0%) |
| 35 to 44 Years | 765 (96.1%) | 31 (3.9%) |
| 45 to 54 Years | 934 (95.1%) | 48 (4.9%) |
| 55 to 64 Years | 1,055 (92.8%) | 82 (7.2%) |
| 65 to 74 Years | 672 (100.0%) | 0 (0.0%) |
| 75 Years and older | 260 (100.0%) | 0 (0.0%) |
| Total | 7,614 (96.5%) | 278 (3.5%) |
Health Insurance Coverage by Citizenship Status in Thompsonville
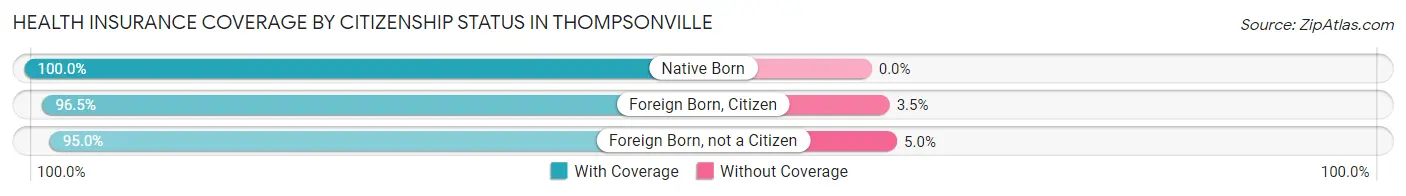
| Citizenship Status | With Coverage | Without Coverage |
| Native Born | 779 (100.0%) | 0 (0.0%) |
| Foreign Born, Citizen | 1,287 (96.5%) | 47 (3.5%) |
| Foreign Born, not a Citizen | 553 (95.0%) | 29 (5.0%) |
Health Insurance Coverage by Household Income in Thompsonville
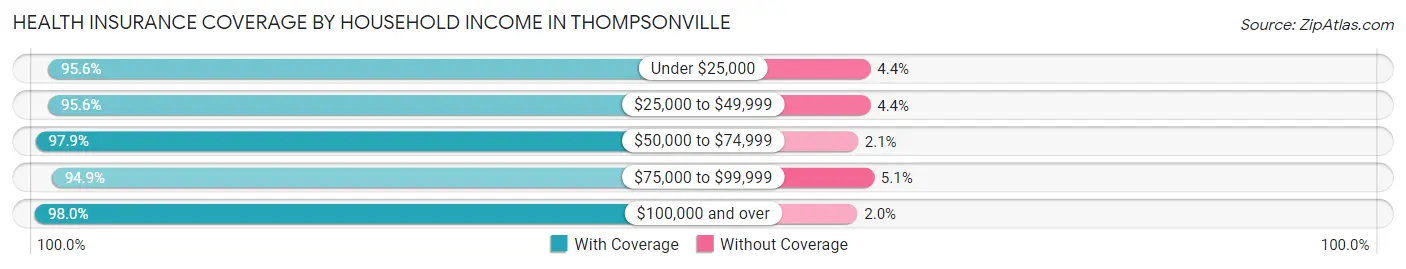
| Household Income | With Coverage | Without Coverage |
| Under $25,000 | 2,036 (95.6%) | 94 (4.4%) |
| $25,000 to $49,999 | 1,021 (95.6%) | 47 (4.4%) |
| $50,000 to $74,999 | 1,184 (97.9%) | 25 (2.1%) |
| $75,000 to $99,999 | 1,383 (94.9%) | 74 (5.1%) |
| $100,000 and over | 1,887 (98.0%) | 38 (2.0%) |
Public vs Private Health Insurance Coverage by Age in Thompsonville
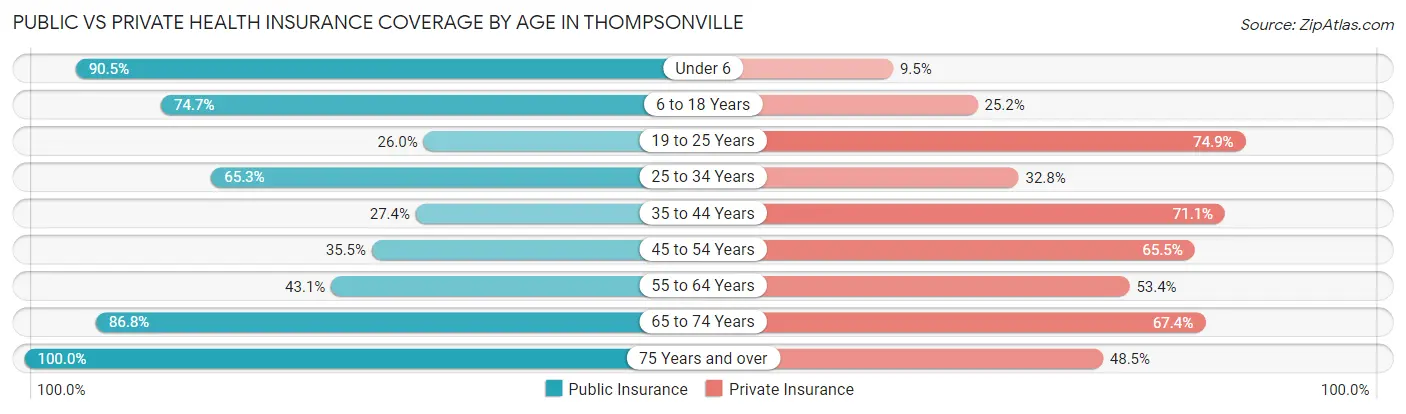
| Age Bracket | Public Insurance | Private Insurance |
| Under 6 | 705 (90.5%) | 74 (9.5%) |
| 6 to 18 Years | 996 (74.7%) | 336 (25.2%) |
| 19 to 25 Years | 151 (26.0%) | 436 (74.9%) |
| 25 to 34 Years | 882 (65.3%) | 443 (32.8%) |
| 35 to 44 Years | 218 (27.4%) | 566 (71.1%) |
| 45 to 54 Years | 349 (35.5%) | 643 (65.5%) |
| 55 to 64 Years | 490 (43.1%) | 607 (53.4%) |
| 65 to 74 Years | 583 (86.8%) | 453 (67.4%) |
| 75 Years and over | 260 (100.0%) | 126 (48.5%) |
| Total | 4,634 (58.7%) | 3,684 (46.7%) |
Disability Status by Sex by Age in Thompsonville
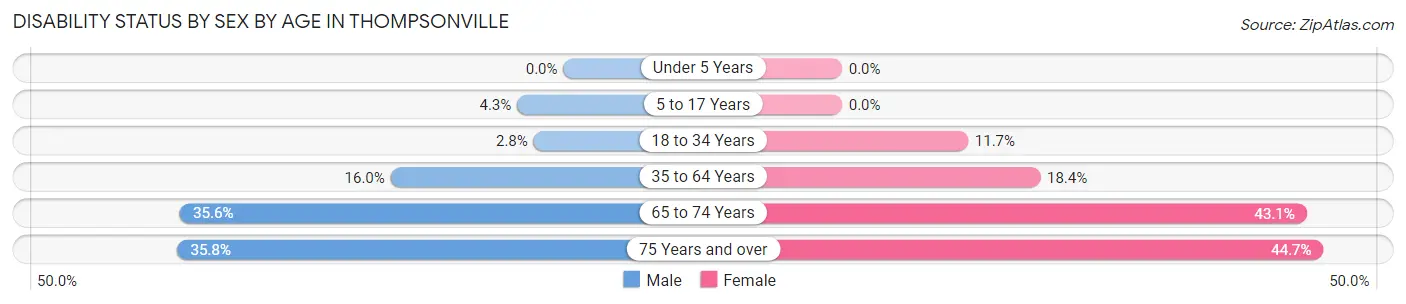
| Age Bracket | Male | Female |
| Under 5 Years | 0 (0.0%) | 0 (0.0%) |
| 5 to 17 Years | 31 (4.3%) | 0 (0.0%) |
| 18 to 34 Years | 31 (2.8%) | 106 (11.7%) |
| 35 to 64 Years | 225 (16.0%) | 278 (18.4%) |
| 65 to 74 Years | 112 (35.6%) | 154 (43.1%) |
| 75 Years and over | 29 (35.8%) | 80 (44.7%) |
Disability Class by Sex by Age in Thompsonville
Disability Class: Hearing Difficulty
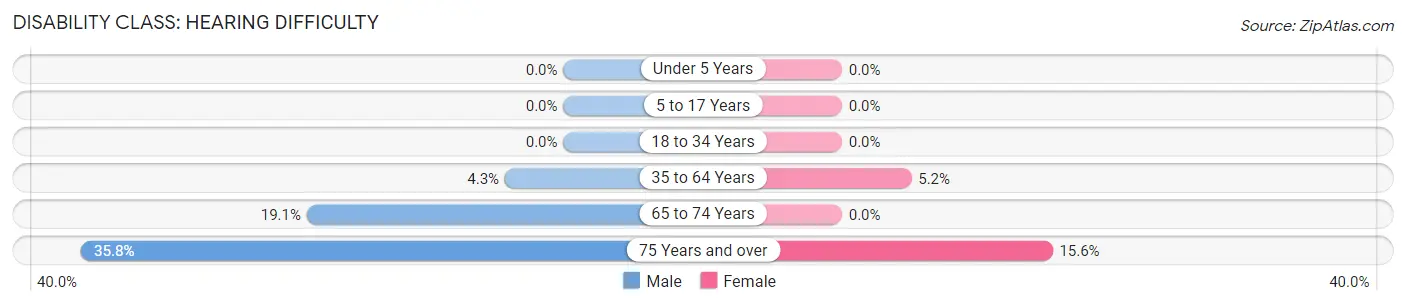
| Age Bracket | Male | Female |
| Under 5 Years | 0 (0.0%) | 0 (0.0%) |
| 5 to 17 Years | 0 (0.0%) | 0 (0.0%) |
| 18 to 34 Years | 0 (0.0%) | 0 (0.0%) |
| 35 to 64 Years | 61 (4.3%) | 78 (5.2%) |
| 65 to 74 Years | 60 (19.1%) | 0 (0.0%) |
| 75 Years and over | 29 (35.8%) | 28 (15.6%) |
Disability Class: Vision Difficulty
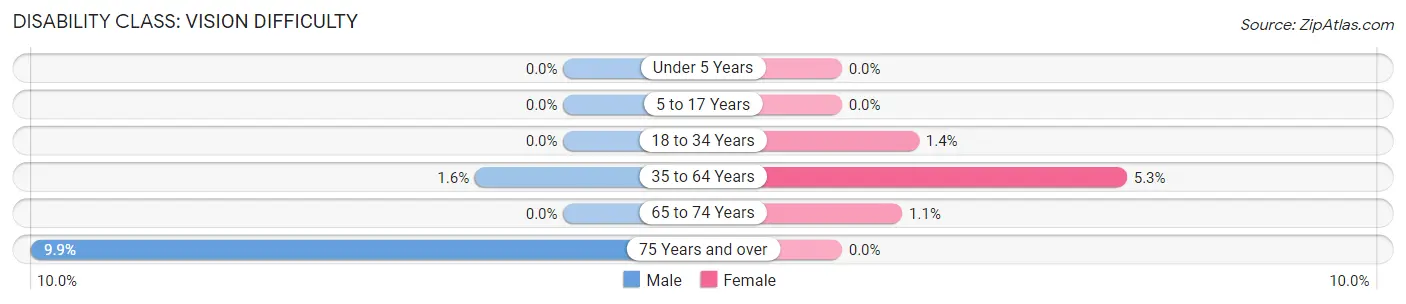
| Age Bracket | Male | Female |
| Under 5 Years | 0 (0.0%) | 0 (0.0%) |
| 5 to 17 Years | 0 (0.0%) | 0 (0.0%) |
| 18 to 34 Years | 0 (0.0%) | 13 (1.4%) |
| 35 to 64 Years | 23 (1.6%) | 80 (5.3%) |
| 65 to 74 Years | 0 (0.0%) | 4 (1.1%) |
| 75 Years and over | 8 (9.9%) | 0 (0.0%) |
Disability Class: Cognitive Difficulty
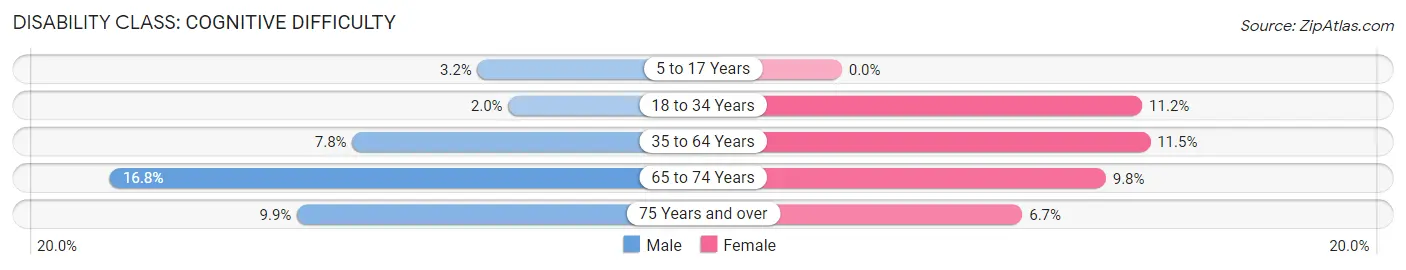
| Age Bracket | Male | Female |
| 5 to 17 Years | 23 (3.2%) | 0 (0.0%) |
| 18 to 34 Years | 23 (2.0%) | 101 (11.2%) |
| 35 to 64 Years | 110 (7.8%) | 173 (11.5%) |
| 65 to 74 Years | 53 (16.8%) | 35 (9.8%) |
| 75 Years and over | 8 (9.9%) | 12 (6.7%) |
Disability Class: Ambulatory Difficulty
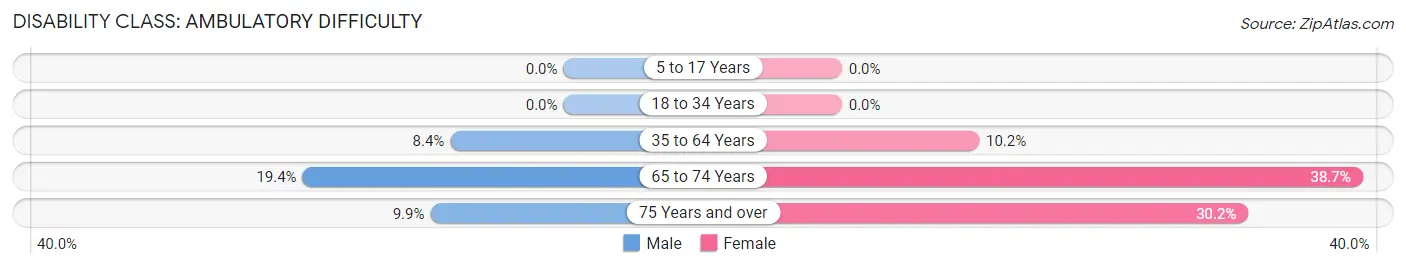
| Age Bracket | Male | Female |
| 5 to 17 Years | 0 (0.0%) | 0 (0.0%) |
| 18 to 34 Years | 0 (0.0%) | 0 (0.0%) |
| 35 to 64 Years | 118 (8.4%) | 154 (10.2%) |
| 65 to 74 Years | 61 (19.4%) | 138 (38.7%) |
| 75 Years and over | 8 (9.9%) | 54 (30.2%) |
Disability Class: Self-Care Difficulty
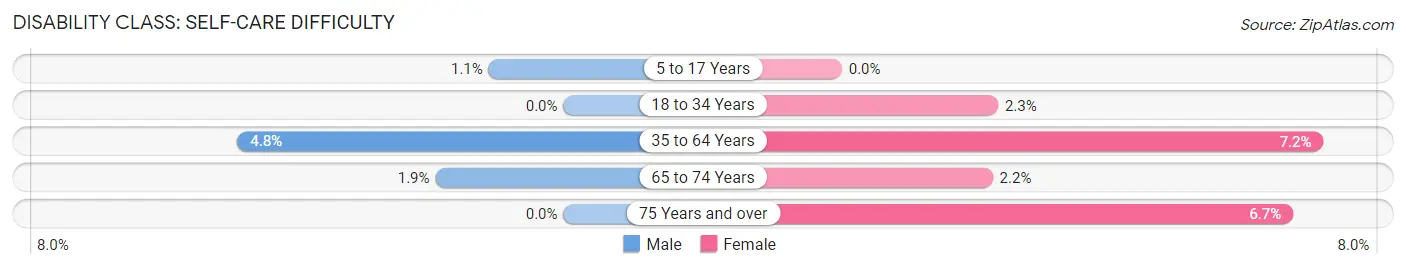
| Age Bracket | Male | Female |
| 5 to 17 Years | 8 (1.1%) | 0 (0.0%) |
| 18 to 34 Years | 0 (0.0%) | 21 (2.3%) |
| 35 to 64 Years | 68 (4.8%) | 108 (7.1%) |
| 65 to 74 Years | 6 (1.9%) | 8 (2.2%) |
| 75 Years and over | 0 (0.0%) | 12 (6.7%) |
Technology Access in Thompsonville
Computing Device Access in Thompsonville
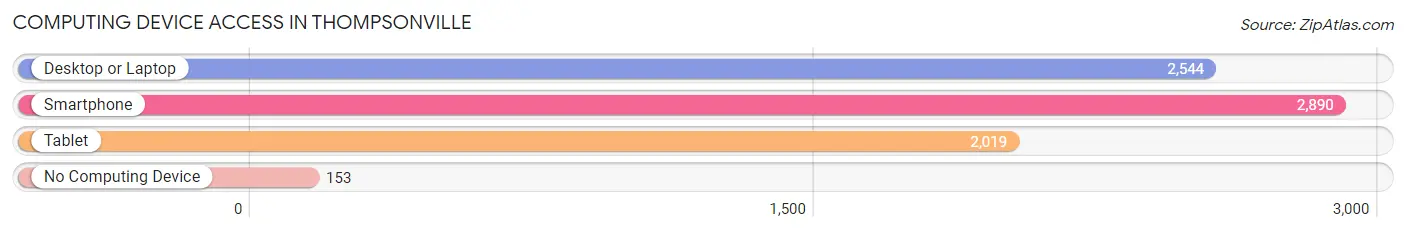
| Device Type | # Households | % Households |
| Desktop or Laptop | 2,544 | 78.0% |
| Smartphone | 2,890 | 88.6% |
| Tablet | 2,019 | 61.9% |
| No Computing Device | 153 | 4.7% |
| Total | 3,261 | 100.0% |
Internet Access in Thompsonville
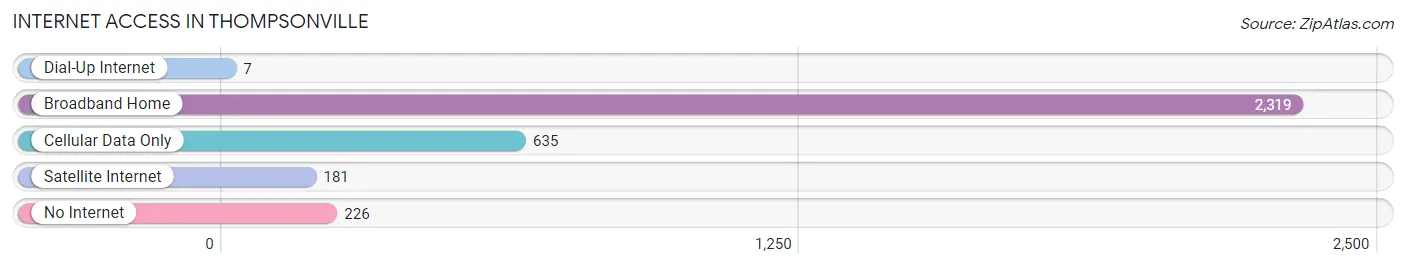
| Internet Type | # Households | % Households |
| Dial-Up Internet | 7 | 0.2% |
| Broadband Home | 2,319 | 71.1% |
| Cellular Data Only | 635 | 19.5% |
| Satellite Internet | 181 | 5.6% |
| No Internet | 226 | 6.9% |
| Total | 3,261 | 100.0% |
Thompsonville Summary
Thompsonville is a census-designated place (CDP) located in the town of Enfield, Connecticut, United States. The population was 8,577 at the 2010 census. It is located in the northeastern corner of the state, just south of the Massachusetts border.
History
Thompsonville was first settled in 1734 by the Thompson family, who were among the first settlers in the area. The area was originally known as Thompson's Farms, and the name was changed to Thompsonville in 1825. The area was primarily agricultural until the mid-19th century, when the first factories were built. The factories were powered by the Scantic River, which runs through the town.
The town was incorporated in 1845, and the first post office was established in 1846. The town grew rapidly in the late 19th century, and by the early 20th century, it was a thriving industrial center. The town was home to several factories, including the Bigelow-Sanford Carpet Company, which was the largest carpet manufacturer in the world at the time.
The town was also home to several other industries, including the Enfield Manufacturing Company, which produced firearms, and the Enfield Clock Company, which produced clocks and watches. The town was also home to several mills, including the Scantic Mills, which produced cotton and woolen goods.
The town was also home to several schools, including the Enfield High School, which was established in 1877. The town also had several churches, including the First Congregational Church, which was established in 1845.
Geography
Thompsonville is located in the northeastern corner of Connecticut, just south of the Massachusetts border. It is bordered to the north by the town of Suffield, to the east by the town of East Windsor, to the south by the town of Longmeadow, Massachusetts, and to the west by the town of Windsor Locks.
The town is located in the Connecticut River Valley, and is bisected by the Scantic River. The town is mostly flat, with an elevation of about 200 feet above sea level.
Economy
Thompsonville is primarily a residential community, with a few small businesses. The town is home to several small retail stores, restaurants, and service businesses. The town is also home to several manufacturing companies, including the Bigelow-Sanford Carpet Company, which is still in operation.
The town is also home to several educational institutions, including the Enfield High School, the Enfield Public Library, and the Enfield Adult Education Center.
Demographics
As of the 2010 census, there were 8,577 people, 3,541 households, and 2,323 families residing in the town. The population density was 1,845.3 people per square mile (715.3/km2). There were 3,817 housing units at an average density of 809.3 per square mile (312.3/km2). The racial makeup of the town was 92.2% White, 2.7% African American, 0.3% Native American, 1.7% Asian, 0.1% Pacific Islander, 1.3% from other races, and 2.1% from two or more races. Hispanic or Latino of any race were 5.2% of the population.
There were 3,541 households, out of which 28.7% had children under the age of 18 living with them, 48.2% were married couples living together, 12.3% had a female householder with no husband present, and 34.7% were non-families. 28.3% of all households were made up of individuals, and 11.2% had someone living alone who was 65 years of age or older. The average household size was 2.41 and the average family size was 2.94.
In the town, the population was spread out, with 22.3% under the age of 18, 7.2% from 18 to 24, 30.2% from 25 to 44, 24.2% from 45 to 64, and 16.1% who were 65 years of age or older. The median age was 39 years. For every 100 females, there were 91.2 males. For every 100 females age 18 and over, there were 87.7 males.
The median income for a household in the town was $50,945, and the median income for a family was $62,917. Males had a median income of $45,945 versus $35,917 for females. The per capita income for the town was $25,945. About 4.2% of families and 6.2% of the population were below the poverty line, including 8.2% of those under age 18 and 5.2% of those age 65 or over.
Common Questions
What is Per Capita Income in Thompsonville?
Per Capita income in Thompsonville is $32,465.
What is the Median Family Income in Thompsonville?
Median Family Income in Thompsonville is $76,750.
What is the Median Household income in Thompsonville?
Median Household Income in Thompsonville is $57,662.
What is Income or Wage Gap in Thompsonville?
Income or Wage Gap in Thompsonville is 25.9%.
Women in Thompsonville earn 74.1 cents for every dollar earned by a man.
What is Inequality or Gini Index in Thompsonville?
Inequality or Gini Index in Thompsonville is 0.51.
What is the Total Population of Thompsonville?
Total Population of Thompsonville is 8,097.
What is the Total Male Population of Thompsonville?
Total Male Population of Thompsonville is 4,098.
What is the Total Female Population of Thompsonville?
Total Female Population of Thompsonville is 3,999.
What is the Ratio of Males per 100 Females in Thompsonville?
There are 102.48 Males per 100 Females in Thompsonville.
What is the Ratio of Females per 100 Males in Thompsonville?
There are 97.58 Females per 100 Males in Thompsonville.
What is the Median Population Age in Thompsonville?
Median Population Age in Thompsonville is 35.0 Years.
What is the Average Family Size in Thompsonville
Average Family Size in Thompsonville is 3.3 People.
What is the Average Household Size in Thompsonville
Average Household Size in Thompsonville is 2.4 People.
How Large is the Labor Force in Thompsonville?
There are 4,100 People in the Labor Forcein in Thompsonville.
What is the Percentage of People in the Labor Force in Thompsonville?
66.1% of People are in the Labor Force in Thompsonville.
What is the Unemployment Rate in Thompsonville?
Unemployment Rate in Thompsonville is 17.5%.