Zip Codes with the Highest Percentage of Population Employed in Food Preparation & Serving in Waterbury, CT
RELATED REPORTS & OPTIONS
Food Preparation & Serving
Waterbury
Compare Zip Codes
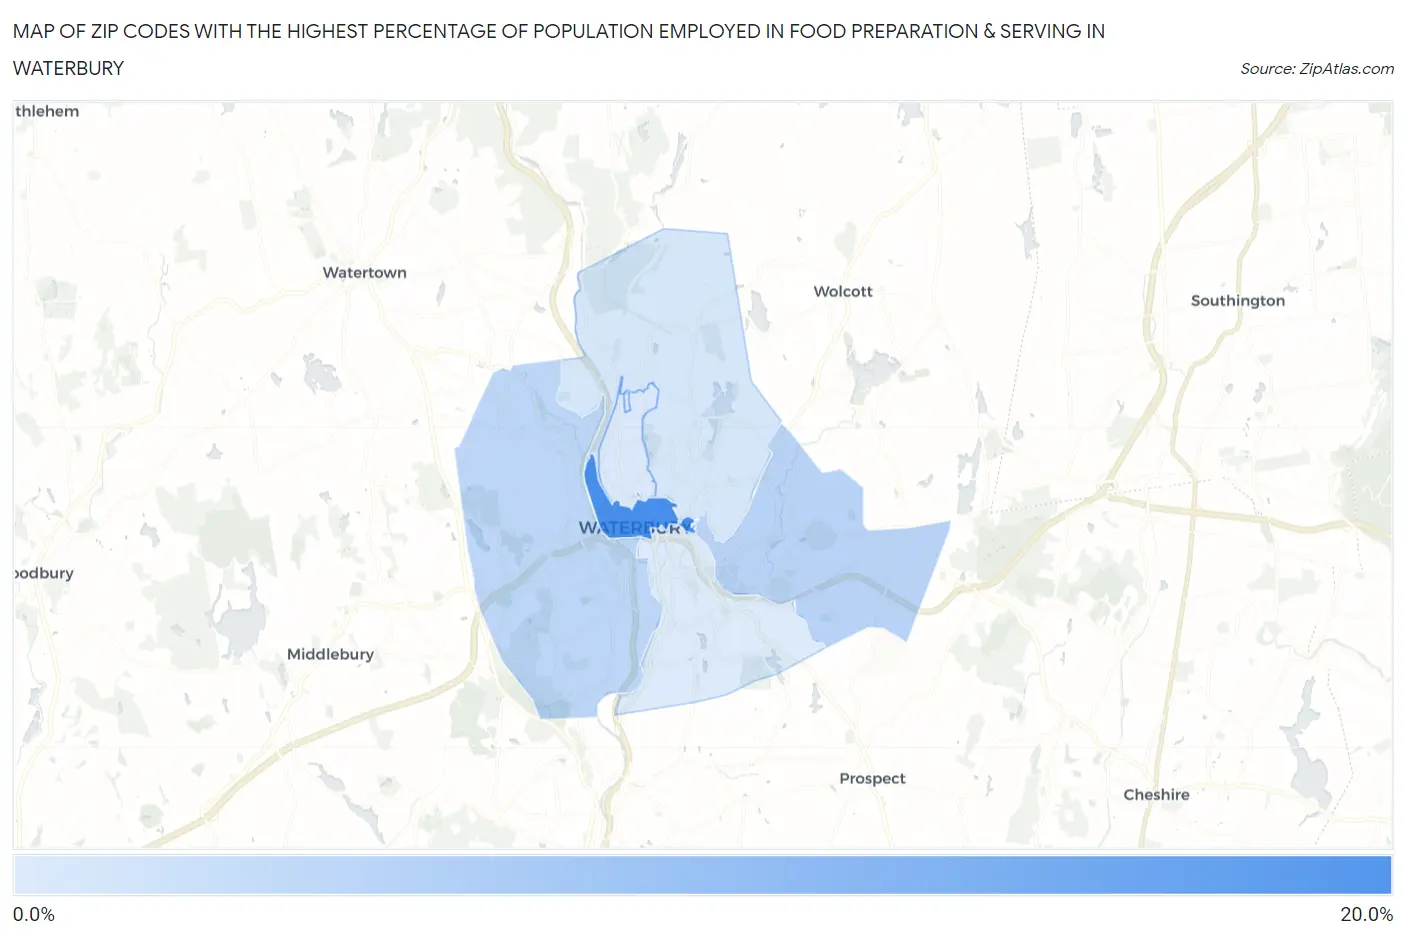
Map of Zip Codes with the Highest Percentage of Population Employed in Food Preparation & Serving in Waterbury
3.9%
17.1%
Zip Codes with the Highest Percentage of Population Employed in Food Preparation & Serving in Waterbury, CT
| Zip Code | % Employed | vs State | vs National | |
| 1. | 06702 | 17.1% | 4.7%(+12.4)#4 | 5.3%(+11.8)#740 |
| 2. | 06705 | 6.9% | 4.7%(+2.25)#46 | 5.3%(+1.65)#6,740 |
| 3. | 06708 | 6.6% | 4.7%(+1.92)#53 | 5.3%(+1.32)#7,591 |
| 4. | 06704 | 4.5% | 4.7%(-0.231)#102 | 5.3%(-0.833)#15,190 |
| 5. | 06710 | 4.2% | 4.7%(-0.512)#113 | 5.3%(-1.11)#16,426 |
| 6. | 06706 | 3.9% | 4.7%(-0.791)#127 | 5.3%(-1.39)#17,569 |
1
Common Questions
What are the Top 5 Zip Codes with the Highest Percentage of Population Employed in Food Preparation & Serving in Waterbury, CT?
Top 5 Zip Codes with the Highest Percentage of Population Employed in Food Preparation & Serving in Waterbury, CT are:
What zip code has the Highest Percentage of Population Employed in Food Preparation & Serving in Waterbury, CT?
06702 has the Highest Percentage of Population Employed in Food Preparation & Serving in Waterbury, CT with 17.1%.
What is the Percentage of Population Employed in Food Preparation & Serving in Waterbury, CT?
Percentage of Population Employed in Food Preparation & Serving in Waterbury is 5.7%.
What is the Percentage of Population Employed in Food Preparation & Serving in Connecticut?
Percentage of Population Employed in Food Preparation & Serving in Connecticut is 4.7%.
What is the Percentage of Population Employed in Food Preparation & Serving in the United States?
Percentage of Population Employed in Food Preparation & Serving in the United States is 5.3%.