East Brooklyn, CT Map & Demographics
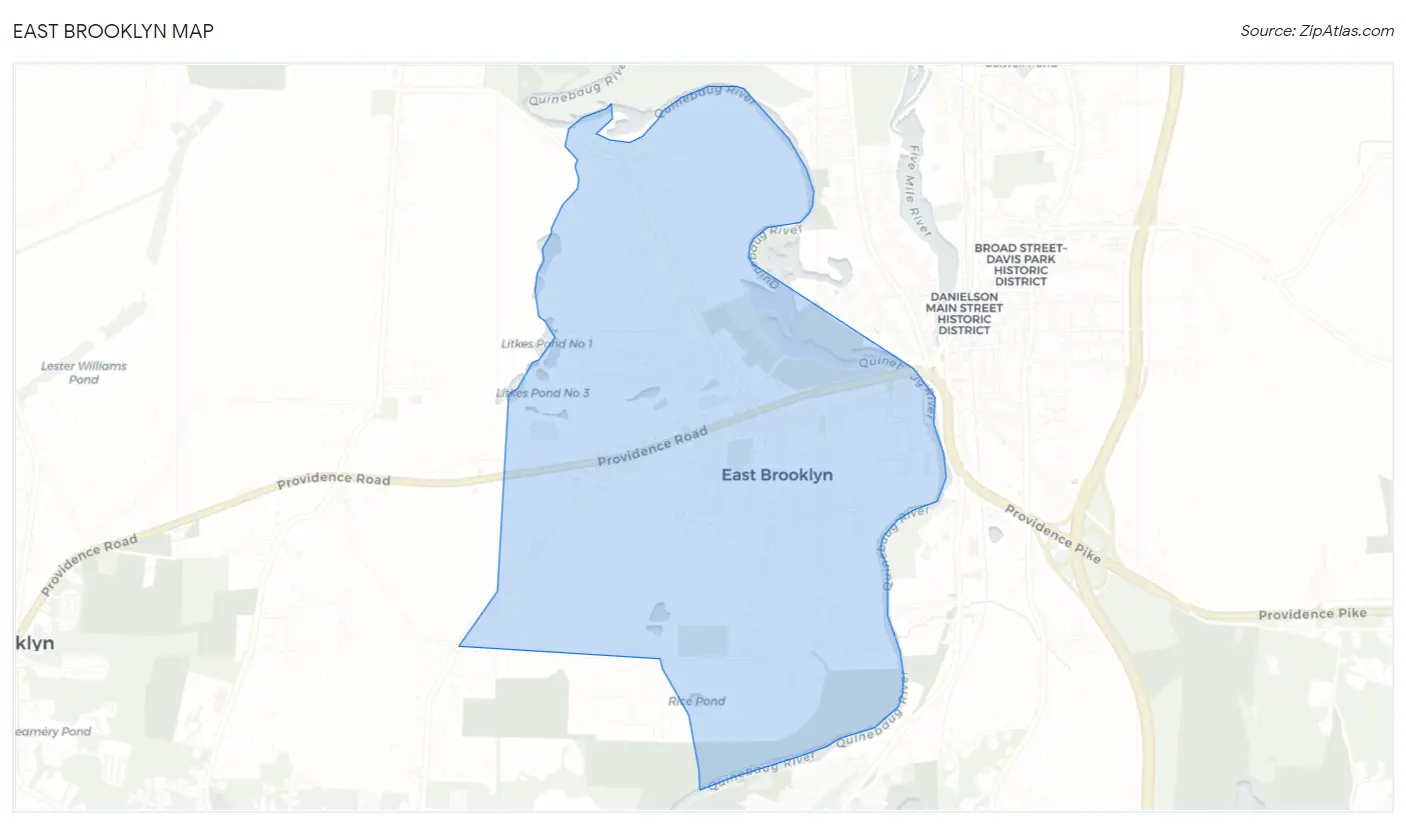
East Brooklyn Map
East Brooklyn Overview
$33,125
PER CAPITA INCOME
$64,020
AVG FAMILY INCOME
$63,938
AVG HOUSEHOLD INCOME
0.4%
WAGE / INCOME GAP [ % ]
99.6¢/ $1
WAGE / INCOME GAP [ $ ]
0.42
INEQUALITY / GINI INDEX
2,051
TOTAL POPULATION
959
MALE POPULATION
1,092
FEMALE POPULATION
87.82
MALES / 100 FEMALES
113.87
FEMALES / 100 MALES
50.2
MEDIAN AGE
2.8
AVG FAMILY SIZE
2.5
AVG HOUSEHOLD SIZE
1,053
LABOR FORCE [ PEOPLE ]
59.5%
PERCENT IN LABOR FORCE
9.9%
UNEMPLOYMENT RATE
Income in East Brooklyn
Income Overview in East Brooklyn
Per Capita Income in East Brooklyn is $33,125, while median incomes of families and households are $64,020 and $63,938 respectively.
| Characteristic | Number | Measure |
| Per Capita Income | 2,051 | $33,125 |
| Median Family Income | 595 | $64,020 |
| Mean Family Income | 595 | $81,147 |
| Median Household Income | 803 | $63,938 |
| Mean Household Income | 803 | $82,765 |
| Income Deficit | 595 | $0 |
| Wage / Income Gap (%) | 2,051 | 0.44% |
| Wage / Income Gap ($) | 2,051 | 99.56¢ per $1 |
| Gini / Inequality Index | 2,051 | 0.42 |
Earnings by Sex in East Brooklyn
Average Earnings in East Brooklyn are $39,814, $39,918 for men and $39,741 for women, a difference of 0.4%.
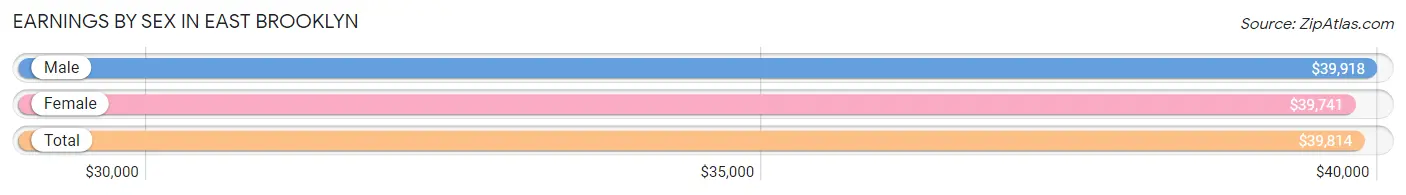
| Sex | Number | Average Earnings |
| Male | 614 (56.8%) | $39,918 |
| Female | 468 (43.2%) | $39,741 |
| Total | 1,082 (100.0%) | $39,814 |
Earnings by Sex by Income Bracket in East Brooklyn
The most common earnings brackets in East Brooklyn are $55,000 to $64,999 for men (116 | 18.9%) and $100,000+ for women (98 | 20.9%).
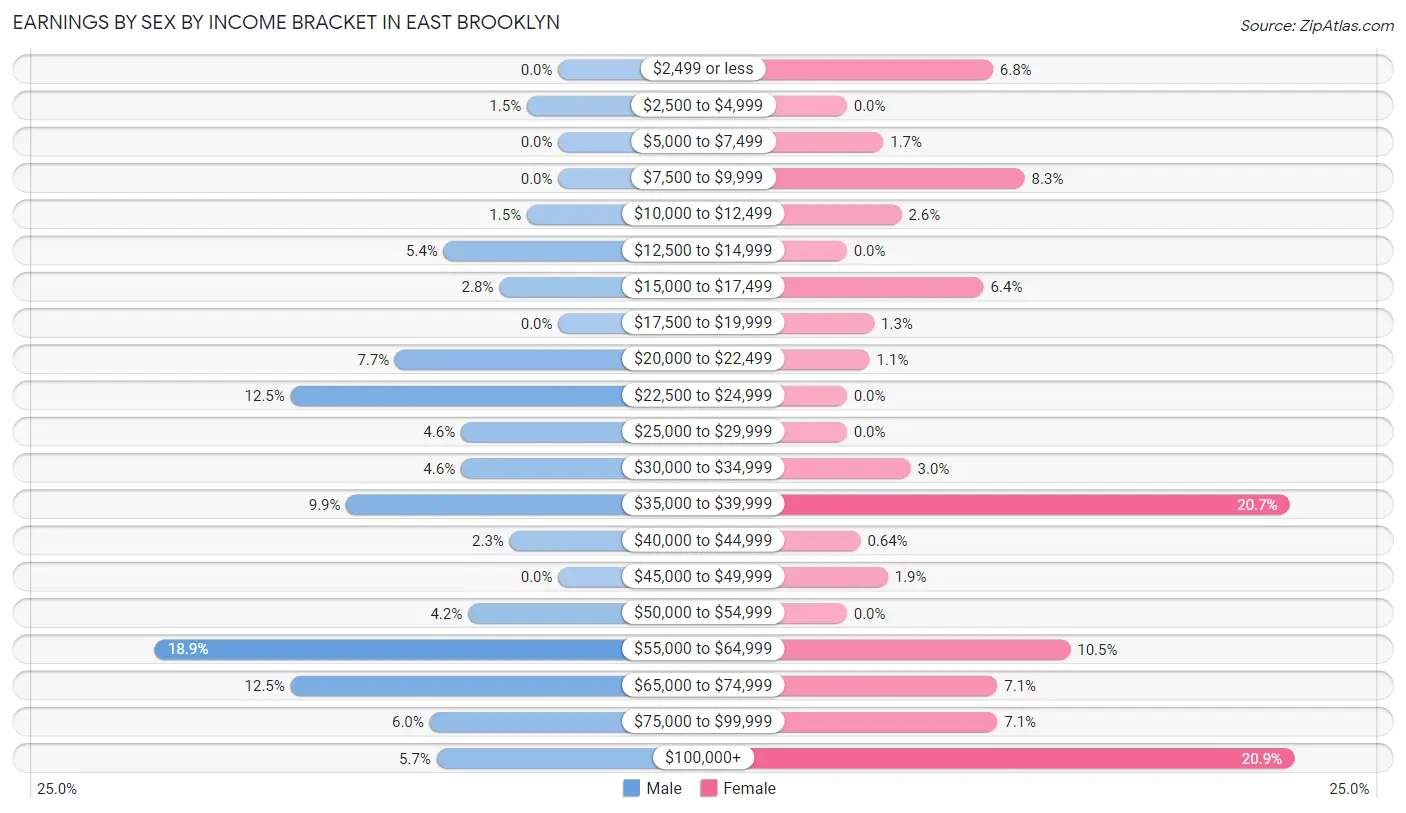
| Income | Male | Female |
| $2,499 or less | 0 (0.0%) | 32 (6.8%) |
| $2,500 to $4,999 | 9 (1.5%) | 0 (0.0%) |
| $5,000 to $7,499 | 0 (0.0%) | 8 (1.7%) |
| $7,500 to $9,999 | 0 (0.0%) | 39 (8.3%) |
| $10,000 to $12,499 | 9 (1.5%) | 12 (2.6%) |
| $12,500 to $14,999 | 33 (5.4%) | 0 (0.0%) |
| $15,000 to $17,499 | 17 (2.8%) | 30 (6.4%) |
| $17,500 to $19,999 | 0 (0.0%) | 6 (1.3%) |
| $20,000 to $22,499 | 47 (7.6%) | 5 (1.1%) |
| $22,500 to $24,999 | 77 (12.5%) | 0 (0.0%) |
| $25,000 to $29,999 | 28 (4.6%) | 0 (0.0%) |
| $30,000 to $34,999 | 28 (4.6%) | 14 (3.0%) |
| $35,000 to $39,999 | 61 (9.9%) | 97 (20.7%) |
| $40,000 to $44,999 | 14 (2.3%) | 3 (0.6%) |
| $45,000 to $49,999 | 0 (0.0%) | 9 (1.9%) |
| $50,000 to $54,999 | 26 (4.2%) | 0 (0.0%) |
| $55,000 to $64,999 | 116 (18.9%) | 49 (10.5%) |
| $65,000 to $74,999 | 77 (12.5%) | 33 (7.0%) |
| $75,000 to $99,999 | 37 (6.0%) | 33 (7.0%) |
| $100,000+ | 35 (5.7%) | 98 (20.9%) |
| Total | 614 (100.0%) | 468 (100.0%) |
Earnings by Sex by Educational Attainment in East Brooklyn
Average earnings in East Brooklyn are $52,639 for men and $56,047 for women, a difference of 6.1%. Men with an educational attainment of bachelor's degree enjoy the highest average annual earnings of $132,500, while those with high school diploma education earn the least with $26,250. Women with an educational attainment of college or associate's degree earn the most with the average annual earnings of $65,375, while those with high school diploma education have the smallest earnings of $55,980.
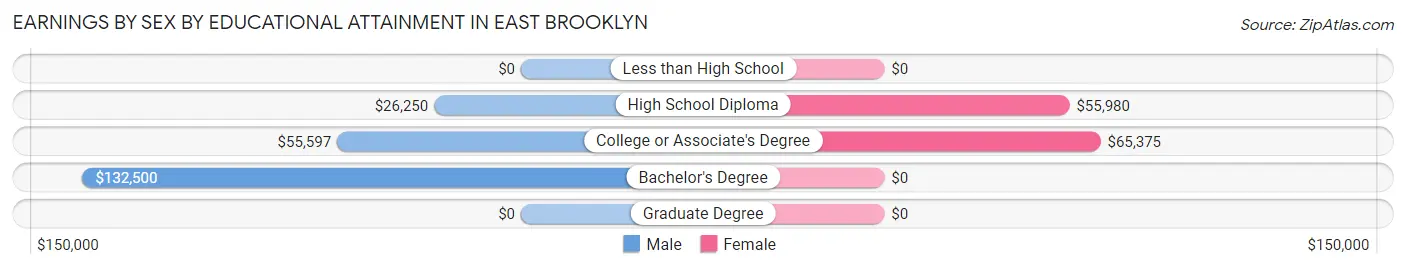
| Educational Attainment | Male Income | Female Income |
| Less than High School | - | - |
| High School Diploma | $26,250 | $55,980 |
| College or Associate's Degree | $55,597 | $65,375 |
| Bachelor's Degree | $132,500 | $0 |
| Graduate Degree | - | - |
| Total | $52,639 | $56,047 |
Family Income in East Brooklyn
Family Income Brackets in East Brooklyn
According to the East Brooklyn family income data, there are 238 families falling into the $50,000 to $74,999 income range, which is the most common income bracket and makes up 40.0% of all families.
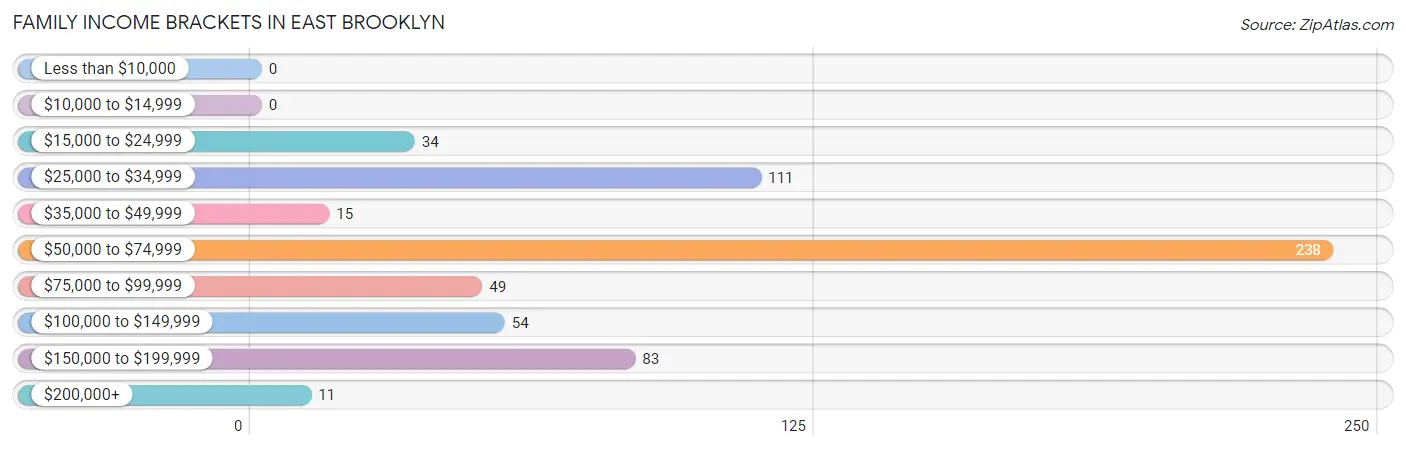
| Income Bracket | # Families | % Families |
| Less than $10,000 | 0 | 0.0% |
| $10,000 to $14,999 | 0 | 0.0% |
| $15,000 to $24,999 | 34 | 5.7% |
| $25,000 to $34,999 | 111 | 18.7% |
| $35,000 to $49,999 | 15 | 2.5% |
| $50,000 to $74,999 | 238 | 40.0% |
| $75,000 to $99,999 | 49 | 8.2% |
| $100,000 to $149,999 | 54 | 9.1% |
| $150,000 to $199,999 | 83 | 13.9% |
| $200,000+ | 11 | 1.8% |
Family Income by Famaliy Size in East Brooklyn
3-person families (161 | 27.1%) account for the highest median family income in East Brooklyn with $64,361 per family, while 2-person families (270 | 45.4%) have the highest median income of $27,780 per family member.
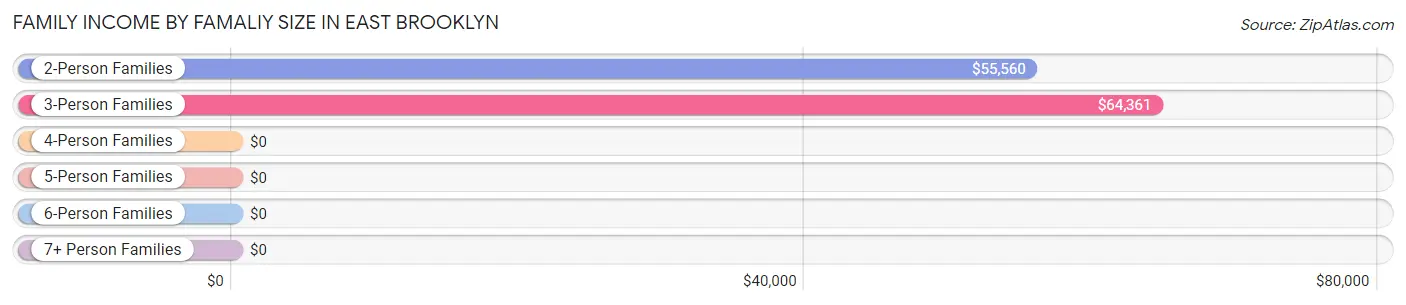
| Income Bracket | # Families | Median Income |
| 2-Person Families | 270 (45.4%) | $55,560 |
| 3-Person Families | 161 (27.1%) | $64,361 |
| 4-Person Families | 111 (18.7%) | $0 |
| 5-Person Families | 8 (1.3%) | $0 |
| 6-Person Families | 45 (7.6%) | $0 |
| 7+ Person Families | 0 (0.0%) | $0 |
| Total | 595 (100.0%) | $64,020 |
Family Income by Number of Earners in East Brooklyn
The median family income in East Brooklyn is $64,020, with families comprising 3+ earners (63) having the highest median family income of $198,347, while families with no earners (81) have the lowest median family income of $29,034, accounting for 10.6% and 13.6% of families, respectively.
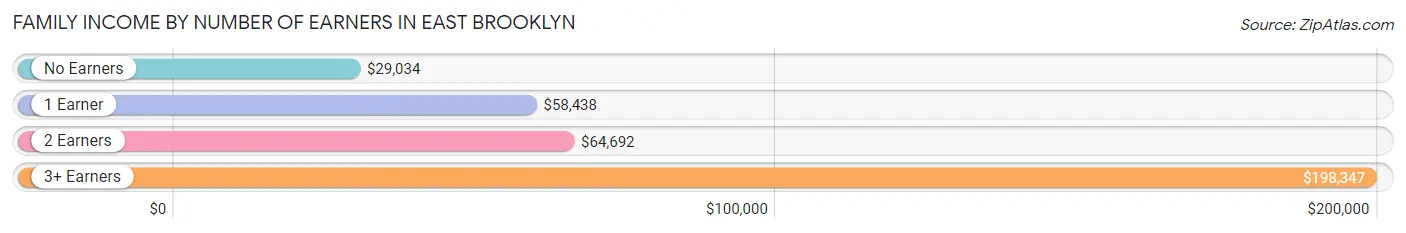
| Number of Earners | # Families | Median Income |
| No Earners | 81 (13.6%) | $29,034 |
| 1 Earner | 298 (50.1%) | $58,438 |
| 2 Earners | 153 (25.7%) | $64,692 |
| 3+ Earners | 63 (10.6%) | $198,347 |
| Total | 595 (100.0%) | $64,020 |
Household Income in East Brooklyn
Household Income Brackets in East Brooklyn
With 171 households falling in the category, the $50,000 to $74,999 income range is the most frequent in East Brooklyn, accounting for 21.3% of all households. In contrast, only 5 households (0.6%) fall into the less than $10,000 income bracket, making it the least populous group.
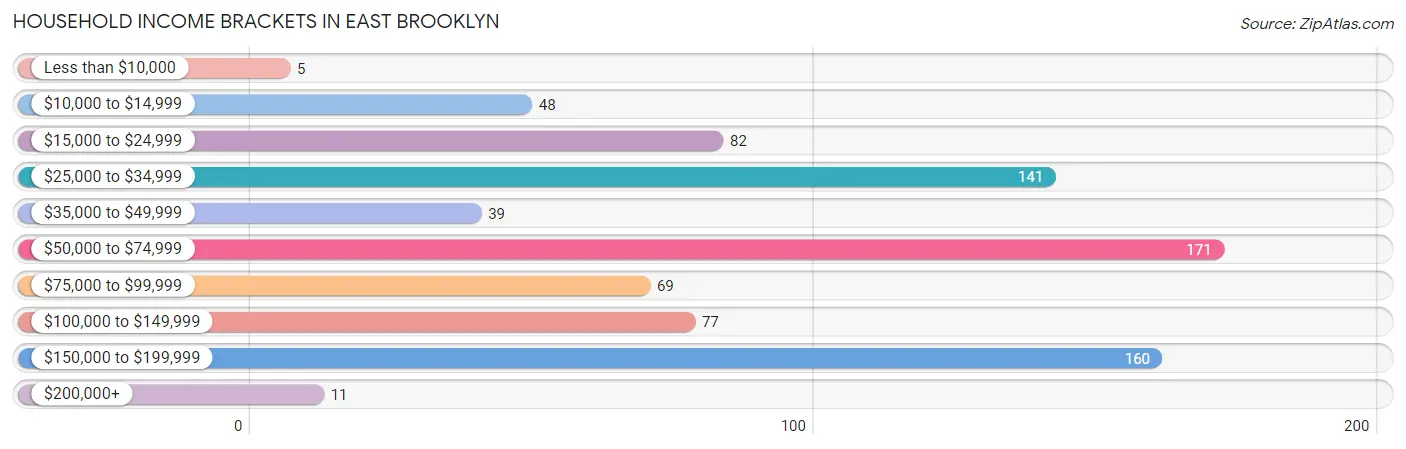
| Income Bracket | # Households | % Households |
| Less than $10,000 | 5 | 0.6% |
| $10,000 to $14,999 | 48 | 6.0% |
| $15,000 to $24,999 | 82 | 10.2% |
| $25,000 to $34,999 | 141 | 17.6% |
| $35,000 to $49,999 | 39 | 4.9% |
| $50,000 to $74,999 | 171 | 21.3% |
| $75,000 to $99,999 | 69 | 8.6% |
| $100,000 to $149,999 | 77 | 9.6% |
| $150,000 to $199,999 | 160 | 19.9% |
| $200,000+ | 11 | 1.4% |
Household Income by Householder Age in East Brooklyn
The median household income in East Brooklyn is $63,938, with the highest median household income of $185,325 found in the 25 to 44 years age bracket for the primary householder. A total of 134 households (16.7%) fall into this category.
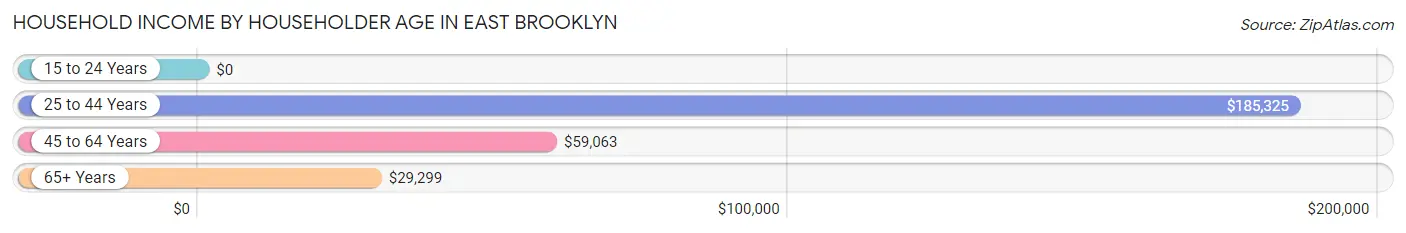
| Income Bracket | # Households | Median Income |
| 15 to 24 Years | 0 (0.0%) | $0 |
| 25 to 44 Years | 134 (16.7%) | $185,325 |
| 45 to 64 Years | 432 (53.8%) | $59,063 |
| 65+ Years | 237 (29.5%) | $29,299 |
| Total | 803 (100.0%) | $63,938 |
Poverty in East Brooklyn
Income Below Poverty by Sex and Age in East Brooklyn
With 16.8% poverty level for males and 8.0% for females among the residents of East Brooklyn, 12 to 14 year old males and under 5 year old females are the most vulnerable to poverty, with 15 males (100.0%) and 35 females (23.2%) in their respective age groups living below the poverty level.
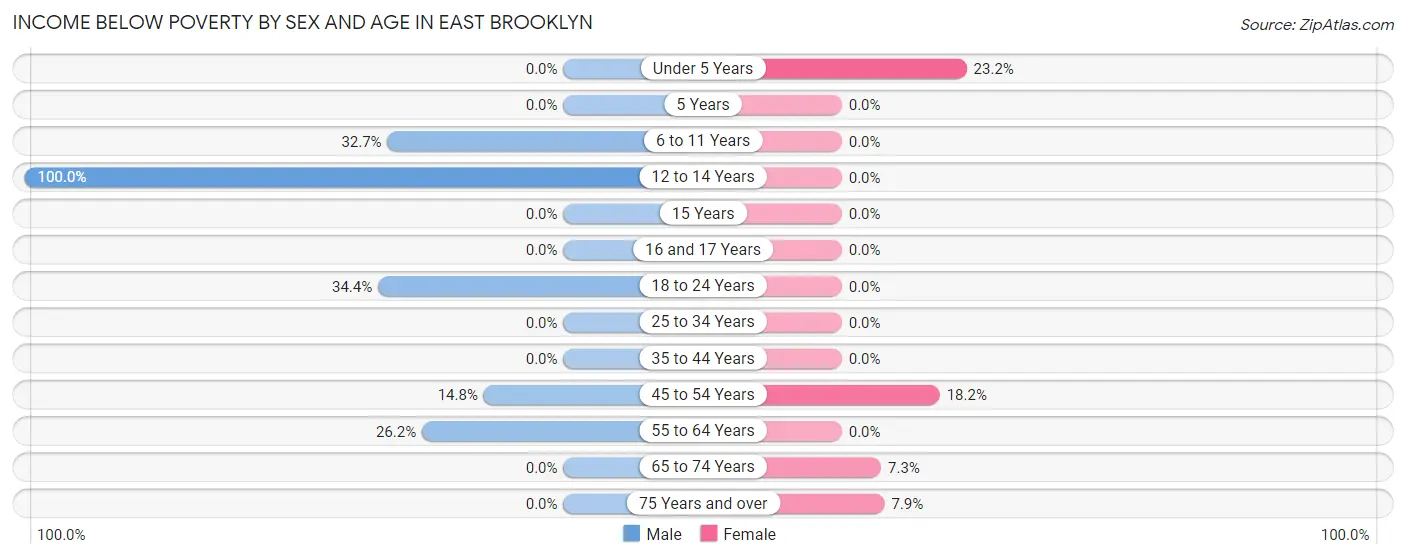
| Age Bracket | Male | Female |
| Under 5 Years | 0 (0.0%) | 35 (23.2%) |
| 5 Years | 0 (0.0%) | 0 (0.0%) |
| 6 to 11 Years | 16 (32.7%) | 0 (0.0%) |
| 12 to 14 Years | 15 (100.0%) | 0 (0.0%) |
| 15 Years | 0 (0.0%) | 0 (0.0%) |
| 16 and 17 Years | 0 (0.0%) | 0 (0.0%) |
| 18 to 24 Years | 43 (34.4%) | 0 (0.0%) |
| 25 to 34 Years | 0 (0.0%) | 0 (0.0%) |
| 35 to 44 Years | 0 (0.0%) | 0 (0.0%) |
| 45 to 54 Years | 30 (14.8%) | 34 (18.2%) |
| 55 to 64 Years | 53 (26.2%) | 0 (0.0%) |
| 65 to 74 Years | 0 (0.0%) | 10 (7.3%) |
| 75 Years and over | 0 (0.0%) | 8 (7.9%) |
| Total | 157 (16.8%) | 87 (8.0%) |
Income Above Poverty by Sex and Age in East Brooklyn
According to the poverty statistics in East Brooklyn, males aged 16 and 17 years and females aged 6 to 11 years are the age groups that are most secure financially, with 100.0% of males and 100.0% of females in these age groups living above the poverty line.
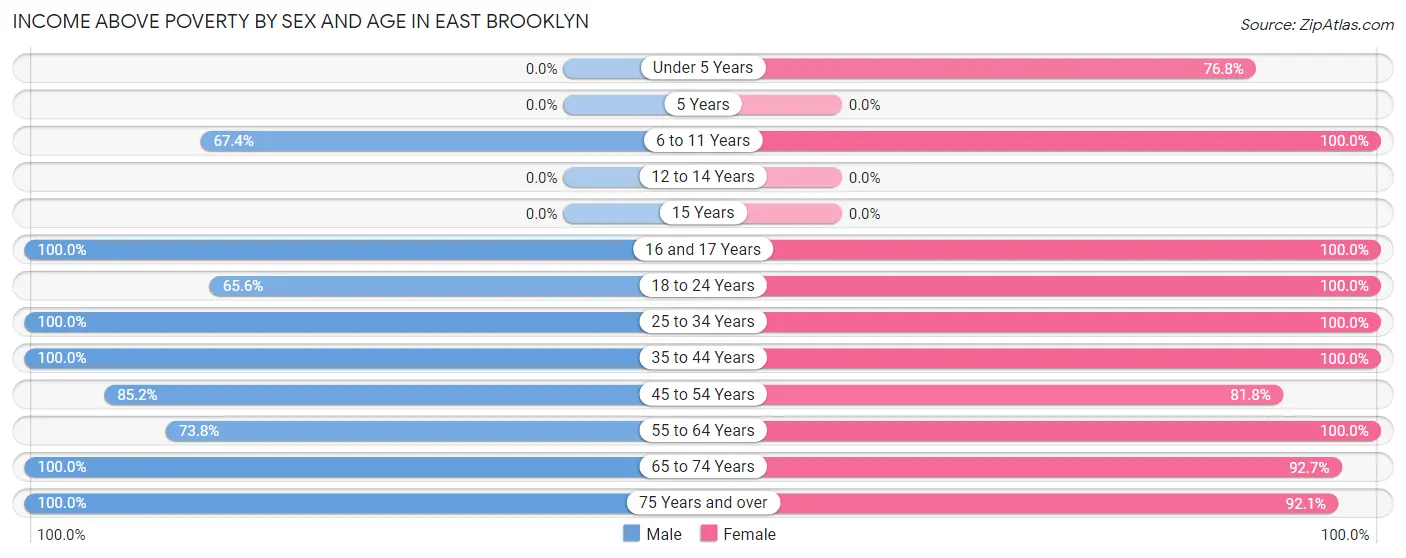
| Age Bracket | Male | Female |
| Under 5 Years | 0 (0.0%) | 116 (76.8%) |
| 5 Years | 0 (0.0%) | 0 (0.0%) |
| 6 to 11 Years | 33 (67.3%) | 42 (100.0%) |
| 12 to 14 Years | 0 (0.0%) | 0 (0.0%) |
| 15 Years | 0 (0.0%) | 0 (0.0%) |
| 16 and 17 Years | 10 (100.0%) | 15 (100.0%) |
| 18 to 24 Years | 82 (65.6%) | 58 (100.0%) |
| 25 to 34 Years | 165 (100.0%) | 134 (100.0%) |
| 35 to 44 Years | 23 (100.0%) | 90 (100.0%) |
| 45 to 54 Years | 173 (85.2%) | 153 (81.8%) |
| 55 to 64 Years | 149 (73.8%) | 177 (100.0%) |
| 65 to 74 Years | 91 (100.0%) | 127 (92.7%) |
| 75 Years and over | 51 (100.0%) | 93 (92.1%) |
| Total | 777 (83.2%) | 1,005 (92.0%) |
Income Below Poverty Among Married-Couple Families in East Brooklyn
The poverty statistics for married-couple families in East Brooklyn show that 9.1% or 34 of the total 373 families live below the poverty line. Families with 3 or 4 children have the highest poverty rate of 100.0%, comprising of 34 families. On the other hand, families with no children have the lowest poverty rate of 0.0%, which includes 0 families.
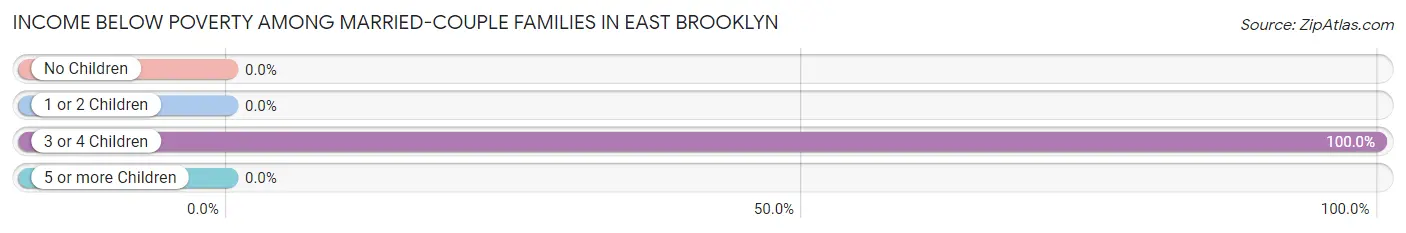
| Children | Above Poverty | Below Poverty |
| No Children | 272 (100.0%) | 0 (0.0%) |
| 1 or 2 Children | 67 (100.0%) | 0 (0.0%) |
| 3 or 4 Children | 0 (0.0%) | 34 (100.0%) |
| 5 or more Children | 0 (0.0%) | 0 (0.0%) |
| Total | 339 (90.9%) | 34 (9.1%) |
Income Below Poverty Among Single-Parent Households in East Brooklyn
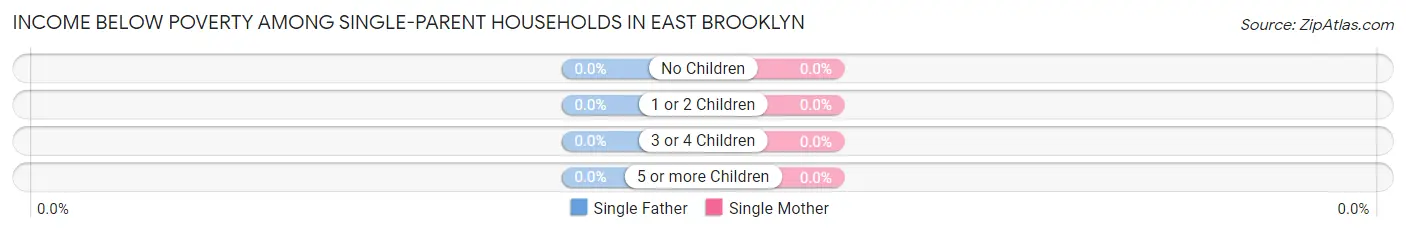
| Children | Single Father | Single Mother |
| No Children | 0 (0.0%) | 0 (0.0%) |
| 1 or 2 Children | 0 (0.0%) | 0 (0.0%) |
| 3 or 4 Children | 0 (0.0%) | 0 (0.0%) |
| 5 or more Children | 0 (0.0%) | 0 (0.0%) |
| Total | 0 (0.0%) | 0 (0.0%) |
Income Below Poverty Among Married-Couple vs Single-Parent Households in East Brooklyn
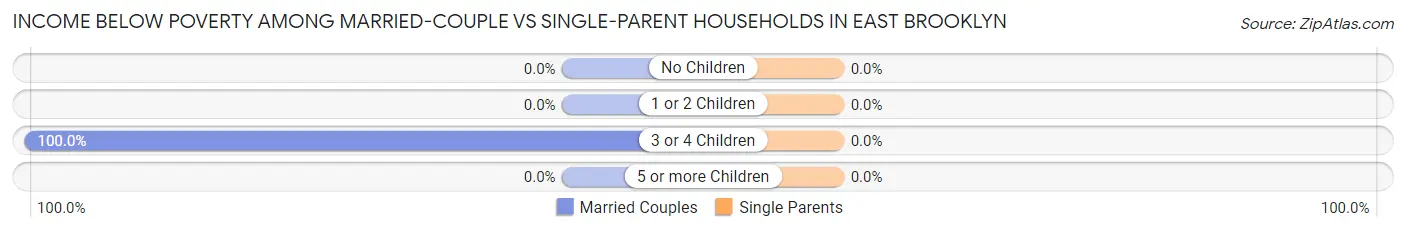
| Children | Married-Couple Families | Single-Parent Households |
| No Children | 0 (0.0%) | 0 (0.0%) |
| 1 or 2 Children | 0 (0.0%) | 0 (0.0%) |
| 3 or 4 Children | 34 (100.0%) | 0 (0.0%) |
| 5 or more Children | 0 (0.0%) | 0 (0.0%) |
| Total | 34 (9.1%) | 0 (0.0%) |
Race in East Brooklyn
The most populous races in East Brooklyn are White / Caucasian (1,577 | 76.9%), Asian (416 | 20.3%), and Hispanic or Latino (187 | 9.1%).
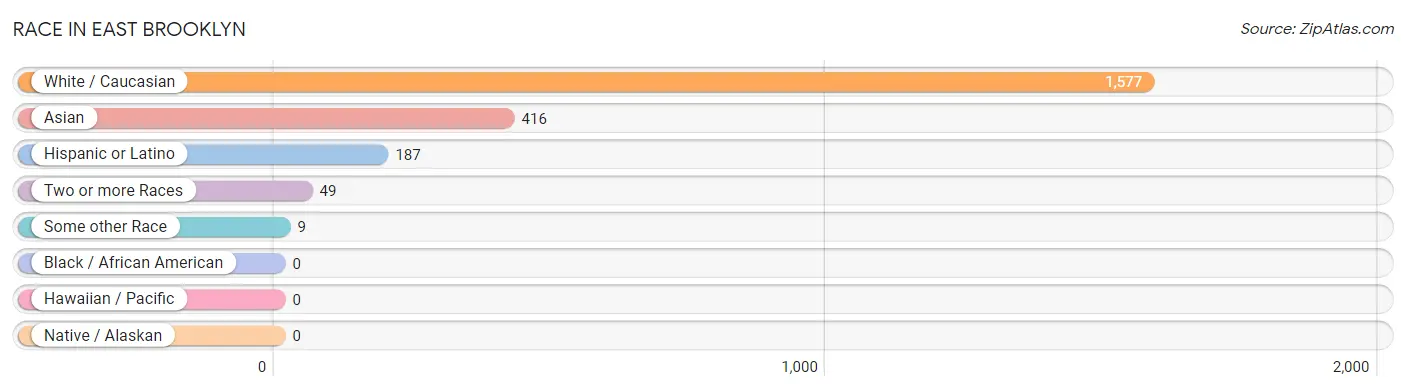
| Race | # Population | % Population |
| Asian | 416 | 20.3% |
| Black / African American | 0 | 0.0% |
| Hawaiian / Pacific | 0 | 0.0% |
| Hispanic or Latino | 187 | 9.1% |
| Native / Alaskan | 0 | 0.0% |
| White / Caucasian | 1,577 | 76.9% |
| Two or more Races | 49 | 2.4% |
| Some other Race | 9 | 0.4% |
| Total | 2,051 | 100.0% |
Ancestry in East Brooklyn
The most populous ancestries reported in East Brooklyn are Irish (458 | 22.3%), French (397 | 19.4%), Indian (Asian) (310 | 15.1%), American (216 | 10.5%), and English (210 | 10.2%), together accounting for 77.6% of all East Brooklyn residents.
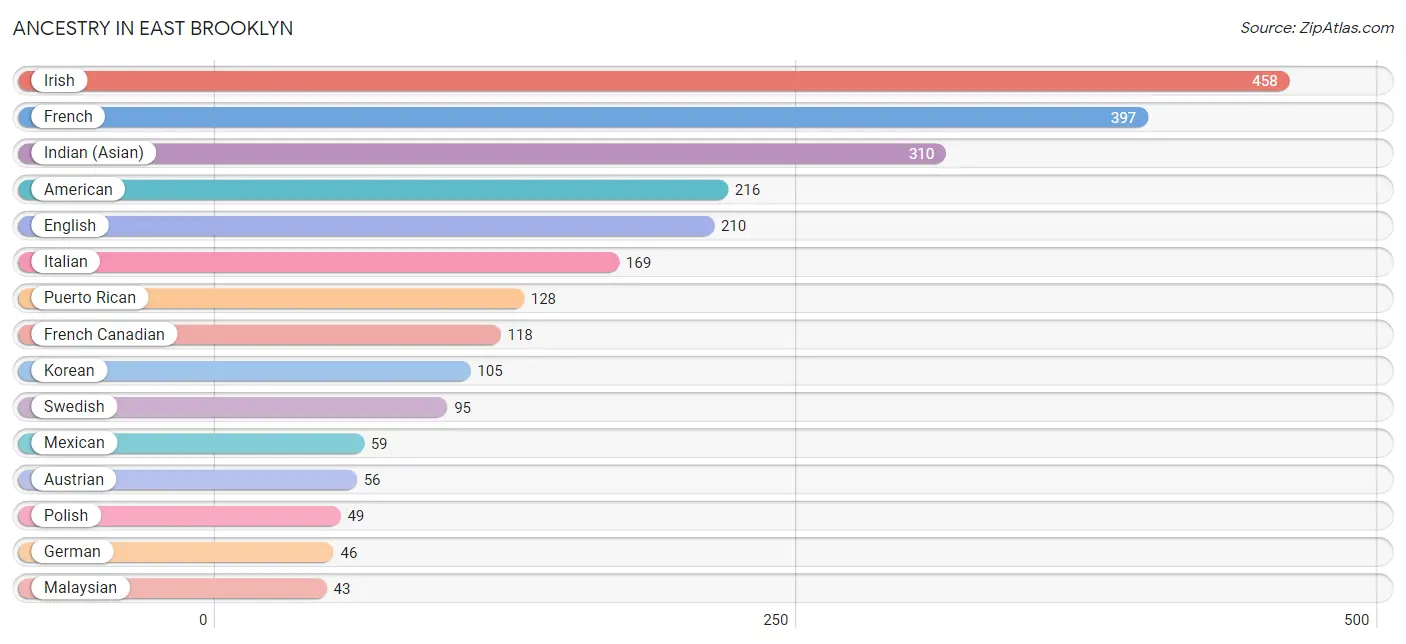
| Ancestry | # Population | % Population |
| American | 216 | 10.5% |
| Austrian | 56 | 2.7% |
| Canadian | 42 | 2.1% |
| Cherokee | 42 | 2.1% |
| Dutch | 31 | 1.5% |
| English | 210 | 10.2% |
| European | 11 | 0.5% |
| Finnish | 6 | 0.3% |
| French | 397 | 19.4% |
| French Canadian | 118 | 5.8% |
| German | 46 | 2.2% |
| Greek | 36 | 1.8% |
| Indian (Asian) | 310 | 15.1% |
| Irish | 458 | 22.3% |
| Italian | 169 | 8.2% |
| Jamaican | 42 | 2.1% |
| Korean | 105 | 5.1% |
| Malaysian | 43 | 2.1% |
| Mexican | 59 | 2.9% |
| Norwegian | 20 | 1.0% |
| Polish | 49 | 2.4% |
| Puerto Rican | 128 | 6.2% |
| Scotch-Irish | 15 | 0.7% |
| Scottish | 6 | 0.3% |
| Swedish | 95 | 4.6% | View All 25 Rows |
Immigrants in East Brooklyn
The most numerous immigrant groups reported in East Brooklyn came from Asia (338 | 16.5%), China (232 | 11.3%), Eastern Asia (232 | 11.3%), South Eastern Asia (106 | 5.2%), and Thailand (63 | 3.1%), together accounting for 47.3% of all East Brooklyn residents.
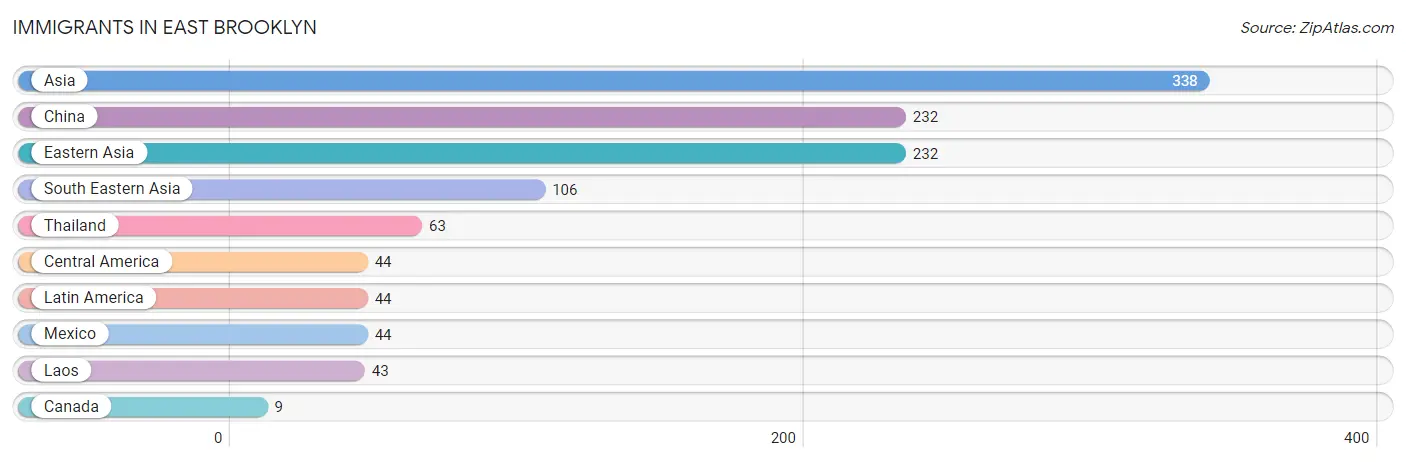
| Immigration Origin | # Population | % Population |
| Asia | 338 | 16.5% |
| Canada | 9 | 0.4% |
| Central America | 44 | 2.1% |
| China | 232 | 11.3% |
| Eastern Asia | 232 | 11.3% |
| Laos | 43 | 2.1% |
| Latin America | 44 | 2.1% |
| Mexico | 44 | 2.1% |
| South Eastern Asia | 106 | 5.2% |
| Thailand | 63 | 3.1% | View All 10 Rows |
Sex and Age in East Brooklyn
Sex and Age in East Brooklyn
The most populous age groups in East Brooklyn are 50 to 54 Years (151 | 15.8%) for men and Under 5 Years (151 | 13.8%) for women.
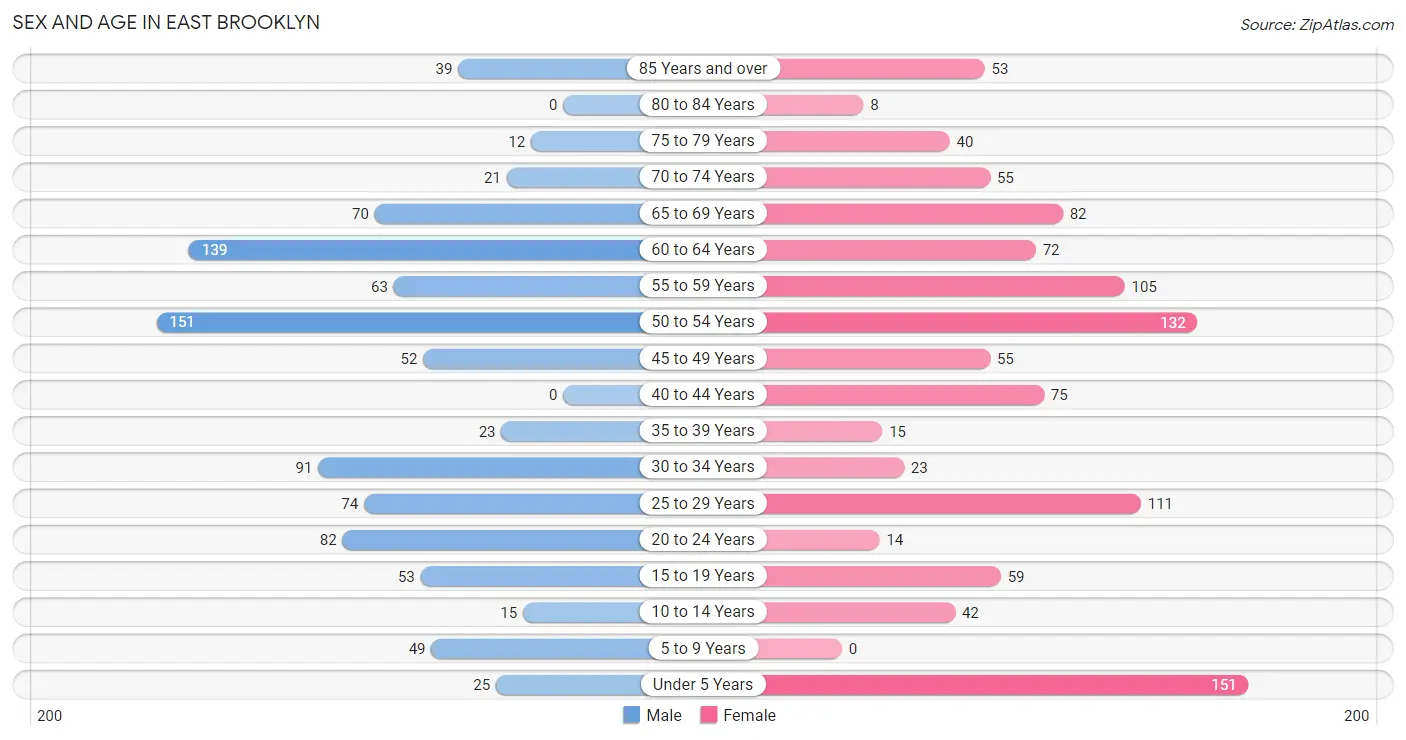
| Age Bracket | Male | Female |
| Under 5 Years | 25 (2.6%) | 151 (13.8%) |
| 5 to 9 Years | 49 (5.1%) | 0 (0.0%) |
| 10 to 14 Years | 15 (1.6%) | 42 (3.8%) |
| 15 to 19 Years | 53 (5.5%) | 59 (5.4%) |
| 20 to 24 Years | 82 (8.6%) | 14 (1.3%) |
| 25 to 29 Years | 74 (7.7%) | 111 (10.2%) |
| 30 to 34 Years | 91 (9.5%) | 23 (2.1%) |
| 35 to 39 Years | 23 (2.4%) | 15 (1.4%) |
| 40 to 44 Years | 0 (0.0%) | 75 (6.9%) |
| 45 to 49 Years | 52 (5.4%) | 55 (5.0%) |
| 50 to 54 Years | 151 (15.8%) | 132 (12.1%) |
| 55 to 59 Years | 63 (6.6%) | 105 (9.6%) |
| 60 to 64 Years | 139 (14.5%) | 72 (6.6%) |
| 65 to 69 Years | 70 (7.3%) | 82 (7.5%) |
| 70 to 74 Years | 21 (2.2%) | 55 (5.0%) |
| 75 to 79 Years | 12 (1.3%) | 40 (3.7%) |
| 80 to 84 Years | 0 (0.0%) | 8 (0.7%) |
| 85 Years and over | 39 (4.1%) | 53 (4.9%) |
| Total | 959 (100.0%) | 1,092 (100.0%) |
Families and Households in East Brooklyn
Median Family Size in East Brooklyn
The median family size in East Brooklyn is 2.84 persons per family, with married-couple families (373 | 62.7%) accounting for the largest median family size of 3.2 persons per family. On the other hand, single male/father families (144 | 24.2%) represent the smallest median family size with 2.06 persons per family.
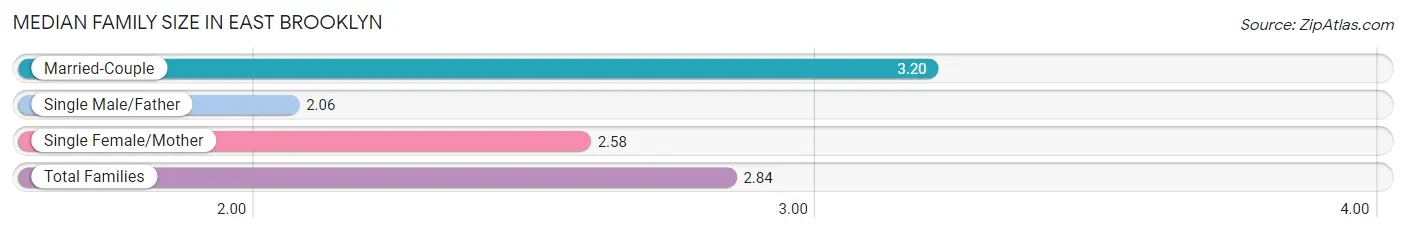
| Family Type | # Families | Family Size |
| Married-Couple | 373 (62.7%) | 3.20 |
| Single Male/Father | 144 (24.2%) | 2.06 |
| Single Female/Mother | 78 (13.1%) | 2.58 |
| Total Families | 595 (100.0%) | 2.84 |
Median Household Size in East Brooklyn
The median household size in East Brooklyn is 2.55 persons per household, with married-couple households (373 | 46.5%) accounting for the largest median household size of 3.2 persons per household. non-family households (208 | 25.9%) represent the smallest median household size with 1.13 persons per household.
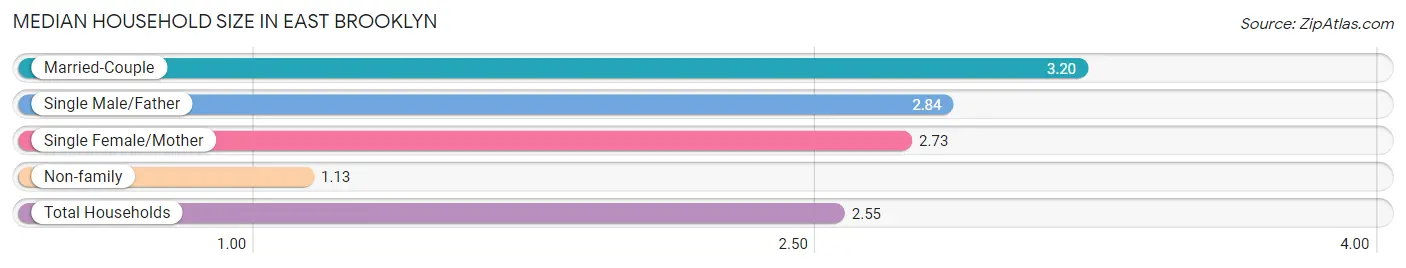
| Household Type | # Households | Household Size |
| Married-Couple | 373 (46.5%) | 3.20 |
| Single Male/Father | 144 (17.9%) | 2.84 |
| Single Female/Mother | 78 (9.7%) | 2.73 |
| Non-family | 208 (25.9%) | 1.13 |
| Total Households | 803 (100.0%) | 2.55 |
Household Size by Marriage Status in East Brooklyn
Out of a total of 803 households in East Brooklyn, 595 (74.1%) are family households, while 208 (25.9%) are nonfamily households. The most numerous type of family households are 2-person households, comprising 267, and the most common type of nonfamily households are 1-person households, comprising 180.
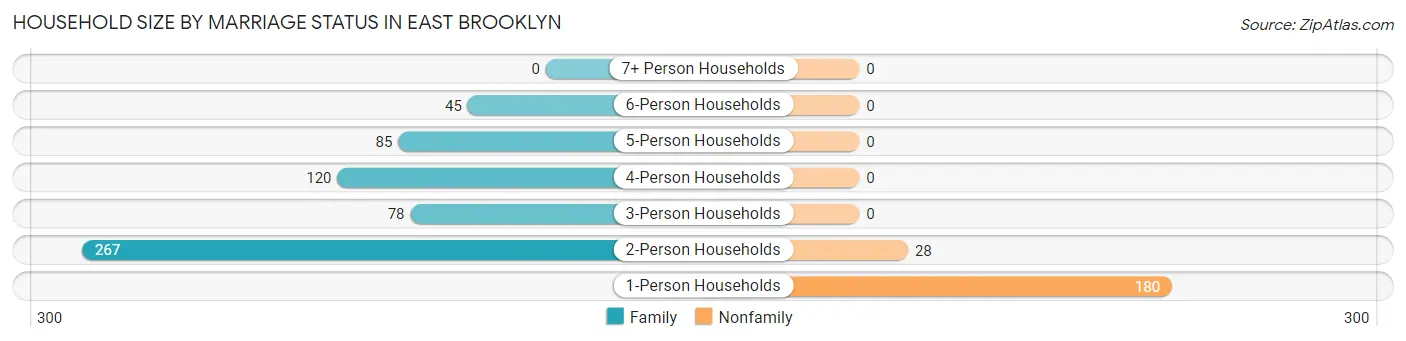
| Household Size | Family Households | Nonfamily Households |
| 1-Person Households | - | 180 (22.4%) |
| 2-Person Households | 267 (33.3%) | 28 (3.5%) |
| 3-Person Households | 78 (9.7%) | 0 (0.0%) |
| 4-Person Households | 120 (14.9%) | 0 (0.0%) |
| 5-Person Households | 85 (10.6%) | 0 (0.0%) |
| 6-Person Households | 45 (5.6%) | 0 (0.0%) |
| 7+ Person Households | 0 (0.0%) | 0 (0.0%) |
| Total | 595 (74.1%) | 208 (25.9%) |
Female Fertility in East Brooklyn
Fertility by Age in East Brooklyn
Average fertility rate in East Brooklyn is 179.0 births per 1,000 women. Women in the age bracket of 35 to 50 years have the highest fertility rate with 434.0 births per 1,000 women. Women in the age bracket of 35 to 50 years acount for 100.0% of all women with births.
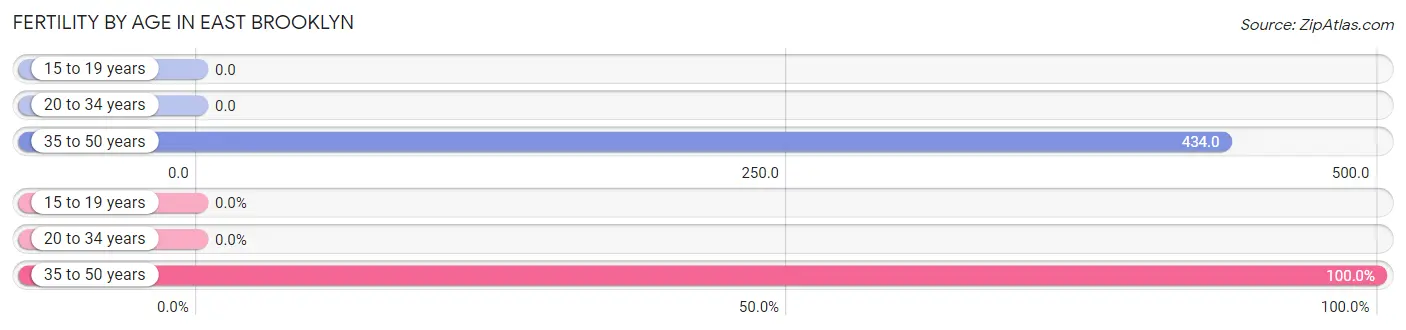
| Age Bracket | Women with Births | Births / 1,000 Women |
| 15 to 19 years | 0 (0.0%) | 0.0 |
| 20 to 34 years | 0 (0.0%) | 0.0 |
| 35 to 50 years | 63 (100.0%) | 434.0 |
| Total | 63 (100.0%) | 179.0 |
Fertility by Age by Marriage Status in East Brooklyn
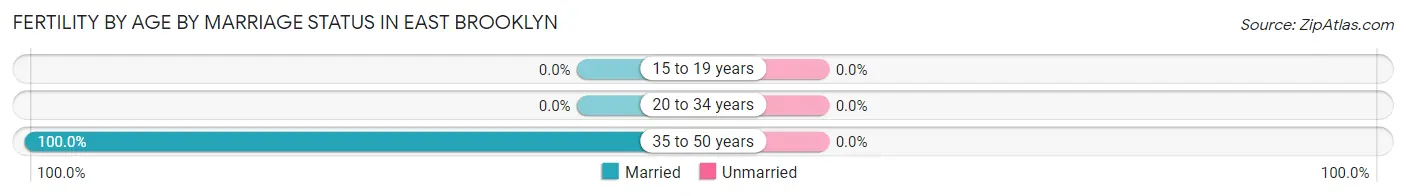
| Age Bracket | Married | Unmarried |
| 15 to 19 years | 0 (0.0%) | 0 (0.0%) |
| 20 to 34 years | 0 (0.0%) | 0 (0.0%) |
| 35 to 50 years | 63 (100.0%) | 0 (0.0%) |
| Total | 63 (100.0%) | 0 (0.0%) |
Fertility by Education in East Brooklyn
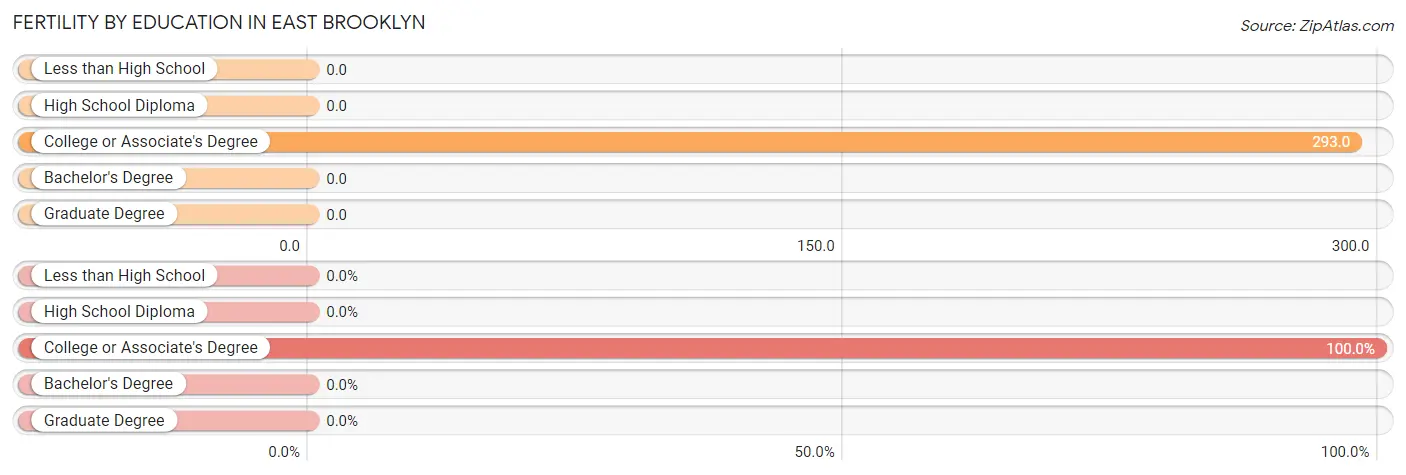
| Educational Attainment | Women with Births | Births / 1,000 Women |
| Less than High School | 0 (0.0%) | 0.0 |
| High School Diploma | 0 (0.0%) | 0.0 |
| College or Associate's Degree | 63 (100.0%) | 293.0 |
| Bachelor's Degree | 0 (0.0%) | 0.0 |
| Graduate Degree | 0 (0.0%) | 0.0 |
| Total | 63 (100.0%) | 179.0 |
Fertility by Education by Marriage Status in East Brooklyn
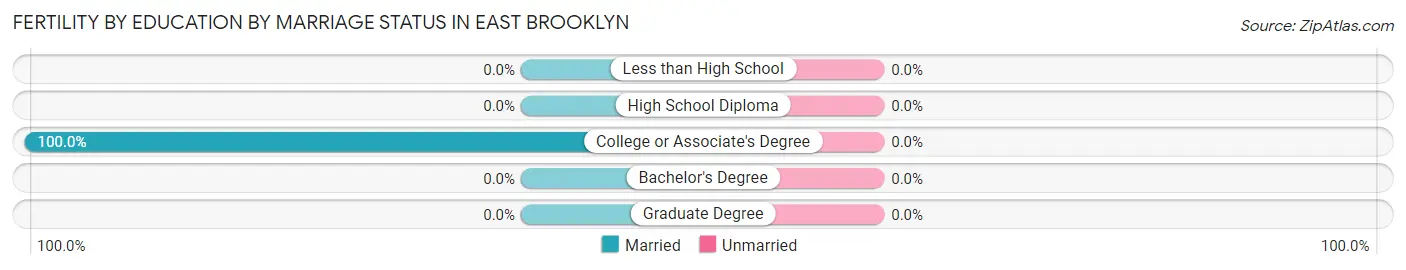
| Educational Attainment | Married | Unmarried |
| Less than High School | 0 (0.0%) | 0 (0.0%) |
| High School Diploma | 0 (0.0%) | 0 (0.0%) |
| College or Associate's Degree | 63 (100.0%) | 0 (0.0%) |
| Bachelor's Degree | 0 (0.0%) | 0 (0.0%) |
| Graduate Degree | 0 (0.0%) | 0 (0.0%) |
| Total | 63 (100.0%) | 0 (0.0%) |
Employment Characteristics in East Brooklyn
Employment by Class of Employer in East Brooklyn
Among the 939 employed individuals in East Brooklyn, private company employees (693 | 73.8%), self-employed (not incorporated) (119 | 12.7%), and not-for-profit organizations (66 | 7.0%) make up the most common classes of employment.
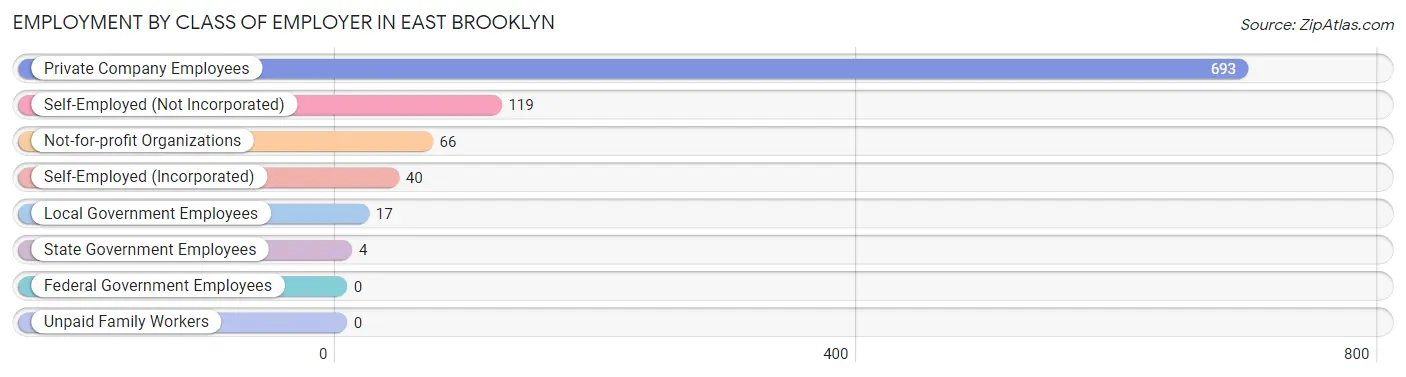
| Employer Class | # Employees | % Employees |
| Private Company Employees | 693 | 73.8% |
| Self-Employed (Incorporated) | 40 | 4.3% |
| Self-Employed (Not Incorporated) | 119 | 12.7% |
| Not-for-profit Organizations | 66 | 7.0% |
| Local Government Employees | 17 | 1.8% |
| State Government Employees | 4 | 0.4% |
| Federal Government Employees | 0 | 0.0% |
| Unpaid Family Workers | 0 | 0.0% |
| Total | 939 | 100.0% |
Employment Status by Age in East Brooklyn
According to the labor force statistics for East Brooklyn, out of the total population over 16 years of age (1,769), 59.5% or 1,053 individuals are in the labor force, with 9.9% or 104 of them unemployed. The age group with the highest labor force participation rate is 20 to 24 years, with 100.0% or 96 individuals in the labor force. Within the labor force, the 20 to 24 years age range has the highest percentage of unemployed individuals, with 50.0% or 48 of them being unemployed.
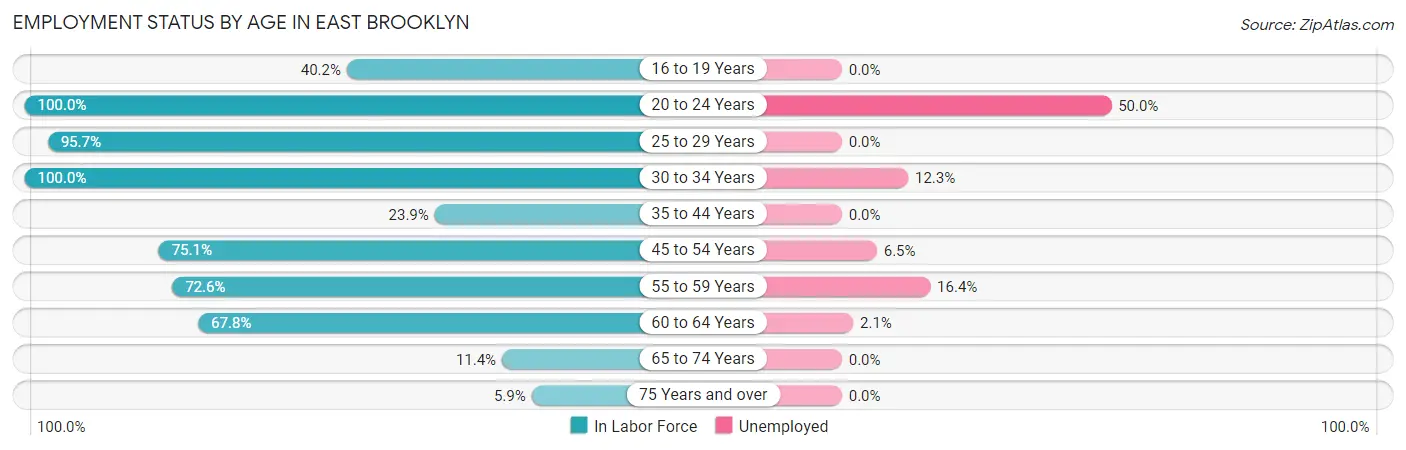
| Age Bracket | In Labor Force | Unemployed |
| 16 to 19 Years | 45 (40.2%) | 0 (0.0%) |
| 20 to 24 Years | 96 (100.0%) | 48 (50.0%) |
| 25 to 29 Years | 177 (95.7%) | 0 (0.0%) |
| 30 to 34 Years | 114 (100.0%) | 14 (12.3%) |
| 35 to 44 Years | 27 (23.9%) | 0 (0.0%) |
| 45 to 54 Years | 293 (75.1%) | 19 (6.5%) |
| 55 to 59 Years | 122 (72.6%) | 20 (16.4%) |
| 60 to 64 Years | 143 (67.8%) | 3 (2.1%) |
| 65 to 74 Years | 26 (11.4%) | 0 (0.0%) |
| 75 Years and over | 9 (5.9%) | 0 (0.0%) |
| Total | 1,053 (59.5%) | 104 (9.9%) |
Employment Status by Educational Attainment in East Brooklyn
According to labor force statistics for East Brooklyn, 74.2% of individuals (876) out of the total population between 25 and 64 years of age (1,181) are in the labor force, with 6.4% or 56 of them being unemployed. The group with the highest labor force participation rate are those with the educational attainment of bachelor's degree or higher, with 100.0% or 53 individuals in the labor force. Within the labor force, individuals with college / associate degree education have the highest percentage of unemployment, with 9.7% or 53 of them being unemployed.
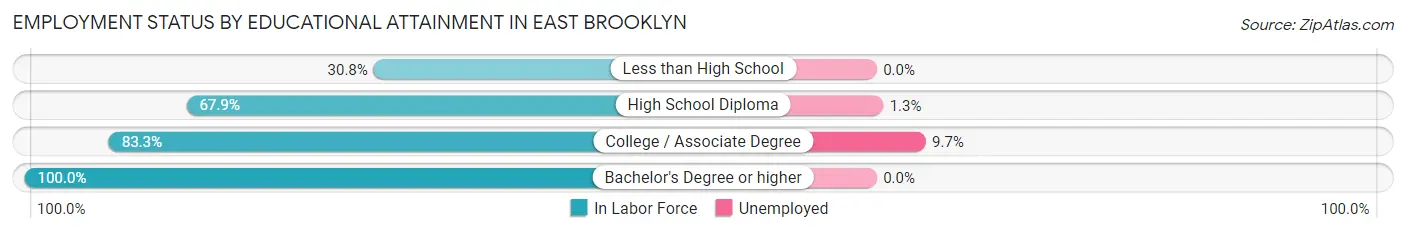
| Educational Attainment | In Labor Force | Unemployed |
| Less than High School | 37 (30.8%) | 0 (0.0%) |
| High School Diploma | 237 (67.9%) | 5 (1.3%) |
| College / Associate Degree | 549 (83.3%) | 64 (9.7%) |
| Bachelor's Degree or higher | 53 (100.0%) | 0 (0.0%) |
| Total | 876 (74.2%) | 76 (6.4%) |
Employment Occupations by Sex in East Brooklyn
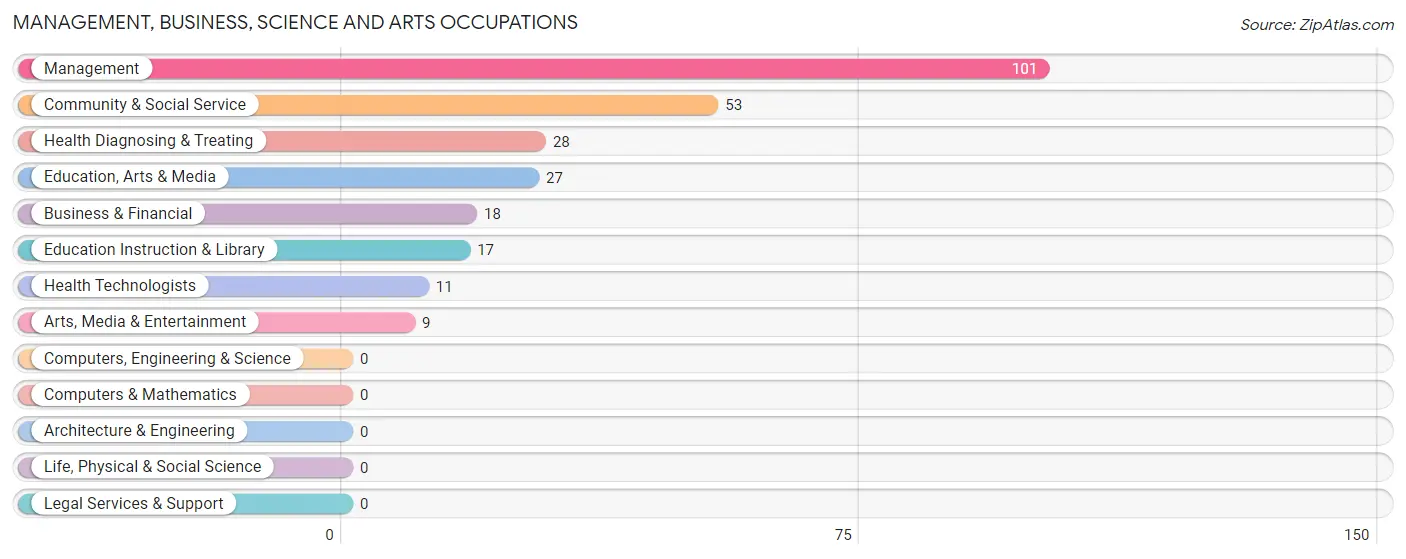
Management, Business, Science and Arts Occupations
The most common Management, Business, Science and Arts occupations in East Brooklyn are Management (101 | 10.6%), Community & Social Service (53 | 5.6%), Health Diagnosing & Treating (28 | 2.9%), Education, Arts & Media (27 | 2.9%), and Business & Financial (18 | 1.9%).
Management, Business, Science and Arts Occupations by Sex
Within the Management, Business, Science and Arts occupations in East Brooklyn, the most male-oriented occupations are Community & Social Service (100.0%), Education, Arts & Media (100.0%), and Education Instruction & Library (100.0%), while the most female-oriented occupations are Business & Financial (100.0%), Health Diagnosing & Treating (100.0%), and Health Technologists (100.0%).
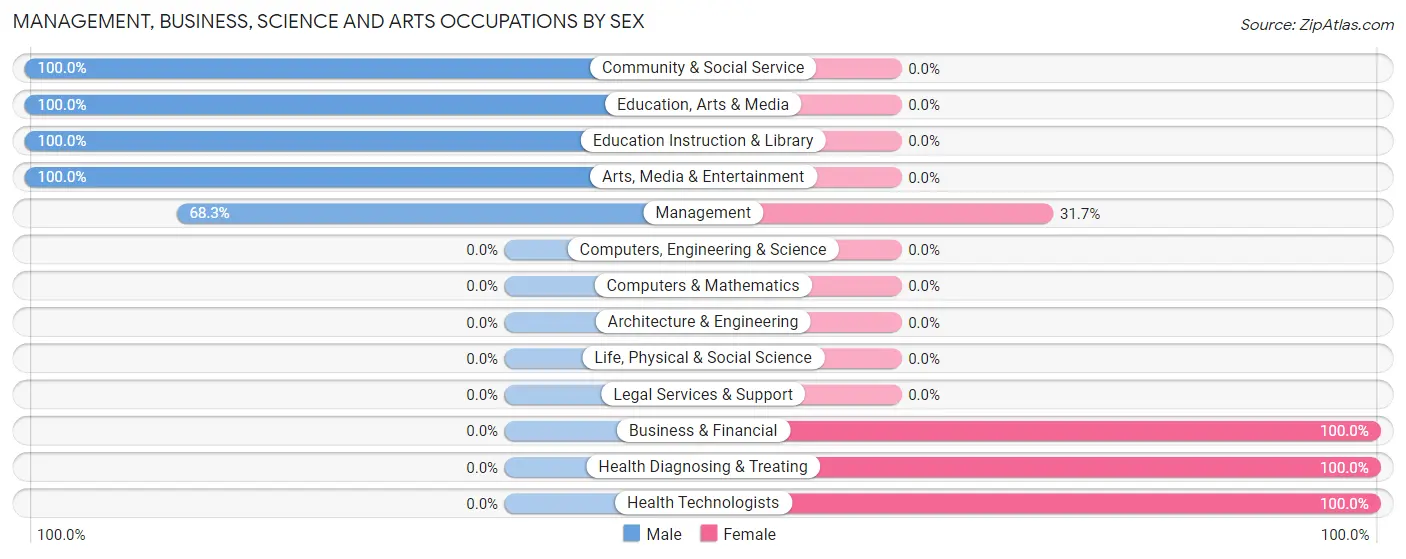
| Occupation | Male | Female |
| Management | 69 (68.3%) | 32 (31.7%) |
| Business & Financial | 0 (0.0%) | 18 (100.0%) |
| Computers, Engineering & Science | 0 (0.0%) | 0 (0.0%) |
| Computers & Mathematics | 0 (0.0%) | 0 (0.0%) |
| Architecture & Engineering | 0 (0.0%) | 0 (0.0%) |
| Life, Physical & Social Science | 0 (0.0%) | 0 (0.0%) |
| Community & Social Service | 53 (100.0%) | 0 (0.0%) |
| Education, Arts & Media | 27 (100.0%) | 0 (0.0%) |
| Legal Services & Support | 0 (0.0%) | 0 (0.0%) |
| Education Instruction & Library | 17 (100.0%) | 0 (0.0%) |
| Arts, Media & Entertainment | 9 (100.0%) | 0 (0.0%) |
| Health Diagnosing & Treating | 0 (0.0%) | 28 (100.0%) |
| Health Technologists | 0 (0.0%) | 11 (100.0%) |
| Total (Category) | 122 (61.0%) | 78 (39.0%) |
| Total (Overall) | 544 (57.4%) | 404 (42.6%) |
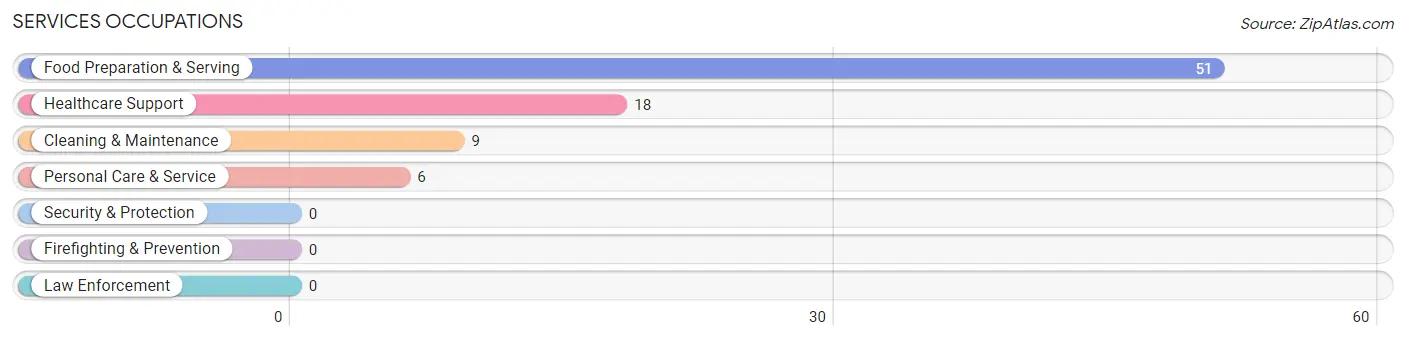
Services Occupations
The most common Services occupations in East Brooklyn are Food Preparation & Serving (51 | 5.4%), Healthcare Support (18 | 1.9%), Cleaning & Maintenance (9 | 0.9%), and Personal Care & Service (6 | 0.6%).
Services Occupations by Sex
Within the Services occupations in East Brooklyn, the most male-oriented occupations are Cleaning & Maintenance (100.0%), Healthcare Support (72.2%), and Food Preparation & Serving (27.5%), while the most female-oriented occupations are Personal Care & Service (100.0%), Food Preparation & Serving (72.6%), and Healthcare Support (27.8%).
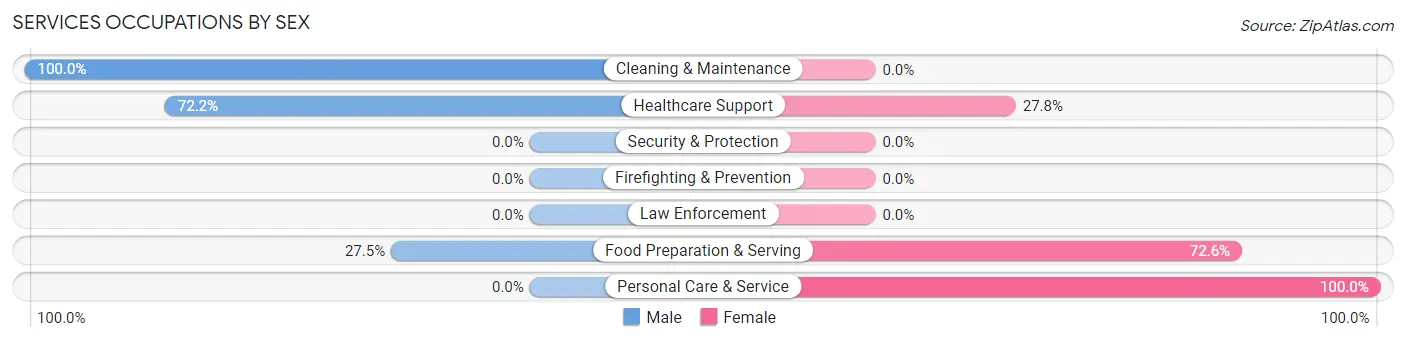
| Occupation | Male | Female |
| Healthcare Support | 13 (72.2%) | 5 (27.8%) |
| Security & Protection | 0 (0.0%) | 0 (0.0%) |
| Firefighting & Prevention | 0 (0.0%) | 0 (0.0%) |
| Law Enforcement | 0 (0.0%) | 0 (0.0%) |
| Food Preparation & Serving | 14 (27.5%) | 37 (72.6%) |
| Cleaning & Maintenance | 9 (100.0%) | 0 (0.0%) |
| Personal Care & Service | 0 (0.0%) | 6 (100.0%) |
| Total (Category) | 36 (42.9%) | 48 (57.1%) |
| Total (Overall) | 544 (57.4%) | 404 (42.6%) |
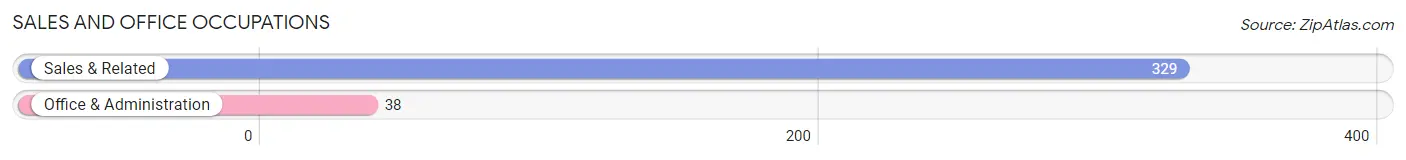
Sales and Office Occupations
The most common Sales and Office occupations in East Brooklyn are Sales & Related (329 | 34.7%), and Office & Administration (38 | 4.0%).
Sales and Office Occupations by Sex
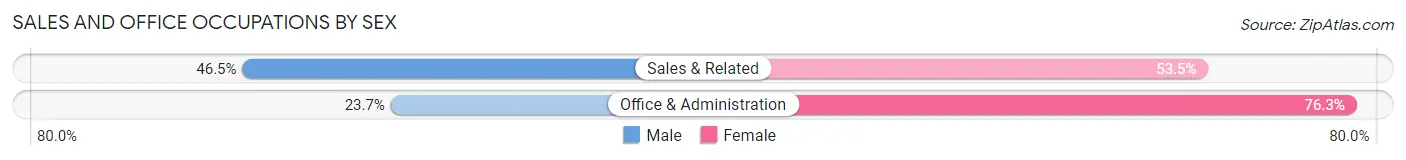
| Occupation | Male | Female |
| Sales & Related | 153 (46.5%) | 176 (53.5%) |
| Office & Administration | 9 (23.7%) | 29 (76.3%) |
| Total (Category) | 162 (44.1%) | 205 (55.9%) |
| Total (Overall) | 544 (57.4%) | 404 (42.6%) |
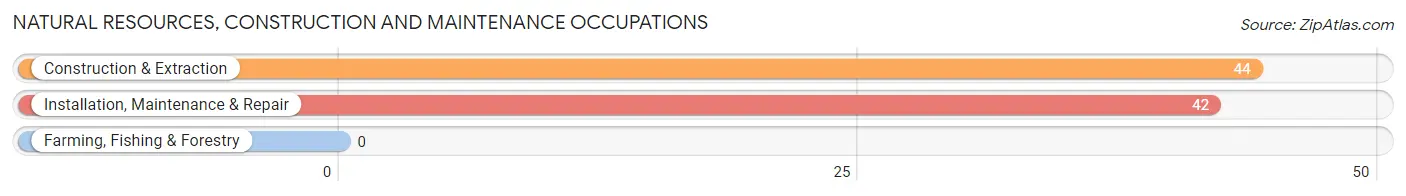
Natural Resources, Construction and Maintenance Occupations
The most common Natural Resources, Construction and Maintenance occupations in East Brooklyn are Construction & Extraction (44 | 4.6%), and Installation, Maintenance & Repair (42 | 4.4%).
Natural Resources, Construction and Maintenance Occupations by Sex
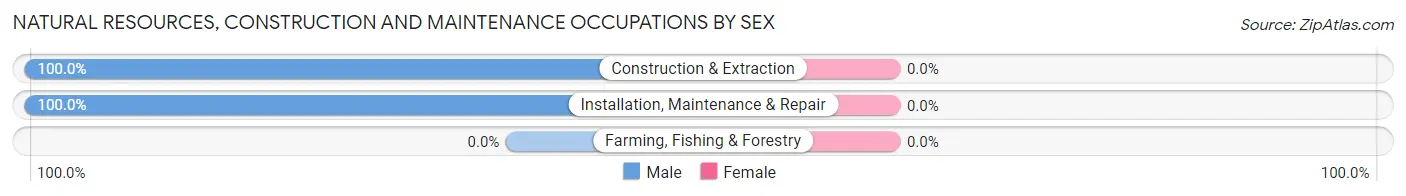
| Occupation | Male | Female |
| Farming, Fishing & Forestry | 0 (0.0%) | 0 (0.0%) |
| Construction & Extraction | 44 (100.0%) | 0 (0.0%) |
| Installation, Maintenance & Repair | 42 (100.0%) | 0 (0.0%) |
| Total (Category) | 86 (100.0%) | 0 (0.0%) |
| Total (Overall) | 544 (57.4%) | 404 (42.6%) |
Production, Transportation and Moving Occupations
The most common Production, Transportation and Moving occupations in East Brooklyn are Production (196 | 20.7%), and Transportation (15 | 1.6%).
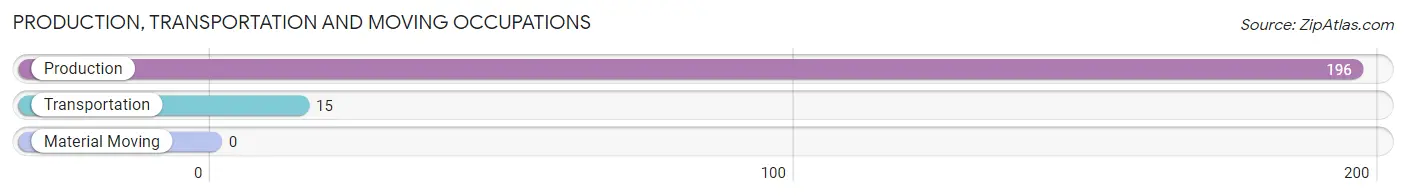
Production, Transportation and Moving Occupations by Sex
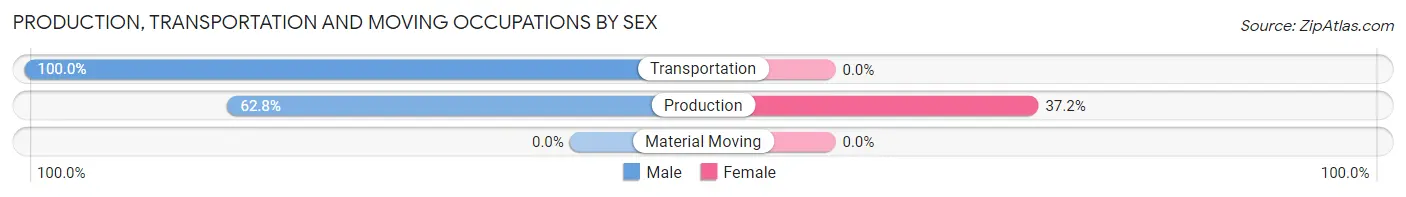
| Occupation | Male | Female |
| Production | 123 (62.8%) | 73 (37.2%) |
| Transportation | 15 (100.0%) | 0 (0.0%) |
| Material Moving | 0 (0.0%) | 0 (0.0%) |
| Total (Category) | 138 (65.4%) | 73 (34.6%) |
| Total (Overall) | 544 (57.4%) | 404 (42.6%) |
Employment Industries by Sex in East Brooklyn
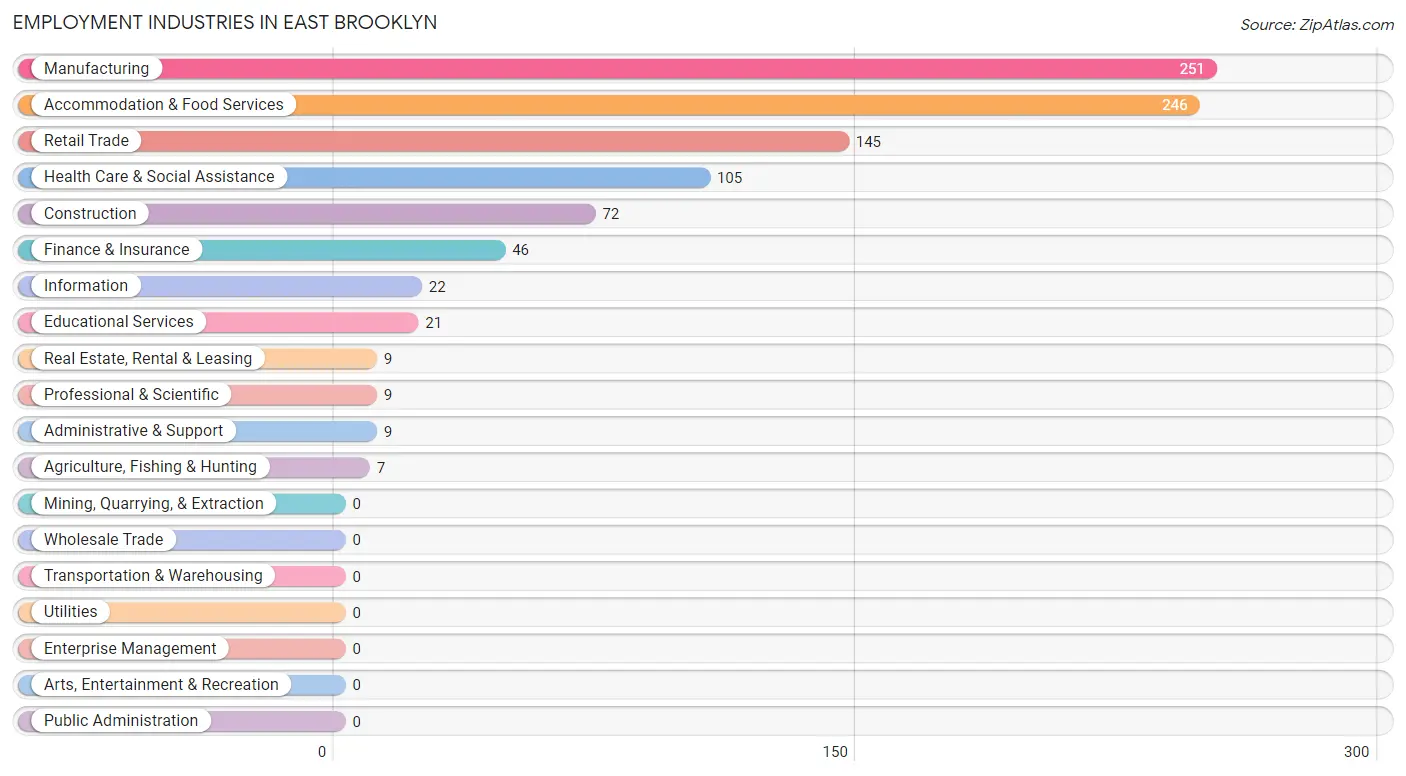
Employment Industries in East Brooklyn
The major employment industries in East Brooklyn include Manufacturing (251 | 26.5%), Accommodation & Food Services (246 | 26.0%), Retail Trade (145 | 15.3%), Health Care & Social Assistance (105 | 11.1%), and Construction (72 | 7.6%).
Employment Industries by Sex in East Brooklyn
The East Brooklyn industries that see more men than women are Agriculture, Fishing & Hunting (100.0%), Construction (100.0%), and Information (100.0%), whereas the industries that tend to have a higher number of women are Real Estate, Rental & Leasing (100.0%), Health Care & Social Assistance (70.5%), and Retail Trade (55.2%).
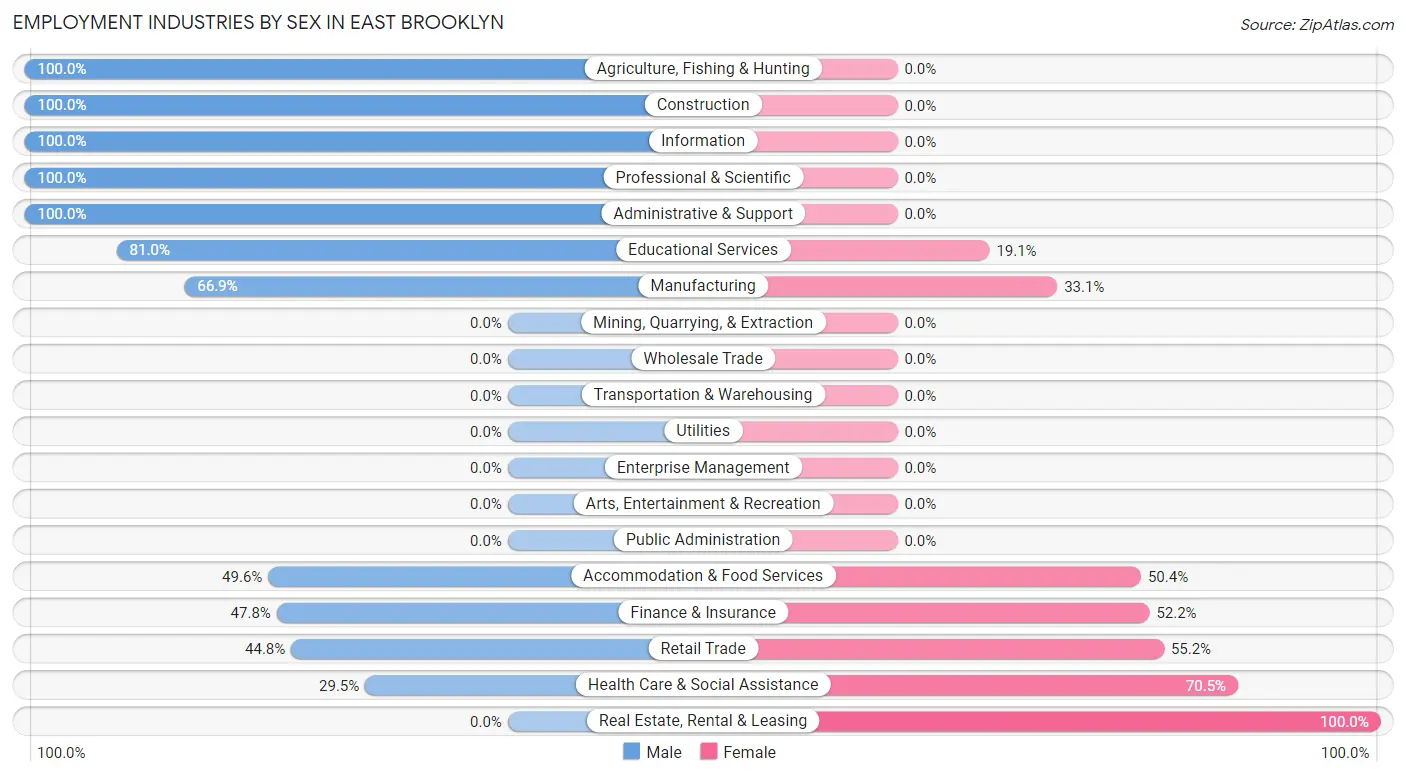
| Industry | Male | Female |
| Agriculture, Fishing & Hunting | 7 (100.0%) | 0 (0.0%) |
| Mining, Quarrying, & Extraction | 0 (0.0%) | 0 (0.0%) |
| Construction | 72 (100.0%) | 0 (0.0%) |
| Manufacturing | 168 (66.9%) | 83 (33.1%) |
| Wholesale Trade | 0 (0.0%) | 0 (0.0%) |
| Retail Trade | 65 (44.8%) | 80 (55.2%) |
| Transportation & Warehousing | 0 (0.0%) | 0 (0.0%) |
| Utilities | 0 (0.0%) | 0 (0.0%) |
| Information | 22 (100.0%) | 0 (0.0%) |
| Finance & Insurance | 22 (47.8%) | 24 (52.2%) |
| Real Estate, Rental & Leasing | 0 (0.0%) | 9 (100.0%) |
| Professional & Scientific | 9 (100.0%) | 0 (0.0%) |
| Enterprise Management | 0 (0.0%) | 0 (0.0%) |
| Administrative & Support | 9 (100.0%) | 0 (0.0%) |
| Educational Services | 17 (80.9%) | 4 (19.1%) |
| Health Care & Social Assistance | 31 (29.5%) | 74 (70.5%) |
| Arts, Entertainment & Recreation | 0 (0.0%) | 0 (0.0%) |
| Accommodation & Food Services | 122 (49.6%) | 124 (50.4%) |
| Public Administration | 0 (0.0%) | 0 (0.0%) |
| Total | 544 (57.4%) | 404 (42.6%) |
Education in East Brooklyn
School Enrollment in East Brooklyn
The most common levels of schooling among the 247 students in East Brooklyn are college / undergraduate (110 | 44.5%), middle school (57 | 23.1%), and high school (39 | 15.8%).
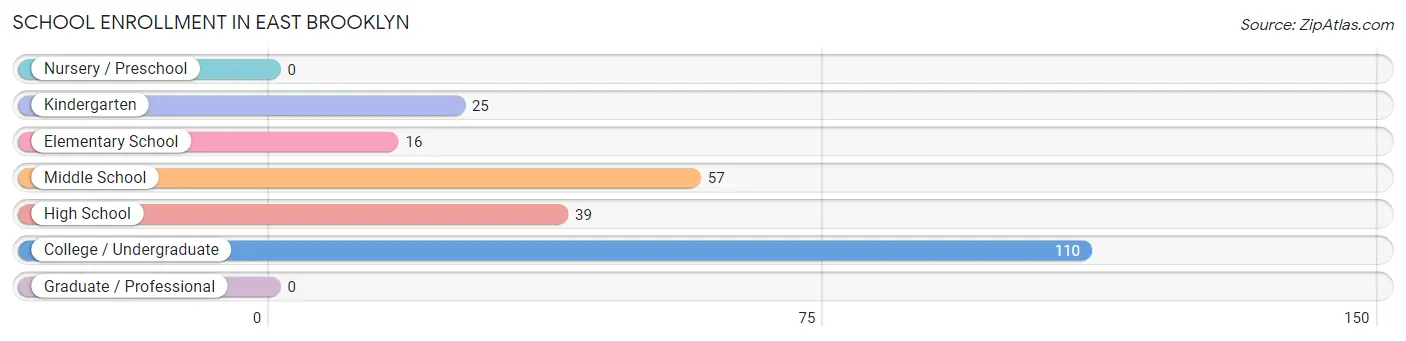
| School Level | # Students | % Students |
| Nursery / Preschool | 0 | 0.0% |
| Kindergarten | 25 | 10.1% |
| Elementary School | 16 | 6.5% |
| Middle School | 57 | 23.1% |
| High School | 39 | 15.8% |
| College / Undergraduate | 110 | 44.5% |
| Graduate / Professional | 0 | 0.0% |
| Total | 247 | 100.0% |
School Enrollment by Age by Funding Source in East Brooklyn
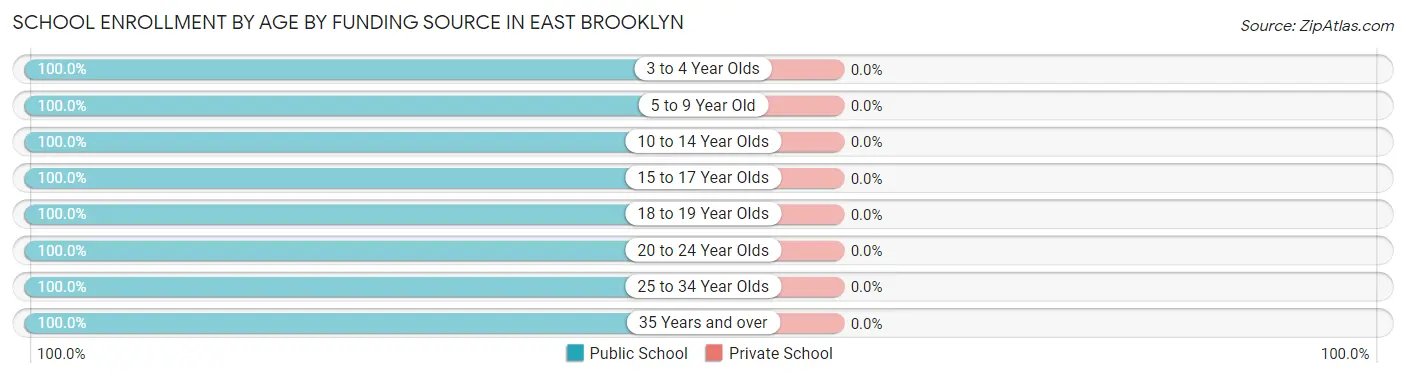
| Age Bracket | Public School | Private School |
| 3 to 4 Year Olds | 25 (100.0%) | 0 (0.0%) |
| 5 to 9 Year Old | 16 (100.0%) | 0 (0.0%) |
| 10 to 14 Year Olds | 57 (100.0%) | 0 (0.0%) |
| 15 to 17 Year Olds | 25 (100.0%) | 0 (0.0%) |
| 18 to 19 Year Olds | 57 (100.0%) | 0 (0.0%) |
| 20 to 24 Year Olds | 32 (100.0%) | 0 (0.0%) |
| 25 to 34 Year Olds | 24 (100.0%) | 0 (0.0%) |
| 35 Years and over | 11 (100.0%) | 0 (0.0%) |
| Total | 247 (100.0%) | 0 (0.0%) |
Educational Attainment by Field of Study in East Brooklyn
Education (22 | 34.4%), liberal arts & history (22 | 34.4%), business (11 | 17.2%), and arts & humanities (9 | 14.1%) are the most common fields of study among 64 individuals in East Brooklyn who have obtained a bachelor's degree or higher.
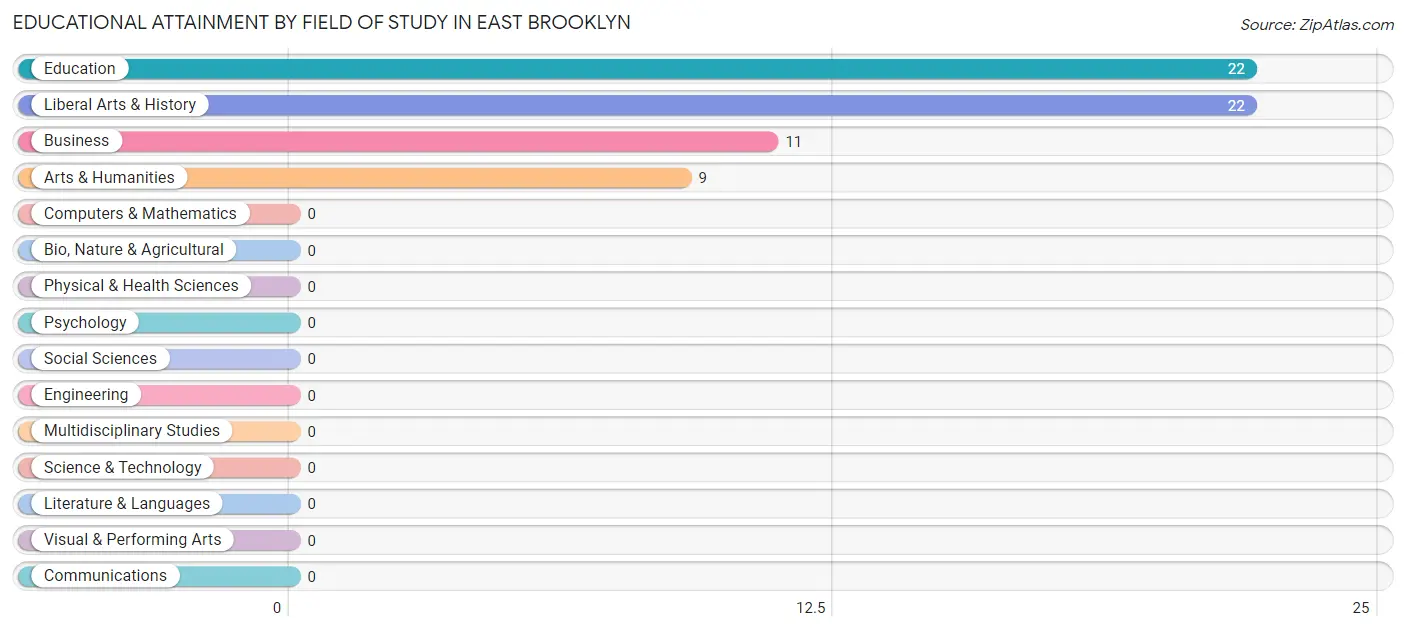
| Field of Study | # Graduates | % Graduates |
| Computers & Mathematics | 0 | 0.0% |
| Bio, Nature & Agricultural | 0 | 0.0% |
| Physical & Health Sciences | 0 | 0.0% |
| Psychology | 0 | 0.0% |
| Social Sciences | 0 | 0.0% |
| Engineering | 0 | 0.0% |
| Multidisciplinary Studies | 0 | 0.0% |
| Science & Technology | 0 | 0.0% |
| Business | 11 | 17.2% |
| Education | 22 | 34.4% |
| Literature & Languages | 0 | 0.0% |
| Liberal Arts & History | 22 | 34.4% |
| Visual & Performing Arts | 0 | 0.0% |
| Communications | 0 | 0.0% |
| Arts & Humanities | 9 | 14.1% |
| Total | 64 | 100.0% |
Transportation & Commute in East Brooklyn
Vehicle Availability by Sex in East Brooklyn
The most prevalent vehicle ownership categories in East Brooklyn are males with 3 vehicles (163, accounting for 30.5%) and females with 3 vehicles (61, making up 40.4%).
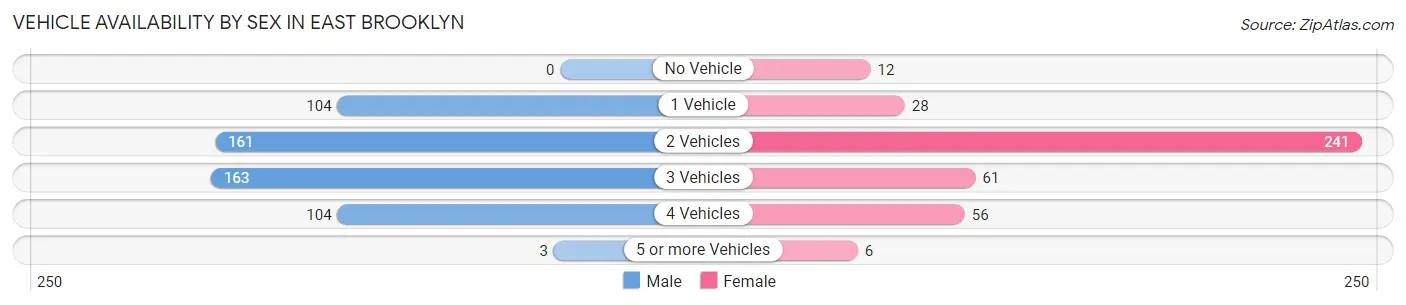
| Vehicles Available | Male | Female |
| No Vehicle | 0 (0.0%) | 12 (3.0%) |
| 1 Vehicle | 104 (19.4%) | 28 (6.9%) |
| 2 Vehicles | 161 (30.1%) | 241 (59.7%) |
| 3 Vehicles | 163 (30.5%) | 61 (15.1%) |
| 4 Vehicles | 104 (19.4%) | 56 (13.9%) |
| 5 or more Vehicles | 3 (0.6%) | 6 (1.5%) |
| Total | 535 (100.0%) | 404 (100.0%) |
Commute Time in East Brooklyn
The most frequently occuring commute durations in East Brooklyn are 10 to 14 minutes (345 commuters, 36.7%), 30 to 34 minutes (209 commuters, 22.3%), and 60 to 89 minutes (92 commuters, 9.8%).
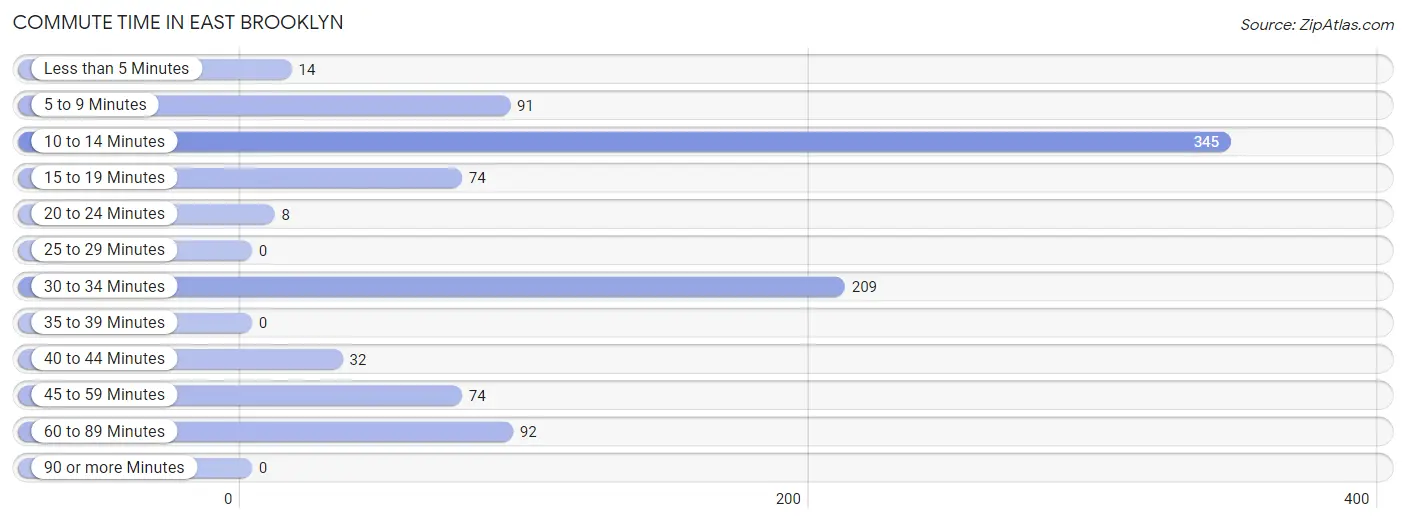
| Commute Time | # Commuters | % Commuters |
| Less than 5 Minutes | 14 | 1.5% |
| 5 to 9 Minutes | 91 | 9.7% |
| 10 to 14 Minutes | 345 | 36.7% |
| 15 to 19 Minutes | 74 | 7.9% |
| 20 to 24 Minutes | 8 | 0.9% |
| 25 to 29 Minutes | 0 | 0.0% |
| 30 to 34 Minutes | 209 | 22.3% |
| 35 to 39 Minutes | 0 | 0.0% |
| 40 to 44 Minutes | 32 | 3.4% |
| 45 to 59 Minutes | 74 | 7.9% |
| 60 to 89 Minutes | 92 | 9.8% |
| 90 or more Minutes | 0 | 0.0% |
Commute Time by Sex in East Brooklyn
The most common commute times in East Brooklyn are 10 to 14 minutes (257 commuters, 48.0%) for males and 30 to 34 minutes (100 commuters, 24.7%) for females.
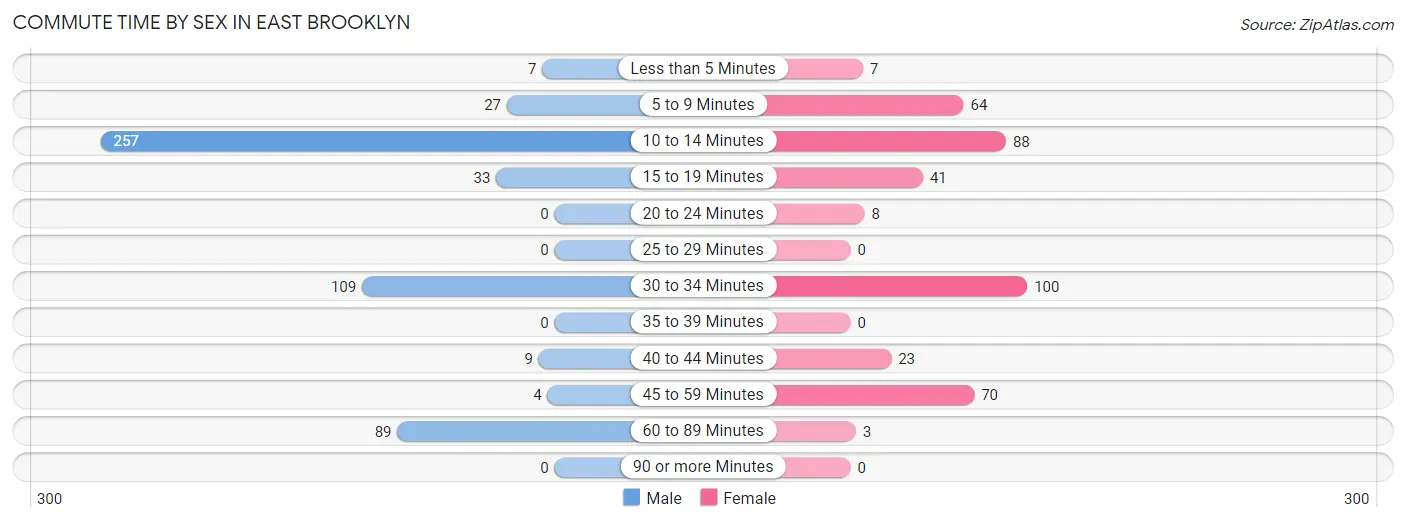
| Commute Time | Male | Female |
| Less than 5 Minutes | 7 (1.3%) | 7 (1.7%) |
| 5 to 9 Minutes | 27 (5.1%) | 64 (15.8%) |
| 10 to 14 Minutes | 257 (48.0%) | 88 (21.8%) |
| 15 to 19 Minutes | 33 (6.2%) | 41 (10.2%) |
| 20 to 24 Minutes | 0 (0.0%) | 8 (2.0%) |
| 25 to 29 Minutes | 0 (0.0%) | 0 (0.0%) |
| 30 to 34 Minutes | 109 (20.4%) | 100 (24.7%) |
| 35 to 39 Minutes | 0 (0.0%) | 0 (0.0%) |
| 40 to 44 Minutes | 9 (1.7%) | 23 (5.7%) |
| 45 to 59 Minutes | 4 (0.7%) | 70 (17.3%) |
| 60 to 89 Minutes | 89 (16.6%) | 3 (0.7%) |
| 90 or more Minutes | 0 (0.0%) | 0 (0.0%) |
Time of Departure to Work by Sex in East Brooklyn
The most frequent times of departure to work in East Brooklyn are 11:00 AM to 11:59 AM (158, 29.5%) for males and 11:00 AM to 11:59 AM (202, 50.0%) for females.
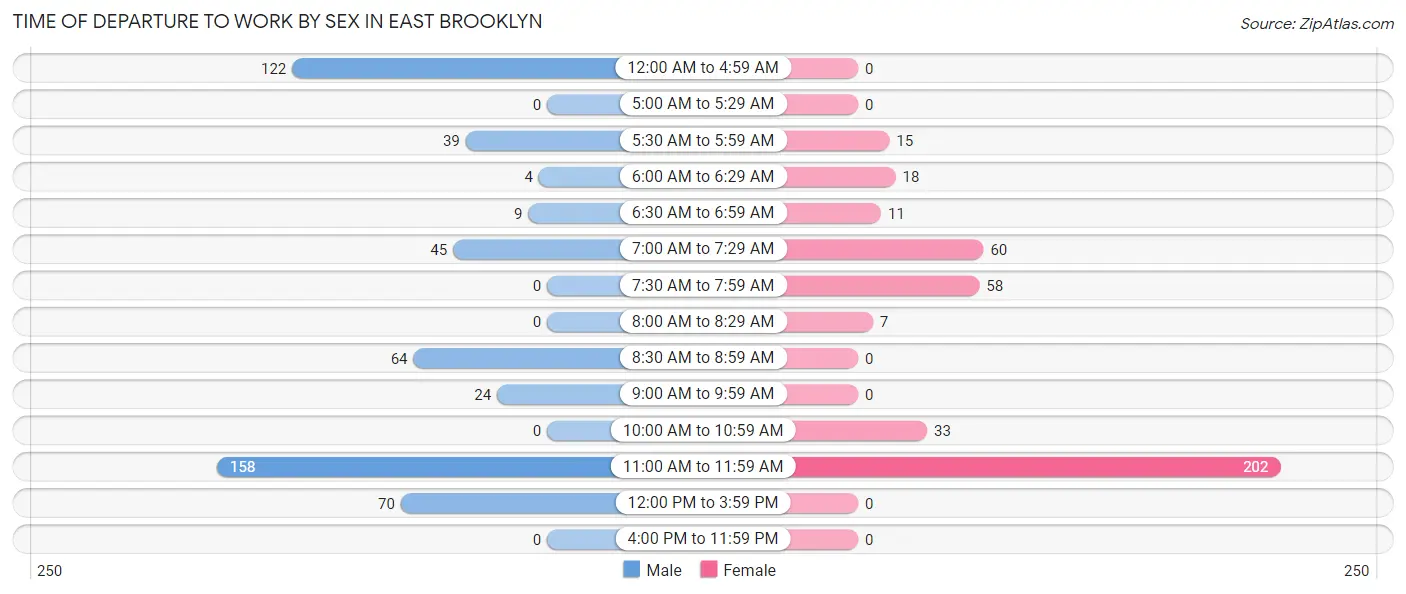
| Time of Departure | Male | Female |
| 12:00 AM to 4:59 AM | 122 (22.8%) | 0 (0.0%) |
| 5:00 AM to 5:29 AM | 0 (0.0%) | 0 (0.0%) |
| 5:30 AM to 5:59 AM | 39 (7.3%) | 15 (3.7%) |
| 6:00 AM to 6:29 AM | 4 (0.7%) | 18 (4.5%) |
| 6:30 AM to 6:59 AM | 9 (1.7%) | 11 (2.7%) |
| 7:00 AM to 7:29 AM | 45 (8.4%) | 60 (14.8%) |
| 7:30 AM to 7:59 AM | 0 (0.0%) | 58 (14.4%) |
| 8:00 AM to 8:29 AM | 0 (0.0%) | 7 (1.7%) |
| 8:30 AM to 8:59 AM | 64 (12.0%) | 0 (0.0%) |
| 9:00 AM to 9:59 AM | 24 (4.5%) | 0 (0.0%) |
| 10:00 AM to 10:59 AM | 0 (0.0%) | 33 (8.2%) |
| 11:00 AM to 11:59 AM | 158 (29.5%) | 202 (50.0%) |
| 12:00 PM to 3:59 PM | 70 (13.1%) | 0 (0.0%) |
| 4:00 PM to 11:59 PM | 0 (0.0%) | 0 (0.0%) |
| Total | 535 (100.0%) | 404 (100.0%) |
Housing Occupancy in East Brooklyn
Occupancy by Ownership in East Brooklyn
Of the total 803 dwellings in East Brooklyn, owner-occupied units account for 552 (68.7%), while renter-occupied units make up 251 (31.3%).
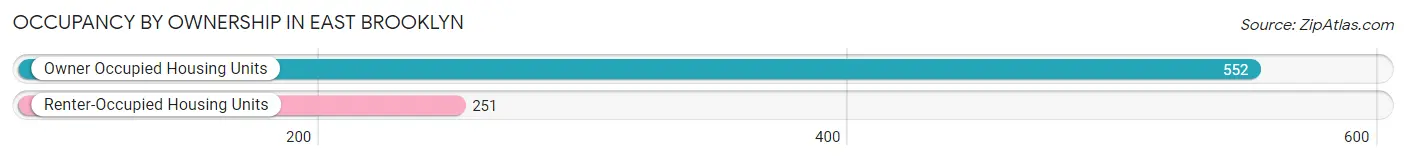
| Occupancy | # Housing Units | % Housing Units |
| Owner Occupied Housing Units | 552 | 68.7% |
| Renter-Occupied Housing Units | 251 | 31.3% |
| Total Occupied Housing Units | 803 | 100.0% |
Occupancy by Household Size in East Brooklyn
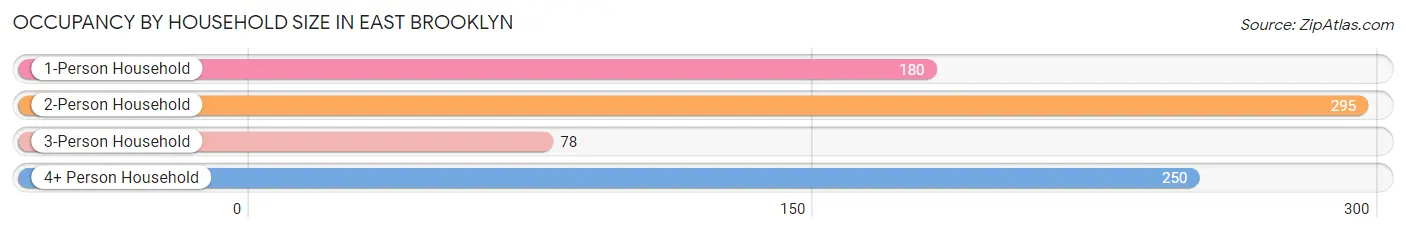
| Household Size | # Housing Units | % Housing Units |
| 1-Person Household | 180 | 22.4% |
| 2-Person Household | 295 | 36.7% |
| 3-Person Household | 78 | 9.7% |
| 4+ Person Household | 250 | 31.1% |
| Total Housing Units | 803 | 100.0% |
Occupancy by Ownership by Household Size in East Brooklyn
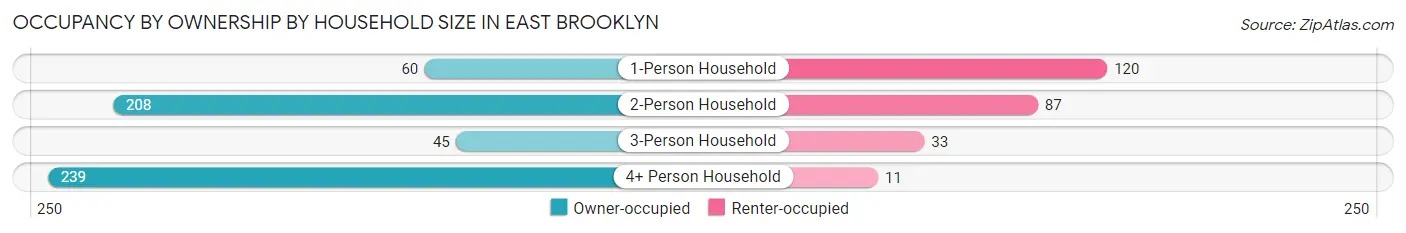
| Household Size | Owner-occupied | Renter-occupied |
| 1-Person Household | 60 (33.3%) | 120 (66.7%) |
| 2-Person Household | 208 (70.5%) | 87 (29.5%) |
| 3-Person Household | 45 (57.7%) | 33 (42.3%) |
| 4+ Person Household | 239 (95.6%) | 11 (4.4%) |
| Total Housing Units | 552 (68.7%) | 251 (31.3%) |
Occupancy by Educational Attainment in East Brooklyn
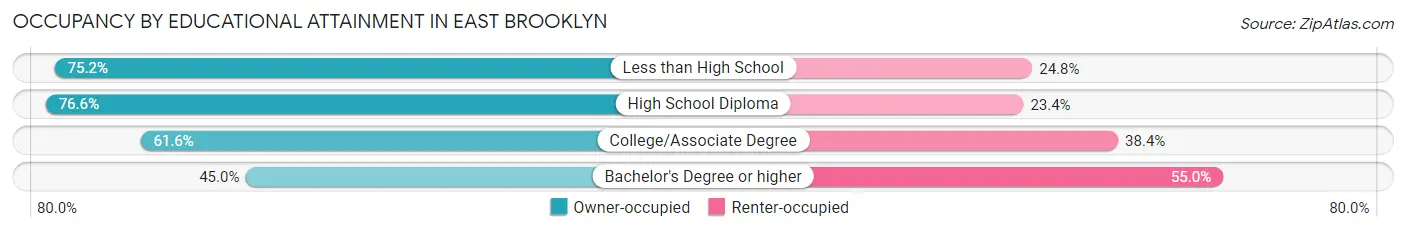
| Household Size | Owner-occupied | Renter-occupied |
| Less than High School | 82 (75.2%) | 27 (24.8%) |
| High School Diploma | 233 (76.6%) | 71 (23.4%) |
| College/Associate Degree | 228 (61.6%) | 142 (38.4%) |
| Bachelor's Degree or higher | 9 (45.0%) | 11 (55.0%) |
Occupancy by Age of Householder in East Brooklyn
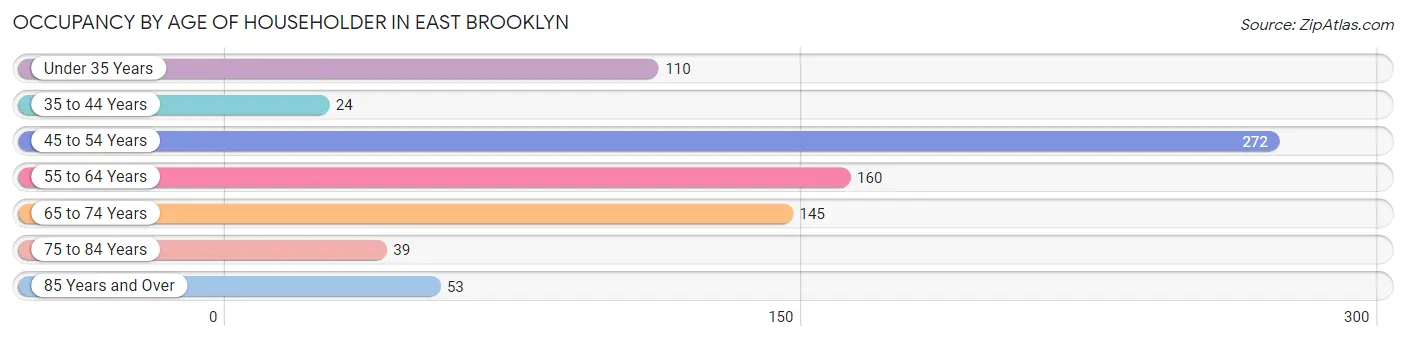
| Age Bracket | # Households | % Households |
| Under 35 Years | 110 | 13.7% |
| 35 to 44 Years | 24 | 3.0% |
| 45 to 54 Years | 272 | 33.9% |
| 55 to 64 Years | 160 | 19.9% |
| 65 to 74 Years | 145 | 18.1% |
| 75 to 84 Years | 39 | 4.9% |
| 85 Years and Over | 53 | 6.6% |
| Total | 803 | 100.0% |
Housing Finances in East Brooklyn
Median Income by Occupancy in East Brooklyn
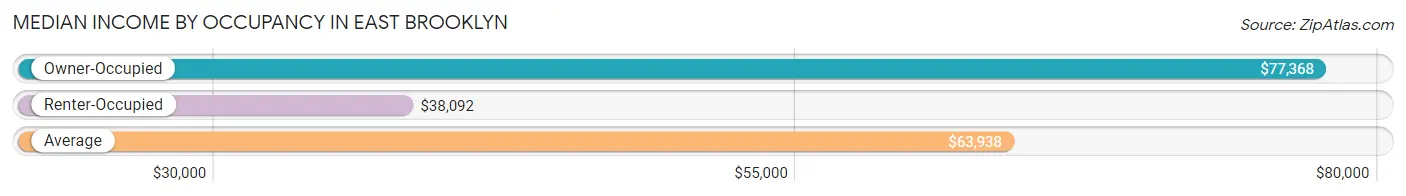
| Occupancy Type | # Households | Median Income |
| Owner-Occupied | 552 (68.7%) | $77,368 |
| Renter-Occupied | 251 (31.3%) | $38,092 |
| Average | 803 (100.0%) | $63,938 |
Occupancy by Householder Income Bracket in East Brooklyn
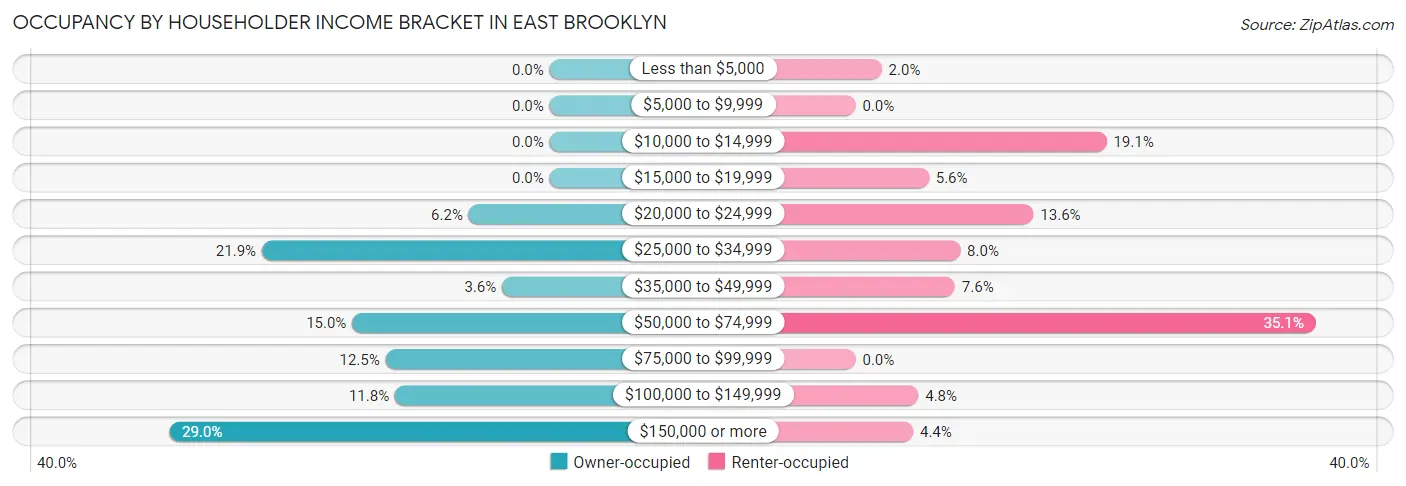
| Income Bracket | Owner-occupied | Renter-occupied |
| Less than $5,000 | 0 (0.0%) | 5 (2.0%) |
| $5,000 to $9,999 | 0 (0.0%) | 0 (0.0%) |
| $10,000 to $14,999 | 0 (0.0%) | 48 (19.1%) |
| $15,000 to $19,999 | 0 (0.0%) | 14 (5.6%) |
| $20,000 to $24,999 | 34 (6.2%) | 34 (13.6%) |
| $25,000 to $34,999 | 121 (21.9%) | 20 (8.0%) |
| $35,000 to $49,999 | 20 (3.6%) | 19 (7.6%) |
| $50,000 to $74,999 | 83 (15.0%) | 88 (35.1%) |
| $75,000 to $99,999 | 69 (12.5%) | 0 (0.0%) |
| $100,000 to $149,999 | 65 (11.8%) | 12 (4.8%) |
| $150,000 or more | 160 (29.0%) | 11 (4.4%) |
| Total | 552 (100.0%) | 251 (100.0%) |
Monthly Housing Cost Tiers in East Brooklyn
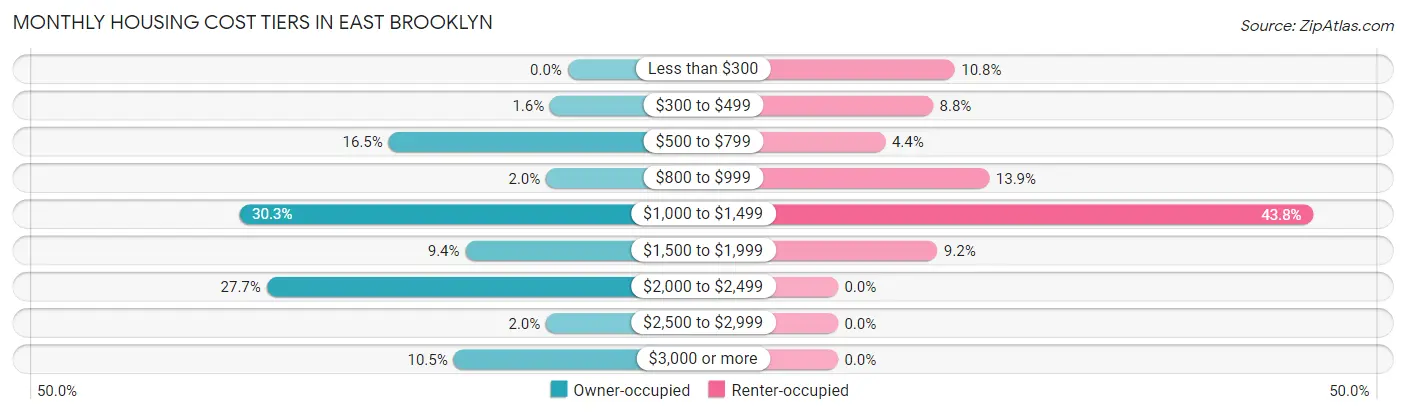
| Monthly Cost | Owner-occupied | Renter-occupied |
| Less than $300 | 0 (0.0%) | 27 (10.8%) |
| $300 to $499 | 9 (1.6%) | 22 (8.8%) |
| $500 to $799 | 91 (16.5%) | 11 (4.4%) |
| $800 to $999 | 11 (2.0%) | 35 (13.9%) |
| $1,000 to $1,499 | 167 (30.2%) | 110 (43.8%) |
| $1,500 to $1,999 | 52 (9.4%) | 23 (9.2%) |
| $2,000 to $2,499 | 153 (27.7%) | 0 (0.0%) |
| $2,500 to $2,999 | 11 (2.0%) | 0 (0.0%) |
| $3,000 or more | 58 (10.5%) | 0 (0.0%) |
| Total | 552 (100.0%) | 251 (100.0%) |
Physical Housing Characteristics in East Brooklyn
Housing Structures in East Brooklyn
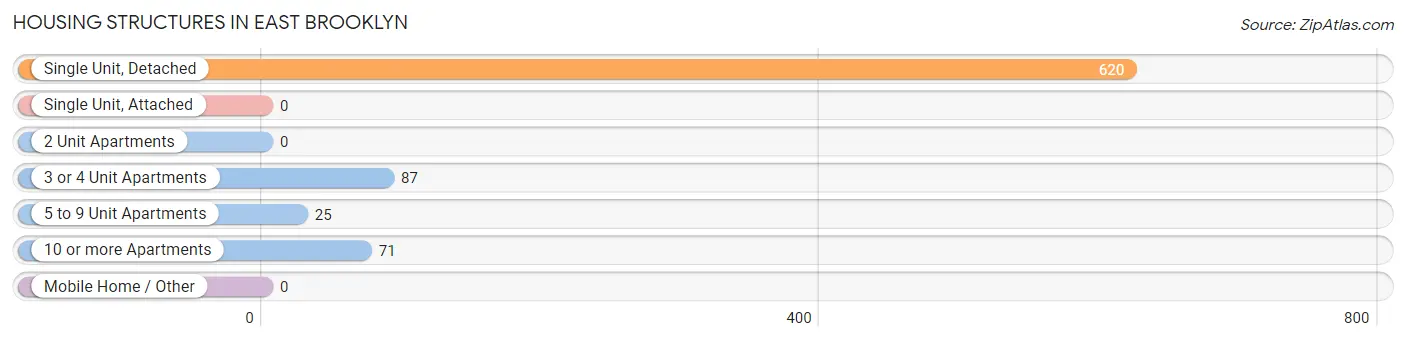
| Structure Type | # Housing Units | % Housing Units |
| Single Unit, Detached | 620 | 77.2% |
| Single Unit, Attached | 0 | 0.0% |
| 2 Unit Apartments | 0 | 0.0% |
| 3 or 4 Unit Apartments | 87 | 10.8% |
| 5 to 9 Unit Apartments | 25 | 3.1% |
| 10 or more Apartments | 71 | 8.8% |
| Mobile Home / Other | 0 | 0.0% |
| Total | 803 | 100.0% |
Housing Structures by Occupancy in East Brooklyn
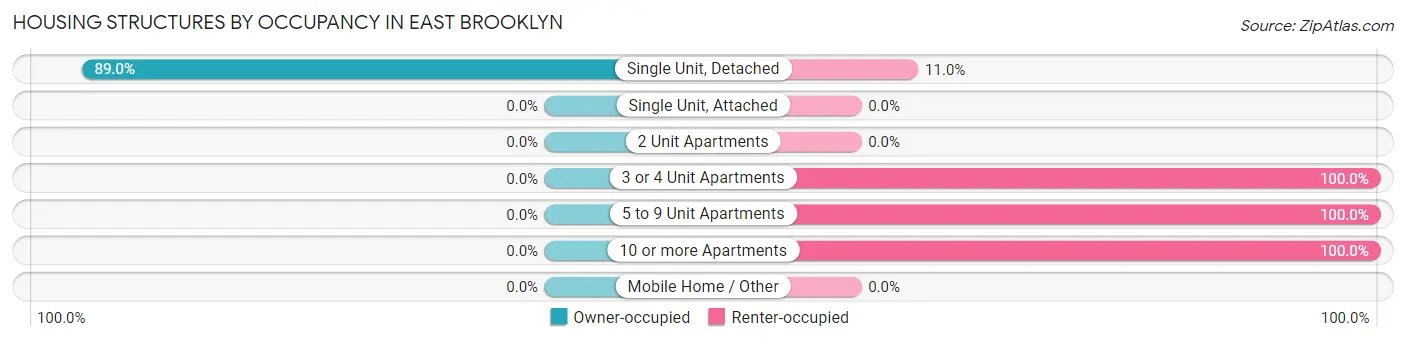
| Structure Type | Owner-occupied | Renter-occupied |
| Single Unit, Detached | 552 (89.0%) | 68 (11.0%) |
| Single Unit, Attached | 0 (0.0%) | 0 (0.0%) |
| 2 Unit Apartments | 0 (0.0%) | 0 (0.0%) |
| 3 or 4 Unit Apartments | 0 (0.0%) | 87 (100.0%) |
| 5 to 9 Unit Apartments | 0 (0.0%) | 25 (100.0%) |
| 10 or more Apartments | 0 (0.0%) | 71 (100.0%) |
| Mobile Home / Other | 0 (0.0%) | 0 (0.0%) |
| Total | 552 (68.7%) | 251 (31.3%) |
Housing Structures by Number of Rooms in East Brooklyn
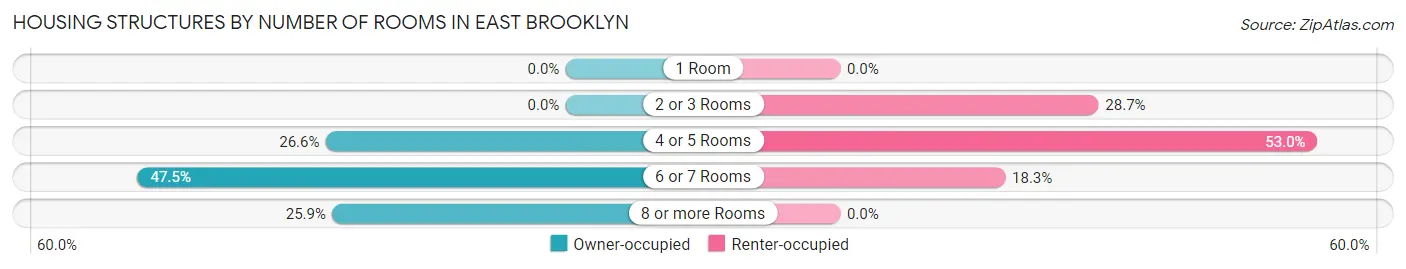
| Number of Rooms | Owner-occupied | Renter-occupied |
| 1 Room | 0 (0.0%) | 0 (0.0%) |
| 2 or 3 Rooms | 0 (0.0%) | 72 (28.7%) |
| 4 or 5 Rooms | 147 (26.6%) | 133 (53.0%) |
| 6 or 7 Rooms | 262 (47.5%) | 46 (18.3%) |
| 8 or more Rooms | 143 (25.9%) | 0 (0.0%) |
| Total | 552 (100.0%) | 251 (100.0%) |
Housing Structure by Heating Type in East Brooklyn
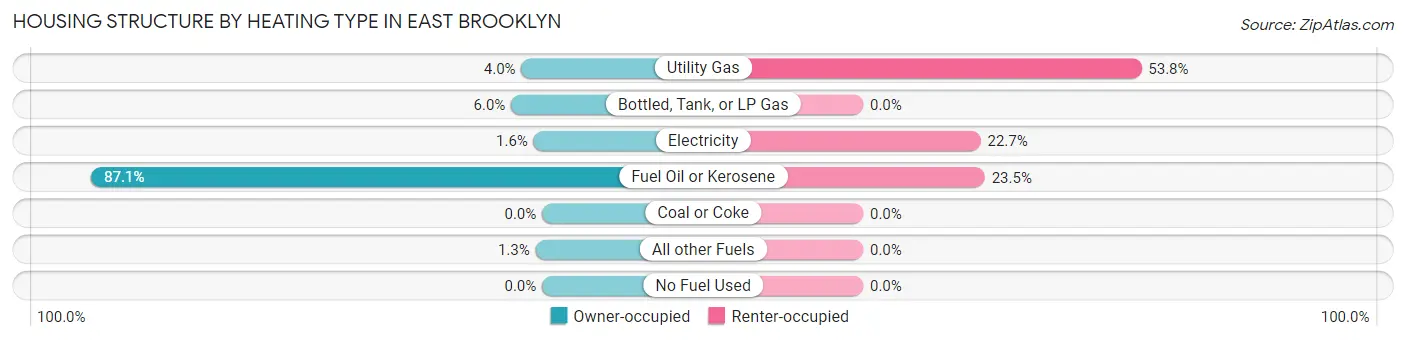
| Heating Type | Owner-occupied | Renter-occupied |
| Utility Gas | 22 (4.0%) | 135 (53.8%) |
| Bottled, Tank, or LP Gas | 33 (6.0%) | 0 (0.0%) |
| Electricity | 9 (1.6%) | 57 (22.7%) |
| Fuel Oil or Kerosene | 481 (87.1%) | 59 (23.5%) |
| Coal or Coke | 0 (0.0%) | 0 (0.0%) |
| All other Fuels | 7 (1.3%) | 0 (0.0%) |
| No Fuel Used | 0 (0.0%) | 0 (0.0%) |
| Total | 552 (100.0%) | 251 (100.0%) |
Household Vehicle Usage in East Brooklyn
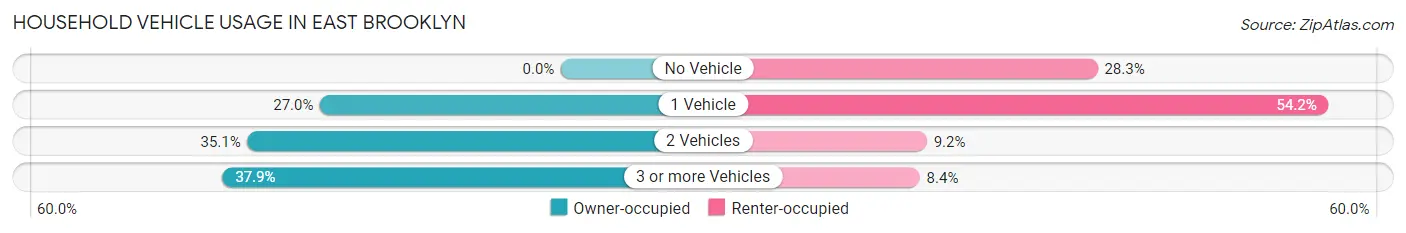
| Vehicles per Household | Owner-occupied | Renter-occupied |
| No Vehicle | 0 (0.0%) | 71 (28.3%) |
| 1 Vehicle | 149 (27.0%) | 136 (54.2%) |
| 2 Vehicles | 194 (35.1%) | 23 (9.2%) |
| 3 or more Vehicles | 209 (37.9%) | 21 (8.4%) |
| Total | 552 (100.0%) | 251 (100.0%) |
Real Estate & Mortgages in East Brooklyn
Real Estate and Mortgage Overview in East Brooklyn
| Characteristic | Without Mortgage | With Mortgage |
| Housing Units | 87 | 465 |
| Median Property Value | - | - |
| Median Household Income | $29,063 | $160 |
| Monthly Housing Costs | $582 | $58 |
| Real Estate Taxes | $5,448 | $0 |
Property Value by Mortgage Status in East Brooklyn
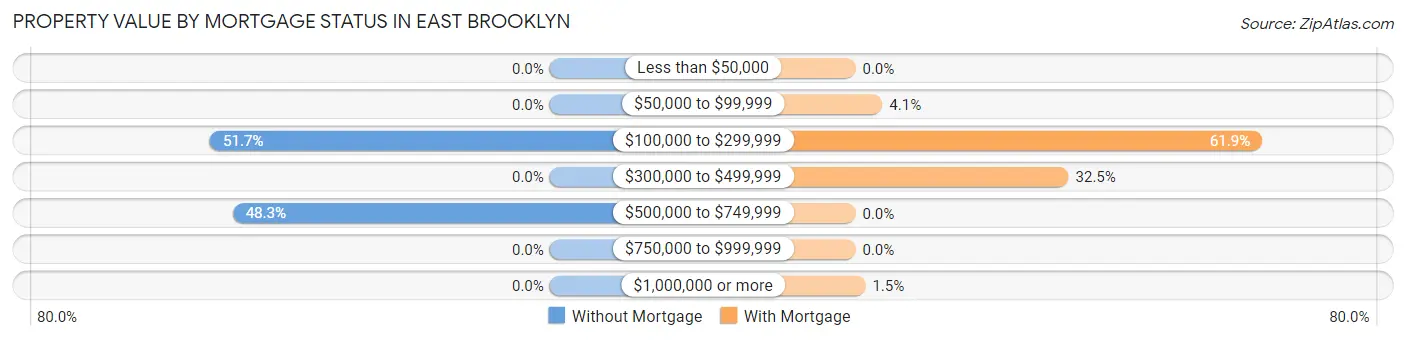
| Property Value | Without Mortgage | With Mortgage |
| Less than $50,000 | 0 (0.0%) | 0 (0.0%) |
| $50,000 to $99,999 | 0 (0.0%) | 19 (4.1%) |
| $100,000 to $299,999 | 45 (51.7%) | 288 (61.9%) |
| $300,000 to $499,999 | 0 (0.0%) | 151 (32.5%) |
| $500,000 to $749,999 | 42 (48.3%) | 0 (0.0%) |
| $750,000 to $999,999 | 0 (0.0%) | 0 (0.0%) |
| $1,000,000 or more | 0 (0.0%) | 7 (1.5%) |
| Total | 87 (100.0%) | 465 (100.0%) |
Household Income by Mortgage Status in East Brooklyn
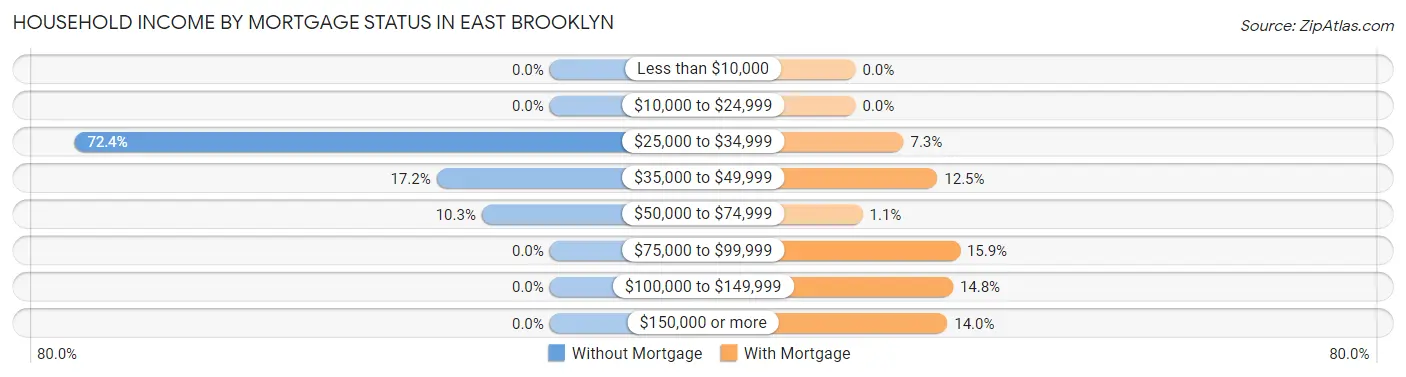
| Household Income | Without Mortgage | With Mortgage |
| Less than $10,000 | 0 (0.0%) | 0 (0.0%) |
| $10,000 to $24,999 | 0 (0.0%) | 0 (0.0%) |
| $25,000 to $34,999 | 63 (72.4%) | 34 (7.3%) |
| $35,000 to $49,999 | 15 (17.2%) | 58 (12.5%) |
| $50,000 to $74,999 | 9 (10.3%) | 5 (1.1%) |
| $75,000 to $99,999 | 0 (0.0%) | 74 (15.9%) |
| $100,000 to $149,999 | 0 (0.0%) | 69 (14.8%) |
| $150,000 or more | 0 (0.0%) | 65 (14.0%) |
| Total | 87 (100.0%) | 465 (100.0%) |
Property Value to Household Income Ratio in East Brooklyn
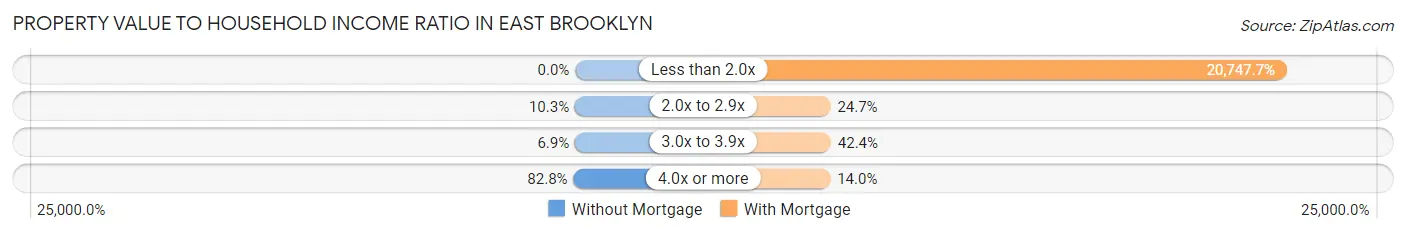
| Value-to-Income Ratio | Without Mortgage | With Mortgage |
| Less than 2.0x | 0 (0.0%) | 96,477 (20,747.7%) |
| 2.0x to 2.9x | 9 (10.3%) | 115 (24.7%) |
| 3.0x to 3.9x | 6 (6.9%) | 197 (42.4%) |
| 4.0x or more | 72 (82.8%) | 65 (14.0%) |
| Total | 87 (100.0%) | 465 (100.0%) |
Real Estate Taxes by Mortgage Status in East Brooklyn
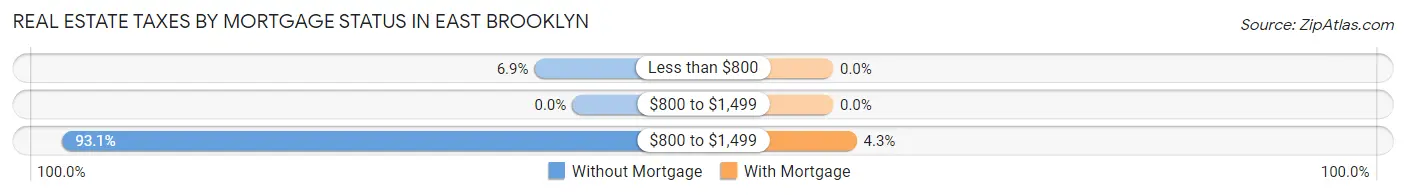
| Property Taxes | Without Mortgage | With Mortgage |
| Less than $800 | 6 (6.9%) | 0 (0.0%) |
| $800 to $1,499 | 0 (0.0%) | 0 (0.0%) |
| $800 to $1,499 | 81 (93.1%) | 20 (4.3%) |
| Total | 87 (100.0%) | 465 (100.0%) |
Health & Disability in East Brooklyn
Health Insurance Coverage by Age in East Brooklyn
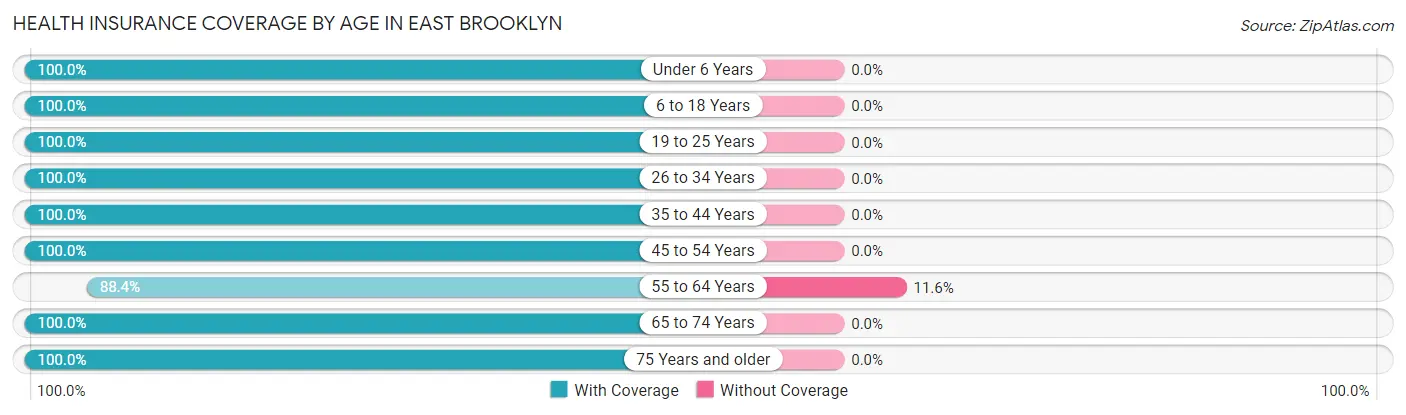
| Age Bracket | With Coverage | Without Coverage |
| Under 6 Years | 176 (100.0%) | 0 (0.0%) |
| 6 to 18 Years | 175 (100.0%) | 0 (0.0%) |
| 19 to 25 Years | 163 (100.0%) | 0 (0.0%) |
| 26 to 34 Years | 275 (100.0%) | 0 (0.0%) |
| 35 to 44 Years | 113 (100.0%) | 0 (0.0%) |
| 45 to 54 Years | 390 (100.0%) | 0 (0.0%) |
| 55 to 64 Years | 335 (88.4%) | 44 (11.6%) |
| 65 to 74 Years | 228 (100.0%) | 0 (0.0%) |
| 75 Years and older | 152 (100.0%) | 0 (0.0%) |
| Total | 2,007 (97.9%) | 44 (2.1%) |
Health Insurance Coverage by Citizenship Status in East Brooklyn
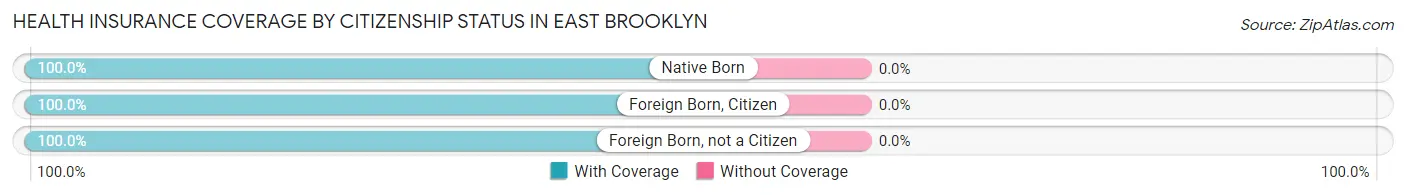
| Citizenship Status | With Coverage | Without Coverage |
| Native Born | 176 (100.0%) | 0 (0.0%) |
| Foreign Born, Citizen | 175 (100.0%) | 0 (0.0%) |
| Foreign Born, not a Citizen | 163 (100.0%) | 0 (0.0%) |
Health Insurance Coverage by Household Income in East Brooklyn
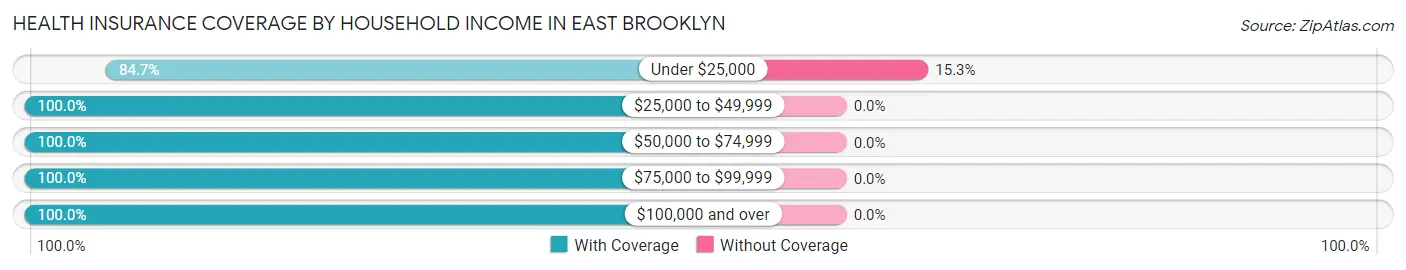
| Household Income | With Coverage | Without Coverage |
| Under $25,000 | 244 (84.7%) | 44 (15.3%) |
| $25,000 to $49,999 | 349 (100.0%) | 0 (0.0%) |
| $50,000 to $74,999 | 419 (100.0%) | 0 (0.0%) |
| $75,000 to $99,999 | 159 (100.0%) | 0 (0.0%) |
| $100,000 and over | 836 (100.0%) | 0 (0.0%) |
Public vs Private Health Insurance Coverage by Age in East Brooklyn
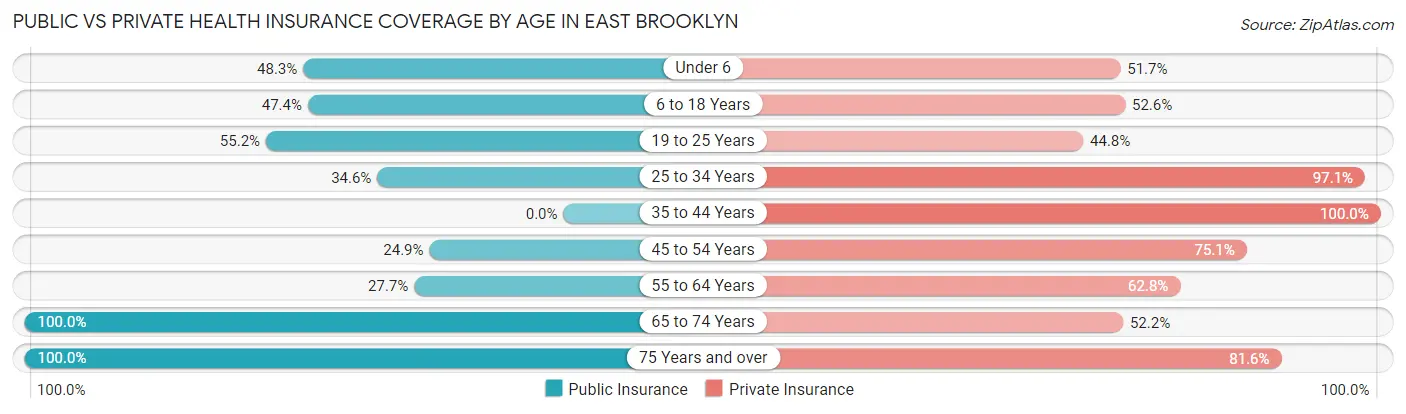
| Age Bracket | Public Insurance | Private Insurance |
| Under 6 | 85 (48.3%) | 91 (51.7%) |
| 6 to 18 Years | 83 (47.4%) | 92 (52.6%) |
| 19 to 25 Years | 90 (55.2%) | 73 (44.8%) |
| 25 to 34 Years | 95 (34.5%) | 267 (97.1%) |
| 35 to 44 Years | 0 (0.0%) | 113 (100.0%) |
| 45 to 54 Years | 97 (24.9%) | 293 (75.1%) |
| 55 to 64 Years | 105 (27.7%) | 238 (62.8%) |
| 65 to 74 Years | 228 (100.0%) | 119 (52.2%) |
| 75 Years and over | 152 (100.0%) | 124 (81.6%) |
| Total | 935 (45.6%) | 1,410 (68.8%) |
Disability Status by Sex by Age in East Brooklyn
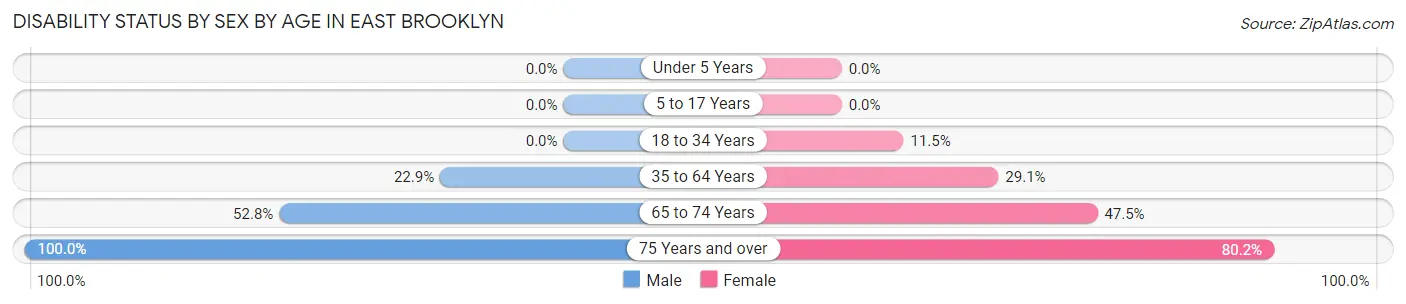
| Age Bracket | Male | Female |
| Under 5 Years | 0 (0.0%) | 0 (0.0%) |
| 5 to 17 Years | 0 (0.0%) | 0 (0.0%) |
| 18 to 34 Years | 0 (0.0%) | 22 (11.5%) |
| 35 to 64 Years | 98 (22.9%) | 132 (29.1%) |
| 65 to 74 Years | 48 (52.7%) | 65 (47.4%) |
| 75 Years and over | 51 (100.0%) | 81 (80.2%) |
Disability Class by Sex by Age in East Brooklyn
Disability Class: Hearing Difficulty
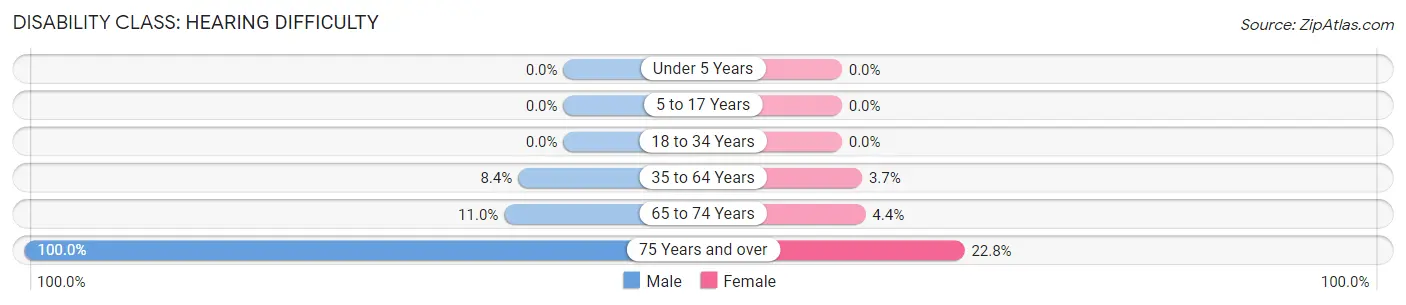
| Age Bracket | Male | Female |
| Under 5 Years | 0 (0.0%) | 0 (0.0%) |
| 5 to 17 Years | 0 (0.0%) | 0 (0.0%) |
| 18 to 34 Years | 0 (0.0%) | 0 (0.0%) |
| 35 to 64 Years | 36 (8.4%) | 17 (3.7%) |
| 65 to 74 Years | 10 (11.0%) | 6 (4.4%) |
| 75 Years and over | 51 (100.0%) | 23 (22.8%) |
Disability Class: Vision Difficulty
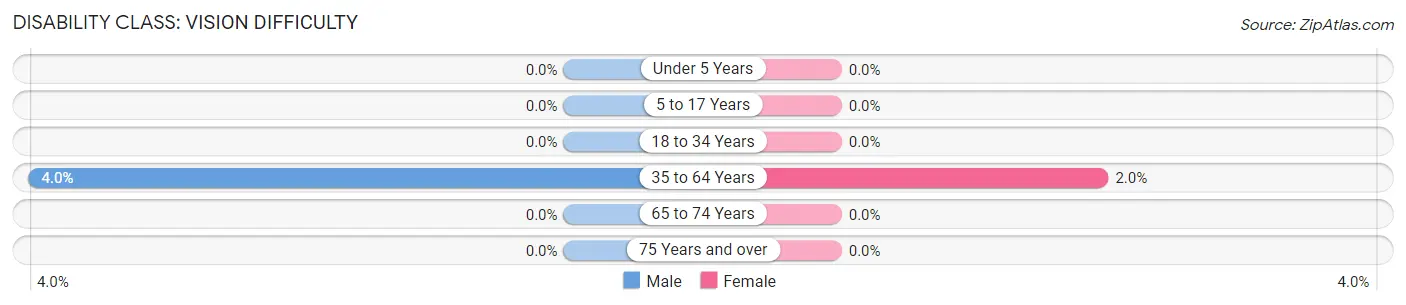
| Age Bracket | Male | Female |
| Under 5 Years | 0 (0.0%) | 0 (0.0%) |
| 5 to 17 Years | 0 (0.0%) | 0 (0.0%) |
| 18 to 34 Years | 0 (0.0%) | 0 (0.0%) |
| 35 to 64 Years | 17 (4.0%) | 9 (2.0%) |
| 65 to 74 Years | 0 (0.0%) | 0 (0.0%) |
| 75 Years and over | 0 (0.0%) | 0 (0.0%) |
Disability Class: Cognitive Difficulty
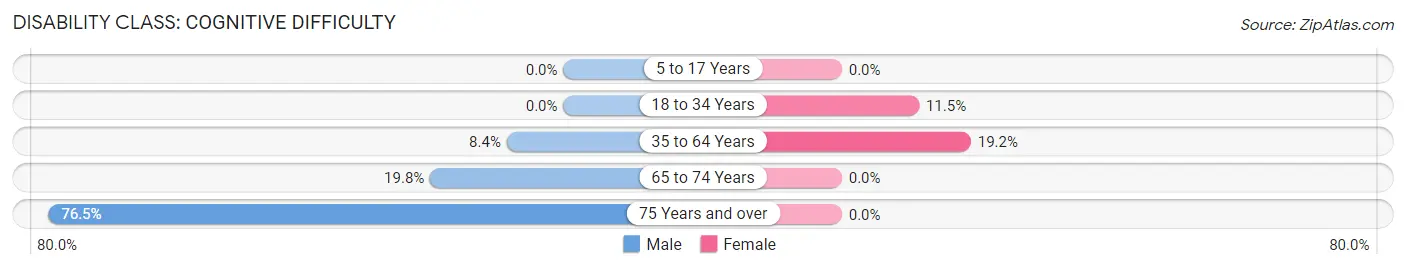
| Age Bracket | Male | Female |
| 5 to 17 Years | 0 (0.0%) | 0 (0.0%) |
| 18 to 34 Years | 0 (0.0%) | 22 (11.5%) |
| 35 to 64 Years | 36 (8.4%) | 87 (19.2%) |
| 65 to 74 Years | 18 (19.8%) | 0 (0.0%) |
| 75 Years and over | 39 (76.5%) | 0 (0.0%) |
Disability Class: Ambulatory Difficulty
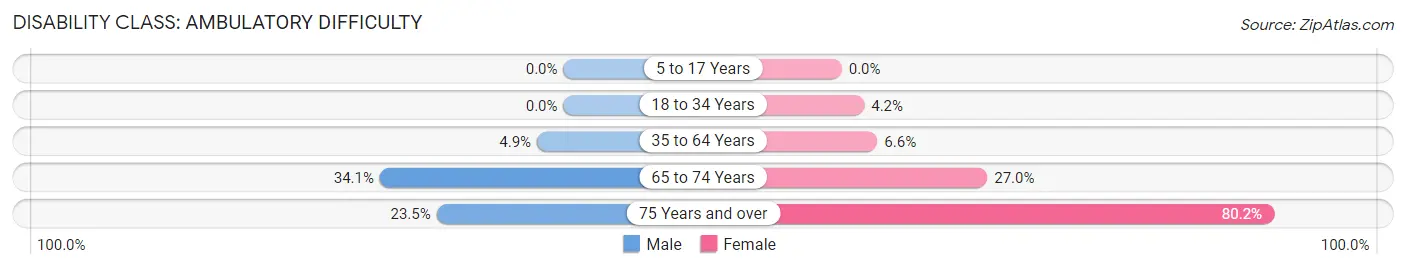
| Age Bracket | Male | Female |
| 5 to 17 Years | 0 (0.0%) | 0 (0.0%) |
| 18 to 34 Years | 0 (0.0%) | 8 (4.2%) |
| 35 to 64 Years | 21 (4.9%) | 30 (6.6%) |
| 65 to 74 Years | 31 (34.1%) | 37 (27.0%) |
| 75 Years and over | 12 (23.5%) | 81 (80.2%) |
Disability Class: Self-Care Difficulty
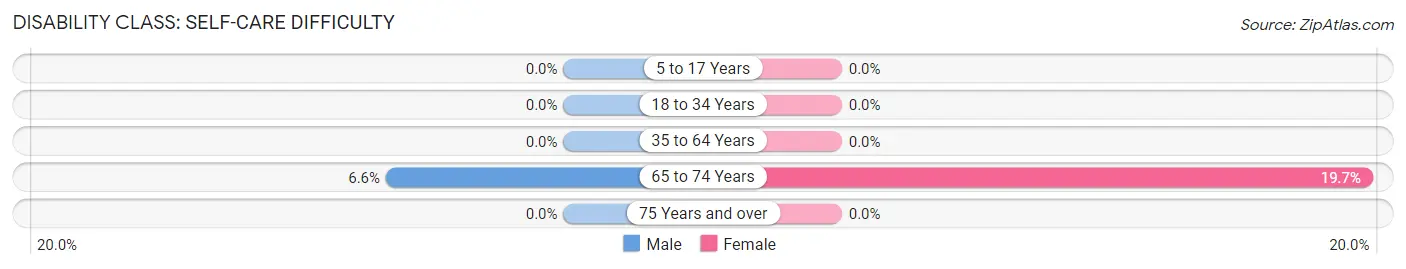
| Age Bracket | Male | Female |
| 5 to 17 Years | 0 (0.0%) | 0 (0.0%) |
| 18 to 34 Years | 0 (0.0%) | 0 (0.0%) |
| 35 to 64 Years | 0 (0.0%) | 0 (0.0%) |
| 65 to 74 Years | 6 (6.6%) | 27 (19.7%) |
| 75 Years and over | 0 (0.0%) | 0 (0.0%) |
Technology Access in East Brooklyn
Computing Device Access in East Brooklyn
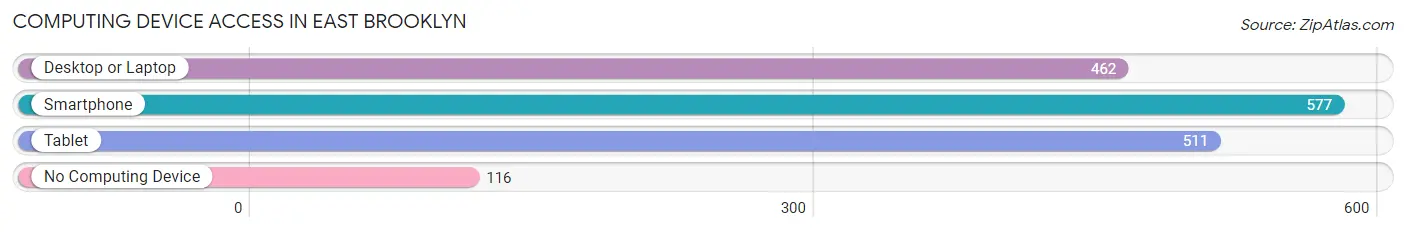
| Device Type | # Households | % Households |
| Desktop or Laptop | 462 | 57.5% |
| Smartphone | 577 | 71.9% |
| Tablet | 511 | 63.6% |
| No Computing Device | 116 | 14.4% |
| Total | 803 | 100.0% |
Internet Access in East Brooklyn
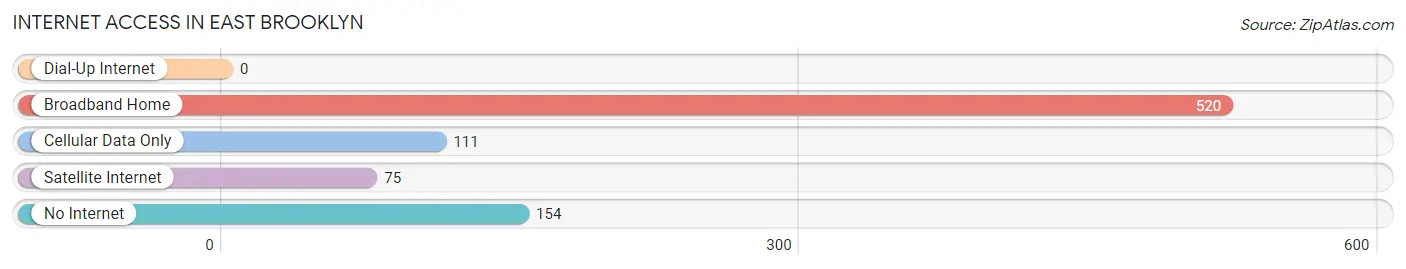
| Internet Type | # Households | % Households |
| Dial-Up Internet | 0 | 0.0% |
| Broadband Home | 520 | 64.8% |
| Cellular Data Only | 111 | 13.8% |
| Satellite Internet | 75 | 9.3% |
| No Internet | 154 | 19.2% |
| Total | 803 | 100.0% |
East Brooklyn Summary
East Brooklyn is a small town located in Windham County, Connecticut. It is situated in the northeastern corner of the state, just south of the Massachusetts border. The town has a population of approximately 1,500 people and covers an area of 8.3 square miles.
History
East Brooklyn was first settled in 1710 by a group of settlers from Massachusetts. The town was originally part of the town of Windham, but was incorporated as its own town in 1786. The town was named after the city of Brooklyn, New York, which was named after the Dutch city of Breukelen.
The town was primarily an agricultural community for much of its history. The town was known for its dairy farms and apple orchards. The town also had a number of mills, including a grist mill, a saw mill, and a woolen mill.
Geography
East Brooklyn is located in the northeastern corner of Connecticut, just south of the Massachusetts border. The town is bordered by the towns of Windham to the north, Scotland to the east, Hampton to the south, and Chaplin to the west.
The town is located in the Quinebaug River Valley, which is part of the Connecticut River Valley. The town is located on the eastern edge of the Quinebaug River, which is a tributary of the Connecticut River. The town is located in the foothills of the Berkshires, and is surrounded by rolling hills and forests.
Economy
The economy of East Brooklyn is primarily based on agriculture. The town is known for its dairy farms and apple orchards. The town also has a number of small businesses, including a few restaurants, a hardware store, and a few retail stores.
The town is also home to a number of small manufacturing companies, including a plastics manufacturer and a metal fabrication company. The town is also home to a number of small service businesses, including a few law firms and accounting firms.
Demographics
As of the 2010 census, the population of East Brooklyn was 1,521. The racial makeup of the town was 95.3% White, 1.2% African American, 0.4% Native American, 0.7% Asian, 0.1% Pacific Islander, 0.7% from other races, and 1.6% from two or more races. Hispanic or Latino of any race were 2.2% of the population.
The median household income in East Brooklyn was $60,938, and the median family income was $68,750. The per capita income for the town was $27,945. About 5.3% of families and 7.2% of the population were below the poverty line, including 8.3% of those under age 18 and 5.2% of those age 65 or over.
Common Questions
What is Per Capita Income in East Brooklyn?
Per Capita income in East Brooklyn is $33,125.
What is the Median Family Income in East Brooklyn?
Median Family Income in East Brooklyn is $64,020.
What is the Median Household income in East Brooklyn?
Median Household Income in East Brooklyn is $63,938.
What is Income or Wage Gap in East Brooklyn?
Income or Wage Gap in East Brooklyn is 0.4%.
Women in East Brooklyn earn 99.6 cents for every dollar earned by a man.
What is Inequality or Gini Index in East Brooklyn?
Inequality or Gini Index in East Brooklyn is 0.42.
What is the Total Population of East Brooklyn?
Total Population of East Brooklyn is 2,051.
What is the Total Male Population of East Brooklyn?
Total Male Population of East Brooklyn is 959.
What is the Total Female Population of East Brooklyn?
Total Female Population of East Brooklyn is 1,092.
What is the Ratio of Males per 100 Females in East Brooklyn?
There are 87.82 Males per 100 Females in East Brooklyn.
What is the Ratio of Females per 100 Males in East Brooklyn?
There are 113.87 Females per 100 Males in East Brooklyn.
What is the Median Population Age in East Brooklyn?
Median Population Age in East Brooklyn is 50.2 Years.
What is the Average Family Size in East Brooklyn
Average Family Size in East Brooklyn is 2.8 People.
What is the Average Household Size in East Brooklyn
Average Household Size in East Brooklyn is 2.5 People.
How Large is the Labor Force in East Brooklyn?
There are 1,053 People in the Labor Forcein in East Brooklyn.
What is the Percentage of People in the Labor Force in East Brooklyn?
59.5% of People are in the Labor Force in East Brooklyn.
What is the Unemployment Rate in East Brooklyn?
Unemployment Rate in East Brooklyn is 9.9%.