Newtown borough, CT Map & Demographics
Newtown borough Overview
$63,639
PER CAPITA INCOME
$165,625
AVG FAMILY INCOME
$144,375
AVG HOUSEHOLD INCOME
8.6%
WAGE / INCOME GAP [ % ]
91.4¢/ $1
WAGE / INCOME GAP [ $ ]
0.41
INEQUALITY / GINI INDEX
1,959
TOTAL POPULATION
959
MALE POPULATION
1,000
FEMALE POPULATION
95.90
MALES / 100 FEMALES
104.28
FEMALES / 100 MALES
43.7
MEDIAN AGE
3.2
AVG FAMILY SIZE
2.8
AVG HOUSEHOLD SIZE
1,101
LABOR FORCE [ PEOPLE ]
69.0%
PERCENT IN LABOR FORCE
3.4%
UNEMPLOYMENT RATE
Income in Newtown borough
Income Overview in Newtown borough
Per Capita Income in Newtown borough is $63,639, while median incomes of families and households are $165,625 and $144,375 respectively.
| Characteristic | Number | Measure |
| Per Capita Income | 1,959 | $63,639 |
| Median Family Income | 544 | $165,625 |
| Mean Family Income | 544 | $199,403 |
| Median Household Income | 697 | $144,375 |
| Mean Household Income | 697 | $176,660 |
| Income Deficit | 544 | $0 |
| Wage / Income Gap (%) | 1,959 | 8.60% |
| Wage / Income Gap ($) | 1,959 | 91.40¢ per $1 |
| Gini / Inequality Index | 1,959 | 0.41 |
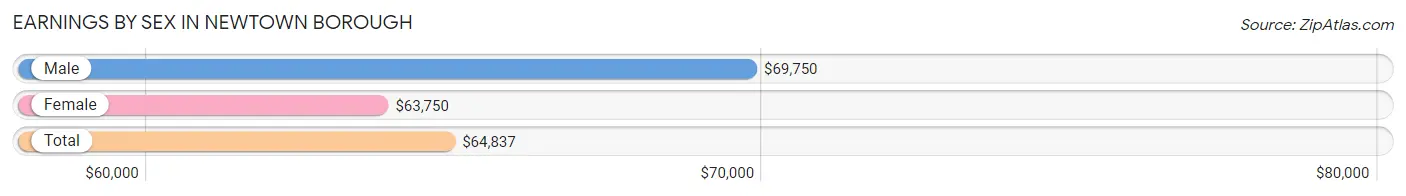
Earnings by Sex in Newtown borough
Average Earnings in Newtown borough are $64,837, $69,750 for men and $63,750 for women, a difference of 8.6%.
| Sex | Number | Average Earnings |
| Male | 635 (54.6%) | $69,750 |
| Female | 528 (45.4%) | $63,750 |
| Total | 1,163 (100.0%) | $64,837 |
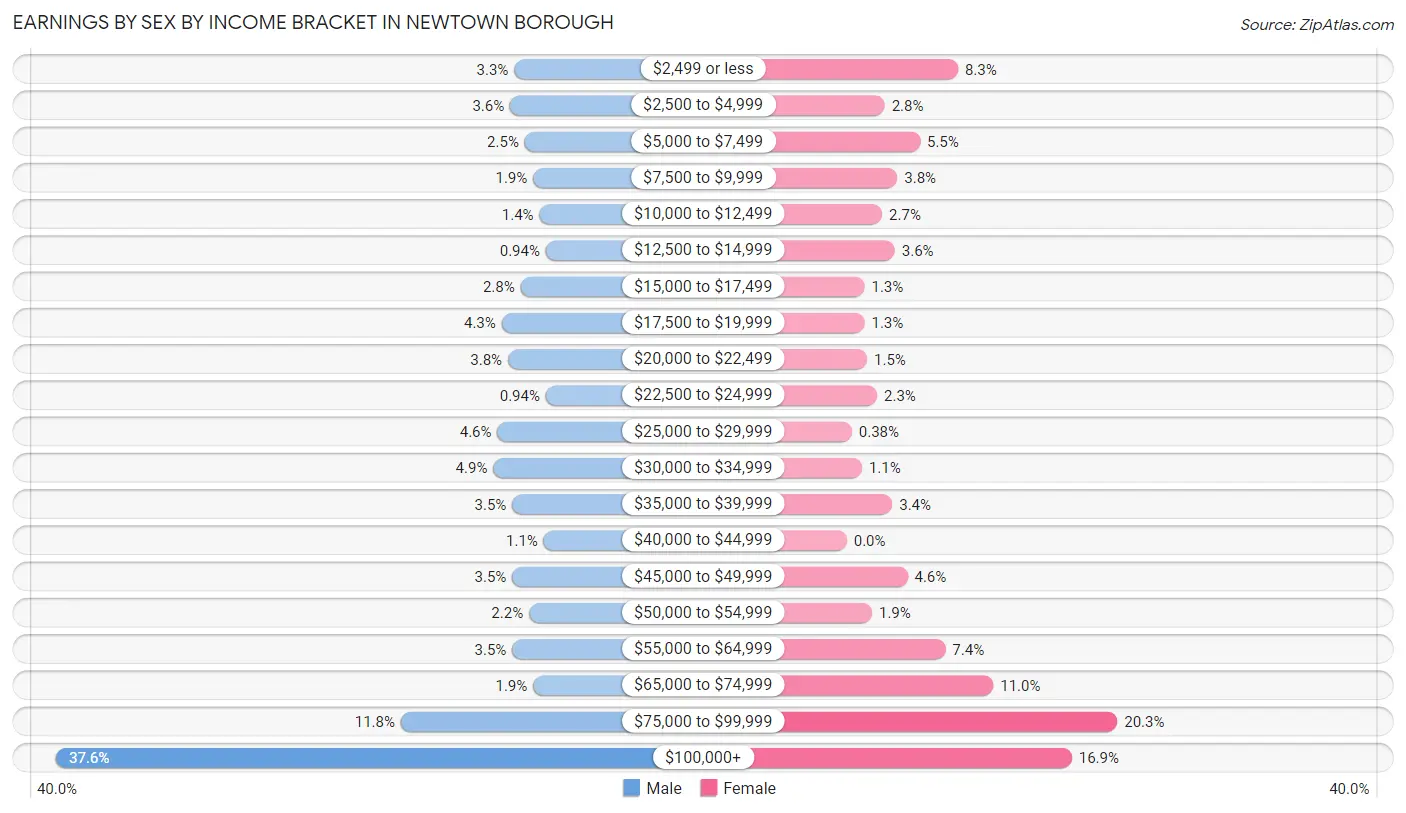
Earnings by Sex by Income Bracket in Newtown borough
The most common earnings brackets in Newtown borough are $100,000+ for men (239 | 37.6%) and $75,000 to $99,999 for women (107 | 20.3%).
| Income | Male | Female |
| $2,499 or less | 21 (3.3%) | 44 (8.3%) |
| $2,500 to $4,999 | 23 (3.6%) | 15 (2.8%) |
| $5,000 to $7,499 | 16 (2.5%) | 29 (5.5%) |
| $7,500 to $9,999 | 12 (1.9%) | 20 (3.8%) |
| $10,000 to $12,499 | 9 (1.4%) | 14 (2.6%) |
| $12,500 to $14,999 | 6 (0.9%) | 19 (3.6%) |
| $15,000 to $17,499 | 18 (2.8%) | 7 (1.3%) |
| $17,500 to $19,999 | 27 (4.3%) | 7 (1.3%) |
| $20,000 to $22,499 | 24 (3.8%) | 8 (1.5%) |
| $22,500 to $24,999 | 6 (0.9%) | 12 (2.3%) |
| $25,000 to $29,999 | 29 (4.6%) | 2 (0.4%) |
| $30,000 to $34,999 | 31 (4.9%) | 6 (1.1%) |
| $35,000 to $39,999 | 22 (3.5%) | 18 (3.4%) |
| $40,000 to $44,999 | 7 (1.1%) | 0 (0.0%) |
| $45,000 to $49,999 | 22 (3.5%) | 24 (4.5%) |
| $50,000 to $54,999 | 14 (2.2%) | 10 (1.9%) |
| $55,000 to $64,999 | 22 (3.5%) | 39 (7.4%) |
| $65,000 to $74,999 | 12 (1.9%) | 58 (11.0%) |
| $75,000 to $99,999 | 75 (11.8%) | 107 (20.3%) |
| $100,000+ | 239 (37.6%) | 89 (16.9%) |
| Total | 635 (100.0%) | 528 (100.0%) |
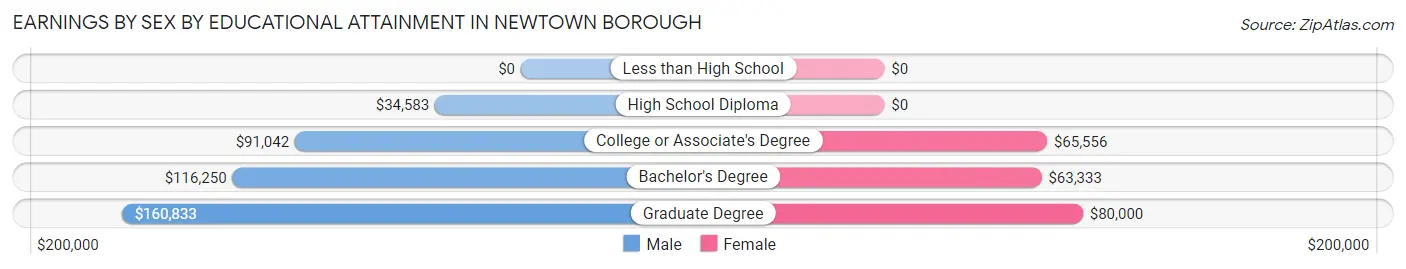
Earnings by Sex by Educational Attainment in Newtown borough
Average earnings in Newtown borough are $91,591 for men and $66,466 for women, a difference of 27.4%. Men with an educational attainment of graduate degree enjoy the highest average annual earnings of $160,833, while those with high school diploma education earn the least with $34,583. Women with an educational attainment of graduate degree earn the most with the average annual earnings of $80,000, while those with bachelor's degree education have the smallest earnings of $63,333.
| Educational Attainment | Male Income | Female Income |
| Less than High School | - | - |
| High School Diploma | $34,583 | $0 |
| College or Associate's Degree | $91,042 | $65,556 |
| Bachelor's Degree | $116,250 | $63,333 |
| Graduate Degree | $160,833 | $80,000 |
| Total | $91,591 | $66,466 |
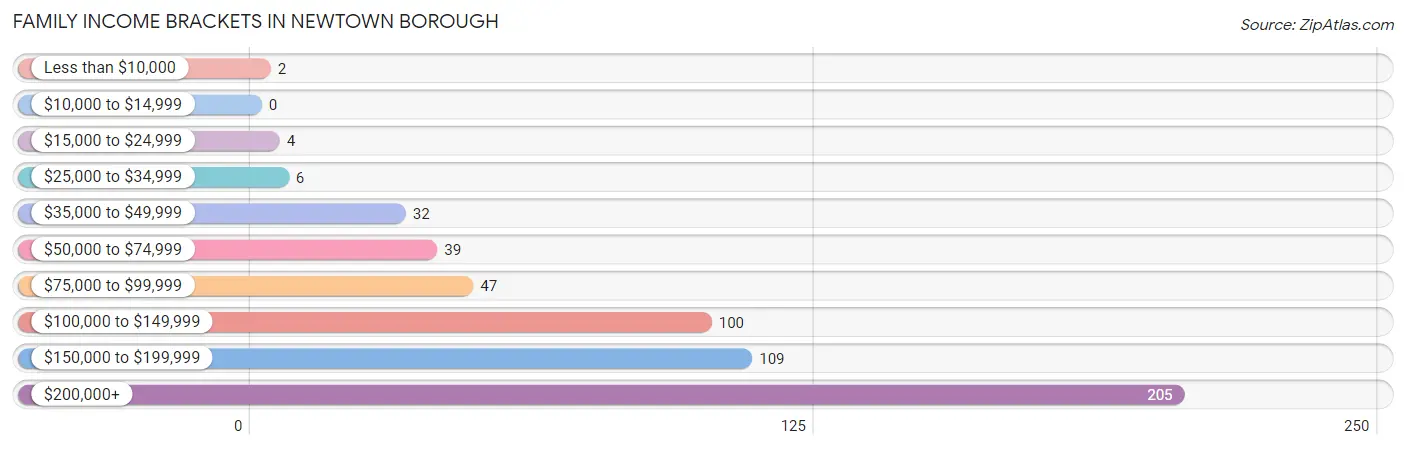
Family Income in Newtown borough
Family Income Brackets in Newtown borough
According to the Newtown borough family income data, there are 205 families falling into the $200,000+ income range, which is the most common income bracket and makes up 37.7% of all families.
| Income Bracket | # Families | % Families |
| Less than $10,000 | 2 | 0.4% |
| $10,000 to $14,999 | 0 | 0.0% |
| $15,000 to $24,999 | 4 | 0.7% |
| $25,000 to $34,999 | 6 | 1.1% |
| $35,000 to $49,999 | 32 | 5.9% |
| $50,000 to $74,999 | 39 | 7.2% |
| $75,000 to $99,999 | 47 | 8.6% |
| $100,000 to $149,999 | 100 | 18.4% |
| $150,000 to $199,999 | 109 | 20.0% |
| $200,000+ | 205 | 37.7% |
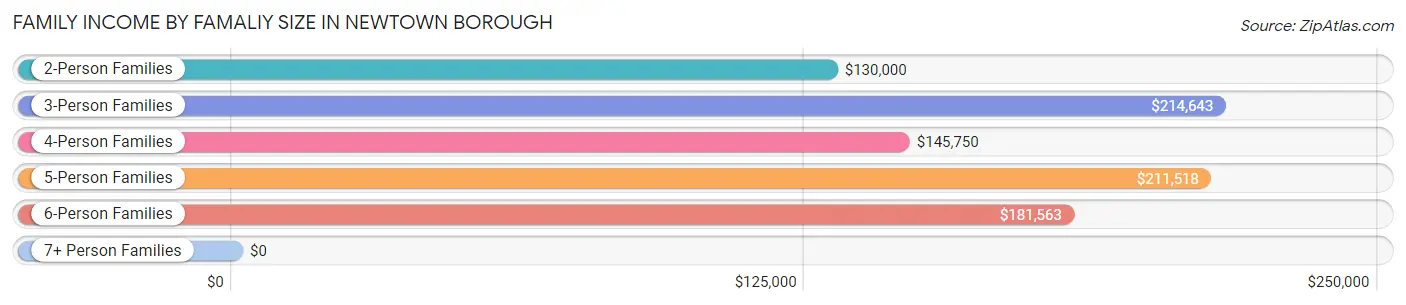
Family Income by Famaliy Size in Newtown borough
3-person families (142 | 26.1%) account for the highest median family income in Newtown borough with $214,643 per family, while 3-person families (142 | 26.1%) have the highest median income of $71,548 per family member.
| Income Bracket | # Families | Median Income |
| 2-Person Families | 218 (40.1%) | $130,000 |
| 3-Person Families | 142 (26.1%) | $214,643 |
| 4-Person Families | 129 (23.7%) | $145,750 |
| 5-Person Families | 31 (5.7%) | $211,518 |
| 6-Person Families | 11 (2.0%) | $181,563 |
| 7+ Person Families | 13 (2.4%) | $0 |
| Total | 544 (100.0%) | $165,625 |
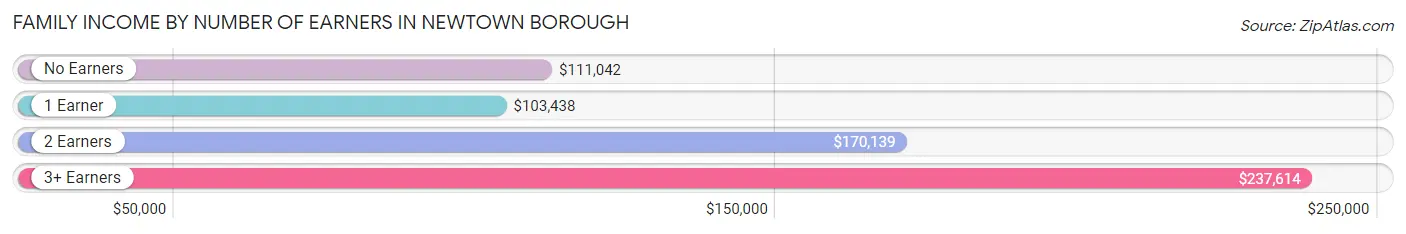
Family Income by Number of Earners in Newtown borough
The median family income in Newtown borough is $165,625, with families comprising 3+ earners (119) having the highest median family income of $237,614, while families with 1 earner (109) have the lowest median family income of $103,438, accounting for 21.9% and 20.0% of families, respectively.
| Number of Earners | # Families | Median Income |
| No Earners | 43 (7.9%) | $111,042 |
| 1 Earner | 109 (20.0%) | $103,438 |
| 2 Earners | 273 (50.2%) | $170,139 |
| 3+ Earners | 119 (21.9%) | $237,614 |
| Total | 544 (100.0%) | $165,625 |
Household Income in Newtown borough
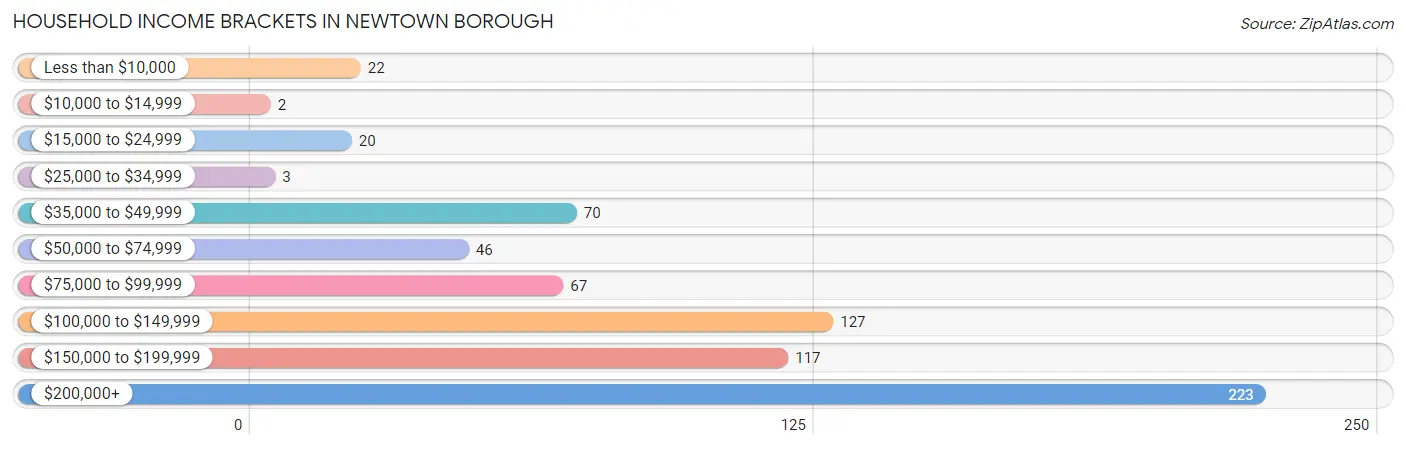
Household Income Brackets in Newtown borough
With 223 households falling in the category, the $200,000+ income range is the most frequent in Newtown borough, accounting for 32.0% of all households. In contrast, only 2 households (0.3%) fall into the $10,000 to $14,999 income bracket, making it the least populous group.
| Income Bracket | # Households | % Households |
| Less than $10,000 | 22 | 3.2% |
| $10,000 to $14,999 | 2 | 0.3% |
| $15,000 to $24,999 | 20 | 2.9% |
| $25,000 to $34,999 | 3 | 0.4% |
| $35,000 to $49,999 | 70 | 10.0% |
| $50,000 to $74,999 | 46 | 6.6% |
| $75,000 to $99,999 | 67 | 9.6% |
| $100,000 to $149,999 | 127 | 18.2% |
| $150,000 to $199,999 | 117 | 16.8% |
| $200,000+ | 223 | 32.0% |
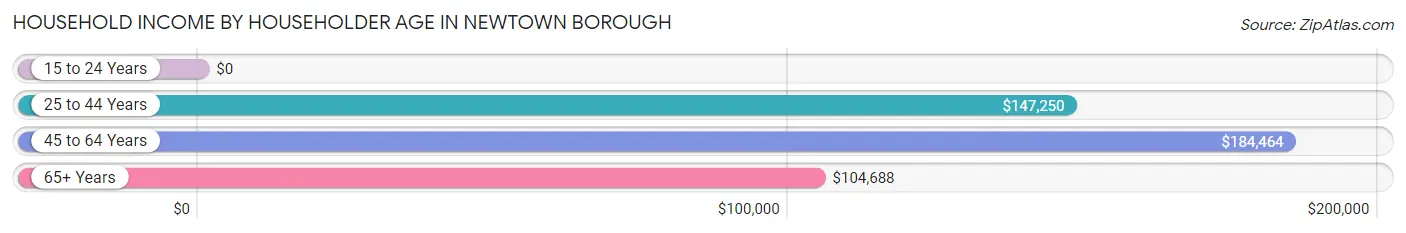
Household Income by Householder Age in Newtown borough
The median household income in Newtown borough is $144,375, with the highest median household income of $184,464 found in the 45 to 64 years age bracket for the primary householder. A total of 273 households (39.2%) fall into this category.
| Income Bracket | # Households | Median Income |
| 15 to 24 Years | 0 (0.0%) | $0 |
| 25 to 44 Years | 213 (30.6%) | $147,250 |
| 45 to 64 Years | 273 (39.2%) | $184,464 |
| 65+ Years | 211 (30.3%) | $104,688 |
| Total | 697 (100.0%) | $144,375 |
Poverty in Newtown borough
Income Below Poverty by Sex and Age in Newtown borough
With 1.6% poverty level for males and 2.9% for females among the residents of Newtown borough, 35 to 44 year old males and 75 year old and over females are the most vulnerable to poverty, with 6 males (8.1%) and 19 females (23.7%) in their respective age groups living below the poverty level.
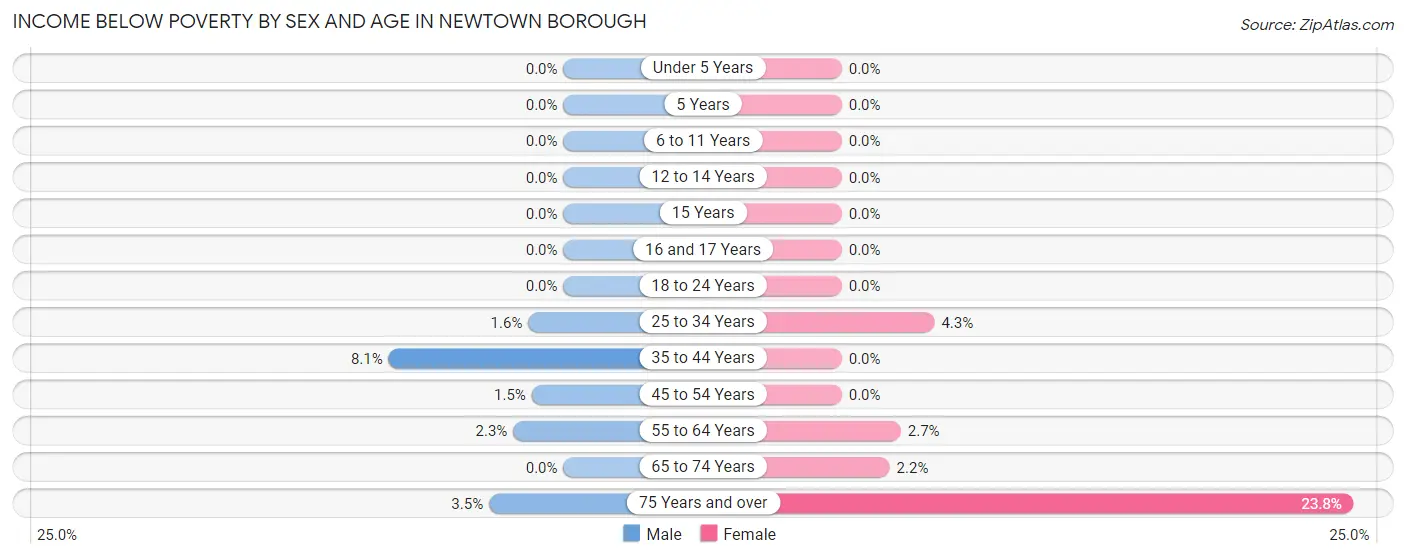
| Age Bracket | Male | Female |
| Under 5 Years | 0 (0.0%) | 0 (0.0%) |
| 5 Years | 0 (0.0%) | 0 (0.0%) |
| 6 to 11 Years | 0 (0.0%) | 0 (0.0%) |
| 12 to 14 Years | 0 (0.0%) | 0 (0.0%) |
| 15 Years | 0 (0.0%) | 0 (0.0%) |
| 16 and 17 Years | 0 (0.0%) | 0 (0.0%) |
| 18 to 24 Years | 0 (0.0%) | 0 (0.0%) |
| 25 to 34 Years | 2 (1.6%) | 4 (4.3%) |
| 35 to 44 Years | 6 (8.1%) | 0 (0.0%) |
| 45 to 54 Years | 2 (1.5%) | 0 (0.0%) |
| 55 to 64 Years | 3 (2.3%) | 4 (2.7%) |
| 65 to 74 Years | 0 (0.0%) | 2 (2.2%) |
| 75 Years and over | 2 (3.5%) | 19 (23.7%) |
| Total | 15 (1.6%) | 29 (2.9%) |
Income Above Poverty by Sex and Age in Newtown borough
According to the poverty statistics in Newtown borough, males aged under 5 years and females aged under 5 years are the age groups that are most secure financially, with 100.0% of males and 100.0% of females in these age groups living above the poverty line.
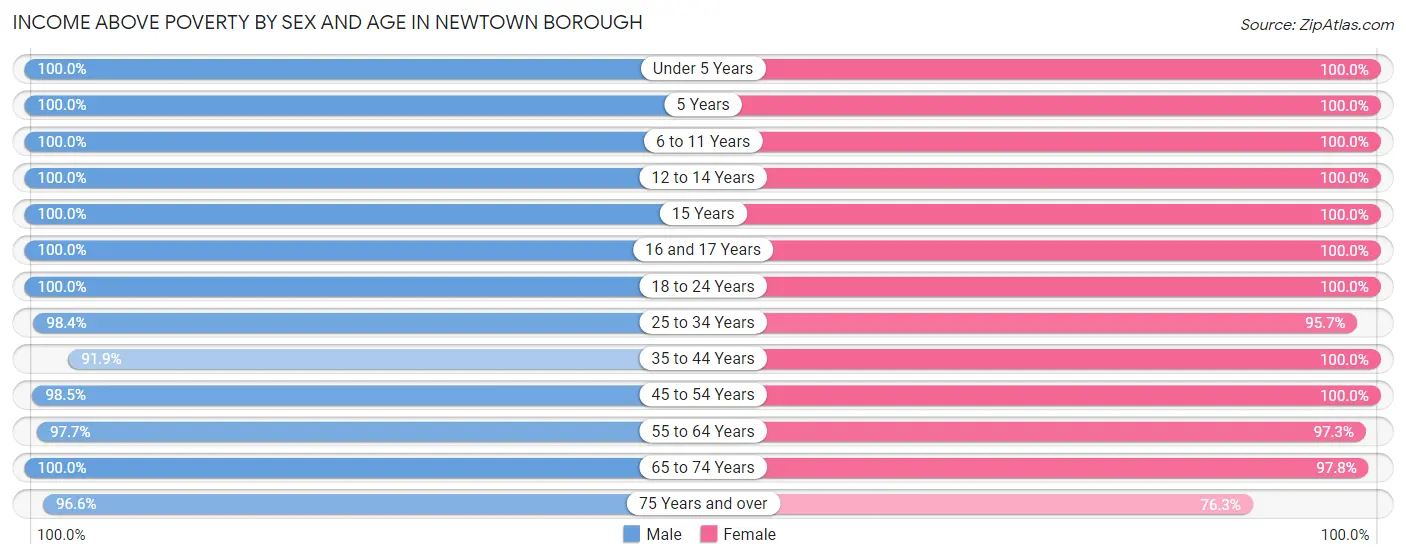
| Age Bracket | Male | Female |
| Under 5 Years | 32 (100.0%) | 42 (100.0%) |
| 5 Years | 13 (100.0%) | 17 (100.0%) |
| 6 to 11 Years | 50 (100.0%) | 93 (100.0%) |
| 12 to 14 Years | 32 (100.0%) | 47 (100.0%) |
| 15 Years | 13 (100.0%) | 24 (100.0%) |
| 16 and 17 Years | 44 (100.0%) | 40 (100.0%) |
| 18 to 24 Years | 111 (100.0%) | 54 (100.0%) |
| 25 to 34 Years | 121 (98.4%) | 89 (95.7%) |
| 35 to 44 Years | 68 (91.9%) | 121 (100.0%) |
| 45 to 54 Years | 134 (98.5%) | 153 (100.0%) |
| 55 to 64 Years | 126 (97.7%) | 142 (97.3%) |
| 65 to 74 Years | 144 (100.0%) | 88 (97.8%) |
| 75 Years and over | 56 (96.6%) | 61 (76.2%) |
| Total | 944 (98.4%) | 971 (97.1%) |
Income Below Poverty Among Married-Couple Families in Newtown borough
The poverty statistics for married-couple families in Newtown borough show that 0.2% or 1 of the total 471 families live below the poverty line. Families with no children have the highest poverty rate of 0.4%, comprising of 1 families. On the other hand, families with 1 or 2 children have the lowest poverty rate of 0.0%, which includes 0 families.
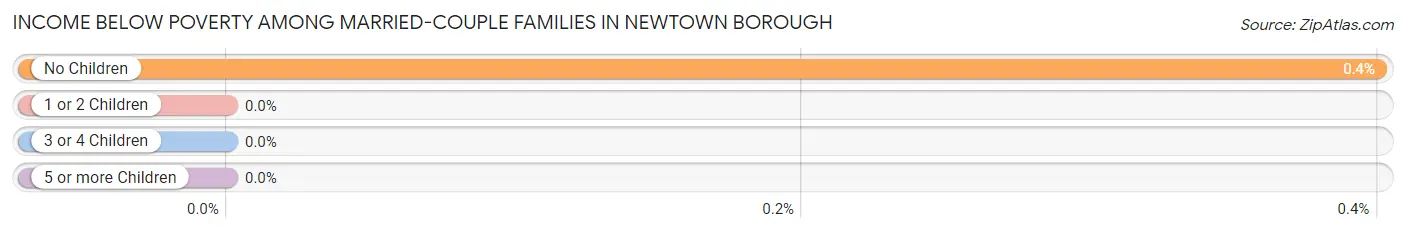
| Children | Above Poverty | Below Poverty |
| No Children | 248 (99.6%) | 1 (0.4%) |
| 1 or 2 Children | 194 (100.0%) | 0 (0.0%) |
| 3 or 4 Children | 28 (100.0%) | 0 (0.0%) |
| 5 or more Children | 0 (0.0%) | 0 (0.0%) |
| Total | 470 (99.8%) | 1 (0.2%) |
Income Below Poverty Among Single-Parent Households in Newtown borough
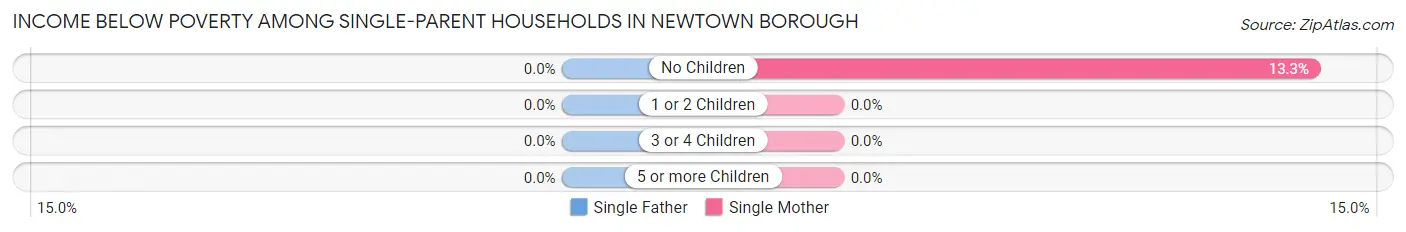
| Children | Single Father | Single Mother |
| No Children | 0 (0.0%) | 2 (13.3%) |
| 1 or 2 Children | 0 (0.0%) | 0 (0.0%) |
| 3 or 4 Children | 0 (0.0%) | 0 (0.0%) |
| 5 or more Children | 0 (0.0%) | 0 (0.0%) |
| Total | 0 (0.0%) | 2 (3.2%) |
Income Below Poverty Among Married-Couple vs Single-Parent Households in Newtown borough
The poverty data for Newtown borough shows that 1 of the married-couple family households (0.2%) and 2 of the single-parent households (2.7%) are living below the poverty level. Within the married-couple family households, those with no children have the highest poverty rate, with 1 households (0.4%) falling below the poverty line. Among the single-parent households, those with no children have the highest poverty rate, with 2 household (8.7%) living below poverty.
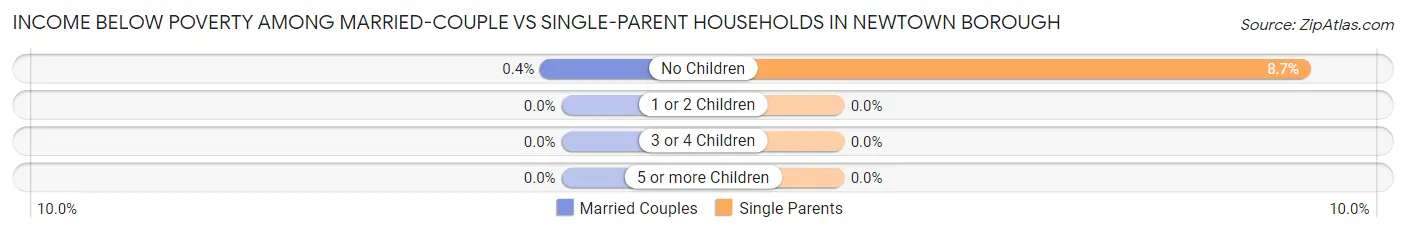
| Children | Married-Couple Families | Single-Parent Households |
| No Children | 1 (0.4%) | 2 (8.7%) |
| 1 or 2 Children | 0 (0.0%) | 0 (0.0%) |
| 3 or 4 Children | 0 (0.0%) | 0 (0.0%) |
| 5 or more Children | 0 (0.0%) | 0 (0.0%) |
| Total | 1 (0.2%) | 2 (2.7%) |
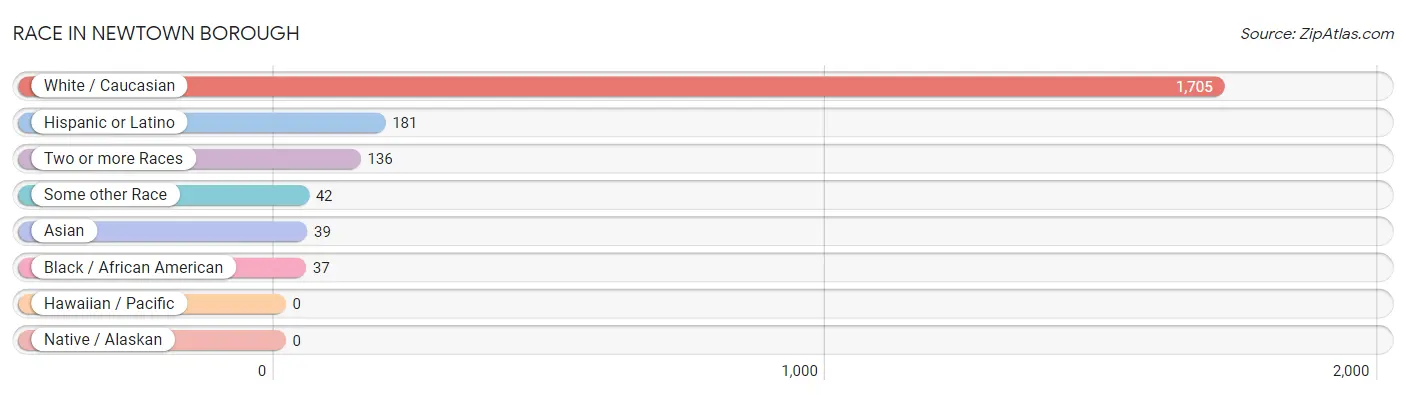
Race in Newtown borough
The most populous races in Newtown borough are White / Caucasian (1,705 | 87.0%), Hispanic or Latino (181 | 9.2%), and Two or more Races (136 | 6.9%).
| Race | # Population | % Population |
| Asian | 39 | 2.0% |
| Black / African American | 37 | 1.9% |
| Hawaiian / Pacific | 0 | 0.0% |
| Hispanic or Latino | 181 | 9.2% |
| Native / Alaskan | 0 | 0.0% |
| White / Caucasian | 1,705 | 87.0% |
| Two or more Races | 136 | 6.9% |
| Some other Race | 42 | 2.1% |
| Total | 1,959 | 100.0% |
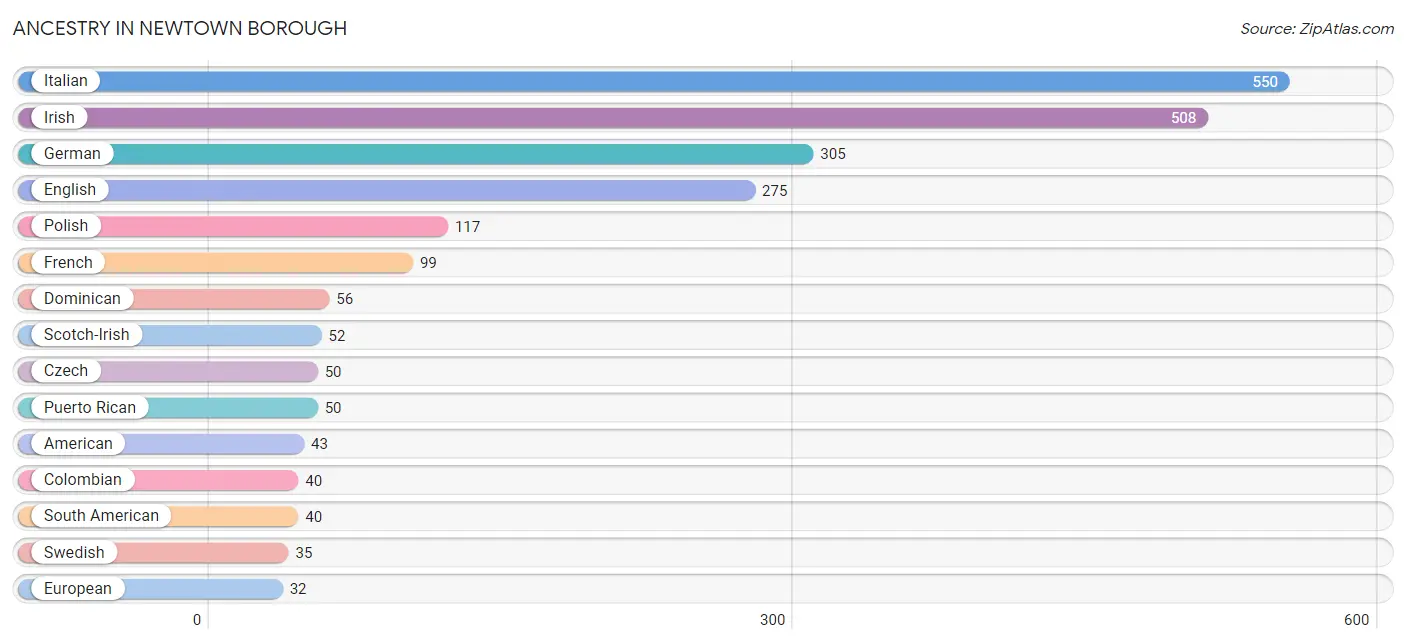
Ancestry in Newtown borough
The most populous ancestries reported in Newtown borough are Italian (550 | 28.1%), Irish (508 | 25.9%), German (305 | 15.6%), English (275 | 14.0%), and Polish (117 | 6.0%), together accounting for 89.6% of all Newtown borough residents.
| Ancestry | # Population | % Population |
| Albanian | 2 | 0.1% |
| American | 43 | 2.2% |
| Arab | 21 | 1.1% |
| Belgian | 27 | 1.4% |
| British | 27 | 1.4% |
| Burmese | 17 | 0.9% |
| Canadian | 5 | 0.3% |
| Colombian | 40 | 2.0% |
| Cuban | 10 | 0.5% |
| Czech | 50 | 2.5% |
| Czechoslovakian | 2 | 0.1% |
| Danish | 11 | 0.6% |
| Dominican | 56 | 2.9% |
| Dutch | 7 | 0.4% |
| Eastern European | 13 | 0.7% |
| Egyptian | 15 | 0.8% |
| English | 275 | 14.0% |
| European | 32 | 1.6% |
| French | 99 | 5.1% |
| French Canadian | 9 | 0.5% |
| German | 305 | 15.6% |
| Greek | 26 | 1.3% |
| Hungarian | 15 | 0.8% |
| Indian (Asian) | 27 | 1.4% |
| Irish | 508 | 25.9% |
| Italian | 550 | 28.1% |
| Latvian | 2 | 0.1% |
| Lebanese | 2 | 0.1% |
| Lithuanian | 10 | 0.5% |
| Mexican | 9 | 0.5% |
| Northern European | 11 | 0.6% |
| Norwegian | 12 | 0.6% |
| Pakistani | 9 | 0.5% |
| Polish | 117 | 6.0% |
| Portuguese | 19 | 1.0% |
| Puerto Rican | 50 | 2.5% |
| Russian | 15 | 0.8% |
| Scotch-Irish | 52 | 2.6% |
| Scottish | 23 | 1.2% |
| Serbian | 13 | 0.7% |
| Slovak | 8 | 0.4% |
| South American | 40 | 2.0% |
| Spaniard | 3 | 0.2% |
| Spanish | 13 | 0.7% |
| Swedish | 35 | 1.8% |
| Swiss | 6 | 0.3% |
| Syrian | 4 | 0.2% |
| Ukrainian | 6 | 0.3% |
| Yugoslavian | 5 | 0.3% | View All 49 Rows |
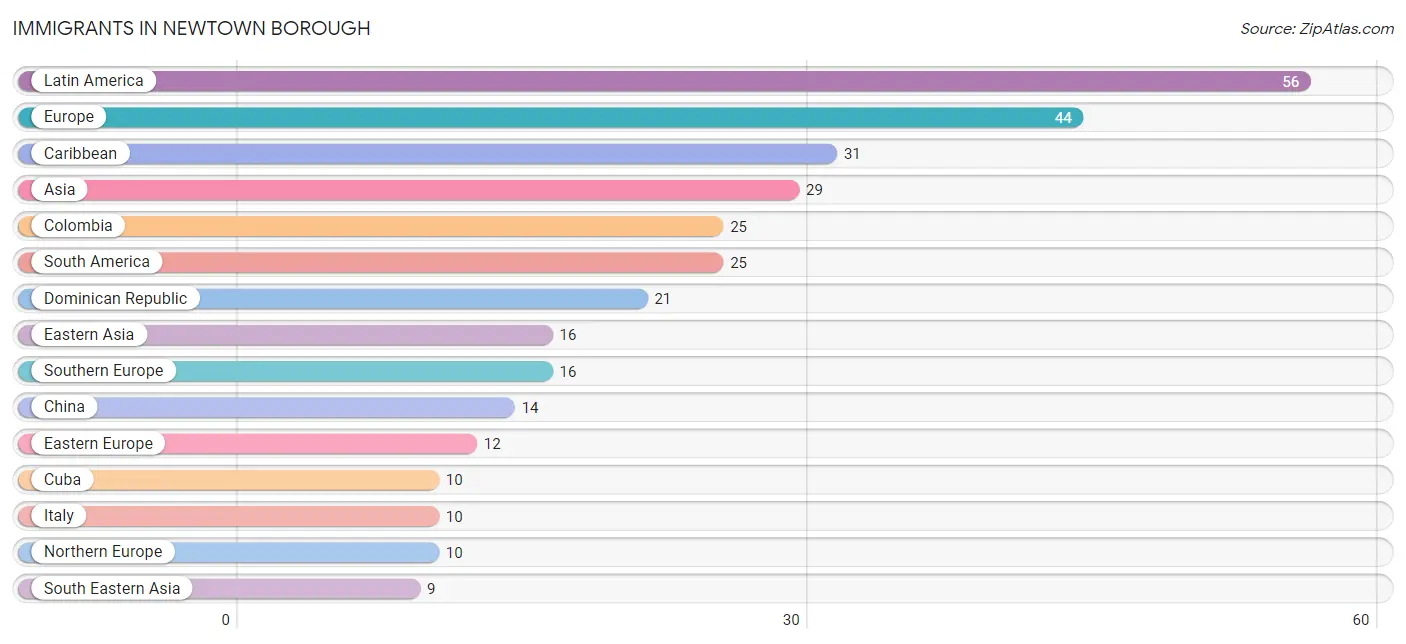
Immigrants in Newtown borough
The most numerous immigrant groups reported in Newtown borough came from Latin America (56 | 2.9%), Europe (44 | 2.2%), Caribbean (31 | 1.6%), Asia (29 | 1.5%), and Colombia (25 | 1.3%), together accounting for 9.5% of all Newtown borough residents.
| Immigration Origin | # Population | % Population |
| Albania | 8 | 0.4% |
| Asia | 29 | 1.5% |
| Canada | 7 | 0.4% |
| Caribbean | 31 | 1.6% |
| China | 14 | 0.7% |
| Colombia | 25 | 1.3% |
| Cuba | 10 | 0.5% |
| Dominican Republic | 21 | 1.1% |
| Eastern Asia | 16 | 0.8% |
| Eastern Europe | 12 | 0.6% |
| England | 1 | 0.1% |
| Europe | 44 | 2.2% |
| France | 4 | 0.2% |
| Germany | 2 | 0.1% |
| India | 4 | 0.2% |
| Ireland | 3 | 0.2% |
| Italy | 10 | 0.5% |
| Korea | 2 | 0.1% |
| Latin America | 56 | 2.9% |
| Northern Europe | 10 | 0.5% |
| Norway | 6 | 0.3% |
| Portugal | 6 | 0.3% |
| Romania | 4 | 0.2% |
| South America | 25 | 1.3% |
| South Central Asia | 4 | 0.2% |
| South Eastern Asia | 9 | 0.5% |
| Southern Europe | 16 | 0.8% |
| Thailand | 9 | 0.5% |
| Western Europe | 6 | 0.3% | View All 29 Rows |
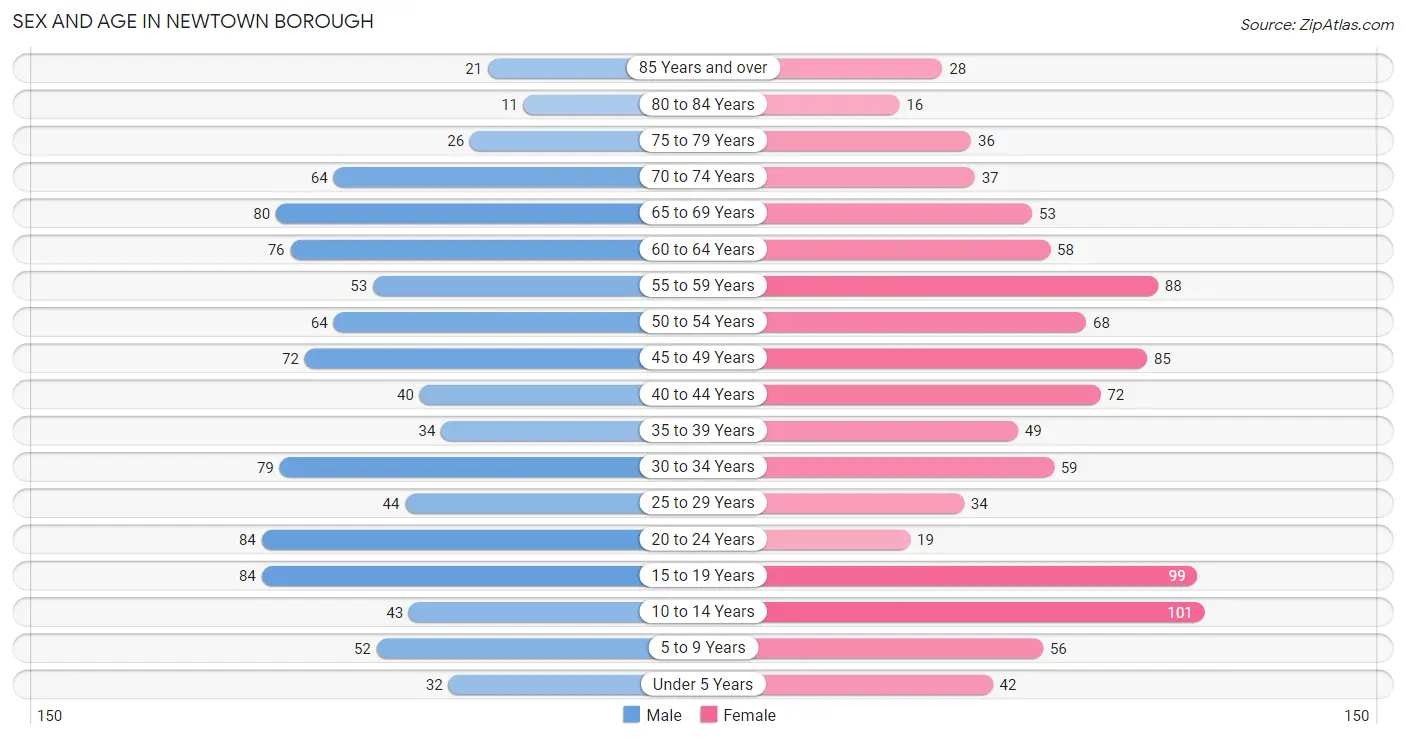
Sex and Age in Newtown borough
Sex and Age in Newtown borough
The most populous age groups in Newtown borough are 15 to 19 Years (84 | 8.8%) for men and 10 to 14 Years (101 | 10.1%) for women.
| Age Bracket | Male | Female |
| Under 5 Years | 32 (3.3%) | 42 (4.2%) |
| 5 to 9 Years | 52 (5.4%) | 56 (5.6%) |
| 10 to 14 Years | 43 (4.5%) | 101 (10.1%) |
| 15 to 19 Years | 84 (8.8%) | 99 (9.9%) |
| 20 to 24 Years | 84 (8.8%) | 19 (1.9%) |
| 25 to 29 Years | 44 (4.6%) | 34 (3.4%) |
| 30 to 34 Years | 79 (8.2%) | 59 (5.9%) |
| 35 to 39 Years | 34 (3.5%) | 49 (4.9%) |
| 40 to 44 Years | 40 (4.2%) | 72 (7.2%) |
| 45 to 49 Years | 72 (7.5%) | 85 (8.5%) |
| 50 to 54 Years | 64 (6.7%) | 68 (6.8%) |
| 55 to 59 Years | 53 (5.5%) | 88 (8.8%) |
| 60 to 64 Years | 76 (7.9%) | 58 (5.8%) |
| 65 to 69 Years | 80 (8.3%) | 53 (5.3%) |
| 70 to 74 Years | 64 (6.7%) | 37 (3.7%) |
| 75 to 79 Years | 26 (2.7%) | 36 (3.6%) |
| 80 to 84 Years | 11 (1.1%) | 16 (1.6%) |
| 85 Years and over | 21 (2.2%) | 28 (2.8%) |
| Total | 959 (100.0%) | 1,000 (100.0%) |
Families and Households in Newtown borough
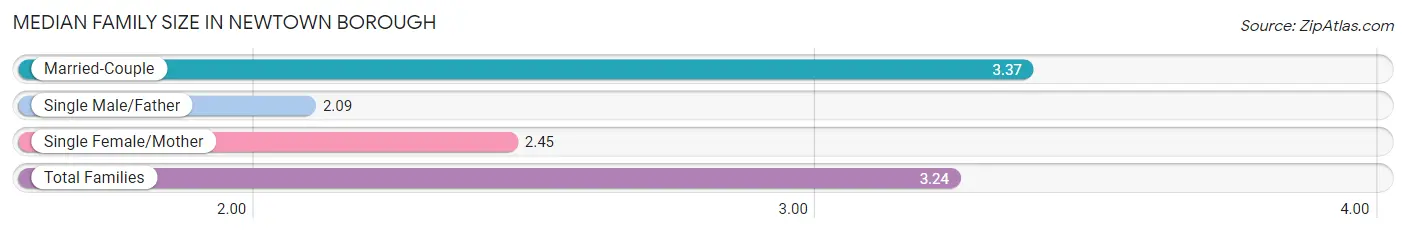
Median Family Size in Newtown borough
The median family size in Newtown borough is 3.24 persons per family, with married-couple families (471 | 86.6%) accounting for the largest median family size of 3.37 persons per family. On the other hand, single male/father families (11 | 2.0%) represent the smallest median family size with 2.09 persons per family.
| Family Type | # Families | Family Size |
| Married-Couple | 471 (86.6%) | 3.37 |
| Single Male/Father | 11 (2.0%) | 2.09 |
| Single Female/Mother | 62 (11.4%) | 2.45 |
| Total Families | 544 (100.0%) | 3.24 |
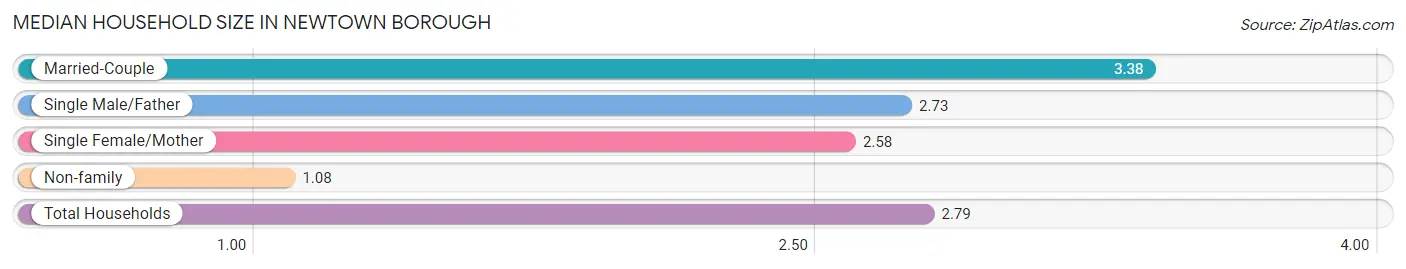
Median Household Size in Newtown borough
The median household size in Newtown borough is 2.79 persons per household, with married-couple households (471 | 67.6%) accounting for the largest median household size of 3.38 persons per household. non-family households (153 | 22.0%) represent the smallest median household size with 1.08 persons per household.
| Household Type | # Households | Household Size |
| Married-Couple | 471 (67.6%) | 3.38 |
| Single Male/Father | 11 (1.6%) | 2.73 |
| Single Female/Mother | 62 (8.9%) | 2.58 |
| Non-family | 153 (22.0%) | 1.08 |
| Total Households | 697 (100.0%) | 2.79 |
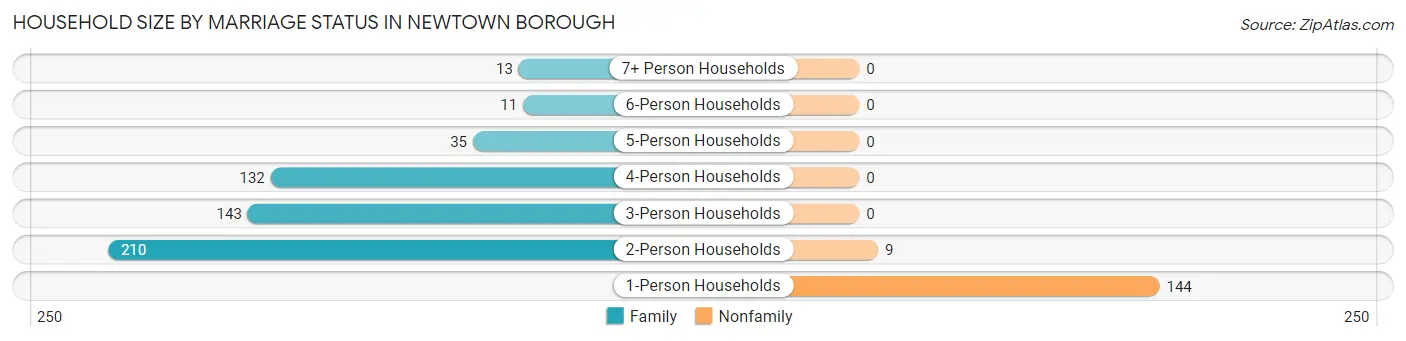
Household Size by Marriage Status in Newtown borough
Out of a total of 697 households in Newtown borough, 544 (78.0%) are family households, while 153 (22.0%) are nonfamily households. The most numerous type of family households are 2-person households, comprising 210, and the most common type of nonfamily households are 1-person households, comprising 144.
| Household Size | Family Households | Nonfamily Households |
| 1-Person Households | - | 144 (20.7%) |
| 2-Person Households | 210 (30.1%) | 9 (1.3%) |
| 3-Person Households | 143 (20.5%) | 0 (0.0%) |
| 4-Person Households | 132 (18.9%) | 0 (0.0%) |
| 5-Person Households | 35 (5.0%) | 0 (0.0%) |
| 6-Person Households | 11 (1.6%) | 0 (0.0%) |
| 7+ Person Households | 13 (1.9%) | 0 (0.0%) |
| Total | 544 (78.0%) | 153 (22.0%) |
Female Fertility in Newtown borough
Fertility by Age in Newtown borough
Average fertility rate in Newtown borough is 56.0 births per 1,000 women. Women in the age bracket of 20 to 34 years have the highest fertility rate with 116.0 births per 1,000 women. Women in the age bracket of 20 to 34 years acount for 54.2% of all women with births.
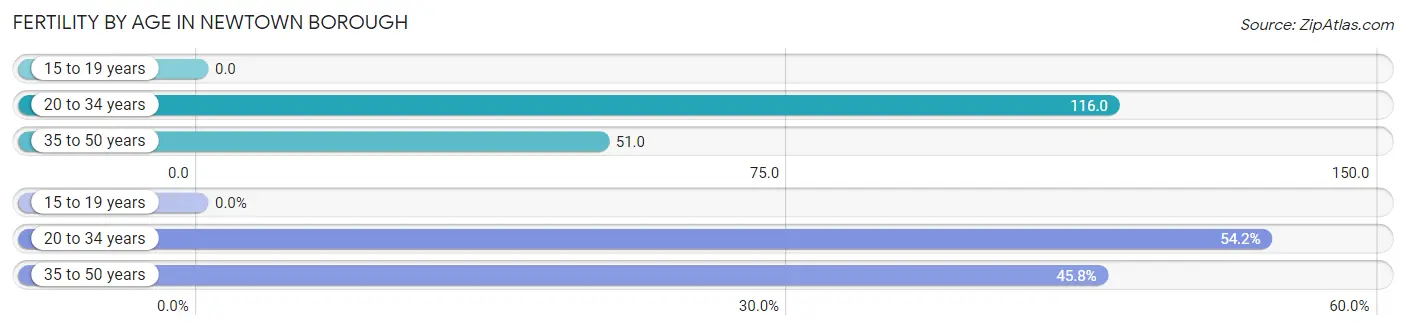
| Age Bracket | Women with Births | Births / 1,000 Women |
| 15 to 19 years | 0 (0.0%) | 0.0 |
| 20 to 34 years | 13 (54.2%) | 116.0 |
| 35 to 50 years | 11 (45.8%) | 51.0 |
| Total | 24 (100.0%) | 56.0 |
Fertility by Age by Marriage Status in Newtown borough
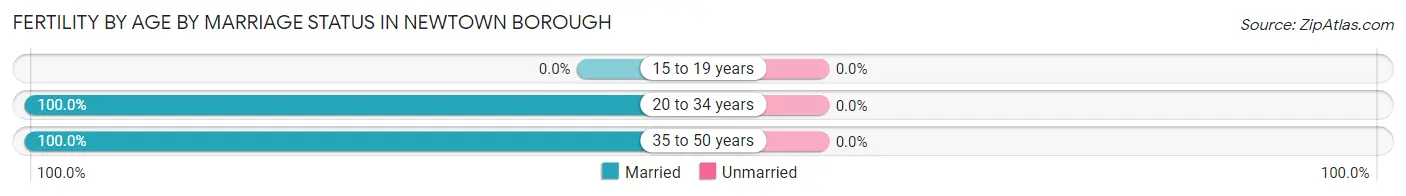
| Age Bracket | Married | Unmarried |
| 15 to 19 years | 0 (0.0%) | 0 (0.0%) |
| 20 to 34 years | 13 (100.0%) | 0 (0.0%) |
| 35 to 50 years | 11 (100.0%) | 0 (0.0%) |
| Total | 24 (100.0%) | 0 (0.0%) |
Fertility by Education in Newtown borough
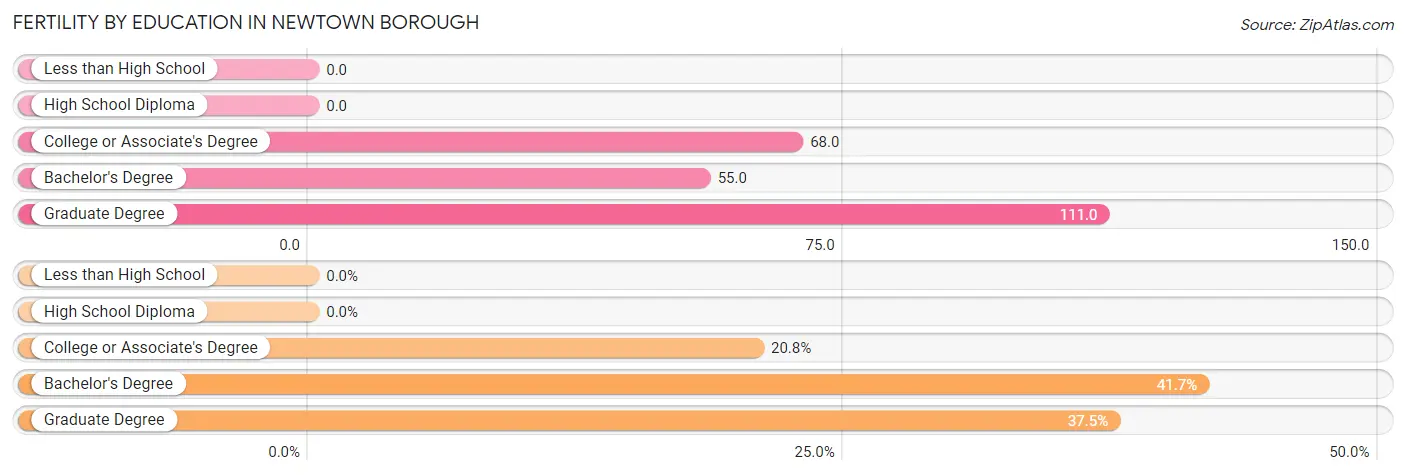
| Educational Attainment | Women with Births | Births / 1,000 Women |
| Less than High School | 0 (0.0%) | 0.0 |
| High School Diploma | 0 (0.0%) | 0.0 |
| College or Associate's Degree | 5 (20.8%) | 68.0 |
| Bachelor's Degree | 10 (41.7%) | 55.0 |
| Graduate Degree | 9 (37.5%) | 111.0 |
| Total | 24 (100.0%) | 56.0 |
Fertility by Education by Marriage Status in Newtown borough
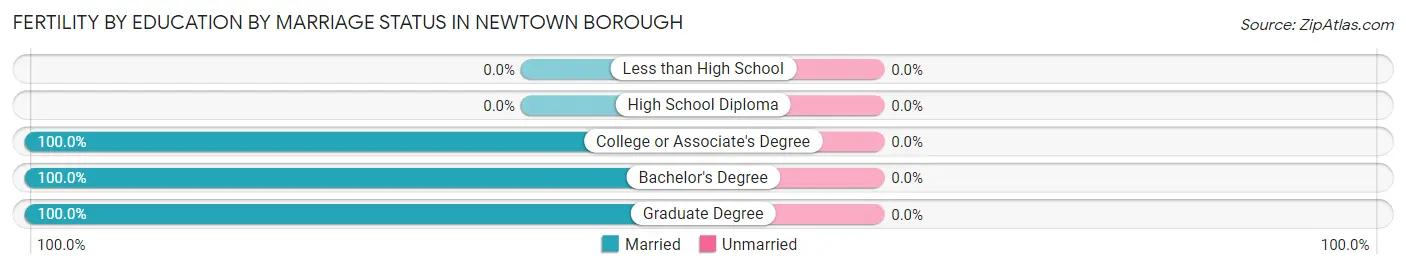
| Educational Attainment | Married | Unmarried |
| Less than High School | 0 (0.0%) | 0 (0.0%) |
| High School Diploma | 0 (0.0%) | 0 (0.0%) |
| College or Associate's Degree | 5 (100.0%) | 0 (0.0%) |
| Bachelor's Degree | 10 (100.0%) | 0 (0.0%) |
| Graduate Degree | 9 (100.0%) | 0 (0.0%) |
| Total | 24 (100.0%) | 0 (0.0%) |
Employment Characteristics in Newtown borough
Employment by Class of Employer in Newtown borough
Among the 1,051 employed individuals in Newtown borough, private company employees (666 | 63.4%), local government employees (133 | 12.7%), and not-for-profit organizations (101 | 9.6%) make up the most common classes of employment.
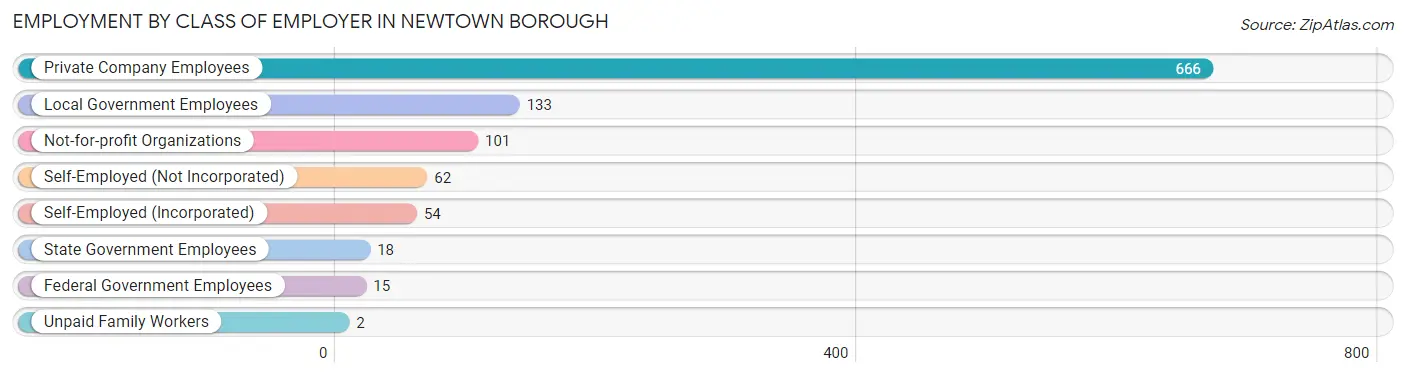
| Employer Class | # Employees | % Employees |
| Private Company Employees | 666 | 63.4% |
| Self-Employed (Incorporated) | 54 | 5.1% |
| Self-Employed (Not Incorporated) | 62 | 5.9% |
| Not-for-profit Organizations | 101 | 9.6% |
| Local Government Employees | 133 | 12.7% |
| State Government Employees | 18 | 1.7% |
| Federal Government Employees | 15 | 1.4% |
| Unpaid Family Workers | 2 | 0.2% |
| Total | 1,051 | 100.0% |
Employment Status by Age in Newtown borough
According to the labor force statistics for Newtown borough, out of the total population over 16 years of age (1,596), 69.0% or 1,101 individuals are in the labor force, with 3.4% or 37 of them unemployed. The age group with the highest labor force participation rate is 30 to 34 years, with 97.8% or 135 individuals in the labor force. Within the labor force, the 30 to 34 years age range has the highest percentage of unemployed individuals, with 12.6% or 17 of them being unemployed.
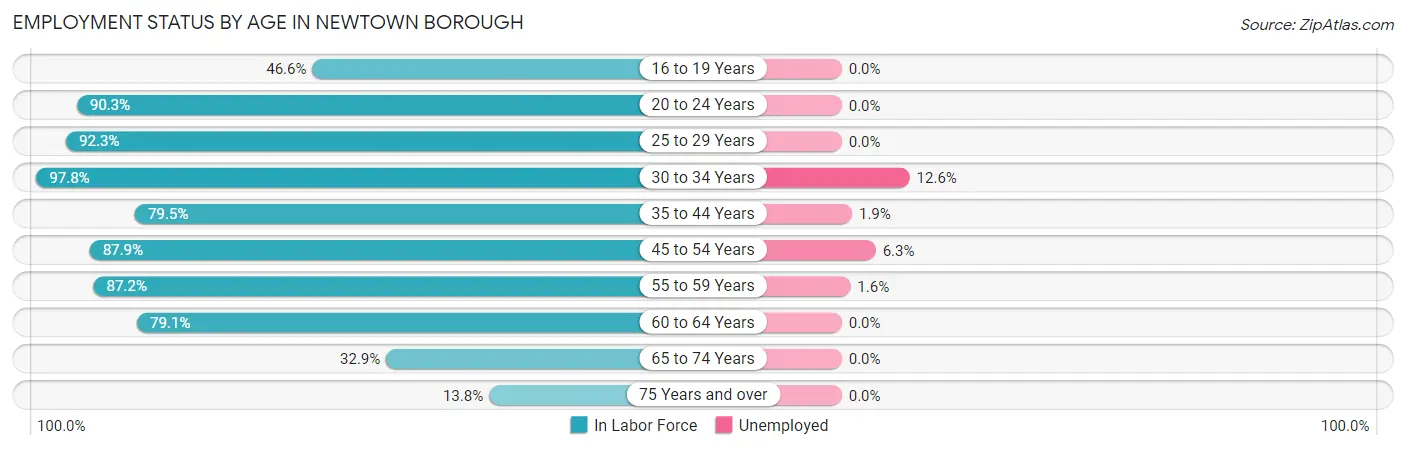
| Age Bracket | In Labor Force | Unemployed |
| 16 to 19 Years | 68 (46.6%) | 0 (0.0%) |
| 20 to 24 Years | 93 (90.3%) | 0 (0.0%) |
| 25 to 29 Years | 72 (92.3%) | 0 (0.0%) |
| 30 to 34 Years | 135 (97.8%) | 17 (12.6%) |
| 35 to 44 Years | 155 (79.5%) | 3 (1.9%) |
| 45 to 54 Years | 254 (87.9%) | 16 (6.3%) |
| 55 to 59 Years | 123 (87.2%) | 2 (1.6%) |
| 60 to 64 Years | 106 (79.1%) | 0 (0.0%) |
| 65 to 74 Years | 77 (32.9%) | 0 (0.0%) |
| 75 Years and over | 19 (13.8%) | 0 (0.0%) |
| Total | 1,101 (69.0%) | 37 (3.4%) |
Employment Status by Educational Attainment in Newtown borough
According to labor force statistics for Newtown borough, 86.7% of individuals (845) out of the total population between 25 and 64 years of age (975) are in the labor force, with 4.5% or 38 of them being unemployed. The group with the highest labor force participation rate are those with the educational attainment of college / associate degree, with 91.7% or 188 individuals in the labor force. Within the labor force, individuals with high school diploma education have the highest percentage of unemployment, with 10.9% or 7 of them being unemployed.
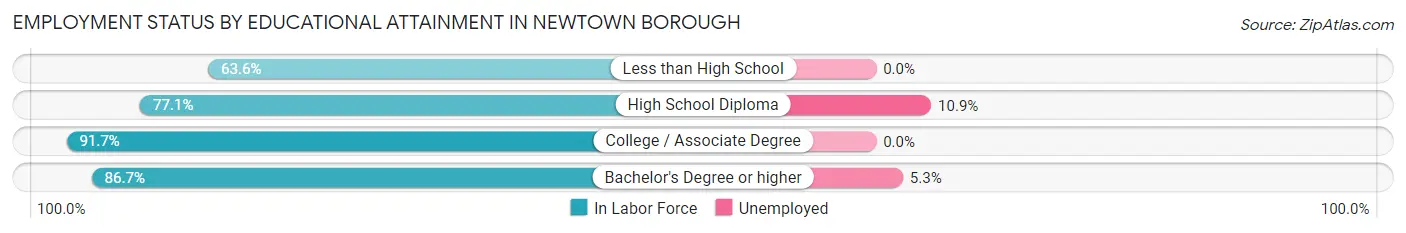
| Educational Attainment | In Labor Force | Unemployed |
| Less than High School | 7 (63.6%) | 0 (0.0%) |
| High School Diploma | 64 (77.1%) | 9 (10.9%) |
| College / Associate Degree | 188 (91.7%) | 0 (0.0%) |
| Bachelor's Degree or higher | 586 (86.7%) | 36 (5.3%) |
| Total | 845 (86.7%) | 44 (4.5%) |
Employment Occupations by Sex in Newtown borough
Management, Business, Science and Arts Occupations
The most common Management, Business, Science and Arts occupations in Newtown borough are Management (207 | 19.5%), Community & Social Service (166 | 15.6%), Education Instruction & Library (96 | 9.0%), Health Diagnosing & Treating (84 | 7.9%), and Business & Financial (78 | 7.3%).
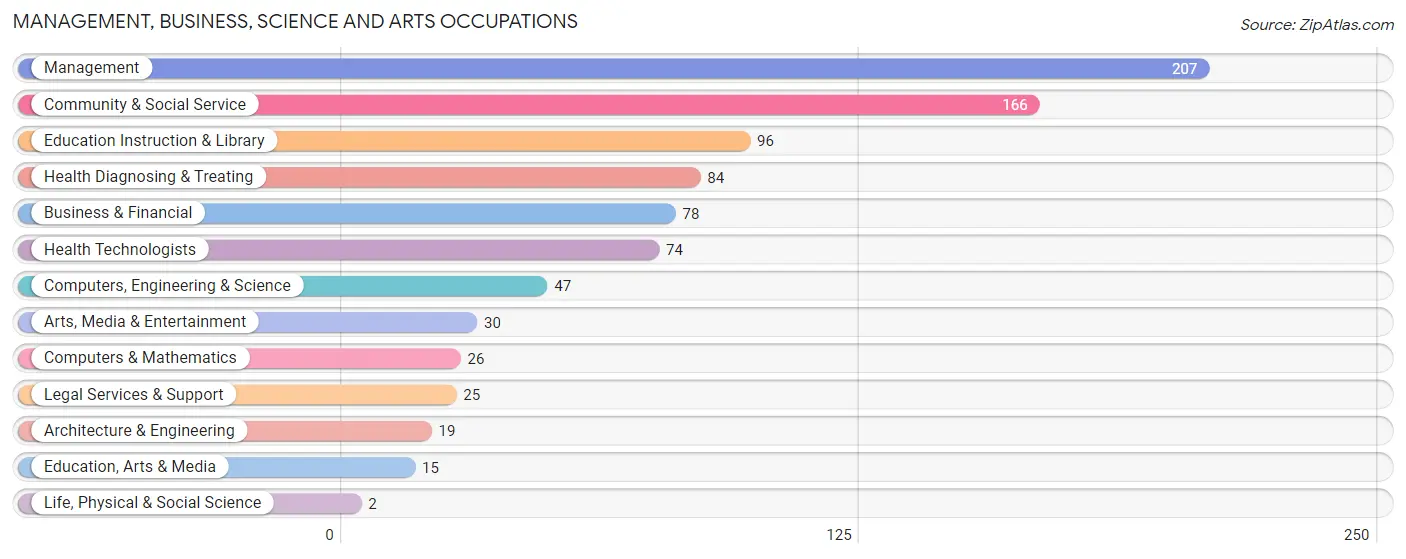
Management, Business, Science and Arts Occupations by Sex
Within the Management, Business, Science and Arts occupations in Newtown borough, the most male-oriented occupations are Life, Physical & Social Science (100.0%), Computers & Mathematics (92.3%), and Arts, Media & Entertainment (90.0%), while the most female-oriented occupations are Education, Arts & Media (100.0%), Health Diagnosing & Treating (92.9%), and Health Technologists (91.9%).
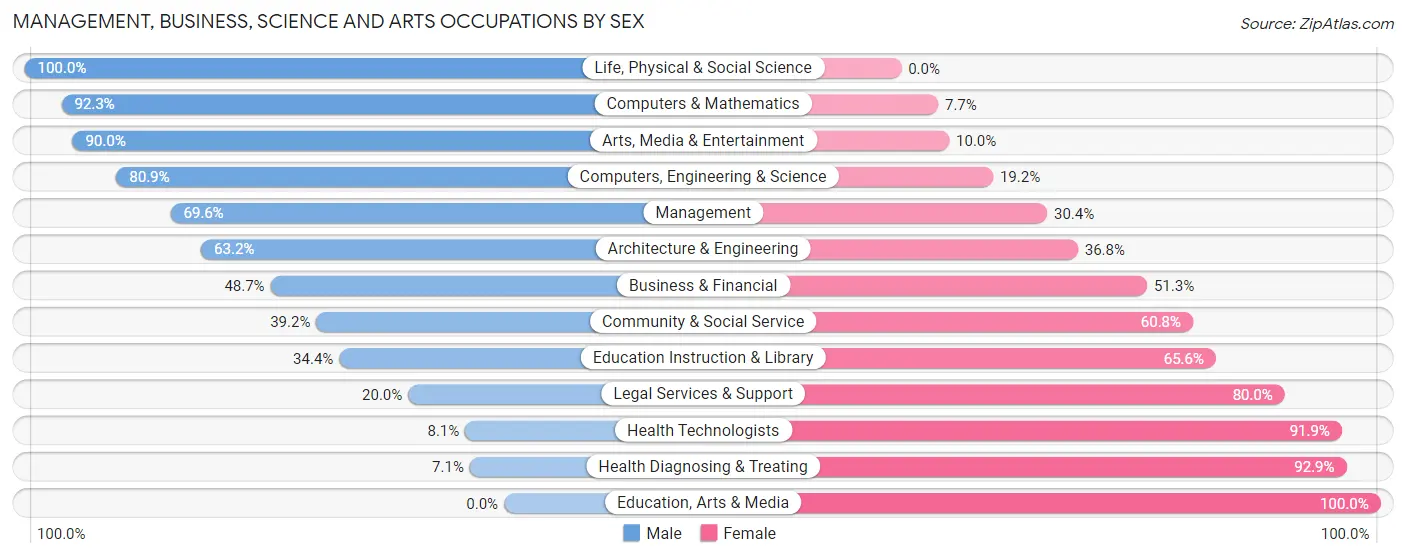
| Occupation | Male | Female |
| Management | 144 (69.6%) | 63 (30.4%) |
| Business & Financial | 38 (48.7%) | 40 (51.3%) |
| Computers, Engineering & Science | 38 (80.8%) | 9 (19.2%) |
| Computers & Mathematics | 24 (92.3%) | 2 (7.7%) |
| Architecture & Engineering | 12 (63.2%) | 7 (36.8%) |
| Life, Physical & Social Science | 2 (100.0%) | 0 (0.0%) |
| Community & Social Service | 65 (39.2%) | 101 (60.8%) |
| Education, Arts & Media | 0 (0.0%) | 15 (100.0%) |
| Legal Services & Support | 5 (20.0%) | 20 (80.0%) |
| Education Instruction & Library | 33 (34.4%) | 63 (65.6%) |
| Arts, Media & Entertainment | 27 (90.0%) | 3 (10.0%) |
| Health Diagnosing & Treating | 6 (7.1%) | 78 (92.9%) |
| Health Technologists | 6 (8.1%) | 68 (91.9%) |
| Total (Category) | 291 (50.0%) | 291 (50.0%) |
| Total (Overall) | 608 (57.1%) | 456 (42.9%) |
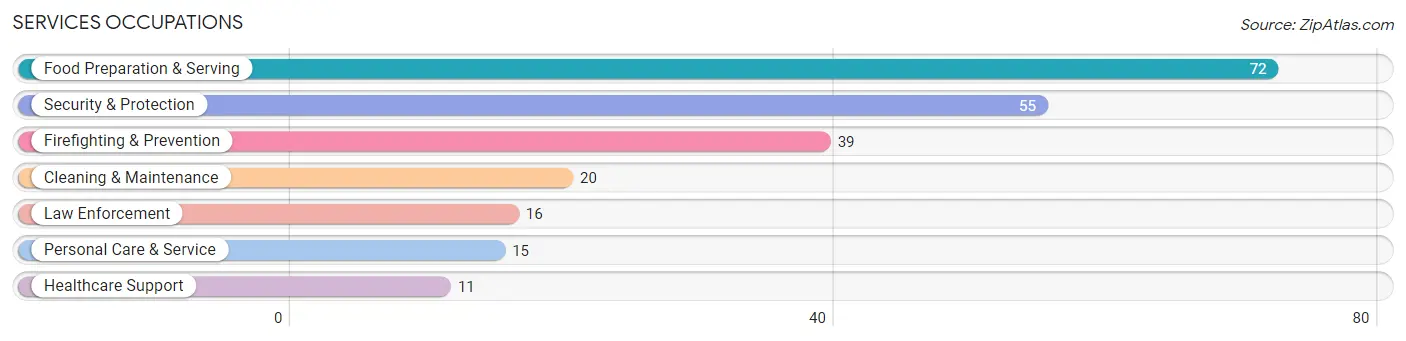
Services Occupations
The most common Services occupations in Newtown borough are Food Preparation & Serving (72 | 6.8%), Security & Protection (55 | 5.2%), Firefighting & Prevention (39 | 3.7%), Cleaning & Maintenance (20 | 1.9%), and Law Enforcement (16 | 1.5%).
Services Occupations by Sex
Within the Services occupations in Newtown borough, the most male-oriented occupations are Cleaning & Maintenance (100.0%), Law Enforcement (81.2%), and Food Preparation & Serving (70.8%), while the most female-oriented occupations are Healthcare Support (100.0%), Personal Care & Service (100.0%), and Firefighting & Prevention (35.9%).
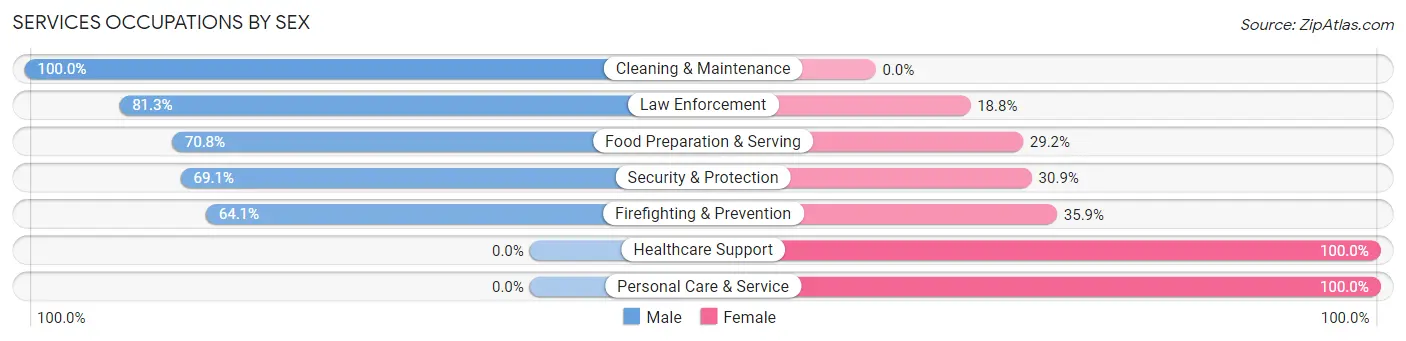
| Occupation | Male | Female |
| Healthcare Support | 0 (0.0%) | 11 (100.0%) |
| Security & Protection | 38 (69.1%) | 17 (30.9%) |
| Firefighting & Prevention | 25 (64.1%) | 14 (35.9%) |
| Law Enforcement | 13 (81.2%) | 3 (18.8%) |
| Food Preparation & Serving | 51 (70.8%) | 21 (29.2%) |
| Cleaning & Maintenance | 20 (100.0%) | 0 (0.0%) |
| Personal Care & Service | 0 (0.0%) | 15 (100.0%) |
| Total (Category) | 109 (63.0%) | 64 (37.0%) |
| Total (Overall) | 608 (57.1%) | 456 (42.9%) |
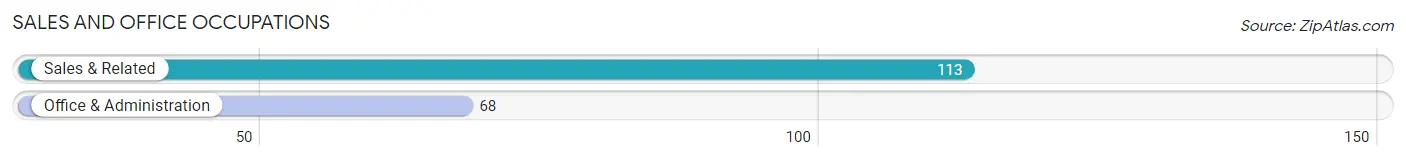
Sales and Office Occupations
The most common Sales and Office occupations in Newtown borough are Sales & Related (113 | 10.6%), and Office & Administration (68 | 6.4%).
Sales and Office Occupations by Sex
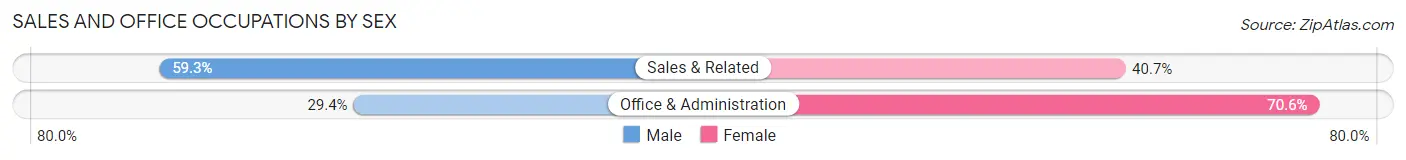
| Occupation | Male | Female |
| Sales & Related | 67 (59.3%) | 46 (40.7%) |
| Office & Administration | 20 (29.4%) | 48 (70.6%) |
| Total (Category) | 87 (48.1%) | 94 (51.9%) |
| Total (Overall) | 608 (57.1%) | 456 (42.9%) |
Natural Resources, Construction and Maintenance Occupations
The most common Natural Resources, Construction and Maintenance occupations in Newtown borough are Construction & Extraction (46 | 4.3%), and Installation, Maintenance & Repair (31 | 2.9%).
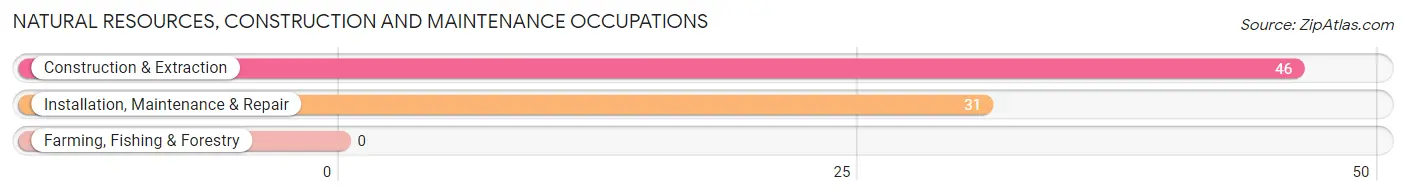
Natural Resources, Construction and Maintenance Occupations by Sex
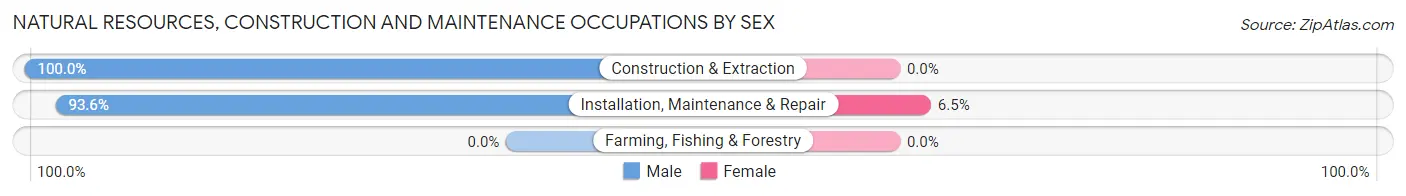
| Occupation | Male | Female |
| Farming, Fishing & Forestry | 0 (0.0%) | 0 (0.0%) |
| Construction & Extraction | 46 (100.0%) | 0 (0.0%) |
| Installation, Maintenance & Repair | 29 (93.5%) | 2 (6.5%) |
| Total (Category) | 75 (97.4%) | 2 (2.6%) |
| Total (Overall) | 608 (57.1%) | 456 (42.9%) |
Production, Transportation and Moving Occupations
The most common Production, Transportation and Moving occupations in Newtown borough are Transportation (19 | 1.8%), Production (18 | 1.7%), and Material Moving (14 | 1.3%).
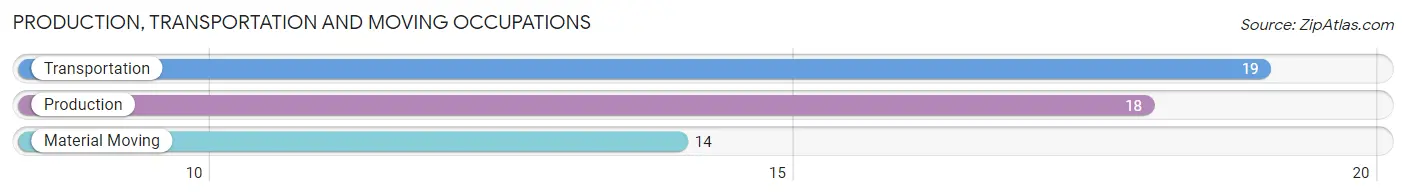
Production, Transportation and Moving Occupations by Sex
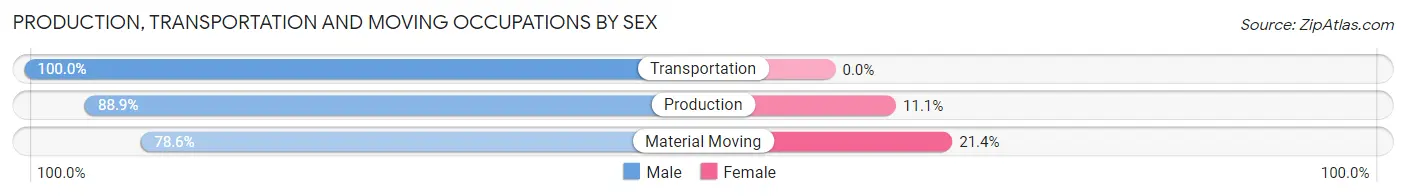
| Occupation | Male | Female |
| Production | 16 (88.9%) | 2 (11.1%) |
| Transportation | 19 (100.0%) | 0 (0.0%) |
| Material Moving | 11 (78.6%) | 3 (21.4%) |
| Total (Category) | 46 (90.2%) | 5 (9.8%) |
| Total (Overall) | 608 (57.1%) | 456 (42.9%) |
Employment Industries by Sex in Newtown borough
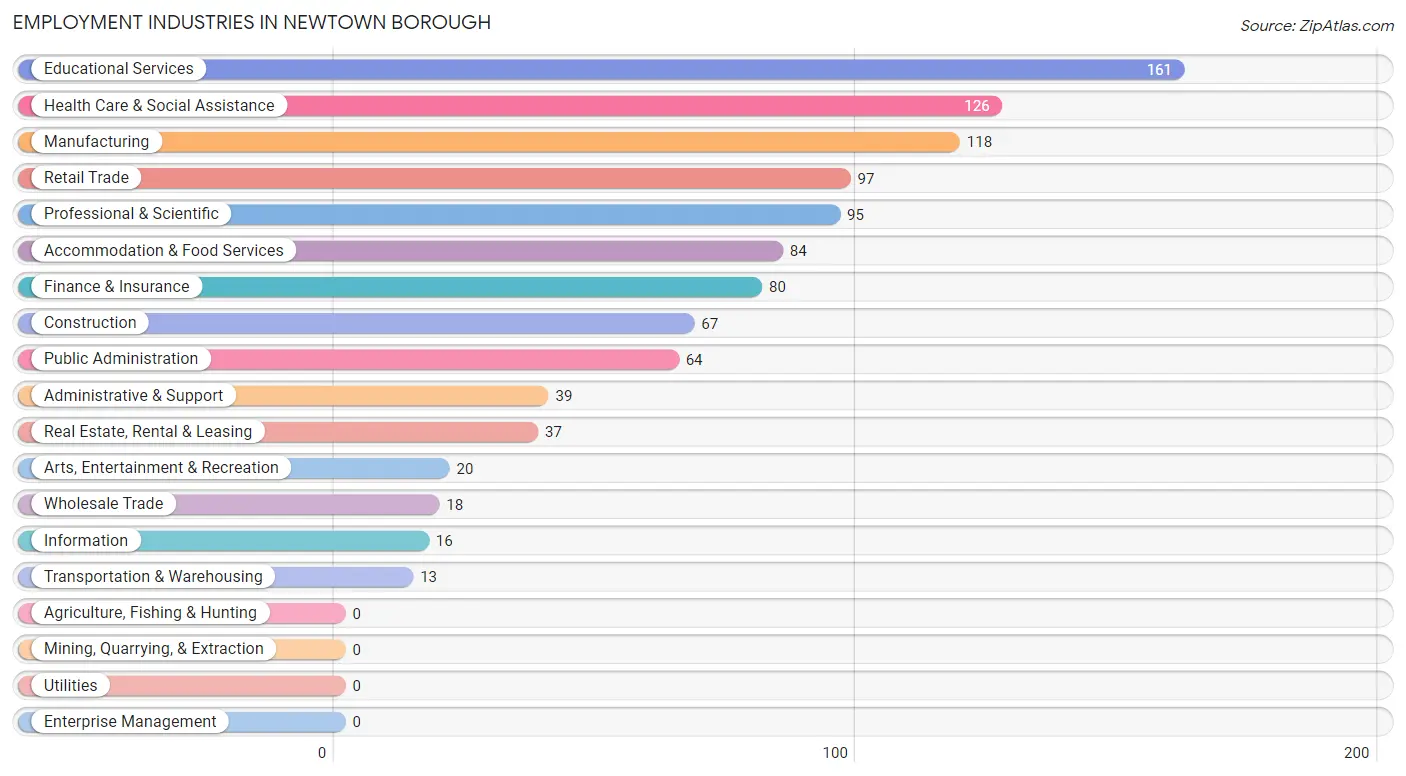
Employment Industries in Newtown borough
The major employment industries in Newtown borough include Educational Services (161 | 15.1%), Health Care & Social Assistance (126 | 11.8%), Manufacturing (118 | 11.1%), Retail Trade (97 | 9.1%), and Professional & Scientific (95 | 8.9%).
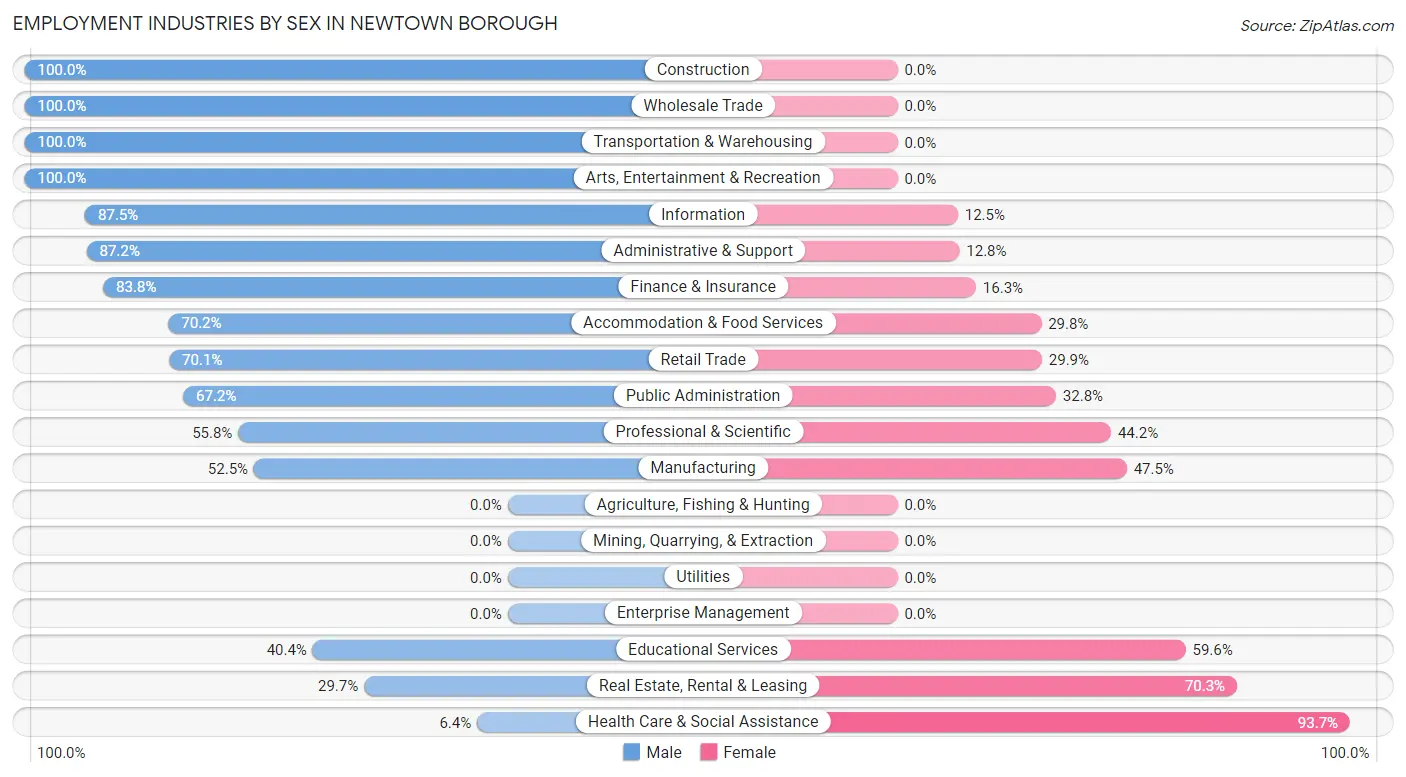
Employment Industries by Sex in Newtown borough
The Newtown borough industries that see more men than women are Construction (100.0%), Wholesale Trade (100.0%), and Transportation & Warehousing (100.0%), whereas the industries that tend to have a higher number of women are Health Care & Social Assistance (93.6%), Real Estate, Rental & Leasing (70.3%), and Educational Services (59.6%).
| Industry | Male | Female |
| Agriculture, Fishing & Hunting | 0 (0.0%) | 0 (0.0%) |
| Mining, Quarrying, & Extraction | 0 (0.0%) | 0 (0.0%) |
| Construction | 67 (100.0%) | 0 (0.0%) |
| Manufacturing | 62 (52.5%) | 56 (47.5%) |
| Wholesale Trade | 18 (100.0%) | 0 (0.0%) |
| Retail Trade | 68 (70.1%) | 29 (29.9%) |
| Transportation & Warehousing | 13 (100.0%) | 0 (0.0%) |
| Utilities | 0 (0.0%) | 0 (0.0%) |
| Information | 14 (87.5%) | 2 (12.5%) |
| Finance & Insurance | 67 (83.8%) | 13 (16.3%) |
| Real Estate, Rental & Leasing | 11 (29.7%) | 26 (70.3%) |
| Professional & Scientific | 53 (55.8%) | 42 (44.2%) |
| Enterprise Management | 0 (0.0%) | 0 (0.0%) |
| Administrative & Support | 34 (87.2%) | 5 (12.8%) |
| Educational Services | 65 (40.4%) | 96 (59.6%) |
| Health Care & Social Assistance | 8 (6.4%) | 118 (93.6%) |
| Arts, Entertainment & Recreation | 20 (100.0%) | 0 (0.0%) |
| Accommodation & Food Services | 59 (70.2%) | 25 (29.8%) |
| Public Administration | 43 (67.2%) | 21 (32.8%) |
| Total | 608 (57.1%) | 456 (42.9%) |
Education in Newtown borough
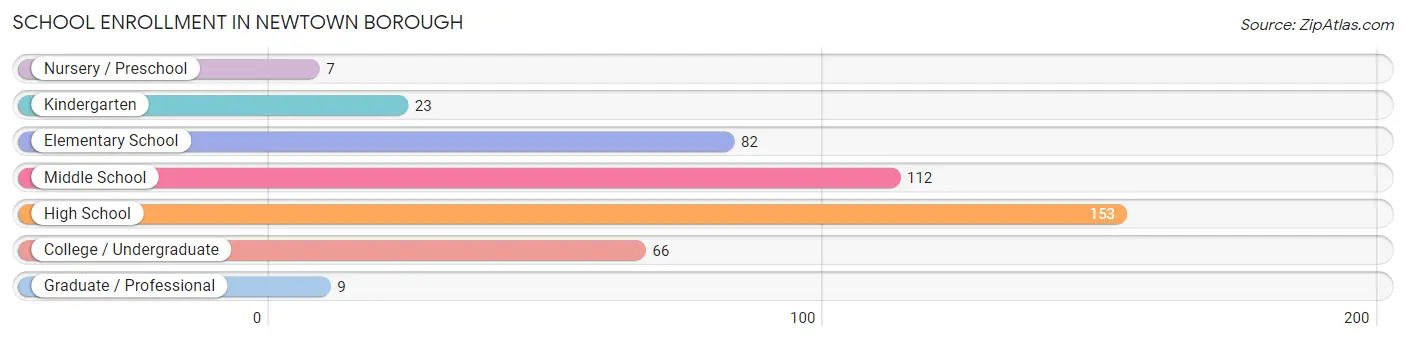
School Enrollment in Newtown borough
The most common levels of schooling among the 452 students in Newtown borough are high school (153 | 33.9%), middle school (112 | 24.8%), and elementary school (82 | 18.1%).
| School Level | # Students | % Students |
| Nursery / Preschool | 7 | 1.5% |
| Kindergarten | 23 | 5.1% |
| Elementary School | 82 | 18.1% |
| Middle School | 112 | 24.8% |
| High School | 153 | 33.9% |
| College / Undergraduate | 66 | 14.6% |
| Graduate / Professional | 9 | 2.0% |
| Total | 452 | 100.0% |
School Enrollment by Age by Funding Source in Newtown borough
Out of a total of 452 students who are enrolled in schools in Newtown borough, 69 (15.3%) attend a private institution, while the remaining 383 (84.7%) are enrolled in public schools. The age group of 25 to 34 year olds has the highest likelihood of being enrolled in private schools, with 7 (77.8% in the age bracket) enrolled. Conversely, the age group of 3 to 4 year olds has the lowest likelihood of being enrolled in a private school, with 3 (100.0% in the age bracket) attending a public institution.
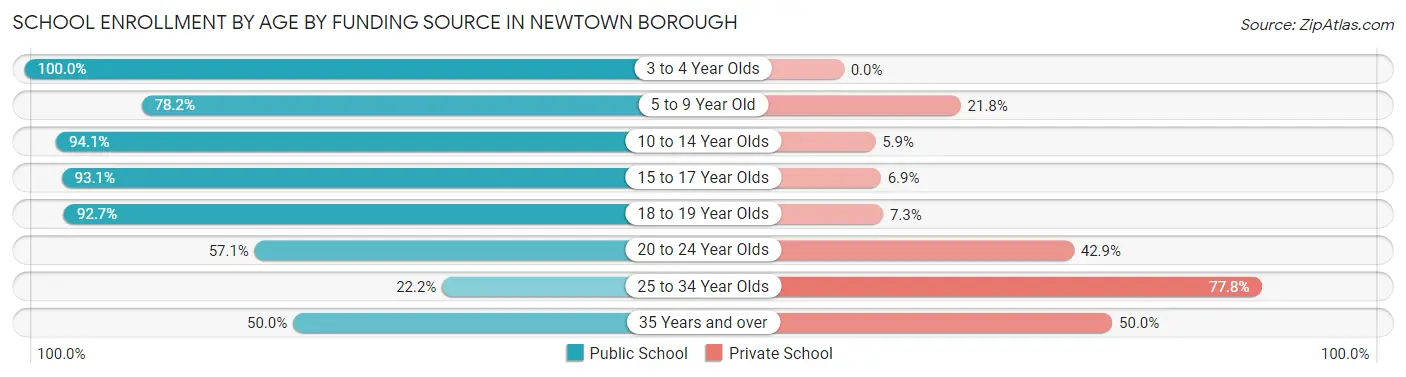
| Age Bracket | Public School | Private School |
| 3 to 4 Year Olds | 3 (100.0%) | 0 (0.0%) |
| 5 to 9 Year Old | 79 (78.2%) | 22 (21.8%) |
| 10 to 14 Year Olds | 128 (94.1%) | 8 (5.9%) |
| 15 to 17 Year Olds | 108 (93.1%) | 8 (6.9%) |
| 18 to 19 Year Olds | 38 (92.7%) | 3 (7.3%) |
| 20 to 24 Year Olds | 16 (57.1%) | 12 (42.9%) |
| 25 to 34 Year Olds | 2 (22.2%) | 7 (77.8%) |
| 35 Years and over | 9 (50.0%) | 9 (50.0%) |
| Total | 383 (84.7%) | 69 (15.3%) |
Educational Attainment by Field of Study in Newtown borough
Business (148 | 16.5%), social sciences (136 | 15.2%), science & technology (85 | 9.5%), education (82 | 9.1%), and literature & languages (67 | 7.5%) are the most common fields of study among 897 individuals in Newtown borough who have obtained a bachelor's degree or higher.
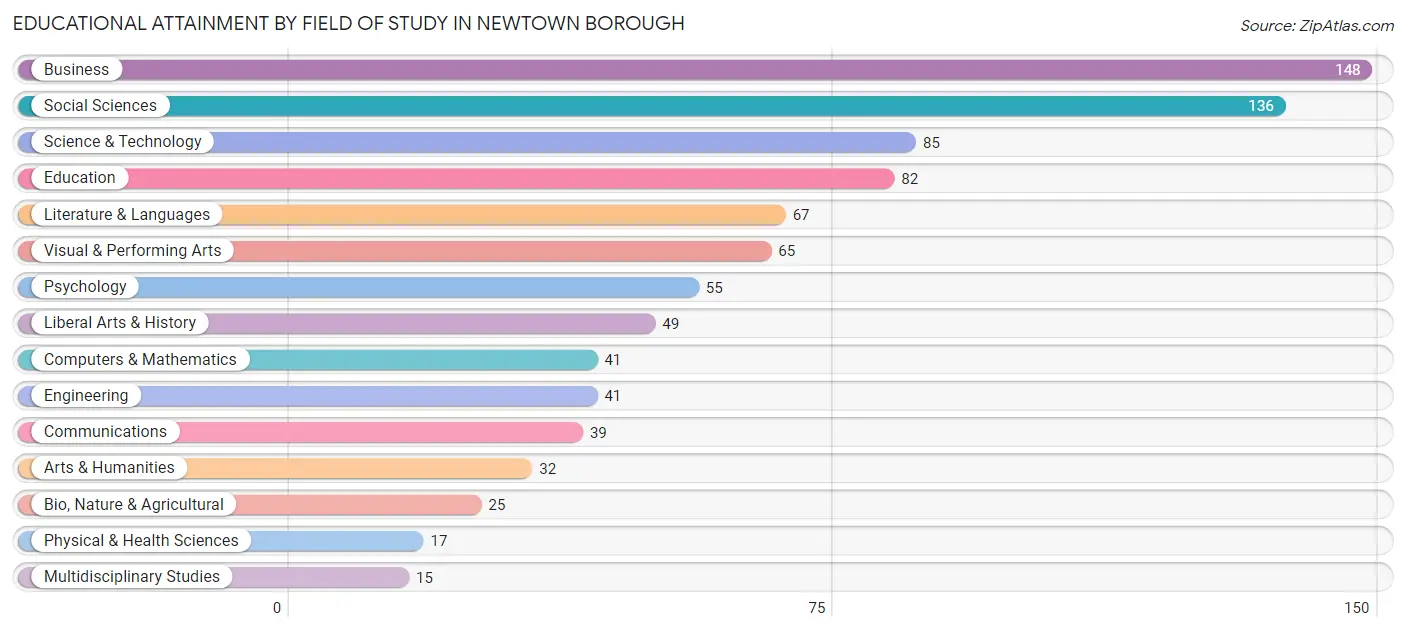
| Field of Study | # Graduates | % Graduates |
| Computers & Mathematics | 41 | 4.6% |
| Bio, Nature & Agricultural | 25 | 2.8% |
| Physical & Health Sciences | 17 | 1.9% |
| Psychology | 55 | 6.1% |
| Social Sciences | 136 | 15.2% |
| Engineering | 41 | 4.6% |
| Multidisciplinary Studies | 15 | 1.7% |
| Science & Technology | 85 | 9.5% |
| Business | 148 | 16.5% |
| Education | 82 | 9.1% |
| Literature & Languages | 67 | 7.5% |
| Liberal Arts & History | 49 | 5.5% |
| Visual & Performing Arts | 65 | 7.2% |
| Communications | 39 | 4.3% |
| Arts & Humanities | 32 | 3.6% |
| Total | 897 | 100.0% |
Transportation & Commute in Newtown borough
Vehicle Availability by Sex in Newtown borough
The most prevalent vehicle ownership categories in Newtown borough are males with 2 vehicles (267, accounting for 45.0%) and females with 2 vehicles (181, making up 58.6%).
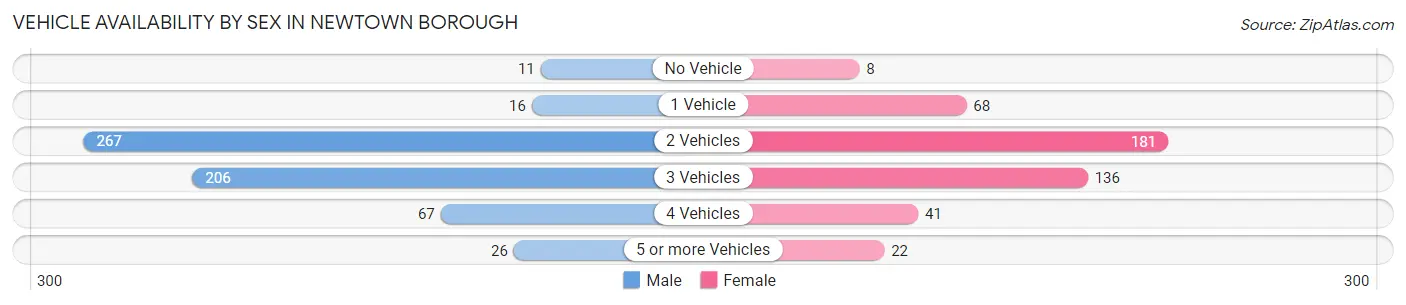
| Vehicles Available | Male | Female |
| No Vehicle | 11 (1.8%) | 8 (1.8%) |
| 1 Vehicle | 16 (2.7%) | 68 (14.9%) |
| 2 Vehicles | 267 (45.0%) | 181 (39.7%) |
| 3 Vehicles | 206 (34.7%) | 136 (29.8%) |
| 4 Vehicles | 67 (11.3%) | 41 (9.0%) |
| 5 or more Vehicles | 26 (4.4%) | 22 (4.8%) |
| Total | 593 (100.0%) | 456 (100.0%) |
Commute Time in Newtown borough
The most frequently occuring commute durations in Newtown borough are 15 to 19 minutes (118 commuters, 14.3%), 60 to 89 minutes (116 commuters, 14.1%), and 30 to 34 minutes (93 commuters, 11.3%).
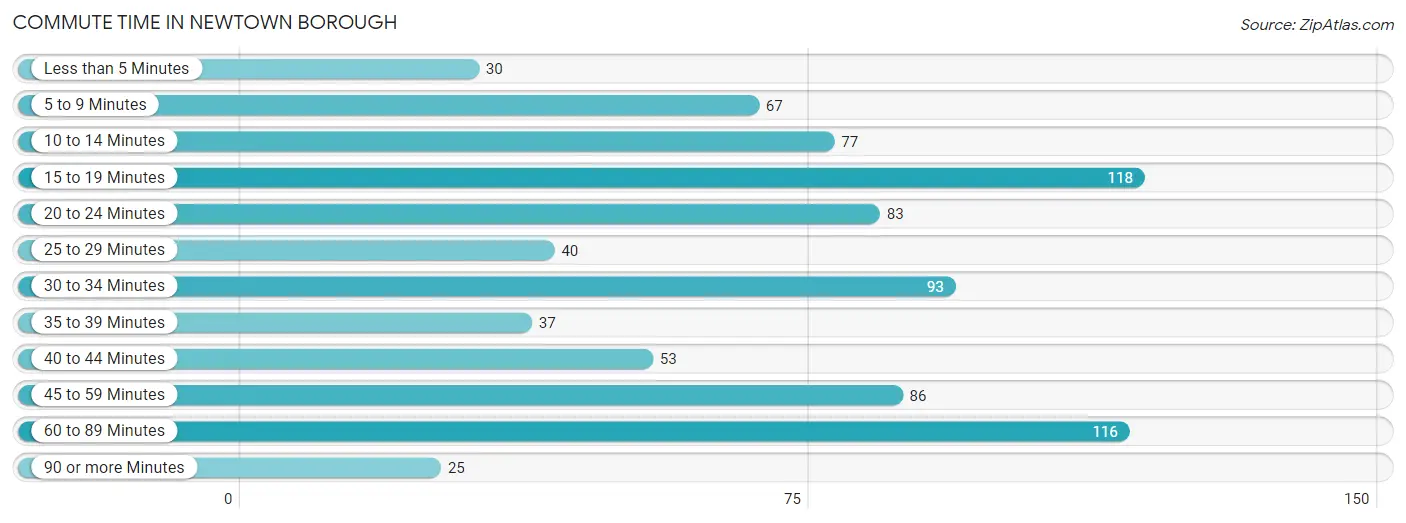
| Commute Time | # Commuters | % Commuters |
| Less than 5 Minutes | 30 | 3.6% |
| 5 to 9 Minutes | 67 | 8.1% |
| 10 to 14 Minutes | 77 | 9.3% |
| 15 to 19 Minutes | 118 | 14.3% |
| 20 to 24 Minutes | 83 | 10.1% |
| 25 to 29 Minutes | 40 | 4.9% |
| 30 to 34 Minutes | 93 | 11.3% |
| 35 to 39 Minutes | 37 | 4.5% |
| 40 to 44 Minutes | 53 | 6.4% |
| 45 to 59 Minutes | 86 | 10.4% |
| 60 to 89 Minutes | 116 | 14.1% |
| 90 or more Minutes | 25 | 3.0% |
Commute Time by Sex in Newtown borough
The most common commute times in Newtown borough are 60 to 89 minutes (84 commuters, 17.5%) for males and 15 to 19 minutes (71 commuters, 20.6%) for females.
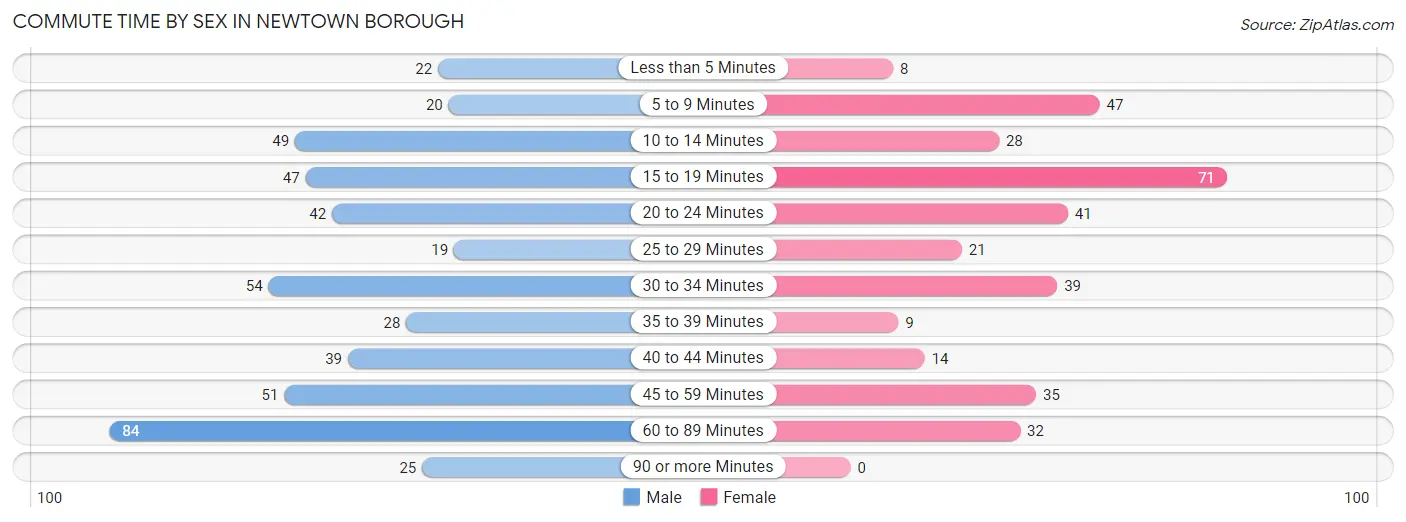
| Commute Time | Male | Female |
| Less than 5 Minutes | 22 (4.6%) | 8 (2.3%) |
| 5 to 9 Minutes | 20 (4.2%) | 47 (13.6%) |
| 10 to 14 Minutes | 49 (10.2%) | 28 (8.1%) |
| 15 to 19 Minutes | 47 (9.8%) | 71 (20.6%) |
| 20 to 24 Minutes | 42 (8.7%) | 41 (11.9%) |
| 25 to 29 Minutes | 19 (4.0%) | 21 (6.1%) |
| 30 to 34 Minutes | 54 (11.3%) | 39 (11.3%) |
| 35 to 39 Minutes | 28 (5.8%) | 9 (2.6%) |
| 40 to 44 Minutes | 39 (8.1%) | 14 (4.1%) |
| 45 to 59 Minutes | 51 (10.6%) | 35 (10.1%) |
| 60 to 89 Minutes | 84 (17.5%) | 32 (9.3%) |
| 90 or more Minutes | 25 (5.2%) | 0 (0.0%) |
Time of Departure to Work by Sex in Newtown borough
The most frequent times of departure to work in Newtown borough are 5:30 AM to 5:59 AM (73, 15.2%) for males and 7:30 AM to 7:59 AM (55, 15.9%) for females.
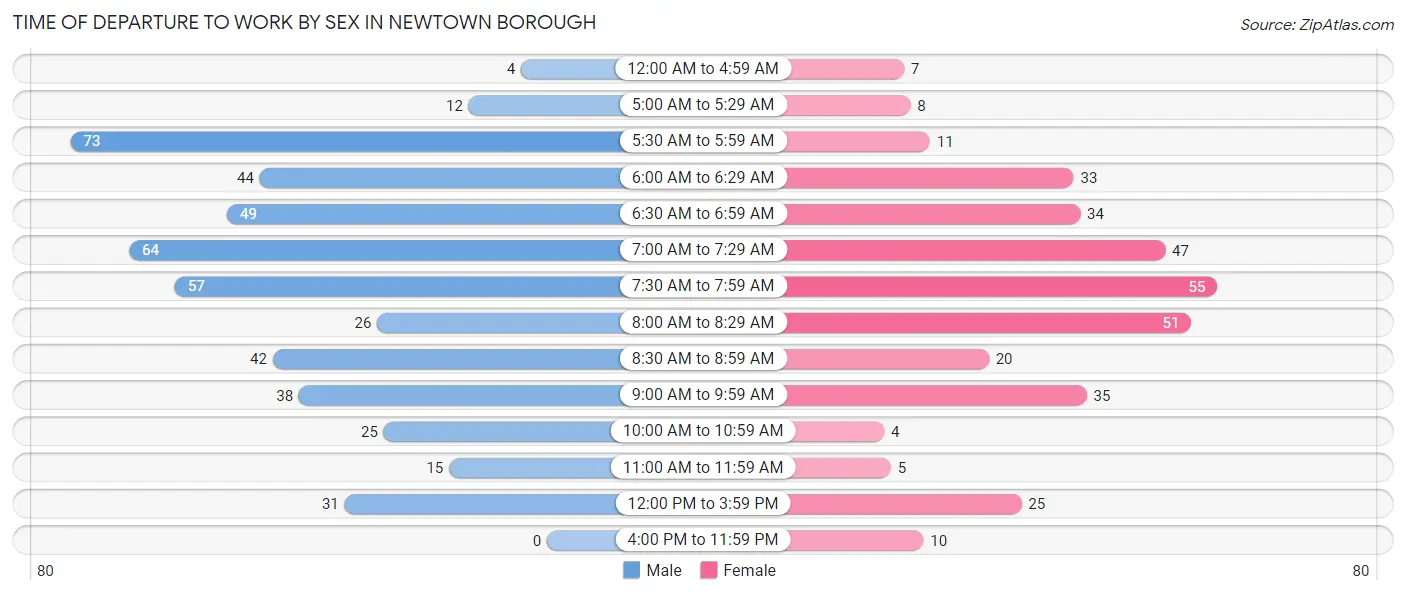
| Time of Departure | Male | Female |
| 12:00 AM to 4:59 AM | 4 (0.8%) | 7 (2.0%) |
| 5:00 AM to 5:29 AM | 12 (2.5%) | 8 (2.3%) |
| 5:30 AM to 5:59 AM | 73 (15.2%) | 11 (3.2%) |
| 6:00 AM to 6:29 AM | 44 (9.2%) | 33 (9.6%) |
| 6:30 AM to 6:59 AM | 49 (10.2%) | 34 (9.9%) |
| 7:00 AM to 7:29 AM | 64 (13.3%) | 47 (13.6%) |
| 7:30 AM to 7:59 AM | 57 (11.9%) | 55 (15.9%) |
| 8:00 AM to 8:29 AM | 26 (5.4%) | 51 (14.8%) |
| 8:30 AM to 8:59 AM | 42 (8.7%) | 20 (5.8%) |
| 9:00 AM to 9:59 AM | 38 (7.9%) | 35 (10.1%) |
| 10:00 AM to 10:59 AM | 25 (5.2%) | 4 (1.2%) |
| 11:00 AM to 11:59 AM | 15 (3.1%) | 5 (1.5%) |
| 12:00 PM to 3:59 PM | 31 (6.5%) | 25 (7.2%) |
| 4:00 PM to 11:59 PM | 0 (0.0%) | 10 (2.9%) |
| Total | 480 (100.0%) | 345 (100.0%) |
Housing Occupancy in Newtown borough
Occupancy by Ownership in Newtown borough
Of the total 697 dwellings in Newtown borough, owner-occupied units account for 622 (89.2%), while renter-occupied units make up 75 (10.8%).
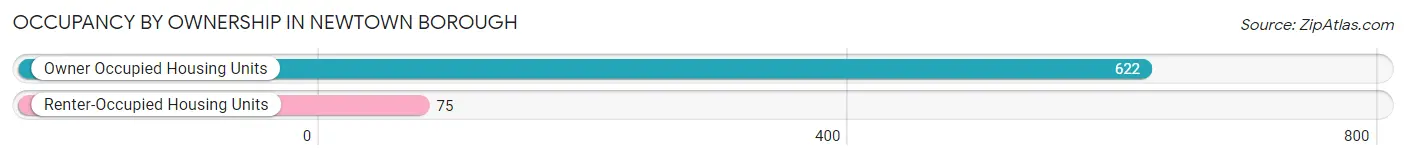
| Occupancy | # Housing Units | % Housing Units |
| Owner Occupied Housing Units | 622 | 89.2% |
| Renter-Occupied Housing Units | 75 | 10.8% |
| Total Occupied Housing Units | 697 | 100.0% |
Occupancy by Household Size in Newtown borough
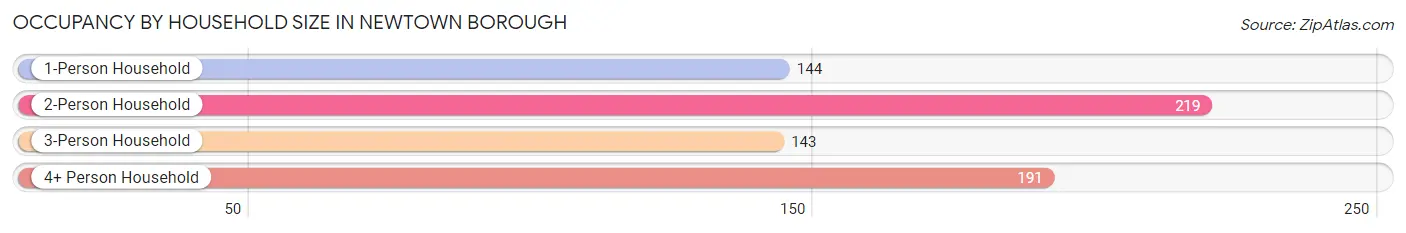
| Household Size | # Housing Units | % Housing Units |
| 1-Person Household | 144 | 20.7% |
| 2-Person Household | 219 | 31.4% |
| 3-Person Household | 143 | 20.5% |
| 4+ Person Household | 191 | 27.4% |
| Total Housing Units | 697 | 100.0% |
Occupancy by Ownership by Household Size in Newtown borough
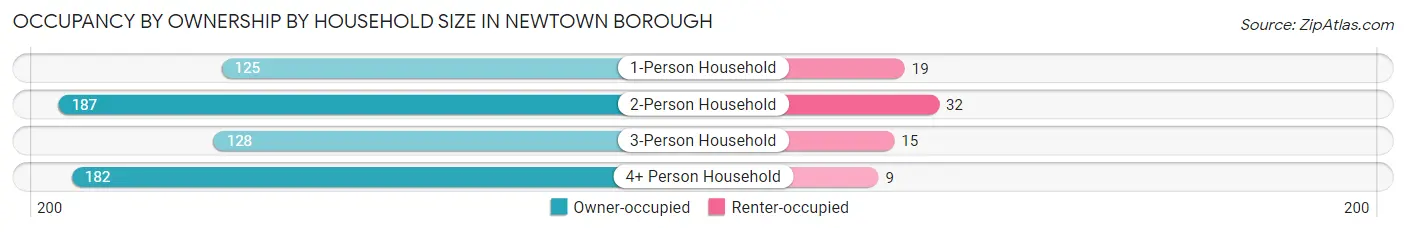
| Household Size | Owner-occupied | Renter-occupied |
| 1-Person Household | 125 (86.8%) | 19 (13.2%) |
| 2-Person Household | 187 (85.4%) | 32 (14.6%) |
| 3-Person Household | 128 (89.5%) | 15 (10.5%) |
| 4+ Person Household | 182 (95.3%) | 9 (4.7%) |
| Total Housing Units | 622 (89.2%) | 75 (10.8%) |
Occupancy by Educational Attainment in Newtown borough
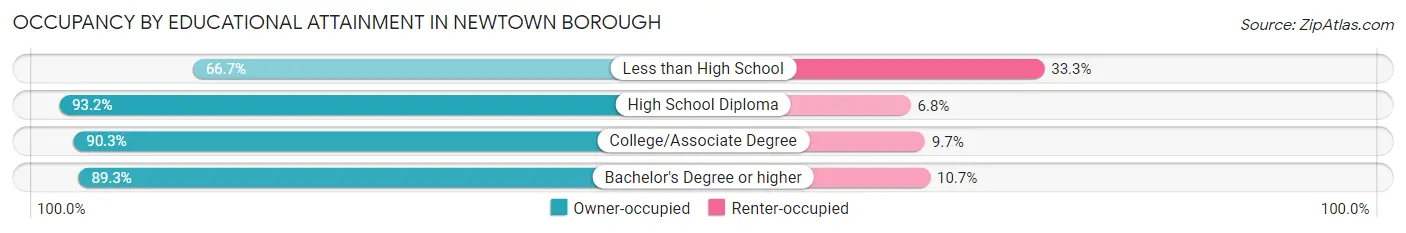
| Household Size | Owner-occupied | Renter-occupied |
| Less than High School | 12 (66.7%) | 6 (33.3%) |
| High School Diploma | 41 (93.2%) | 3 (6.8%) |
| College/Associate Degree | 159 (90.3%) | 17 (9.7%) |
| Bachelor's Degree or higher | 410 (89.3%) | 49 (10.7%) |
Occupancy by Age of Householder in Newtown borough
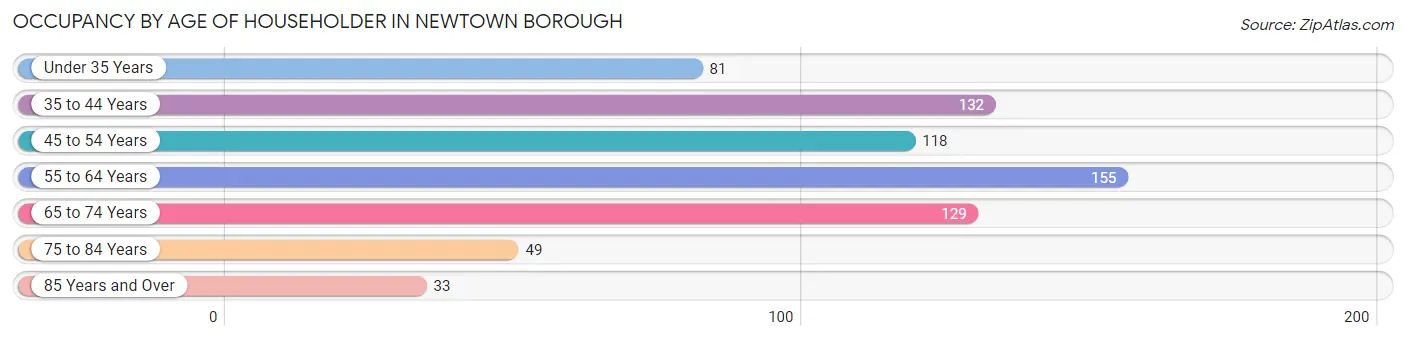
| Age Bracket | # Households | % Households |
| Under 35 Years | 81 | 11.6% |
| 35 to 44 Years | 132 | 18.9% |
| 45 to 54 Years | 118 | 16.9% |
| 55 to 64 Years | 155 | 22.2% |
| 65 to 74 Years | 129 | 18.5% |
| 75 to 84 Years | 49 | 7.0% |
| 85 Years and Over | 33 | 4.7% |
| Total | 697 | 100.0% |
Housing Finances in Newtown borough
Median Income by Occupancy in Newtown borough
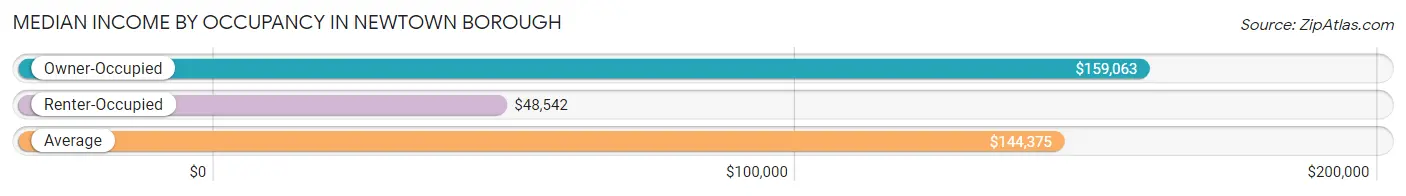
| Occupancy Type | # Households | Median Income |
| Owner-Occupied | 622 (89.2%) | $159,063 |
| Renter-Occupied | 75 (10.8%) | $48,542 |
| Average | 697 (100.0%) | $144,375 |
Occupancy by Householder Income Bracket in Newtown borough
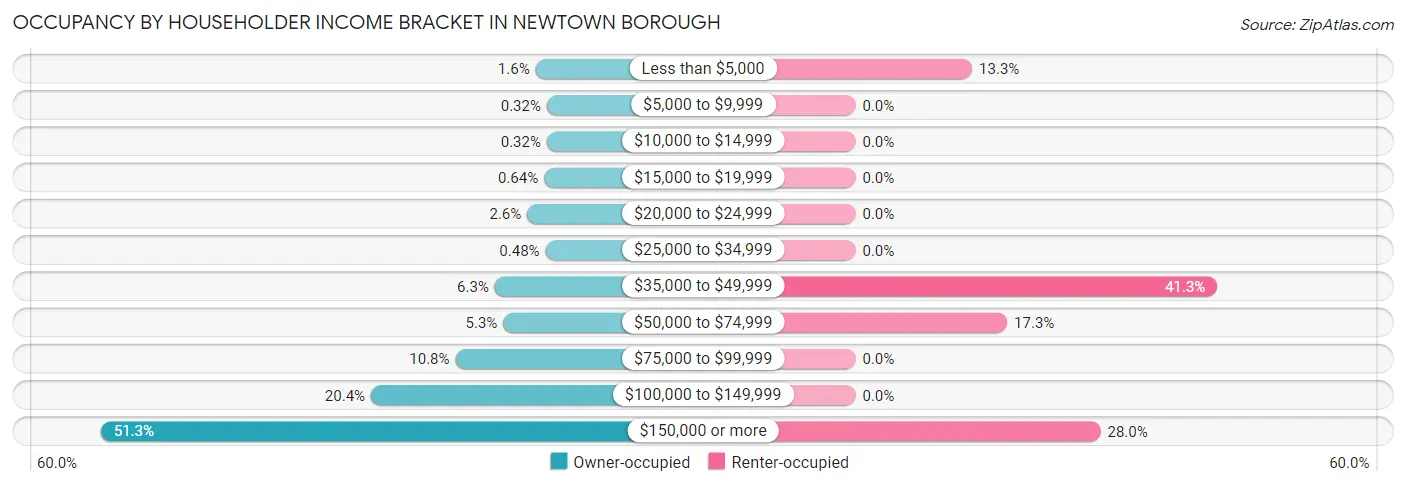
| Income Bracket | Owner-occupied | Renter-occupied |
| Less than $5,000 | 10 (1.6%) | 10 (13.3%) |
| $5,000 to $9,999 | 2 (0.3%) | 0 (0.0%) |
| $10,000 to $14,999 | 2 (0.3%) | 0 (0.0%) |
| $15,000 to $19,999 | 4 (0.6%) | 0 (0.0%) |
| $20,000 to $24,999 | 16 (2.6%) | 0 (0.0%) |
| $25,000 to $34,999 | 3 (0.5%) | 0 (0.0%) |
| $35,000 to $49,999 | 39 (6.3%) | 31 (41.3%) |
| $50,000 to $74,999 | 33 (5.3%) | 13 (17.3%) |
| $75,000 to $99,999 | 67 (10.8%) | 0 (0.0%) |
| $100,000 to $149,999 | 127 (20.4%) | 0 (0.0%) |
| $150,000 or more | 319 (51.3%) | 21 (28.0%) |
| Total | 622 (100.0%) | 75 (100.0%) |
Monthly Housing Cost Tiers in Newtown borough
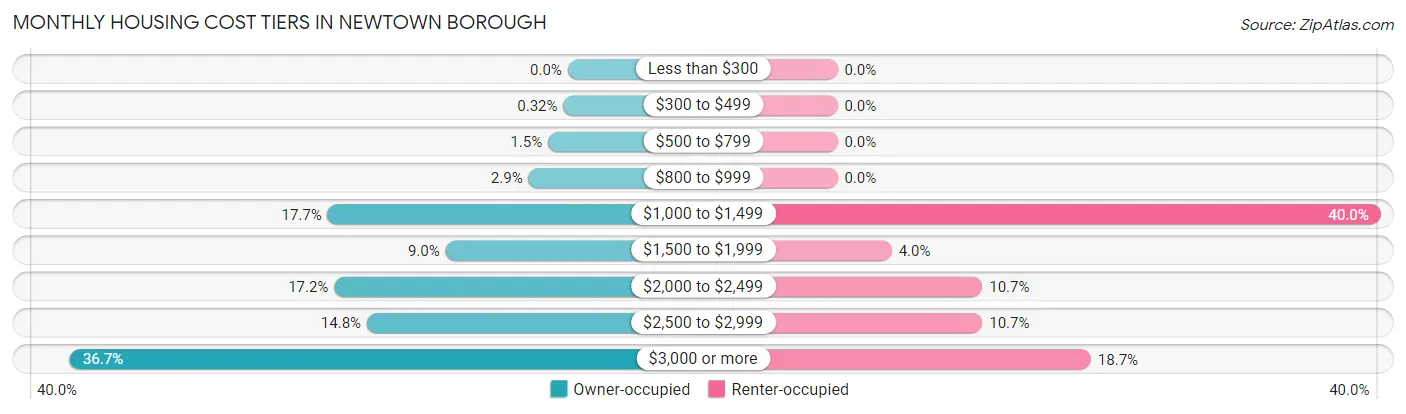
| Monthly Cost | Owner-occupied | Renter-occupied |
| Less than $300 | 0 (0.0%) | 0 (0.0%) |
| $300 to $499 | 2 (0.3%) | 0 (0.0%) |
| $500 to $799 | 9 (1.5%) | 0 (0.0%) |
| $800 to $999 | 18 (2.9%) | 0 (0.0%) |
| $1,000 to $1,499 | 110 (17.7%) | 30 (40.0%) |
| $1,500 to $1,999 | 56 (9.0%) | 3 (4.0%) |
| $2,000 to $2,499 | 107 (17.2%) | 8 (10.7%) |
| $2,500 to $2,999 | 92 (14.8%) | 8 (10.7%) |
| $3,000 or more | 228 (36.7%) | 14 (18.7%) |
| Total | 622 (100.0%) | 75 (100.0%) |
Physical Housing Characteristics in Newtown borough
Housing Structures in Newtown borough
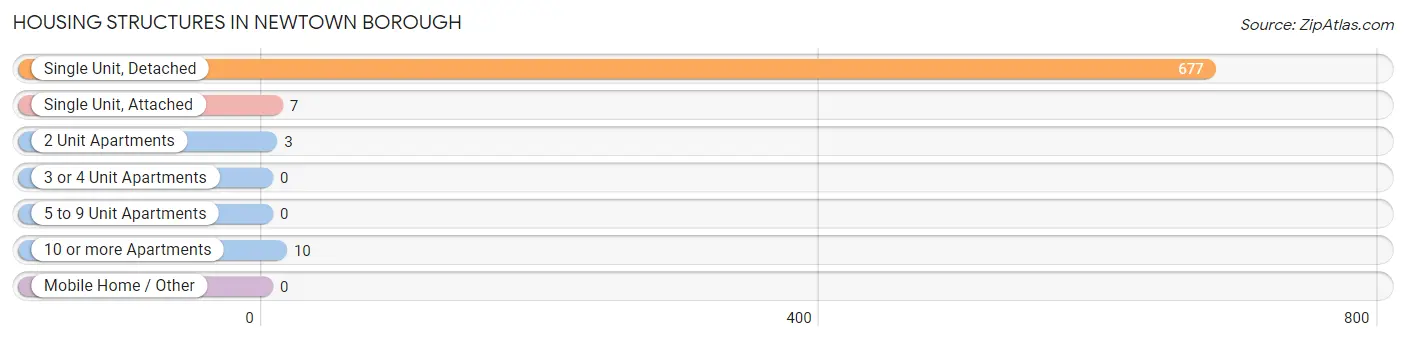
| Structure Type | # Housing Units | % Housing Units |
| Single Unit, Detached | 677 | 97.1% |
| Single Unit, Attached | 7 | 1.0% |
| 2 Unit Apartments | 3 | 0.4% |
| 3 or 4 Unit Apartments | 0 | 0.0% |
| 5 to 9 Unit Apartments | 0 | 0.0% |
| 10 or more Apartments | 10 | 1.4% |
| Mobile Home / Other | 0 | 0.0% |
| Total | 697 | 100.0% |
Housing Structures by Occupancy in Newtown borough
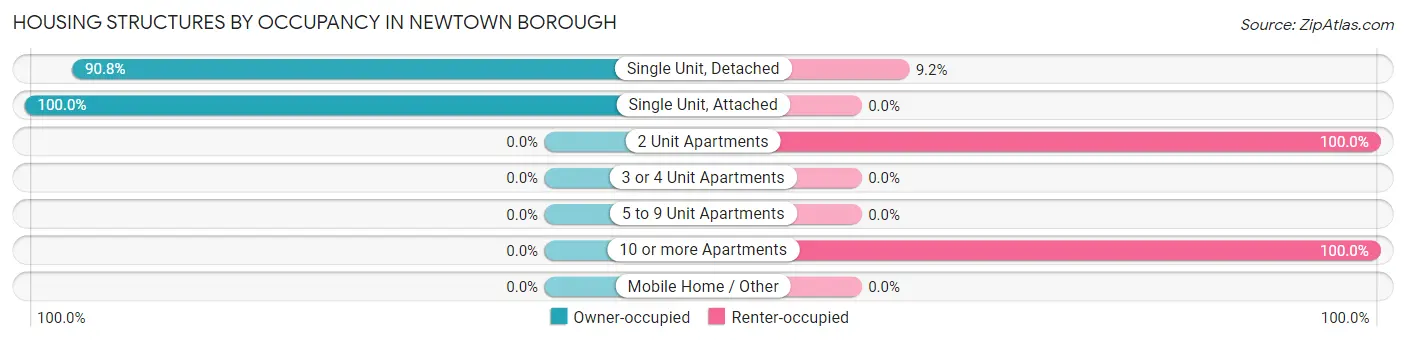
| Structure Type | Owner-occupied | Renter-occupied |
| Single Unit, Detached | 615 (90.8%) | 62 (9.2%) |
| Single Unit, Attached | 7 (100.0%) | 0 (0.0%) |
| 2 Unit Apartments | 0 (0.0%) | 3 (100.0%) |
| 3 or 4 Unit Apartments | 0 (0.0%) | 0 (0.0%) |
| 5 to 9 Unit Apartments | 0 (0.0%) | 0 (0.0%) |
| 10 or more Apartments | 0 (0.0%) | 10 (100.0%) |
| Mobile Home / Other | 0 (0.0%) | 0 (0.0%) |
| Total | 622 (89.2%) | 75 (10.8%) |
Housing Structures by Number of Rooms in Newtown borough
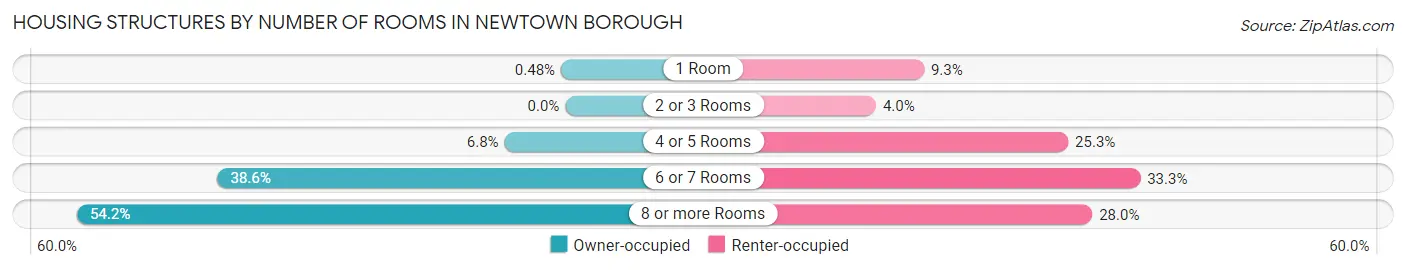
| Number of Rooms | Owner-occupied | Renter-occupied |
| 1 Room | 3 (0.5%) | 7 (9.3%) |
| 2 or 3 Rooms | 0 (0.0%) | 3 (4.0%) |
| 4 or 5 Rooms | 42 (6.8%) | 19 (25.3%) |
| 6 or 7 Rooms | 240 (38.6%) | 25 (33.3%) |
| 8 or more Rooms | 337 (54.2%) | 21 (28.0%) |
| Total | 622 (100.0%) | 75 (100.0%) |
Housing Structure by Heating Type in Newtown borough
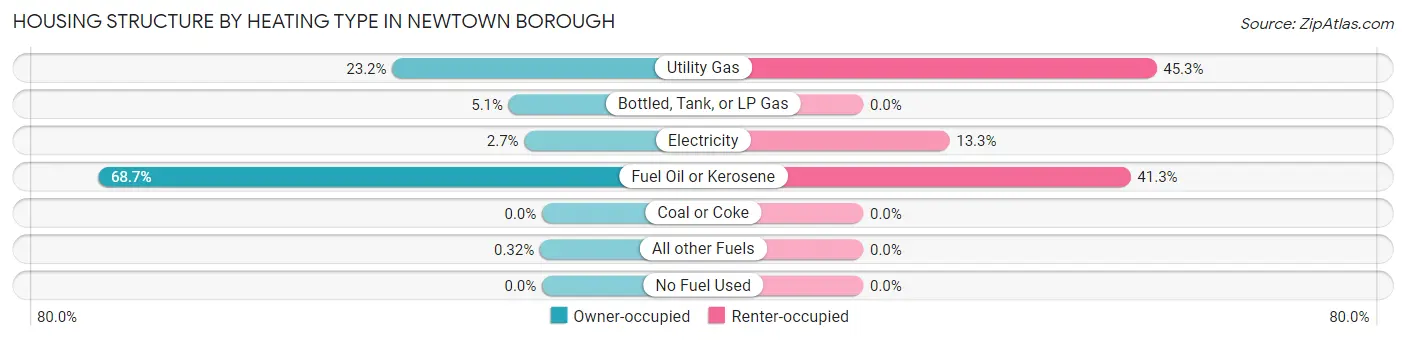
| Heating Type | Owner-occupied | Renter-occupied |
| Utility Gas | 144 (23.2%) | 34 (45.3%) |
| Bottled, Tank, or LP Gas | 32 (5.1%) | 0 (0.0%) |
| Electricity | 17 (2.7%) | 10 (13.3%) |
| Fuel Oil or Kerosene | 427 (68.6%) | 31 (41.3%) |
| Coal or Coke | 0 (0.0%) | 0 (0.0%) |
| All other Fuels | 2 (0.3%) | 0 (0.0%) |
| No Fuel Used | 0 (0.0%) | 0 (0.0%) |
| Total | 622 (100.0%) | 75 (100.0%) |
Household Vehicle Usage in Newtown borough
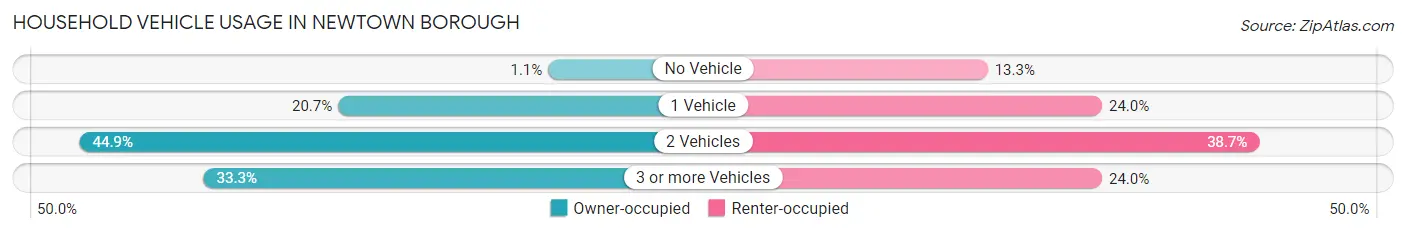
| Vehicles per Household | Owner-occupied | Renter-occupied |
| No Vehicle | 7 (1.1%) | 10 (13.3%) |
| 1 Vehicle | 129 (20.7%) | 18 (24.0%) |
| 2 Vehicles | 279 (44.9%) | 29 (38.7%) |
| 3 or more Vehicles | 207 (33.3%) | 18 (24.0%) |
| Total | 622 (100.0%) | 75 (100.0%) |
Real Estate & Mortgages in Newtown borough
Real Estate and Mortgage Overview in Newtown borough
| Characteristic | Without Mortgage | With Mortgage |
| Housing Units | 165 | 457 |
| Median Property Value | $401,400 | $464,200 |
| Median Household Income | $123,550 | $262 |
| Monthly Housing Costs | $1,127 | $228 |
| Real Estate Taxes | $8,293 | $0 |
Property Value by Mortgage Status in Newtown borough
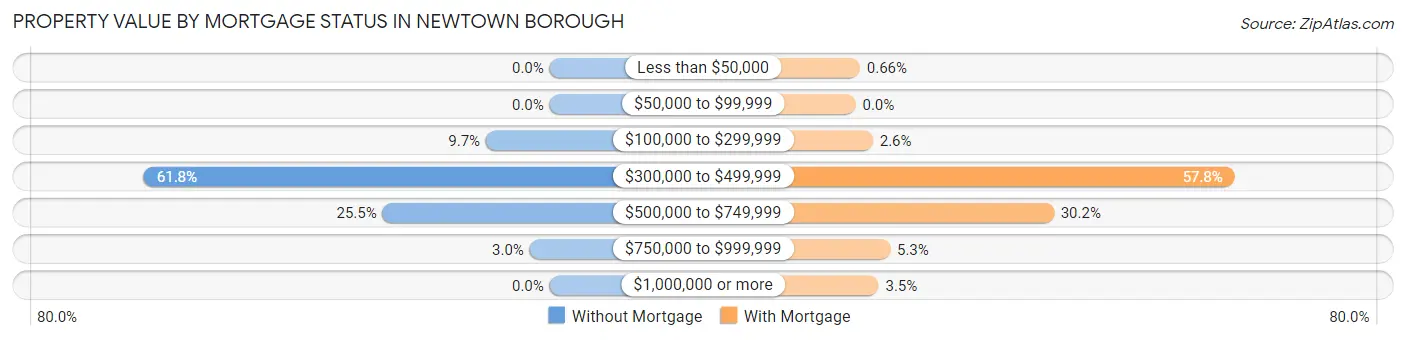
| Property Value | Without Mortgage | With Mortgage |
| Less than $50,000 | 0 (0.0%) | 3 (0.7%) |
| $50,000 to $99,999 | 0 (0.0%) | 0 (0.0%) |
| $100,000 to $299,999 | 16 (9.7%) | 12 (2.6%) |
| $300,000 to $499,999 | 102 (61.8%) | 264 (57.8%) |
| $500,000 to $749,999 | 42 (25.5%) | 138 (30.2%) |
| $750,000 to $999,999 | 5 (3.0%) | 24 (5.2%) |
| $1,000,000 or more | 0 (0.0%) | 16 (3.5%) |
| Total | 165 (100.0%) | 457 (100.0%) |
Household Income by Mortgage Status in Newtown borough
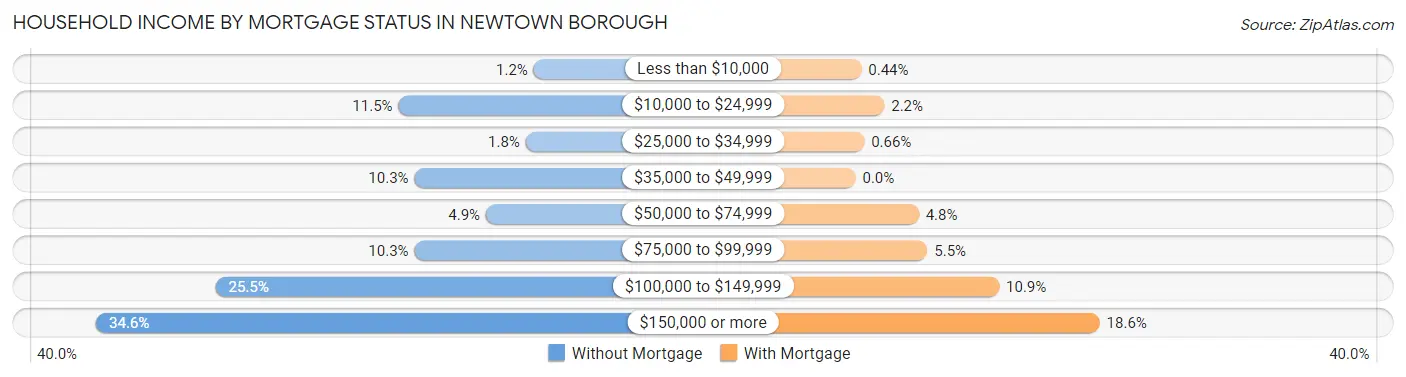
| Household Income | Without Mortgage | With Mortgage |
| Less than $10,000 | 2 (1.2%) | 2 (0.4%) |
| $10,000 to $24,999 | 19 (11.5%) | 10 (2.2%) |
| $25,000 to $34,999 | 3 (1.8%) | 3 (0.7%) |
| $35,000 to $49,999 | 17 (10.3%) | 0 (0.0%) |
| $50,000 to $74,999 | 8 (4.9%) | 22 (4.8%) |
| $75,000 to $99,999 | 17 (10.3%) | 25 (5.5%) |
| $100,000 to $149,999 | 42 (25.5%) | 50 (10.9%) |
| $150,000 or more | 57 (34.5%) | 85 (18.6%) |
| Total | 165 (100.0%) | 457 (100.0%) |
Property Value to Household Income Ratio in Newtown borough
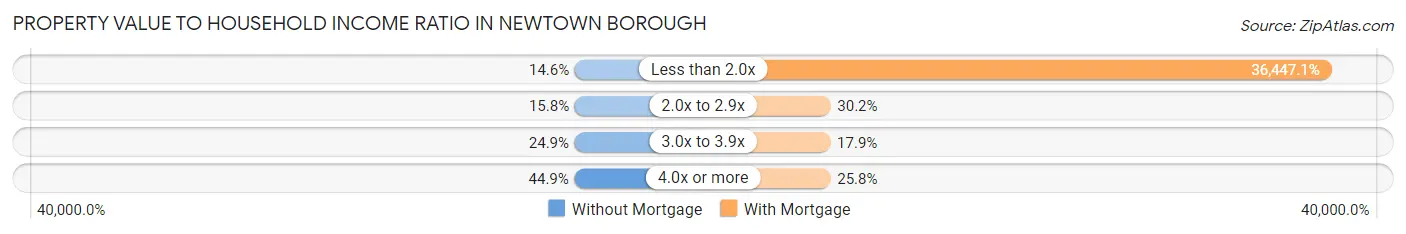
| Value-to-Income Ratio | Without Mortgage | With Mortgage |
| Less than 2.0x | 24 (14.5%) | 166,563 (36,447.1%) |
| 2.0x to 2.9x | 26 (15.8%) | 138 (30.2%) |
| 3.0x to 3.9x | 41 (24.8%) | 82 (17.9%) |
| 4.0x or more | 74 (44.9%) | 118 (25.8%) |
| Total | 165 (100.0%) | 457 (100.0%) |
Real Estate Taxes by Mortgage Status in Newtown borough
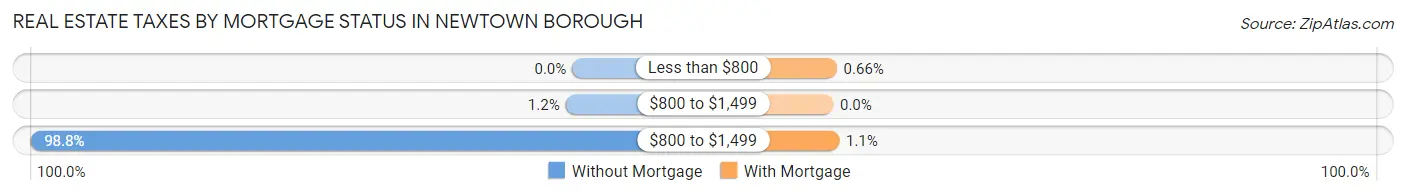
| Property Taxes | Without Mortgage | With Mortgage |
| Less than $800 | 0 (0.0%) | 3 (0.7%) |
| $800 to $1,499 | 2 (1.2%) | 0 (0.0%) |
| $800 to $1,499 | 163 (98.8%) | 5 (1.1%) |
| Total | 165 (100.0%) | 457 (100.0%) |
Health & Disability in Newtown borough
Health Insurance Coverage by Age in Newtown borough
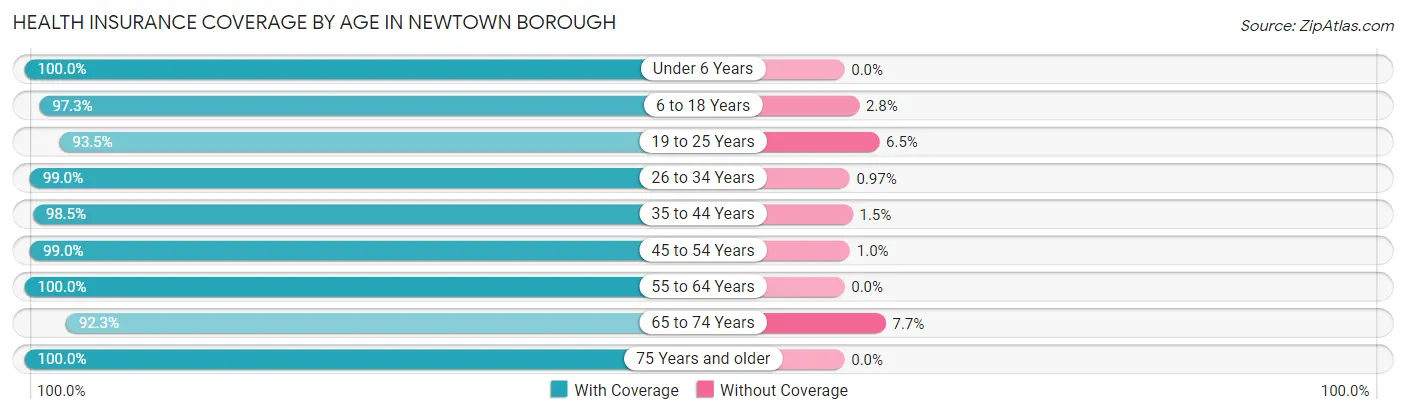
| Age Bracket | With Coverage | Without Coverage |
| Under 6 Years | 104 (100.0%) | 0 (0.0%) |
| 6 to 18 Years | 354 (97.3%) | 10 (2.8%) |
| 19 to 25 Years | 144 (93.5%) | 10 (6.5%) |
| 26 to 34 Years | 204 (99.0%) | 2 (1.0%) |
| 35 to 44 Years | 192 (98.5%) | 3 (1.5%) |
| 45 to 54 Years | 286 (99.0%) | 3 (1.0%) |
| 55 to 64 Years | 275 (100.0%) | 0 (0.0%) |
| 65 to 74 Years | 216 (92.3%) | 18 (7.7%) |
| 75 Years and older | 138 (100.0%) | 0 (0.0%) |
| Total | 1,913 (97.7%) | 46 (2.4%) |
Health Insurance Coverage by Citizenship Status in Newtown borough
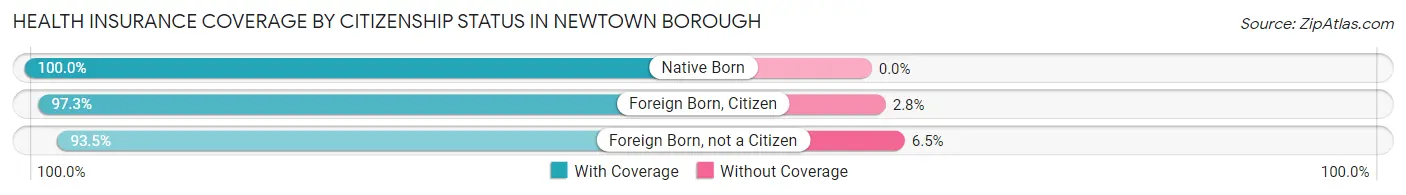
| Citizenship Status | With Coverage | Without Coverage |
| Native Born | 104 (100.0%) | 0 (0.0%) |
| Foreign Born, Citizen | 354 (97.3%) | 10 (2.8%) |
| Foreign Born, not a Citizen | 144 (93.5%) | 10 (6.5%) |
Health Insurance Coverage by Household Income in Newtown borough
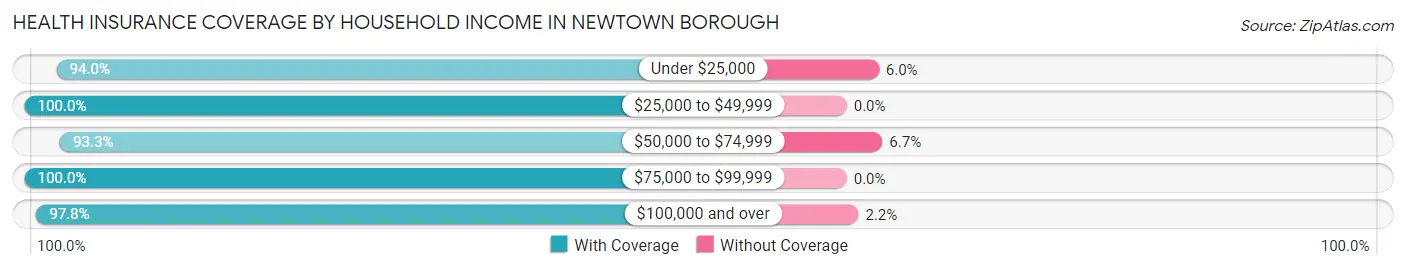
| Household Income | With Coverage | Without Coverage |
| Under $25,000 | 47 (94.0%) | 3 (6.0%) |
| $25,000 to $49,999 | 101 (100.0%) | 0 (0.0%) |
| $50,000 to $74,999 | 140 (93.3%) | 10 (6.7%) |
| $75,000 to $99,999 | 144 (100.0%) | 0 (0.0%) |
| $100,000 and over | 1,470 (97.8%) | 33 (2.2%) |
Public vs Private Health Insurance Coverage by Age in Newtown borough
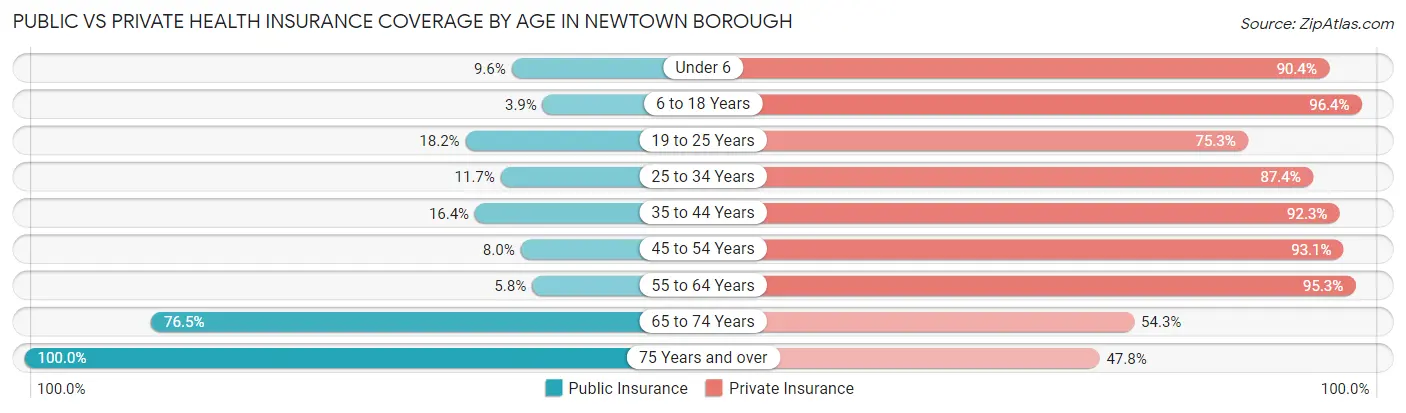
| Age Bracket | Public Insurance | Private Insurance |
| Under 6 | 10 (9.6%) | 94 (90.4%) |
| 6 to 18 Years | 14 (3.8%) | 351 (96.4%) |
| 19 to 25 Years | 28 (18.2%) | 116 (75.3%) |
| 25 to 34 Years | 24 (11.7%) | 180 (87.4%) |
| 35 to 44 Years | 32 (16.4%) | 180 (92.3%) |
| 45 to 54 Years | 23 (8.0%) | 269 (93.1%) |
| 55 to 64 Years | 16 (5.8%) | 262 (95.3%) |
| 65 to 74 Years | 179 (76.5%) | 127 (54.3%) |
| 75 Years and over | 138 (100.0%) | 66 (47.8%) |
| Total | 464 (23.7%) | 1,645 (84.0%) |
Disability Status by Sex by Age in Newtown borough
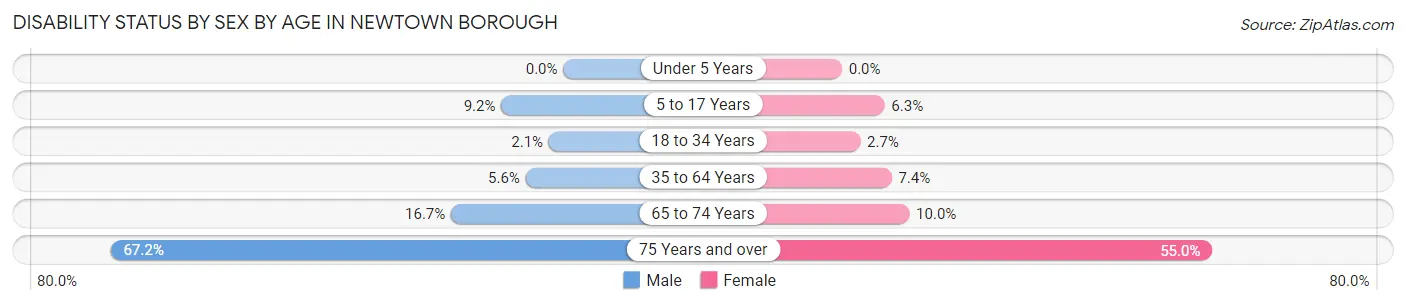
| Age Bracket | Male | Female |
| Under 5 Years | 0 (0.0%) | 0 (0.0%) |
| 5 to 17 Years | 14 (9.2%) | 14 (6.3%) |
| 18 to 34 Years | 5 (2.1%) | 4 (2.7%) |
| 35 to 64 Years | 19 (5.6%) | 31 (7.4%) |
| 65 to 74 Years | 24 (16.7%) | 9 (10.0%) |
| 75 Years and over | 39 (67.2%) | 44 (55.0%) |
Disability Class by Sex by Age in Newtown borough
Disability Class: Hearing Difficulty
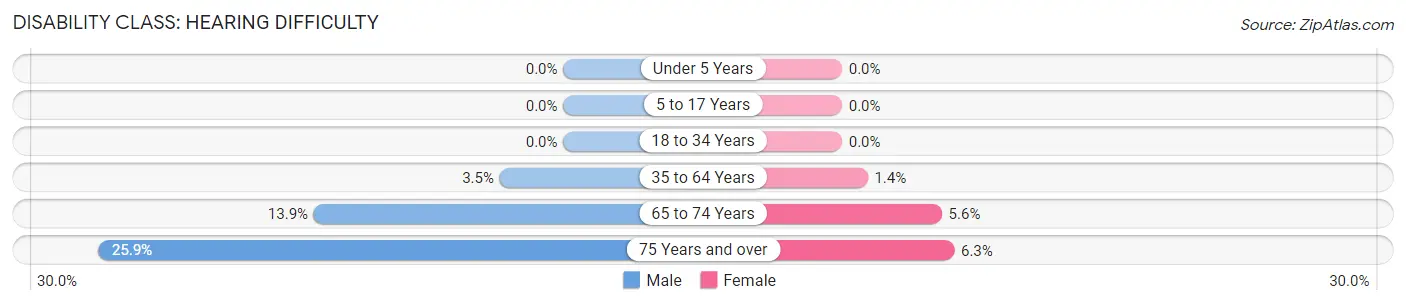
| Age Bracket | Male | Female |
| Under 5 Years | 0 (0.0%) | 0 (0.0%) |
| 5 to 17 Years | 0 (0.0%) | 0 (0.0%) |
| 18 to 34 Years | 0 (0.0%) | 0 (0.0%) |
| 35 to 64 Years | 12 (3.5%) | 6 (1.4%) |
| 65 to 74 Years | 20 (13.9%) | 5 (5.6%) |
| 75 Years and over | 15 (25.9%) | 5 (6.2%) |
Disability Class: Vision Difficulty
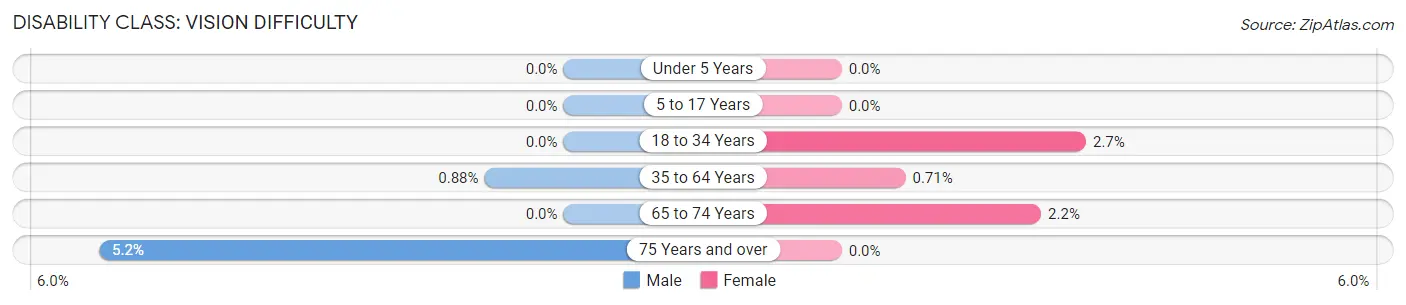
| Age Bracket | Male | Female |
| Under 5 Years | 0 (0.0%) | 0 (0.0%) |
| 5 to 17 Years | 0 (0.0%) | 0 (0.0%) |
| 18 to 34 Years | 0 (0.0%) | 4 (2.7%) |
| 35 to 64 Years | 3 (0.9%) | 3 (0.7%) |
| 65 to 74 Years | 0 (0.0%) | 2 (2.2%) |
| 75 Years and over | 3 (5.2%) | 0 (0.0%) |
Disability Class: Cognitive Difficulty
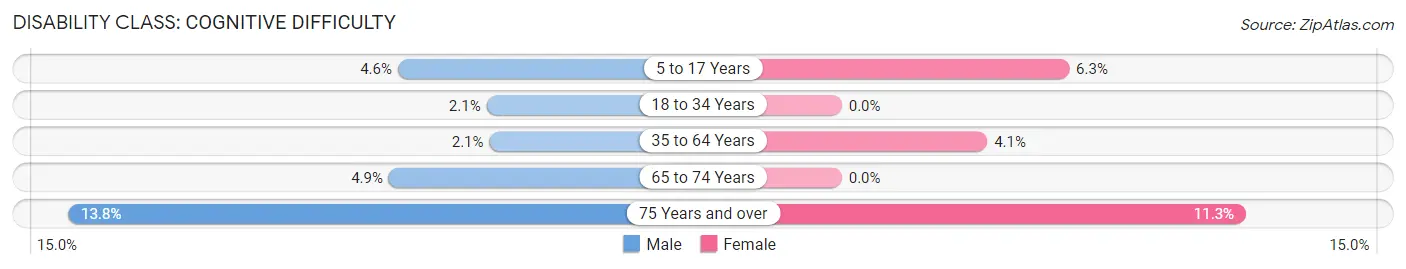
| Age Bracket | Male | Female |
| 5 to 17 Years | 7 (4.6%) | 14 (6.3%) |
| 18 to 34 Years | 5 (2.1%) | 0 (0.0%) |
| 35 to 64 Years | 7 (2.1%) | 17 (4.1%) |
| 65 to 74 Years | 7 (4.9%) | 0 (0.0%) |
| 75 Years and over | 8 (13.8%) | 9 (11.3%) |
Disability Class: Ambulatory Difficulty
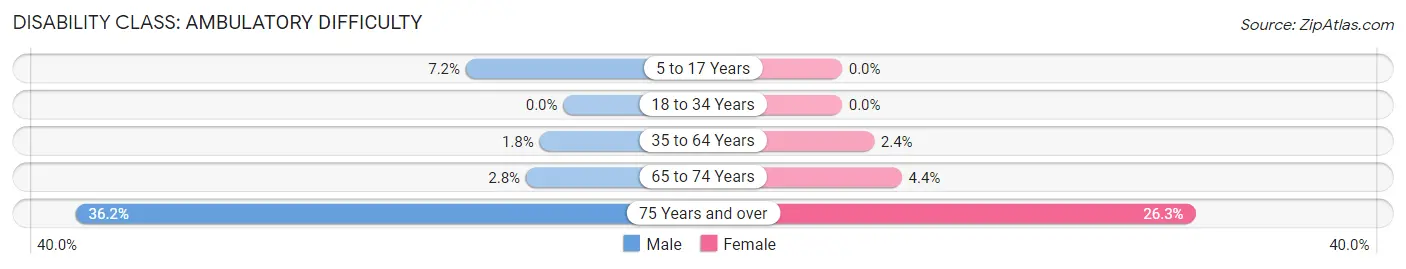
| Age Bracket | Male | Female |
| 5 to 17 Years | 11 (7.2%) | 0 (0.0%) |
| 18 to 34 Years | 0 (0.0%) | 0 (0.0%) |
| 35 to 64 Years | 6 (1.8%) | 10 (2.4%) |
| 65 to 74 Years | 4 (2.8%) | 4 (4.4%) |
| 75 Years and over | 21 (36.2%) | 21 (26.3%) |
Disability Class: Self-Care Difficulty
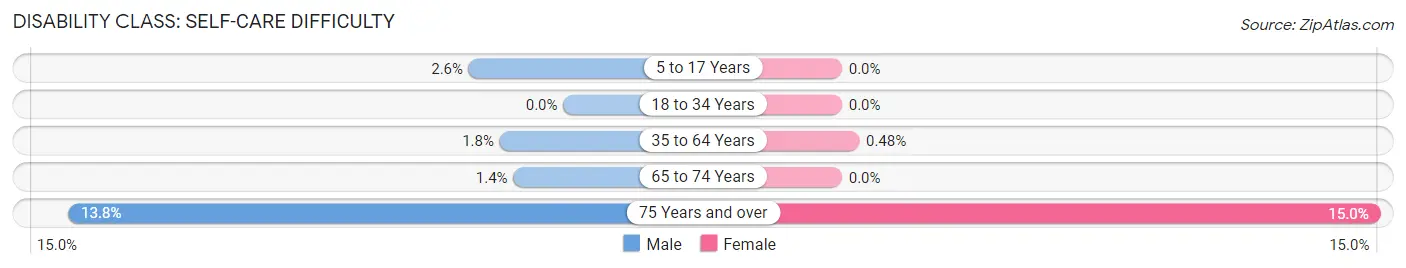
| Age Bracket | Male | Female |
| 5 to 17 Years | 4 (2.6%) | 0 (0.0%) |
| 18 to 34 Years | 0 (0.0%) | 0 (0.0%) |
| 35 to 64 Years | 6 (1.8%) | 2 (0.5%) |
| 65 to 74 Years | 2 (1.4%) | 0 (0.0%) |
| 75 Years and over | 8 (13.8%) | 12 (15.0%) |
Technology Access in Newtown borough
Computing Device Access in Newtown borough
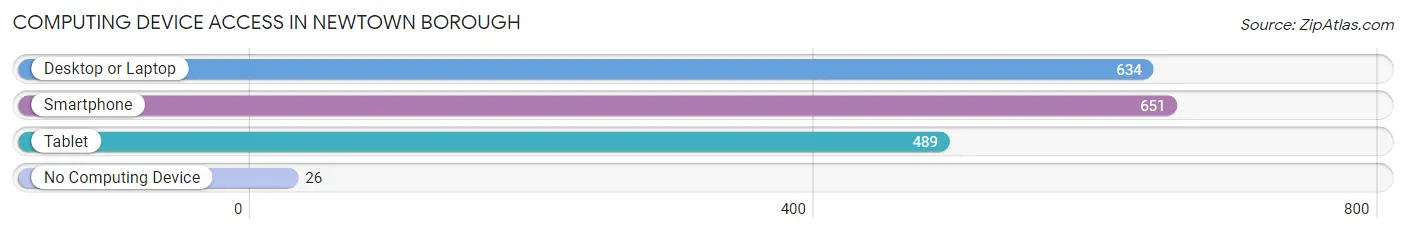
| Device Type | # Households | % Households |
| Desktop or Laptop | 634 | 91.0% |
| Smartphone | 651 | 93.4% |
| Tablet | 489 | 70.2% |
| No Computing Device | 26 | 3.7% |
| Total | 697 | 100.0% |
Internet Access in Newtown borough
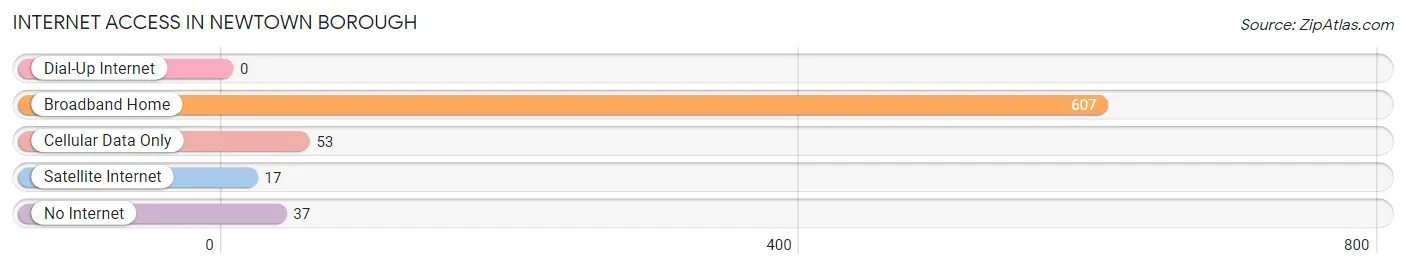
| Internet Type | # Households | % Households |
| Dial-Up Internet | 0 | 0.0% |
| Broadband Home | 607 | 87.1% |
| Cellular Data Only | 53 | 7.6% |
| Satellite Internet | 17 | 2.4% |
| No Internet | 37 | 5.3% |
| Total | 697 | 100.0% |
Newtown borough Summary
Newtown Borough is a small town located in Bucks County, Pennsylvania. It is situated in the heart of Bucks County, approximately 25 miles north of Philadelphia. The town is bordered by the townships of Upper Makefield, Lower Makefield, and Wrightstown. Newtown Borough is a part of the larger Newtown Township, which is the largest municipality in Bucks County.
History
Newtown Borough was founded in 1711 by William Penn, who was the founder of Pennsylvania. The town was originally known as “New Town” and was the first settlement in Bucks County. The town was laid out in a grid pattern, with the main street running east-west and the cross streets running north-south. The town was named after the town of Newtown in Wales, which was the birthplace of William Penn’s father.
The town was an important stop on the stagecoach route between Philadelphia and New York City. The town was also a major stop on the Underground Railroad, which was used by escaped slaves to travel to freedom in the North.
In the late 19th century, Newtown Borough became a popular summer resort destination for wealthy Philadelphians. The town was home to several large hotels, including the Newtown Hotel, which was built in 1876.
Geography
Newtown Borough is located in the heart of Bucks County, approximately 25 miles north of Philadelphia. The town is bordered by the townships of Upper Makefield, Lower Makefield, and Wrightstown. The town is situated on the banks of the Neshaminy Creek, which flows through the center of the town.
The town is located in the Delaware Valley, which is a region of low-lying hills and valleys. The town is located in the Piedmont region of Pennsylvania, which is characterized by rolling hills and valleys.
Economy
Newtown Borough is a small town with a population of approximately 2,500 people. The town is primarily a residential community, with most of the population employed in the service sector. The town is home to several small businesses, including restaurants, retail stores, and professional services.
The town is also home to several large employers, including the Newtown Square Shopping Center, which is the largest shopping center in Bucks County. The shopping center is home to several large retailers, including Target, Walmart, and Home Depot.
Demographics
As of the 2010 census, the population of Newtown Borough was 2,497. The racial makeup of the town was 94.3% White, 2.2% African American, 0.3% Native American, 1.2% Asian, 0.1% Pacific Islander, 0.7% from other races, and 1.3% from two or more races. Hispanic or Latino of any race were 2.3% of the population.
The median household income in Newtown Borough was $76,944, and the median family income was $90,944. The per capita income for the town was $35,944. About 4.2% of families and 5.3% of the population were below the poverty line, including 6.3% of those under age 18 and 4.2% of those age 65 or over.
Common Questions
What is Per Capita Income in Newtown borough?
Per Capita income in Newtown borough is $63,639.
What is the Median Family Income in Newtown borough?
Median Family Income in Newtown borough is $165,625.
What is the Median Household income in Newtown borough?
Median Household Income in Newtown borough is $144,375.
What is Income or Wage Gap in Newtown borough?
Income or Wage Gap in Newtown borough is 8.6%.
Women in Newtown borough earn 91.4 cents for every dollar earned by a man.
What is Inequality or Gini Index in Newtown borough?
Inequality or Gini Index in Newtown borough is 0.41.
What is the Total Population of Newtown borough?
Total Population of Newtown borough is 1,959.
What is the Total Male Population of Newtown borough?
Total Male Population of Newtown borough is 959.
What is the Total Female Population of Newtown borough?
Total Female Population of Newtown borough is 1,000.
What is the Ratio of Males per 100 Females in Newtown borough?
There are 95.90 Males per 100 Females in Newtown borough.
What is the Ratio of Females per 100 Males in Newtown borough?
There are 104.28 Females per 100 Males in Newtown borough.
What is the Median Population Age in Newtown borough?
Median Population Age in Newtown borough is 43.7 Years.
What is the Average Family Size in Newtown borough
Average Family Size in Newtown borough is 3.2 People.
What is the Average Household Size in Newtown borough
Average Household Size in Newtown borough is 2.8 People.
How Large is the Labor Force in Newtown borough?
There are 1,101 People in the Labor Forcein in Newtown borough.
What is the Percentage of People in the Labor Force in Newtown borough?
69.0% of People are in the Labor Force in Newtown borough.
What is the Unemployment Rate in Newtown borough?
Unemployment Rate in Newtown borough is 3.4%.