Naugatuck borough, CT Map & Demographics
Naugatuck borough Overview
$42,211
PER CAPITA INCOME
$110,521
AVG FAMILY INCOME
$91,145
AVG HOUSEHOLD INCOME
27.5%
WAGE / INCOME GAP [ % ]
72.5¢/ $1
WAGE / INCOME GAP [ $ ]
0.40
INEQUALITY / GINI INDEX
31,653
TOTAL POPULATION
16,367
MALE POPULATION
15,286
FEMALE POPULATION
107.07
MALES / 100 FEMALES
93.40
FEMALES / 100 MALES
38.7
MEDIAN AGE
3.1
AVG FAMILY SIZE
2.6
AVG HOUSEHOLD SIZE
18,878
LABOR FORCE [ PEOPLE ]
70.7%
PERCENT IN LABOR FORCE
5.5%
UNEMPLOYMENT RATE
Income in Naugatuck borough
Income Overview in Naugatuck borough
Per Capita Income in Naugatuck borough is $42,211, while median incomes of families and households are $110,521 and $91,145 respectively.
| Characteristic | Number | Measure |
| Per Capita Income | 31,653 | $42,211 |
| Median Family Income | 8,030 | $110,521 |
| Mean Family Income | 8,030 | $123,161 |
| Median Household Income | 12,257 | $91,145 |
| Mean Household Income | 12,257 | $107,465 |
| Income Deficit | 8,030 | $0 |
| Wage / Income Gap (%) | 31,653 | 27.45% |
| Wage / Income Gap ($) | 31,653 | 72.55¢ per $1 |
| Gini / Inequality Index | 31,653 | 0.40 |
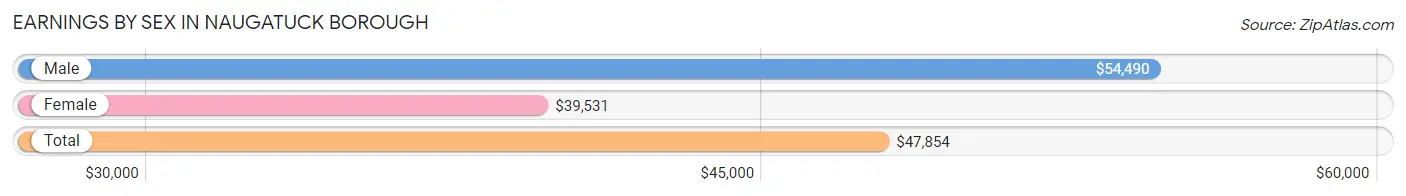
Earnings by Sex in Naugatuck borough
Average Earnings in Naugatuck borough are $47,854, $54,490 for men and $39,531 for women, a difference of 27.5%.
| Sex | Number | Average Earnings |
| Male | 10,040 (53.0%) | $54,490 |
| Female | 8,888 (47.0%) | $39,531 |
| Total | 18,928 (100.0%) | $47,854 |
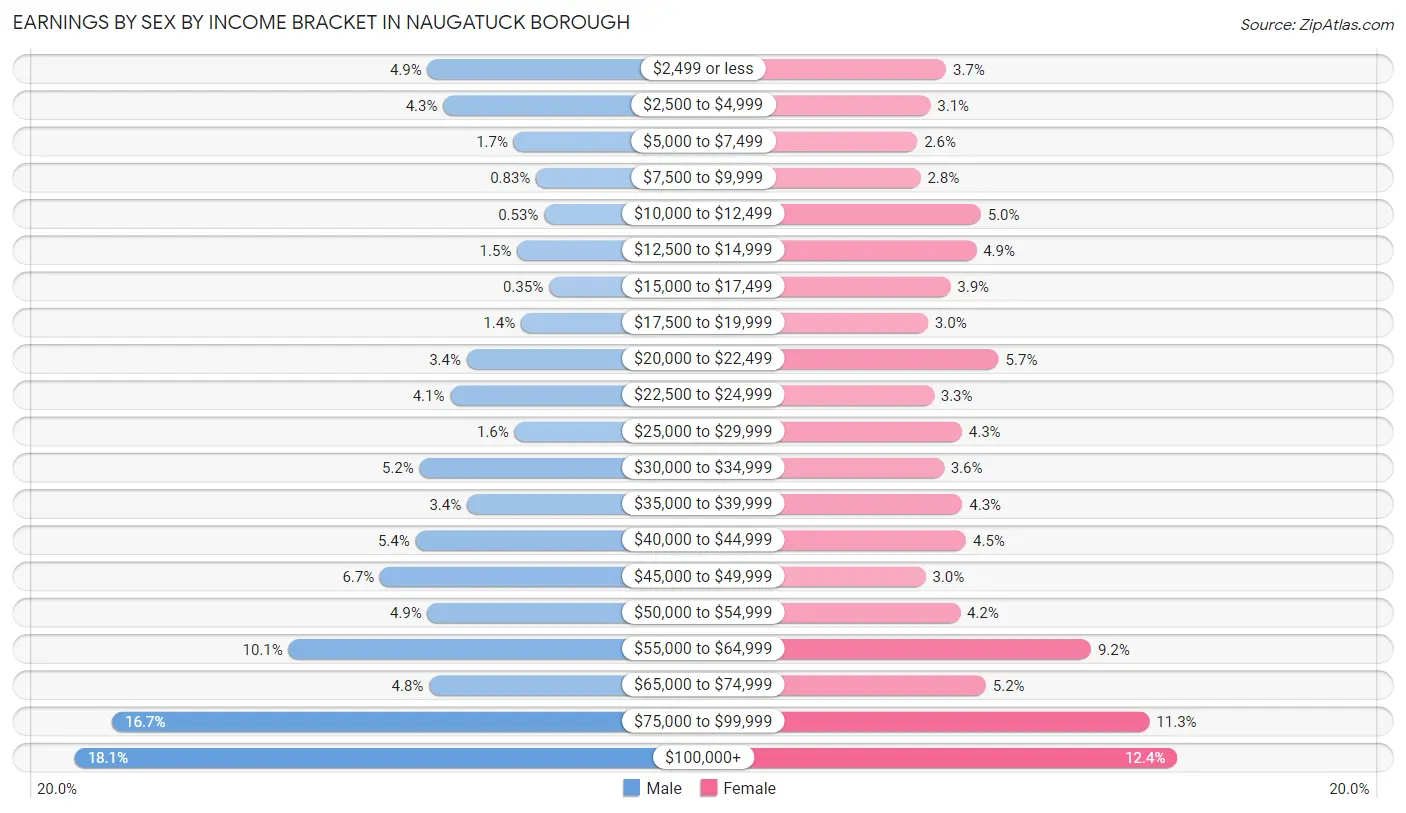
Earnings by Sex by Income Bracket in Naugatuck borough
The most common earnings brackets in Naugatuck borough are $100,000+ for men (1,819 | 18.1%) and $100,000+ for women (1,100 | 12.4%).
| Income | Male | Female |
| $2,499 or less | 492 (4.9%) | 331 (3.7%) |
| $2,500 to $4,999 | 433 (4.3%) | 278 (3.1%) |
| $5,000 to $7,499 | 168 (1.7%) | 235 (2.6%) |
| $7,500 to $9,999 | 83 (0.8%) | 245 (2.8%) |
| $10,000 to $12,499 | 53 (0.5%) | 446 (5.0%) |
| $12,500 to $14,999 | 155 (1.5%) | 431 (4.9%) |
| $15,000 to $17,499 | 35 (0.4%) | 345 (3.9%) |
| $17,500 to $19,999 | 141 (1.4%) | 270 (3.0%) |
| $20,000 to $22,499 | 344 (3.4%) | 506 (5.7%) |
| $22,500 to $24,999 | 407 (4.1%) | 290 (3.3%) |
| $25,000 to $29,999 | 165 (1.6%) | 383 (4.3%) |
| $30,000 to $34,999 | 522 (5.2%) | 323 (3.6%) |
| $35,000 to $39,999 | 343 (3.4%) | 385 (4.3%) |
| $40,000 to $44,999 | 537 (5.3%) | 397 (4.5%) |
| $45,000 to $49,999 | 671 (6.7%) | 262 (2.9%) |
| $50,000 to $54,999 | 492 (4.9%) | 377 (4.2%) |
| $55,000 to $64,999 | 1,015 (10.1%) | 813 (9.1%) |
| $65,000 to $74,999 | 486 (4.8%) | 463 (5.2%) |
| $75,000 to $99,999 | 1,679 (16.7%) | 1,008 (11.3%) |
| $100,000+ | 1,819 (18.1%) | 1,100 (12.4%) |
| Total | 10,040 (100.0%) | 8,888 (100.0%) |
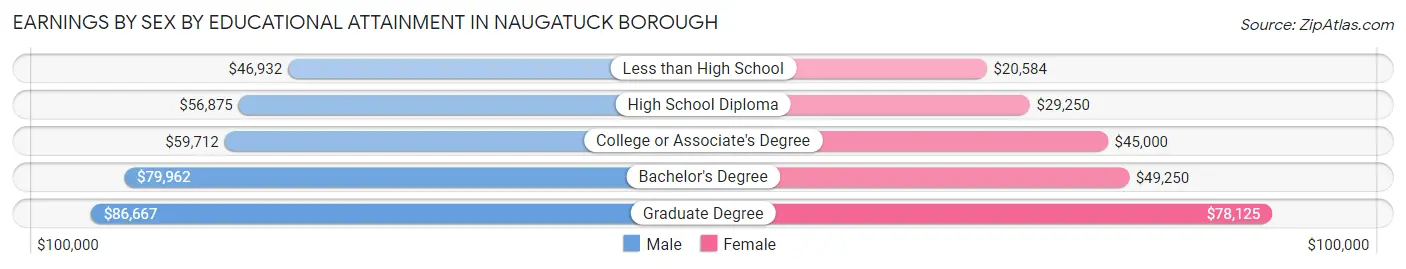
Earnings by Sex by Educational Attainment in Naugatuck borough
Average earnings in Naugatuck borough are $61,066 for men and $48,250 for women, a difference of 21.0%. Men with an educational attainment of graduate degree enjoy the highest average annual earnings of $86,667, while those with less than high school education earn the least with $46,932. Women with an educational attainment of graduate degree earn the most with the average annual earnings of $78,125, while those with less than high school education have the smallest earnings of $20,584.
| Educational Attainment | Male Income | Female Income |
| Less than High School | $46,932 | $20,584 |
| High School Diploma | $56,875 | $29,250 |
| College or Associate's Degree | $59,712 | $45,000 |
| Bachelor's Degree | $79,962 | $49,250 |
| Graduate Degree | $86,667 | $78,125 |
| Total | $61,066 | $48,250 |
Family Income in Naugatuck borough
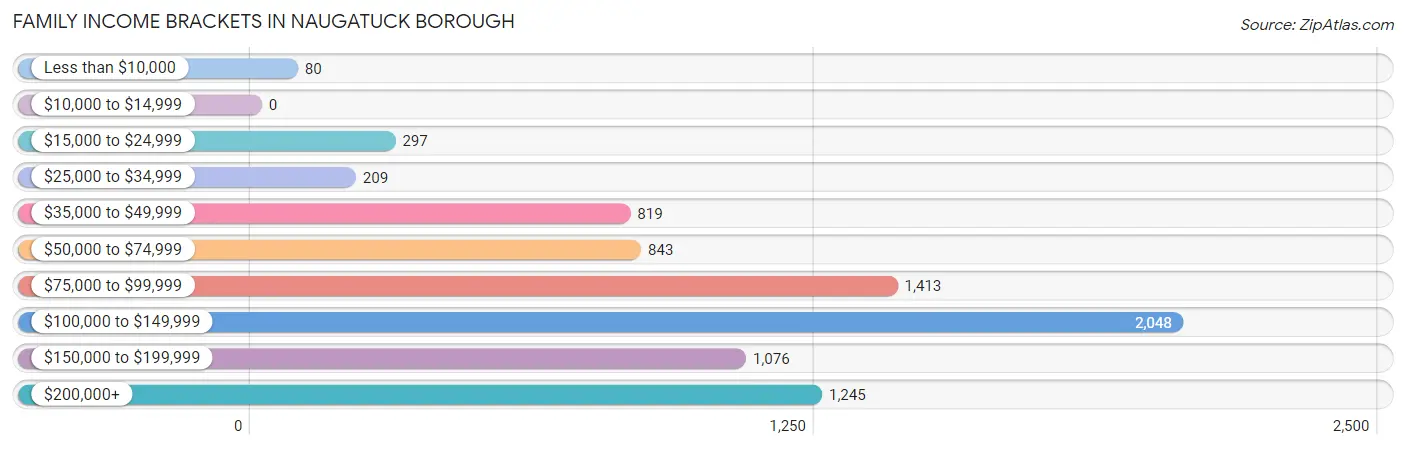
Family Income Brackets in Naugatuck borough
According to the Naugatuck borough family income data, there are 2,048 families falling into the $100,000 to $149,999 income range, which is the most common income bracket and makes up 25.5% of all families.
| Income Bracket | # Families | % Families |
| Less than $10,000 | 80 | 1.0% |
| $10,000 to $14,999 | 0 | 0.0% |
| $15,000 to $24,999 | 297 | 3.7% |
| $25,000 to $34,999 | 209 | 2.6% |
| $35,000 to $49,999 | 819 | 10.2% |
| $50,000 to $74,999 | 843 | 10.5% |
| $75,000 to $99,999 | 1,413 | 17.6% |
| $100,000 to $149,999 | 2,048 | 25.5% |
| $150,000 to $199,999 | 1,076 | 13.4% |
| $200,000+ | 1,245 | 15.5% |
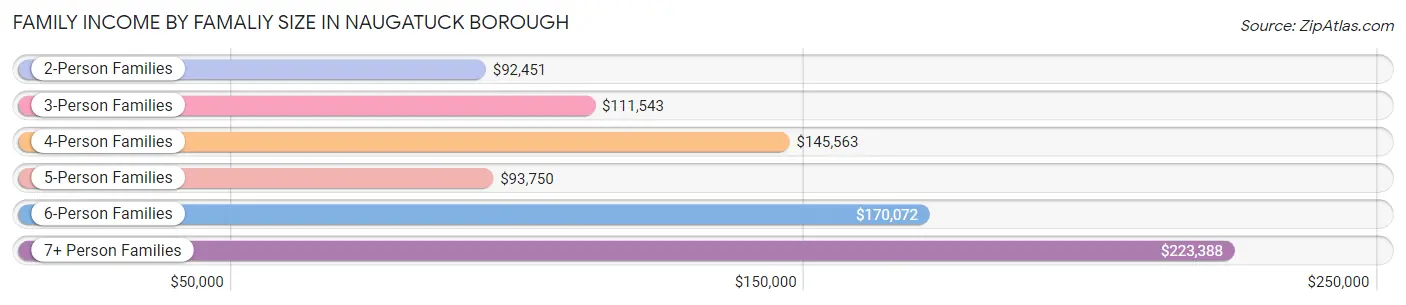
Family Income by Famaliy Size in Naugatuck borough
7+ person families (156 | 1.9%) account for the highest median family income in Naugatuck borough with $223,388 per family, while 2-person families (3,801 | 47.3%) have the highest median income of $46,226 per family member.
| Income Bracket | # Families | Median Income |
| 2-Person Families | 3,801 (47.3%) | $92,451 |
| 3-Person Families | 1,758 (21.9%) | $111,543 |
| 4-Person Families | 1,527 (19.0%) | $145,563 |
| 5-Person Families | 567 (7.1%) | $93,750 |
| 6-Person Families | 221 (2.8%) | $170,072 |
| 7+ Person Families | 156 (1.9%) | $223,388 |
| Total | 8,030 (100.0%) | $110,521 |
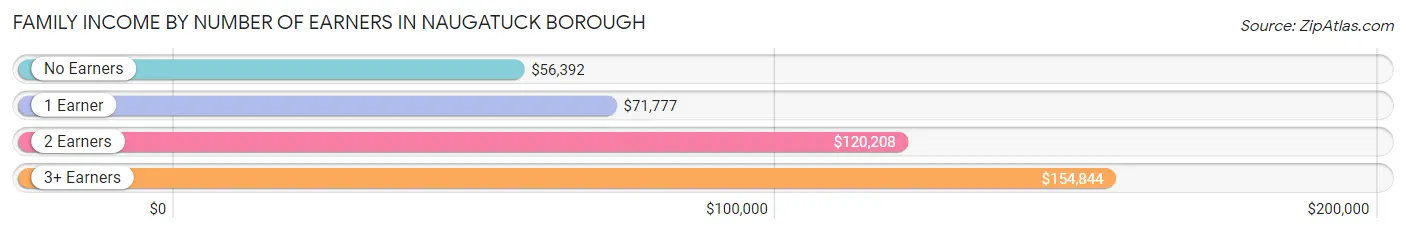
Family Income by Number of Earners in Naugatuck borough
The median family income in Naugatuck borough is $110,521, with families comprising 3+ earners (1,459) having the highest median family income of $154,844, while families with no earners (805) have the lowest median family income of $56,392, accounting for 18.2% and 10.0% of families, respectively.
| Number of Earners | # Families | Median Income |
| No Earners | 805 (10.0%) | $56,392 |
| 1 Earner | 2,042 (25.4%) | $71,777 |
| 2 Earners | 3,724 (46.4%) | $120,208 |
| 3+ Earners | 1,459 (18.2%) | $154,844 |
| Total | 8,030 (100.0%) | $110,521 |
Household Income in Naugatuck borough
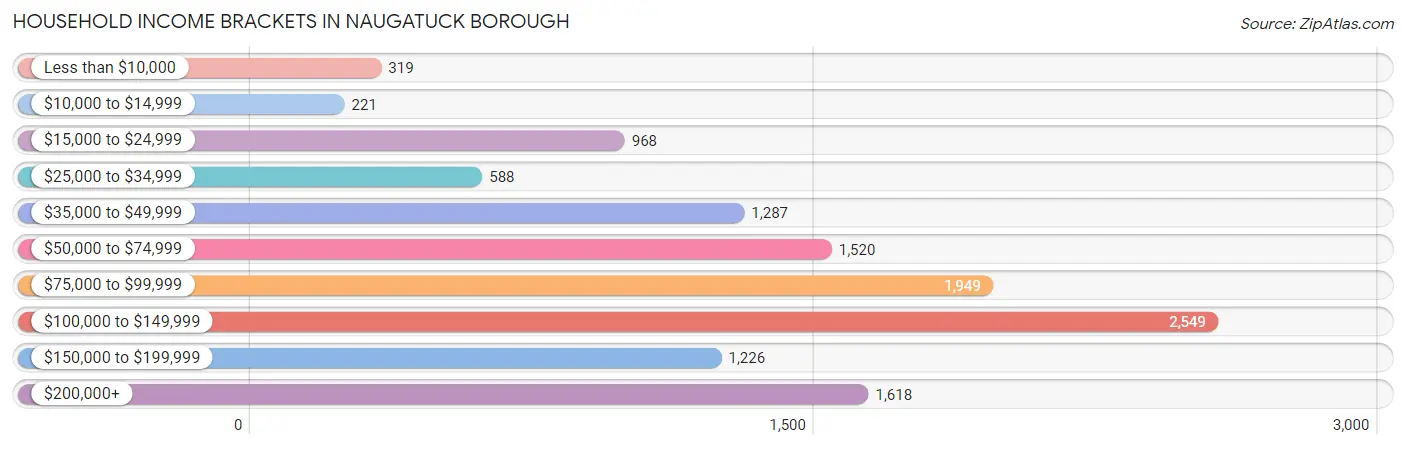
Household Income Brackets in Naugatuck borough
With 2,549 households falling in the category, the $100,000 to $149,999 income range is the most frequent in Naugatuck borough, accounting for 20.8% of all households. In contrast, only 221 households (1.8%) fall into the $10,000 to $14,999 income bracket, making it the least populous group.
| Income Bracket | # Households | % Households |
| Less than $10,000 | 319 | 2.6% |
| $10,000 to $14,999 | 221 | 1.8% |
| $15,000 to $24,999 | 968 | 7.9% |
| $25,000 to $34,999 | 588 | 4.8% |
| $35,000 to $49,999 | 1,287 | 10.5% |
| $50,000 to $74,999 | 1,520 | 12.4% |
| $75,000 to $99,999 | 1,949 | 15.9% |
| $100,000 to $149,999 | 2,549 | 20.8% |
| $150,000 to $199,999 | 1,226 | 10.0% |
| $200,000+ | 1,618 | 13.2% |
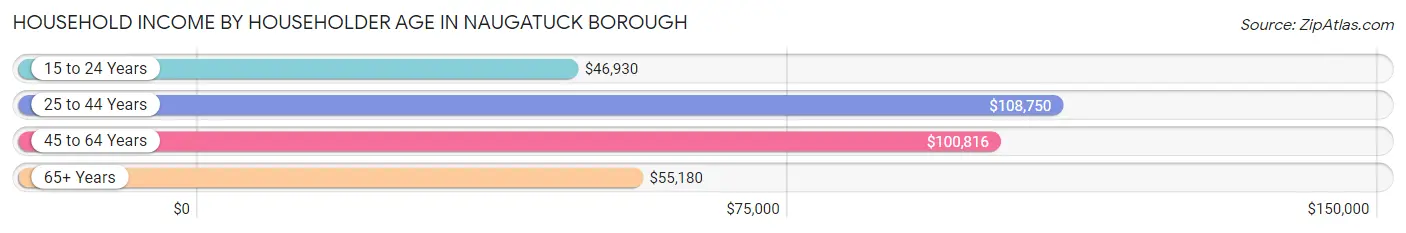
Household Income by Householder Age in Naugatuck borough
The median household income in Naugatuck borough is $91,145, with the highest median household income of $108,750 found in the 25 to 44 years age bracket for the primary householder. A total of 4,214 households (34.4%) fall into this category. Meanwhile, the 15 to 24 years age bracket for the primary householder has the lowest median household income of $46,930, with 363 households (3.0%) in this group.
| Income Bracket | # Households | Median Income |
| 15 to 24 Years | 363 (3.0%) | $46,930 |
| 25 to 44 Years | 4,214 (34.4%) | $108,750 |
| 45 to 64 Years | 5,103 (41.6%) | $100,816 |
| 65+ Years | 2,577 (21.0%) | $55,180 |
| Total | 12,257 (100.0%) | $91,145 |
Poverty in Naugatuck borough
Income Below Poverty by Sex and Age in Naugatuck borough
With 4.5% poverty level for males and 6.5% for females among the residents of Naugatuck borough, 15 year old males and 75 year old and over females are the most vulnerable to poverty, with 77 males (29.7%) and 139 females (14.6%) in their respective age groups living below the poverty level.
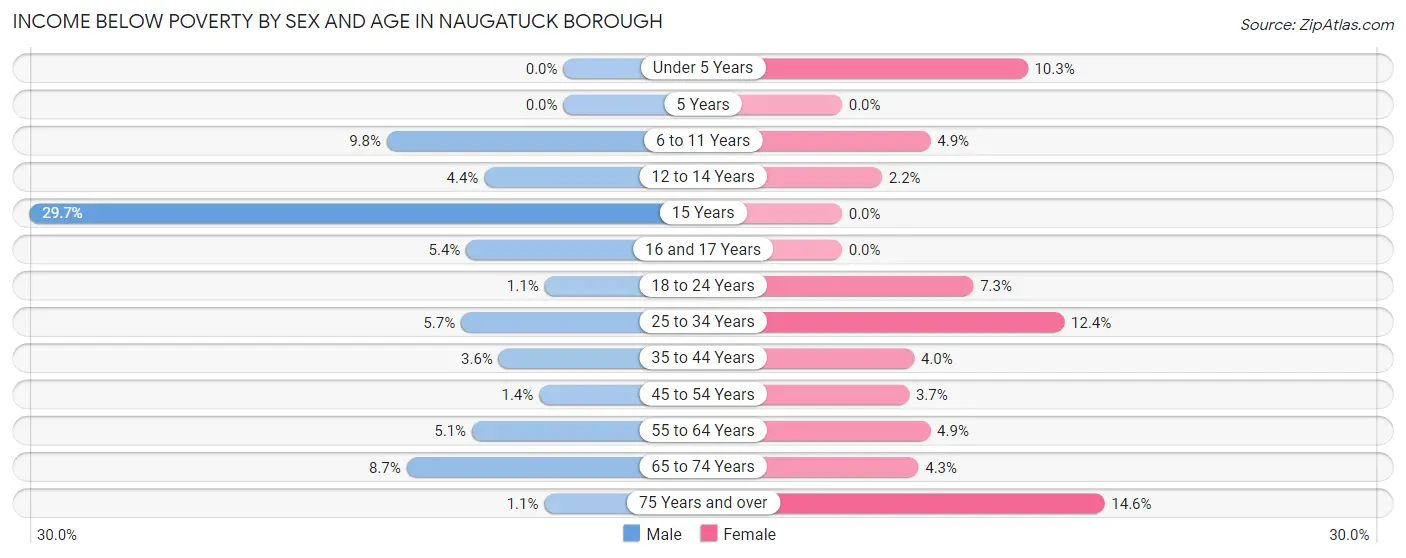
| Age Bracket | Male | Female |
| Under 5 Years | 0 (0.0%) | 73 (10.3%) |
| 5 Years | 0 (0.0%) | 0 (0.0%) |
| 6 to 11 Years | 88 (9.8%) | 42 (4.9%) |
| 12 to 14 Years | 28 (4.4%) | 8 (2.2%) |
| 15 Years | 77 (29.7%) | 0 (0.0%) |
| 16 and 17 Years | 42 (5.4%) | 0 (0.0%) |
| 18 to 24 Years | 17 (1.1%) | 102 (7.3%) |
| 25 to 34 Years | 142 (5.7%) | 276 (12.4%) |
| 35 to 44 Years | 88 (3.6%) | 87 (4.0%) |
| 45 to 54 Years | 27 (1.3%) | 75 (3.7%) |
| 55 to 64 Years | 113 (5.1%) | 123 (4.9%) |
| 65 to 74 Years | 107 (8.7%) | 55 (4.3%) |
| 75 Years and over | 8 (1.1%) | 139 (14.6%) |
| Total | 737 (4.5%) | 980 (6.5%) |
Income Above Poverty by Sex and Age in Naugatuck borough
According to the poverty statistics in Naugatuck borough, males aged under 5 years and females aged 5 years are the age groups that are most secure financially, with 100.0% of males and 100.0% of females in these age groups living above the poverty line.
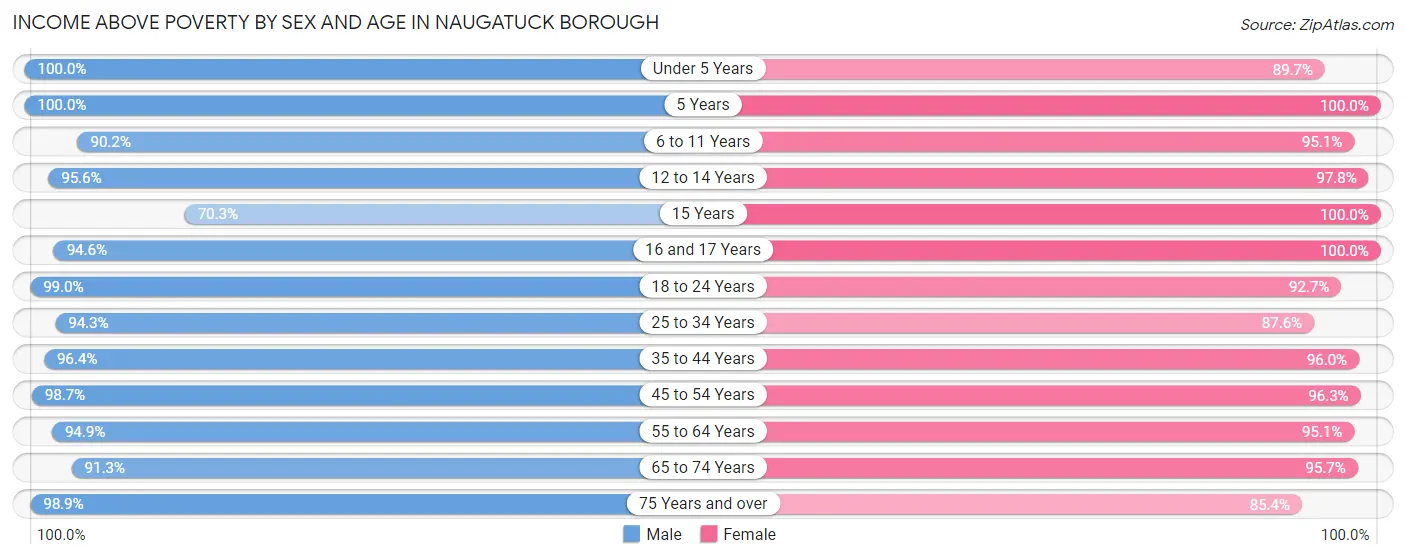
| Age Bracket | Male | Female |
| Under 5 Years | 879 (100.0%) | 633 (89.7%) |
| 5 Years | 75 (100.0%) | 48 (100.0%) |
| 6 to 11 Years | 807 (90.2%) | 810 (95.1%) |
| 12 to 14 Years | 607 (95.6%) | 350 (97.8%) |
| 15 Years | 182 (70.3%) | 133 (100.0%) |
| 16 and 17 Years | 734 (94.6%) | 418 (100.0%) |
| 18 to 24 Years | 1,597 (99.0%) | 1,291 (92.7%) |
| 25 to 34 Years | 2,350 (94.3%) | 1,953 (87.6%) |
| 35 to 44 Years | 2,358 (96.4%) | 2,076 (96.0%) |
| 45 to 54 Years | 1,978 (98.7%) | 1,930 (96.3%) |
| 55 to 64 Years | 2,109 (94.9%) | 2,379 (95.1%) |
| 65 to 74 Years | 1,118 (91.3%) | 1,236 (95.7%) |
| 75 Years and over | 748 (98.9%) | 812 (85.4%) |
| Total | 15,542 (95.5%) | 14,069 (93.5%) |
Income Below Poverty Among Married-Couple Families in Naugatuck borough
The poverty statistics for married-couple families in Naugatuck borough show that 1.3% or 83 of the total 6,180 families live below the poverty line. Families with 3 or 4 children have the highest poverty rate of 2.6%, comprising of 11 families. On the other hand, families with 1 or 2 children have the lowest poverty rate of 0.0%, which includes 0 families.
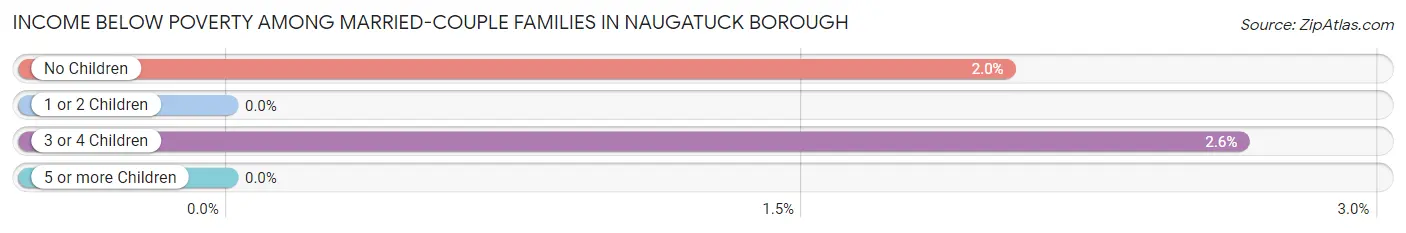
| Children | Above Poverty | Below Poverty |
| No Children | 3,481 (98.0%) | 72 (2.0%) |
| 1 or 2 Children | 2,210 (100.0%) | 0 (0.0%) |
| 3 or 4 Children | 406 (97.4%) | 11 (2.6%) |
| 5 or more Children | 0 (0.0%) | 0 (0.0%) |
| Total | 6,097 (98.7%) | 83 (1.3%) |
Income Below Poverty Among Single-Parent Households in Naugatuck borough
According to the poverty data in Naugatuck borough, 6.9% or 37 single-father households and 7.5% or 99 single-mother households are living below the poverty line. Among single-father households, those with 1 or 2 children have the highest poverty rate, with 37 households (11.5%) experiencing poverty. Likewise, among single-mother households, those with 3 or 4 children have the highest poverty rate, with 68 households (100.0%) falling below the poverty line.
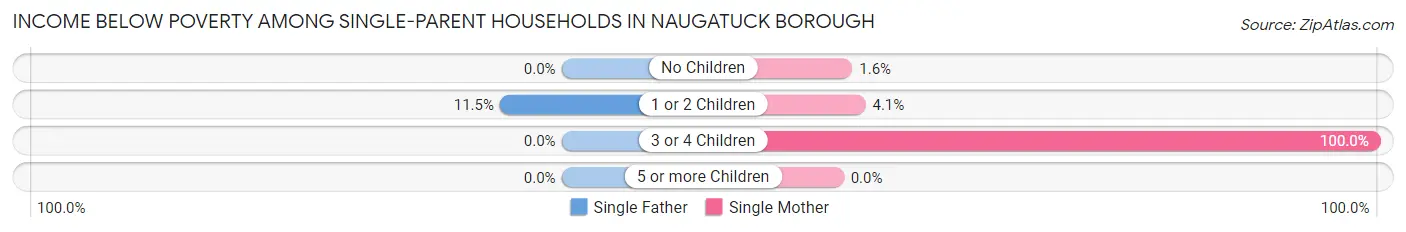
| Children | Single Father | Single Mother |
| No Children | 0 (0.0%) | 13 (1.6%) |
| 1 or 2 Children | 37 (11.5%) | 18 (4.1%) |
| 3 or 4 Children | 0 (0.0%) | 68 (100.0%) |
| 5 or more Children | 0 (0.0%) | 0 (0.0%) |
| Total | 37 (6.9%) | 99 (7.5%) |
Income Below Poverty Among Married-Couple vs Single-Parent Households in Naugatuck borough
The poverty data for Naugatuck borough shows that 83 of the married-couple family households (1.3%) and 136 of the single-parent households (7.3%) are living below the poverty level. Within the married-couple family households, those with 3 or 4 children have the highest poverty rate, with 11 households (2.6%) falling below the poverty line. Among the single-parent households, those with 3 or 4 children have the highest poverty rate, with 68 household (100.0%) living below poverty.
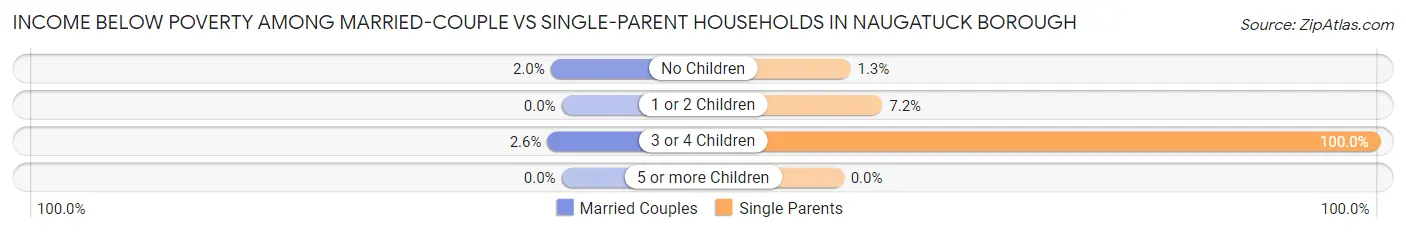
| Children | Married-Couple Families | Single-Parent Households |
| No Children | 72 (2.0%) | 13 (1.3%) |
| 1 or 2 Children | 0 (0.0%) | 55 (7.2%) |
| 3 or 4 Children | 11 (2.6%) | 68 (100.0%) |
| 5 or more Children | 0 (0.0%) | 0 (0.0%) |
| Total | 83 (1.3%) | 136 (7.3%) |
Race in Naugatuck borough
The most populous races in Naugatuck borough are White / Caucasian (21,460 | 67.8%), Hispanic or Latino (5,050 | 16.0%), and Black / African American (4,033 | 12.7%).
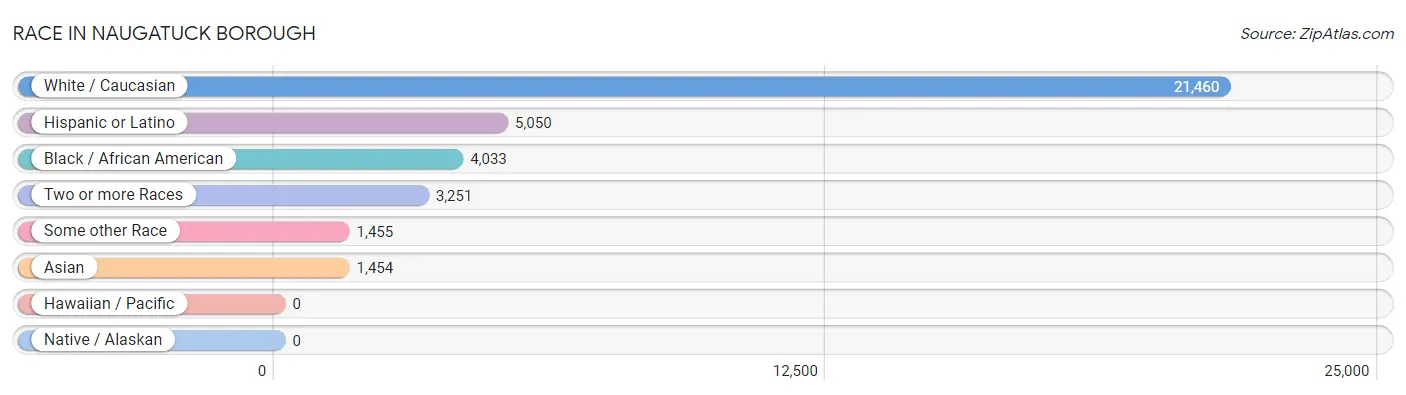
| Race | # Population | % Population |
| Asian | 1,454 | 4.6% |
| Black / African American | 4,033 | 12.7% |
| Hawaiian / Pacific | 0 | 0.0% |
| Hispanic or Latino | 5,050 | 16.0% |
| Native / Alaskan | 0 | 0.0% |
| White / Caucasian | 21,460 | 67.8% |
| Two or more Races | 3,251 | 10.3% |
| Some other Race | 1,455 | 4.6% |
| Total | 31,653 | 100.0% |
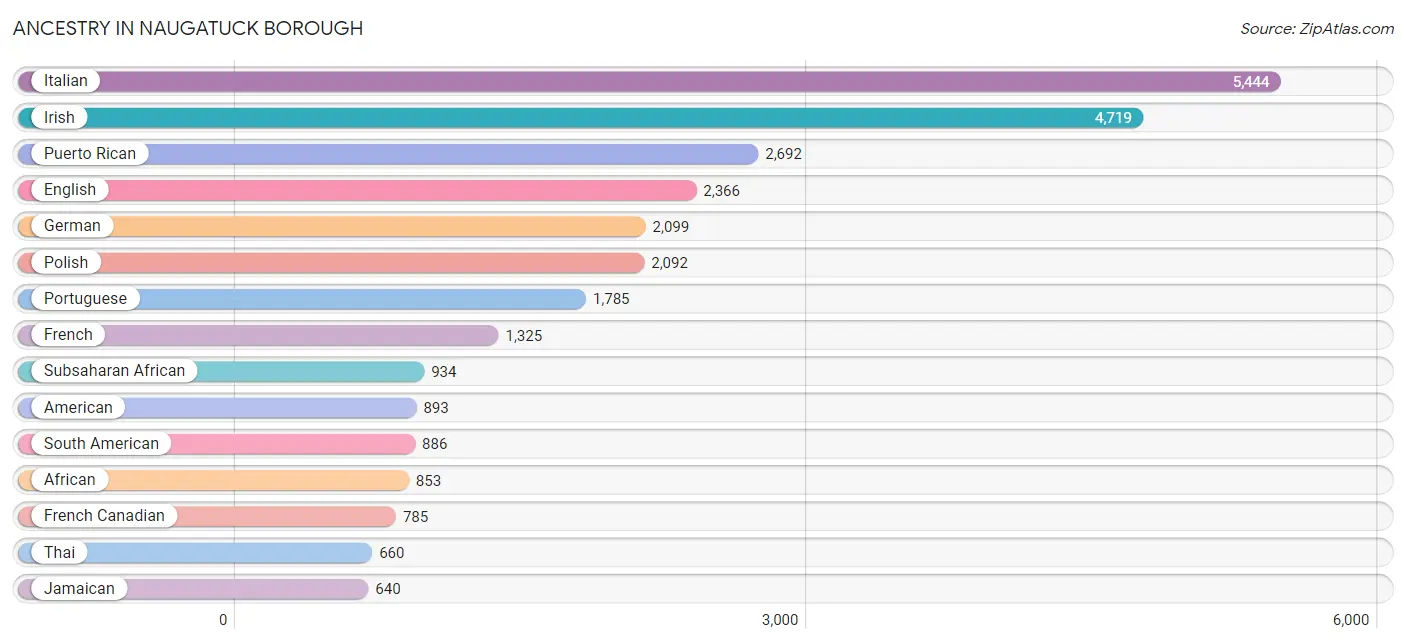
Ancestry in Naugatuck borough
The most populous ancestries reported in Naugatuck borough are Italian (5,444 | 17.2%), Irish (4,719 | 14.9%), Puerto Rican (2,692 | 8.5%), English (2,366 | 7.5%), and German (2,099 | 6.6%), together accounting for 54.7% of all Naugatuck borough residents.
| Ancestry | # Population | % Population |
| African | 853 | 2.7% |
| Albanian | 139 | 0.4% |
| American | 893 | 2.8% |
| Arab | 132 | 0.4% |
| Armenian | 10 | 0.0% |
| Austrian | 149 | 0.5% |
| Belgian | 15 | 0.1% |
| Brazilian | 601 | 1.9% |
| British | 35 | 0.1% |
| Burmese | 171 | 0.5% |
| Canadian | 114 | 0.4% |
| Central American | 211 | 0.7% |
| Central American Indian | 95 | 0.3% |
| Colombian | 447 | 1.4% |
| Cuban | 116 | 0.4% |
| Czech | 30 | 0.1% |
| Czechoslovakian | 9 | 0.0% |
| Danish | 56 | 0.2% |
| Dominican | 370 | 1.2% |
| Dutch | 43 | 0.1% |
| Eastern European | 128 | 0.4% |
| Ecuadorian | 279 | 0.9% |
| Egyptian | 6 | 0.0% |
| English | 2,366 | 7.5% |
| European | 413 | 1.3% |
| Filipino | 61 | 0.2% |
| French | 1,325 | 4.2% |
| French Canadian | 785 | 2.5% |
| German | 2,099 | 6.6% |
| Ghanaian | 66 | 0.2% |
| Greek | 100 | 0.3% |
| Guatemalan | 111 | 0.4% |
| Guyanese | 16 | 0.1% |
| Haitian | 45 | 0.1% |
| Hungarian | 379 | 1.2% |
| Indian (Asian) | 357 | 1.1% |
| Irish | 4,719 | 14.9% |
| Italian | 5,444 | 17.2% |
| Jamaican | 640 | 2.0% |
| Korean | 92 | 0.3% |
| Latvian | 13 | 0.0% |
| Lebanese | 17 | 0.1% |
| Lithuanian | 443 | 1.4% |
| Mexican | 202 | 0.6% |
| Moroccan | 32 | 0.1% |
| Nicaraguan | 19 | 0.1% |
| Norwegian | 25 | 0.1% |
| Pennsylvania German | 11 | 0.0% |
| Peruvian | 21 | 0.1% |
| Polish | 2,092 | 6.6% |
| Portuguese | 1,785 | 5.6% |
| Puerto Rican | 2,692 | 8.5% |
| Romanian | 29 | 0.1% |
| Russian | 252 | 0.8% |
| Salvadoran | 81 | 0.3% |
| Scandinavian | 94 | 0.3% |
| Scotch-Irish | 98 | 0.3% |
| Scottish | 234 | 0.7% |
| Slavic | 11 | 0.0% |
| Slovak | 150 | 0.5% |
| Slovene | 9 | 0.0% |
| South American | 886 | 2.8% |
| Spaniard | 16 | 0.1% |
| Spanish | 157 | 0.5% |
| Spanish American | 38 | 0.1% |
| Sri Lankan | 75 | 0.2% |
| Subsaharan African | 934 | 2.9% |
| Swedish | 208 | 0.7% |
| Swiss | 81 | 0.3% |
| Syrian | 11 | 0.0% |
| Thai | 660 | 2.1% |
| Turkish | 60 | 0.2% |
| Ukrainian | 223 | 0.7% |
| Venezuelan | 139 | 0.4% |
| Welsh | 74 | 0.2% |
| West Indian | 37 | 0.1% |
| Yugoslavian | 173 | 0.5% | View All 77 Rows |
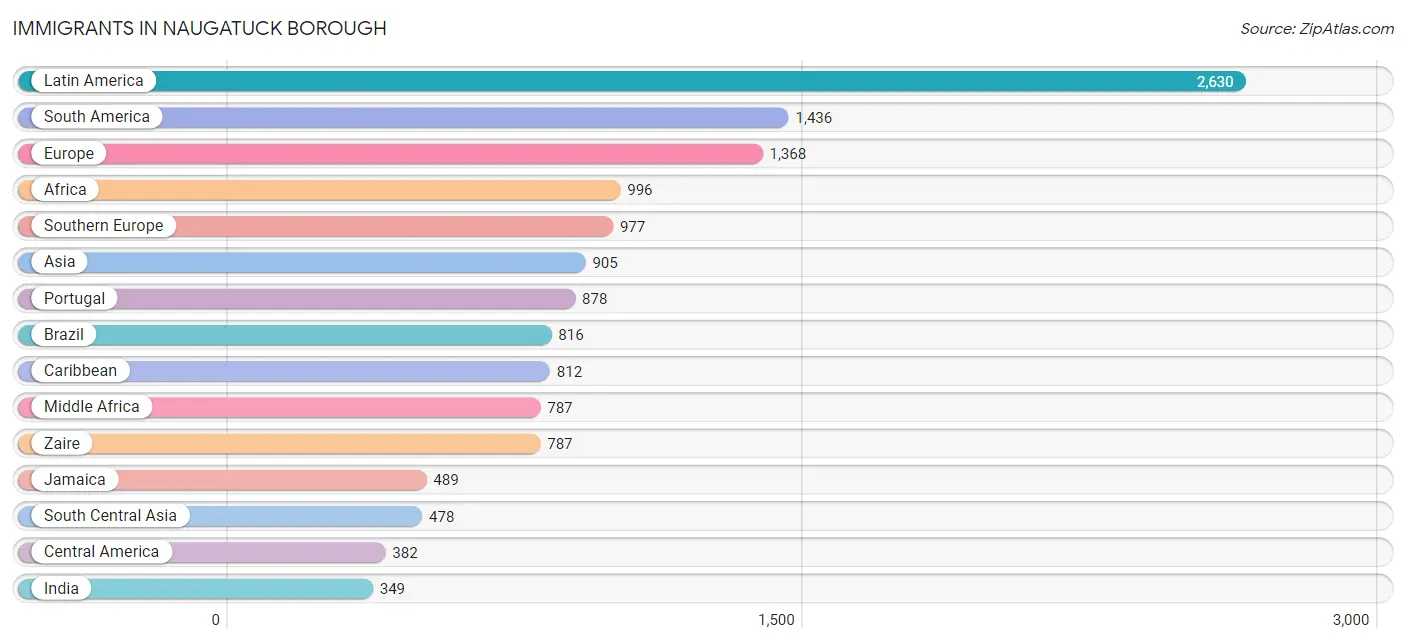
Immigrants in Naugatuck borough
The most numerous immigrant groups reported in Naugatuck borough came from Latin America (2,630 | 8.3%), South America (1,436 | 4.5%), Europe (1,368 | 4.3%), Africa (996 | 3.2%), and Southern Europe (977 | 3.1%), together accounting for 23.4% of all Naugatuck borough residents.
| Immigration Origin | # Population | % Population |
| Africa | 996 | 3.2% |
| Albania | 28 | 0.1% |
| Asia | 905 | 2.9% |
| Belarus | 20 | 0.1% |
| Brazil | 816 | 2.6% |
| Canada | 70 | 0.2% |
| Caribbean | 812 | 2.6% |
| Central America | 382 | 1.2% |
| China | 185 | 0.6% |
| Colombia | 276 | 0.9% |
| Cuba | 53 | 0.2% |
| Dominica | 15 | 0.1% |
| Dominican Republic | 229 | 0.7% |
| Eastern Asia | 229 | 0.7% |
| Eastern Europe | 322 | 1.0% |
| Ecuador | 158 | 0.5% |
| Egypt | 6 | 0.0% |
| El Salvador | 67 | 0.2% |
| England | 16 | 0.1% |
| Europe | 1,368 | 4.3% |
| Germany | 3 | 0.0% |
| Ghana | 54 | 0.2% |
| Guatemala | 111 | 0.4% |
| Guyana | 16 | 0.1% |
| Haiti | 26 | 0.1% |
| Honduras | 124 | 0.4% |
| Hungary | 36 | 0.1% |
| India | 349 | 1.1% |
| Iran | 14 | 0.0% |
| Ireland | 22 | 0.1% |
| Italy | 99 | 0.3% |
| Jamaica | 489 | 1.5% |
| Korea | 44 | 0.1% |
| Laos | 40 | 0.1% |
| Latin America | 2,630 | 8.3% |
| Lithuania | 66 | 0.2% |
| Mexico | 80 | 0.3% |
| Middle Africa | 787 | 2.5% |
| Morocco | 11 | 0.0% |
| Netherlands | 28 | 0.1% |
| North Macedonia | 14 | 0.0% |
| Northern Africa | 155 | 0.5% |
| Northern Europe | 38 | 0.1% |
| Pakistan | 115 | 0.4% |
| Peru | 11 | 0.0% |
| Philippines | 69 | 0.2% |
| Poland | 158 | 0.5% |
| Portugal | 878 | 2.8% |
| South America | 1,436 | 4.5% |
| South Central Asia | 478 | 1.5% |
| South Eastern Asia | 149 | 0.5% |
| Southern Europe | 977 | 3.1% |
| Taiwan | 102 | 0.3% |
| Turkey | 49 | 0.2% |
| Venezuela | 159 | 0.5% |
| Vietnam | 14 | 0.0% |
| Western Africa | 54 | 0.2% |
| Western Asia | 49 | 0.2% |
| Western Europe | 31 | 0.1% |
| Zaire | 787 | 2.5% | View All 60 Rows |
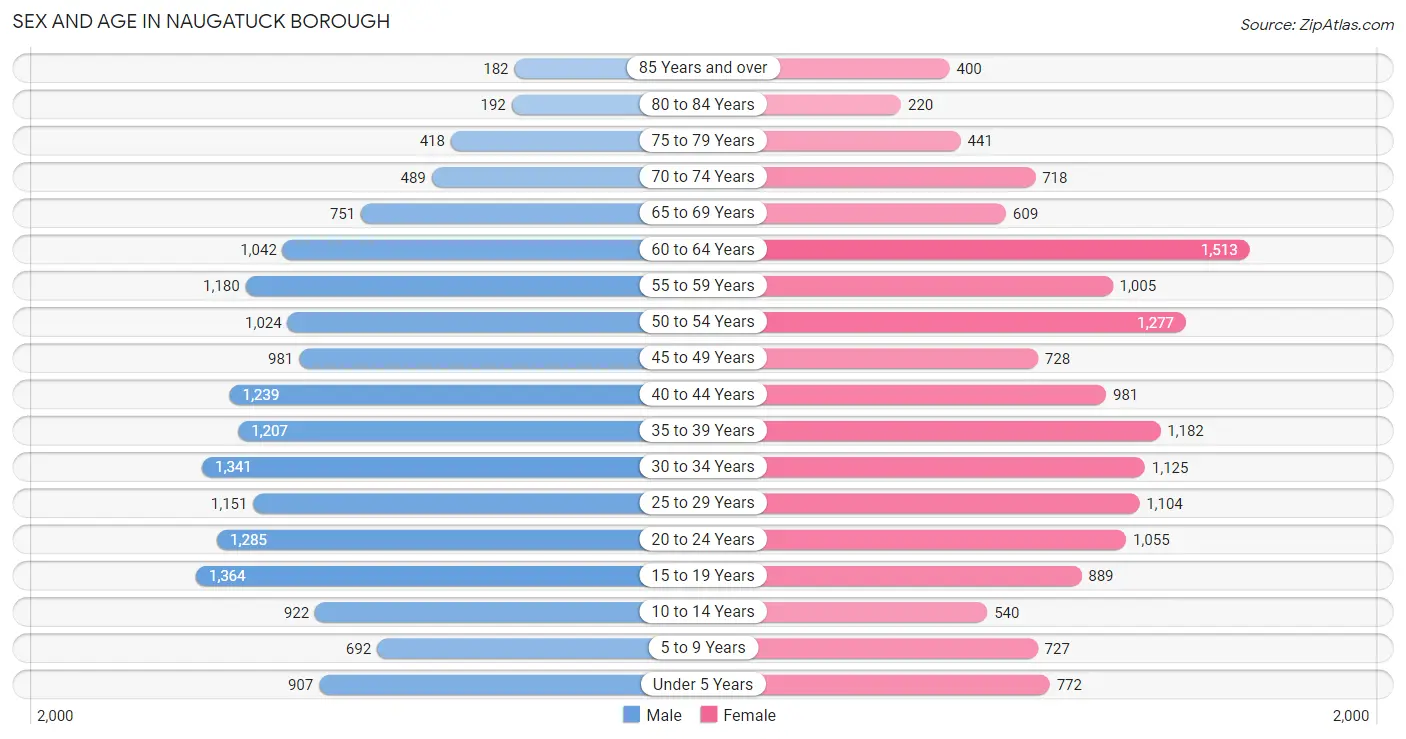
Sex and Age in Naugatuck borough
Sex and Age in Naugatuck borough
The most populous age groups in Naugatuck borough are 15 to 19 Years (1,364 | 8.3%) for men and 60 to 64 Years (1,513 | 9.9%) for women.
| Age Bracket | Male | Female |
| Under 5 Years | 907 (5.5%) | 772 (5.1%) |
| 5 to 9 Years | 692 (4.2%) | 727 (4.8%) |
| 10 to 14 Years | 922 (5.6%) | 540 (3.5%) |
| 15 to 19 Years | 1,364 (8.3%) | 889 (5.8%) |
| 20 to 24 Years | 1,285 (7.9%) | 1,055 (6.9%) |
| 25 to 29 Years | 1,151 (7.0%) | 1,104 (7.2%) |
| 30 to 34 Years | 1,341 (8.2%) | 1,125 (7.4%) |
| 35 to 39 Years | 1,207 (7.4%) | 1,182 (7.7%) |
| 40 to 44 Years | 1,239 (7.6%) | 981 (6.4%) |
| 45 to 49 Years | 981 (6.0%) | 728 (4.8%) |
| 50 to 54 Years | 1,024 (6.3%) | 1,277 (8.4%) |
| 55 to 59 Years | 1,180 (7.2%) | 1,005 (6.6%) |
| 60 to 64 Years | 1,042 (6.4%) | 1,513 (9.9%) |
| 65 to 69 Years | 751 (4.6%) | 609 (4.0%) |
| 70 to 74 Years | 489 (3.0%) | 718 (4.7%) |
| 75 to 79 Years | 418 (2.5%) | 441 (2.9%) |
| 80 to 84 Years | 192 (1.2%) | 220 (1.4%) |
| 85 Years and over | 182 (1.1%) | 400 (2.6%) |
| Total | 16,367 (100.0%) | 15,286 (100.0%) |
Families and Households in Naugatuck borough
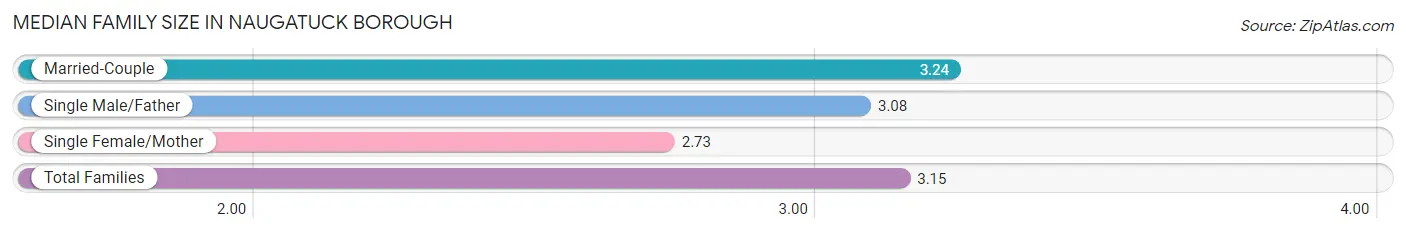
Median Family Size in Naugatuck borough
The median family size in Naugatuck borough is 3.15 persons per family, with married-couple families (6,180 | 77.0%) accounting for the largest median family size of 3.24 persons per family. On the other hand, single female/mother families (1,312 | 16.3%) represent the smallest median family size with 2.73 persons per family.
| Family Type | # Families | Family Size |
| Married-Couple | 6,180 (77.0%) | 3.24 |
| Single Male/Father | 538 (6.7%) | 3.08 |
| Single Female/Mother | 1,312 (16.3%) | 2.73 |
| Total Families | 8,030 (100.0%) | 3.15 |
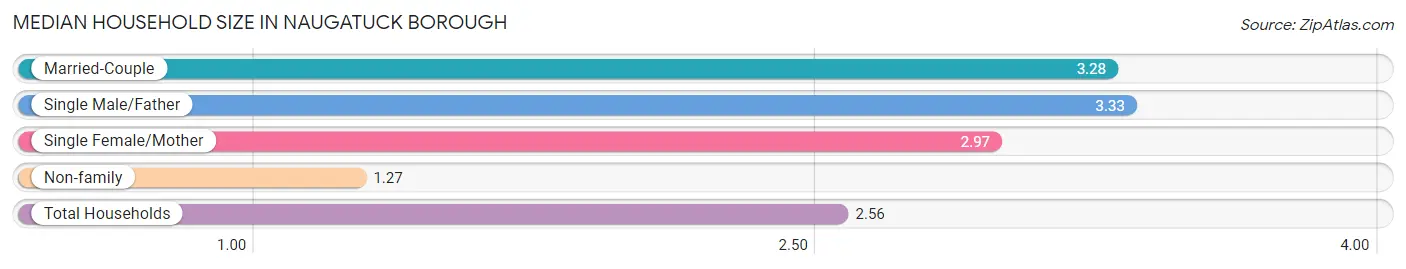
Median Household Size in Naugatuck borough
The median household size in Naugatuck borough is 2.56 persons per household, with single male/father households (538 | 4.4%) accounting for the largest median household size of 3.33 persons per household. non-family households (4,227 | 34.5%) represent the smallest median household size with 1.27 persons per household.
| Household Type | # Households | Household Size |
| Married-Couple | 6,180 (50.4%) | 3.28 |
| Single Male/Father | 538 (4.4%) | 3.33 |
| Single Female/Mother | 1,312 (10.7%) | 2.97 |
| Non-family | 4,227 (34.5%) | 1.27 |
| Total Households | 12,257 (100.0%) | 2.56 |
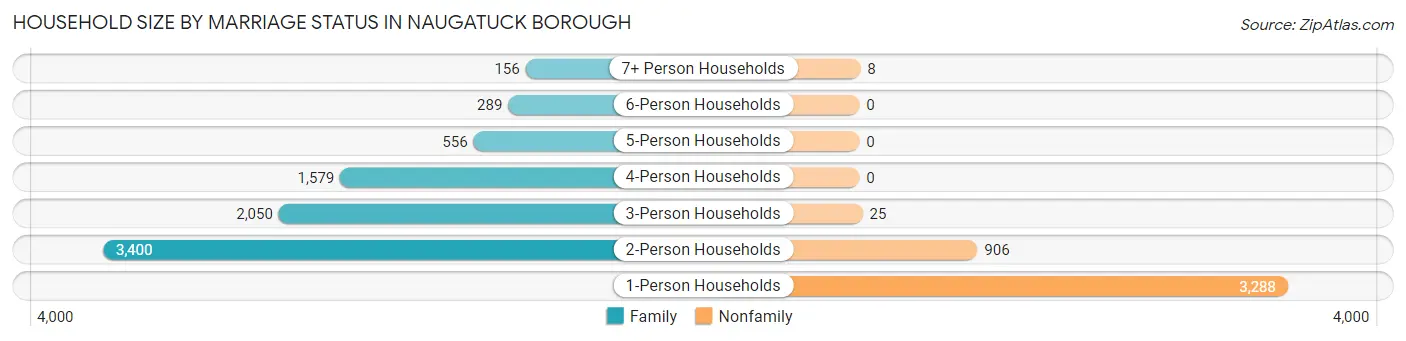
Household Size by Marriage Status in Naugatuck borough
Out of a total of 12,257 households in Naugatuck borough, 8,030 (65.5%) are family households, while 4,227 (34.5%) are nonfamily households. The most numerous type of family households are 2-person households, comprising 3,400, and the most common type of nonfamily households are 1-person households, comprising 3,288.
| Household Size | Family Households | Nonfamily Households |
| 1-Person Households | - | 3,288 (26.8%) |
| 2-Person Households | 3,400 (27.7%) | 906 (7.4%) |
| 3-Person Households | 2,050 (16.7%) | 25 (0.2%) |
| 4-Person Households | 1,579 (12.9%) | 0 (0.0%) |
| 5-Person Households | 556 (4.5%) | 0 (0.0%) |
| 6-Person Households | 289 (2.4%) | 0 (0.0%) |
| 7+ Person Households | 156 (1.3%) | 8 (0.1%) |
| Total | 8,030 (65.5%) | 4,227 (34.5%) |
Female Fertility in Naugatuck borough
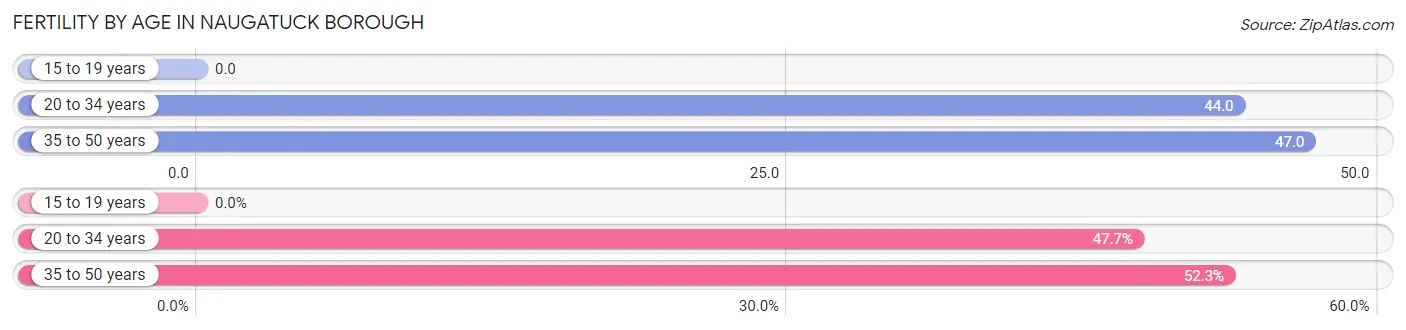
Fertility by Age in Naugatuck borough
Average fertility rate in Naugatuck borough is 40.0 births per 1,000 women. Women in the age bracket of 35 to 50 years have the highest fertility rate with 47.0 births per 1,000 women. Women in the age bracket of 35 to 50 years acount for 52.3% of all women with births.
| Age Bracket | Women with Births | Births / 1,000 Women |
| 15 to 19 years | 0 (0.0%) | 0.0 |
| 20 to 34 years | 144 (47.7%) | 44.0 |
| 35 to 50 years | 158 (52.3%) | 47.0 |
| Total | 302 (100.0%) | 40.0 |
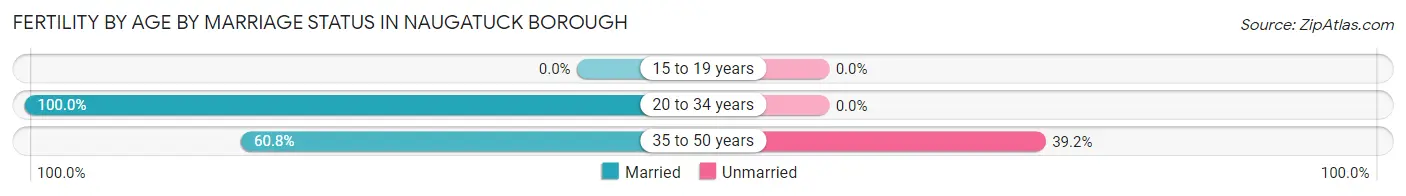
Fertility by Age by Marriage Status in Naugatuck borough
79.5% of women with births (302) in Naugatuck borough are married. The highest percentage of unmarried women with births falls into 35 to 50 years age bracket with 39.2% of them unmarried at the time of birth, while the lowest percentage of unmarried women with births belong to 20 to 34 years age bracket with 0.0% of them unmarried.
| Age Bracket | Married | Unmarried |
| 15 to 19 years | 0 (0.0%) | 0 (0.0%) |
| 20 to 34 years | 144 (100.0%) | 0 (0.0%) |
| 35 to 50 years | 96 (60.8%) | 62 (39.2%) |
| Total | 240 (79.5%) | 62 (20.5%) |
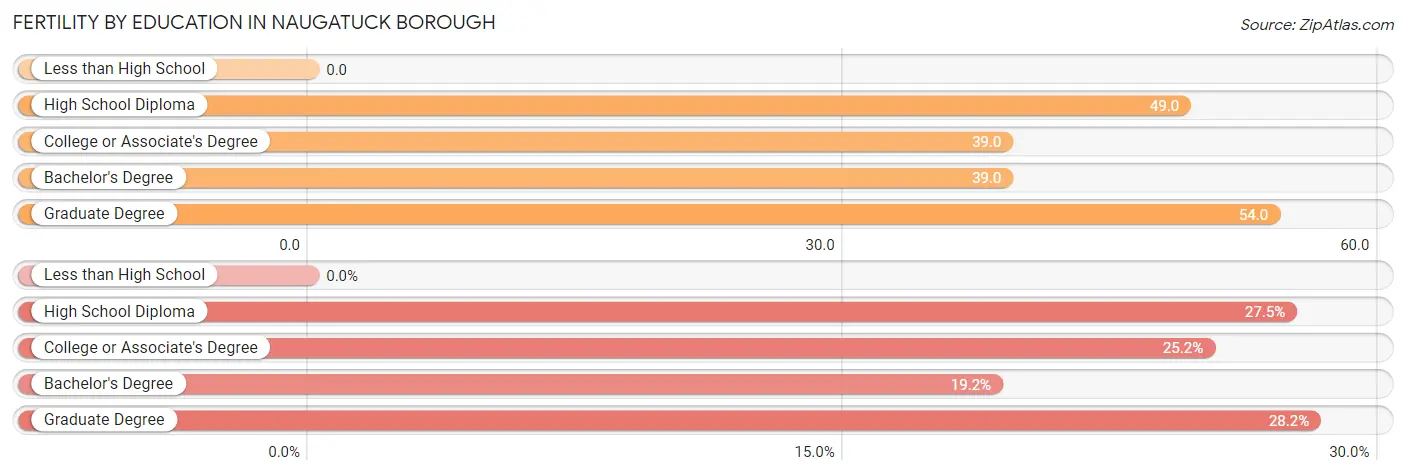
Fertility by Education in Naugatuck borough
| Educational Attainment | Women with Births | Births / 1,000 Women |
| Less than High School | 0 (0.0%) | 0.0 |
| High School Diploma | 83 (27.5%) | 49.0 |
| College or Associate's Degree | 76 (25.2%) | 39.0 |
| Bachelor's Degree | 58 (19.2%) | 39.0 |
| Graduate Degree | 85 (28.1%) | 54.0 |
| Total | 302 (100.0%) | 40.0 |
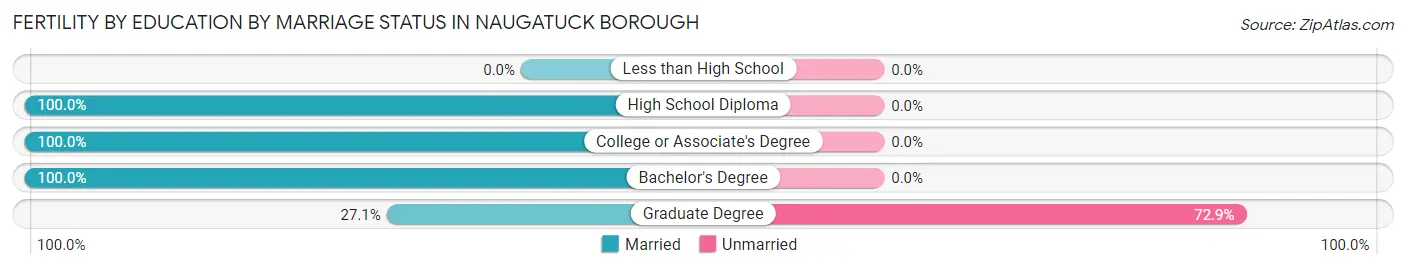
Fertility by Education by Marriage Status in Naugatuck borough
20.5% of women with births in Naugatuck borough are unmarried. Women with the educational attainment of high school diploma are most likely to be married with 100.0% of them married at childbirth, while women with the educational attainment of graduate degree are least likely to be married with 72.9% of them unmarried at childbirth.
| Educational Attainment | Married | Unmarried |
| Less than High School | 0 (0.0%) | 0 (0.0%) |
| High School Diploma | 83 (100.0%) | 0 (0.0%) |
| College or Associate's Degree | 76 (100.0%) | 0 (0.0%) |
| Bachelor's Degree | 58 (100.0%) | 0 (0.0%) |
| Graduate Degree | 23 (27.1%) | 62 (72.9%) |
| Total | 240 (79.5%) | 62 (20.5%) |
Employment Characteristics in Naugatuck borough
Employment by Class of Employer in Naugatuck borough
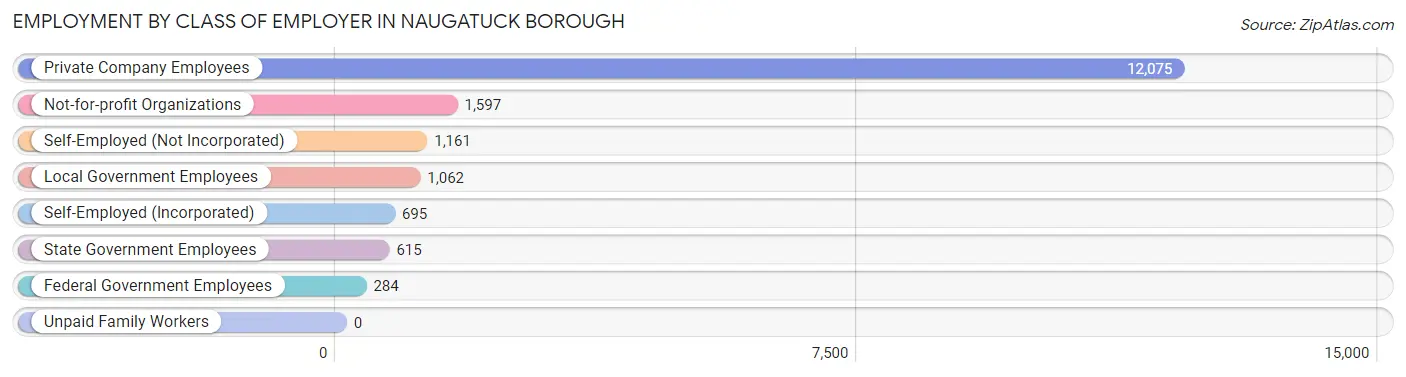
Among the 17,489 employed individuals in Naugatuck borough, private company employees (12,075 | 69.0%), not-for-profit organizations (1,597 | 9.1%), and self-employed (not incorporated) (1,161 | 6.6%) make up the most common classes of employment.
| Employer Class | # Employees | % Employees |
| Private Company Employees | 12,075 | 69.0% |
| Self-Employed (Incorporated) | 695 | 4.0% |
| Self-Employed (Not Incorporated) | 1,161 | 6.6% |
| Not-for-profit Organizations | 1,597 | 9.1% |
| Local Government Employees | 1,062 | 6.1% |
| State Government Employees | 615 | 3.5% |
| Federal Government Employees | 284 | 1.6% |
| Unpaid Family Workers | 0 | 0.0% |
| Total | 17,489 | 100.0% |
Employment Status by Age in Naugatuck borough
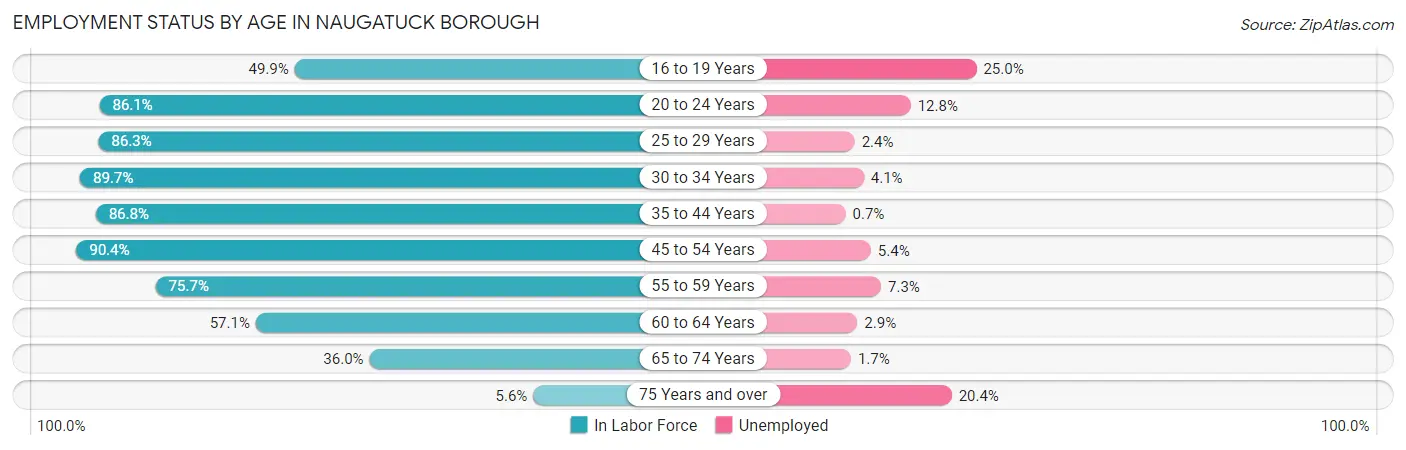
According to the labor force statistics for Naugatuck borough, out of the total population over 16 years of age (26,701), 70.7% or 18,878 individuals are in the labor force, with 5.5% or 1,038 of them unemployed. The age group with the highest labor force participation rate is 45 to 54 years, with 90.4% or 3,625 individuals in the labor force. Within the labor force, the 16 to 19 years age range has the highest percentage of unemployed individuals, with 25.0% or 232 of them being unemployed.
| Age Bracket | In Labor Force | Unemployed |
| 16 to 19 Years | 929 (49.9%) | 232 (25.0%) |
| 20 to 24 Years | 2,015 (86.1%) | 258 (12.8%) |
| 25 to 29 Years | 1,946 (86.3%) | 47 (2.4%) |
| 30 to 34 Years | 2,212 (89.7%) | 91 (4.1%) |
| 35 to 44 Years | 4,001 (86.8%) | 28 (0.7%) |
| 45 to 54 Years | 3,625 (90.4%) | 196 (5.4%) |
| 55 to 59 Years | 1,654 (75.7%) | 121 (7.3%) |
| 60 to 64 Years | 1,459 (57.1%) | 42 (2.9%) |
| 65 to 74 Years | 924 (36.0%) | 16 (1.7%) |
| 75 Years and over | 104 (5.6%) | 21 (20.4%) |
| Total | 18,878 (70.7%) | 1,038 (5.5%) |
Employment Status by Educational Attainment in Naugatuck borough
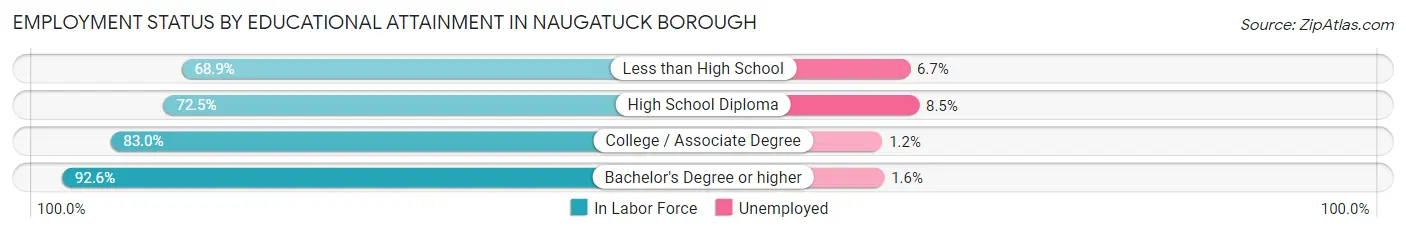
According to labor force statistics for Naugatuck borough, 82.4% of individuals (14,898) out of the total population between 25 and 64 years of age (18,080) are in the labor force, with 3.5% or 521 of them being unemployed. The group with the highest labor force participation rate are those with the educational attainment of bachelor's degree or higher, with 92.6% or 6,000 individuals in the labor force. Within the labor force, individuals with high school diploma education have the highest percentage of unemployment, with 8.5% or 312 of them being unemployed.
| Educational Attainment | In Labor Force | Unemployed |
| Less than High School | 971 (68.9%) | 94 (6.7%) |
| High School Diploma | 3,668 (72.5%) | 430 (8.5%) |
| College / Associate Degree | 4,259 (83.0%) | 62 (1.2%) |
| Bachelor's Degree or higher | 6,000 (92.6%) | 104 (1.6%) |
| Total | 14,898 (82.4%) | 633 (3.5%) |
Employment Occupations by Sex in Naugatuck borough
Management, Business, Science and Arts Occupations
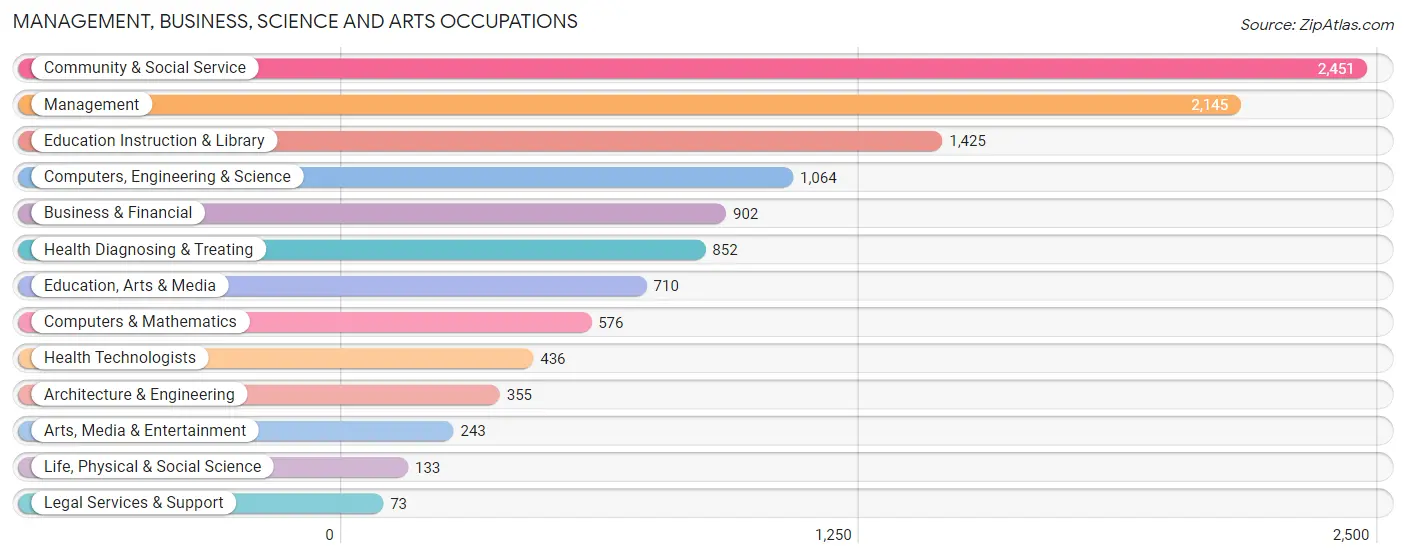
The most common Management, Business, Science and Arts occupations in Naugatuck borough are Community & Social Service (2,451 | 13.8%), Management (2,145 | 12.0%), Education Instruction & Library (1,425 | 8.0%), Computers, Engineering & Science (1,064 | 6.0%), and Business & Financial (902 | 5.1%).
Management, Business, Science and Arts Occupations by Sex
Within the Management, Business, Science and Arts occupations in Naugatuck borough, the most male-oriented occupations are Computers & Mathematics (90.8%), Architecture & Engineering (89.6%), and Computers, Engineering & Science (88.0%), while the most female-oriented occupations are Education Instruction & Library (83.7%), Health Diagnosing & Treating (80.2%), and Health Technologists (78.9%).
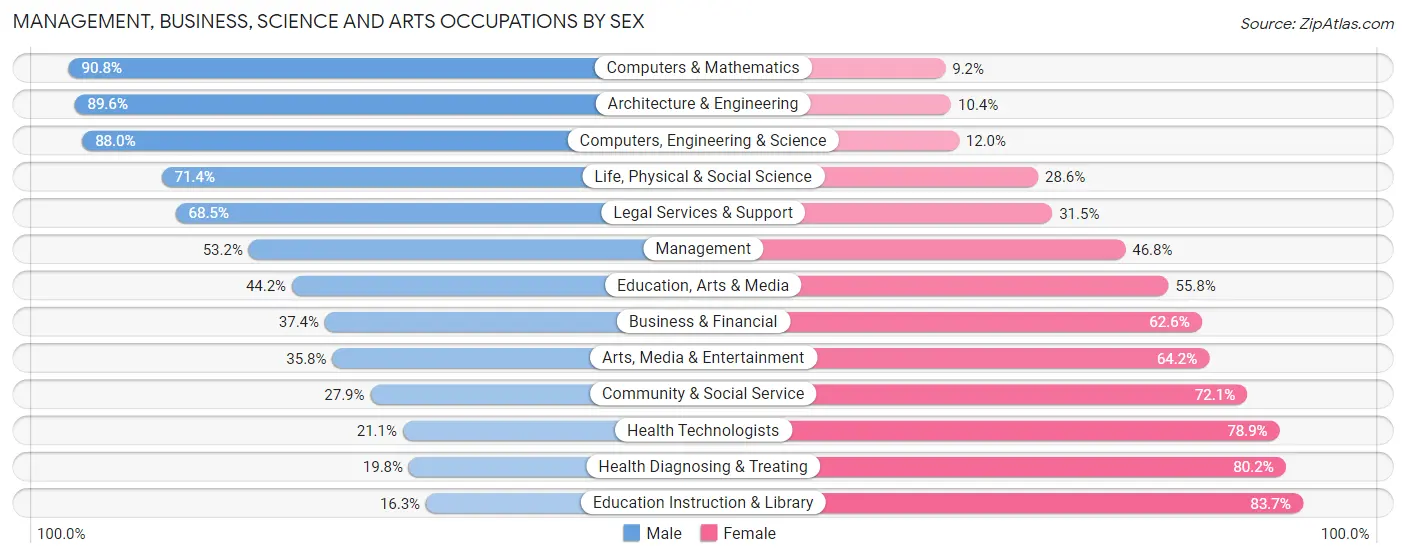
| Occupation | Male | Female |
| Management | 1,142 (53.2%) | 1,003 (46.8%) |
| Business & Financial | 337 (37.4%) | 565 (62.6%) |
| Computers, Engineering & Science | 936 (88.0%) | 128 (12.0%) |
| Computers & Mathematics | 523 (90.8%) | 53 (9.2%) |
| Architecture & Engineering | 318 (89.6%) | 37 (10.4%) |
| Life, Physical & Social Science | 95 (71.4%) | 38 (28.6%) |
| Community & Social Service | 683 (27.9%) | 1,768 (72.1%) |
| Education, Arts & Media | 314 (44.2%) | 396 (55.8%) |
| Legal Services & Support | 50 (68.5%) | 23 (31.5%) |
| Education Instruction & Library | 232 (16.3%) | 1,193 (83.7%) |
| Arts, Media & Entertainment | 87 (35.8%) | 156 (64.2%) |
| Health Diagnosing & Treating | 169 (19.8%) | 683 (80.2%) |
| Health Technologists | 92 (21.1%) | 344 (78.9%) |
| Total (Category) | 3,267 (44.1%) | 4,147 (55.9%) |
| Total (Overall) | 9,340 (52.4%) | 8,479 (47.6%) |
Services Occupations
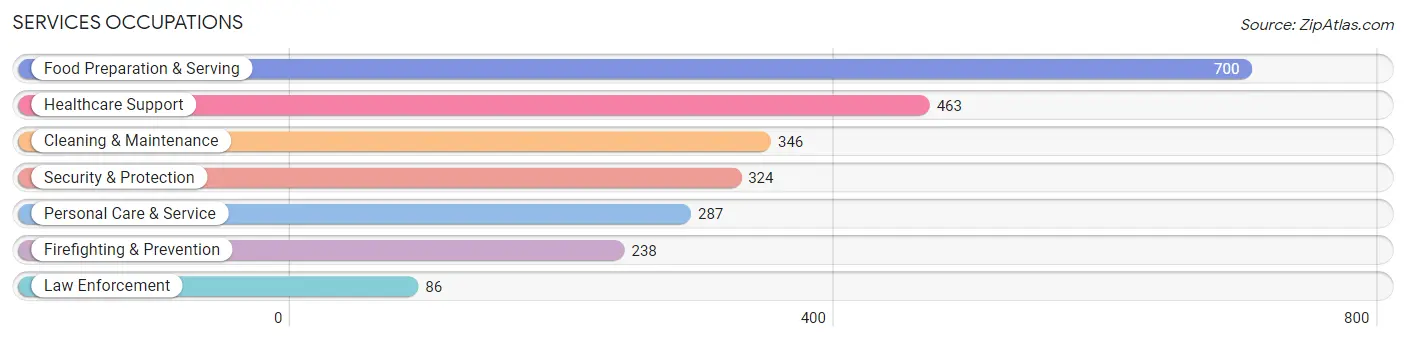
The most common Services occupations in Naugatuck borough are Food Preparation & Serving (700 | 3.9%), Healthcare Support (463 | 2.6%), Cleaning & Maintenance (346 | 1.9%), Security & Protection (324 | 1.8%), and Personal Care & Service (287 | 1.6%).
Services Occupations by Sex
Within the Services occupations in Naugatuck borough, the most male-oriented occupations are Firefighting & Prevention (92.0%), Cleaning & Maintenance (73.1%), and Security & Protection (69.8%), while the most female-oriented occupations are Law Enforcement (91.9%), Healthcare Support (89.2%), and Personal Care & Service (69.3%).
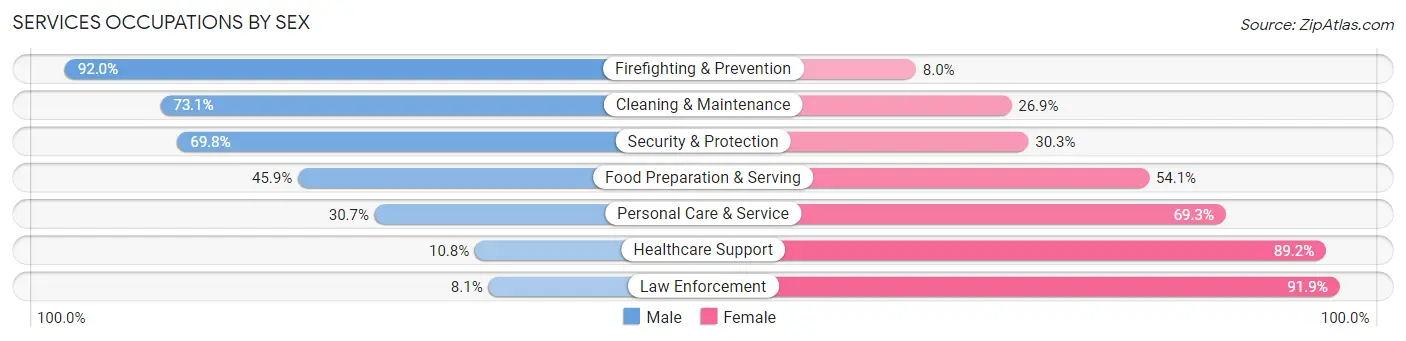
| Occupation | Male | Female |
| Healthcare Support | 50 (10.8%) | 413 (89.2%) |
| Security & Protection | 226 (69.8%) | 98 (30.2%) |
| Firefighting & Prevention | 219 (92.0%) | 19 (8.0%) |
| Law Enforcement | 7 (8.1%) | 79 (91.9%) |
| Food Preparation & Serving | 321 (45.9%) | 379 (54.1%) |
| Cleaning & Maintenance | 253 (73.1%) | 93 (26.9%) |
| Personal Care & Service | 88 (30.7%) | 199 (69.3%) |
| Total (Category) | 938 (44.3%) | 1,182 (55.7%) |
| Total (Overall) | 9,340 (52.4%) | 8,479 (47.6%) |
Sales and Office Occupations
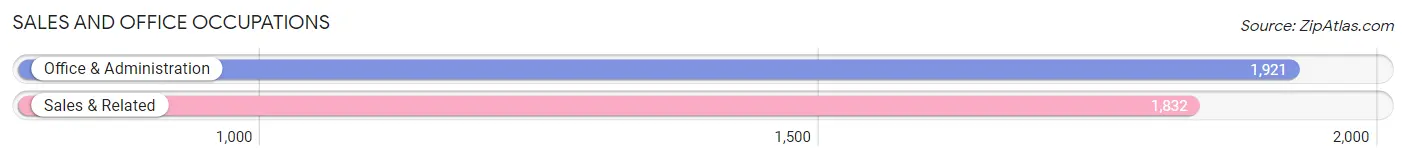
The most common Sales and Office occupations in Naugatuck borough are Office & Administration (1,921 | 10.8%), and Sales & Related (1,832 | 10.3%).
Sales and Office Occupations by Sex
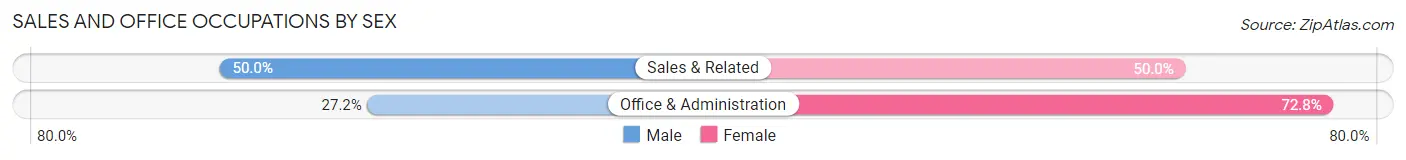
| Occupation | Male | Female |
| Sales & Related | 916 (50.0%) | 916 (50.0%) |
| Office & Administration | 523 (27.2%) | 1,398 (72.8%) |
| Total (Category) | 1,439 (38.3%) | 2,314 (61.7%) |
| Total (Overall) | 9,340 (52.4%) | 8,479 (47.6%) |
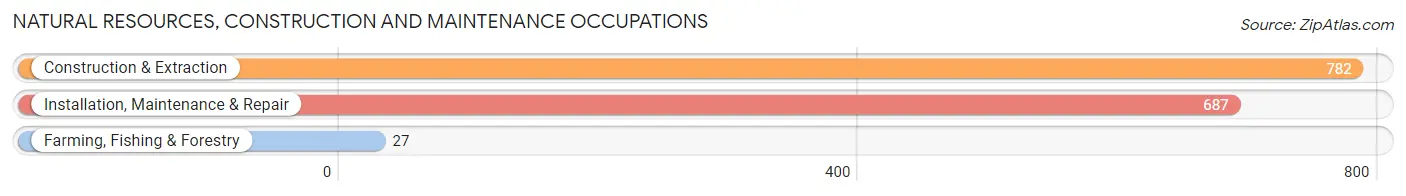
Natural Resources, Construction and Maintenance Occupations
The most common Natural Resources, Construction and Maintenance occupations in Naugatuck borough are Construction & Extraction (782 | 4.4%), Installation, Maintenance & Repair (687 | 3.9%), and Farming, Fishing & Forestry (27 | 0.2%).
Natural Resources, Construction and Maintenance Occupations by Sex
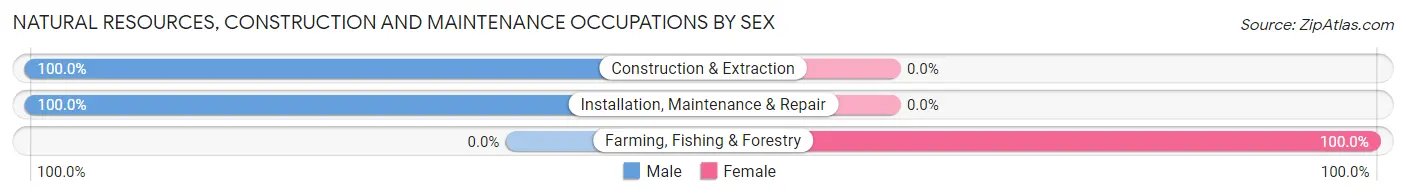
| Occupation | Male | Female |
| Farming, Fishing & Forestry | 0 (0.0%) | 27 (100.0%) |
| Construction & Extraction | 782 (100.0%) | 0 (0.0%) |
| Installation, Maintenance & Repair | 687 (100.0%) | 0 (0.0%) |
| Total (Category) | 1,469 (98.2%) | 27 (1.8%) |
| Total (Overall) | 9,340 (52.4%) | 8,479 (47.6%) |
Production, Transportation and Moving Occupations
The most common Production, Transportation and Moving occupations in Naugatuck borough are Production (1,621 | 9.1%), Material Moving (762 | 4.3%), and Transportation (653 | 3.7%).
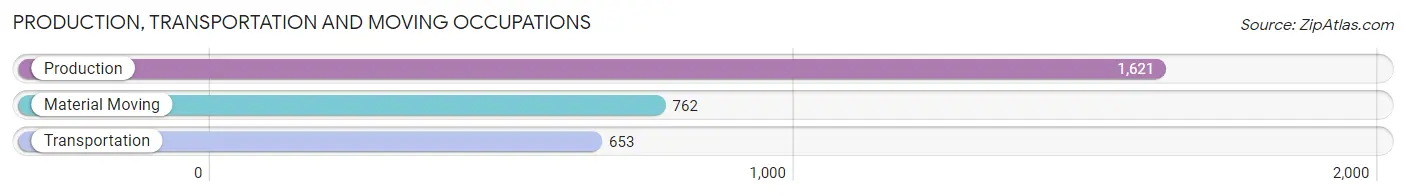
Production, Transportation and Moving Occupations by Sex
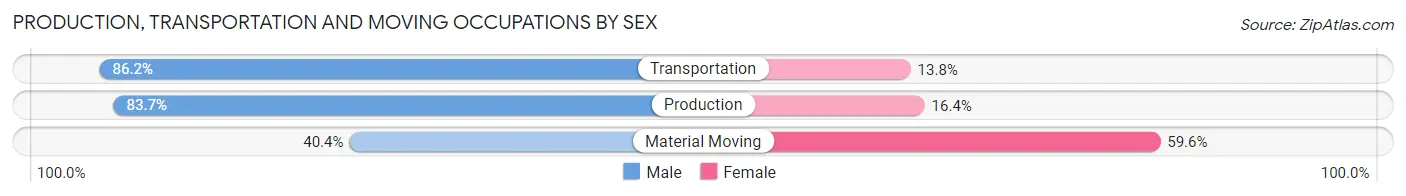
| Occupation | Male | Female |
| Production | 1,356 (83.7%) | 265 (16.4%) |
| Transportation | 563 (86.2%) | 90 (13.8%) |
| Material Moving | 308 (40.4%) | 454 (59.6%) |
| Total (Category) | 2,227 (73.4%) | 809 (26.7%) |
| Total (Overall) | 9,340 (52.4%) | 8,479 (47.6%) |
Employment Industries by Sex in Naugatuck borough
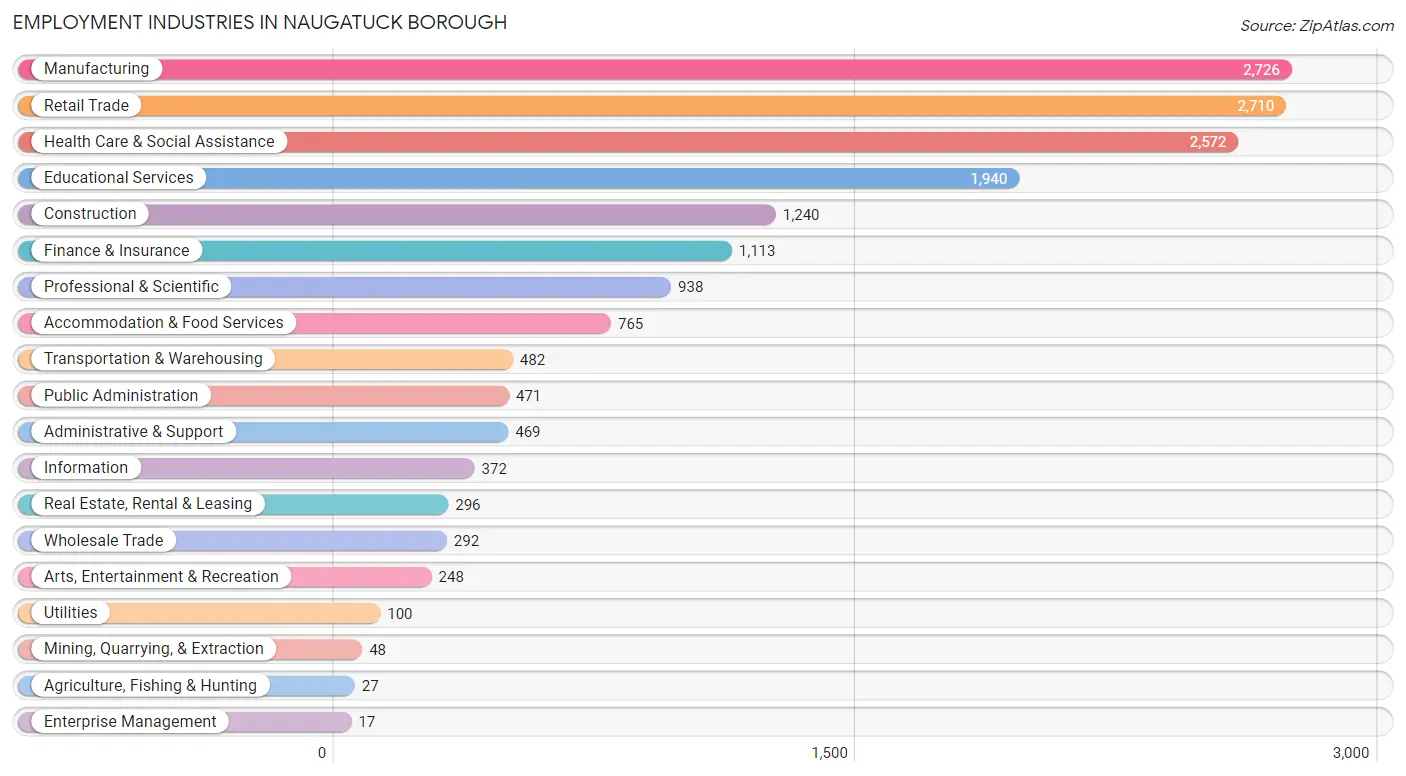
Employment Industries in Naugatuck borough
The major employment industries in Naugatuck borough include Manufacturing (2,726 | 15.3%), Retail Trade (2,710 | 15.2%), Health Care & Social Assistance (2,572 | 14.4%), Educational Services (1,940 | 10.9%), and Construction (1,240 | 7.0%).
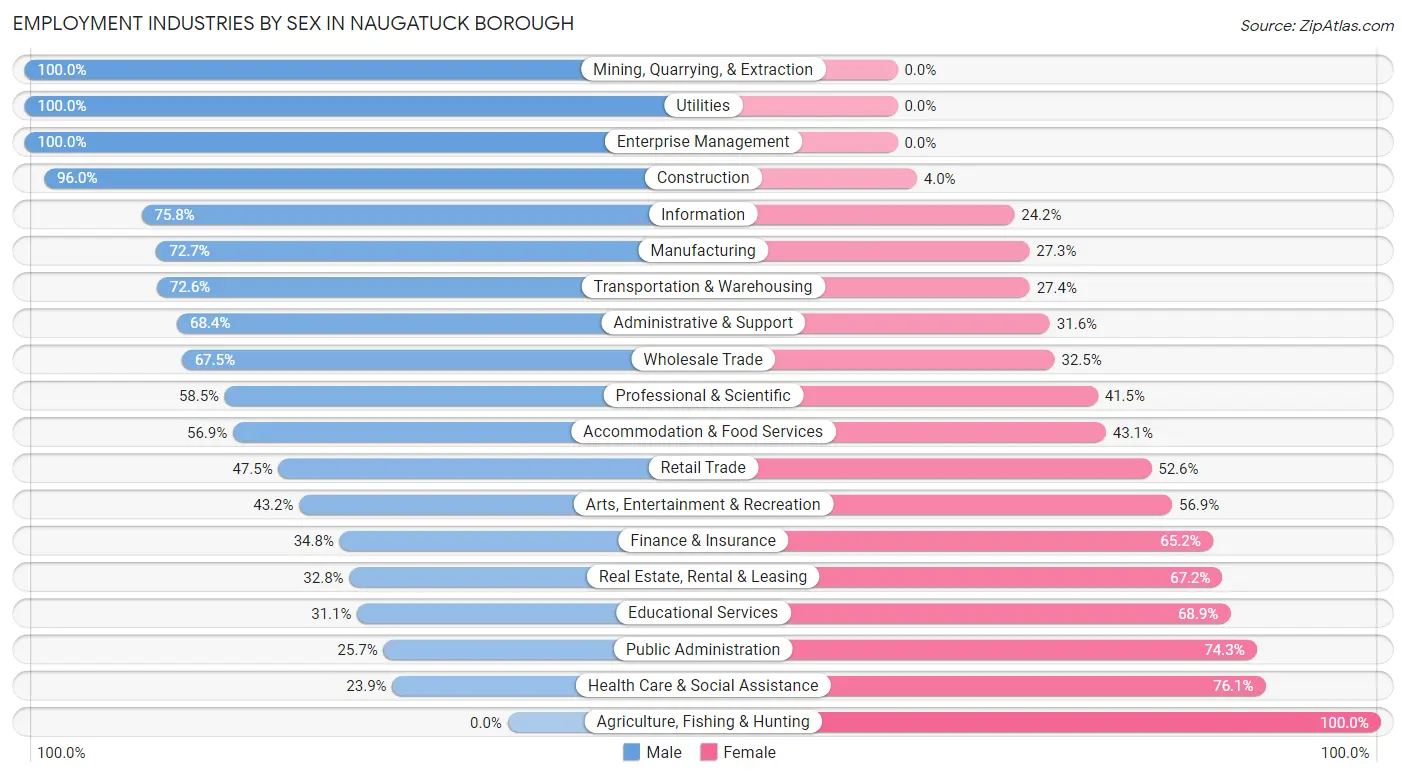
Employment Industries by Sex in Naugatuck borough
The Naugatuck borough industries that see more men than women are Mining, Quarrying, & Extraction (100.0%), Utilities (100.0%), and Enterprise Management (100.0%), whereas the industries that tend to have a higher number of women are Agriculture, Fishing & Hunting (100.0%), Health Care & Social Assistance (76.1%), and Public Administration (74.3%).
| Industry | Male | Female |
| Agriculture, Fishing & Hunting | 0 (0.0%) | 27 (100.0%) |
| Mining, Quarrying, & Extraction | 48 (100.0%) | 0 (0.0%) |
| Construction | 1,190 (96.0%) | 50 (4.0%) |
| Manufacturing | 1,982 (72.7%) | 744 (27.3%) |
| Wholesale Trade | 197 (67.5%) | 95 (32.5%) |
| Retail Trade | 1,286 (47.4%) | 1,424 (52.5%) |
| Transportation & Warehousing | 350 (72.6%) | 132 (27.4%) |
| Utilities | 100 (100.0%) | 0 (0.0%) |
| Information | 282 (75.8%) | 90 (24.2%) |
| Finance & Insurance | 387 (34.8%) | 726 (65.2%) |
| Real Estate, Rental & Leasing | 97 (32.8%) | 199 (67.2%) |
| Professional & Scientific | 549 (58.5%) | 389 (41.5%) |
| Enterprise Management | 17 (100.0%) | 0 (0.0%) |
| Administrative & Support | 321 (68.4%) | 148 (31.6%) |
| Educational Services | 604 (31.1%) | 1,336 (68.9%) |
| Health Care & Social Assistance | 614 (23.9%) | 1,958 (76.1%) |
| Arts, Entertainment & Recreation | 107 (43.1%) | 141 (56.9%) |
| Accommodation & Food Services | 435 (56.9%) | 330 (43.1%) |
| Public Administration | 121 (25.7%) | 350 (74.3%) |
| Total | 9,340 (52.4%) | 8,479 (47.6%) |
Education in Naugatuck borough
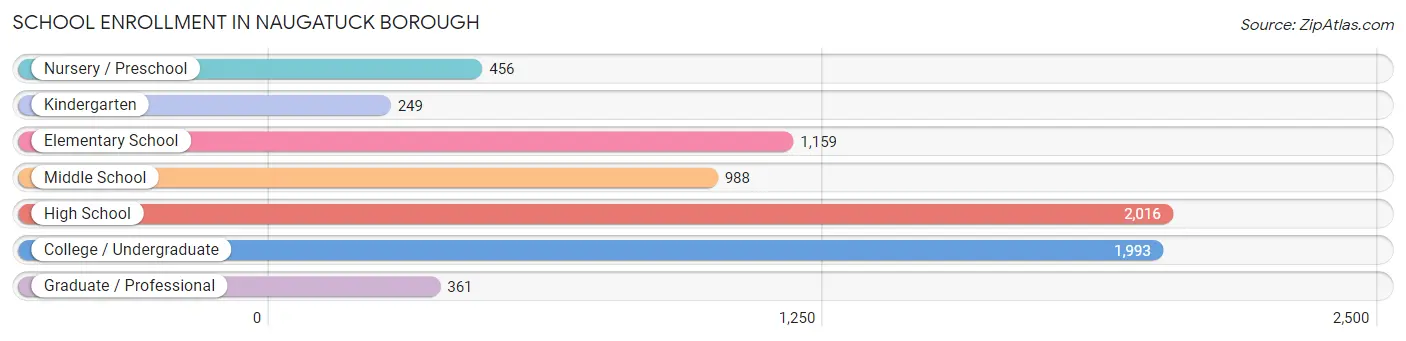
School Enrollment in Naugatuck borough
The most common levels of schooling among the 7,222 students in Naugatuck borough are high school (2,016 | 27.9%), college / undergraduate (1,993 | 27.6%), and elementary school (1,159 | 16.1%).
| School Level | # Students | % Students |
| Nursery / Preschool | 456 | 6.3% |
| Kindergarten | 249 | 3.5% |
| Elementary School | 1,159 | 16.1% |
| Middle School | 988 | 13.7% |
| High School | 2,016 | 27.9% |
| College / Undergraduate | 1,993 | 27.6% |
| Graduate / Professional | 361 | 5.0% |
| Total | 7,222 | 100.0% |
School Enrollment by Age by Funding Source in Naugatuck borough
Out of a total of 7,222 students who are enrolled in schools in Naugatuck borough, 1,546 (21.4%) attend a private institution, while the remaining 5,676 (78.6%) are enrolled in public schools. The age group of 3 to 4 year olds has the highest likelihood of being enrolled in private schools, with 187 (46.3% in the age bracket) enrolled. Conversely, the age group of 10 to 14 year olds has the lowest likelihood of being enrolled in a private school, with 1,366 (94.6% in the age bracket) attending a public institution.
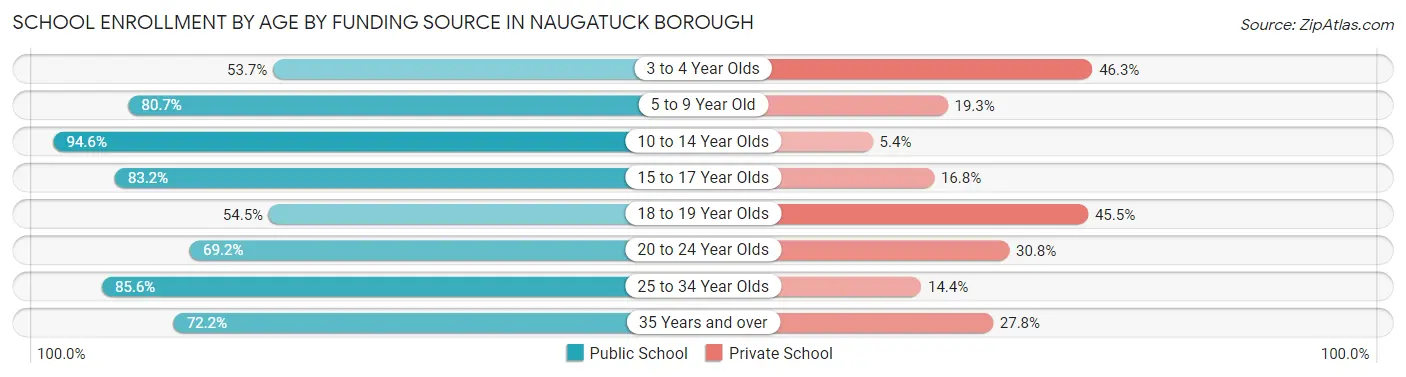
| Age Bracket | Public School | Private School |
| 3 to 4 Year Olds | 217 (53.7%) | 187 (46.3%) |
| 5 to 9 Year Old | 1,126 (80.7%) | 270 (19.3%) |
| 10 to 14 Year Olds | 1,366 (94.6%) | 78 (5.4%) |
| 15 to 17 Year Olds | 1,301 (83.2%) | 263 (16.8%) |
| 18 to 19 Year Olds | 285 (54.5%) | 238 (45.5%) |
| 20 to 24 Year Olds | 797 (69.2%) | 355 (30.8%) |
| 25 to 34 Year Olds | 303 (85.6%) | 51 (14.4%) |
| 35 Years and over | 278 (72.2%) | 107 (27.8%) |
| Total | 5,676 (78.6%) | 1,546 (21.4%) |
Educational Attainment by Field of Study in Naugatuck borough
Business (1,152 | 14.6%), arts & humanities (784 | 9.9%), psychology (747 | 9.4%), education (710 | 9.0%), and social sciences (680 | 8.6%) are the most common fields of study among 7,911 individuals in Naugatuck borough who have obtained a bachelor's degree or higher.
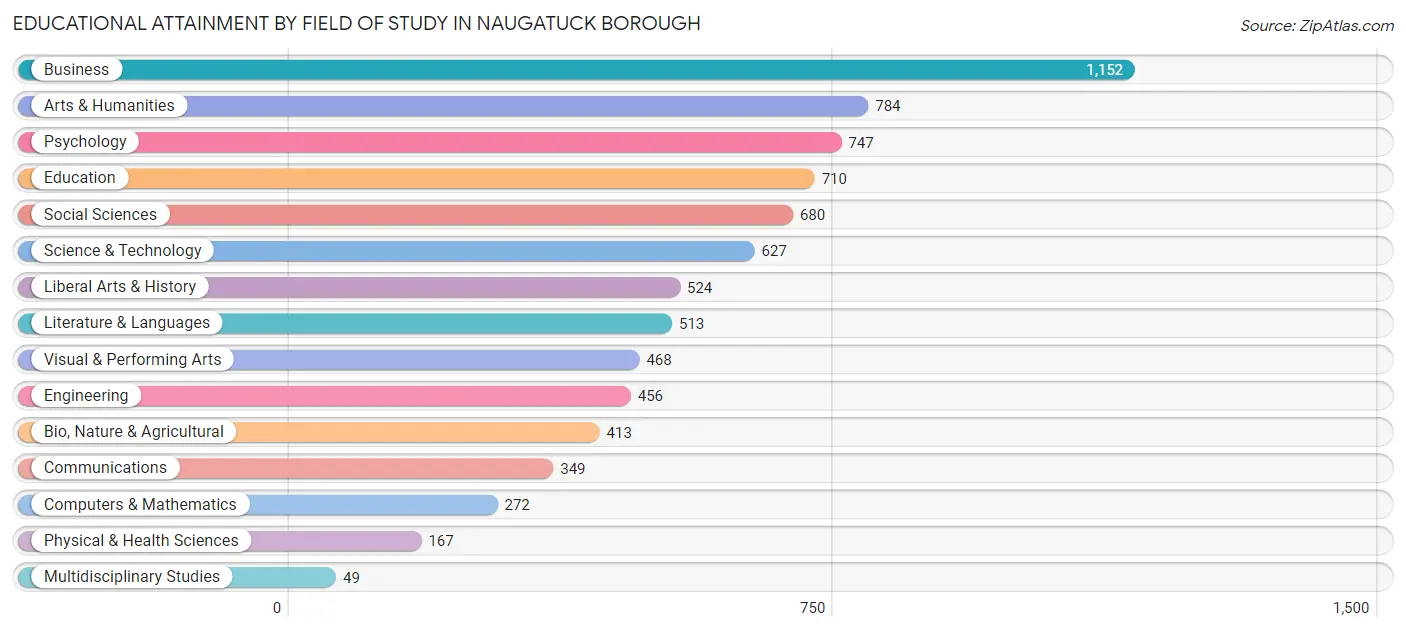
| Field of Study | # Graduates | % Graduates |
| Computers & Mathematics | 272 | 3.4% |
| Bio, Nature & Agricultural | 413 | 5.2% |
| Physical & Health Sciences | 167 | 2.1% |
| Psychology | 747 | 9.4% |
| Social Sciences | 680 | 8.6% |
| Engineering | 456 | 5.8% |
| Multidisciplinary Studies | 49 | 0.6% |
| Science & Technology | 627 | 7.9% |
| Business | 1,152 | 14.6% |
| Education | 710 | 9.0% |
| Literature & Languages | 513 | 6.5% |
| Liberal Arts & History | 524 | 6.6% |
| Visual & Performing Arts | 468 | 5.9% |
| Communications | 349 | 4.4% |
| Arts & Humanities | 784 | 9.9% |
| Total | 7,911 | 100.0% |
Transportation & Commute in Naugatuck borough
Vehicle Availability by Sex in Naugatuck borough
The most prevalent vehicle ownership categories in Naugatuck borough are males with 2 vehicles (4,316, accounting for 46.9%) and females with 2 vehicles (4,119, making up 52.1%).
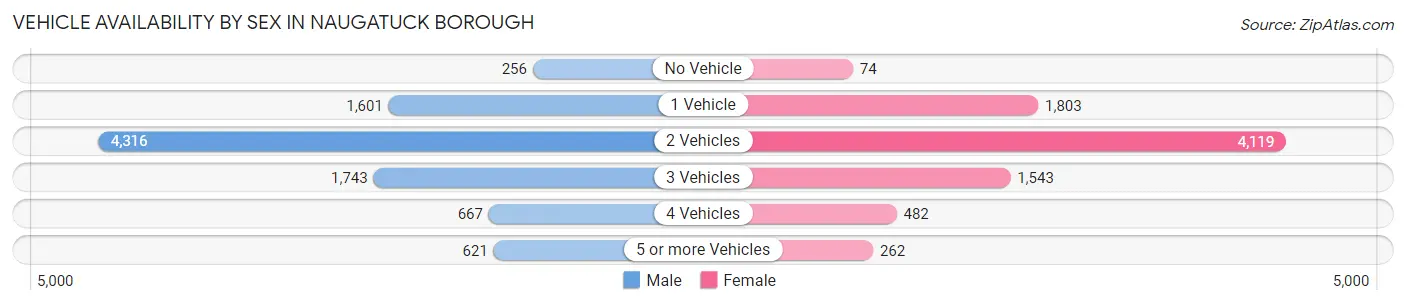
| Vehicles Available | Male | Female |
| No Vehicle | 256 (2.8%) | 74 (0.9%) |
| 1 Vehicle | 1,601 (17.4%) | 1,803 (21.8%) |
| 2 Vehicles | 4,316 (46.9%) | 4,119 (49.7%) |
| 3 Vehicles | 1,743 (18.9%) | 1,543 (18.6%) |
| 4 Vehicles | 667 (7.2%) | 482 (5.8%) |
| 5 or more Vehicles | 621 (6.8%) | 262 (3.2%) |
| Total | 9,204 (100.0%) | 8,283 (100.0%) |
Commute Time in Naugatuck borough
The most frequently occuring commute durations in Naugatuck borough are 20 to 24 minutes (2,135 commuters, 13.6%), 10 to 14 minutes (2,131 commuters, 13.6%), and 30 to 34 minutes (2,127 commuters, 13.6%).
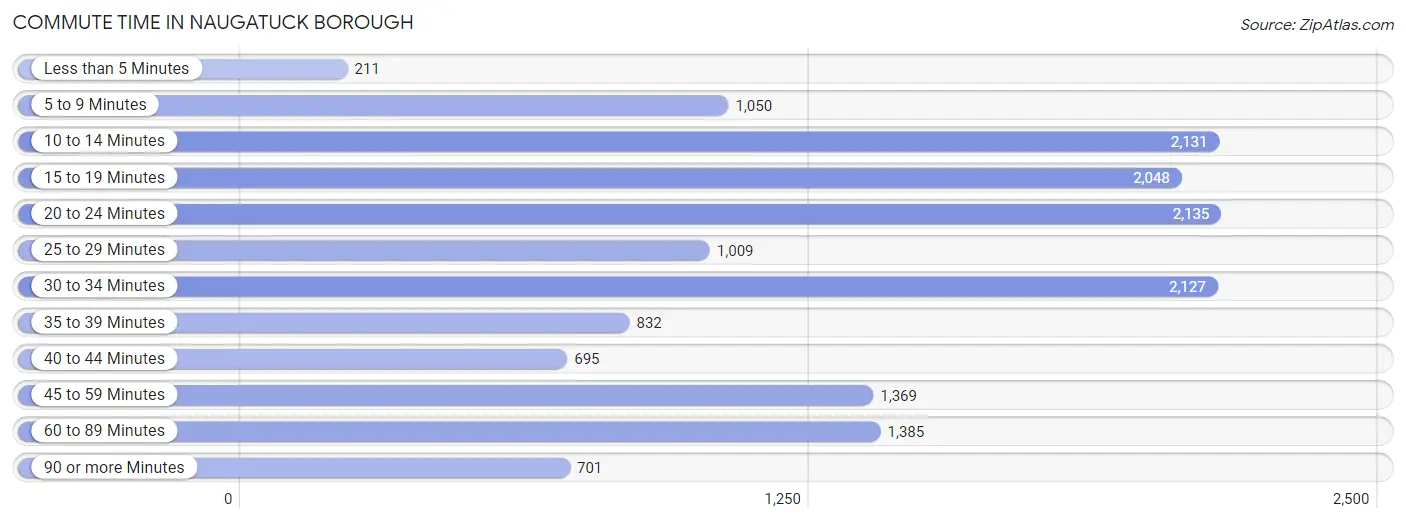
| Commute Time | # Commuters | % Commuters |
| Less than 5 Minutes | 211 | 1.3% |
| 5 to 9 Minutes | 1,050 | 6.7% |
| 10 to 14 Minutes | 2,131 | 13.6% |
| 15 to 19 Minutes | 2,048 | 13.1% |
| 20 to 24 Minutes | 2,135 | 13.6% |
| 25 to 29 Minutes | 1,009 | 6.4% |
| 30 to 34 Minutes | 2,127 | 13.6% |
| 35 to 39 Minutes | 832 | 5.3% |
| 40 to 44 Minutes | 695 | 4.4% |
| 45 to 59 Minutes | 1,369 | 8.7% |
| 60 to 89 Minutes | 1,385 | 8.8% |
| 90 or more Minutes | 701 | 4.5% |
Commute Time by Sex in Naugatuck borough
The most common commute times in Naugatuck borough are 30 to 34 minutes (1,458 commuters, 17.2%) for males and 15 to 19 minutes (1,236 commuters, 17.2%) for females.
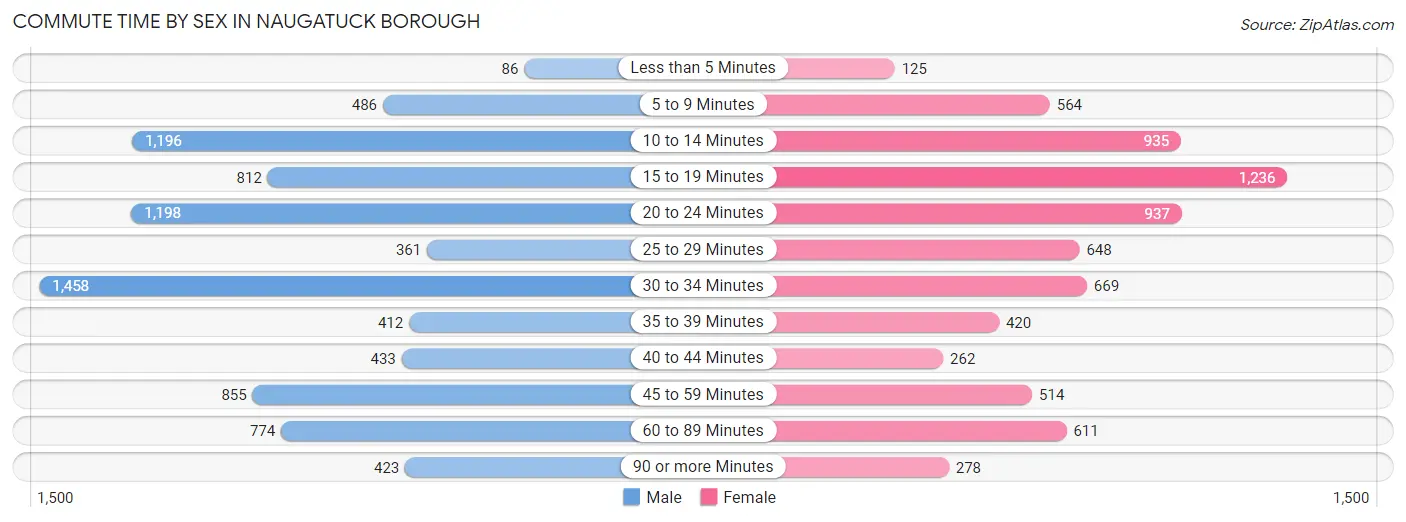
| Commute Time | Male | Female |
| Less than 5 Minutes | 86 (1.0%) | 125 (1.7%) |
| 5 to 9 Minutes | 486 (5.7%) | 564 (7.8%) |
| 10 to 14 Minutes | 1,196 (14.1%) | 935 (13.0%) |
| 15 to 19 Minutes | 812 (9.6%) | 1,236 (17.2%) |
| 20 to 24 Minutes | 1,198 (14.1%) | 937 (13.0%) |
| 25 to 29 Minutes | 361 (4.3%) | 648 (9.0%) |
| 30 to 34 Minutes | 1,458 (17.2%) | 669 (9.3%) |
| 35 to 39 Minutes | 412 (4.9%) | 420 (5.8%) |
| 40 to 44 Minutes | 433 (5.1%) | 262 (3.6%) |
| 45 to 59 Minutes | 855 (10.1%) | 514 (7.1%) |
| 60 to 89 Minutes | 774 (9.1%) | 611 (8.5%) |
| 90 or more Minutes | 423 (5.0%) | 278 (3.9%) |
Time of Departure to Work by Sex in Naugatuck borough
The most frequent times of departure to work in Naugatuck borough are 7:30 AM to 7:59 AM (1,231, 14.5%) for males and 6:30 AM to 6:59 AM (1,156, 16.1%) for females.
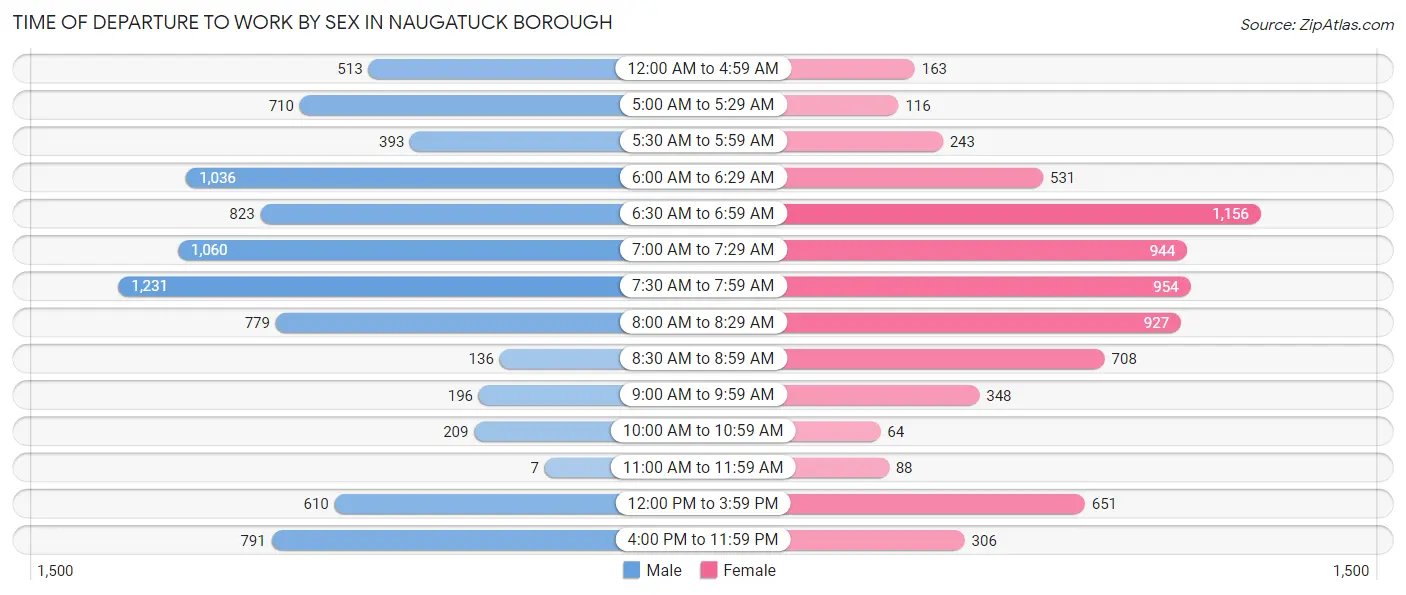
| Time of Departure | Male | Female |
| 12:00 AM to 4:59 AM | 513 (6.0%) | 163 (2.3%) |
| 5:00 AM to 5:29 AM | 710 (8.4%) | 116 (1.6%) |
| 5:30 AM to 5:59 AM | 393 (4.6%) | 243 (3.4%) |
| 6:00 AM to 6:29 AM | 1,036 (12.2%) | 531 (7.4%) |
| 6:30 AM to 6:59 AM | 823 (9.7%) | 1,156 (16.1%) |
| 7:00 AM to 7:29 AM | 1,060 (12.5%) | 944 (13.1%) |
| 7:30 AM to 7:59 AM | 1,231 (14.5%) | 954 (13.3%) |
| 8:00 AM to 8:29 AM | 779 (9.2%) | 927 (12.9%) |
| 8:30 AM to 8:59 AM | 136 (1.6%) | 708 (9.8%) |
| 9:00 AM to 9:59 AM | 196 (2.3%) | 348 (4.8%) |
| 10:00 AM to 10:59 AM | 209 (2.5%) | 64 (0.9%) |
| 11:00 AM to 11:59 AM | 7 (0.1%) | 88 (1.2%) |
| 12:00 PM to 3:59 PM | 610 (7.2%) | 651 (9.0%) |
| 4:00 PM to 11:59 PM | 791 (9.3%) | 306 (4.3%) |
| Total | 8,494 (100.0%) | 7,199 (100.0%) |
Housing Occupancy in Naugatuck borough
Occupancy by Ownership in Naugatuck borough
Of the total 12,257 dwellings in Naugatuck borough, owner-occupied units account for 8,085 (66.0%), while renter-occupied units make up 4,172 (34.0%).
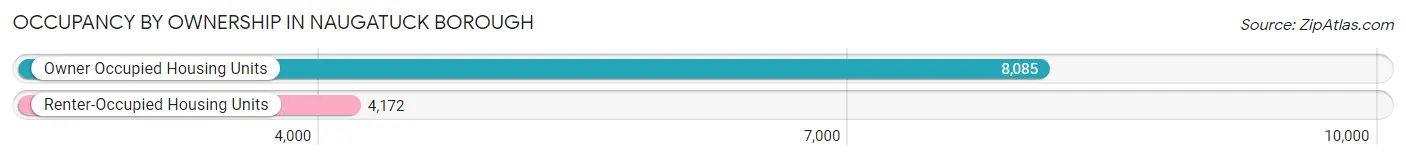
| Occupancy | # Housing Units | % Housing Units |
| Owner Occupied Housing Units | 8,085 | 66.0% |
| Renter-Occupied Housing Units | 4,172 | 34.0% |
| Total Occupied Housing Units | 12,257 | 100.0% |
Occupancy by Household Size in Naugatuck borough
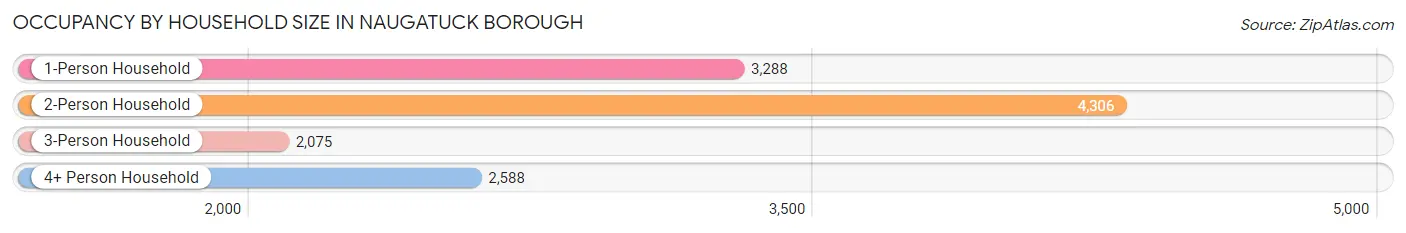
| Household Size | # Housing Units | % Housing Units |
| 1-Person Household | 3,288 | 26.8% |
| 2-Person Household | 4,306 | 35.1% |
| 3-Person Household | 2,075 | 16.9% |
| 4+ Person Household | 2,588 | 21.1% |
| Total Housing Units | 12,257 | 100.0% |
Occupancy by Ownership by Household Size in Naugatuck borough
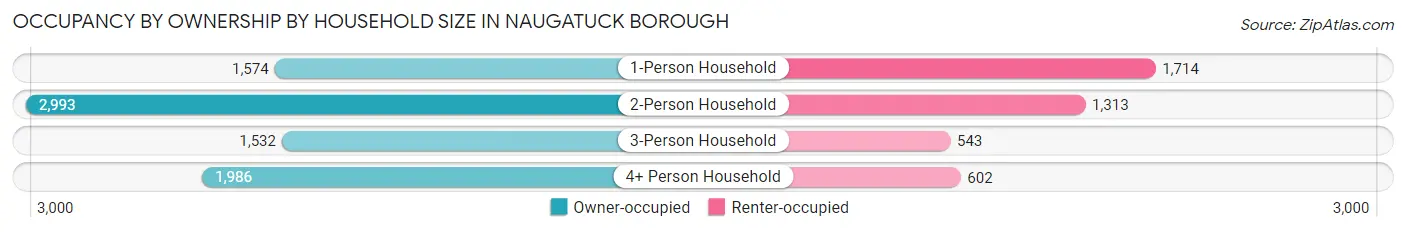
| Household Size | Owner-occupied | Renter-occupied |
| 1-Person Household | 1,574 (47.9%) | 1,714 (52.1%) |
| 2-Person Household | 2,993 (69.5%) | 1,313 (30.5%) |
| 3-Person Household | 1,532 (73.8%) | 543 (26.2%) |
| 4+ Person Household | 1,986 (76.7%) | 602 (23.3%) |
| Total Housing Units | 8,085 (66.0%) | 4,172 (34.0%) |
Occupancy by Educational Attainment in Naugatuck borough
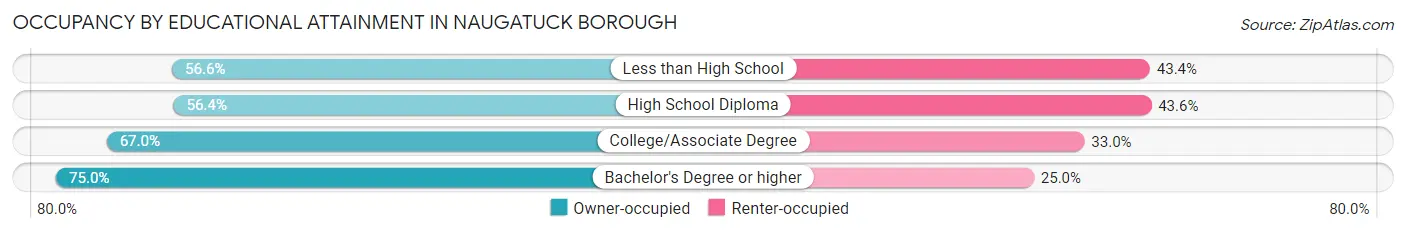
| Household Size | Owner-occupied | Renter-occupied |
| Less than High School | 515 (56.6%) | 395 (43.4%) |
| High School Diploma | 1,903 (56.4%) | 1,473 (43.6%) |
| College/Associate Degree | 2,591 (67.0%) | 1,278 (33.0%) |
| Bachelor's Degree or higher | 3,076 (75.0%) | 1,026 (25.0%) |
Occupancy by Age of Householder in Naugatuck borough
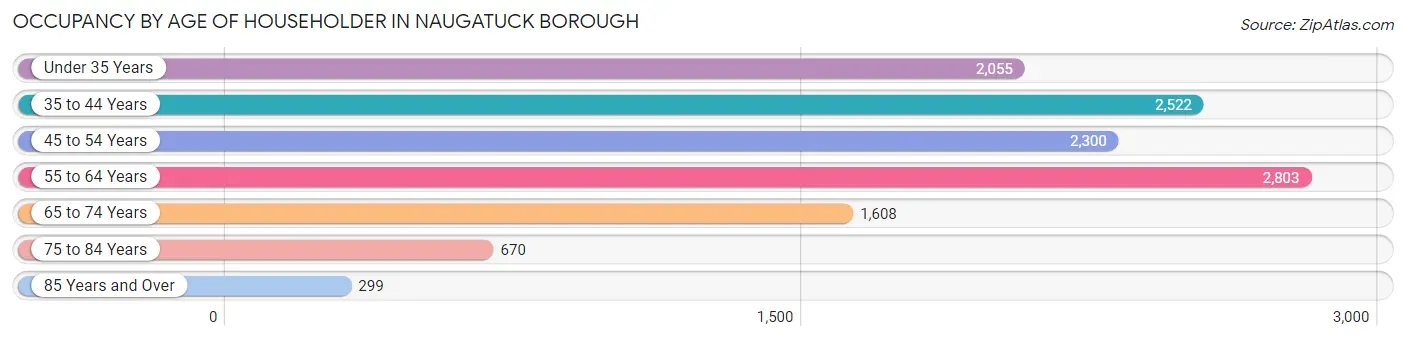
| Age Bracket | # Households | % Households |
| Under 35 Years | 2,055 | 16.8% |
| 35 to 44 Years | 2,522 | 20.6% |
| 45 to 54 Years | 2,300 | 18.8% |
| 55 to 64 Years | 2,803 | 22.9% |
| 65 to 74 Years | 1,608 | 13.1% |
| 75 to 84 Years | 670 | 5.5% |
| 85 Years and Over | 299 | 2.4% |
| Total | 12,257 | 100.0% |
Housing Finances in Naugatuck borough
Median Income by Occupancy in Naugatuck borough
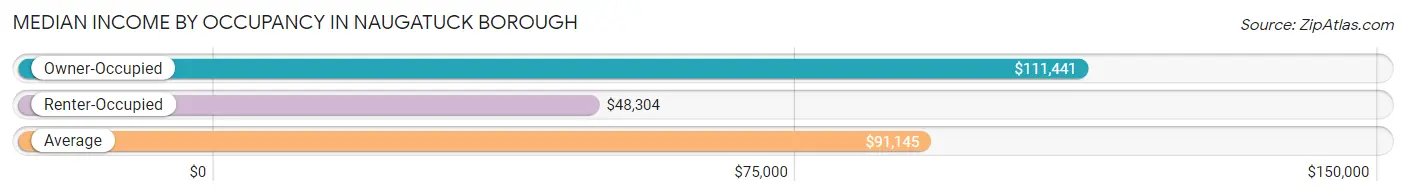
| Occupancy Type | # Households | Median Income |
| Owner-Occupied | 8,085 (66.0%) | $111,441 |
| Renter-Occupied | 4,172 (34.0%) | $48,304 |
| Average | 12,257 (100.0%) | $91,145 |
Occupancy by Householder Income Bracket in Naugatuck borough
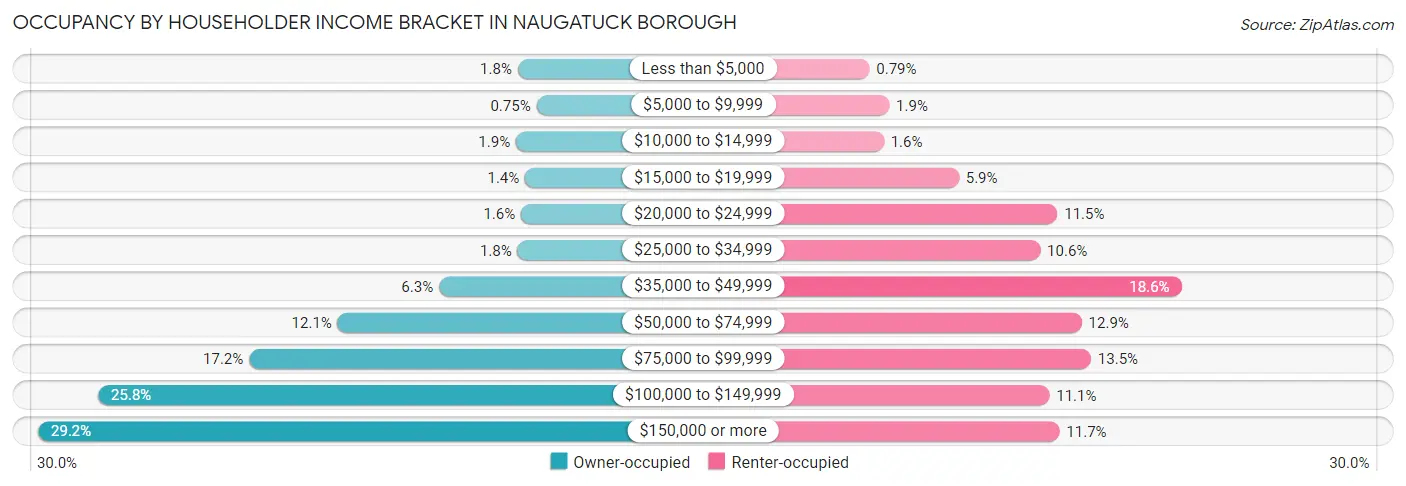
| Income Bracket | Owner-occupied | Renter-occupied |
| Less than $5,000 | 147 (1.8%) | 33 (0.8%) |
| $5,000 to $9,999 | 61 (0.7%) | 80 (1.9%) |
| $10,000 to $14,999 | 155 (1.9%) | 67 (1.6%) |
| $15,000 to $19,999 | 113 (1.4%) | 246 (5.9%) |
| $20,000 to $24,999 | 132 (1.6%) | 481 (11.5%) |
| $25,000 to $34,999 | 148 (1.8%) | 440 (10.5%) |
| $35,000 to $49,999 | 511 (6.3%) | 777 (18.6%) |
| $50,000 to $74,999 | 979 (12.1%) | 539 (12.9%) |
| $75,000 to $99,999 | 1,388 (17.2%) | 561 (13.5%) |
| $100,000 to $149,999 | 2,087 (25.8%) | 462 (11.1%) |
| $150,000 or more | 2,364 (29.2%) | 486 (11.7%) |
| Total | 8,085 (100.0%) | 4,172 (100.0%) |
Monthly Housing Cost Tiers in Naugatuck borough
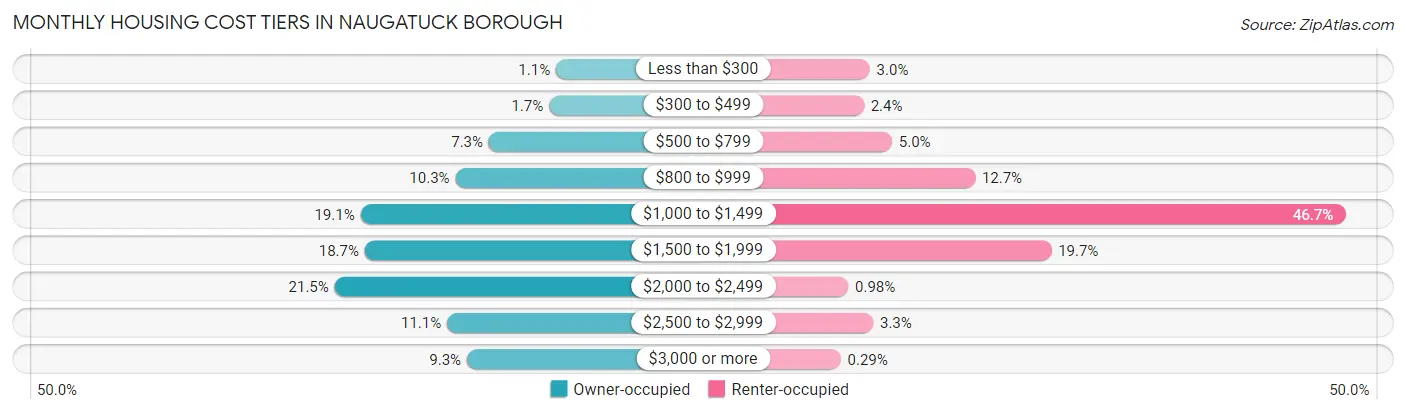
| Monthly Cost | Owner-occupied | Renter-occupied |
| Less than $300 | 87 (1.1%) | 124 (3.0%) |
| $300 to $499 | 139 (1.7%) | 101 (2.4%) |
| $500 to $799 | 587 (7.3%) | 209 (5.0%) |
| $800 to $999 | 836 (10.3%) | 528 (12.7%) |
| $1,000 to $1,499 | 1,543 (19.1%) | 1,950 (46.7%) |
| $1,500 to $1,999 | 1,510 (18.7%) | 821 (19.7%) |
| $2,000 to $2,499 | 1,735 (21.5%) | 41 (1.0%) |
| $2,500 to $2,999 | 898 (11.1%) | 137 (3.3%) |
| $3,000 or more | 750 (9.3%) | 12 (0.3%) |
| Total | 8,085 (100.0%) | 4,172 (100.0%) |
Physical Housing Characteristics in Naugatuck borough
Housing Structures in Naugatuck borough
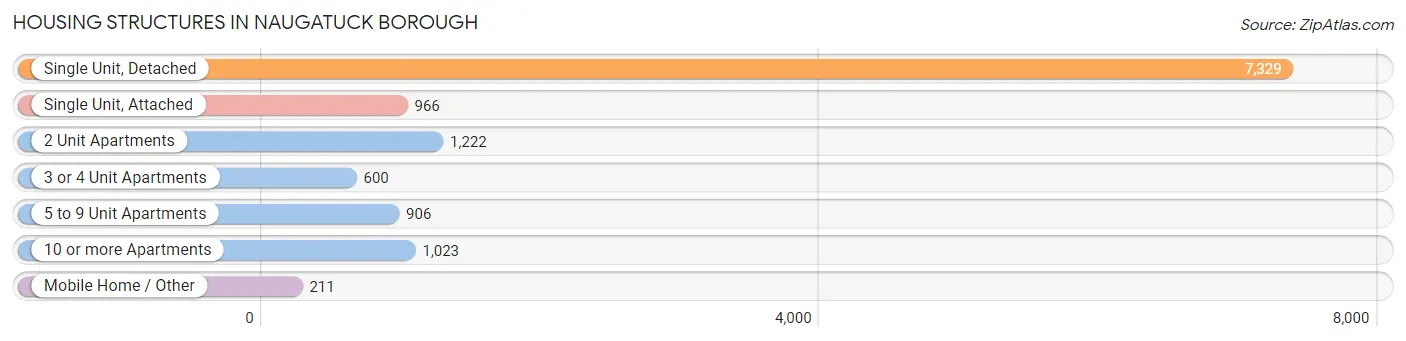
| Structure Type | # Housing Units | % Housing Units |
| Single Unit, Detached | 7,329 | 59.8% |
| Single Unit, Attached | 966 | 7.9% |
| 2 Unit Apartments | 1,222 | 10.0% |
| 3 or 4 Unit Apartments | 600 | 4.9% |
| 5 to 9 Unit Apartments | 906 | 7.4% |
| 10 or more Apartments | 1,023 | 8.4% |
| Mobile Home / Other | 211 | 1.7% |
| Total | 12,257 | 100.0% |
Housing Structures by Occupancy in Naugatuck borough
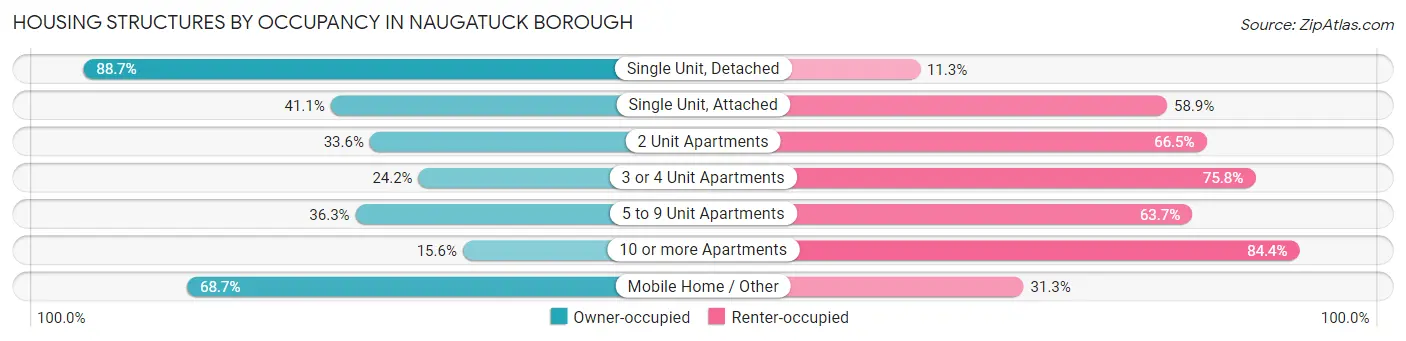
| Structure Type | Owner-occupied | Renter-occupied |
| Single Unit, Detached | 6,499 (88.7%) | 830 (11.3%) |
| Single Unit, Attached | 397 (41.1%) | 569 (58.9%) |
| 2 Unit Apartments | 410 (33.6%) | 812 (66.4%) |
| 3 or 4 Unit Apartments | 145 (24.2%) | 455 (75.8%) |
| 5 to 9 Unit Apartments | 329 (36.3%) | 577 (63.7%) |
| 10 or more Apartments | 160 (15.6%) | 863 (84.4%) |
| Mobile Home / Other | 145 (68.7%) | 66 (31.3%) |
| Total | 8,085 (66.0%) | 4,172 (34.0%) |
Housing Structures by Number of Rooms in Naugatuck borough
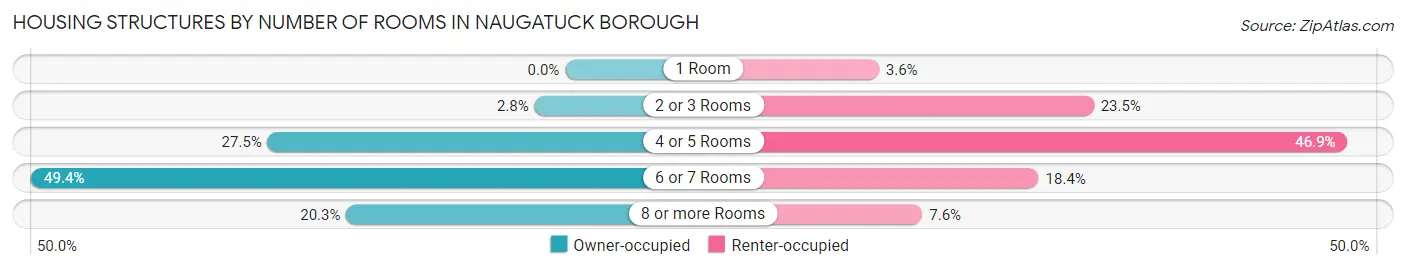
| Number of Rooms | Owner-occupied | Renter-occupied |
| 1 Room | 0 (0.0%) | 150 (3.6%) |
| 2 or 3 Rooms | 230 (2.8%) | 979 (23.5%) |
| 4 or 5 Rooms | 2,225 (27.5%) | 1,958 (46.9%) |
| 6 or 7 Rooms | 3,993 (49.4%) | 767 (18.4%) |
| 8 or more Rooms | 1,637 (20.3%) | 318 (7.6%) |
| Total | 8,085 (100.0%) | 4,172 (100.0%) |
Housing Structure by Heating Type in Naugatuck borough
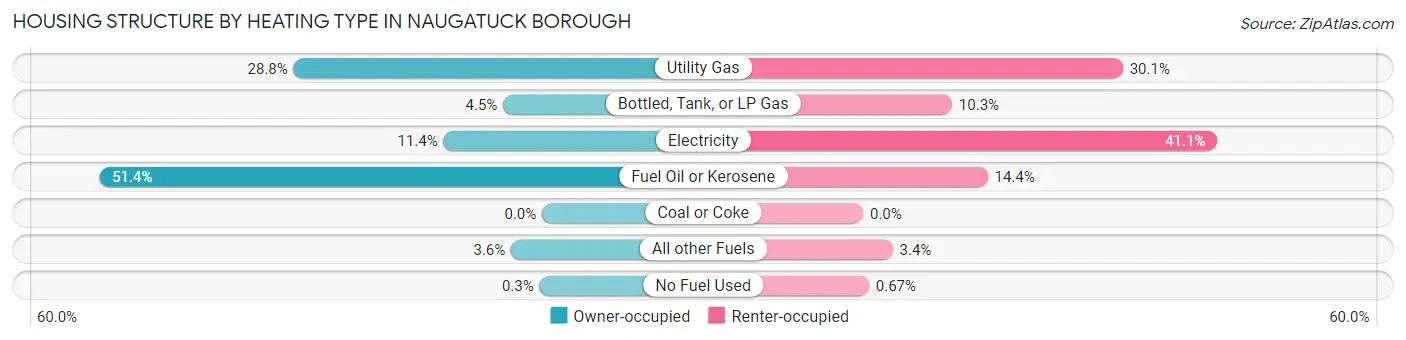
| Heating Type | Owner-occupied | Renter-occupied |
| Utility Gas | 2,329 (28.8%) | 1,256 (30.1%) |
| Bottled, Tank, or LP Gas | 365 (4.5%) | 430 (10.3%) |
| Electricity | 924 (11.4%) | 1,713 (41.1%) |
| Fuel Oil or Kerosene | 4,153 (51.4%) | 602 (14.4%) |
| Coal or Coke | 0 (0.0%) | 0 (0.0%) |
| All other Fuels | 290 (3.6%) | 143 (3.4%) |
| No Fuel Used | 24 (0.3%) | 28 (0.7%) |
| Total | 8,085 (100.0%) | 4,172 (100.0%) |
Household Vehicle Usage in Naugatuck borough
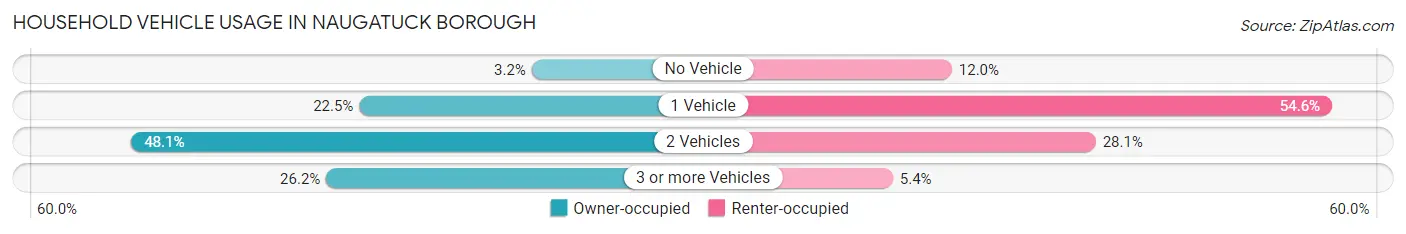
| Vehicles per Household | Owner-occupied | Renter-occupied |
| No Vehicle | 259 (3.2%) | 500 (12.0%) |
| 1 Vehicle | 1,821 (22.5%) | 2,276 (54.5%) |
| 2 Vehicles | 3,885 (48.0%) | 1,172 (28.1%) |
| 3 or more Vehicles | 2,120 (26.2%) | 224 (5.4%) |
| Total | 8,085 (100.0%) | 4,172 (100.0%) |
Real Estate & Mortgages in Naugatuck borough
Real Estate and Mortgage Overview in Naugatuck borough
| Characteristic | Without Mortgage | With Mortgage |
| Housing Units | 2,443 | 5,642 |
| Median Property Value | $200,300 | $234,900 |
| Median Household Income | $88,958 | $1,823 |
| Monthly Housing Costs | $929 | $734 |
| Real Estate Taxes | $5,991 | $135 |
Property Value by Mortgage Status in Naugatuck borough
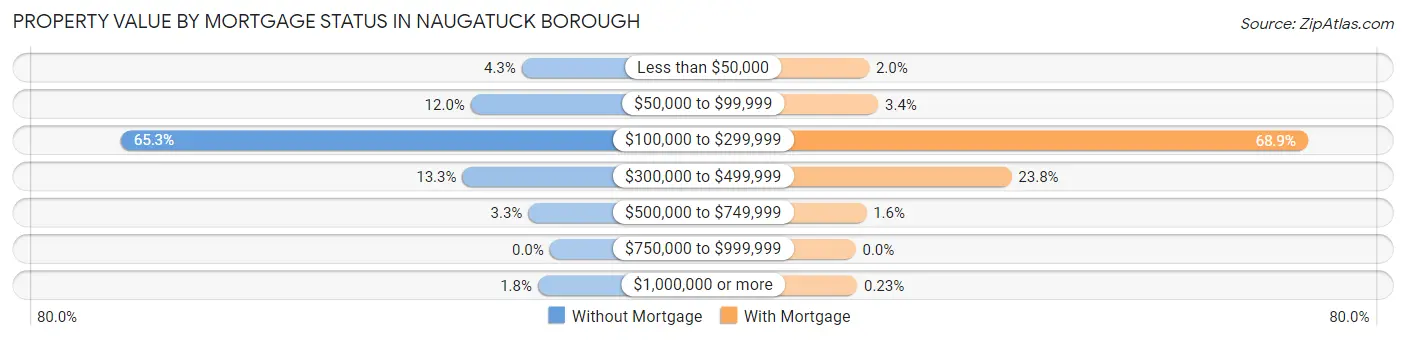
| Property Value | Without Mortgage | With Mortgage |
| Less than $50,000 | 104 (4.3%) | 115 (2.0%) |
| $50,000 to $99,999 | 294 (12.0%) | 194 (3.4%) |
| $100,000 to $299,999 | 1,596 (65.3%) | 3,888 (68.9%) |
| $300,000 to $499,999 | 325 (13.3%) | 1,340 (23.7%) |
| $500,000 to $749,999 | 80 (3.3%) | 92 (1.6%) |
| $750,000 to $999,999 | 0 (0.0%) | 0 (0.0%) |
| $1,000,000 or more | 44 (1.8%) | 13 (0.2%) |
| Total | 2,443 (100.0%) | 5,642 (100.0%) |
Household Income by Mortgage Status in Naugatuck borough
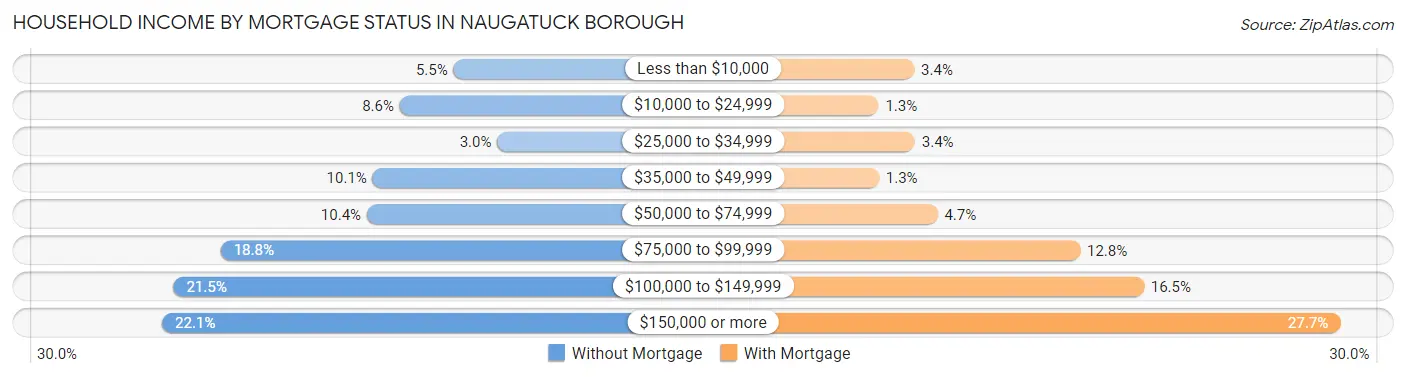
| Household Income | Without Mortgage | With Mortgage |
| Less than $10,000 | 134 (5.5%) | 189 (3.4%) |
| $10,000 to $24,999 | 209 (8.6%) | 74 (1.3%) |
| $25,000 to $34,999 | 73 (3.0%) | 191 (3.4%) |
| $35,000 to $49,999 | 247 (10.1%) | 75 (1.3%) |
| $50,000 to $74,999 | 255 (10.4%) | 264 (4.7%) |
| $75,000 to $99,999 | 459 (18.8%) | 724 (12.8%) |
| $100,000 to $149,999 | 525 (21.5%) | 929 (16.5%) |
| $150,000 or more | 541 (22.1%) | 1,562 (27.7%) |
| Total | 2,443 (100.0%) | 5,642 (100.0%) |
Property Value to Household Income Ratio in Naugatuck borough
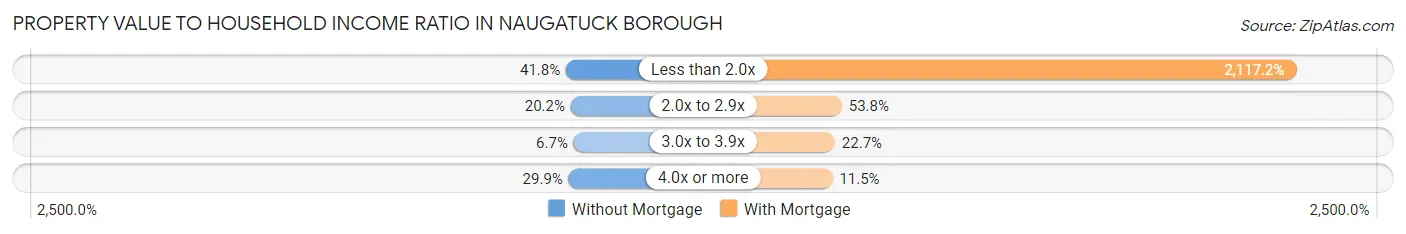
| Value-to-Income Ratio | Without Mortgage | With Mortgage |
| Less than 2.0x | 1,022 (41.8%) | 119,454 (2,117.2%) |
| 2.0x to 2.9x | 493 (20.2%) | 3,035 (53.8%) |
| 3.0x to 3.9x | 163 (6.7%) | 1,280 (22.7%) |
| 4.0x or more | 730 (29.9%) | 648 (11.5%) |
| Total | 2,443 (100.0%) | 5,642 (100.0%) |
Real Estate Taxes by Mortgage Status in Naugatuck borough
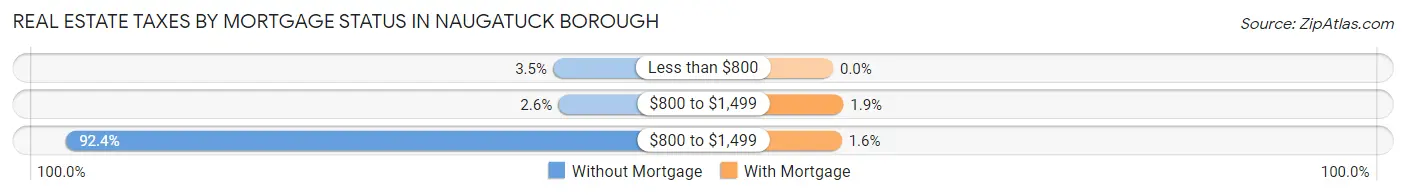
| Property Taxes | Without Mortgage | With Mortgage |
| Less than $800 | 86 (3.5%) | 0 (0.0%) |
| $800 to $1,499 | 63 (2.6%) | 106 (1.9%) |
| $800 to $1,499 | 2,257 (92.4%) | 89 (1.6%) |
| Total | 2,443 (100.0%) | 5,642 (100.0%) |
Health & Disability in Naugatuck borough
Health Insurance Coverage by Age in Naugatuck borough
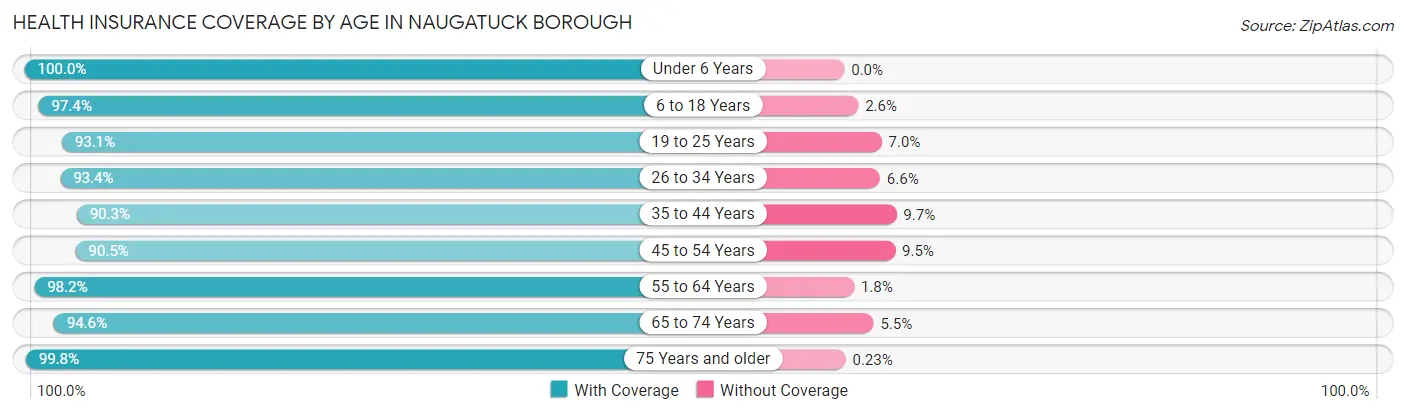
| Age Bracket | With Coverage | Without Coverage |
| Under 6 Years | 1,802 (100.0%) | 0 (0.0%) |
| 6 to 18 Years | 4,535 (97.4%) | 121 (2.6%) |
| 19 to 25 Years | 2,904 (93.0%) | 217 (7.0%) |
| 26 to 34 Years | 4,010 (93.4%) | 285 (6.6%) |
| 35 to 44 Years | 4,161 (90.3%) | 448 (9.7%) |
| 45 to 54 Years | 3,630 (90.5%) | 380 (9.5%) |
| 55 to 64 Years | 4,639 (98.2%) | 85 (1.8%) |
| 65 to 74 Years | 2,379 (94.6%) | 137 (5.4%) |
| 75 Years and older | 1,703 (99.8%) | 4 (0.2%) |
| Total | 29,763 (94.7%) | 1,677 (5.3%) |
Health Insurance Coverage by Citizenship Status in Naugatuck borough
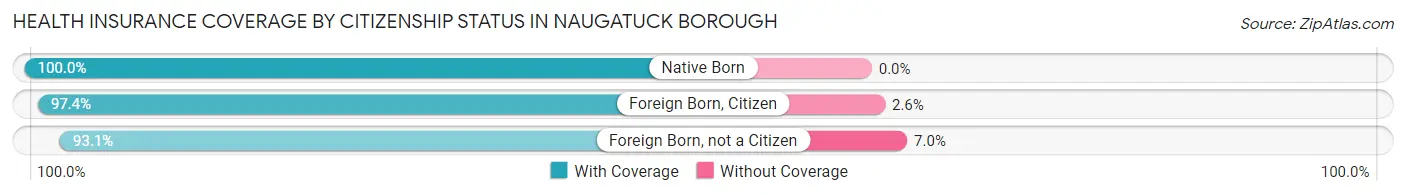
| Citizenship Status | With Coverage | Without Coverage |
| Native Born | 1,802 (100.0%) | 0 (0.0%) |
| Foreign Born, Citizen | 4,535 (97.4%) | 121 (2.6%) |
| Foreign Born, not a Citizen | 2,904 (93.0%) | 217 (7.0%) |
Health Insurance Coverage by Household Income in Naugatuck borough
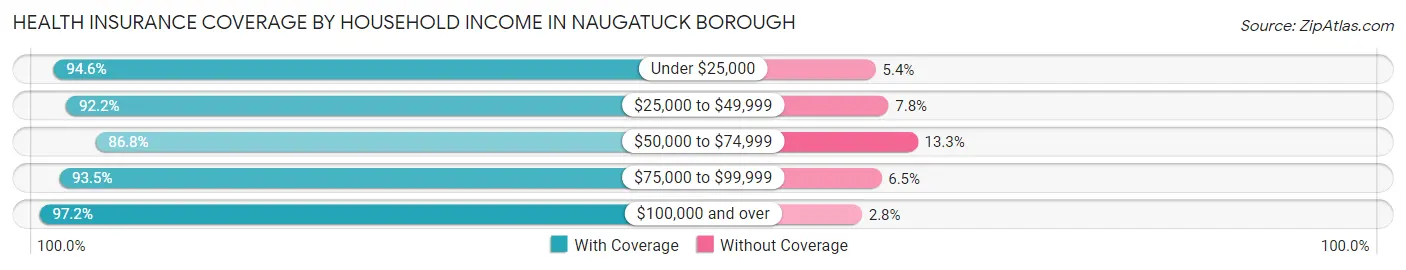
| Household Income | With Coverage | Without Coverage |
| Under $25,000 | 2,031 (94.6%) | 116 (5.4%) |
| $25,000 to $49,999 | 3,375 (92.2%) | 285 (7.8%) |
| $50,000 to $74,999 | 2,939 (86.8%) | 449 (13.3%) |
| $75,000 to $99,999 | 5,130 (93.5%) | 354 (6.5%) |
| $100,000 and over | 16,206 (97.2%) | 469 (2.8%) |
Public vs Private Health Insurance Coverage by Age in Naugatuck borough
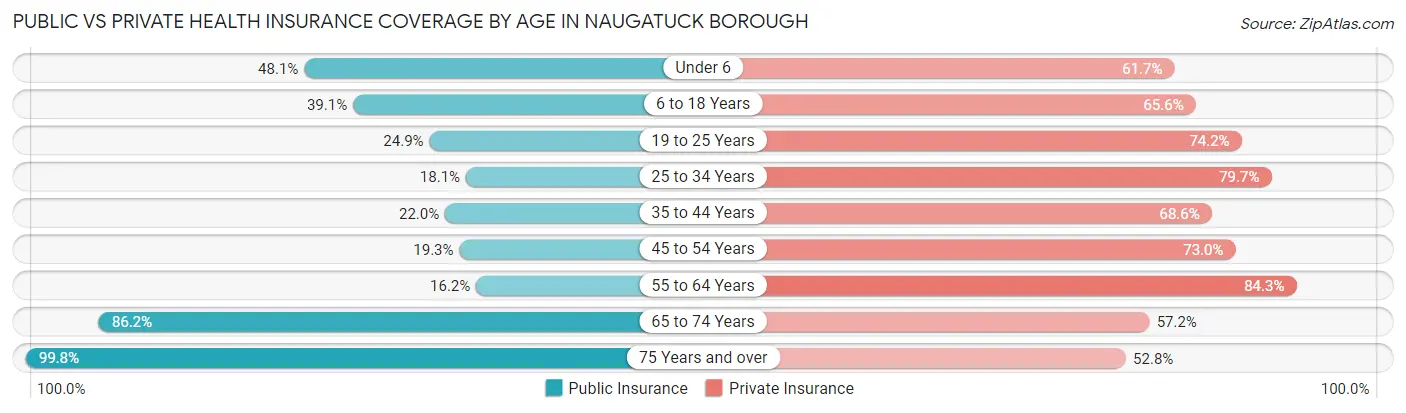
| Age Bracket | Public Insurance | Private Insurance |
| Under 6 | 867 (48.1%) | 1,112 (61.7%) |
| 6 to 18 Years | 1,818 (39.1%) | 3,056 (65.6%) |
| 19 to 25 Years | 776 (24.9%) | 2,315 (74.2%) |
| 25 to 34 Years | 777 (18.1%) | 3,423 (79.7%) |
| 35 to 44 Years | 1,012 (22.0%) | 3,163 (68.6%) |
| 45 to 54 Years | 774 (19.3%) | 2,929 (73.0%) |
| 55 to 64 Years | 765 (16.2%) | 3,984 (84.3%) |
| 65 to 74 Years | 2,169 (86.2%) | 1,438 (57.2%) |
| 75 Years and over | 1,703 (99.8%) | 901 (52.8%) |
| Total | 10,661 (33.9%) | 22,321 (71.0%) |
Disability Status by Sex by Age in Naugatuck borough
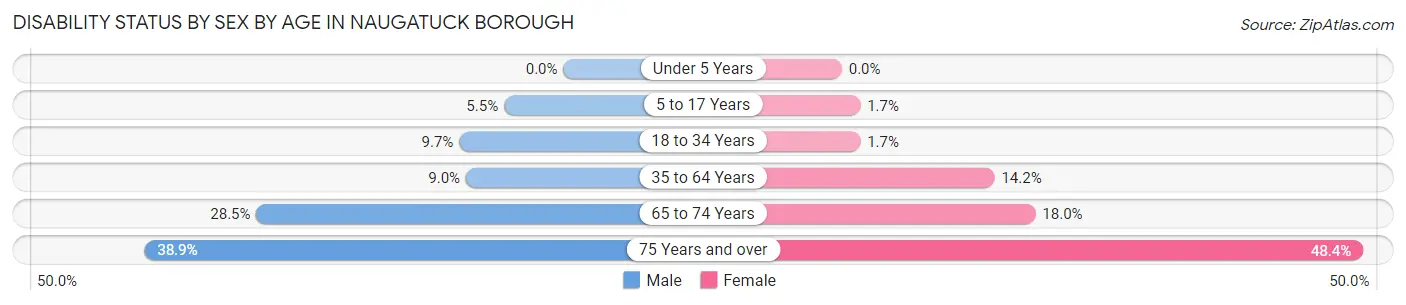
| Age Bracket | Male | Female |
| Under 5 Years | 0 (0.0%) | 0 (0.0%) |
| 5 to 17 Years | 146 (5.5%) | 31 (1.7%) |
| 18 to 34 Years | 397 (9.7%) | 62 (1.7%) |
| 35 to 64 Years | 603 (9.0%) | 945 (14.2%) |
| 65 to 74 Years | 349 (28.5%) | 232 (18.0%) |
| 75 Years and over | 294 (38.9%) | 460 (48.4%) |
Disability Class by Sex by Age in Naugatuck borough
Disability Class: Hearing Difficulty
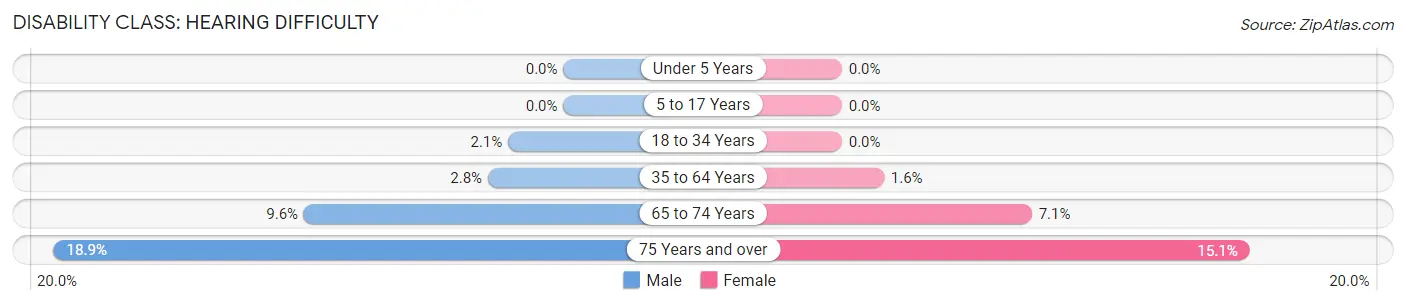
| Age Bracket | Male | Female |
| Under 5 Years | 0 (0.0%) | 0 (0.0%) |
| 5 to 17 Years | 0 (0.0%) | 0 (0.0%) |
| 18 to 34 Years | 84 (2.1%) | 0 (0.0%) |
| 35 to 64 Years | 187 (2.8%) | 104 (1.6%) |
| 65 to 74 Years | 118 (9.6%) | 91 (7.0%) |
| 75 Years and over | 143 (18.9%) | 144 (15.1%) |
Disability Class: Vision Difficulty
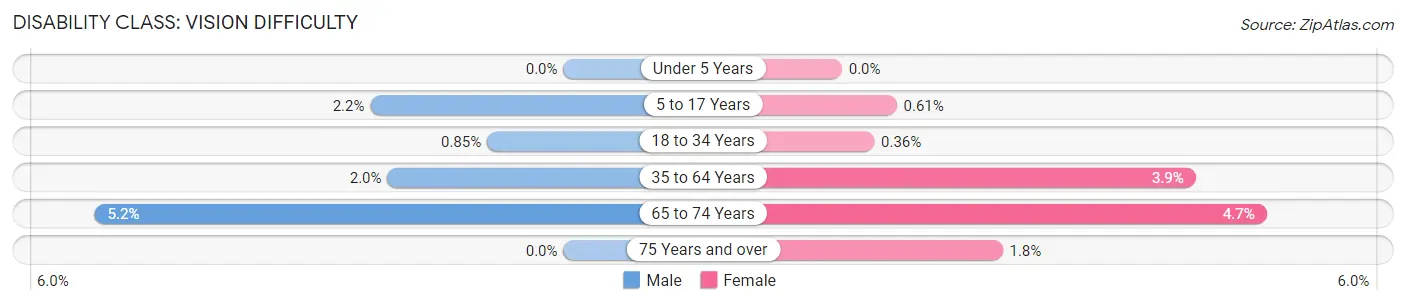
| Age Bracket | Male | Female |
| Under 5 Years | 0 (0.0%) | 0 (0.0%) |
| 5 to 17 Years | 57 (2.1%) | 11 (0.6%) |
| 18 to 34 Years | 35 (0.9%) | 13 (0.4%) |
| 35 to 64 Years | 131 (2.0%) | 263 (3.9%) |
| 65 to 74 Years | 64 (5.2%) | 61 (4.7%) |
| 75 Years and over | 0 (0.0%) | 17 (1.8%) |
Disability Class: Cognitive Difficulty
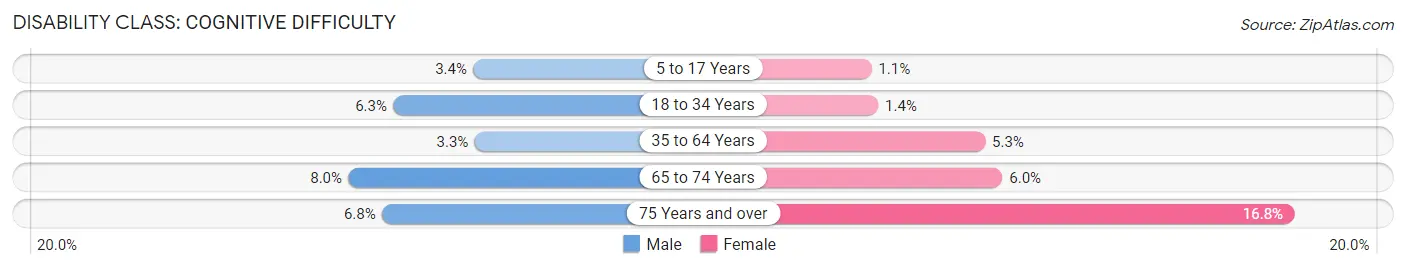
| Age Bracket | Male | Female |
| 5 to 17 Years | 89 (3.4%) | 20 (1.1%) |
| 18 to 34 Years | 260 (6.3%) | 49 (1.3%) |
| 35 to 64 Years | 221 (3.3%) | 355 (5.3%) |
| 65 to 74 Years | 98 (8.0%) | 77 (6.0%) |
| 75 Years and over | 51 (6.8%) | 160 (16.8%) |
Disability Class: Ambulatory Difficulty
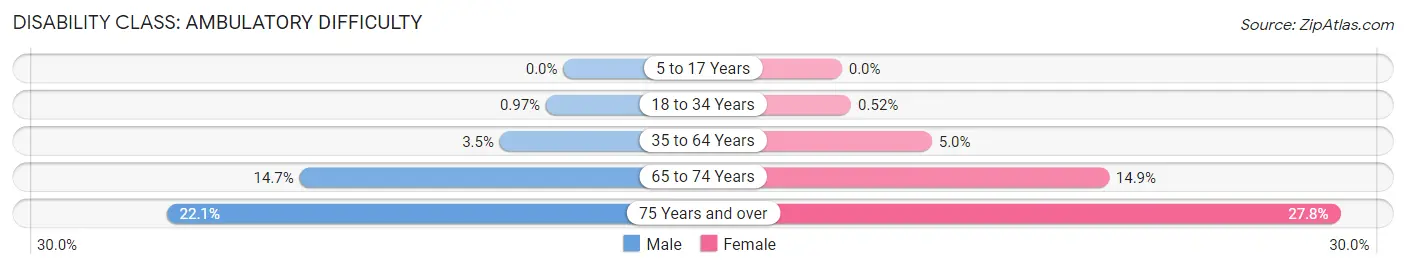
| Age Bracket | Male | Female |
| 5 to 17 Years | 0 (0.0%) | 0 (0.0%) |
| 18 to 34 Years | 40 (1.0%) | 19 (0.5%) |
| 35 to 64 Years | 236 (3.5%) | 334 (5.0%) |
| 65 to 74 Years | 180 (14.7%) | 192 (14.9%) |
| 75 Years and over | 167 (22.1%) | 264 (27.8%) |
Disability Class: Self-Care Difficulty
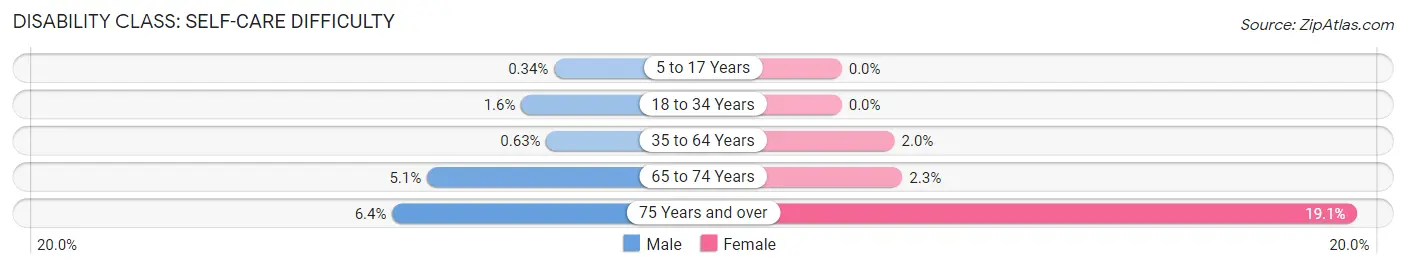
| Age Bracket | Male | Female |
| 5 to 17 Years | 9 (0.3%) | 0 (0.0%) |
| 18 to 34 Years | 64 (1.6%) | 0 (0.0%) |
| 35 to 64 Years | 42 (0.6%) | 131 (2.0%) |
| 65 to 74 Years | 62 (5.1%) | 29 (2.2%) |
| 75 Years and over | 48 (6.4%) | 182 (19.1%) |
Technology Access in Naugatuck borough
Computing Device Access in Naugatuck borough
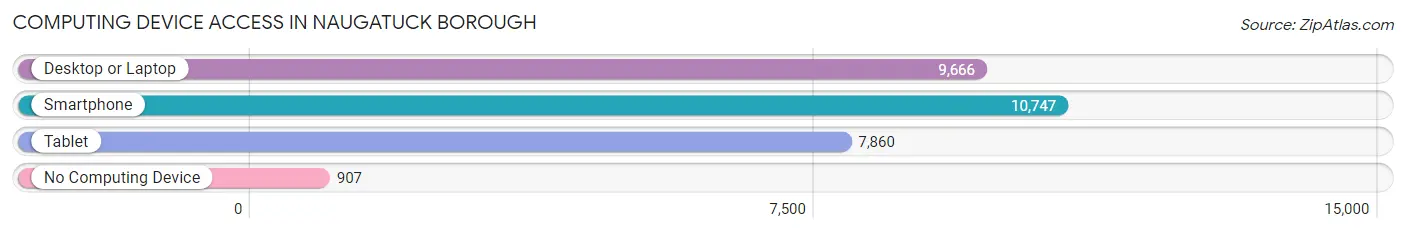
| Device Type | # Households | % Households |
| Desktop or Laptop | 9,666 | 78.9% |
| Smartphone | 10,747 | 87.7% |
| Tablet | 7,860 | 64.1% |
| No Computing Device | 907 | 7.4% |
| Total | 12,257 | 100.0% |
Internet Access in Naugatuck borough
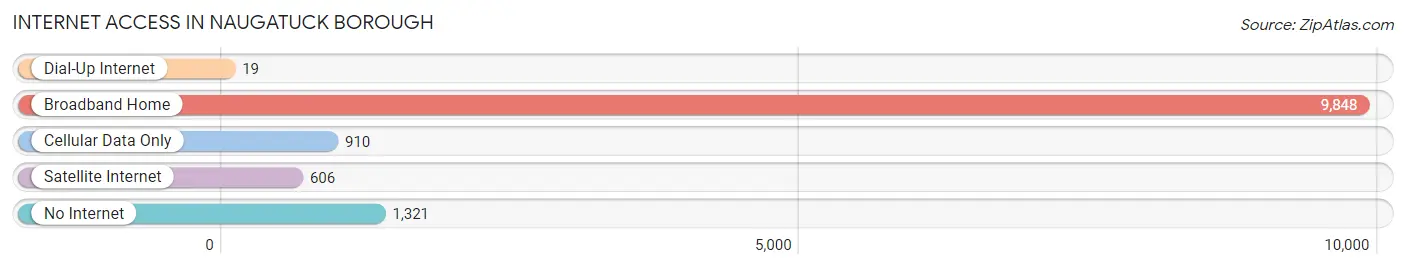
| Internet Type | # Households | % Households |
| Dial-Up Internet | 19 | 0.2% |
| Broadband Home | 9,848 | 80.3% |
| Cellular Data Only | 910 | 7.4% |
| Satellite Internet | 606 | 4.9% |
| No Internet | 1,321 | 10.8% |
| Total | 12,257 | 100.0% |
Naugatuck borough Summary
Naugatuck is a borough located in New Haven County, Connecticut. It is situated in the Naugatuck Valley, which is part of the Greater Waterbury metropolitan area. The borough is bordered by the towns of Beacon Falls, Prospect, Waterbury, and Middlebury. As of the 2010 census, the population of Naugatuck was 31,862.
History
The area that is now Naugatuck was originally inhabited by the Paugusset Native American tribe. The first European settlers arrived in the area in 1678. The town was incorporated in 1844 and was named after the Naugatuck River, which runs through the town.
The town was an important industrial center during the 19th and 20th centuries. It was home to several rubber factories, including the Naugatuck Rubber Company, which was founded in 1844. The company was the largest rubber manufacturer in the world at the time. The town was also home to several other factories, including the Anaconda Copper Company, which produced copper wire and cable.
Geography
Naugatuck is located in the Naugatuck Valley, which is part of the Greater Waterbury metropolitan area. The borough is bordered by the towns of Beacon Falls, Prospect, Waterbury, and Middlebury. The Naugatuck River runs through the town.
The town has a total area of 8.3 square miles, of which 8.2 square miles is land and 0.1 square miles is water. The terrain is mostly flat, with some hills in the northern part of the town.
Economy
Naugatuck is an important industrial center in the region. The town is home to several factories, including the Naugatuck Rubber Company, Anaconda Copper Company, and the Naugatuck Chemical Company. The town is also home to several small businesses, including restaurants, retail stores, and professional services.
Demographics
As of the 2010 census, the population of Naugatuck was 31,862. The racial makeup of the town was 87.3% White, 5.3% African American, 0.5% Native American, 2.2% Asian, 0.1% Pacific Islander, 2.2% from other races, and 2.4% from two or more races. Hispanic or Latino of any race were 8.2% of the population.
The median household income in Naugatuck was $60,945, and the median family income was $71,818. The per capita income was $27,945. About 8.2% of families and 10.2% of the population were below the poverty line, including 14.2% of those under age 18 and 6.2% of those age 65 or over.
Common Questions
What is Per Capita Income in Naugatuck borough?
Per Capita income in Naugatuck borough is $42,211.
What is the Median Family Income in Naugatuck borough?
Median Family Income in Naugatuck borough is $110,521.
What is the Median Household income in Naugatuck borough?
Median Household Income in Naugatuck borough is $91,145.
What is Income or Wage Gap in Naugatuck borough?
Income or Wage Gap in Naugatuck borough is 27.5%.
Women in Naugatuck borough earn 72.5 cents for every dollar earned by a man.
What is Inequality or Gini Index in Naugatuck borough?
Inequality or Gini Index in Naugatuck borough is 0.40.
What is the Total Population of Naugatuck borough?
Total Population of Naugatuck borough is 31,653.
What is the Total Male Population of Naugatuck borough?
Total Male Population of Naugatuck borough is 16,367.
What is the Total Female Population of Naugatuck borough?
Total Female Population of Naugatuck borough is 15,286.
What is the Ratio of Males per 100 Females in Naugatuck borough?
There are 107.07 Males per 100 Females in Naugatuck borough.
What is the Ratio of Females per 100 Males in Naugatuck borough?
There are 93.40 Females per 100 Males in Naugatuck borough.
What is the Median Population Age in Naugatuck borough?
Median Population Age in Naugatuck borough is 38.7 Years.
What is the Average Family Size in Naugatuck borough
Average Family Size in Naugatuck borough is 3.1 People.
What is the Average Household Size in Naugatuck borough
Average Household Size in Naugatuck borough is 2.6 People.
How Large is the Labor Force in Naugatuck borough?
There are 18,878 People in the Labor Forcein in Naugatuck borough.
What is the Percentage of People in the Labor Force in Naugatuck borough?
70.7% of People are in the Labor Force in Naugatuck borough.
What is the Unemployment Rate in Naugatuck borough?
Unemployment Rate in Naugatuck borough is 5.5%.