Stafford Springs, CT Map & Demographics
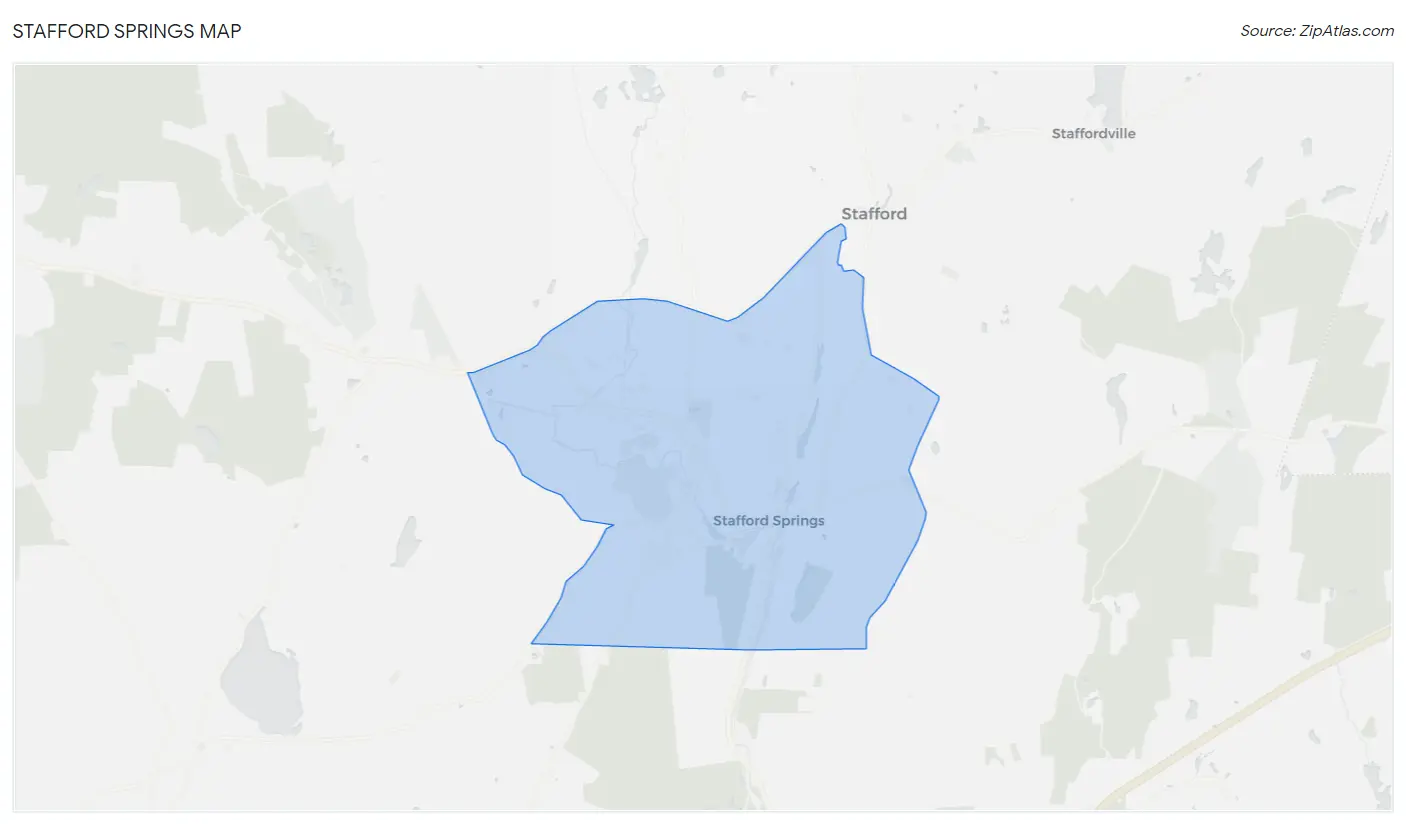
Stafford Springs Map
Stafford Springs Overview
$34,841
PER CAPITA INCOME
$92,708
AVG FAMILY INCOME
$68,929
AVG HOUSEHOLD INCOME
16.1%
WAGE / INCOME GAP [ % ]
83.9¢/ $1
WAGE / INCOME GAP [ $ ]
$15,647
FAMILY INCOME DEFICIT
0.40
INEQUALITY / GINI INDEX
4,890
TOTAL POPULATION
2,273
MALE POPULATION
2,617
FEMALE POPULATION
86.86
MALES / 100 FEMALES
115.13
FEMALES / 100 MALES
43.3
MEDIAN AGE
3.2
AVG FAMILY SIZE
2.4
AVG HOUSEHOLD SIZE
2,504
LABOR FORCE [ PEOPLE ]
64.4%
PERCENT IN LABOR FORCE
6.6%
UNEMPLOYMENT RATE
Stafford Springs Zip Codes
Stafford Springs Area Codes
Income in Stafford Springs
Income Overview in Stafford Springs
Per Capita Income in Stafford Springs is $34,841, while median incomes of families and households are $92,708 and $68,929 respectively.
| Characteristic | Number | Measure |
| Per Capita Income | 4,890 | $34,841 |
| Median Family Income | 1,114 | $92,708 |
| Mean Family Income | 1,114 | $100,732 |
| Median Household Income | 2,056 | $68,929 |
| Mean Household Income | 2,056 | $80,845 |
| Income Deficit | 1,114 | $15,647 |
| Wage / Income Gap (%) | 4,890 | 16.07% |
| Wage / Income Gap ($) | 4,890 | 83.93¢ per $1 |
| Gini / Inequality Index | 4,890 | 0.40 |
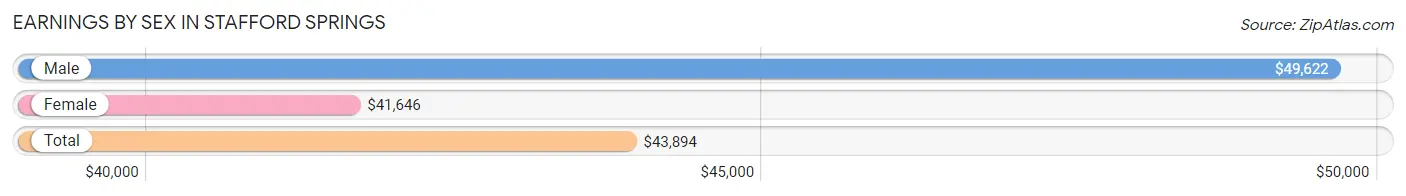
Earnings by Sex in Stafford Springs
Average Earnings in Stafford Springs are $43,894, $49,622 for men and $41,646 for women, a difference of 16.1%.
| Sex | Number | Average Earnings |
| Male | 1,229 (49.2%) | $49,622 |
| Female | 1,270 (50.8%) | $41,646 |
| Total | 2,499 (100.0%) | $43,894 |
Earnings by Sex by Income Bracket in Stafford Springs
The most common earnings brackets in Stafford Springs are $30,000 to $34,999 for men (189 | 15.4%) and $40,000 to $44,999 for women (195 | 15.3%).
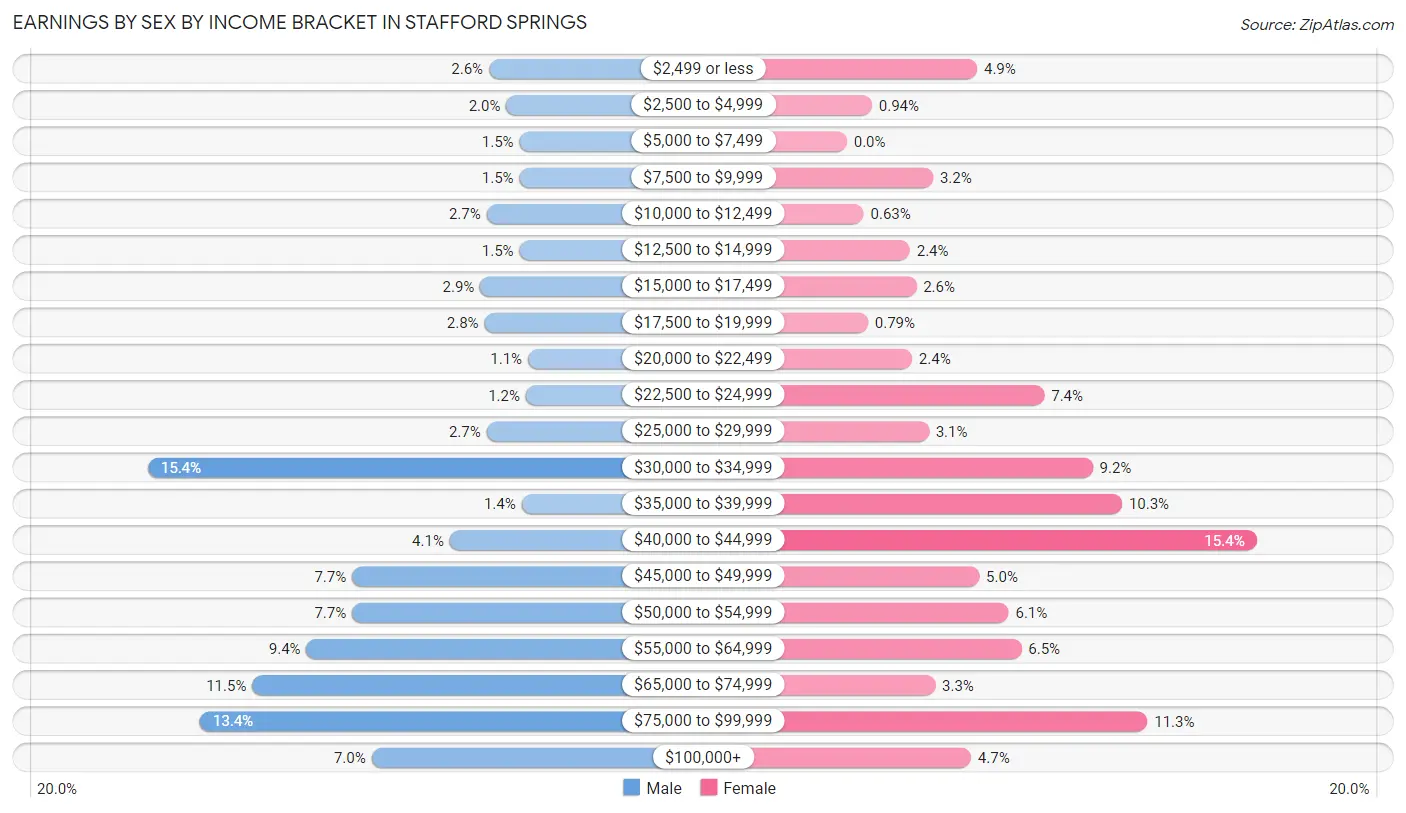
| Income | Male | Female |
| $2,499 or less | 32 (2.6%) | 62 (4.9%) |
| $2,500 to $4,999 | 24 (1.9%) | 12 (0.9%) |
| $5,000 to $7,499 | 18 (1.5%) | 0 (0.0%) |
| $7,500 to $9,999 | 18 (1.5%) | 41 (3.2%) |
| $10,000 to $12,499 | 33 (2.7%) | 8 (0.6%) |
| $12,500 to $14,999 | 18 (1.5%) | 30 (2.4%) |
| $15,000 to $17,499 | 36 (2.9%) | 33 (2.6%) |
| $17,500 to $19,999 | 34 (2.8%) | 10 (0.8%) |
| $20,000 to $22,499 | 14 (1.1%) | 31 (2.4%) |
| $22,500 to $24,999 | 15 (1.2%) | 94 (7.4%) |
| $25,000 to $29,999 | 33 (2.7%) | 39 (3.1%) |
| $30,000 to $34,999 | 189 (15.4%) | 117 (9.2%) |
| $35,000 to $39,999 | 17 (1.4%) | 131 (10.3%) |
| $40,000 to $44,999 | 50 (4.1%) | 195 (15.3%) |
| $45,000 to $49,999 | 95 (7.7%) | 63 (5.0%) |
| $50,000 to $54,999 | 95 (7.7%) | 77 (6.1%) |
| $55,000 to $64,999 | 116 (9.4%) | 83 (6.5%) |
| $65,000 to $74,999 | 141 (11.5%) | 42 (3.3%) |
| $75,000 to $99,999 | 165 (13.4%) | 143 (11.3%) |
| $100,000+ | 86 (7.0%) | 59 (4.6%) |
| Total | 1,229 (100.0%) | 1,270 (100.0%) |
Earnings by Sex by Educational Attainment in Stafford Springs
Average earnings in Stafford Springs are $51,132 for men and $43,206 for women, a difference of 15.5%. Men with an educational attainment of bachelor's degree enjoy the highest average annual earnings of $53,750, while those with graduate degree education earn the least with $2,499. Women with an educational attainment of graduate degree earn the most with the average annual earnings of $103,036, while those with college or associate's degree education have the smallest earnings of $35,170.
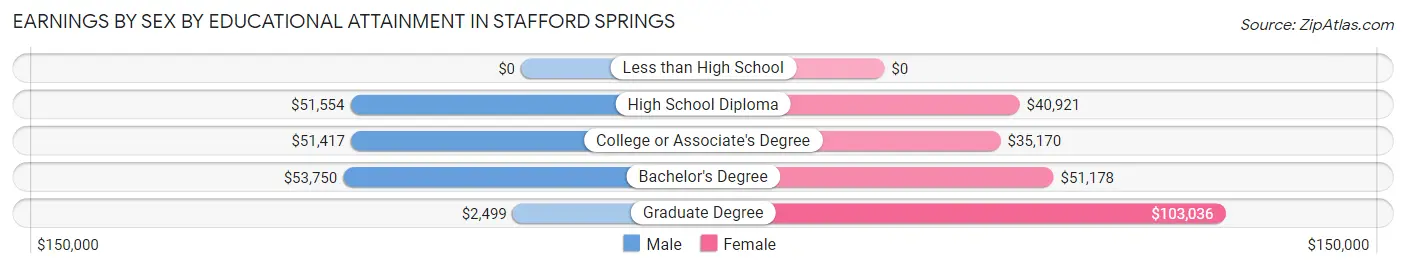
| Educational Attainment | Male Income | Female Income |
| Less than High School | - | - |
| High School Diploma | $51,554 | $40,921 |
| College or Associate's Degree | $51,417 | $35,170 |
| Bachelor's Degree | $53,750 | $51,178 |
| Graduate Degree | $2,499 | $103,036 |
| Total | $51,132 | $43,206 |
Family Income in Stafford Springs
Family Income Brackets in Stafford Springs
According to the Stafford Springs family income data, there are 296 families falling into the $100,000 to $149,999 income range, which is the most common income bracket and makes up 26.6% of all families.
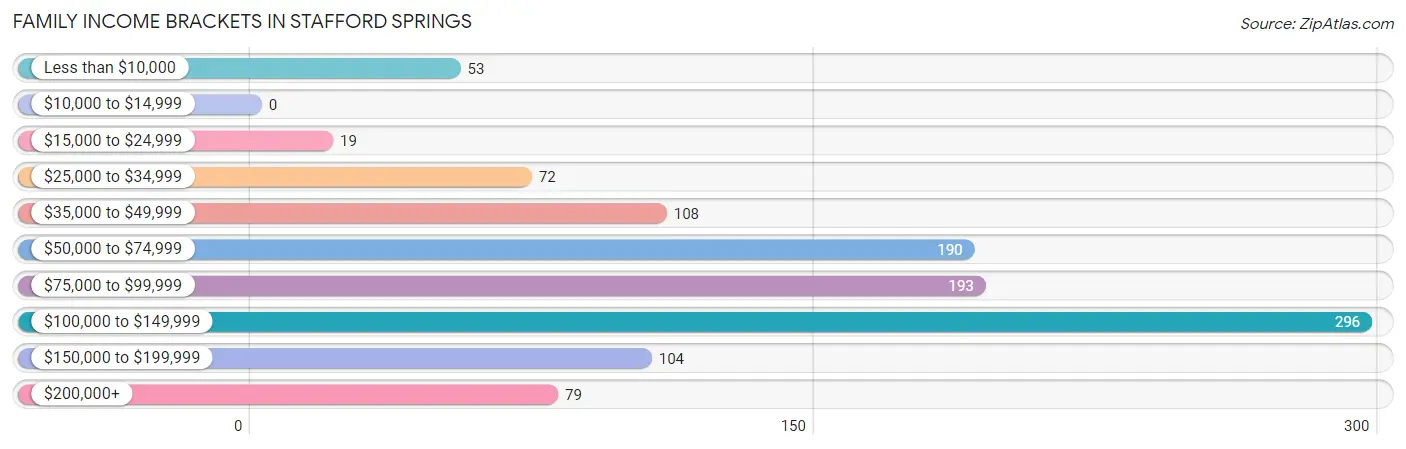
| Income Bracket | # Families | % Families |
| Less than $10,000 | 53 | 4.8% |
| $10,000 to $14,999 | 0 | 0.0% |
| $15,000 to $24,999 | 19 | 1.7% |
| $25,000 to $34,999 | 72 | 6.5% |
| $35,000 to $49,999 | 108 | 9.7% |
| $50,000 to $74,999 | 190 | 17.1% |
| $75,000 to $99,999 | 193 | 17.3% |
| $100,000 to $149,999 | 296 | 26.6% |
| $150,000 to $199,999 | 104 | 9.3% |
| $200,000+ | 79 | 7.1% |
Family Income by Famaliy Size in Stafford Springs
5-person families (103 | 9.2%) account for the highest median family income in Stafford Springs with $148,750 per family, while 2-person families (540 | 48.5%) have the highest median income of $46,250 per family member.
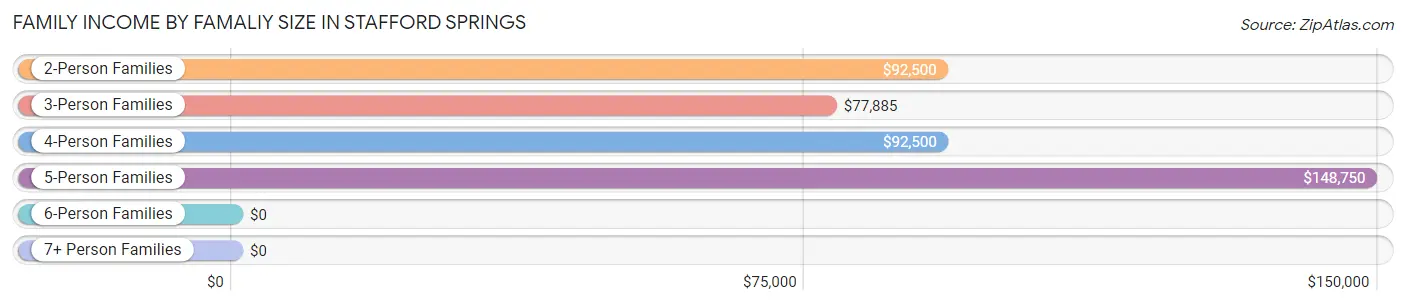
| Income Bracket | # Families | Median Income |
| 2-Person Families | 540 (48.5%) | $92,500 |
| 3-Person Families | 284 (25.5%) | $77,885 |
| 4-Person Families | 120 (10.8%) | $92,500 |
| 5-Person Families | 103 (9.2%) | $148,750 |
| 6-Person Families | 29 (2.6%) | $0 |
| 7+ Person Families | 38 (3.4%) | $0 |
| Total | 1,114 (100.0%) | $92,708 |
Family Income by Number of Earners in Stafford Springs
The median family income in Stafford Springs is $92,708, with families comprising 2 earners (465) having the highest median family income of $130,531, while families with 1 earner (354) have the lowest median family income of $57,115, accounting for 41.7% and 31.8% of families, respectively.
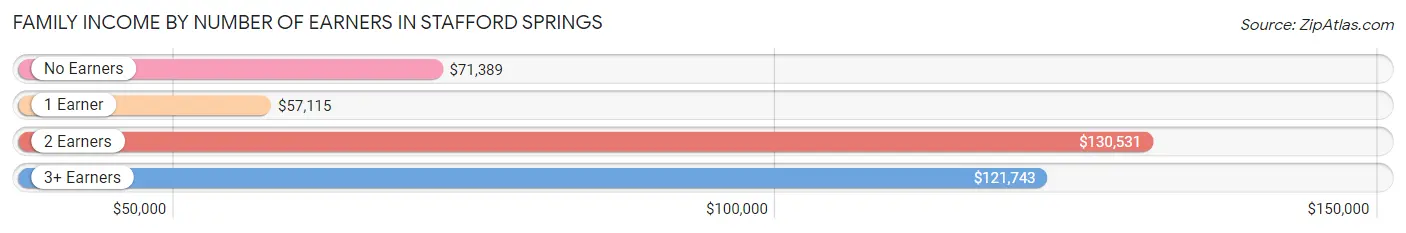
| Number of Earners | # Families | Median Income |
| No Earners | 176 (15.8%) | $71,389 |
| 1 Earner | 354 (31.8%) | $57,115 |
| 2 Earners | 465 (41.7%) | $130,531 |
| 3+ Earners | 119 (10.7%) | $121,743 |
| Total | 1,114 (100.0%) | $92,708 |
Household Income in Stafford Springs
Household Income Brackets in Stafford Springs
With 374 households falling in the category, the $100,000 to $149,999 income range is the most frequent in Stafford Springs, accounting for 18.2% of all households. In contrast, only 78 households (3.8%) fall into the $200,000+ income bracket, making it the least populous group.
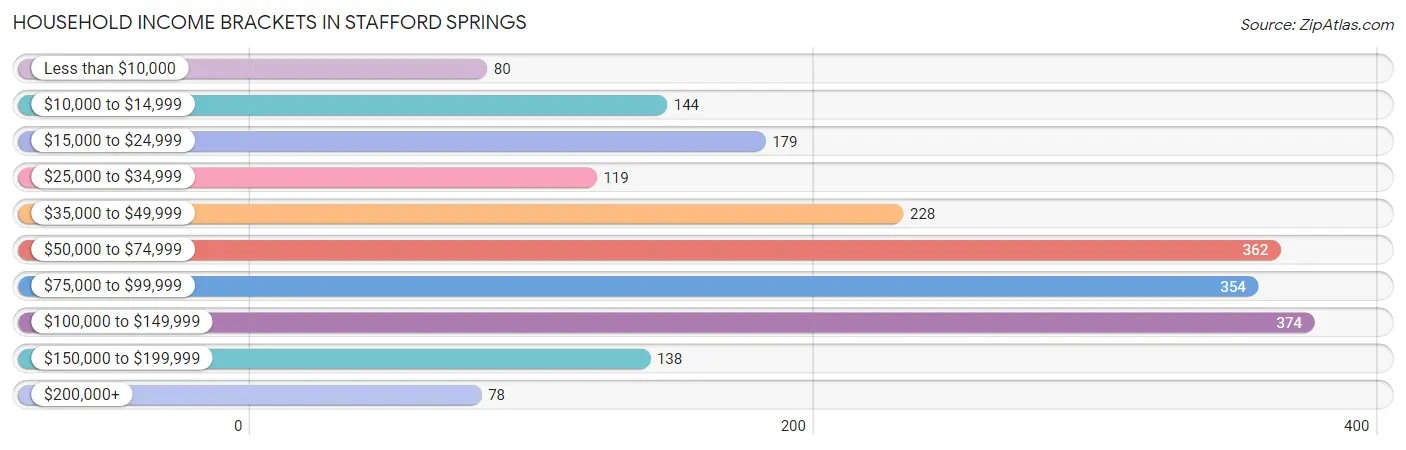
| Income Bracket | # Households | % Households |
| Less than $10,000 | 80 | 3.9% |
| $10,000 to $14,999 | 144 | 7.0% |
| $15,000 to $24,999 | 179 | 8.7% |
| $25,000 to $34,999 | 119 | 5.8% |
| $35,000 to $49,999 | 228 | 11.1% |
| $50,000 to $74,999 | 362 | 17.6% |
| $75,000 to $99,999 | 354 | 17.2% |
| $100,000 to $149,999 | 374 | 18.2% |
| $150,000 to $199,999 | 138 | 6.7% |
| $200,000+ | 78 | 3.8% |
Household Income by Householder Age in Stafford Springs
The median household income in Stafford Springs is $68,929, with the highest median household income of $99,063 found in the 25 to 44 years age bracket for the primary householder. A total of 568 households (27.6%) fall into this category. Meanwhile, the 65+ years age bracket for the primary householder has the lowest median household income of $36,563, with 723 households (35.2%) in this group.
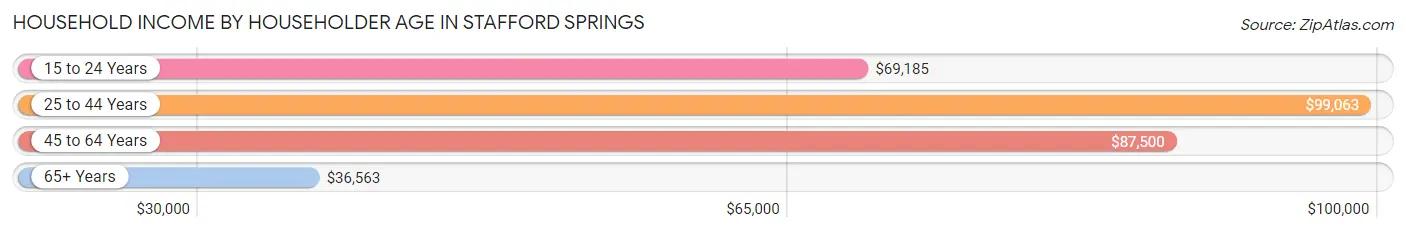
| Income Bracket | # Households | Median Income |
| 15 to 24 Years | 91 (4.4%) | $69,185 |
| 25 to 44 Years | 568 (27.6%) | $99,063 |
| 45 to 64 Years | 674 (32.8%) | $87,500 |
| 65+ Years | 723 (35.2%) | $36,563 |
| Total | 2,056 (100.0%) | $68,929 |
Poverty in Stafford Springs
Income Below Poverty by Sex and Age in Stafford Springs
With 8.9% poverty level for males and 9.2% for females among the residents of Stafford Springs, 65 to 74 year old males and under 5 year old females are the most vulnerable to poverty, with 53 males (20.2%) and 44 females (28.2%) in their respective age groups living below the poverty level.
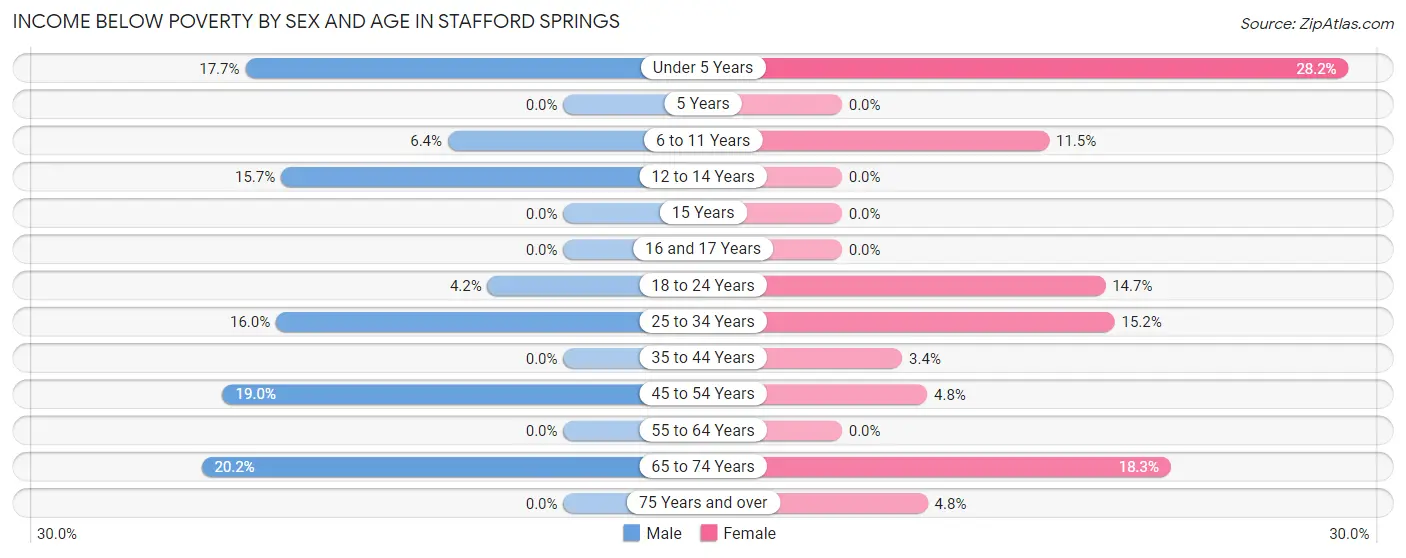
| Age Bracket | Male | Female |
| Under 5 Years | 34 (17.7%) | 44 (28.2%) |
| 5 Years | 0 (0.0%) | 0 (0.0%) |
| 6 to 11 Years | 9 (6.4%) | 21 (11.5%) |
| 12 to 14 Years | 25 (15.7%) | 0 (0.0%) |
| 15 Years | 0 (0.0%) | 0 (0.0%) |
| 16 and 17 Years | 0 (0.0%) | 0 (0.0%) |
| 18 to 24 Years | 7 (4.2%) | 22 (14.7%) |
| 25 to 34 Years | 40 (16.0%) | 43 (15.2%) |
| 35 to 44 Years | 0 (0.0%) | 10 (3.4%) |
| 45 to 54 Years | 33 (19.0%) | 18 (4.8%) |
| 55 to 64 Years | 0 (0.0%) | 0 (0.0%) |
| 65 to 74 Years | 53 (20.2%) | 72 (18.3%) |
| 75 Years and over | 0 (0.0%) | 11 (4.8%) |
| Total | 201 (8.9%) | 241 (9.2%) |
Income Above Poverty by Sex and Age in Stafford Springs
According to the poverty statistics in Stafford Springs, males aged 15 years and females aged 5 years are the age groups that are most secure financially, with 100.0% of males and 100.0% of females in these age groups living above the poverty line.
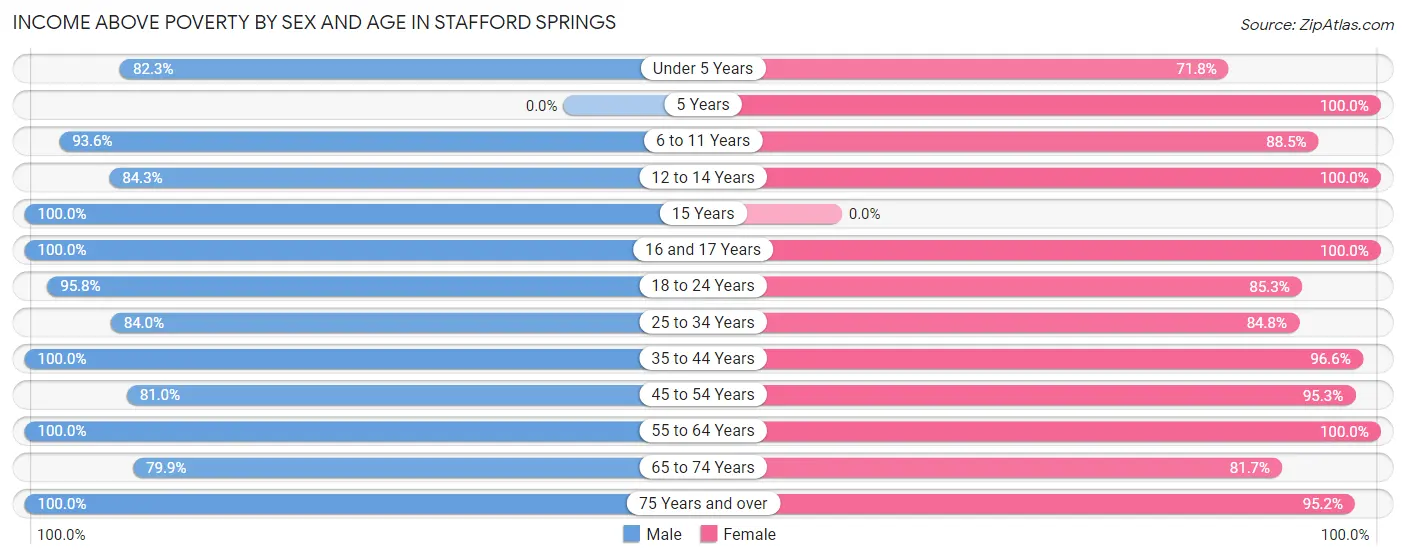
| Age Bracket | Male | Female |
| Under 5 Years | 158 (82.3%) | 112 (71.8%) |
| 5 Years | 0 (0.0%) | 8 (100.0%) |
| 6 to 11 Years | 131 (93.6%) | 161 (88.5%) |
| 12 to 14 Years | 134 (84.3%) | 100 (100.0%) |
| 15 Years | 43 (100.0%) | 0 (0.0%) |
| 16 and 17 Years | 28 (100.0%) | 124 (100.0%) |
| 18 to 24 Years | 159 (95.8%) | 128 (85.3%) |
| 25 to 34 Years | 210 (84.0%) | 240 (84.8%) |
| 35 to 44 Years | 316 (100.0%) | 288 (96.6%) |
| 45 to 54 Years | 141 (81.0%) | 361 (95.3%) |
| 55 to 64 Years | 346 (100.0%) | 314 (100.0%) |
| 65 to 74 Years | 210 (79.8%) | 321 (81.7%) |
| 75 Years and over | 174 (100.0%) | 219 (95.2%) |
| Total | 2,050 (91.1%) | 2,376 (90.8%) |
Income Below Poverty Among Married-Couple Families in Stafford Springs
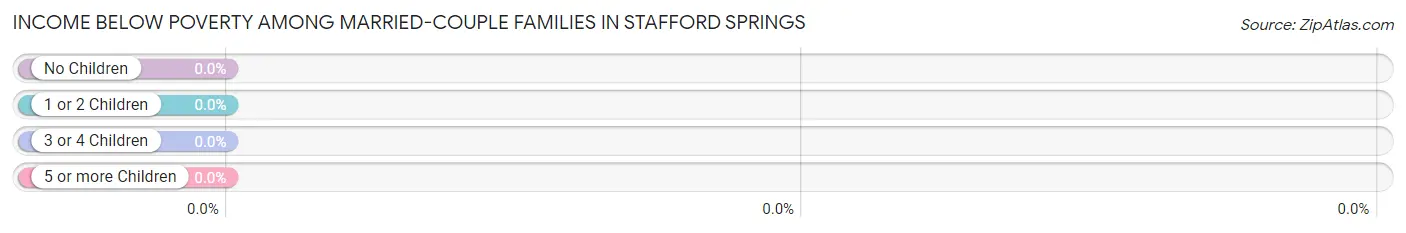
| Children | Above Poverty | Below Poverty |
| No Children | 482 (100.0%) | 0 (0.0%) |
| 1 or 2 Children | 180 (100.0%) | 0 (0.0%) |
| 3 or 4 Children | 119 (100.0%) | 0 (0.0%) |
| 5 or more Children | 0 (0.0%) | 0 (0.0%) |
| Total | 781 (100.0%) | 0 (0.0%) |
Income Below Poverty Among Single-Parent Households in Stafford Springs
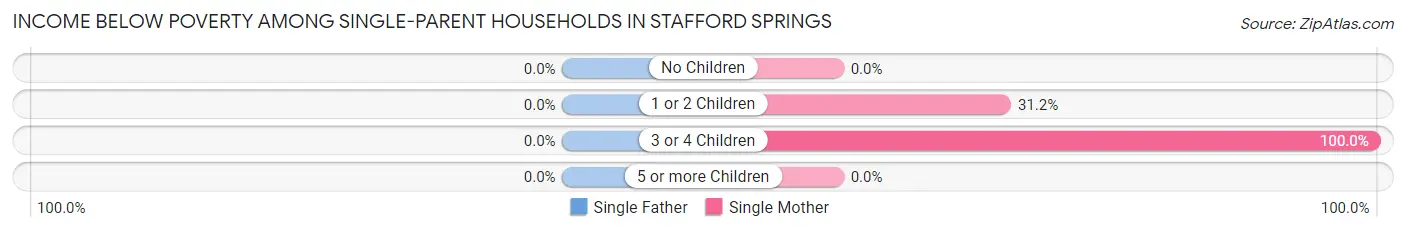
| Children | Single Father | Single Mother |
| No Children | 0 (0.0%) | 0 (0.0%) |
| 1 or 2 Children | 0 (0.0%) | 53 (31.2%) |
| 3 or 4 Children | 0 (0.0%) | 19 (100.0%) |
| 5 or more Children | 0 (0.0%) | 0 (0.0%) |
| Total | 0 (0.0%) | 72 (30.2%) |
Income Below Poverty Among Married-Couple vs Single-Parent Households in Stafford Springs
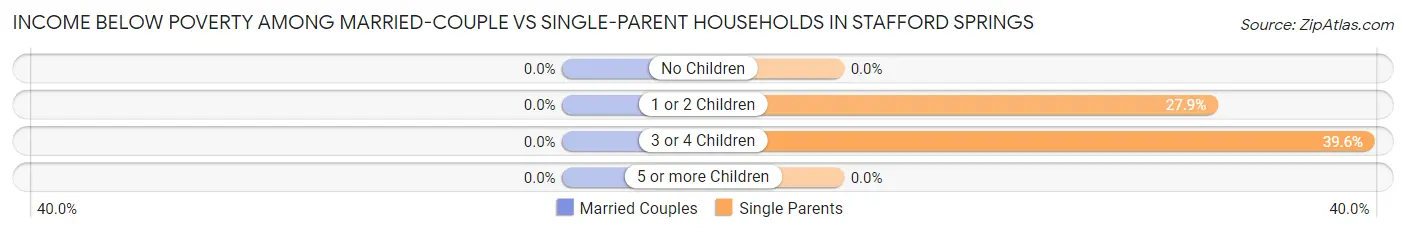
| Children | Married-Couple Families | Single-Parent Households |
| No Children | 0 (0.0%) | 0 (0.0%) |
| 1 or 2 Children | 0 (0.0%) | 53 (27.9%) |
| 3 or 4 Children | 0 (0.0%) | 19 (39.6%) |
| 5 or more Children | 0 (0.0%) | 0 (0.0%) |
| Total | 0 (0.0%) | 72 (21.6%) |
Race in Stafford Springs
The most populous races in Stafford Springs are White / Caucasian (4,590 | 93.9%), Hispanic or Latino (376 | 7.7%), and Two or more Races (290 | 5.9%).
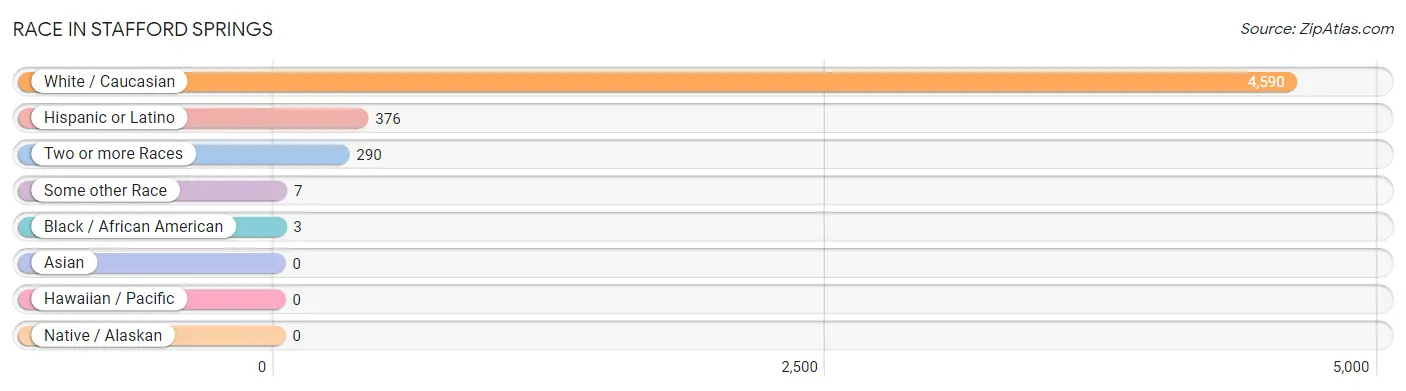
| Race | # Population | % Population |
| Asian | 0 | 0.0% |
| Black / African American | 3 | 0.1% |
| Hawaiian / Pacific | 0 | 0.0% |
| Hispanic or Latino | 376 | 7.7% |
| Native / Alaskan | 0 | 0.0% |
| White / Caucasian | 4,590 | 93.9% |
| Two or more Races | 290 | 5.9% |
| Some other Race | 7 | 0.1% |
| Total | 4,890 | 100.0% |
Ancestry in Stafford Springs
The most populous ancestries reported in Stafford Springs are Italian (1,093 | 22.4%), Irish (708 | 14.5%), French (520 | 10.6%), German (520 | 10.6%), and Polish (488 | 10.0%), together accounting for 68.1% of all Stafford Springs residents.
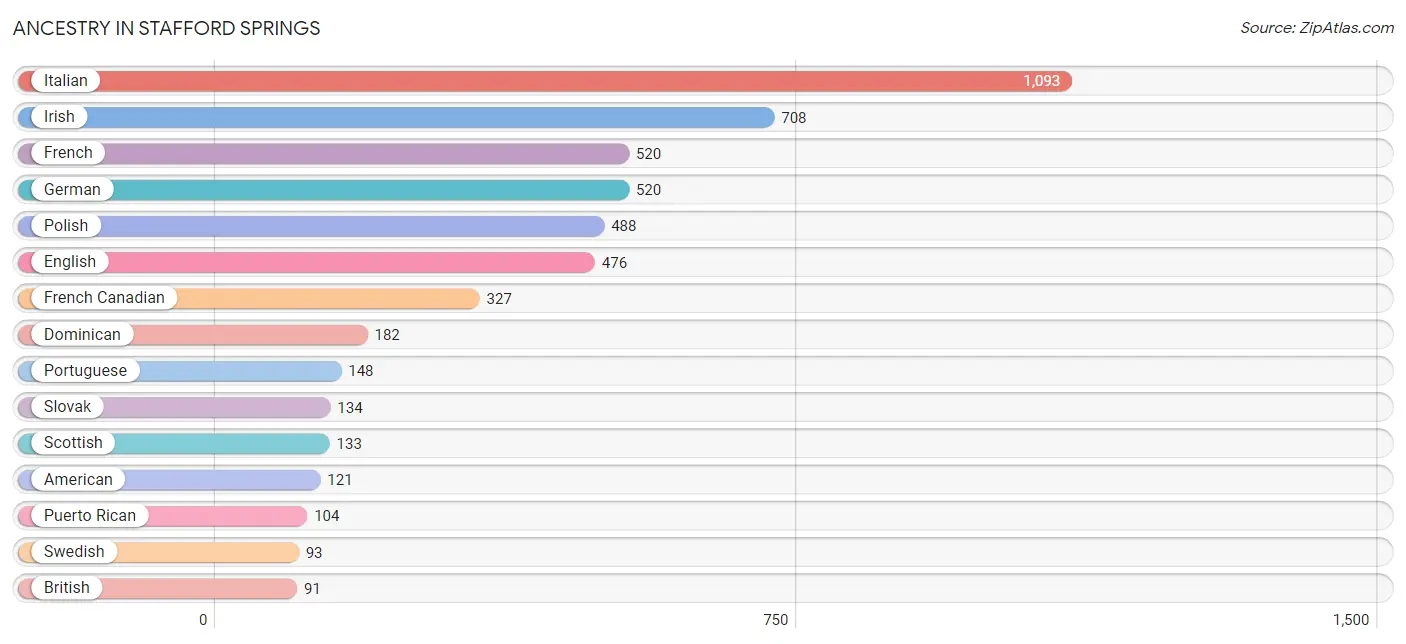
| Ancestry | # Population | % Population |
| American | 121 | 2.5% |
| Arab | 72 | 1.5% |
| Argentinean | 14 | 0.3% |
| Armenian | 22 | 0.4% |
| Austrian | 9 | 0.2% |
| British | 91 | 1.9% |
| Canadian | 7 | 0.1% |
| Central American | 14 | 0.3% |
| Colombian | 26 | 0.5% |
| Czech | 37 | 0.8% |
| Danish | 6 | 0.1% |
| Dominican | 182 | 3.7% |
| Dutch | 65 | 1.3% |
| Eastern European | 8 | 0.2% |
| English | 476 | 9.7% |
| European | 8 | 0.2% |
| Finnish | 8 | 0.2% |
| French | 520 | 10.6% |
| French Canadian | 327 | 6.7% |
| German | 520 | 10.6% |
| Greek | 26 | 0.5% |
| Hungarian | 11 | 0.2% |
| Irish | 708 | 14.5% |
| Italian | 1,093 | 22.4% |
| Jamaican | 18 | 0.4% |
| Mexican | 15 | 0.3% |
| Nicaraguan | 14 | 0.3% |
| Norwegian | 9 | 0.2% |
| Peruvian | 9 | 0.2% |
| Polish | 488 | 10.0% |
| Portuguese | 148 | 3.0% |
| Puerto Rican | 104 | 2.1% |
| Russian | 31 | 0.6% |
| Scandinavian | 9 | 0.2% |
| Scotch-Irish | 28 | 0.6% |
| Scottish | 133 | 2.7% |
| Slovak | 134 | 2.7% |
| South American | 49 | 1.0% |
| Spanish | 12 | 0.3% |
| Swedish | 93 | 1.9% |
| Swiss | 9 | 0.2% |
| Syrian | 22 | 0.4% |
| Ukrainian | 8 | 0.2% |
| Welsh | 27 | 0.5% | View All 44 Rows |
Immigrants in Stafford Springs
The most numerous immigrant groups reported in Stafford Springs came from Canada (49 | 1.0%), Latin America (47 | 1.0%), South America (40 | 0.8%), Colombia (26 | 0.5%), and Africa (20 | 0.4%), together accounting for 3.7% of all Stafford Springs residents.
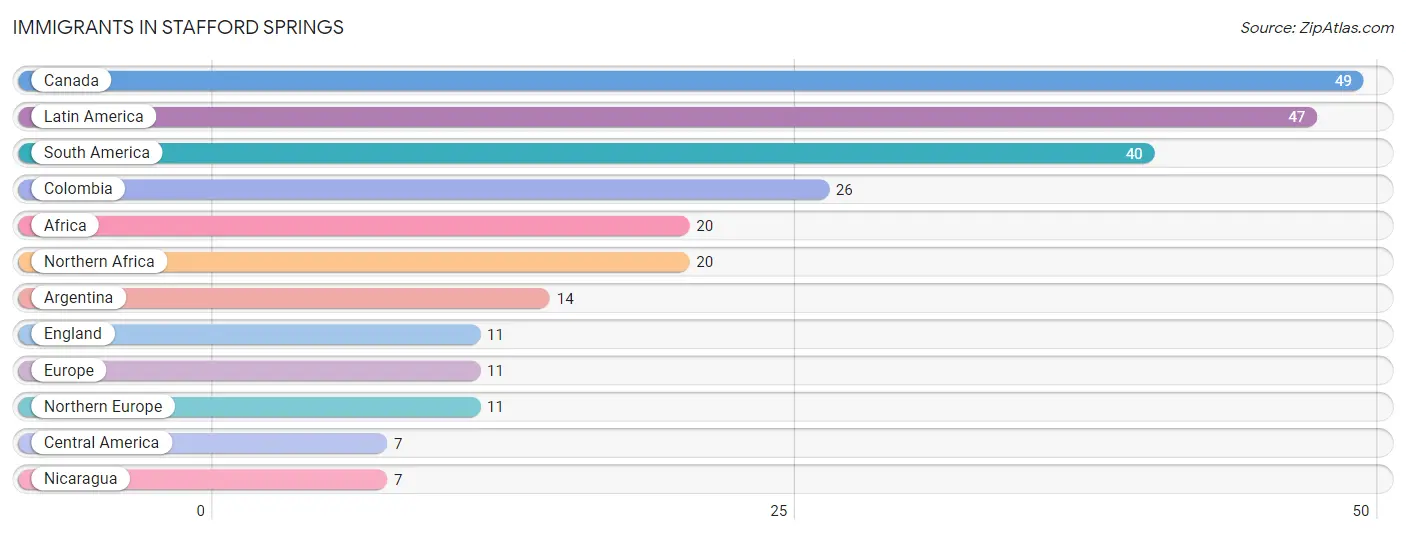
| Immigration Origin | # Population | % Population |
| Africa | 20 | 0.4% |
| Argentina | 14 | 0.3% |
| Canada | 49 | 1.0% |
| Central America | 7 | 0.1% |
| Colombia | 26 | 0.5% |
| England | 11 | 0.2% |
| Europe | 11 | 0.2% |
| Latin America | 47 | 1.0% |
| Nicaragua | 7 | 0.1% |
| Northern Africa | 20 | 0.4% |
| Northern Europe | 11 | 0.2% |
| South America | 40 | 0.8% | View All 12 Rows |
Sex and Age in Stafford Springs
Sex and Age in Stafford Springs
The most populous age groups in Stafford Springs are 40 to 44 Years (209 | 9.2%) for men and 65 to 69 Years (277 | 10.6%) for women.
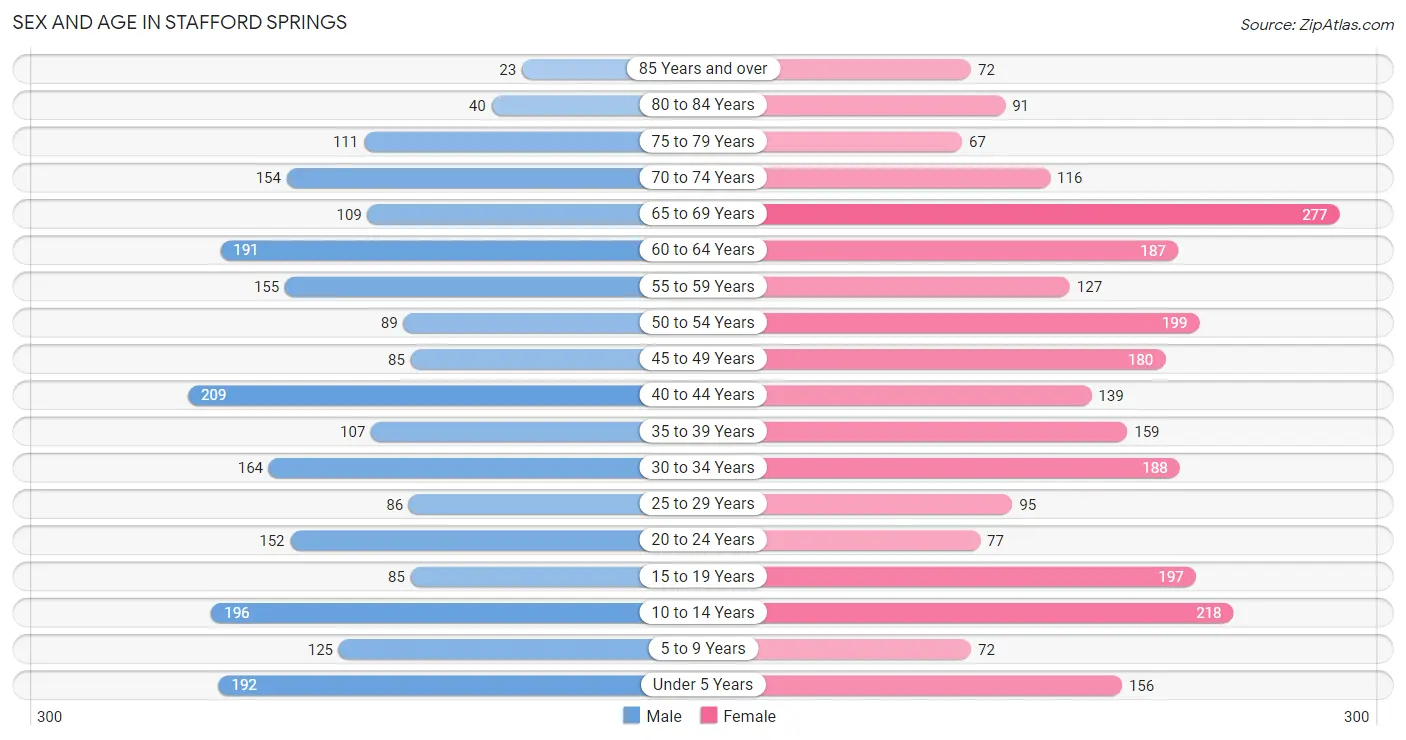
| Age Bracket | Male | Female |
| Under 5 Years | 192 (8.5%) | 156 (6.0%) |
| 5 to 9 Years | 125 (5.5%) | 72 (2.8%) |
| 10 to 14 Years | 196 (8.6%) | 218 (8.3%) |
| 15 to 19 Years | 85 (3.7%) | 197 (7.5%) |
| 20 to 24 Years | 152 (6.7%) | 77 (2.9%) |
| 25 to 29 Years | 86 (3.8%) | 95 (3.6%) |
| 30 to 34 Years | 164 (7.2%) | 188 (7.2%) |
| 35 to 39 Years | 107 (4.7%) | 159 (6.1%) |
| 40 to 44 Years | 209 (9.2%) | 139 (5.3%) |
| 45 to 49 Years | 85 (3.7%) | 180 (6.9%) |
| 50 to 54 Years | 89 (3.9%) | 199 (7.6%) |
| 55 to 59 Years | 155 (6.8%) | 127 (4.9%) |
| 60 to 64 Years | 191 (8.4%) | 187 (7.1%) |
| 65 to 69 Years | 109 (4.8%) | 277 (10.6%) |
| 70 to 74 Years | 154 (6.8%) | 116 (4.4%) |
| 75 to 79 Years | 111 (4.9%) | 67 (2.6%) |
| 80 to 84 Years | 40 (1.8%) | 91 (3.5%) |
| 85 Years and over | 23 (1.0%) | 72 (2.8%) |
| Total | 2,273 (100.0%) | 2,617 (100.0%) |
Families and Households in Stafford Springs
Median Family Size in Stafford Springs
The median family size in Stafford Springs is 3.23 persons per family, with single male/father families (95 | 8.5%) accounting for the largest median family size of 4.19 persons per family. On the other hand, single female/mother families (238 | 21.4%) represent the smallest median family size with 2.61 persons per family.
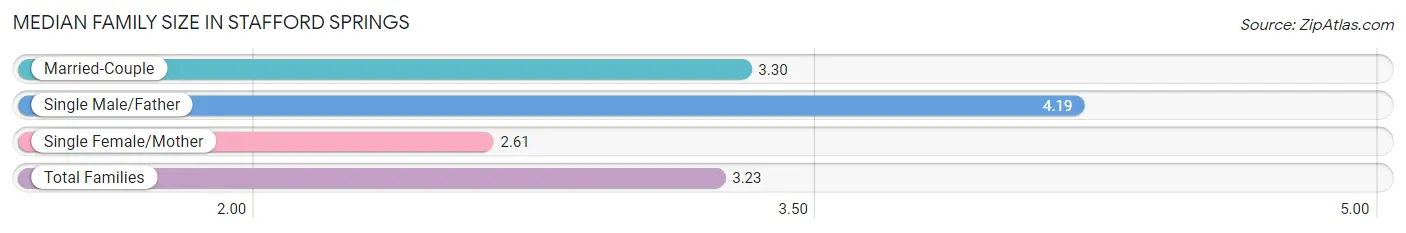
| Family Type | # Families | Family Size |
| Married-Couple | 781 (70.1%) | 3.30 |
| Single Male/Father | 95 (8.5%) | 4.19 |
| Single Female/Mother | 238 (21.4%) | 2.61 |
| Total Families | 1,114 (100.0%) | 3.23 |
Median Household Size in Stafford Springs
The median household size in Stafford Springs is 2.37 persons per household, with single male/father households (95 | 4.6%) accounting for the largest median household size of 4.43 persons per household. non-family households (942 | 45.8%) represent the smallest median household size with 1.24 persons per household.
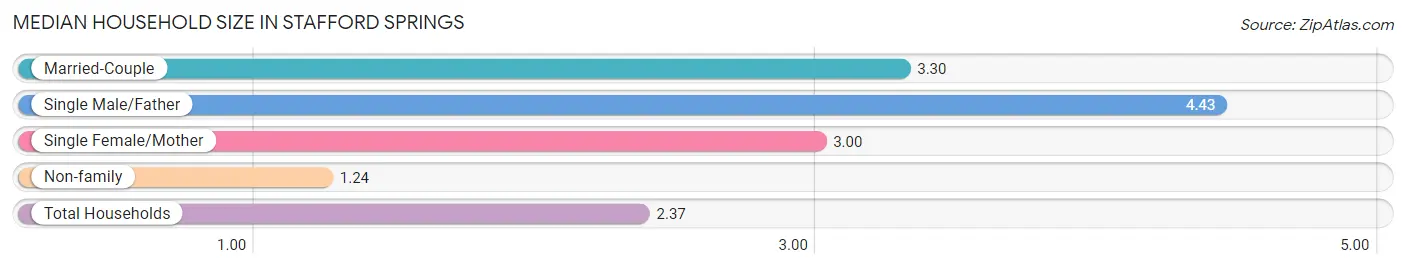
| Household Type | # Households | Household Size |
| Married-Couple | 781 (38.0%) | 3.30 |
| Single Male/Father | 95 (4.6%) | 4.43 |
| Single Female/Mother | 238 (11.6%) | 3.00 |
| Non-family | 942 (45.8%) | 1.24 |
| Total Households | 2,056 (100.0%) | 2.37 |
Household Size by Marriage Status in Stafford Springs
Out of a total of 2,056 households in Stafford Springs, 1,114 (54.2%) are family households, while 942 (45.8%) are nonfamily households. The most numerous type of family households are 2-person households, comprising 510, and the most common type of nonfamily households are 1-person households, comprising 756.
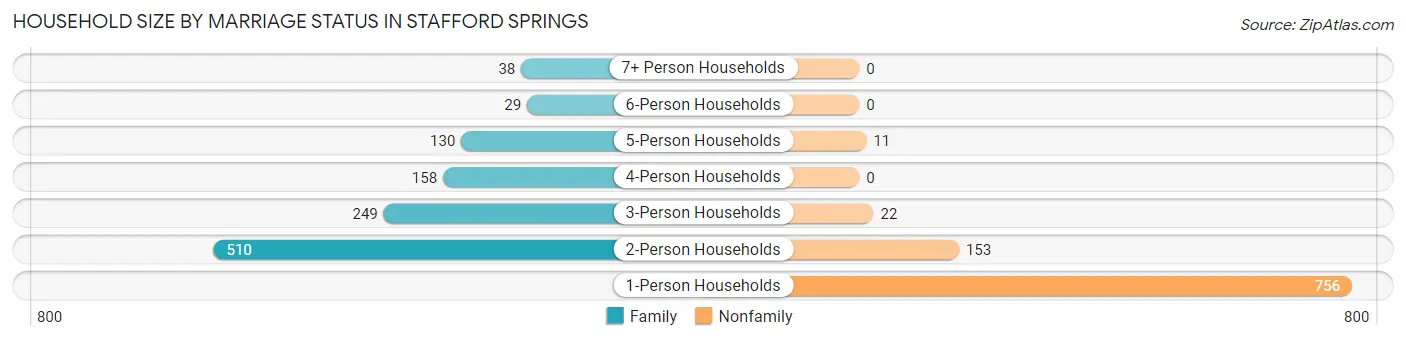
| Household Size | Family Households | Nonfamily Households |
| 1-Person Households | - | 756 (36.8%) |
| 2-Person Households | 510 (24.8%) | 153 (7.4%) |
| 3-Person Households | 249 (12.1%) | 22 (1.1%) |
| 4-Person Households | 158 (7.7%) | 0 (0.0%) |
| 5-Person Households | 130 (6.3%) | 11 (0.5%) |
| 6-Person Households | 29 (1.4%) | 0 (0.0%) |
| 7+ Person Households | 38 (1.8%) | 0 (0.0%) |
| Total | 1,114 (54.2%) | 942 (45.8%) |
Female Fertility in Stafford Springs
Fertility by Age in Stafford Springs
Average fertility rate in Stafford Springs is 80.0 births per 1,000 women. Women in the age bracket of 20 to 34 years have the highest fertility rate with 161.0 births per 1,000 women. Women in the age bracket of 20 to 34 years acount for 69.1% of all women with births.
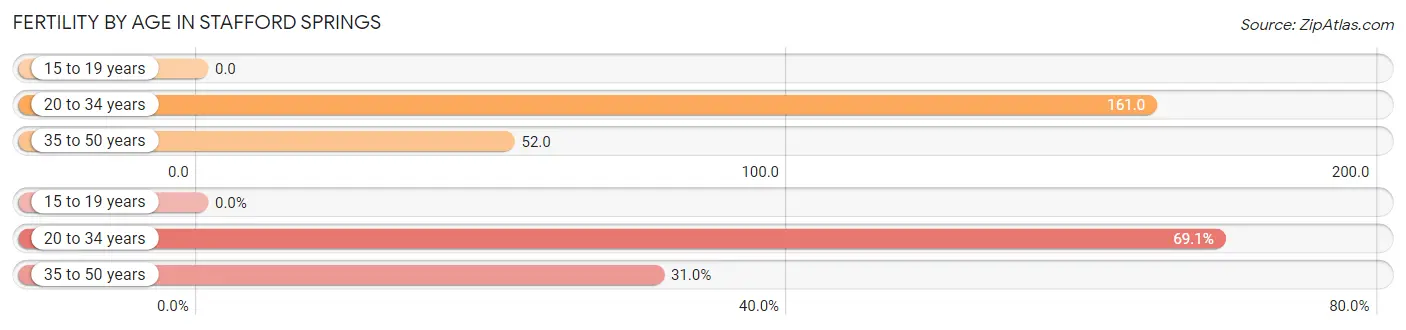
| Age Bracket | Women with Births | Births / 1,000 Women |
| 15 to 19 years | 0 (0.0%) | 0.0 |
| 20 to 34 years | 58 (69.1%) | 161.0 |
| 35 to 50 years | 26 (30.9%) | 52.0 |
| Total | 84 (100.0%) | 80.0 |
Fertility by Age by Marriage Status in Stafford Springs
48.8% of women with births (84) in Stafford Springs are married. The highest percentage of unmarried women with births falls into 20 to 34 years age bracket with 74.1% of them unmarried at the time of birth, while the lowest percentage of unmarried women with births belong to 35 to 50 years age bracket with 0.0% of them unmarried.
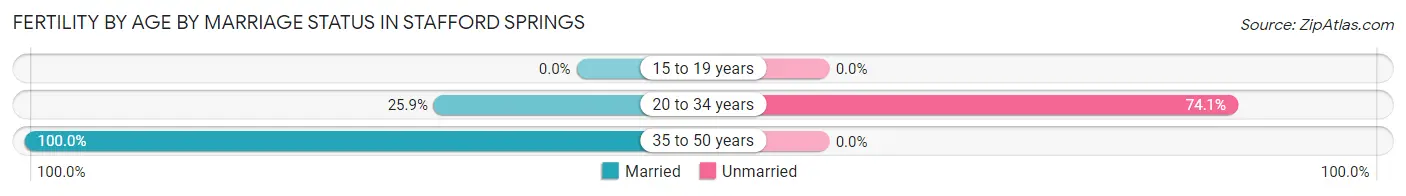
| Age Bracket | Married | Unmarried |
| 15 to 19 years | 0 (0.0%) | 0 (0.0%) |
| 20 to 34 years | 15 (25.9%) | 43 (74.1%) |
| 35 to 50 years | 26 (100.0%) | 0 (0.0%) |
| Total | 41 (48.8%) | 43 (51.2%) |
Fertility by Education in Stafford Springs
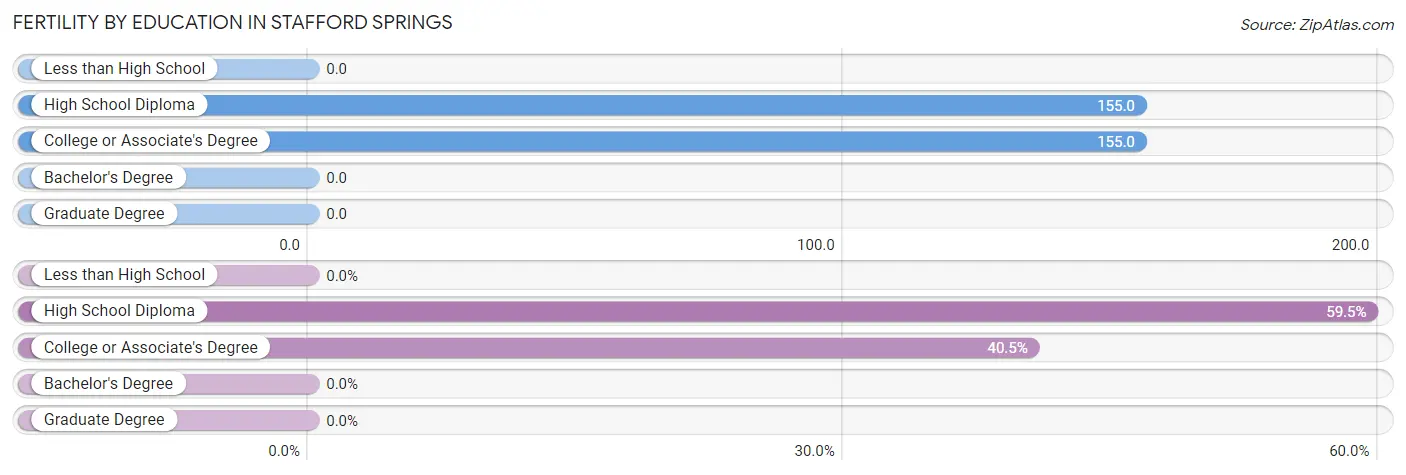
| Educational Attainment | Women with Births | Births / 1,000 Women |
| Less than High School | 0 (0.0%) | 0.0 |
| High School Diploma | 50 (59.5%) | 155.0 |
| College or Associate's Degree | 34 (40.5%) | 155.0 |
| Bachelor's Degree | 0 (0.0%) | 0.0 |
| Graduate Degree | 0 (0.0%) | 0.0 |
| Total | 84 (100.0%) | 80.0 |
Fertility by Education by Marriage Status in Stafford Springs
51.2% of women with births in Stafford Springs are unmarried. Women with the educational attainment of high school diploma are most likely to be married with 52.0% of them married at childbirth, while women with the educational attainment of college or associate's degree are least likely to be married with 55.9% of them unmarried at childbirth.
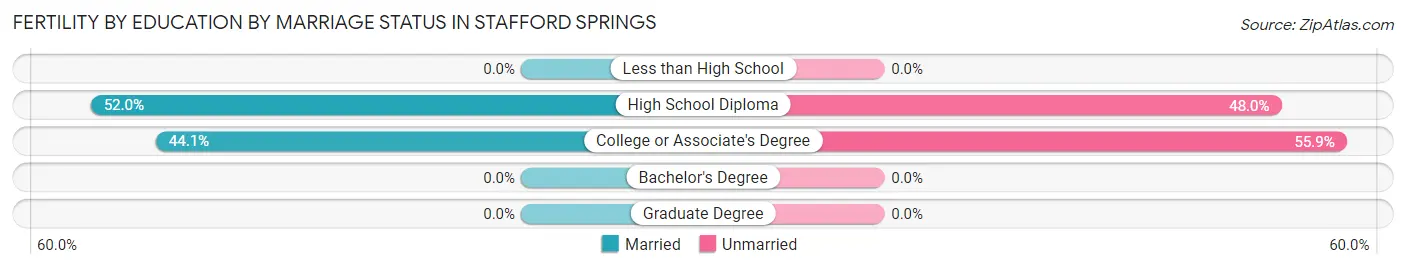
| Educational Attainment | Married | Unmarried |
| Less than High School | 0 (0.0%) | 0 (0.0%) |
| High School Diploma | 26 (52.0%) | 24 (48.0%) |
| College or Associate's Degree | 15 (44.1%) | 19 (55.9%) |
| Bachelor's Degree | 0 (0.0%) | 0 (0.0%) |
| Graduate Degree | 0 (0.0%) | 0 (0.0%) |
| Total | 41 (48.8%) | 43 (51.2%) |
Employment Characteristics in Stafford Springs
Employment by Class of Employer in Stafford Springs
Among the 2,260 employed individuals in Stafford Springs, private company employees (1,614 | 71.4%), state government employees (165 | 7.3%), and not-for-profit organizations (155 | 6.9%) make up the most common classes of employment.
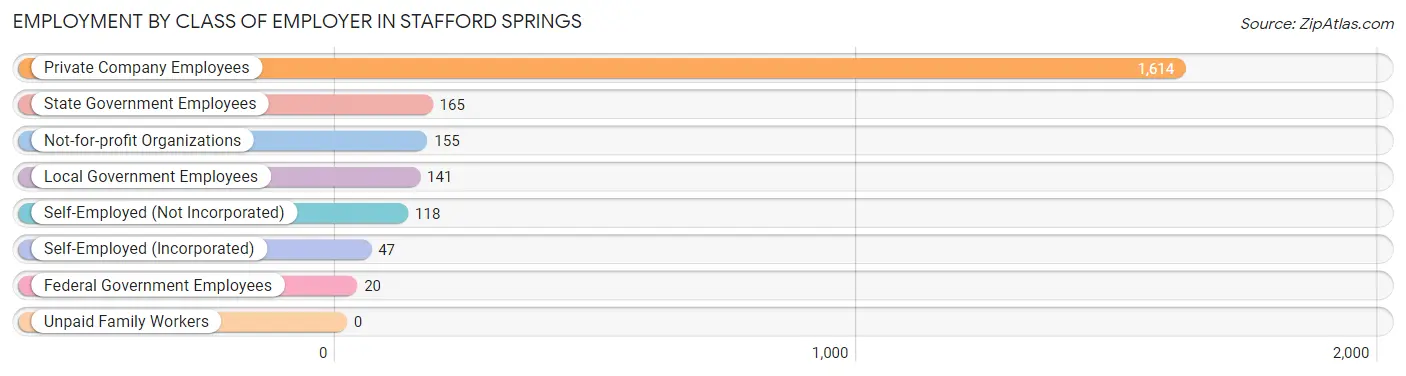
| Employer Class | # Employees | % Employees |
| Private Company Employees | 1,614 | 71.4% |
| Self-Employed (Incorporated) | 47 | 2.1% |
| Self-Employed (Not Incorporated) | 118 | 5.2% |
| Not-for-profit Organizations | 155 | 6.9% |
| Local Government Employees | 141 | 6.2% |
| State Government Employees | 165 | 7.3% |
| Federal Government Employees | 20 | 0.9% |
| Unpaid Family Workers | 0 | 0.0% |
| Total | 2,260 | 100.0% |
Employment Status by Age in Stafford Springs
According to the labor force statistics for Stafford Springs, out of the total population over 16 years of age (3,888), 64.4% or 2,504 individuals are in the labor force, with 6.6% or 165 of them unemployed. The age group with the highest labor force participation rate is 25 to 29 years, with 99.4% or 180 individuals in the labor force. Within the labor force, the 16 to 19 years age range has the highest percentage of unemployed individuals, with 58.4% or 59 of them being unemployed.
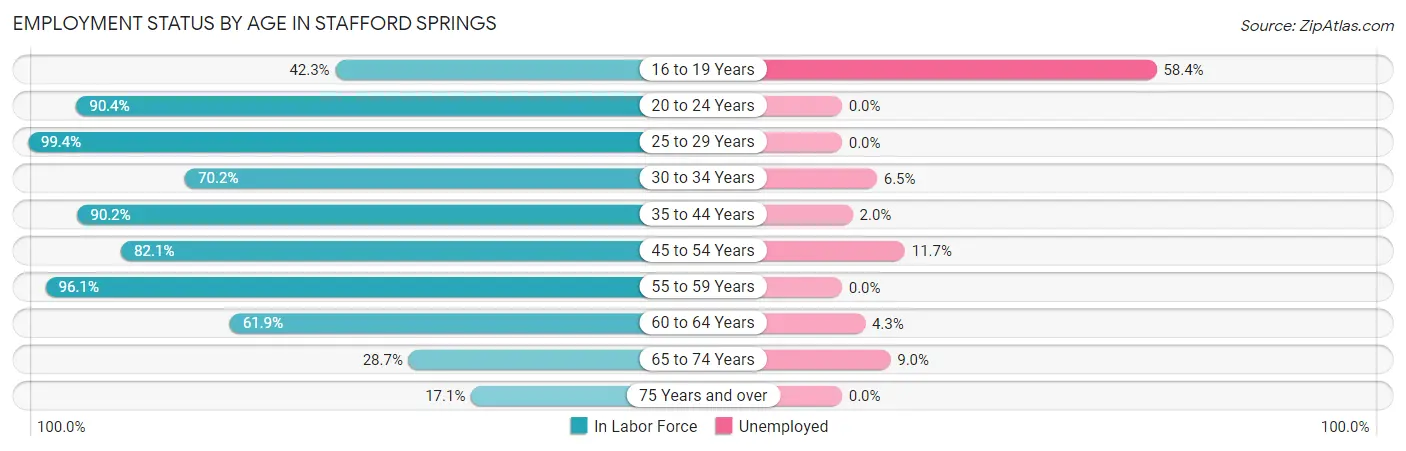
| Age Bracket | In Labor Force | Unemployed |
| 16 to 19 Years | 101 (42.3%) | 59 (58.4%) |
| 20 to 24 Years | 207 (90.4%) | 0 (0.0%) |
| 25 to 29 Years | 180 (99.4%) | 0 (0.0%) |
| 30 to 34 Years | 247 (70.2%) | 16 (6.5%) |
| 35 to 44 Years | 554 (90.2%) | 11 (2.0%) |
| 45 to 54 Years | 454 (82.1%) | 53 (11.7%) |
| 55 to 59 Years | 271 (96.1%) | 0 (0.0%) |
| 60 to 64 Years | 234 (61.9%) | 10 (4.3%) |
| 65 to 74 Years | 188 (28.7%) | 17 (9.0%) |
| 75 Years and over | 69 (17.1%) | 0 (0.0%) |
| Total | 2,504 (64.4%) | 165 (6.6%) |
Employment Status by Educational Attainment in Stafford Springs
According to labor force statistics for Stafford Springs, 82.2% of individuals (1,940) out of the total population between 25 and 64 years of age (2,360) are in the labor force, with 4.6% or 89 of them being unemployed. The group with the highest labor force participation rate are those with the educational attainment of bachelor's degree or higher, with 85.3% or 511 individuals in the labor force. Within the labor force, individuals with high school diploma education have the highest percentage of unemployment, with 9.2% or 79 of them being unemployed.
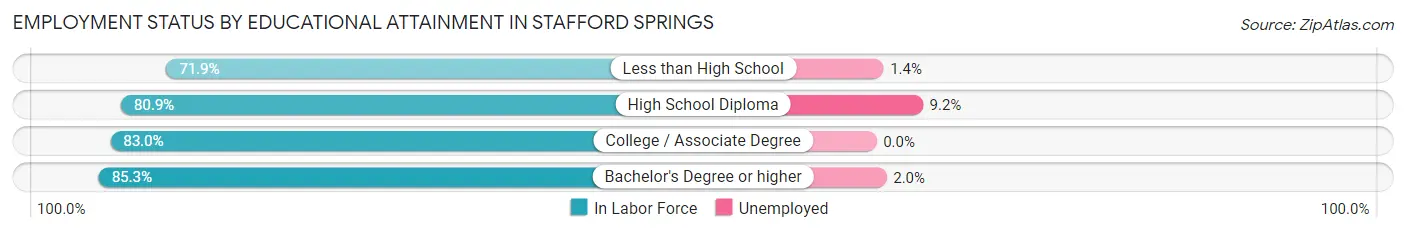
| Educational Attainment | In Labor Force | Unemployed |
| Less than High School | 69 (71.9%) | 1 (1.4%) |
| High School Diploma | 857 (80.9%) | 97 (9.2%) |
| College / Associate Degree | 503 (83.0%) | 0 (0.0%) |
| Bachelor's Degree or higher | 511 (85.3%) | 12 (2.0%) |
| Total | 1,940 (82.2%) | 109 (4.6%) |
Employment Occupations by Sex in Stafford Springs
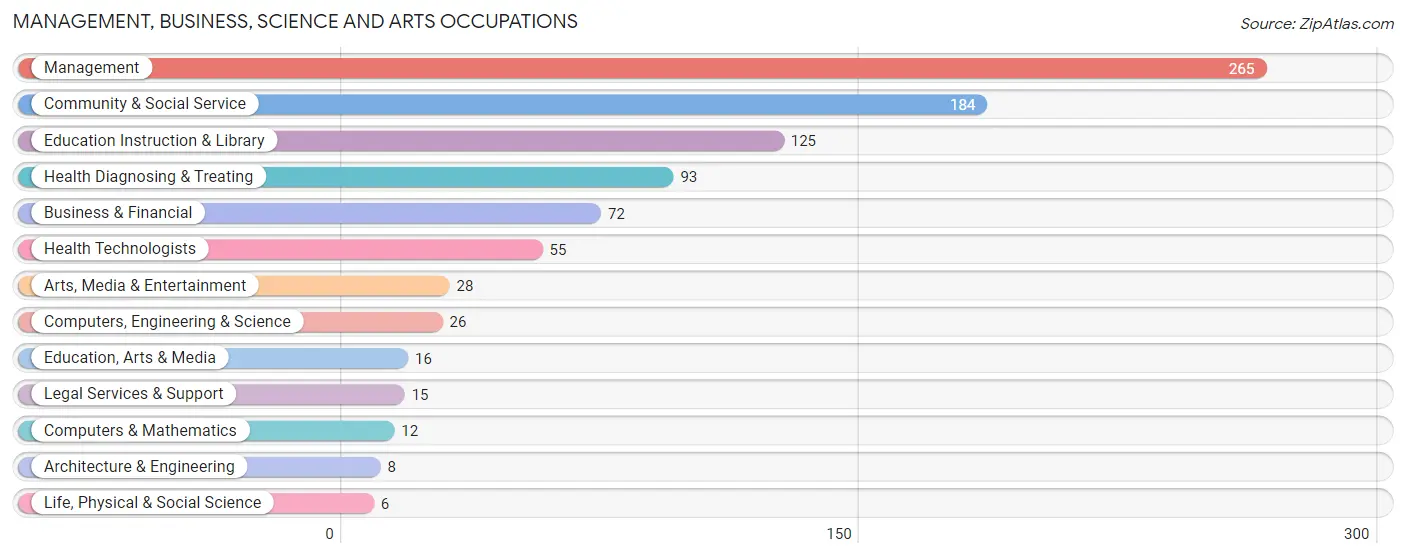
Management, Business, Science and Arts Occupations
The most common Management, Business, Science and Arts occupations in Stafford Springs are Management (265 | 11.3%), Community & Social Service (184 | 7.9%), Education Instruction & Library (125 | 5.3%), Health Diagnosing & Treating (93 | 4.0%), and Business & Financial (72 | 3.1%).
Management, Business, Science and Arts Occupations by Sex
Within the Management, Business, Science and Arts occupations in Stafford Springs, the most male-oriented occupations are Computers & Mathematics (100.0%), Architecture & Engineering (100.0%), and Computers, Engineering & Science (76.9%), while the most female-oriented occupations are Life, Physical & Social Science (100.0%), Legal Services & Support (100.0%), and Health Diagnosing & Treating (89.2%).
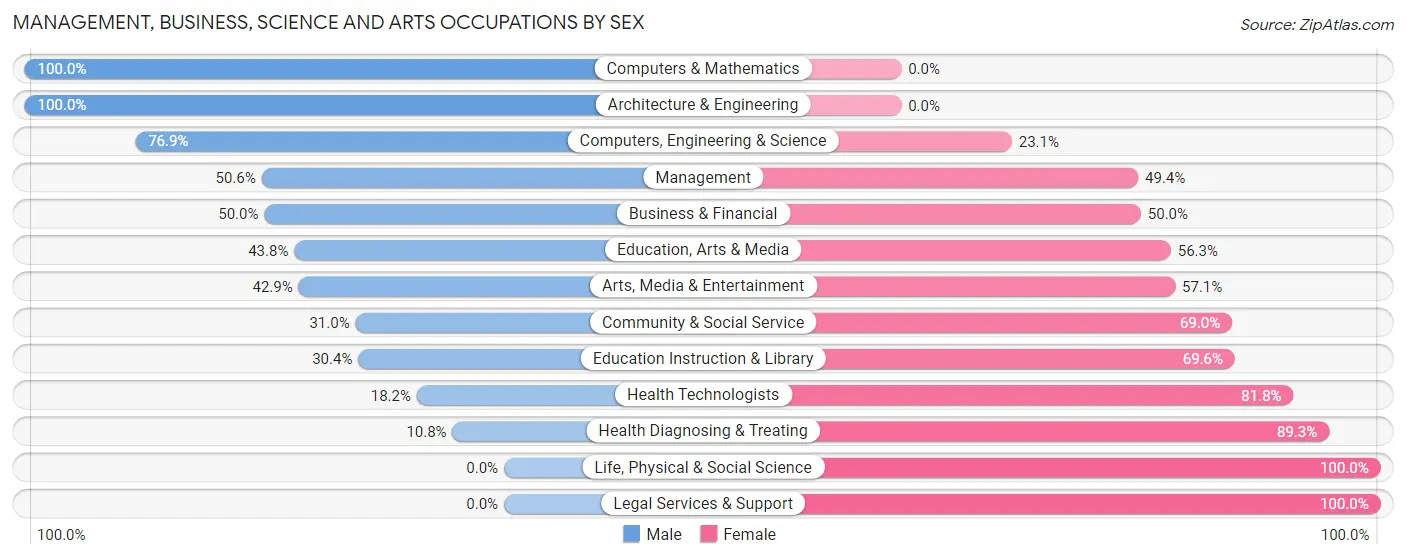
| Occupation | Male | Female |
| Management | 134 (50.6%) | 131 (49.4%) |
| Business & Financial | 36 (50.0%) | 36 (50.0%) |
| Computers, Engineering & Science | 20 (76.9%) | 6 (23.1%) |
| Computers & Mathematics | 12 (100.0%) | 0 (0.0%) |
| Architecture & Engineering | 8 (100.0%) | 0 (0.0%) |
| Life, Physical & Social Science | 0 (0.0%) | 6 (100.0%) |
| Community & Social Service | 57 (31.0%) | 127 (69.0%) |
| Education, Arts & Media | 7 (43.8%) | 9 (56.2%) |
| Legal Services & Support | 0 (0.0%) | 15 (100.0%) |
| Education Instruction & Library | 38 (30.4%) | 87 (69.6%) |
| Arts, Media & Entertainment | 12 (42.9%) | 16 (57.1%) |
| Health Diagnosing & Treating | 10 (10.7%) | 83 (89.2%) |
| Health Technologists | 10 (18.2%) | 45 (81.8%) |
| Total (Category) | 257 (40.2%) | 383 (59.8%) |
| Total (Overall) | 1,129 (48.3%) | 1,210 (51.7%) |
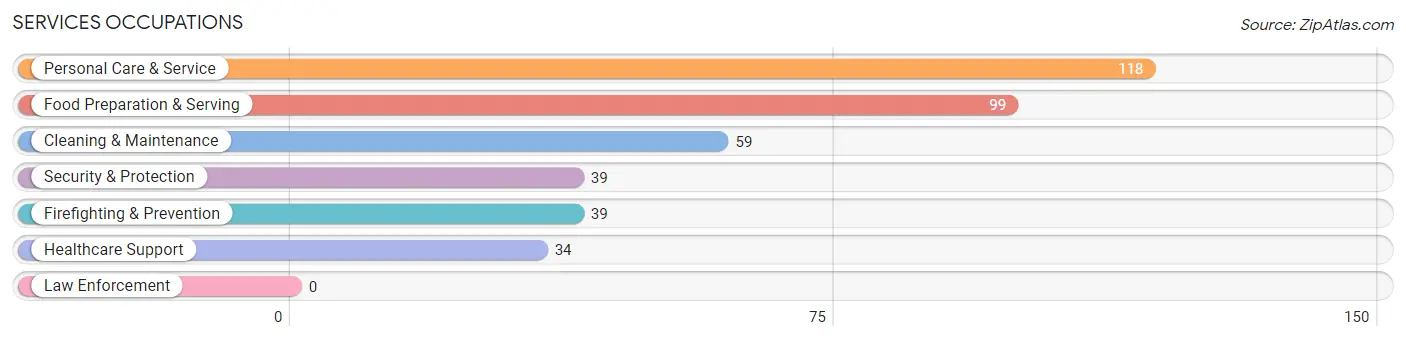
Services Occupations
The most common Services occupations in Stafford Springs are Personal Care & Service (118 | 5.0%), Food Preparation & Serving (99 | 4.2%), Cleaning & Maintenance (59 | 2.5%), Security & Protection (39 | 1.7%), and Firefighting & Prevention (39 | 1.7%).
Services Occupations by Sex
Within the Services occupations in Stafford Springs, the most male-oriented occupations are Security & Protection (100.0%), Firefighting & Prevention (100.0%), and Food Preparation & Serving (84.9%), while the most female-oriented occupations are Healthcare Support (100.0%), Personal Care & Service (85.6%), and Cleaning & Maintenance (22.0%).
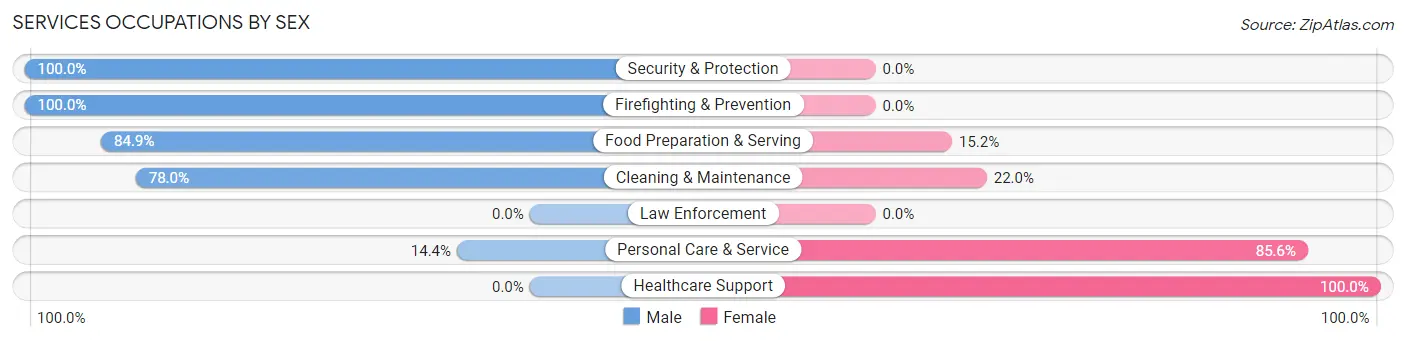
| Occupation | Male | Female |
| Healthcare Support | 0 (0.0%) | 34 (100.0%) |
| Security & Protection | 39 (100.0%) | 0 (0.0%) |
| Firefighting & Prevention | 39 (100.0%) | 0 (0.0%) |
| Law Enforcement | 0 (0.0%) | 0 (0.0%) |
| Food Preparation & Serving | 84 (84.9%) | 15 (15.1%) |
| Cleaning & Maintenance | 46 (78.0%) | 13 (22.0%) |
| Personal Care & Service | 17 (14.4%) | 101 (85.6%) |
| Total (Category) | 186 (53.3%) | 163 (46.7%) |
| Total (Overall) | 1,129 (48.3%) | 1,210 (51.7%) |
Sales and Office Occupations
The most common Sales and Office occupations in Stafford Springs are Office & Administration (382 | 16.3%), and Sales & Related (180 | 7.7%).
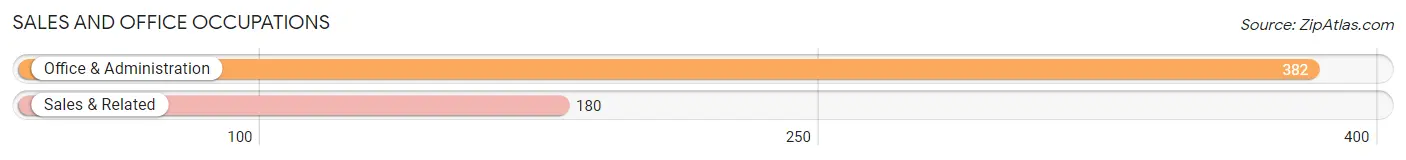
Sales and Office Occupations by Sex
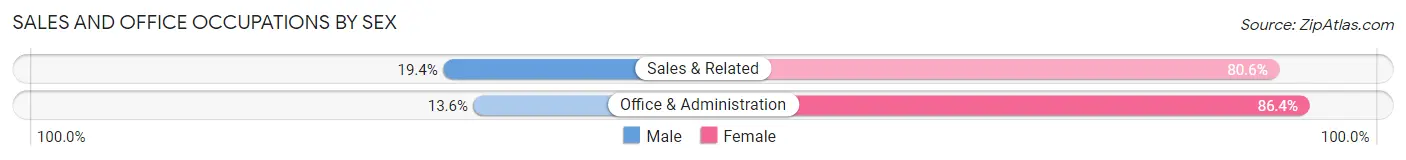
| Occupation | Male | Female |
| Sales & Related | 35 (19.4%) | 145 (80.6%) |
| Office & Administration | 52 (13.6%) | 330 (86.4%) |
| Total (Category) | 87 (15.5%) | 475 (84.5%) |
| Total (Overall) | 1,129 (48.3%) | 1,210 (51.7%) |
Natural Resources, Construction and Maintenance Occupations
The most common Natural Resources, Construction and Maintenance occupations in Stafford Springs are Construction & Extraction (160 | 6.8%), and Installation, Maintenance & Repair (137 | 5.9%).
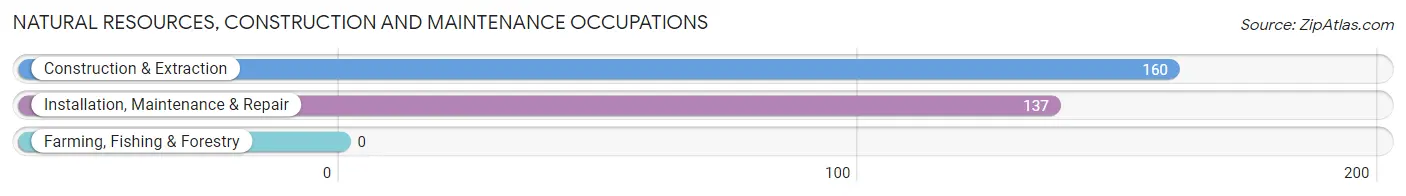
Natural Resources, Construction and Maintenance Occupations by Sex
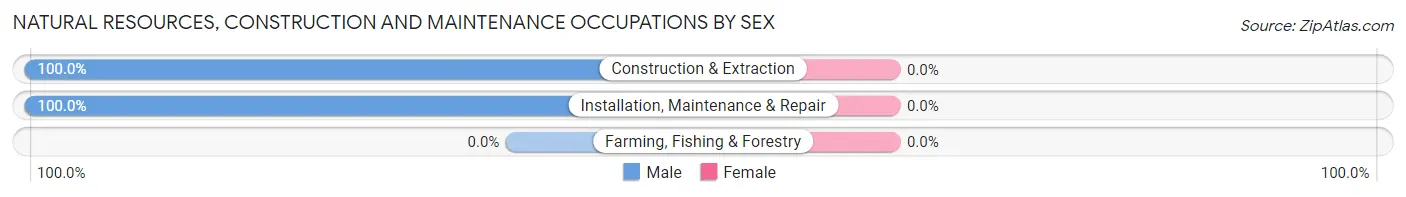
| Occupation | Male | Female |
| Farming, Fishing & Forestry | 0 (0.0%) | 0 (0.0%) |
| Construction & Extraction | 160 (100.0%) | 0 (0.0%) |
| Installation, Maintenance & Repair | 137 (100.0%) | 0 (0.0%) |
| Total (Category) | 297 (100.0%) | 0 (0.0%) |
| Total (Overall) | 1,129 (48.3%) | 1,210 (51.7%) |
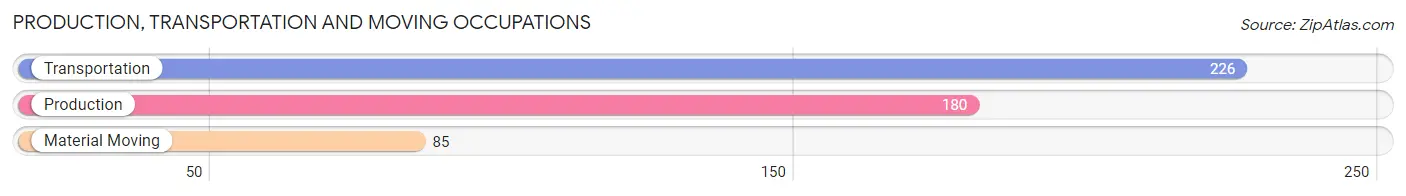
Production, Transportation and Moving Occupations
The most common Production, Transportation and Moving occupations in Stafford Springs are Transportation (226 | 9.7%), Production (180 | 7.7%), and Material Moving (85 | 3.6%).
Production, Transportation and Moving Occupations by Sex
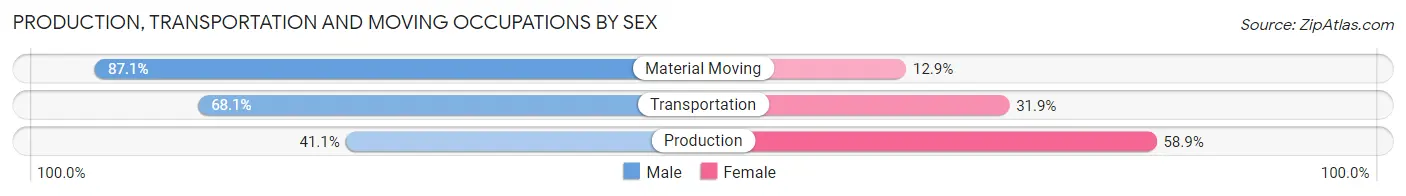
| Occupation | Male | Female |
| Production | 74 (41.1%) | 106 (58.9%) |
| Transportation | 154 (68.1%) | 72 (31.9%) |
| Material Moving | 74 (87.1%) | 11 (12.9%) |
| Total (Category) | 302 (61.5%) | 189 (38.5%) |
| Total (Overall) | 1,129 (48.3%) | 1,210 (51.7%) |
Employment Industries by Sex in Stafford Springs
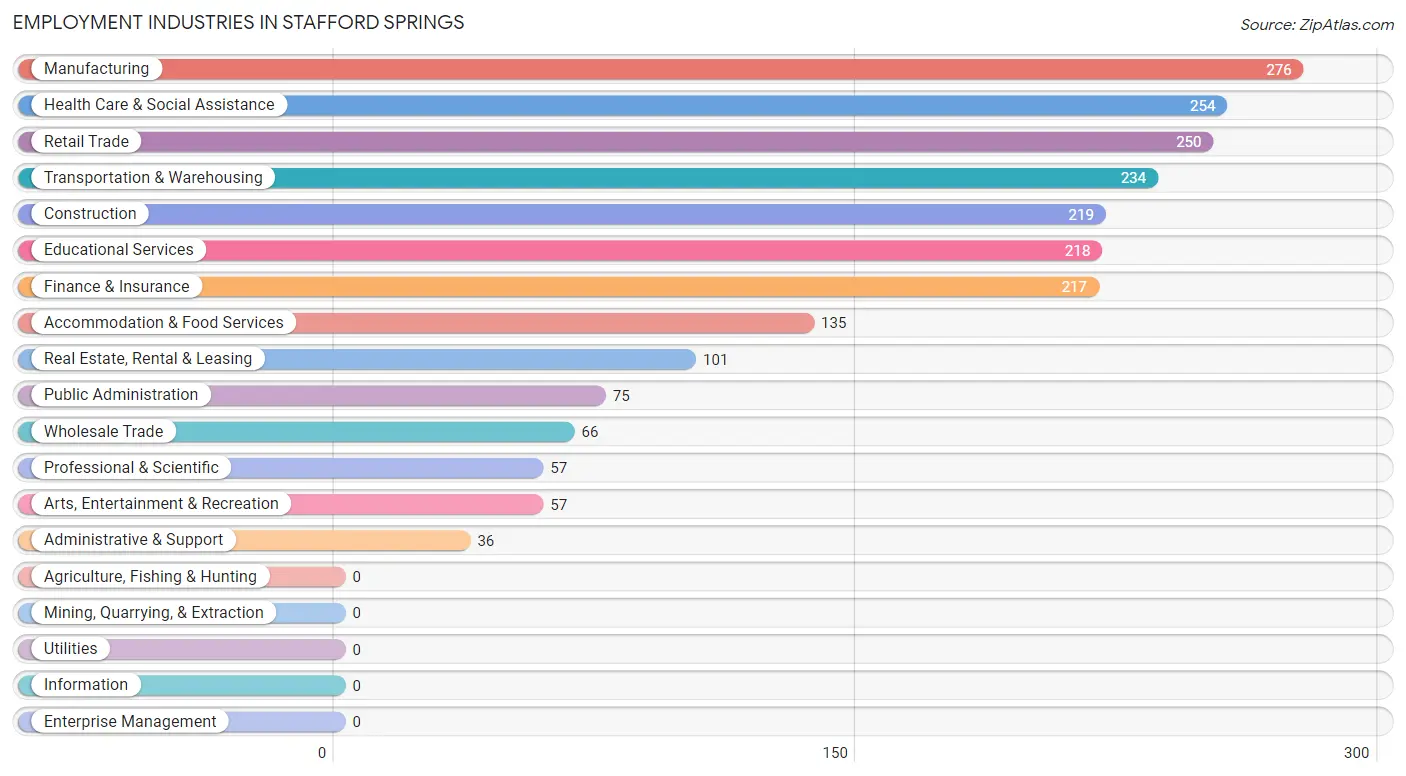
Employment Industries in Stafford Springs
The major employment industries in Stafford Springs include Manufacturing (276 | 11.8%), Health Care & Social Assistance (254 | 10.9%), Retail Trade (250 | 10.7%), Transportation & Warehousing (234 | 10.0%), and Construction (219 | 9.4%).
Employment Industries by Sex in Stafford Springs
The Stafford Springs industries that see more men than women are Administrative & Support (100.0%), Construction (97.3%), and Public Administration (90.7%), whereas the industries that tend to have a higher number of women are Real Estate, Rental & Leasing (100.0%), Health Care & Social Assistance (83.9%), and Finance & Insurance (82.0%).
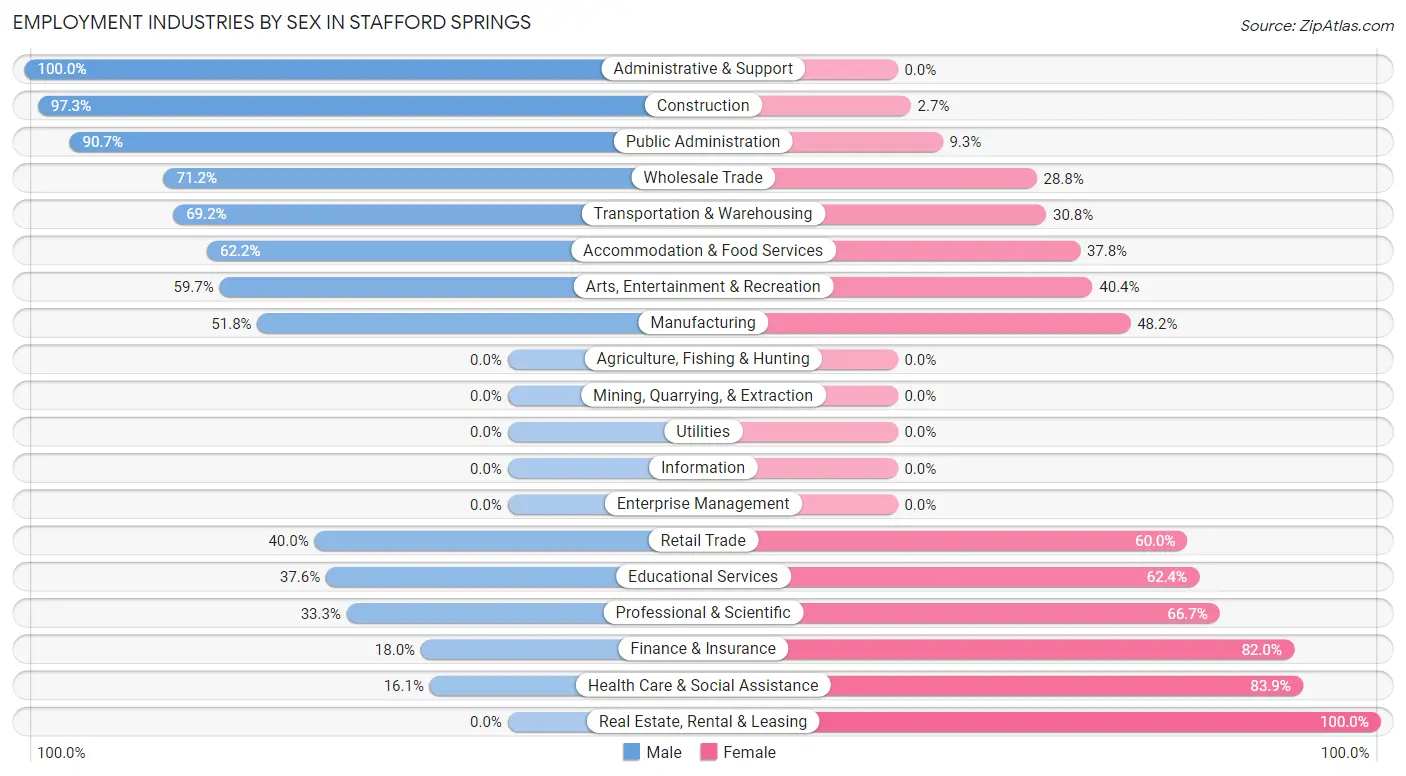
| Industry | Male | Female |
| Agriculture, Fishing & Hunting | 0 (0.0%) | 0 (0.0%) |
| Mining, Quarrying, & Extraction | 0 (0.0%) | 0 (0.0%) |
| Construction | 213 (97.3%) | 6 (2.7%) |
| Manufacturing | 143 (51.8%) | 133 (48.2%) |
| Wholesale Trade | 47 (71.2%) | 19 (28.8%) |
| Retail Trade | 100 (40.0%) | 150 (60.0%) |
| Transportation & Warehousing | 162 (69.2%) | 72 (30.8%) |
| Utilities | 0 (0.0%) | 0 (0.0%) |
| Information | 0 (0.0%) | 0 (0.0%) |
| Finance & Insurance | 39 (18.0%) | 178 (82.0%) |
| Real Estate, Rental & Leasing | 0 (0.0%) | 101 (100.0%) |
| Professional & Scientific | 19 (33.3%) | 38 (66.7%) |
| Enterprise Management | 0 (0.0%) | 0 (0.0%) |
| Administrative & Support | 36 (100.0%) | 0 (0.0%) |
| Educational Services | 82 (37.6%) | 136 (62.4%) |
| Health Care & Social Assistance | 41 (16.1%) | 213 (83.9%) |
| Arts, Entertainment & Recreation | 34 (59.7%) | 23 (40.4%) |
| Accommodation & Food Services | 84 (62.2%) | 51 (37.8%) |
| Public Administration | 68 (90.7%) | 7 (9.3%) |
| Total | 1,129 (48.3%) | 1,210 (51.7%) |
Education in Stafford Springs
School Enrollment in Stafford Springs
The most common levels of schooling among the 1,089 students in Stafford Springs are middle school (349 | 32.1%), high school (227 | 20.8%), and elementary school (170 | 15.6%).
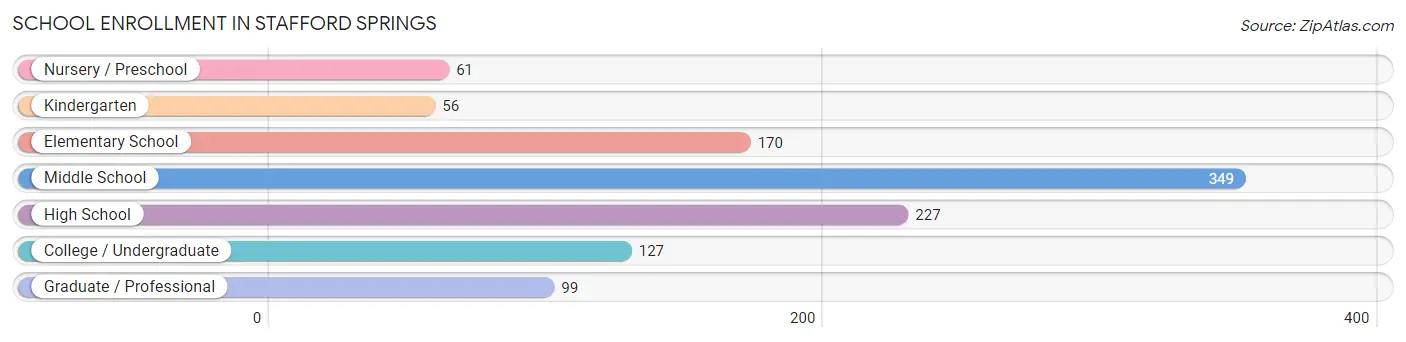
| School Level | # Students | % Students |
| Nursery / Preschool | 61 | 5.6% |
| Kindergarten | 56 | 5.1% |
| Elementary School | 170 | 15.6% |
| Middle School | 349 | 32.1% |
| High School | 227 | 20.8% |
| College / Undergraduate | 127 | 11.7% |
| Graduate / Professional | 99 | 9.1% |
| Total | 1,089 | 100.0% |
School Enrollment by Age by Funding Source in Stafford Springs
Out of a total of 1,089 students who are enrolled in schools in Stafford Springs, 96 (8.8%) attend a private institution, while the remaining 993 (91.2%) are enrolled in public schools. The age group of 3 to 4 year olds has the highest likelihood of being enrolled in private schools, with 52 (73.2% in the age bracket) enrolled. Conversely, the age group of 5 to 9 year old has the lowest likelihood of being enrolled in a private school, with 197 (100.0% in the age bracket) attending a public institution.
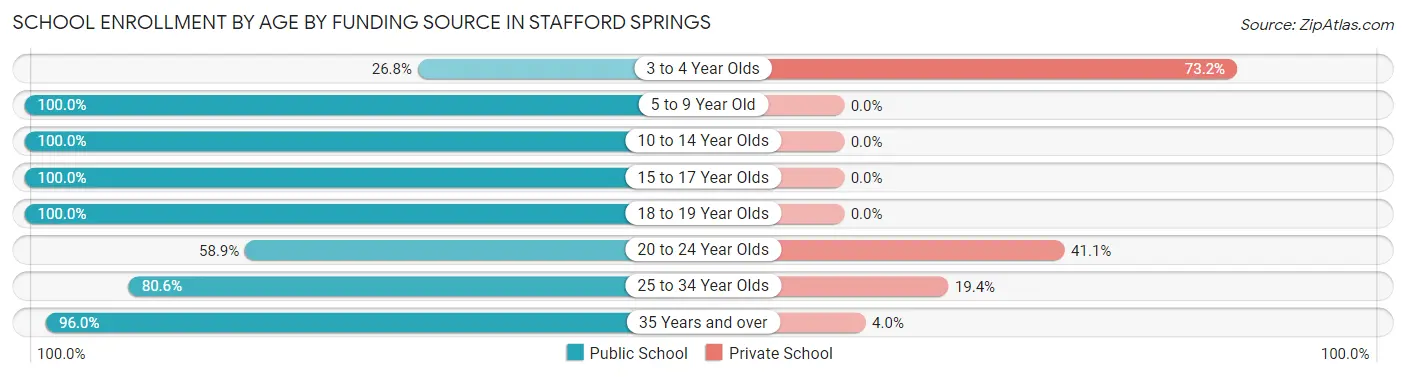
| Age Bracket | Public School | Private School |
| 3 to 4 Year Olds | 19 (26.8%) | 52 (73.2%) |
| 5 to 9 Year Old | 197 (100.0%) | 0 (0.0%) |
| 10 to 14 Year Olds | 414 (100.0%) | 0 (0.0%) |
| 15 to 17 Year Olds | 154 (100.0%) | 0 (0.0%) |
| 18 to 19 Year Olds | 69 (100.0%) | 0 (0.0%) |
| 20 to 24 Year Olds | 33 (58.9%) | 23 (41.1%) |
| 25 to 34 Year Olds | 83 (80.6%) | 20 (19.4%) |
| 35 Years and over | 24 (96.0%) | 1 (4.0%) |
| Total | 993 (91.2%) | 96 (8.8%) |
Educational Attainment by Field of Study in Stafford Springs
Business (181 | 21.2%), social sciences (139 | 16.3%), science & technology (114 | 13.4%), physical & health sciences (77 | 9.0%), and visual & performing arts (65 | 7.6%) are the most common fields of study among 853 individuals in Stafford Springs who have obtained a bachelor's degree or higher.
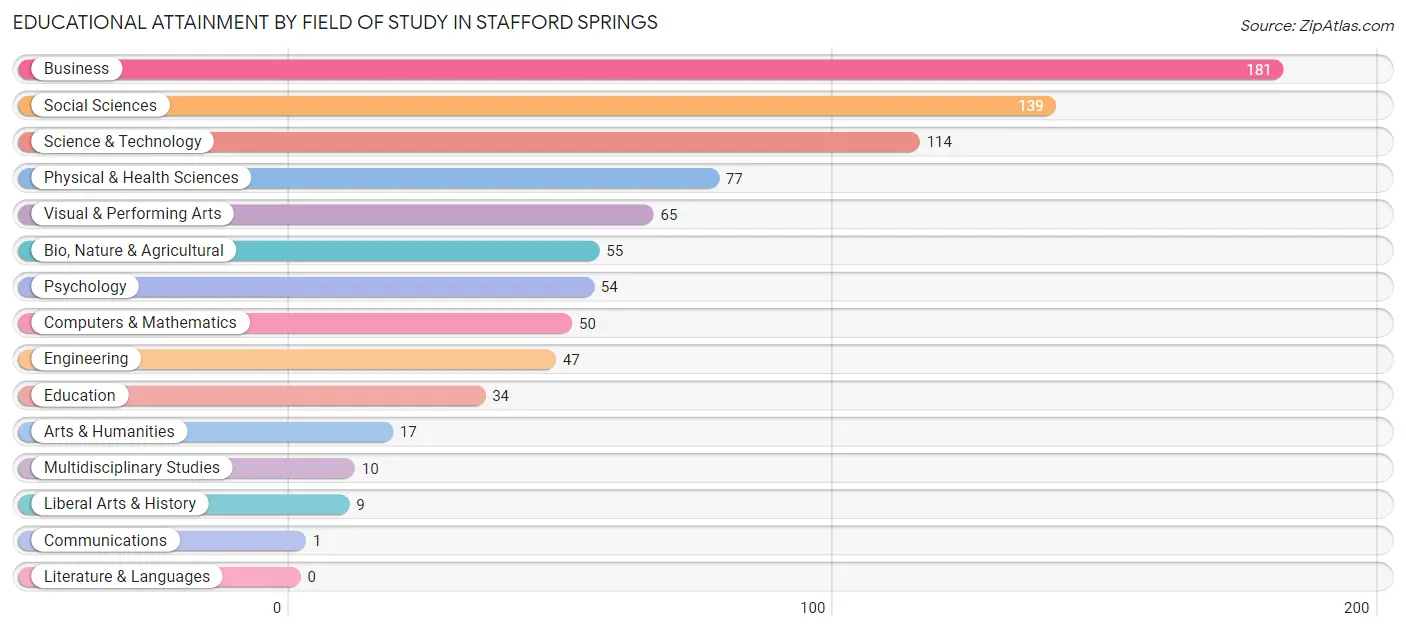
| Field of Study | # Graduates | % Graduates |
| Computers & Mathematics | 50 | 5.9% |
| Bio, Nature & Agricultural | 55 | 6.5% |
| Physical & Health Sciences | 77 | 9.0% |
| Psychology | 54 | 6.3% |
| Social Sciences | 139 | 16.3% |
| Engineering | 47 | 5.5% |
| Multidisciplinary Studies | 10 | 1.2% |
| Science & Technology | 114 | 13.4% |
| Business | 181 | 21.2% |
| Education | 34 | 4.0% |
| Literature & Languages | 0 | 0.0% |
| Liberal Arts & History | 9 | 1.1% |
| Visual & Performing Arts | 65 | 7.6% |
| Communications | 1 | 0.1% |
| Arts & Humanities | 17 | 2.0% |
| Total | 853 | 100.0% |
Transportation & Commute in Stafford Springs
Vehicle Availability by Sex in Stafford Springs
The most prevalent vehicle ownership categories in Stafford Springs are males with 2 vehicles (465, accounting for 42.4%) and females with 2 vehicles (475, making up 40.0%).
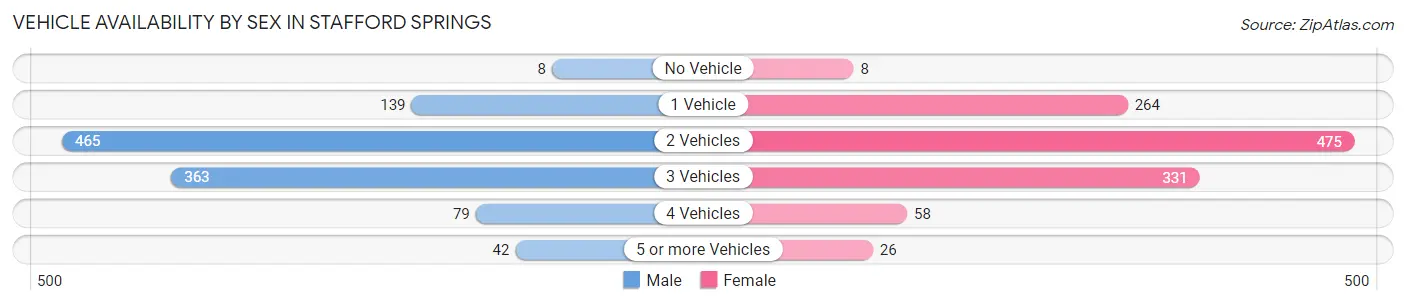
| Vehicles Available | Male | Female |
| No Vehicle | 8 (0.7%) | 8 (0.7%) |
| 1 Vehicle | 139 (12.7%) | 264 (22.7%) |
| 2 Vehicles | 465 (42.4%) | 475 (40.9%) |
| 3 Vehicles | 363 (33.1%) | 331 (28.5%) |
| 4 Vehicles | 79 (7.2%) | 58 (5.0%) |
| 5 or more Vehicles | 42 (3.8%) | 26 (2.2%) |
| Total | 1,096 (100.0%) | 1,162 (100.0%) |
Commute Time in Stafford Springs
The most frequently occuring commute durations in Stafford Springs are 25 to 29 minutes (296 commuters, 14.6%), 30 to 34 minutes (257 commuters, 12.7%), and 10 to 14 minutes (251 commuters, 12.4%).
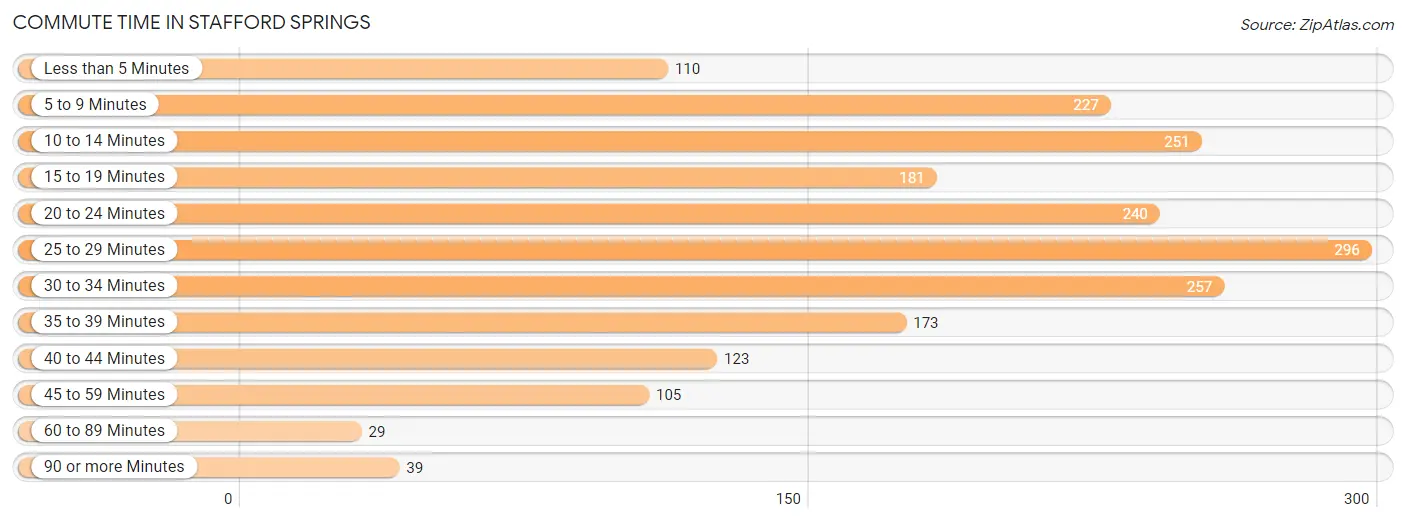
| Commute Time | # Commuters | % Commuters |
| Less than 5 Minutes | 110 | 5.4% |
| 5 to 9 Minutes | 227 | 11.2% |
| 10 to 14 Minutes | 251 | 12.4% |
| 15 to 19 Minutes | 181 | 8.9% |
| 20 to 24 Minutes | 240 | 11.8% |
| 25 to 29 Minutes | 296 | 14.6% |
| 30 to 34 Minutes | 257 | 12.7% |
| 35 to 39 Minutes | 173 | 8.5% |
| 40 to 44 Minutes | 123 | 6.1% |
| 45 to 59 Minutes | 105 | 5.2% |
| 60 to 89 Minutes | 29 | 1.4% |
| 90 or more Minutes | 39 | 1.9% |
Commute Time by Sex in Stafford Springs
The most common commute times in Stafford Springs are 20 to 24 minutes (155 commuters, 14.6%) for males and 10 to 14 minutes (149 commuters, 15.4%) for females.
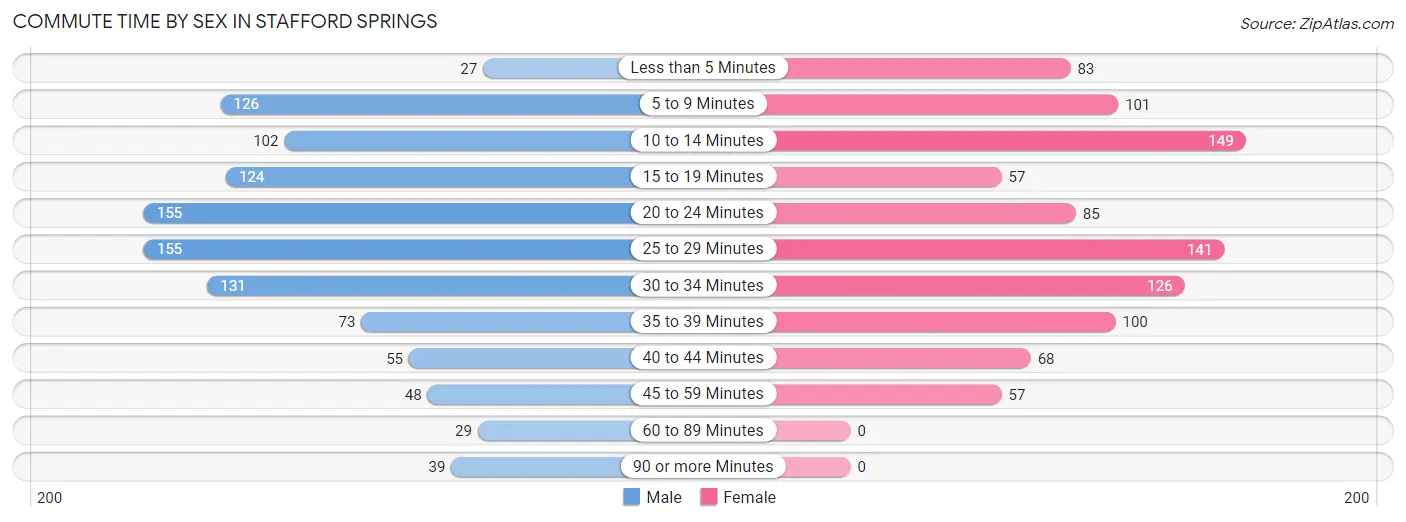
| Commute Time | Male | Female |
| Less than 5 Minutes | 27 (2.5%) | 83 (8.6%) |
| 5 to 9 Minutes | 126 (11.8%) | 101 (10.4%) |
| 10 to 14 Minutes | 102 (9.6%) | 149 (15.4%) |
| 15 to 19 Minutes | 124 (11.7%) | 57 (5.9%) |
| 20 to 24 Minutes | 155 (14.6%) | 85 (8.8%) |
| 25 to 29 Minutes | 155 (14.6%) | 141 (14.6%) |
| 30 to 34 Minutes | 131 (12.3%) | 126 (13.0%) |
| 35 to 39 Minutes | 73 (6.9%) | 100 (10.3%) |
| 40 to 44 Minutes | 55 (5.2%) | 68 (7.0%) |
| 45 to 59 Minutes | 48 (4.5%) | 57 (5.9%) |
| 60 to 89 Minutes | 29 (2.7%) | 0 (0.0%) |
| 90 or more Minutes | 39 (3.7%) | 0 (0.0%) |
Time of Departure to Work by Sex in Stafford Springs
The most frequent times of departure to work in Stafford Springs are 7:00 AM to 7:29 AM (204, 19.2%) for males and 6:00 AM to 6:29 AM (159, 16.4%) for females.
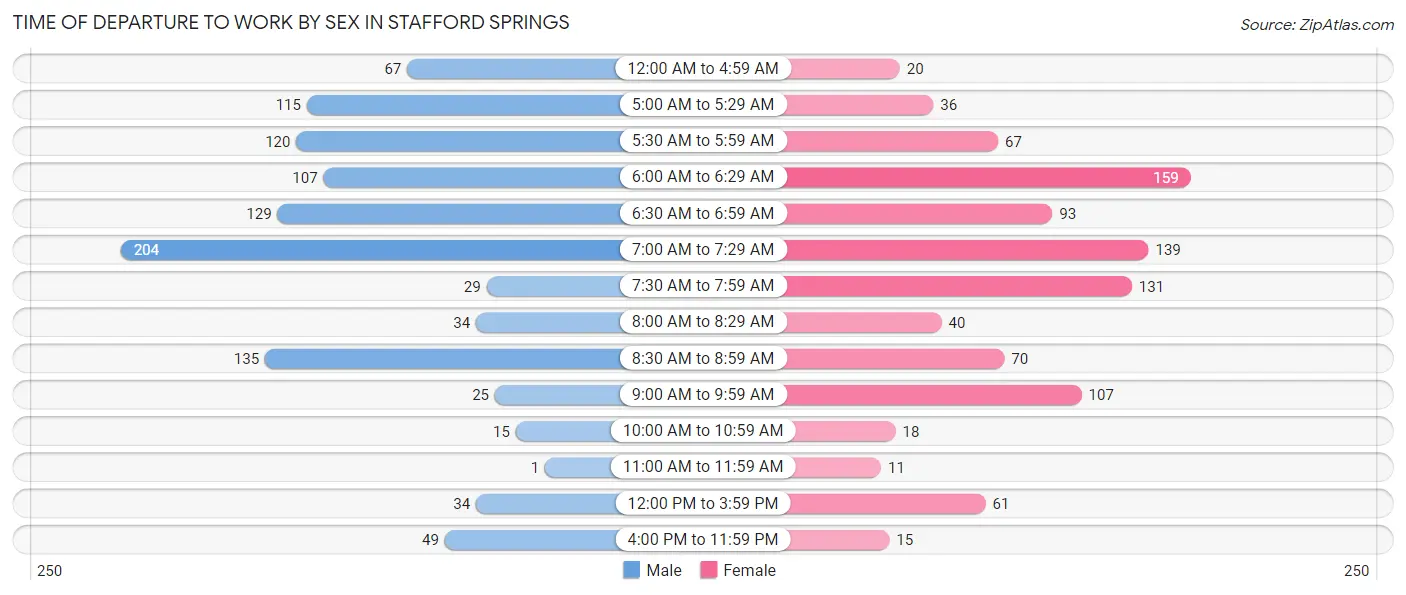
| Time of Departure | Male | Female |
| 12:00 AM to 4:59 AM | 67 (6.3%) | 20 (2.1%) |
| 5:00 AM to 5:29 AM | 115 (10.8%) | 36 (3.7%) |
| 5:30 AM to 5:59 AM | 120 (11.3%) | 67 (6.9%) |
| 6:00 AM to 6:29 AM | 107 (10.1%) | 159 (16.4%) |
| 6:30 AM to 6:59 AM | 129 (12.1%) | 93 (9.6%) |
| 7:00 AM to 7:29 AM | 204 (19.2%) | 139 (14.4%) |
| 7:30 AM to 7:59 AM | 29 (2.7%) | 131 (13.6%) |
| 8:00 AM to 8:29 AM | 34 (3.2%) | 40 (4.1%) |
| 8:30 AM to 8:59 AM | 135 (12.7%) | 70 (7.2%) |
| 9:00 AM to 9:59 AM | 25 (2.4%) | 107 (11.1%) |
| 10:00 AM to 10:59 AM | 15 (1.4%) | 18 (1.9%) |
| 11:00 AM to 11:59 AM | 1 (0.1%) | 11 (1.1%) |
| 12:00 PM to 3:59 PM | 34 (3.2%) | 61 (6.3%) |
| 4:00 PM to 11:59 PM | 49 (4.6%) | 15 (1.5%) |
| Total | 1,064 (100.0%) | 967 (100.0%) |
Housing Occupancy in Stafford Springs
Occupancy by Ownership in Stafford Springs
Of the total 2,056 dwellings in Stafford Springs, owner-occupied units account for 1,339 (65.1%), while renter-occupied units make up 717 (34.9%).
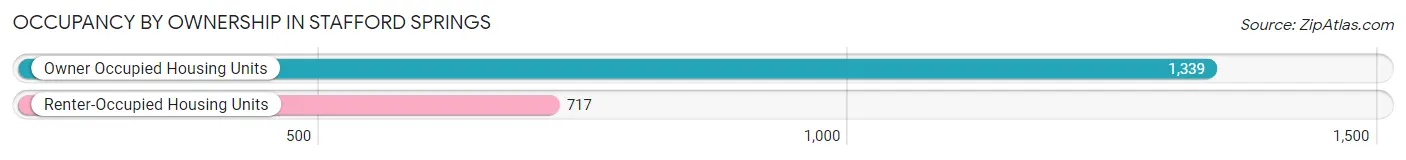
| Occupancy | # Housing Units | % Housing Units |
| Owner Occupied Housing Units | 1,339 | 65.1% |
| Renter-Occupied Housing Units | 717 | 34.9% |
| Total Occupied Housing Units | 2,056 | 100.0% |
Occupancy by Household Size in Stafford Springs
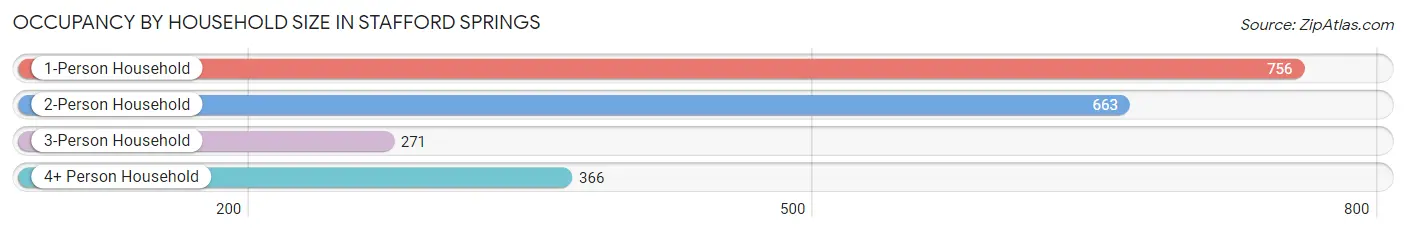
| Household Size | # Housing Units | % Housing Units |
| 1-Person Household | 756 | 36.8% |
| 2-Person Household | 663 | 32.3% |
| 3-Person Household | 271 | 13.2% |
| 4+ Person Household | 366 | 17.8% |
| Total Housing Units | 2,056 | 100.0% |
Occupancy by Ownership by Household Size in Stafford Springs
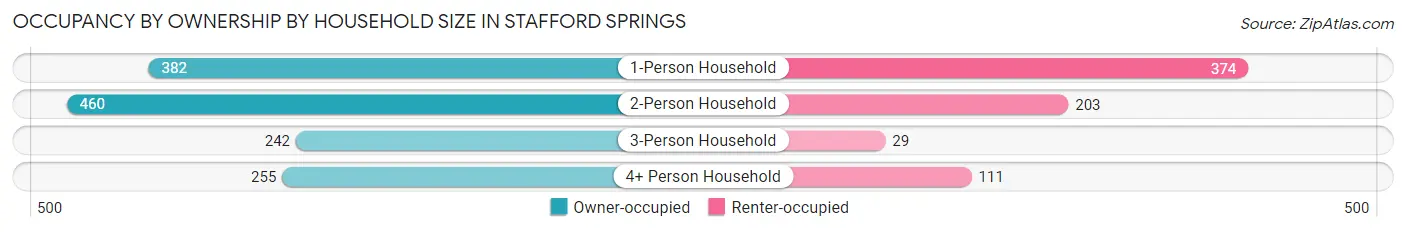
| Household Size | Owner-occupied | Renter-occupied |
| 1-Person Household | 382 (50.5%) | 374 (49.5%) |
| 2-Person Household | 460 (69.4%) | 203 (30.6%) |
| 3-Person Household | 242 (89.3%) | 29 (10.7%) |
| 4+ Person Household | 255 (69.7%) | 111 (30.3%) |
| Total Housing Units | 1,339 (65.1%) | 717 (34.9%) |
Occupancy by Educational Attainment in Stafford Springs
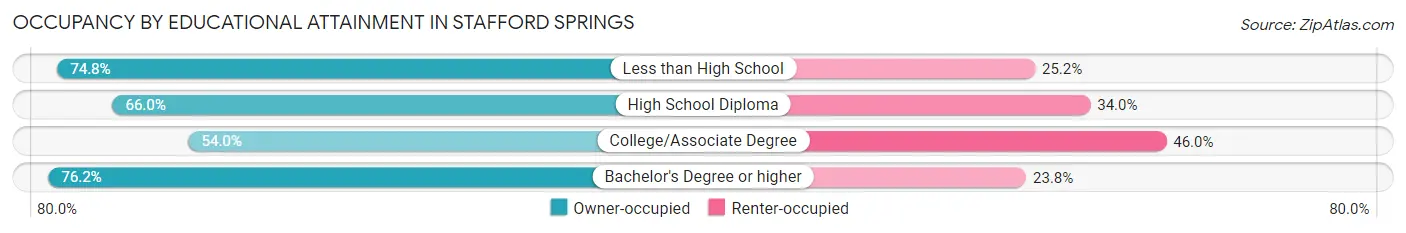
| Household Size | Owner-occupied | Renter-occupied |
| Less than High School | 92 (74.8%) | 31 (25.2%) |
| High School Diploma | 490 (66.0%) | 252 (34.0%) |
| College/Associate Degree | 366 (54.0%) | 312 (46.0%) |
| Bachelor's Degree or higher | 391 (76.2%) | 122 (23.8%) |
Occupancy by Age of Householder in Stafford Springs
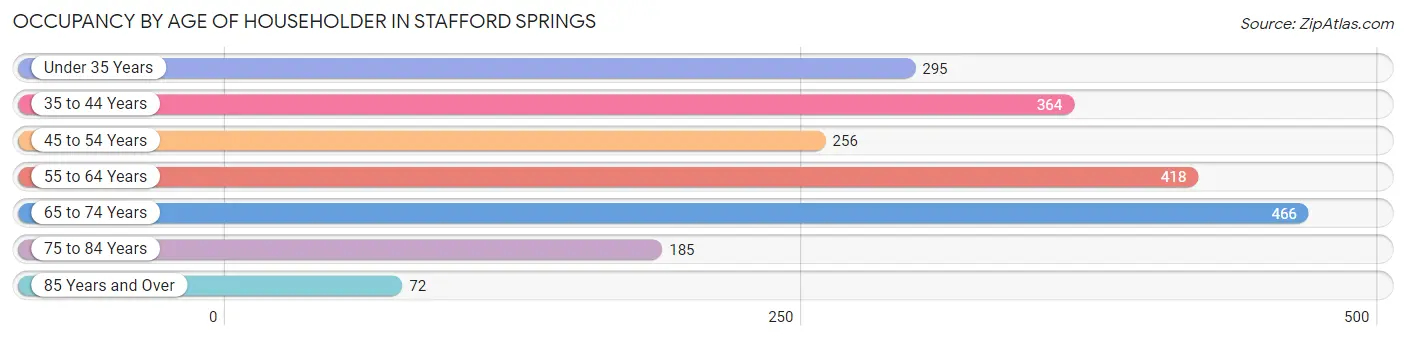
| Age Bracket | # Households | % Households |
| Under 35 Years | 295 | 14.3% |
| 35 to 44 Years | 364 | 17.7% |
| 45 to 54 Years | 256 | 12.4% |
| 55 to 64 Years | 418 | 20.3% |
| 65 to 74 Years | 466 | 22.7% |
| 75 to 84 Years | 185 | 9.0% |
| 85 Years and Over | 72 | 3.5% |
| Total | 2,056 | 100.0% |
Housing Finances in Stafford Springs
Median Income by Occupancy in Stafford Springs
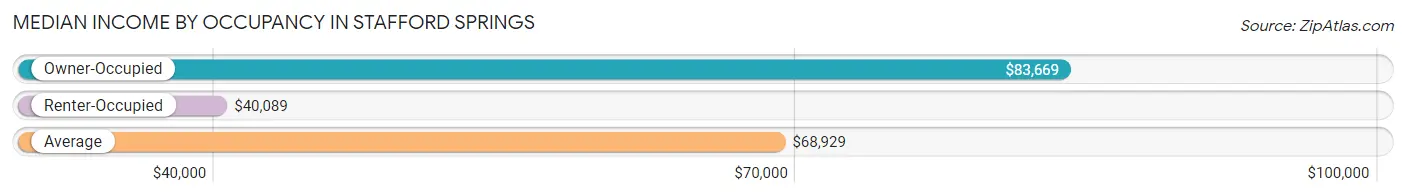
| Occupancy Type | # Households | Median Income |
| Owner-Occupied | 1,339 (65.1%) | $83,669 |
| Renter-Occupied | 717 (34.9%) | $40,089 |
| Average | 2,056 (100.0%) | $68,929 |
Occupancy by Householder Income Bracket in Stafford Springs
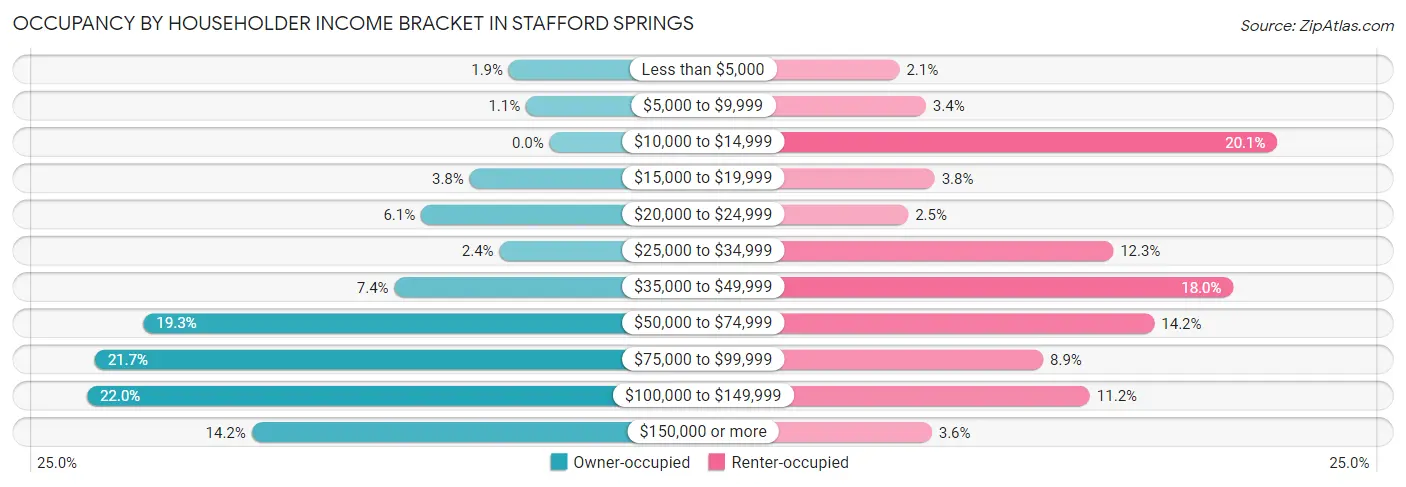
| Income Bracket | Owner-occupied | Renter-occupied |
| Less than $5,000 | 26 (1.9%) | 15 (2.1%) |
| $5,000 to $9,999 | 15 (1.1%) | 24 (3.4%) |
| $10,000 to $14,999 | 0 (0.0%) | 144 (20.1%) |
| $15,000 to $19,999 | 51 (3.8%) | 27 (3.8%) |
| $20,000 to $24,999 | 82 (6.1%) | 18 (2.5%) |
| $25,000 to $34,999 | 32 (2.4%) | 88 (12.3%) |
| $35,000 to $49,999 | 99 (7.4%) | 129 (18.0%) |
| $50,000 to $74,999 | 259 (19.3%) | 102 (14.2%) |
| $75,000 to $99,999 | 290 (21.7%) | 64 (8.9%) |
| $100,000 to $149,999 | 295 (22.0%) | 80 (11.2%) |
| $150,000 or more | 190 (14.2%) | 26 (3.6%) |
| Total | 1,339 (100.0%) | 717 (100.0%) |
Monthly Housing Cost Tiers in Stafford Springs
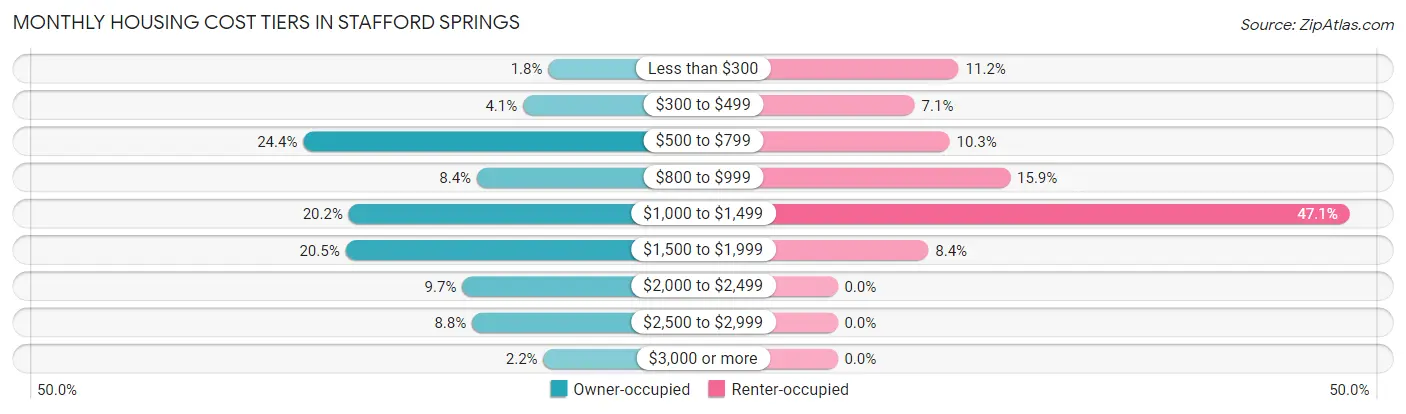
| Monthly Cost | Owner-occupied | Renter-occupied |
| Less than $300 | 24 (1.8%) | 80 (11.2%) |
| $300 to $499 | 55 (4.1%) | 51 (7.1%) |
| $500 to $799 | 326 (24.3%) | 74 (10.3%) |
| $800 to $999 | 112 (8.4%) | 114 (15.9%) |
| $1,000 to $1,499 | 270 (20.2%) | 338 (47.1%) |
| $1,500 to $1,999 | 274 (20.5%) | 60 (8.4%) |
| $2,000 to $2,499 | 130 (9.7%) | 0 (0.0%) |
| $2,500 to $2,999 | 118 (8.8%) | 0 (0.0%) |
| $3,000 or more | 30 (2.2%) | 0 (0.0%) |
| Total | 1,339 (100.0%) | 717 (100.0%) |
Physical Housing Characteristics in Stafford Springs
Housing Structures in Stafford Springs
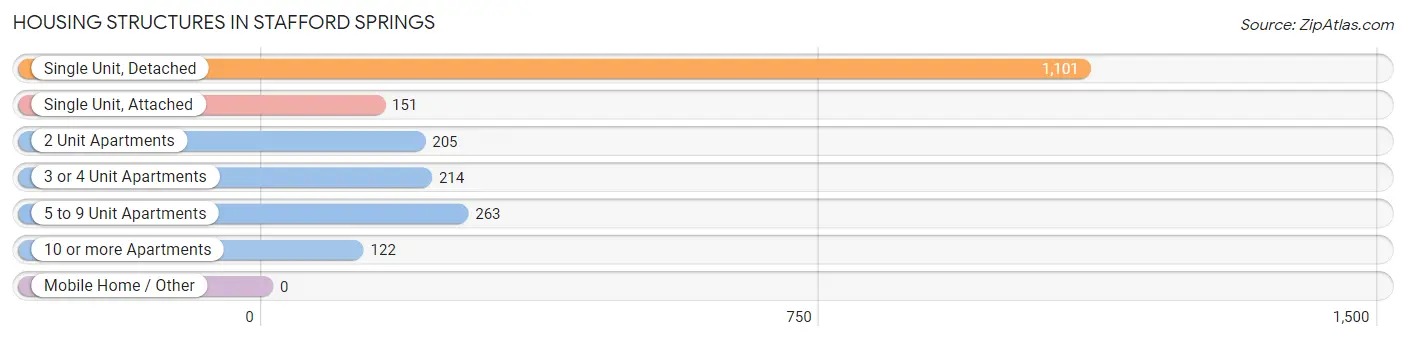
| Structure Type | # Housing Units | % Housing Units |
| Single Unit, Detached | 1,101 | 53.5% |
| Single Unit, Attached | 151 | 7.3% |
| 2 Unit Apartments | 205 | 10.0% |
| 3 or 4 Unit Apartments | 214 | 10.4% |
| 5 to 9 Unit Apartments | 263 | 12.8% |
| 10 or more Apartments | 122 | 5.9% |
| Mobile Home / Other | 0 | 0.0% |
| Total | 2,056 | 100.0% |
Housing Structures by Occupancy in Stafford Springs
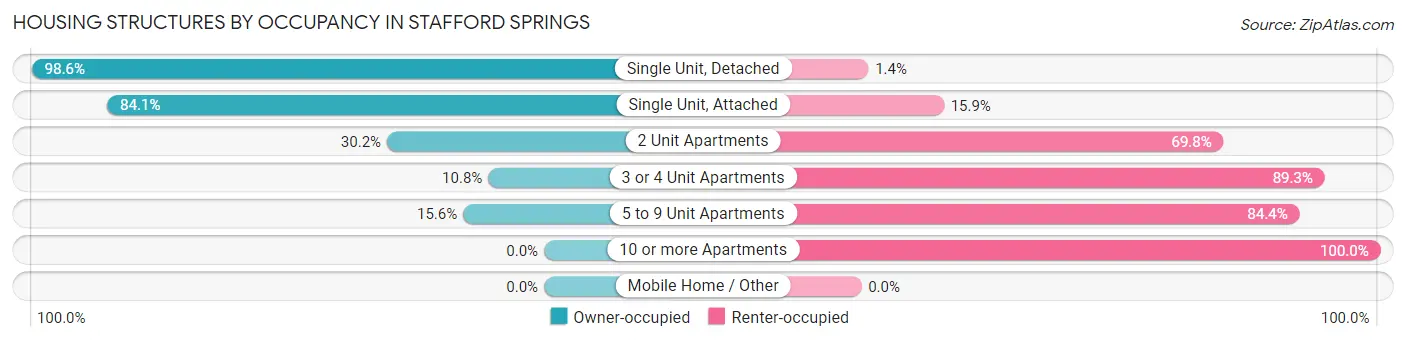
| Structure Type | Owner-occupied | Renter-occupied |
| Single Unit, Detached | 1,086 (98.6%) | 15 (1.4%) |
| Single Unit, Attached | 127 (84.1%) | 24 (15.9%) |
| 2 Unit Apartments | 62 (30.2%) | 143 (69.8%) |
| 3 or 4 Unit Apartments | 23 (10.7%) | 191 (89.2%) |
| 5 to 9 Unit Apartments | 41 (15.6%) | 222 (84.4%) |
| 10 or more Apartments | 0 (0.0%) | 122 (100.0%) |
| Mobile Home / Other | 0 (0.0%) | 0 (0.0%) |
| Total | 1,339 (65.1%) | 717 (34.9%) |
Housing Structures by Number of Rooms in Stafford Springs
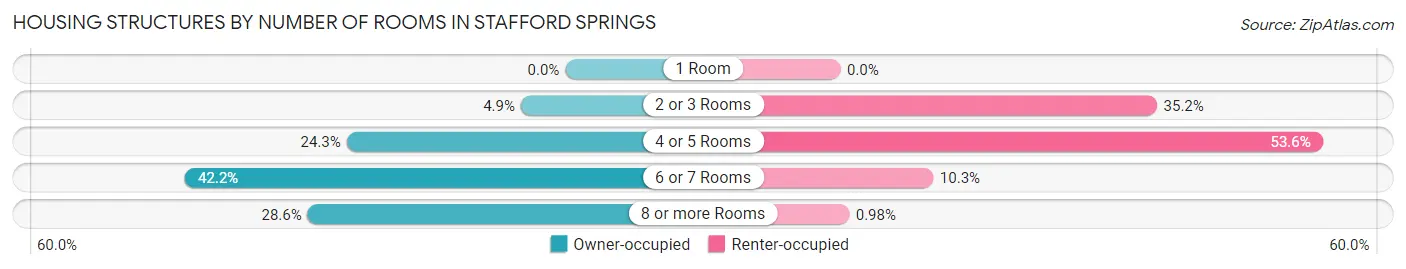
| Number of Rooms | Owner-occupied | Renter-occupied |
| 1 Room | 0 (0.0%) | 0 (0.0%) |
| 2 or 3 Rooms | 66 (4.9%) | 252 (35.1%) |
| 4 or 5 Rooms | 325 (24.3%) | 384 (53.6%) |
| 6 or 7 Rooms | 565 (42.2%) | 74 (10.3%) |
| 8 or more Rooms | 383 (28.6%) | 7 (1.0%) |
| Total | 1,339 (100.0%) | 717 (100.0%) |
Housing Structure by Heating Type in Stafford Springs
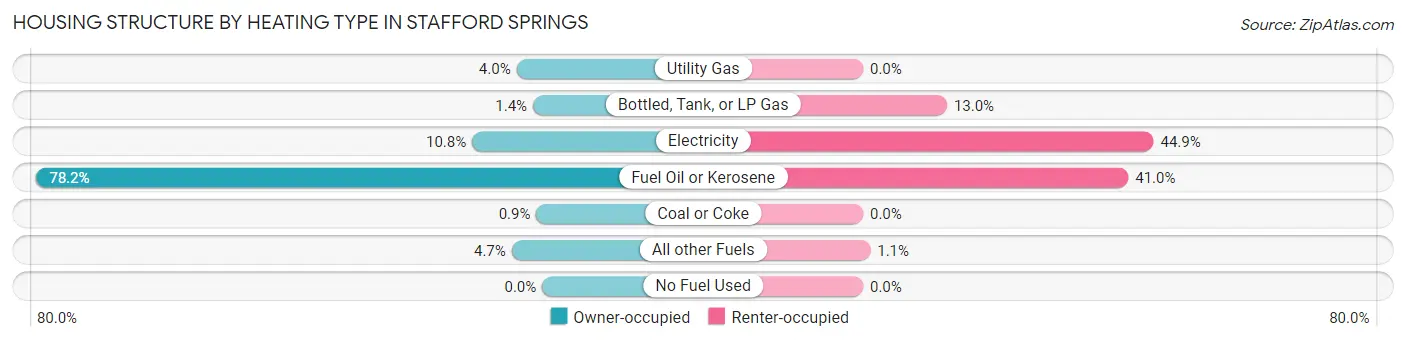
| Heating Type | Owner-occupied | Renter-occupied |
| Utility Gas | 53 (4.0%) | 0 (0.0%) |
| Bottled, Tank, or LP Gas | 19 (1.4%) | 93 (13.0%) |
| Electricity | 145 (10.8%) | 322 (44.9%) |
| Fuel Oil or Kerosene | 1,047 (78.2%) | 294 (41.0%) |
| Coal or Coke | 12 (0.9%) | 0 (0.0%) |
| All other Fuels | 63 (4.7%) | 8 (1.1%) |
| No Fuel Used | 0 (0.0%) | 0 (0.0%) |
| Total | 1,339 (100.0%) | 717 (100.0%) |
Household Vehicle Usage in Stafford Springs
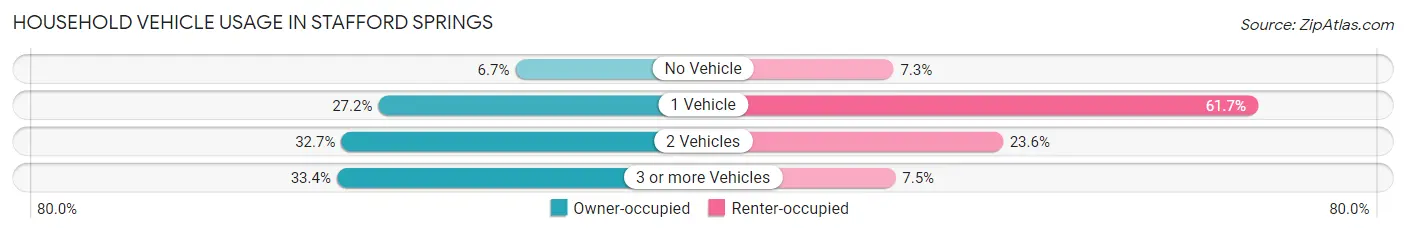
| Vehicles per Household | Owner-occupied | Renter-occupied |
| No Vehicle | 90 (6.7%) | 52 (7.2%) |
| 1 Vehicle | 364 (27.2%) | 442 (61.7%) |
| 2 Vehicles | 438 (32.7%) | 169 (23.6%) |
| 3 or more Vehicles | 447 (33.4%) | 54 (7.5%) |
| Total | 1,339 (100.0%) | 717 (100.0%) |
Real Estate & Mortgages in Stafford Springs
Real Estate and Mortgage Overview in Stafford Springs
| Characteristic | Without Mortgage | With Mortgage |
| Housing Units | 545 | 794 |
| Median Property Value | $198,800 | $207,800 |
| Median Household Income | $63,226 | $152 |
| Monthly Housing Costs | $756 | $30 |
| Real Estate Taxes | $4,424 | $7 |
Property Value by Mortgage Status in Stafford Springs
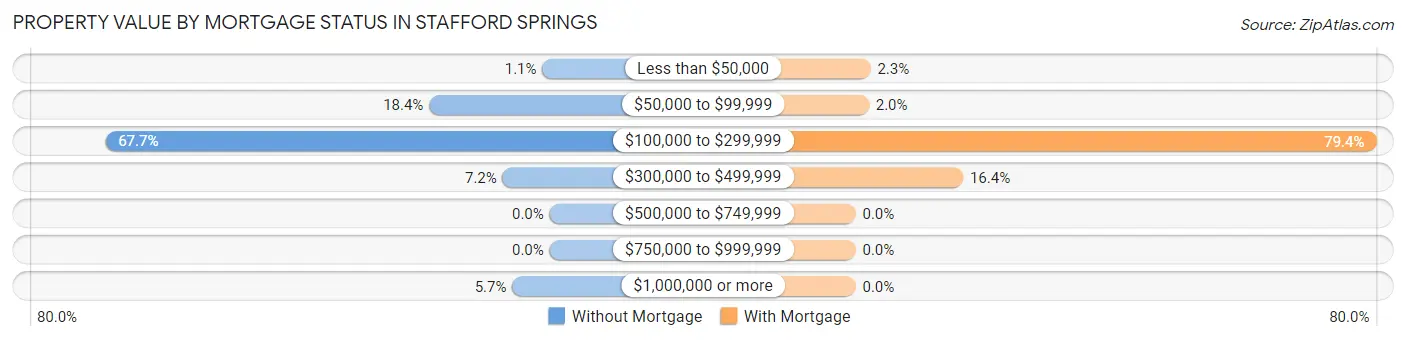
| Property Value | Without Mortgage | With Mortgage |
| Less than $50,000 | 6 (1.1%) | 18 (2.3%) |
| $50,000 to $99,999 | 100 (18.3%) | 16 (2.0%) |
| $100,000 to $299,999 | 369 (67.7%) | 630 (79.3%) |
| $300,000 to $499,999 | 39 (7.2%) | 130 (16.4%) |
| $500,000 to $749,999 | 0 (0.0%) | 0 (0.0%) |
| $750,000 to $999,999 | 0 (0.0%) | 0 (0.0%) |
| $1,000,000 or more | 31 (5.7%) | 0 (0.0%) |
| Total | 545 (100.0%) | 794 (100.0%) |
Household Income by Mortgage Status in Stafford Springs
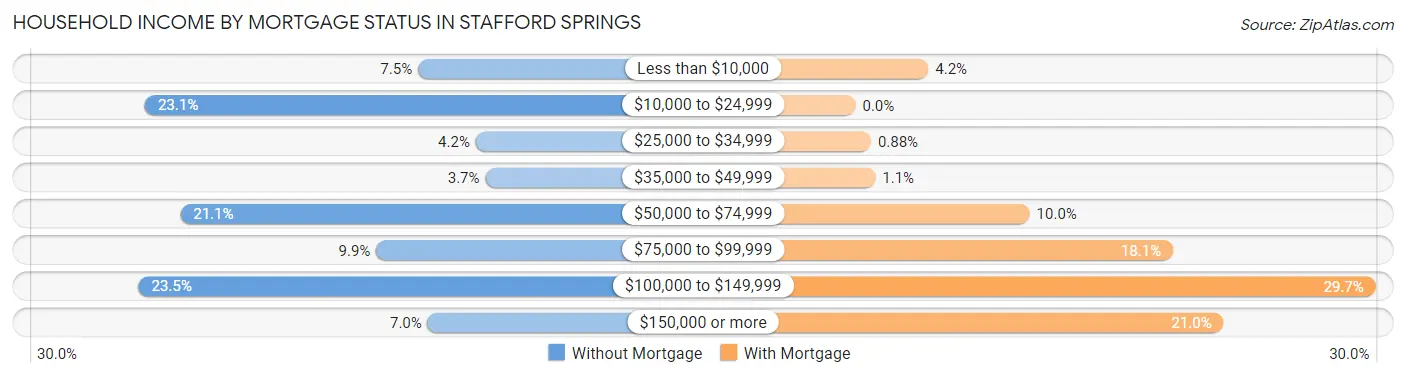
| Household Income | Without Mortgage | With Mortgage |
| Less than $10,000 | 41 (7.5%) | 33 (4.2%) |
| $10,000 to $24,999 | 126 (23.1%) | 0 (0.0%) |
| $25,000 to $34,999 | 23 (4.2%) | 7 (0.9%) |
| $35,000 to $49,999 | 20 (3.7%) | 9 (1.1%) |
| $50,000 to $74,999 | 115 (21.1%) | 79 (10.0%) |
| $75,000 to $99,999 | 54 (9.9%) | 144 (18.1%) |
| $100,000 to $149,999 | 128 (23.5%) | 236 (29.7%) |
| $150,000 or more | 38 (7.0%) | 167 (21.0%) |
| Total | 545 (100.0%) | 794 (100.0%) |
Property Value to Household Income Ratio in Stafford Springs
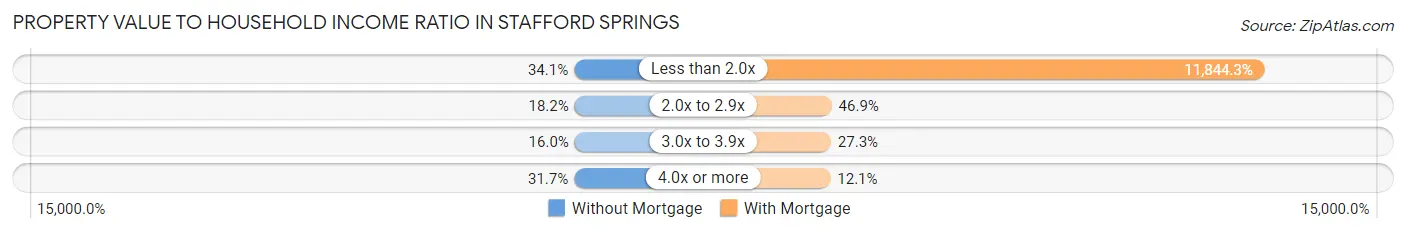
| Value-to-Income Ratio | Without Mortgage | With Mortgage |
| Less than 2.0x | 186 (34.1%) | 94,044 (11,844.3%) |
| 2.0x to 2.9x | 99 (18.2%) | 372 (46.9%) |
| 3.0x to 3.9x | 87 (16.0%) | 217 (27.3%) |
| 4.0x or more | 173 (31.7%) | 96 (12.1%) |
| Total | 545 (100.0%) | 794 (100.0%) |
Real Estate Taxes by Mortgage Status in Stafford Springs
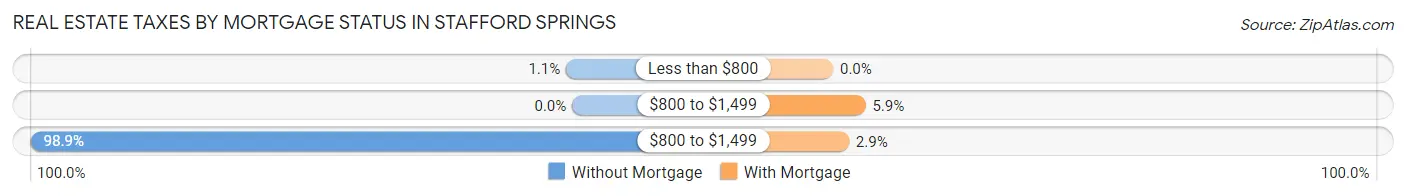
| Property Taxes | Without Mortgage | With Mortgage |
| Less than $800 | 6 (1.1%) | 0 (0.0%) |
| $800 to $1,499 | 0 (0.0%) | 47 (5.9%) |
| $800 to $1,499 | 539 (98.9%) | 23 (2.9%) |
| Total | 545 (100.0%) | 794 (100.0%) |
Health & Disability in Stafford Springs
Health Insurance Coverage by Age in Stafford Springs
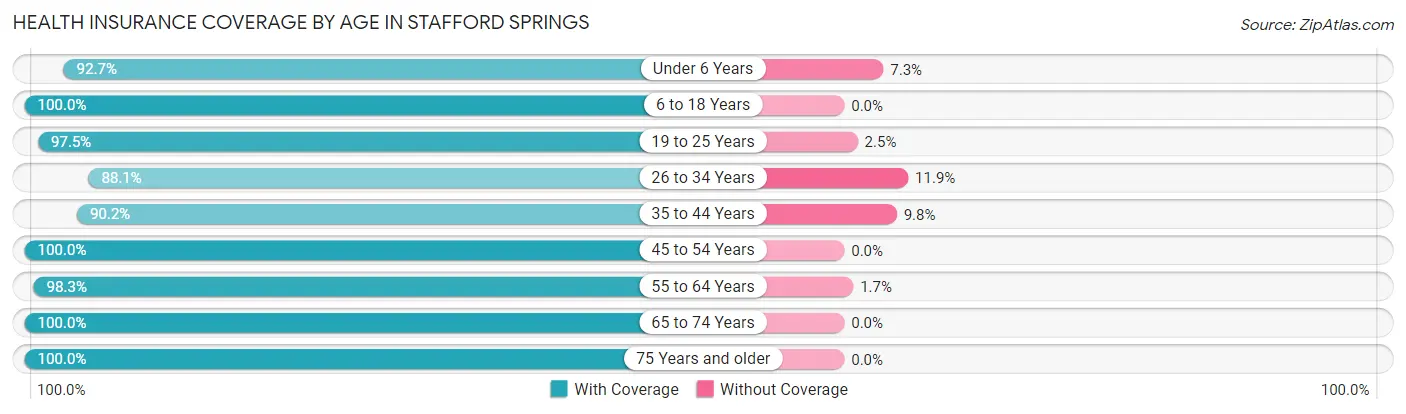
| Age Bracket | With Coverage | Without Coverage |
| Under 6 Years | 344 (92.7%) | 27 (7.3%) |
| 6 to 18 Years | 824 (100.0%) | 0 (0.0%) |
| 19 to 25 Years | 313 (97.5%) | 8 (2.5%) |
| 26 to 34 Years | 429 (88.1%) | 58 (11.9%) |
| 35 to 44 Years | 554 (90.2%) | 60 (9.8%) |
| 45 to 54 Years | 553 (100.0%) | 0 (0.0%) |
| 55 to 64 Years | 649 (98.3%) | 11 (1.7%) |
| 65 to 74 Years | 656 (100.0%) | 0 (0.0%) |
| 75 Years and older | 404 (100.0%) | 0 (0.0%) |
| Total | 4,726 (96.7%) | 164 (3.4%) |
Health Insurance Coverage by Citizenship Status in Stafford Springs
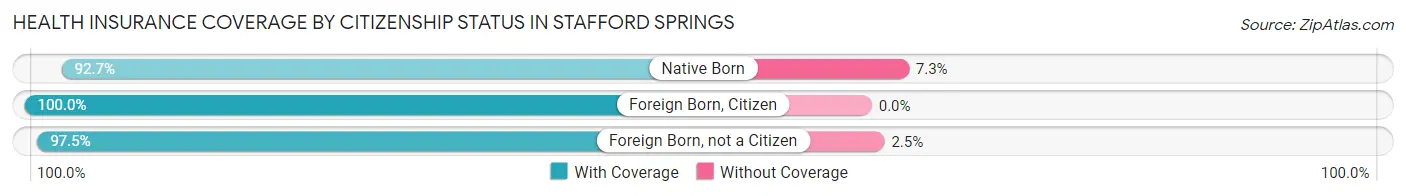
| Citizenship Status | With Coverage | Without Coverage |
| Native Born | 344 (92.7%) | 27 (7.3%) |
| Foreign Born, Citizen | 824 (100.0%) | 0 (0.0%) |
| Foreign Born, not a Citizen | 313 (97.5%) | 8 (2.5%) |
Health Insurance Coverage by Household Income in Stafford Springs
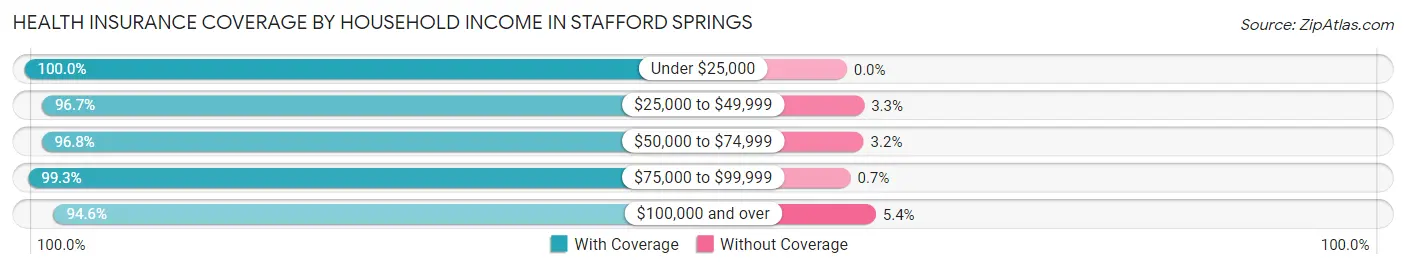
| Household Income | With Coverage | Without Coverage |
| Under $25,000 | 511 (100.0%) | 0 (0.0%) |
| $25,000 to $49,999 | 563 (96.7%) | 19 (3.3%) |
| $50,000 to $74,999 | 919 (96.8%) | 30 (3.2%) |
| $75,000 to $99,999 | 847 (99.3%) | 6 (0.7%) |
| $100,000 and over | 1,879 (94.6%) | 108 (5.4%) |
Public vs Private Health Insurance Coverage by Age in Stafford Springs
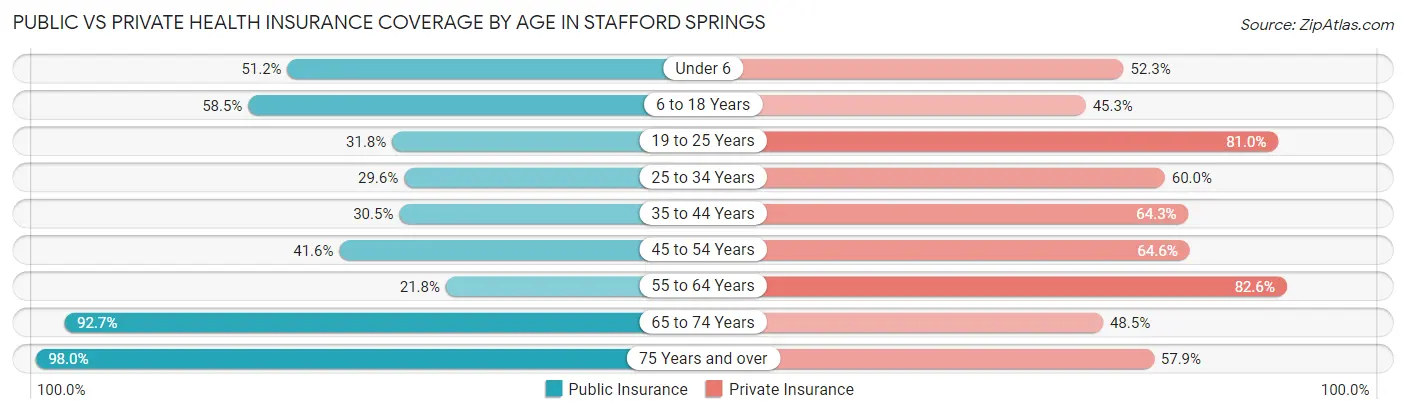
| Age Bracket | Public Insurance | Private Insurance |
| Under 6 | 190 (51.2%) | 194 (52.3%) |
| 6 to 18 Years | 482 (58.5%) | 373 (45.3%) |
| 19 to 25 Years | 102 (31.8%) | 260 (81.0%) |
| 25 to 34 Years | 144 (29.6%) | 292 (60.0%) |
| 35 to 44 Years | 187 (30.5%) | 395 (64.3%) |
| 45 to 54 Years | 230 (41.6%) | 357 (64.6%) |
| 55 to 64 Years | 144 (21.8%) | 545 (82.6%) |
| 65 to 74 Years | 608 (92.7%) | 318 (48.5%) |
| 75 Years and over | 396 (98.0%) | 234 (57.9%) |
| Total | 2,483 (50.8%) | 2,968 (60.7%) |
Disability Status by Sex by Age in Stafford Springs
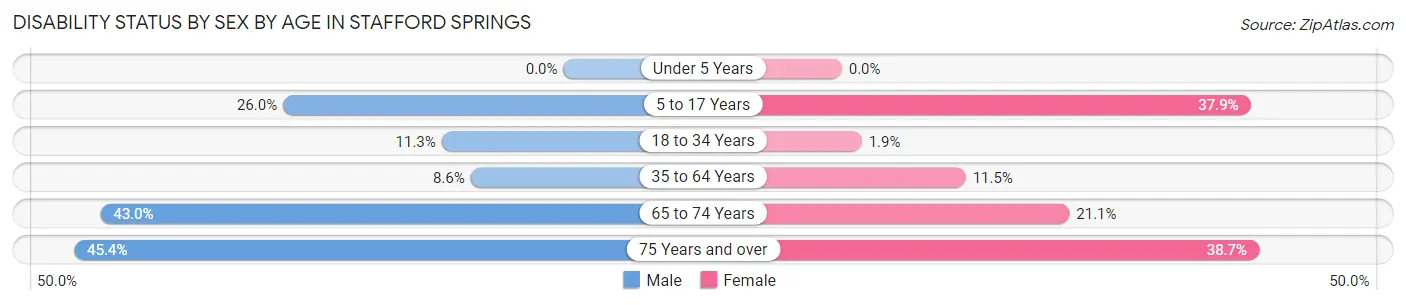
| Age Bracket | Male | Female |
| Under 5 Years | 0 (0.0%) | 0 (0.0%) |
| 5 to 17 Years | 102 (26.0%) | 157 (37.9%) |
| 18 to 34 Years | 47 (11.3%) | 8 (1.8%) |
| 35 to 64 Years | 72 (8.6%) | 114 (11.5%) |
| 65 to 74 Years | 113 (43.0%) | 83 (21.1%) |
| 75 Years and over | 79 (45.4%) | 89 (38.7%) |
Disability Class by Sex by Age in Stafford Springs
Disability Class: Hearing Difficulty
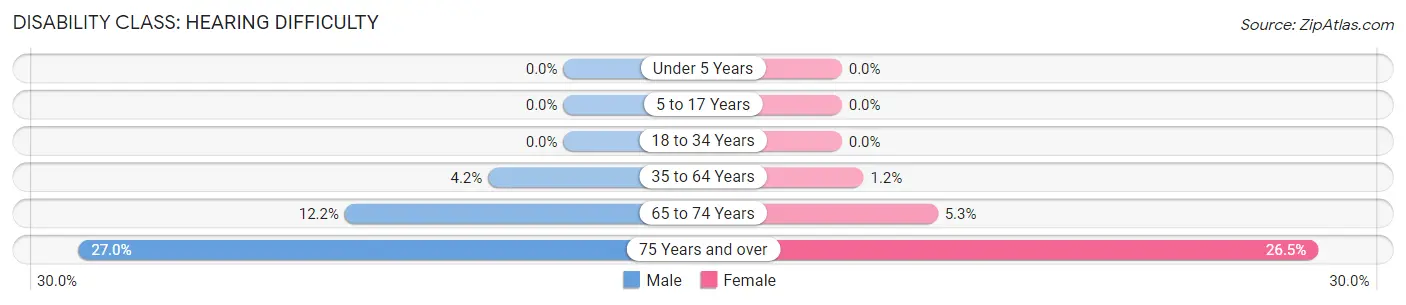
| Age Bracket | Male | Female |
| Under 5 Years | 0 (0.0%) | 0 (0.0%) |
| 5 to 17 Years | 0 (0.0%) | 0 (0.0%) |
| 18 to 34 Years | 0 (0.0%) | 0 (0.0%) |
| 35 to 64 Years | 35 (4.2%) | 12 (1.2%) |
| 65 to 74 Years | 32 (12.2%) | 21 (5.3%) |
| 75 Years and over | 47 (27.0%) | 61 (26.5%) |
Disability Class: Vision Difficulty
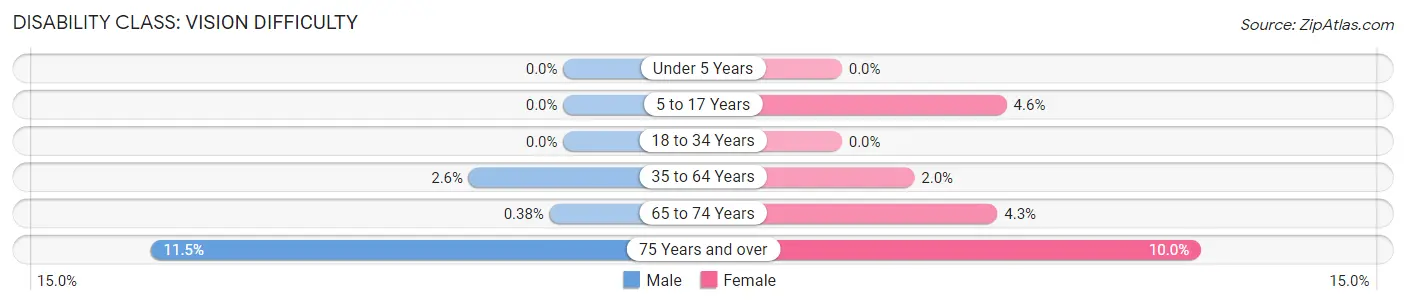
| Age Bracket | Male | Female |
| Under 5 Years | 0 (0.0%) | 0 (0.0%) |
| 5 to 17 Years | 0 (0.0%) | 19 (4.6%) |
| 18 to 34 Years | 0 (0.0%) | 0 (0.0%) |
| 35 to 64 Years | 22 (2.6%) | 20 (2.0%) |
| 65 to 74 Years | 1 (0.4%) | 17 (4.3%) |
| 75 Years and over | 20 (11.5%) | 23 (10.0%) |
Disability Class: Cognitive Difficulty
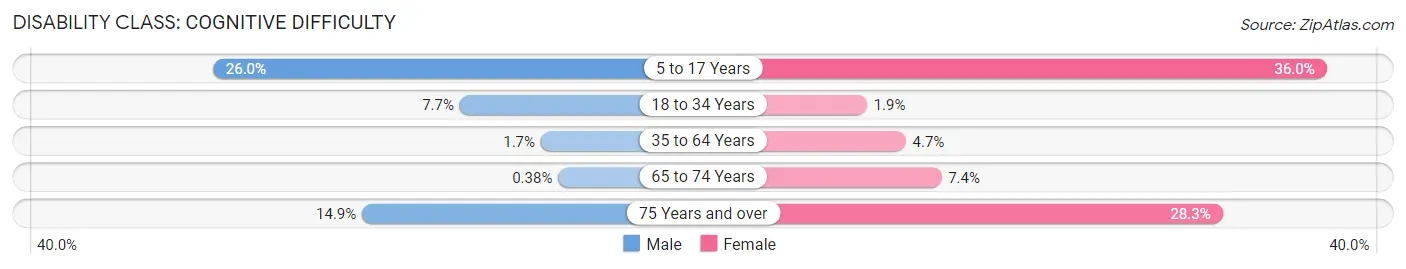
| Age Bracket | Male | Female |
| 5 to 17 Years | 102 (26.0%) | 149 (36.0%) |
| 18 to 34 Years | 32 (7.7%) | 8 (1.8%) |
| 35 to 64 Years | 14 (1.7%) | 47 (4.7%) |
| 65 to 74 Years | 1 (0.4%) | 29 (7.4%) |
| 75 Years and over | 26 (14.9%) | 65 (28.3%) |
Disability Class: Ambulatory Difficulty
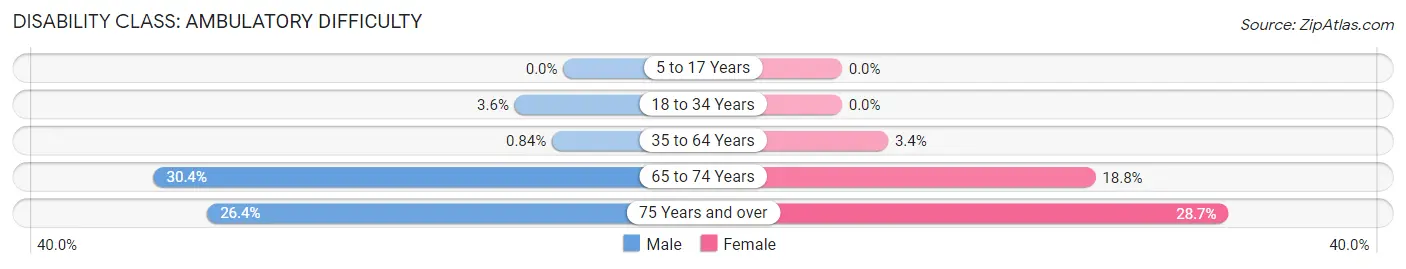
| Age Bracket | Male | Female |
| 5 to 17 Years | 0 (0.0%) | 0 (0.0%) |
| 18 to 34 Years | 15 (3.6%) | 0 (0.0%) |
| 35 to 64 Years | 7 (0.8%) | 34 (3.4%) |
| 65 to 74 Years | 80 (30.4%) | 74 (18.8%) |
| 75 Years and over | 46 (26.4%) | 66 (28.7%) |
Disability Class: Self-Care Difficulty
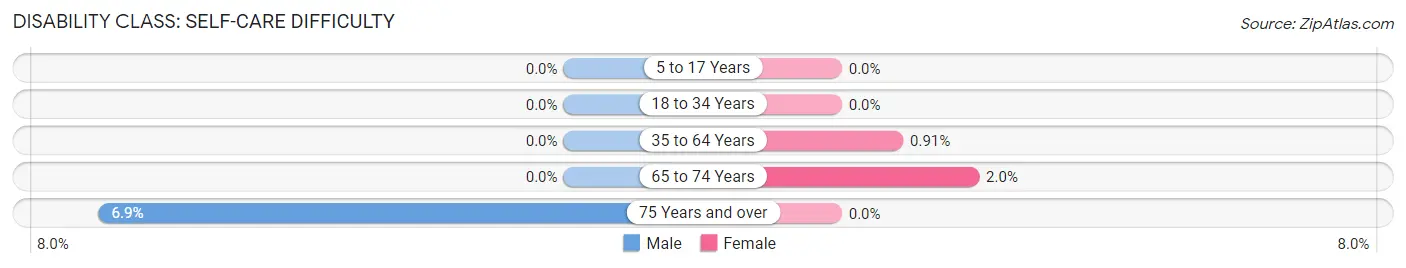
| Age Bracket | Male | Female |
| 5 to 17 Years | 0 (0.0%) | 0 (0.0%) |
| 18 to 34 Years | 0 (0.0%) | 0 (0.0%) |
| 35 to 64 Years | 0 (0.0%) | 9 (0.9%) |
| 65 to 74 Years | 0 (0.0%) | 8 (2.0%) |
| 75 Years and over | 12 (6.9%) | 0 (0.0%) |
Technology Access in Stafford Springs
Computing Device Access in Stafford Springs
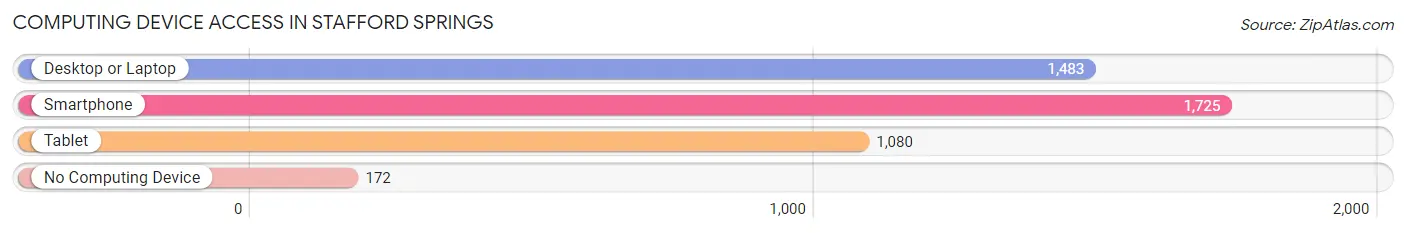
| Device Type | # Households | % Households |
| Desktop or Laptop | 1,483 | 72.1% |
| Smartphone | 1,725 | 83.9% |
| Tablet | 1,080 | 52.5% |
| No Computing Device | 172 | 8.4% |
| Total | 2,056 | 100.0% |
Internet Access in Stafford Springs
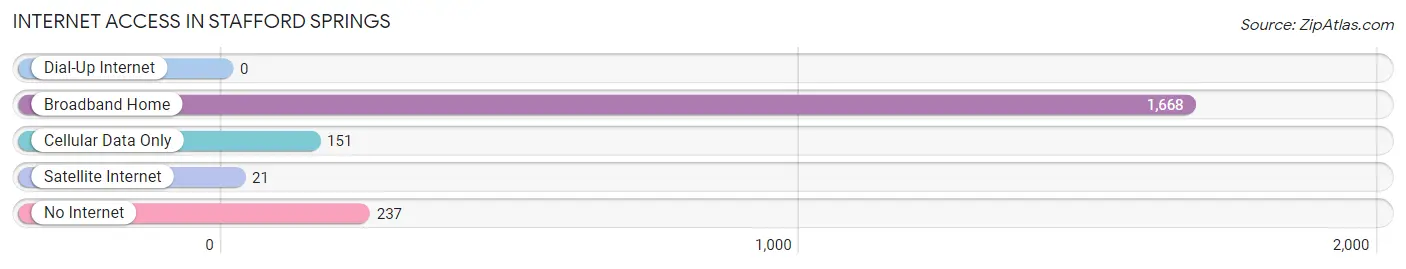
| Internet Type | # Households | % Households |
| Dial-Up Internet | 0 | 0.0% |
| Broadband Home | 1,668 | 81.1% |
| Cellular Data Only | 151 | 7.3% |
| Satellite Internet | 21 | 1.0% |
| No Internet | 237 | 11.5% |
| Total | 2,056 | 100.0% |
Stafford Springs Summary
Stafford Springs, Connecticut is a small town located in Tolland County in the northeastern part of the state. It is bordered by the towns of Somers, Union, Willington, and Ellington. The town has a population of approximately 11,000 people and covers an area of about 25 square miles.
Stafford Springs is located in the Connecticut River Valley, which is known for its rolling hills and lush forests. The town is situated on the banks of the Willimantic River, which is a tributary of the Connecticut River. The town is also home to several small lakes, including Crystal Lake, Stafford Pond, and Lake Congamond.
The town was first settled in 1719 by settlers from Massachusetts. The town was named after Staffordshire, England, and was incorporated in 1719. The town was an important stop on the stagecoach route between Hartford and Boston.
The economy of Stafford Springs is largely based on agriculture and manufacturing. The town is home to several large farms, including the Stafford Springs Dairy Farm, which produces milk, cheese, and other dairy products. The town is also home to several manufacturing companies, including the Stafford Springs Manufacturing Company, which produces a variety of products, including furniture, tools, and machinery.
The town is also home to several small businesses, including restaurants, retail stores, and service providers. The town is also home to several educational institutions, including Stafford Springs High School, Stafford Springs Middle School, and Stafford Springs Elementary School.
The town has a rich history and culture. The town is home to several historic sites, including the Stafford Springs Historic District, which is listed on the National Register of Historic Places. The town is also home to several museums, including the Stafford Springs Historical Society Museum, which houses artifacts from the town's history.
The town is also home to several parks and recreational areas, including the Stafford Springs State Park, which offers camping, fishing, and hiking. The town is also home to several golf courses, including the Stafford Springs Country Club.
The town has a diverse population, with a mix of people from different backgrounds and cultures. The town has a median household income of $60,000, and the median age is 40. The town has a higher than average rate of poverty, with about 15% of the population living below the poverty line.
Stafford Springs is a small town with a rich history and culture. The town is home to several farms, manufacturing companies, small businesses, and educational institutions. The town is also home to several parks and recreational areas, and has a diverse population. The town has a median household income of $60,000, and the median age is 40. The town has a higher than average rate of poverty, with about 15% of the population living below the poverty line.
Common Questions
What is Per Capita Income in Stafford Springs?
Per Capita income in Stafford Springs is $34,841.
What is the Median Family Income in Stafford Springs?
Median Family Income in Stafford Springs is $92,708.
What is the Median Household income in Stafford Springs?
Median Household Income in Stafford Springs is $68,929.
What is Income or Wage Gap in Stafford Springs?
Income or Wage Gap in Stafford Springs is 16.1%.
Women in Stafford Springs earn 83.9 cents for every dollar earned by a man.
What is Family Income Deficit in Stafford Springs?
Family Income Deficit in Stafford Springs is $15,647.
Families that are below poverty line in Stafford Springs earn $15,647 less on average than the poverty threshold level.
What is Inequality or Gini Index in Stafford Springs?
Inequality or Gini Index in Stafford Springs is 0.40.
What is the Total Population of Stafford Springs?
Total Population of Stafford Springs is 4,890.
What is the Total Male Population of Stafford Springs?
Total Male Population of Stafford Springs is 2,273.
What is the Total Female Population of Stafford Springs?
Total Female Population of Stafford Springs is 2,617.
What is the Ratio of Males per 100 Females in Stafford Springs?
There are 86.86 Males per 100 Females in Stafford Springs.
What is the Ratio of Females per 100 Males in Stafford Springs?
There are 115.13 Females per 100 Males in Stafford Springs.
What is the Median Population Age in Stafford Springs?
Median Population Age in Stafford Springs is 43.3 Years.
What is the Average Family Size in Stafford Springs
Average Family Size in Stafford Springs is 3.2 People.
What is the Average Household Size in Stafford Springs
Average Household Size in Stafford Springs is 2.4 People.
How Large is the Labor Force in Stafford Springs?
There are 2,504 People in the Labor Forcein in Stafford Springs.
What is the Percentage of People in the Labor Force in Stafford Springs?
64.4% of People are in the Labor Force in Stafford Springs.
What is the Unemployment Rate in Stafford Springs?
Unemployment Rate in Stafford Springs is 6.6%.