Cities with the Highest Percentage of Finnish Population in Connecticut
RELATED REPORTS & OPTIONS
Finnish
Connecticut
Compare Cities
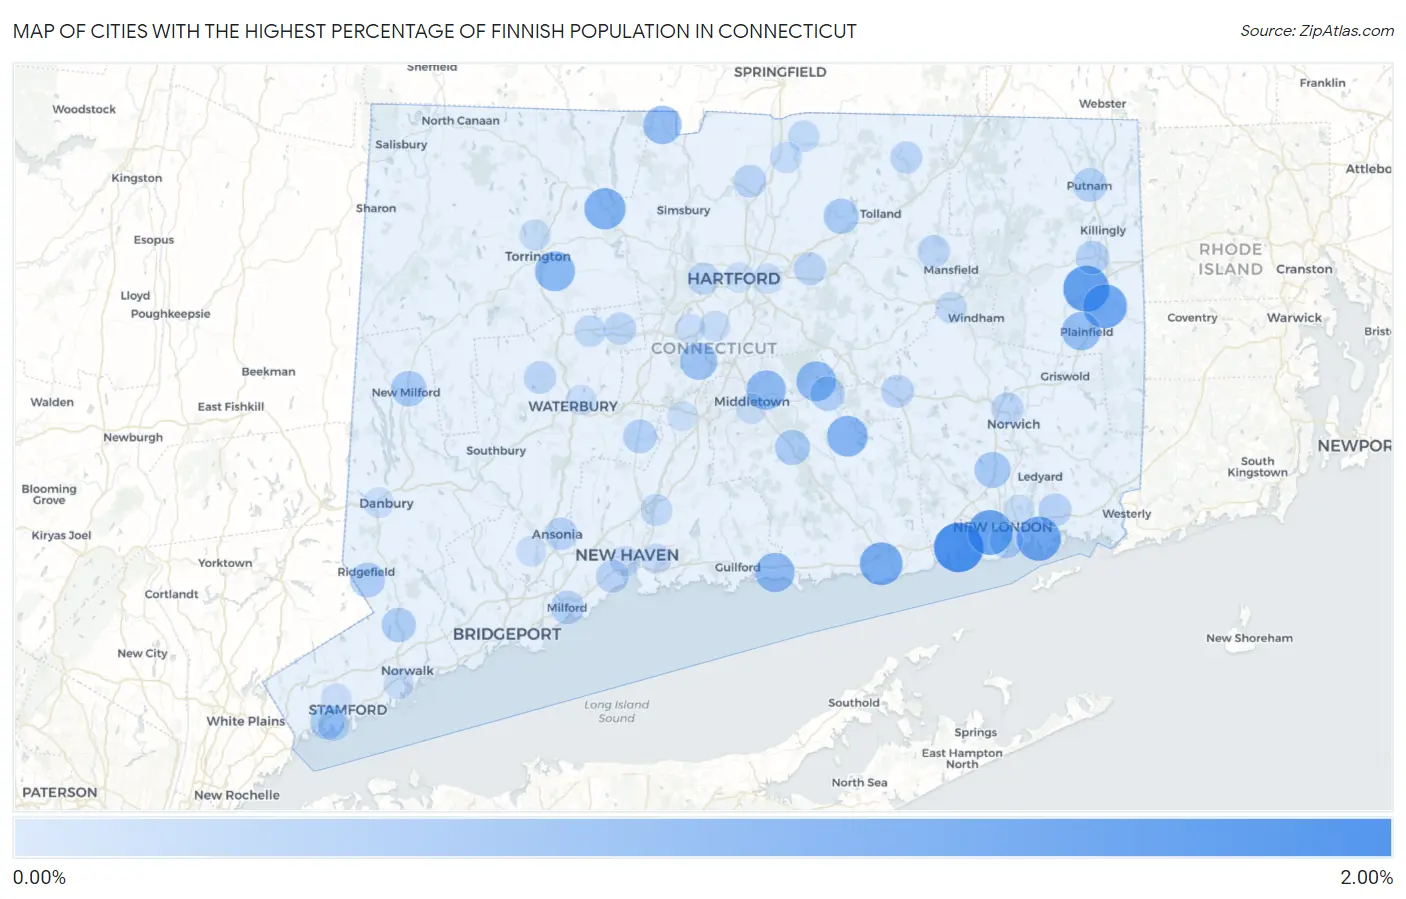
Map of Cities with the Highest Percentage of Finnish Population in Connecticut
0.00%
2.00%
Cities with the Highest Percentage of Finnish Population in Connecticut
| City | Finnish | vs State | vs National | |
| 1. | Niantic | 1.69% | 0.14%(+1.55)#1 | 0.19%(+1.50)#891 |
| 2. | Wauregan | 1.36% | 0.14%(+1.22)#2 | 0.19%(+1.17)#1,107 |
| 3. | Waterford | 1.28% | 0.14%(+1.15)#3 | 0.19%(+1.09)#1,168 |
| 4. | Poquonock Bridge | 1.22% | 0.14%(+1.09)#4 | 0.19%(+1.03)#1,217 |
| 5. | Moosup | 1.20% | 0.14%(+1.06)#5 | 0.19%(+1.01)#1,245 |
| 6. | Old Saybrook Center | 1.09% | 0.14%(+0.954)#6 | 0.19%(+0.901)#1,353 |
| 7. | New Hartford Center | 0.95% | 0.14%(+0.817)#7 | 0.19%(+0.763)#1,556 |
| 8. | Moodus | 0.90% | 0.14%(+0.764)#8 | 0.19%(+0.710)#1,641 |
| 9. | Bantam Borough | 0.86% | 0.14%(+0.724)#9 | 0.19%(+0.671)#1,709 |
| 10. | Northwest Harwinton | 0.84% | 0.14%(+0.707)#10 | 0.19%(+0.653)#1,735 |
| 11. | Lake Pocotopaug | 0.82% | 0.14%(+0.683)#11 | 0.19%(+0.629)#1,788 |
| 12. | Portland | 0.79% | 0.14%(+0.658)#12 | 0.19%(+0.605)#1,836 |
| 13. | Madison Center | 0.78% | 0.14%(+0.645)#13 | 0.19%(+0.591)#1,861 |
| 14. | Saugatuck | 0.73% | 0.14%(+0.597)#14 | 0.19%(+0.544)#1,973 |
| 15. | Plainfield Village | 0.71% | 0.14%(+0.572)#15 | 0.19%(+0.519)#2,026 |
| 16. | North Granby | 0.71% | 0.14%(+0.571)#16 | 0.19%(+0.517)#2,027 |
| 17. | Woodmont Borough | 0.68% | 0.14%(+0.543)#17 | 0.19%(+0.490)#2,093 |
| 18. | Lordship | 0.68% | 0.14%(+0.539)#18 | 0.19%(+0.485)#2,106 |
| 19. | Quinnipiac University | 0.67% | 0.14%(+0.534)#19 | 0.19%(+0.480)#2,122 |
| 20. | Kensington | 0.61% | 0.14%(+0.469)#20 | 0.19%(+0.416)#2,299 |
| 21. | Oxoboxo River | 0.49% | 0.14%(+0.358)#21 | 0.19%(+0.304)#2,671 |
| 22. | New Milford | 0.45% | 0.14%(+0.315)#22 | 0.19%(+0.261)#2,854 |
| 23. | Lakes West | 0.44% | 0.14%(+0.305)#23 | 0.19%(+0.252)#2,901 |
| 24. | Rockville | 0.43% | 0.14%(+0.295)#24 | 0.19%(+0.242)#2,970 |
| 25. | Higganum | 0.41% | 0.14%(+0.277)#25 | 0.19%(+0.224)#3,044 |
| 26. | Ridgefield | 0.40% | 0.14%(+0.269)#26 | 0.19%(+0.215)#3,079 |
| 27. | Daniels Farm | 0.40% | 0.14%(+0.259)#27 | 0.19%(+0.206)#3,140 |
| 28. | East Hampton | 0.37% | 0.14%(+0.237)#28 | 0.19%(+0.184)#3,268 |
| 29. | Wilton Center | 0.37% | 0.14%(+0.229)#29 | 0.19%(+0.176)#3,316 |
| 30. | Riverside | 0.36% | 0.14%(+0.227)#30 | 0.19%(+0.173)#3,332 |
| 31. | New London | 0.31% | 0.14%(+0.172)#31 | 0.19%(+0.118)#3,670 |
| 32. | Cheshire Village | 0.31% | 0.14%(+0.170)#32 | 0.19%(+0.116)#3,686 |
| 33. | Putnam | 0.31% | 0.14%(+0.169)#33 | 0.19%(+0.115)#3,692 |
| 34. | Oronoque | 0.30% | 0.14%(+0.159)#34 | 0.19%(+0.105)#3,776 |
| 35. | East Brooklyn | 0.29% | 0.14%(+0.156)#35 | 0.19%(+0.103)#3,799 |
| 36. | Milford City Balance | 0.28% | 0.14%(+0.142)#36 | 0.19%(+0.088)#3,916 |
| 37. | New Canaan | 0.28% | 0.14%(+0.140)#37 | 0.19%(+0.087)#3,927 |
| 38. | Old Mystic | 0.27% | 0.14%(+0.130)#38 | 0.19%(+0.076)#4,020 |
| 39. | Windsor Locks | 0.24% | 0.14%(+0.102)#39 | 0.19%(+0.049)#4,255 |
| 40. | West Haven | 0.23% | 0.14%(+0.095)#40 | 0.19%(+0.041)#4,324 |
| 41. | Colchester | 0.23% | 0.14%(+0.090)#41 | 0.19%(+0.036)#4,382 |
| 42. | Manchester | 0.22% | 0.14%(+0.088)#42 | 0.19%(+0.034)#4,393 |
| 43. | Ansonia | 0.22% | 0.14%(+0.080)#43 | 0.19%(+0.026)#4,478 |
| 44. | Storrs | 0.22% | 0.14%(+0.079)#44 | 0.19%(+0.026)#4,483 |
| 45. | Watertown | 0.21% | 0.14%(+0.076)#45 | 0.19%(+0.023)#4,513 |
| 46. | Norwich | 0.21% | 0.14%(+0.071)#46 | 0.19%(+0.017)#4,568 |
| 47. | Bristol | 0.19% | 0.14%(+0.052)#47 | 0.19%(-0.002)#4,766 |
| 48. | West Hartford | 0.19% | 0.14%(+0.051)#48 | 0.19%(-0.003)#4,783 |
| 49. | Stafford Springs | 0.16% | 0.14%(+0.027)#49 | 0.19%(-0.026)#5,055 |
| 50. | North Haven | 0.15% | 0.14%(+0.013)#50 | 0.19%(-0.041)#5,228 |
| 51. | Old Greenwich | 0.14% | 0.14%(+0.005)#51 | 0.19%(-0.048)#5,310 |
| 52. | Terryville | 0.14% | 0.14%(+0.004)#52 | 0.19%(-0.050)#5,330 |
| 53. | Hazardville | 0.11% | 0.14%(-0.022)#53 | 0.19%(-0.076)#5,654 |
| 54. | Willimantic | 0.10% | 0.14%(-0.035)#54 | 0.19%(-0.089)#5,826 |
| 55. | Southwood Acres | 0.10% | 0.14%(-0.035)#55 | 0.19%(-0.089)#5,835 |
| 56. | Torrington | 0.093% | 0.14%(-0.043)#56 | 0.19%(-0.097)#5,950 |
| 57. | Greens Farms | 0.066% | 0.14%(-0.071)#57 | 0.19%(-0.124)#6,299 |
| 58. | Conning Towers Nautilus Park | 0.060% | 0.14%(-0.076)#58 | 0.19%(-0.130)#6,367 |
| 59. | Norwalk | 0.057% | 0.14%(-0.079)#59 | 0.19%(-0.133)#6,412 |
| 60. | Newington | 0.056% | 0.14%(-0.081)#60 | 0.19%(-0.134)#6,436 |
| 61. | Middletown | 0.054% | 0.14%(-0.082)#61 | 0.19%(-0.136)#6,458 |
| 62. | New Haven | 0.046% | 0.14%(-0.091)#62 | 0.19%(-0.144)#6,569 |
| 63. | Stamford | 0.043% | 0.14%(-0.094)#63 | 0.19%(-0.147)#6,599 |
| 64. | Danbury | 0.039% | 0.14%(-0.097)#64 | 0.19%(-0.151)#6,643 |
| 65. | Waterbury | 0.038% | 0.14%(-0.098)#65 | 0.19%(-0.151)#6,657 |
| 66. | East Hartford | 0.029% | 0.14%(-0.107)#66 | 0.19%(-0.160)#6,792 |
| 67. | East Haven | 0.025% | 0.14%(-0.111)#67 | 0.19%(-0.165)#6,841 |
| 68. | Shelton | 0.024% | 0.14%(-0.112)#68 | 0.19%(-0.166)#6,848 |
| 69. | New Britain | 0.020% | 0.14%(-0.116)#69 | 0.19%(-0.170)#6,884 |
| 70. | Meriden | 0.020% | 0.14%(-0.117)#70 | 0.19%(-0.170)#6,887 |
| 71. | Hartford | 0.0058% | 0.14%(-0.131)#71 | 0.19%(-0.184)#6,989 |
Common Questions
What are the Top 10 Cities with the Highest Percentage of Finnish Population in Connecticut?
Top 10 Cities with the Highest Percentage of Finnish Population in Connecticut are:
#1
1.69%
#2
1.36%
#3
1.28%
#4
1.22%
#5
1.20%
#6
1.09%
#7
0.95%
#8
0.90%
#9
0.84%
#10
0.82%
What city has the Highest Percentage of Finnish Population in Connecticut?
Niantic has the Highest Percentage of Finnish Population in Connecticut with 1.69%.
What is the Percentage of Finnish Population in the State of Connecticut?
Percentage of Finnish Population in Connecticut is 0.14%.
What is the Percentage of Finnish Population in the United States?
Percentage of Finnish Population in the United States is 0.19%.