Zip Codes with the Highest Percentage of Population Employed in Food Preparation & Serving in Milford, CT
RELATED REPORTS & OPTIONS
Food Preparation & Serving
Milford
Compare Zip Codes
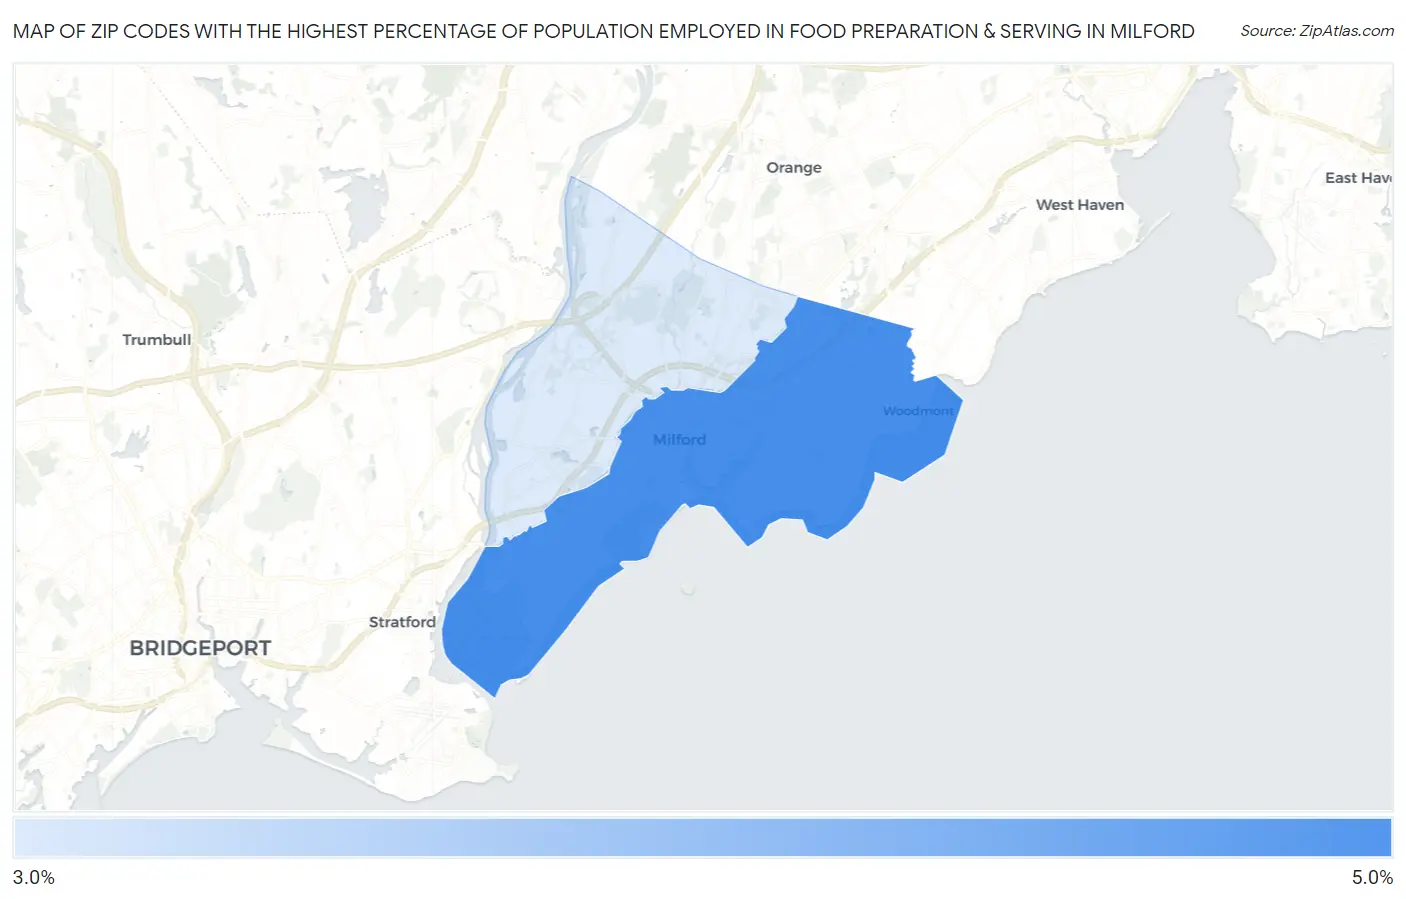
Map of Zip Codes with the Highest Percentage of Population Employed in Food Preparation & Serving in Milford
4.0%
4.1%
Zip Codes with the Highest Percentage of Population Employed in Food Preparation & Serving in Milford, CT
| Zip Code | % Employed | vs State | vs National | |
| 1. | 06460 | 4.1% | 4.7%(-0.602)#119 | 5.3%(-1.20)#16,783 |
| 2. | 06461 | 4.0% | 4.7%(-0.717)#124 | 5.3%(-1.32)#17,251 |
1
Common Questions
What are the Top Zip Codes with the Highest Percentage of Population Employed in Food Preparation & Serving in Milford, CT?
Top Zip Codes with the Highest Percentage of Population Employed in Food Preparation & Serving in Milford, CT are:
What zip code has the Highest Percentage of Population Employed in Food Preparation & Serving in Milford, CT?
06460 has the Highest Percentage of Population Employed in Food Preparation & Serving in Milford, CT with 4.1%.
What is the Percentage of Population Employed in Food Preparation & Serving in Connecticut?
Percentage of Population Employed in Food Preparation & Serving in Connecticut is 4.7%.
What is the Percentage of Population Employed in Food Preparation & Serving in the United States?
Percentage of Population Employed in Food Preparation & Serving in the United States is 5.3%.