East Haven, CT Map & Demographics
East Haven Map
East Haven Overview
$41,397
PER CAPITA INCOME
$104,821
AVG FAMILY INCOME
$83,489
AVG HOUSEHOLD INCOME
25.4%
WAGE / INCOME GAP [ % ]
74.6¢/ $1
WAGE / INCOME GAP [ $ ]
0.41
INEQUALITY / GINI INDEX
27,871
TOTAL POPULATION
13,586
MALE POPULATION
14,285
FEMALE POPULATION
95.11
MALES / 100 FEMALES
105.15
FEMALES / 100 MALES
45.1
MEDIAN AGE
3.1
AVG FAMILY SIZE
2.5
AVG HOUSEHOLD SIZE
15,274
LABOR FORCE [ PEOPLE ]
63.5%
PERCENT IN LABOR FORCE
5.0%
UNEMPLOYMENT RATE
East Haven Zip Codes
East Haven Area Codes
Income in East Haven
Income Overview in East Haven
Per Capita Income in East Haven is $41,397, while median incomes of families and households are $104,821 and $83,489 respectively.
| Characteristic | Number | Measure |
| Per Capita Income | 27,871 | $41,397 |
| Median Family Income | 6,988 | $104,821 |
| Mean Family Income | 6,988 | $119,321 |
| Median Household Income | 11,028 | $83,489 |
| Mean Household Income | 11,028 | $100,165 |
| Income Deficit | 6,988 | $0 |
| Wage / Income Gap (%) | 27,871 | 25.39% |
| Wage / Income Gap ($) | 27,871 | 74.61¢ per $1 |
| Gini / Inequality Index | 27,871 | 0.41 |
Earnings by Sex in East Haven
Average Earnings in East Haven are $51,156, $57,836 for men and $43,152 for women, a difference of 25.4%.
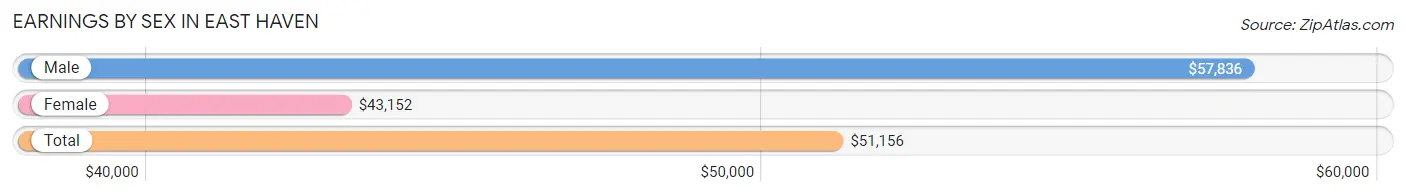
| Sex | Number | Average Earnings |
| Male | 8,074 (51.8%) | $57,836 |
| Female | 7,523 (48.2%) | $43,152 |
| Total | 15,597 (100.0%) | $51,156 |
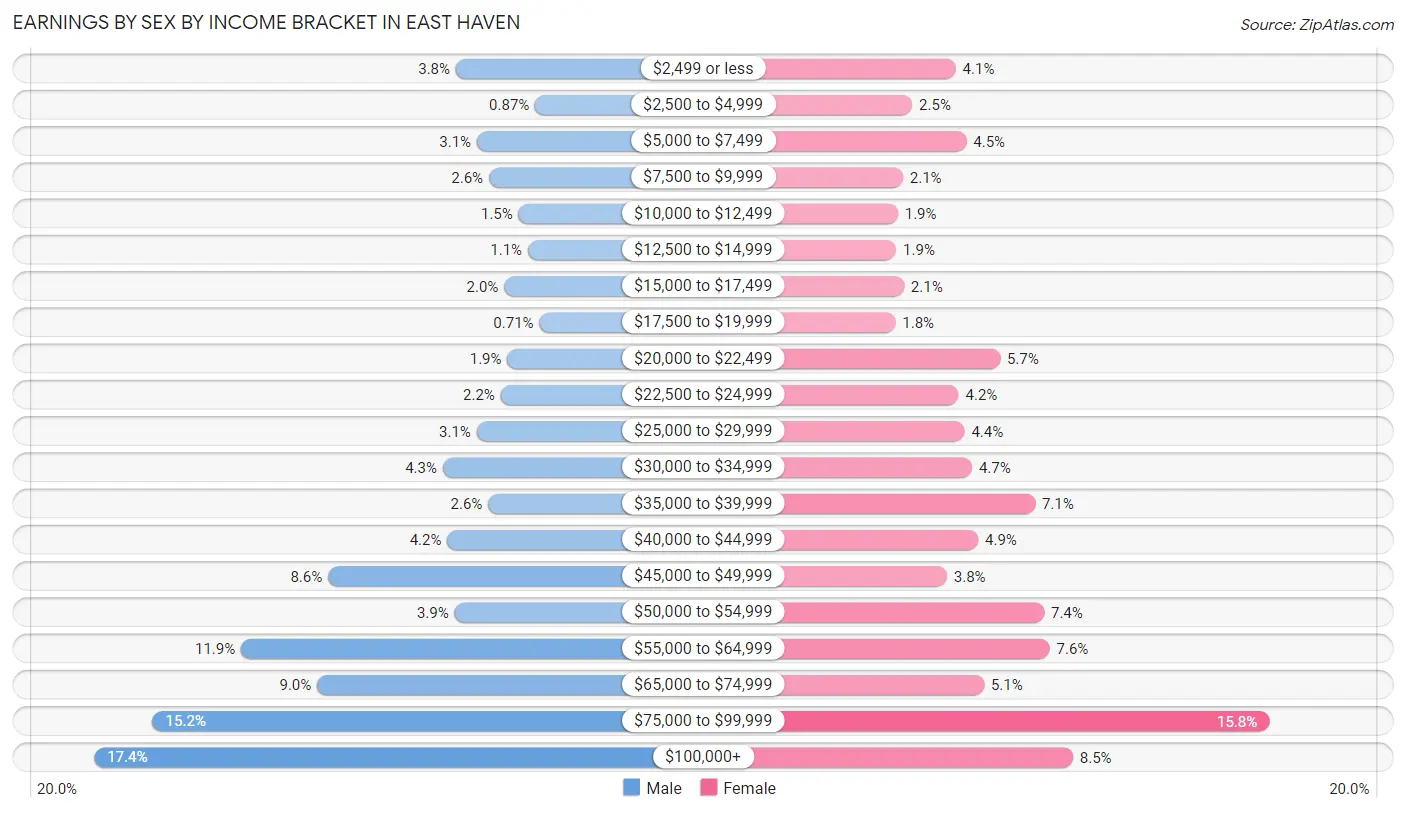
Earnings by Sex by Income Bracket in East Haven
The most common earnings brackets in East Haven are $100,000+ for men (1,404 | 17.4%) and $75,000 to $99,999 for women (1,190 | 15.8%).
| Income | Male | Female |
| $2,499 or less | 310 (3.8%) | 307 (4.1%) |
| $2,500 to $4,999 | 70 (0.9%) | 184 (2.5%) |
| $5,000 to $7,499 | 246 (3.0%) | 337 (4.5%) |
| $7,500 to $9,999 | 210 (2.6%) | 158 (2.1%) |
| $10,000 to $12,499 | 120 (1.5%) | 144 (1.9%) |
| $12,500 to $14,999 | 92 (1.1%) | 139 (1.8%) |
| $15,000 to $17,499 | 164 (2.0%) | 161 (2.1%) |
| $17,500 to $19,999 | 57 (0.7%) | 137 (1.8%) |
| $20,000 to $22,499 | 154 (1.9%) | 432 (5.7%) |
| $22,500 to $24,999 | 174 (2.2%) | 315 (4.2%) |
| $25,000 to $29,999 | 247 (3.1%) | 332 (4.4%) |
| $30,000 to $34,999 | 350 (4.3%) | 353 (4.7%) |
| $35,000 to $39,999 | 212 (2.6%) | 530 (7.0%) |
| $40,000 to $44,999 | 336 (4.2%) | 370 (4.9%) |
| $45,000 to $49,999 | 697 (8.6%) | 282 (3.7%) |
| $50,000 to $54,999 | 314 (3.9%) | 556 (7.4%) |
| $55,000 to $64,999 | 960 (11.9%) | 572 (7.6%) |
| $65,000 to $74,999 | 730 (9.0%) | 387 (5.1%) |
| $75,000 to $99,999 | 1,227 (15.2%) | 1,190 (15.8%) |
| $100,000+ | 1,404 (17.4%) | 637 (8.5%) |
| Total | 8,074 (100.0%) | 7,523 (100.0%) |
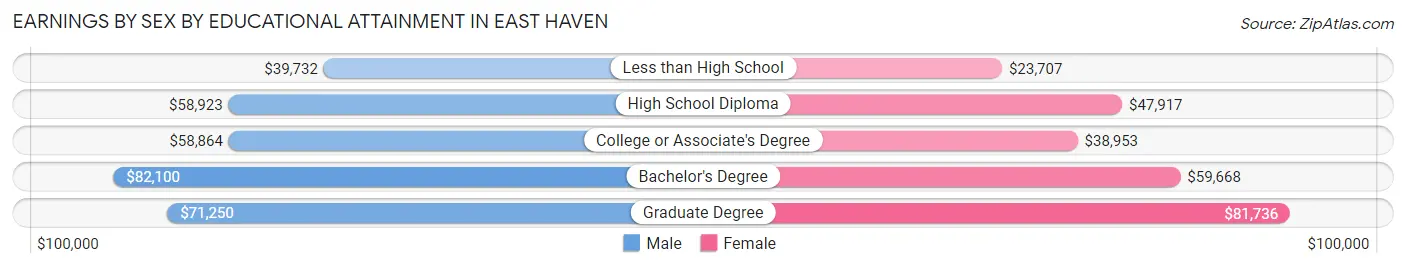
Earnings by Sex by Educational Attainment in East Haven
Average earnings in East Haven are $62,308 for men and $50,424 for women, a difference of 19.1%. Men with an educational attainment of bachelor's degree enjoy the highest average annual earnings of $82,100, while those with less than high school education earn the least with $39,732. Women with an educational attainment of graduate degree earn the most with the average annual earnings of $81,736, while those with less than high school education have the smallest earnings of $23,707.
| Educational Attainment | Male Income | Female Income |
| Less than High School | $39,732 | $23,707 |
| High School Diploma | $58,923 | $47,917 |
| College or Associate's Degree | $58,864 | $38,953 |
| Bachelor's Degree | $82,100 | $59,668 |
| Graduate Degree | $71,250 | $81,736 |
| Total | $62,308 | $50,424 |
Family Income in East Haven
Family Income Brackets in East Haven
According to the East Haven family income data, there are 1,894 families falling into the $100,000 to $149,999 income range, which is the most common income bracket and makes up 27.1% of all families. Conversely, the $10,000 to $14,999 income bracket is the least frequent group with only 112 families (1.6%) belonging to this category.
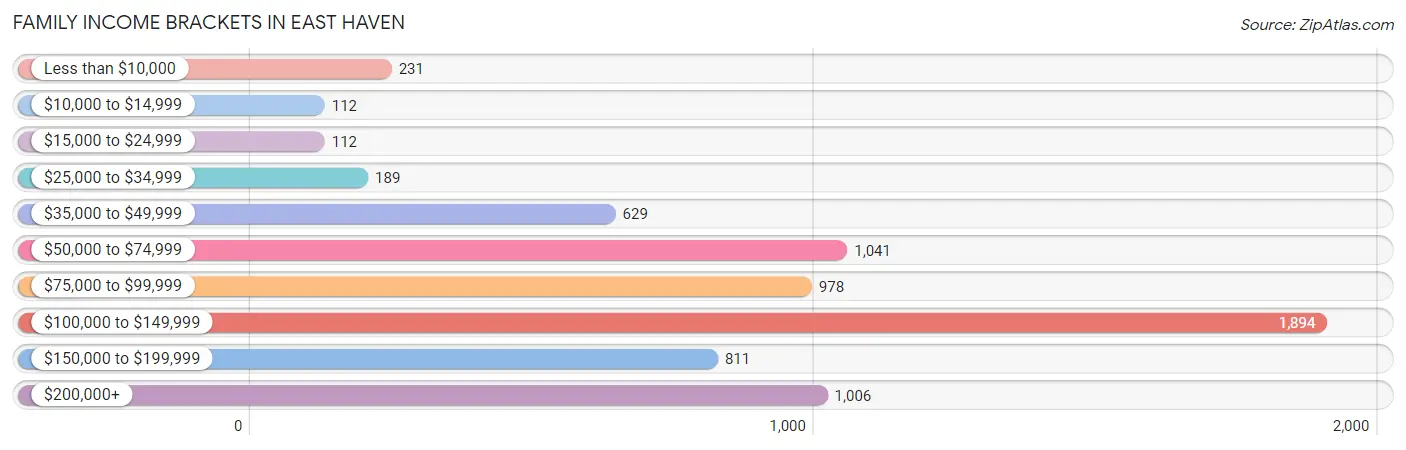
| Income Bracket | # Families | % Families |
| Less than $10,000 | 231 | 3.3% |
| $10,000 to $14,999 | 112 | 1.6% |
| $15,000 to $24,999 | 112 | 1.6% |
| $25,000 to $34,999 | 189 | 2.7% |
| $35,000 to $49,999 | 629 | 9.0% |
| $50,000 to $74,999 | 1,041 | 14.9% |
| $75,000 to $99,999 | 978 | 14.0% |
| $100,000 to $149,999 | 1,894 | 27.1% |
| $150,000 to $199,999 | 811 | 11.6% |
| $200,000+ | 1,006 | 14.4% |
Family Income by Famaliy Size in East Haven
7+ person families (42 | 0.6%) account for the highest median family income in East Haven with $250,001 per family, while 3-person families (1,573 | 22.5%) have the highest median income of $45,863 per family member.
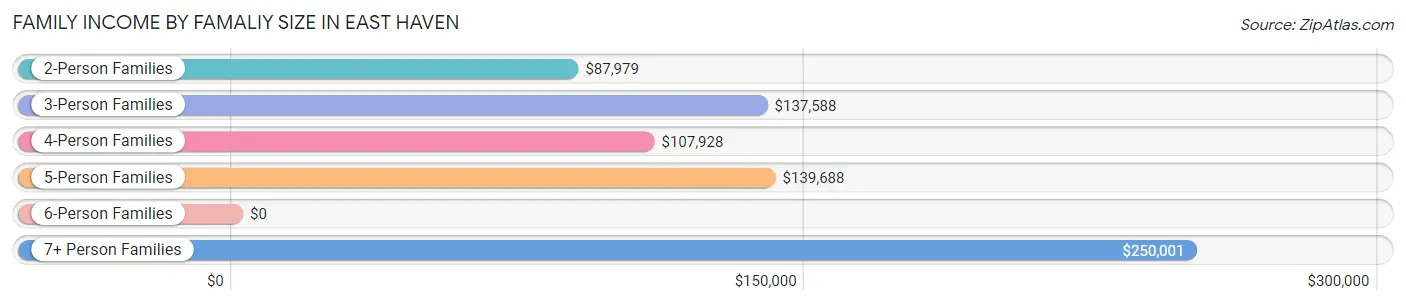
| Income Bracket | # Families | Median Income |
| 2-Person Families | 3,486 (49.9%) | $87,979 |
| 3-Person Families | 1,573 (22.5%) | $137,588 |
| 4-Person Families | 1,119 (16.0%) | $107,928 |
| 5-Person Families | 602 (8.6%) | $139,688 |
| 6-Person Families | 166 (2.4%) | $0 |
| 7+ Person Families | 42 (0.6%) | $250,001 |
| Total | 6,988 (100.0%) | $104,821 |
Family Income by Number of Earners in East Haven
The median family income in East Haven is $104,821, with families comprising 3+ earners (1,022) having the highest median family income of $153,386, while families with no earners (968) have the lowest median family income of $41,981, accounting for 14.6% and 13.9% of families, respectively.
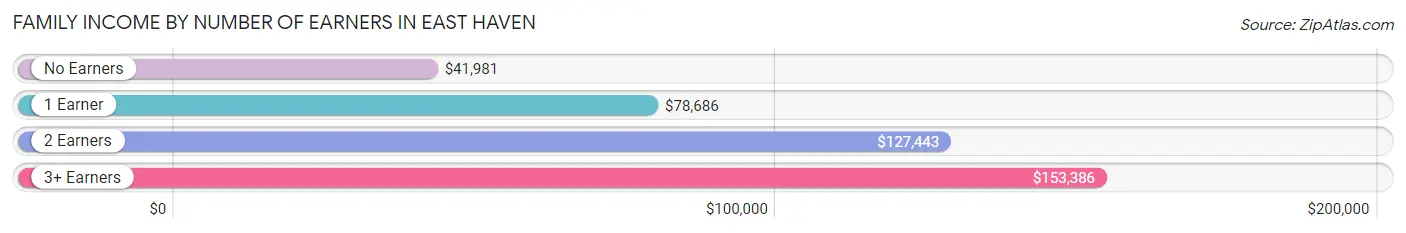
| Number of Earners | # Families | Median Income |
| No Earners | 968 (13.9%) | $41,981 |
| 1 Earner | 1,965 (28.1%) | $78,686 |
| 2 Earners | 3,033 (43.4%) | $127,443 |
| 3+ Earners | 1,022 (14.6%) | $153,386 |
| Total | 6,988 (100.0%) | $104,821 |
Household Income in East Haven
Household Income Brackets in East Haven
With 2,217 households falling in the category, the $100,000 to $149,999 income range is the most frequent in East Haven, accounting for 20.1% of all households. In contrast, only 375 households (3.4%) fall into the less than $10,000 income bracket, making it the least populous group.
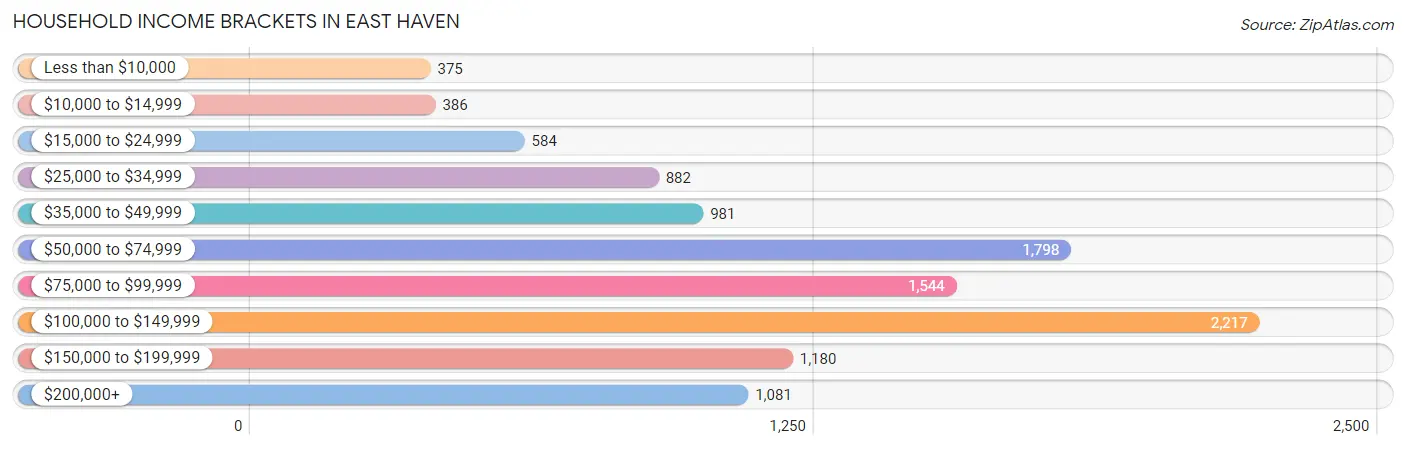
| Income Bracket | # Households | % Households |
| Less than $10,000 | 375 | 3.4% |
| $10,000 to $14,999 | 386 | 3.5% |
| $15,000 to $24,999 | 584 | 5.3% |
| $25,000 to $34,999 | 882 | 8.0% |
| $35,000 to $49,999 | 981 | 8.9% |
| $50,000 to $74,999 | 1,798 | 16.3% |
| $75,000 to $99,999 | 1,544 | 14.0% |
| $100,000 to $149,999 | 2,217 | 20.1% |
| $150,000 to $199,999 | 1,180 | 10.7% |
| $200,000+ | 1,081 | 9.8% |
Household Income by Householder Age in East Haven
The median household income in East Haven is $83,489, with the highest median household income of $100,744 found in the 45 to 64 years age bracket for the primary householder. A total of 4,251 households (38.6%) fall into this category. Meanwhile, the 15 to 24 years age bracket for the primary householder has the lowest median household income of $53,175, with 190 households (1.7%) in this group.
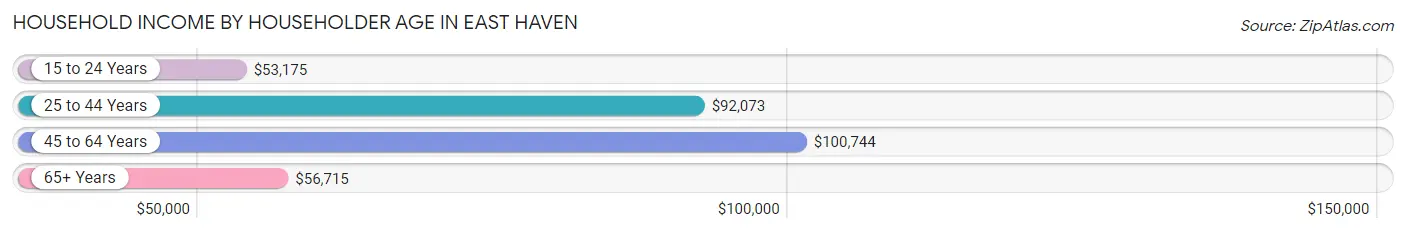
| Income Bracket | # Households | Median Income |
| 15 to 24 Years | 190 (1.7%) | $53,175 |
| 25 to 44 Years | 2,938 (26.6%) | $92,073 |
| 45 to 64 Years | 4,251 (38.6%) | $100,744 |
| 65+ Years | 3,649 (33.1%) | $56,715 |
| Total | 11,028 (100.0%) | $83,489 |
Poverty in East Haven
Income Below Poverty by Sex and Age in East Haven
With 6.5% poverty level for males and 8.1% for females among the residents of East Haven, 15 year old males and 65 to 74 year old females are the most vulnerable to poverty, with 44 males (19.9%) and 232 females (15.9%) in their respective age groups living below the poverty level.
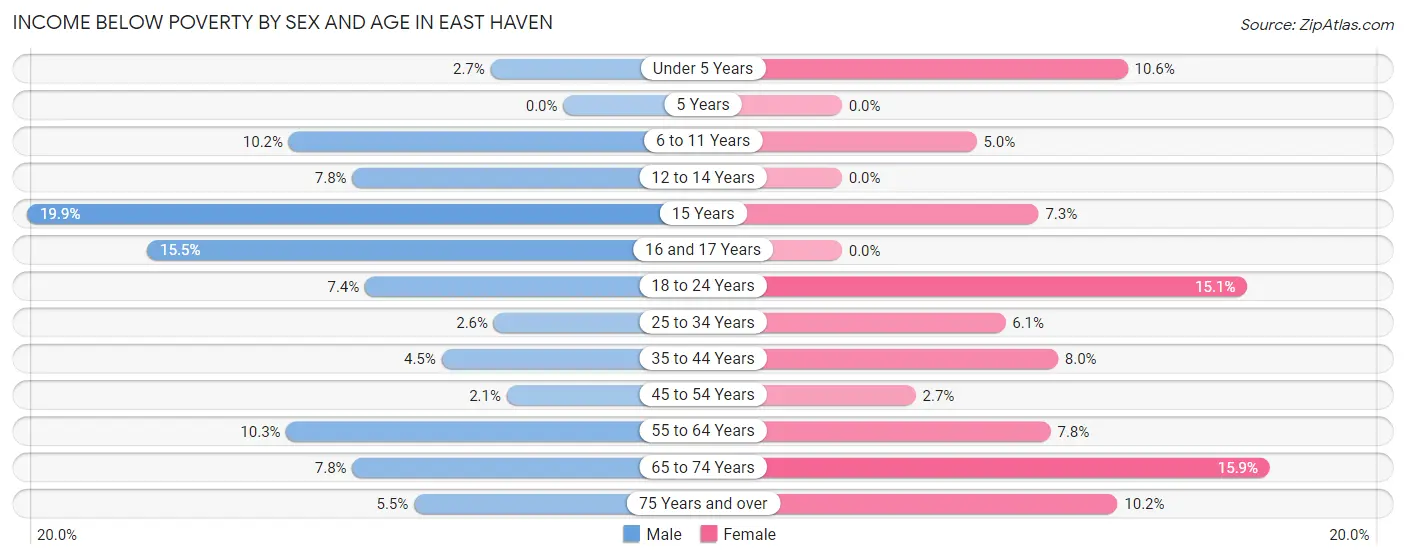
| Age Bracket | Male | Female |
| Under 5 Years | 14 (2.7%) | 56 (10.6%) |
| 5 Years | 0 (0.0%) | 0 (0.0%) |
| 6 to 11 Years | 69 (10.2%) | 34 (5.0%) |
| 12 to 14 Years | 31 (7.8%) | 0 (0.0%) |
| 15 Years | 44 (19.9%) | 10 (7.3%) |
| 16 and 17 Years | 87 (15.4%) | 0 (0.0%) |
| 18 to 24 Years | 92 (7.4%) | 158 (15.0%) |
| 25 to 34 Years | 46 (2.6%) | 105 (6.1%) |
| 35 to 44 Years | 66 (4.5%) | 145 (8.0%) |
| 45 to 54 Years | 44 (2.1%) | 45 (2.7%) |
| 55 to 64 Years | 209 (10.3%) | 204 (7.7%) |
| 65 to 74 Years | 116 (7.8%) | 232 (15.9%) |
| 75 Years and over | 54 (5.5%) | 149 (10.2%) |
| Total | 872 (6.5%) | 1,138 (8.1%) |
Income Above Poverty by Sex and Age in East Haven
According to the poverty statistics in East Haven, males aged 5 years and females aged 5 years are the age groups that are most secure financially, with 100.0% of males and 100.0% of females in these age groups living above the poverty line.
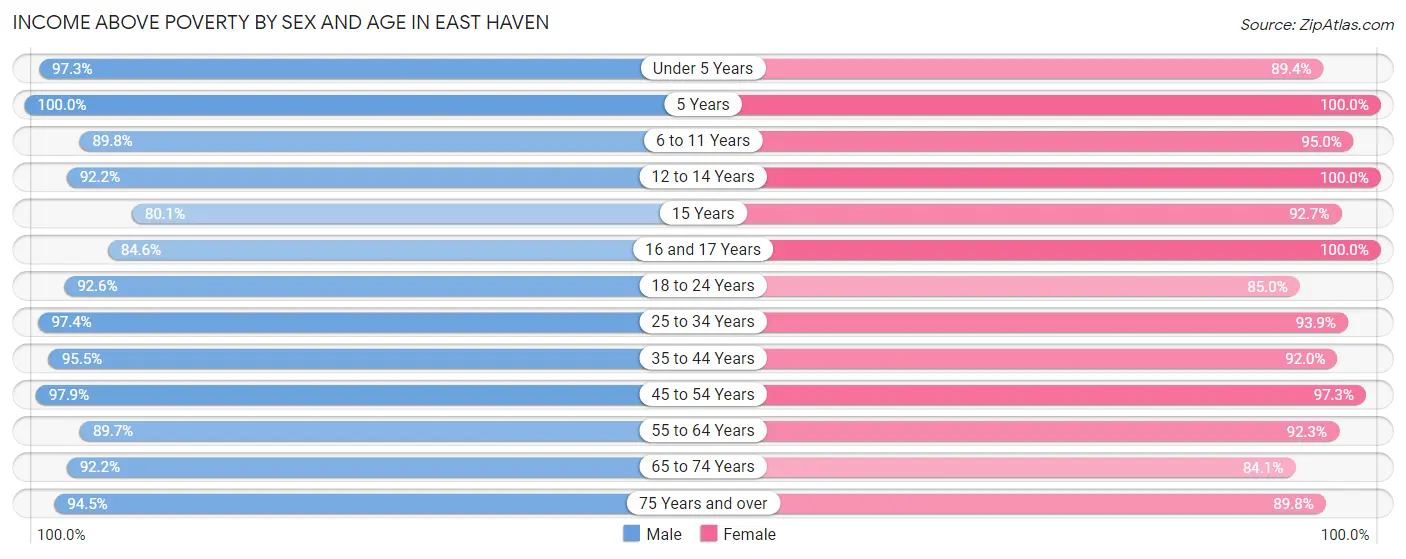
| Age Bracket | Male | Female |
| Under 5 Years | 504 (97.3%) | 472 (89.4%) |
| 5 Years | 64 (100.0%) | 8 (100.0%) |
| 6 to 11 Years | 608 (89.8%) | 646 (95.0%) |
| 12 to 14 Years | 365 (92.2%) | 532 (100.0%) |
| 15 Years | 177 (80.1%) | 127 (92.7%) |
| 16 and 17 Years | 476 (84.6%) | 408 (100.0%) |
| 18 to 24 Years | 1,158 (92.6%) | 892 (85.0%) |
| 25 to 34 Years | 1,738 (97.4%) | 1,624 (93.9%) |
| 35 to 44 Years | 1,394 (95.5%) | 1,662 (92.0%) |
| 45 to 54 Years | 2,050 (97.9%) | 1,595 (97.3%) |
| 55 to 64 Years | 1,824 (89.7%) | 2,427 (92.2%) |
| 65 to 74 Years | 1,365 (92.2%) | 1,228 (84.1%) |
| 75 Years and over | 921 (94.5%) | 1,307 (89.8%) |
| Total | 12,644 (93.5%) | 12,928 (91.9%) |
Income Below Poverty Among Married-Couple Families in East Haven
The poverty statistics for married-couple families in East Haven show that 5.0% or 235 of the total 4,688 families live below the poverty line. Families with no children have the highest poverty rate of 5.6%, comprising of 172 families. On the other hand, families with 3 or 4 children have the lowest poverty rate of 2.0%, which includes 4 families.
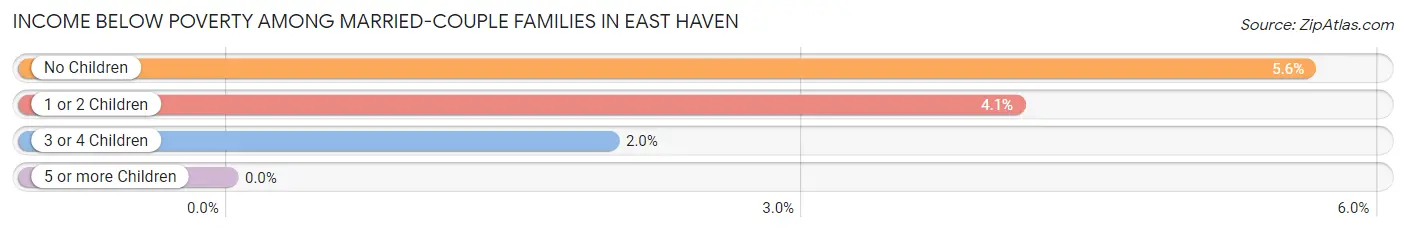
| Children | Above Poverty | Below Poverty |
| No Children | 2,881 (94.4%) | 172 (5.6%) |
| 1 or 2 Children | 1,375 (95.9%) | 59 (4.1%) |
| 3 or 4 Children | 197 (98.0%) | 4 (2.0%) |
| 5 or more Children | 0 (0.0%) | 0 (0.0%) |
| Total | 4,453 (95.0%) | 235 (5.0%) |
Income Below Poverty Among Single-Parent Households in East Haven
According to the poverty data in East Haven, 3.6% or 24 single-father households and 9.0% or 147 single-mother households are living below the poverty line. Among single-father households, those with no children have the highest poverty rate, with 19 households (5.9%) experiencing poverty. Likewise, among single-mother households, those with 3 or 4 children have the highest poverty rate, with 42 households (33.6%) falling below the poverty line.
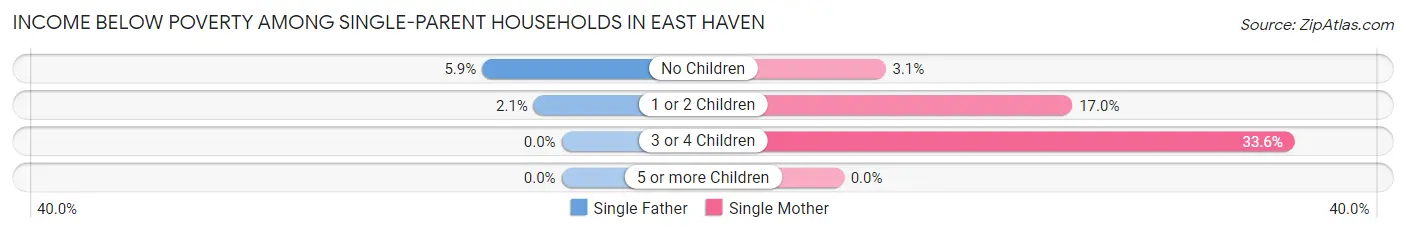
| Children | Single Father | Single Mother |
| No Children | 19 (5.9%) | 34 (3.1%) |
| 1 or 2 Children | 5 (2.1%) | 71 (17.0%) |
| 3 or 4 Children | 0 (0.0%) | 42 (33.6%) |
| 5 or more Children | 0 (0.0%) | 0 (0.0%) |
| Total | 24 (3.6%) | 147 (9.0%) |
Income Below Poverty Among Married-Couple vs Single-Parent Households in East Haven
The poverty data for East Haven shows that 235 of the married-couple family households (5.0%) and 171 of the single-parent households (7.4%) are living below the poverty level. Within the married-couple family households, those with no children have the highest poverty rate, with 172 households (5.6%) falling below the poverty line. Among the single-parent households, those with 3 or 4 children have the highest poverty rate, with 42 household (18.2%) living below poverty.
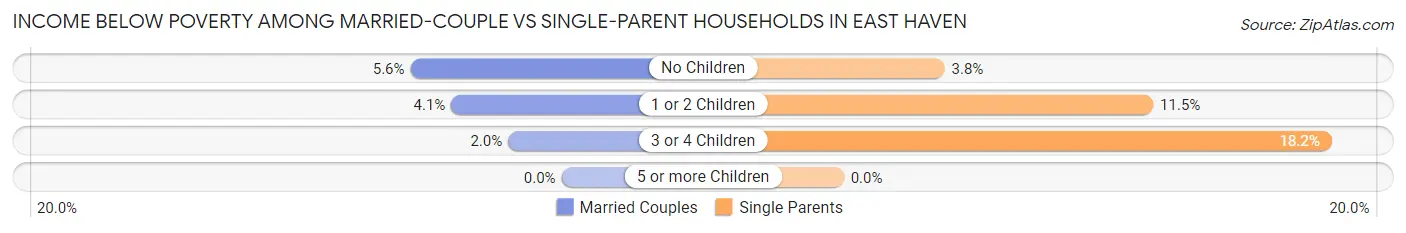
| Children | Married-Couple Families | Single-Parent Households |
| No Children | 172 (5.6%) | 53 (3.8%) |
| 1 or 2 Children | 59 (4.1%) | 76 (11.5%) |
| 3 or 4 Children | 4 (2.0%) | 42 (18.2%) |
| 5 or more Children | 0 (0.0%) | 0 (0.0%) |
| Total | 235 (5.0%) | 171 (7.4%) |
Race in East Haven
The most populous races in East Haven are White / Caucasian (21,896 | 78.6%), Hispanic or Latino (4,856 | 17.4%), and Some other Race (2,413 | 8.7%).
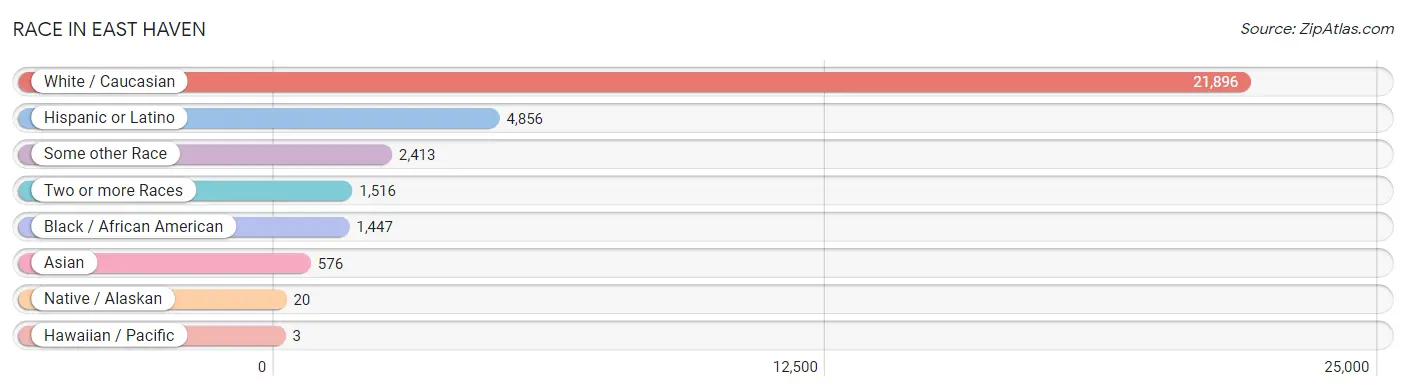
| Race | # Population | % Population |
| Asian | 576 | 2.1% |
| Black / African American | 1,447 | 5.2% |
| Hawaiian / Pacific | 3 | 0.0% |
| Hispanic or Latino | 4,856 | 17.4% |
| Native / Alaskan | 20 | 0.1% |
| White / Caucasian | 21,896 | 78.6% |
| Two or more Races | 1,516 | 5.4% |
| Some other Race | 2,413 | 8.7% |
| Total | 27,871 | 100.0% |
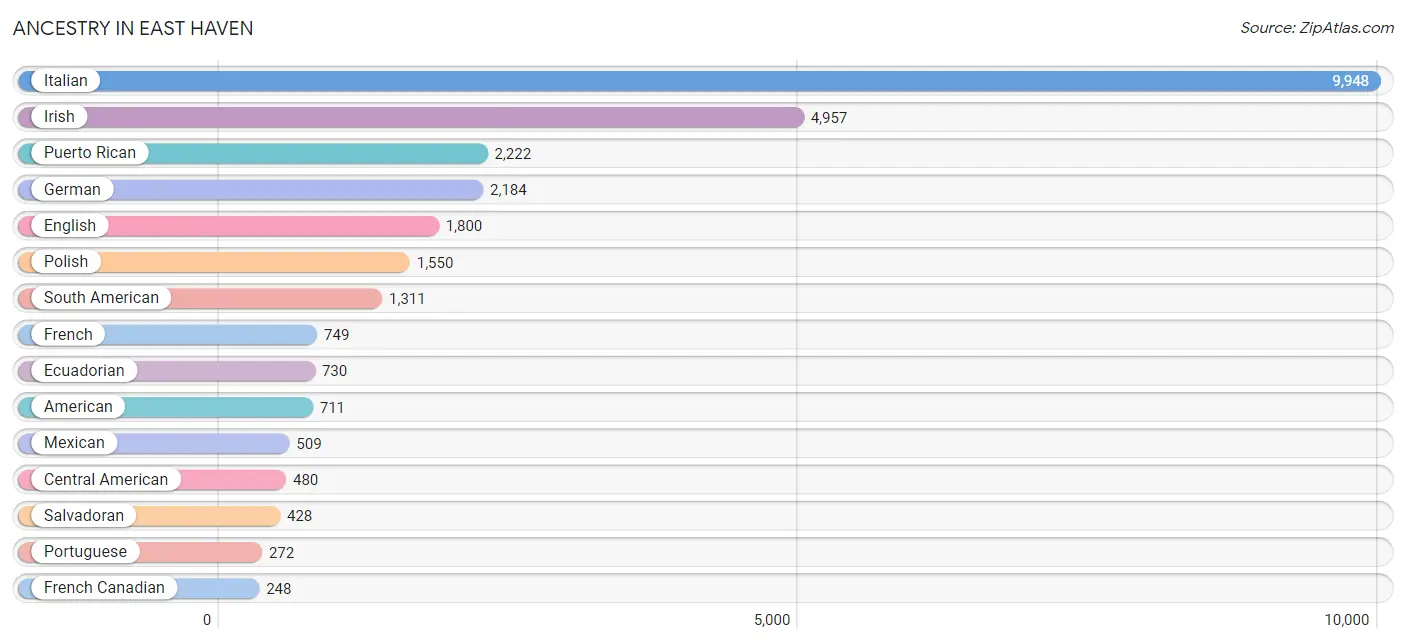
Ancestry in East Haven
The most populous ancestries reported in East Haven are Italian (9,948 | 35.7%), Irish (4,957 | 17.8%), Puerto Rican (2,222 | 8.0%), German (2,184 | 7.8%), and English (1,800 | 6.5%), together accounting for 75.7% of all East Haven residents.
| Ancestry | # Population | % Population |
| African | 21 | 0.1% |
| Albanian | 24 | 0.1% |
| American | 711 | 2.5% |
| Arab | 127 | 0.5% |
| Argentinean | 31 | 0.1% |
| Austrian | 62 | 0.2% |
| Barbadian | 75 | 0.3% |
| Belgian | 8 | 0.0% |
| Blackfeet | 19 | 0.1% |
| Brazilian | 235 | 0.8% |
| British | 44 | 0.2% |
| Burmese | 50 | 0.2% |
| Canadian | 20 | 0.1% |
| Cape Verdean | 9 | 0.0% |
| Central American | 480 | 1.7% |
| Central American Indian | 9 | 0.0% |
| Cherokee | 13 | 0.1% |
| Chilean | 169 | 0.6% |
| Colombian | 215 | 0.8% |
| Cuban | 72 | 0.3% |
| Czech | 68 | 0.2% |
| Czechoslovakian | 26 | 0.1% |
| Danish | 141 | 0.5% |
| Dominican | 190 | 0.7% |
| Dutch | 41 | 0.2% |
| Eastern European | 87 | 0.3% |
| Ecuadorian | 730 | 2.6% |
| Egyptian | 33 | 0.1% |
| English | 1,800 | 6.5% |
| European | 239 | 0.9% |
| Finnish | 7 | 0.0% |
| French | 749 | 2.7% |
| French American Indian | 11 | 0.0% |
| French Canadian | 248 | 0.9% |
| German | 2,184 | 7.8% |
| Greek | 140 | 0.5% |
| Guatemalan | 45 | 0.2% |
| Honduran | 7 | 0.0% |
| Hungarian | 72 | 0.3% |
| Indian (Asian) | 228 | 0.8% |
| Irish | 4,957 | 17.8% |
| Italian | 9,948 | 35.7% |
| Jamaican | 83 | 0.3% |
| Japanese | 6 | 0.0% |
| Korean | 134 | 0.5% |
| Lithuanian | 58 | 0.2% |
| Mexican | 509 | 1.8% |
| Native Hawaiian | 3 | 0.0% |
| Nigerian | 13 | 0.1% |
| Norwegian | 55 | 0.2% |
| Pakistani | 31 | 0.1% |
| Palestinian | 14 | 0.1% |
| Paraguayan | 11 | 0.0% |
| Peruvian | 112 | 0.4% |
| Polish | 1,550 | 5.6% |
| Portuguese | 272 | 1.0% |
| Puerto Rican | 2,222 | 8.0% |
| Russian | 194 | 0.7% |
| Salvadoran | 428 | 1.5% |
| Scandinavian | 23 | 0.1% |
| Scotch-Irish | 100 | 0.4% |
| Scottish | 200 | 0.7% |
| Slavic | 18 | 0.1% |
| Slovak | 66 | 0.2% |
| South African | 17 | 0.1% |
| South American | 1,311 | 4.7% |
| Spaniard | 21 | 0.1% |
| Spanish | 28 | 0.1% |
| Sri Lankan | 164 | 0.6% |
| Subsaharan African | 80 | 0.3% |
| Swedish | 195 | 0.7% |
| Swiss | 7 | 0.0% |
| Syrian | 16 | 0.1% |
| Thai | 107 | 0.4% |
| Turkish | 61 | 0.2% |
| Ukrainian | 81 | 0.3% |
| Uruguayan | 16 | 0.1% |
| Venezuelan | 27 | 0.1% |
| Welsh | 21 | 0.1% |
| Yugoslavian | 25 | 0.1% | View All 80 Rows |
Immigrants in East Haven
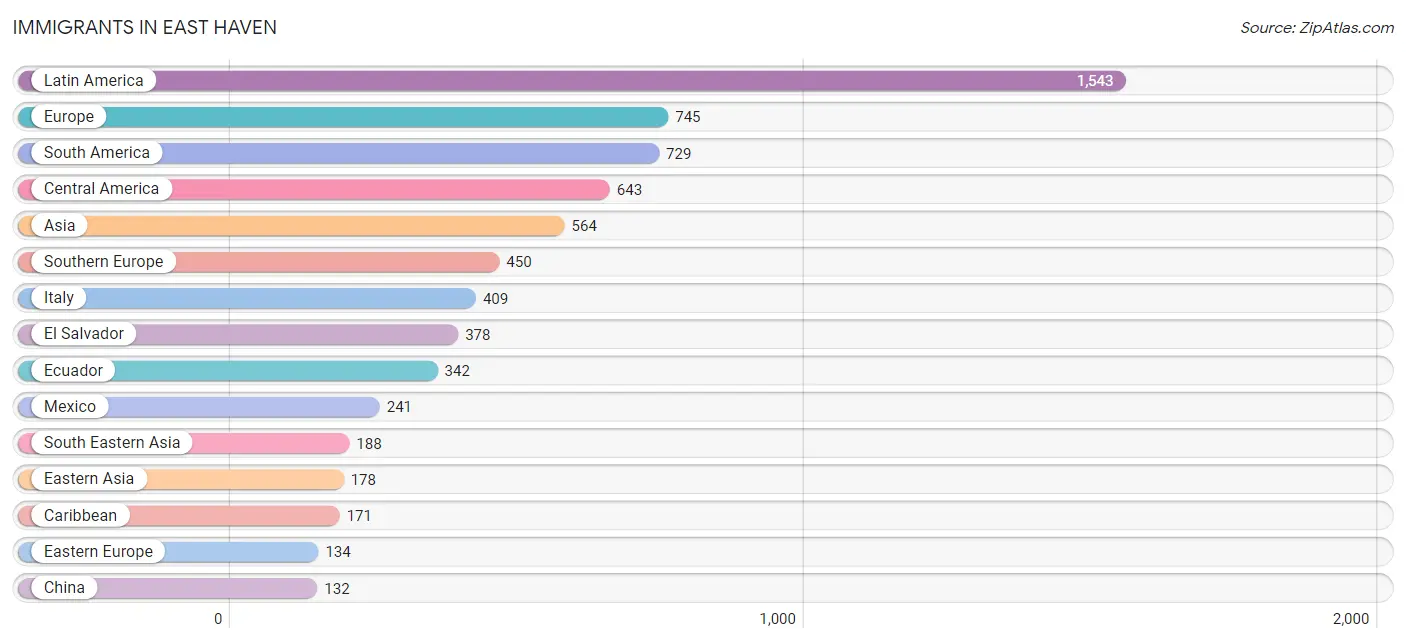
The most numerous immigrant groups reported in East Haven came from Latin America (1,543 | 5.5%), Europe (745 | 2.7%), South America (729 | 2.6%), Central America (643 | 2.3%), and Asia (564 | 2.0%), together accounting for 15.2% of all East Haven residents.
| Immigration Origin | # Population | % Population |
| Africa | 54 | 0.2% |
| Albania | 11 | 0.0% |
| Argentina | 31 | 0.1% |
| Asia | 564 | 2.0% |
| Bosnia and Herzegovina | 25 | 0.1% |
| Brazil | 87 | 0.3% |
| Cambodia | 27 | 0.1% |
| Cameroon | 20 | 0.1% |
| Canada | 12 | 0.0% |
| Caribbean | 171 | 0.6% |
| Central America | 643 | 2.3% |
| Chile | 89 | 0.3% |
| China | 132 | 0.5% |
| Colombia | 101 | 0.4% |
| Cuba | 38 | 0.1% |
| Czechoslovakia | 5 | 0.0% |
| Denmark | 14 | 0.1% |
| Dominican Republic | 118 | 0.4% |
| Eastern Africa | 21 | 0.1% |
| Eastern Asia | 178 | 0.6% |
| Eastern Europe | 134 | 0.5% |
| Ecuador | 342 | 1.2% |
| El Salvador | 378 | 1.4% |
| England | 21 | 0.1% |
| Ethiopia | 21 | 0.1% |
| Europe | 745 | 2.7% |
| France | 8 | 0.0% |
| Germany | 45 | 0.2% |
| Greece | 41 | 0.2% |
| Guatemala | 24 | 0.1% |
| India | 69 | 0.3% |
| Ireland | 22 | 0.1% |
| Italy | 409 | 1.5% |
| Jamaica | 15 | 0.1% |
| Jordan | 14 | 0.1% |
| Korea | 46 | 0.2% |
| Kuwait | 6 | 0.0% |
| Latin America | 1,543 | 5.5% |
| Lithuania | 9 | 0.0% |
| Mexico | 241 | 0.9% |
| Middle Africa | 20 | 0.1% |
| Netherlands | 23 | 0.1% |
| Nigeria | 13 | 0.1% |
| Northern Europe | 85 | 0.3% |
| Peru | 73 | 0.3% |
| Philippines | 59 | 0.2% |
| Poland | 84 | 0.3% |
| South America | 729 | 2.6% |
| South Central Asia | 69 | 0.3% |
| South Eastern Asia | 188 | 0.7% |
| Southern Europe | 450 | 1.6% |
| Syria | 80 | 0.3% |
| Thailand | 24 | 0.1% |
| Turkey | 29 | 0.1% |
| Vietnam | 78 | 0.3% |
| Western Africa | 13 | 0.1% |
| Western Asia | 129 | 0.5% |
| Western Europe | 76 | 0.3% | View All 58 Rows |
Sex and Age in East Haven
Sex and Age in East Haven
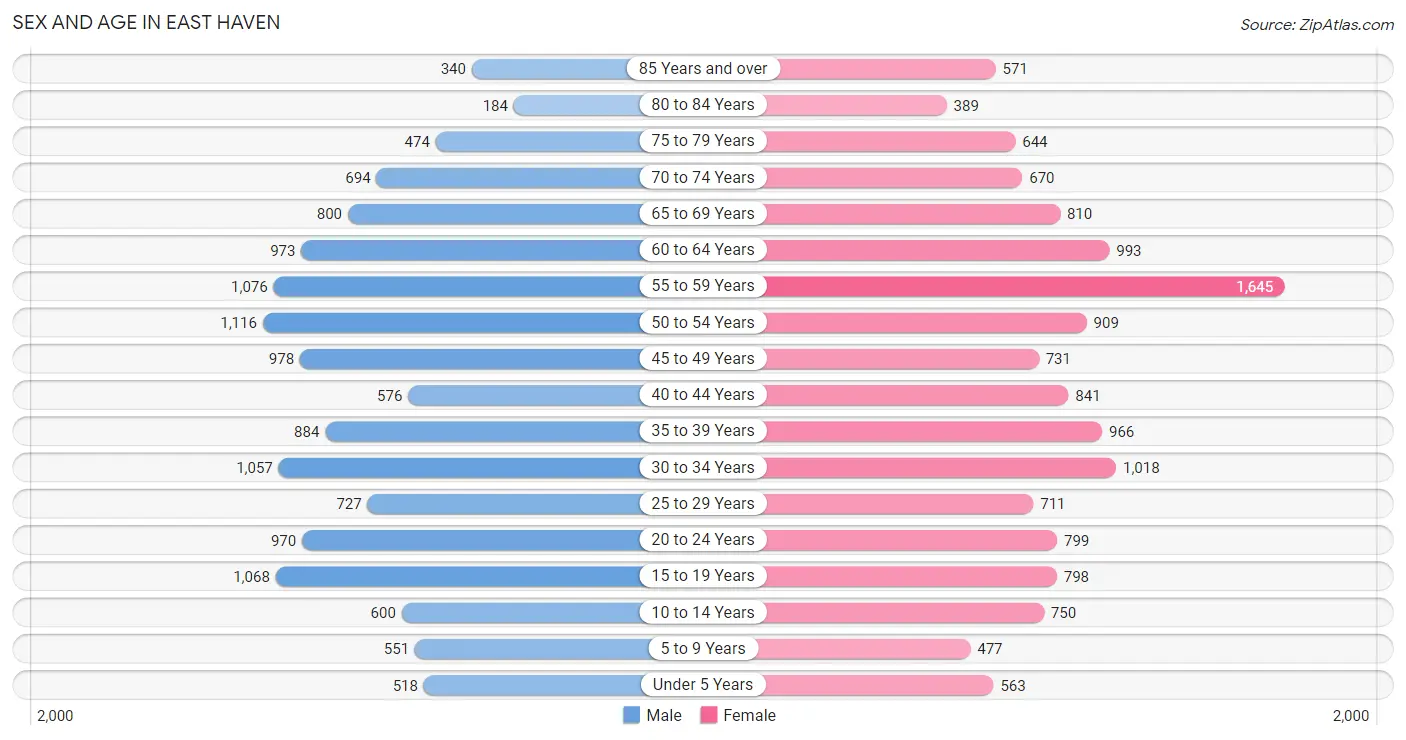
The most populous age groups in East Haven are 50 to 54 Years (1,116 | 8.2%) for men and 55 to 59 Years (1,645 | 11.5%) for women.
| Age Bracket | Male | Female |
| Under 5 Years | 518 (3.8%) | 563 (3.9%) |
| 5 to 9 Years | 551 (4.1%) | 477 (3.3%) |
| 10 to 14 Years | 600 (4.4%) | 750 (5.2%) |
| 15 to 19 Years | 1,068 (7.9%) | 798 (5.6%) |
| 20 to 24 Years | 970 (7.1%) | 799 (5.6%) |
| 25 to 29 Years | 727 (5.3%) | 711 (5.0%) |
| 30 to 34 Years | 1,057 (7.8%) | 1,018 (7.1%) |
| 35 to 39 Years | 884 (6.5%) | 966 (6.8%) |
| 40 to 44 Years | 576 (4.2%) | 841 (5.9%) |
| 45 to 49 Years | 978 (7.2%) | 731 (5.1%) |
| 50 to 54 Years | 1,116 (8.2%) | 909 (6.4%) |
| 55 to 59 Years | 1,076 (7.9%) | 1,645 (11.5%) |
| 60 to 64 Years | 973 (7.2%) | 993 (7.0%) |
| 65 to 69 Years | 800 (5.9%) | 810 (5.7%) |
| 70 to 74 Years | 694 (5.1%) | 670 (4.7%) |
| 75 to 79 Years | 474 (3.5%) | 644 (4.5%) |
| 80 to 84 Years | 184 (1.3%) | 389 (2.7%) |
| 85 Years and over | 340 (2.5%) | 571 (4.0%) |
| Total | 13,586 (100.0%) | 14,285 (100.0%) |
Families and Households in East Haven
Median Family Size in East Haven
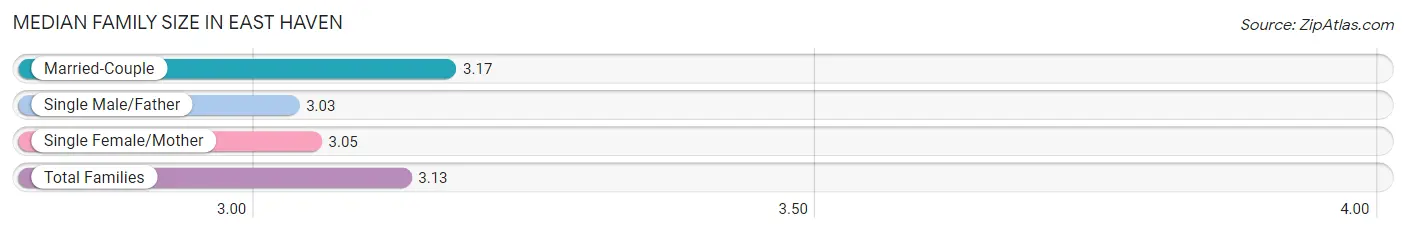
The median family size in East Haven is 3.13 persons per family, with married-couple families (4,688 | 67.1%) accounting for the largest median family size of 3.17 persons per family. On the other hand, single male/father families (669 | 9.6%) represent the smallest median family size with 3.03 persons per family.
| Family Type | # Families | Family Size |
| Married-Couple | 4,688 (67.1%) | 3.17 |
| Single Male/Father | 669 (9.6%) | 3.03 |
| Single Female/Mother | 1,631 (23.3%) | 3.05 |
| Total Families | 6,988 (100.0%) | 3.13 |
Median Household Size in East Haven
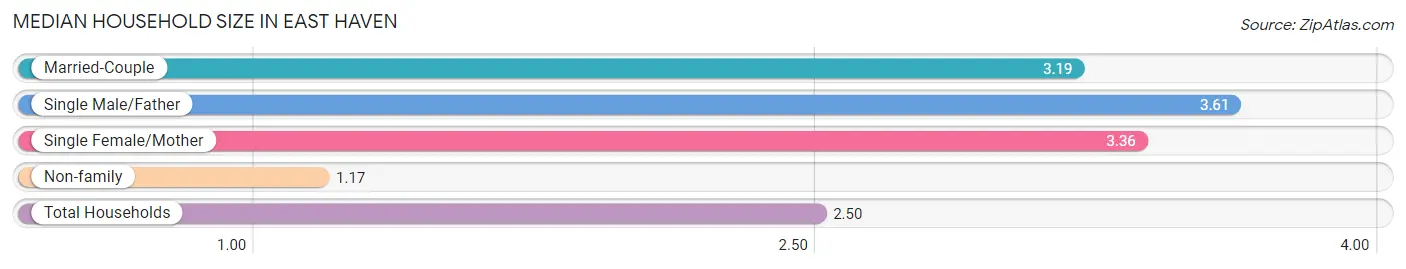
The median household size in East Haven is 2.50 persons per household, with single male/father households (669 | 6.1%) accounting for the largest median household size of 3.61 persons per household. non-family households (4,040 | 36.6%) represent the smallest median household size with 1.17 persons per household.
| Household Type | # Households | Household Size |
| Married-Couple | 4,688 (42.5%) | 3.19 |
| Single Male/Father | 669 (6.1%) | 3.61 |
| Single Female/Mother | 1,631 (14.8%) | 3.36 |
| Non-family | 4,040 (36.6%) | 1.17 |
| Total Households | 11,028 (100.0%) | 2.50 |
Household Size by Marriage Status in East Haven
Out of a total of 11,028 households in East Haven, 6,988 (63.4%) are family households, while 4,040 (36.6%) are nonfamily households. The most numerous type of family households are 2-person households, comprising 3,156, and the most common type of nonfamily households are 1-person households, comprising 3,471.
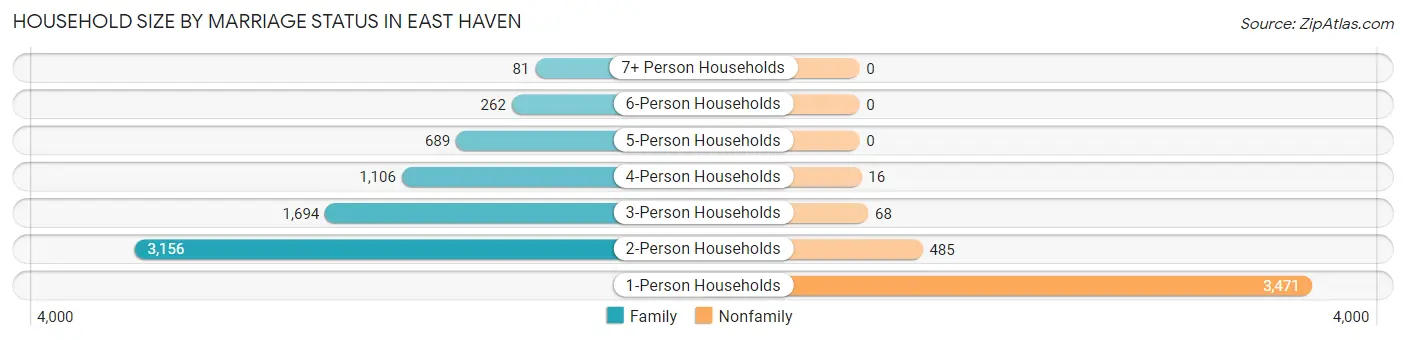
| Household Size | Family Households | Nonfamily Households |
| 1-Person Households | - | 3,471 (31.5%) |
| 2-Person Households | 3,156 (28.6%) | 485 (4.4%) |
| 3-Person Households | 1,694 (15.4%) | 68 (0.6%) |
| 4-Person Households | 1,106 (10.0%) | 16 (0.2%) |
| 5-Person Households | 689 (6.2%) | 0 (0.0%) |
| 6-Person Households | 262 (2.4%) | 0 (0.0%) |
| 7+ Person Households | 81 (0.7%) | 0 (0.0%) |
| Total | 6,988 (63.4%) | 4,040 (36.6%) |
Female Fertility in East Haven
Fertility by Age in East Haven
Average fertility rate in East Haven is 17.0 births per 1,000 women. Women in the age bracket of 20 to 34 years have the highest fertility rate with 30.0 births per 1,000 women. Women in the age bracket of 20 to 34 years acount for 72.4% of all women with births.
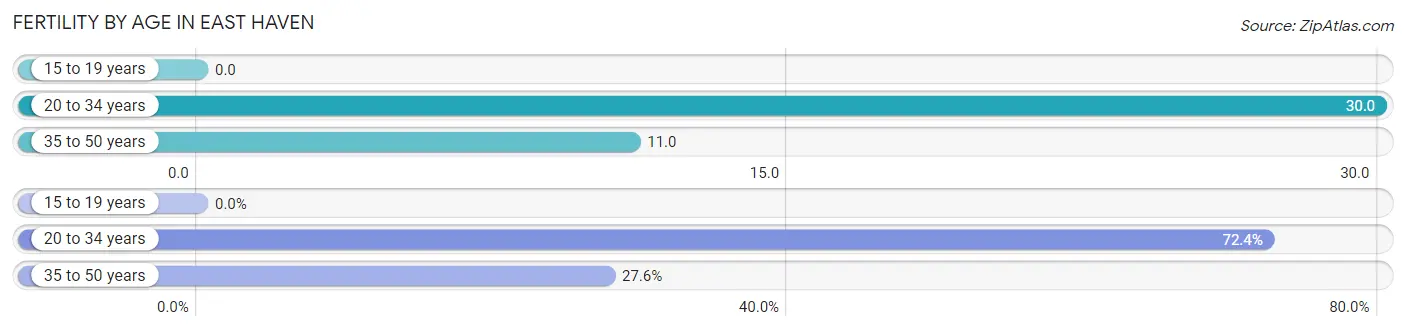
| Age Bracket | Women with Births | Births / 1,000 Women |
| 15 to 19 years | 0 (0.0%) | 0.0 |
| 20 to 34 years | 76 (72.4%) | 30.0 |
| 35 to 50 years | 29 (27.6%) | 11.0 |
| Total | 105 (100.0%) | 17.0 |
Fertility by Age by Marriage Status in East Haven
38.1% of women with births (105) in East Haven are married. The highest percentage of unmarried women with births falls into 35 to 50 years age bracket with 86.2% of them unmarried at the time of birth, while the lowest percentage of unmarried women with births belong to 20 to 34 years age bracket with 52.6% of them unmarried.
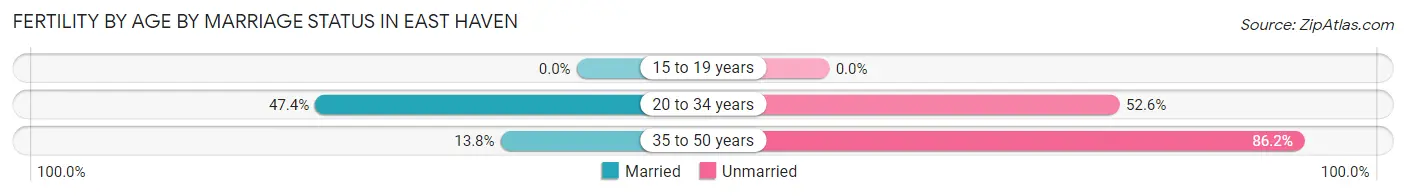
| Age Bracket | Married | Unmarried |
| 15 to 19 years | 0 (0.0%) | 0 (0.0%) |
| 20 to 34 years | 36 (47.4%) | 40 (52.6%) |
| 35 to 50 years | 4 (13.8%) | 25 (86.2%) |
| Total | 40 (38.1%) | 65 (61.9%) |
Fertility by Education in East Haven
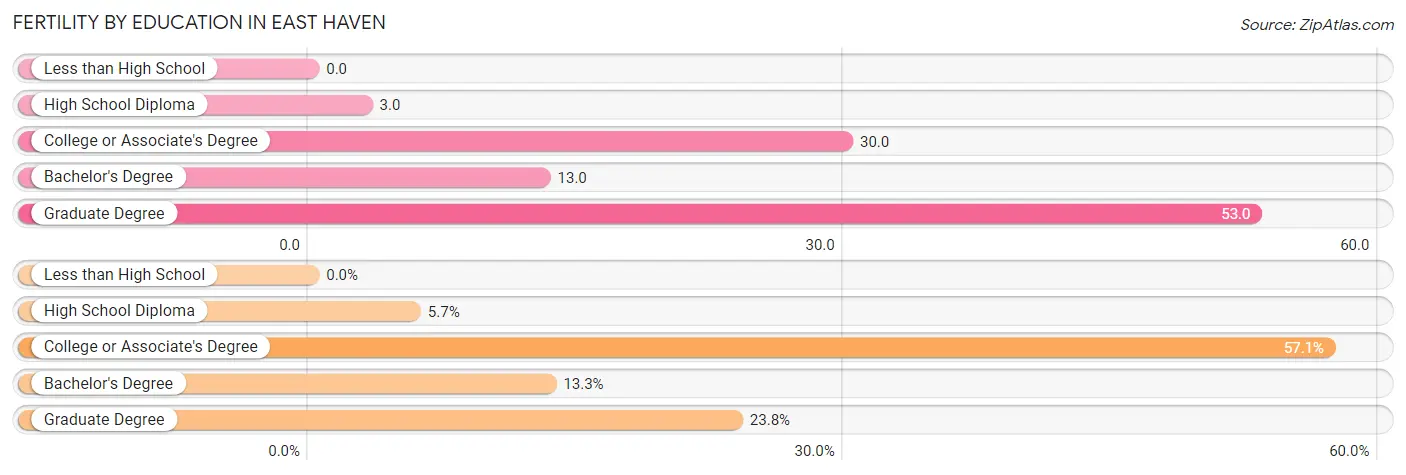
| Educational Attainment | Women with Births | Births / 1,000 Women |
| Less than High School | 0 (0.0%) | 0.0 |
| High School Diploma | 6 (5.7%) | 3.0 |
| College or Associate's Degree | 60 (57.1%) | 30.0 |
| Bachelor's Degree | 14 (13.3%) | 13.0 |
| Graduate Degree | 25 (23.8%) | 53.0 |
| Total | 105 (100.0%) | 17.0 |
Fertility by Education by Marriage Status in East Haven
61.9% of women with births in East Haven are unmarried. Women with the educational attainment of high school diploma are most likely to be married with 100.0% of them married at childbirth, while women with the educational attainment of college or associate's degree are least likely to be married with 66.7% of them unmarried at childbirth.
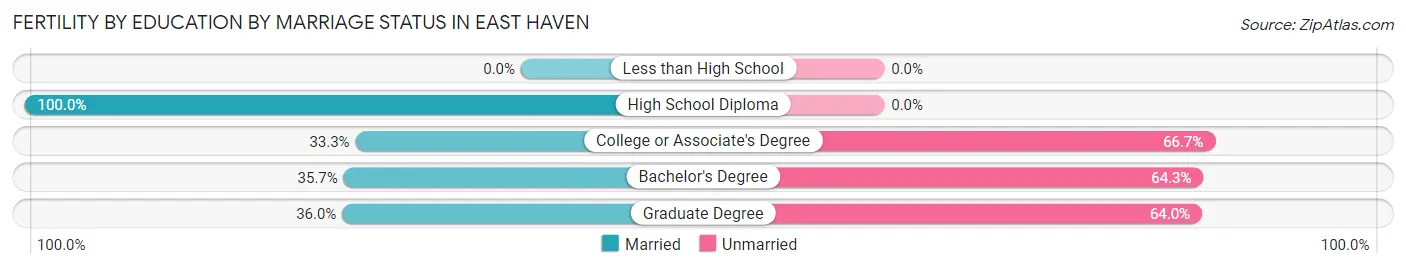
| Educational Attainment | Married | Unmarried |
| Less than High School | 0 (0.0%) | 0 (0.0%) |
| High School Diploma | 6 (100.0%) | 0 (0.0%) |
| College or Associate's Degree | 20 (33.3%) | 40 (66.7%) |
| Bachelor's Degree | 5 (35.7%) | 9 (64.3%) |
| Graduate Degree | 9 (36.0%) | 16 (64.0%) |
| Total | 40 (38.1%) | 65 (61.9%) |
Employment Characteristics in East Haven
Employment by Class of Employer in East Haven
Among the 14,164 employed individuals in East Haven, private company employees (9,482 | 66.9%), not-for-profit organizations (1,832 | 12.9%), and self-employed (not incorporated) (927 | 6.5%) make up the most common classes of employment.
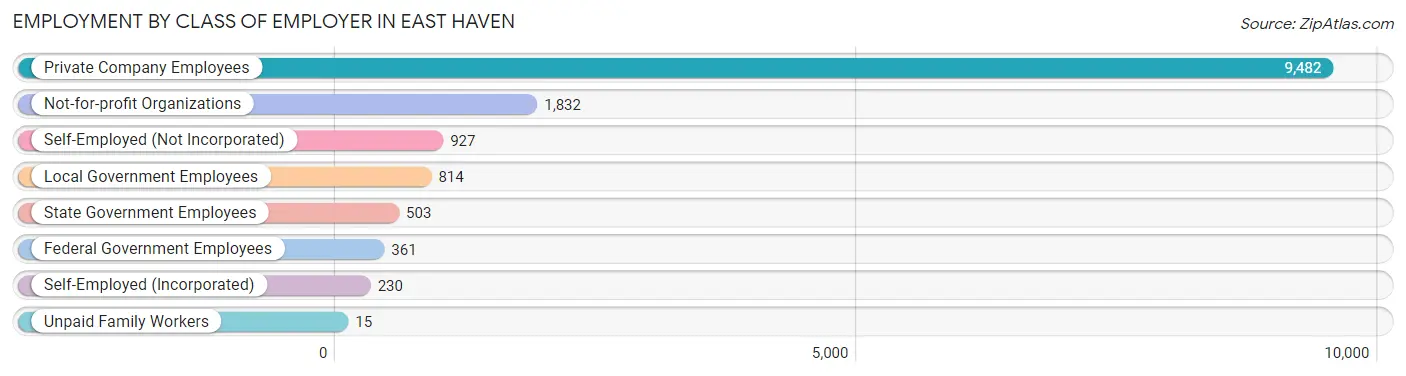
| Employer Class | # Employees | % Employees |
| Private Company Employees | 9,482 | 66.9% |
| Self-Employed (Incorporated) | 230 | 1.6% |
| Self-Employed (Not Incorporated) | 927 | 6.5% |
| Not-for-profit Organizations | 1,832 | 12.9% |
| Local Government Employees | 814 | 5.8% |
| State Government Employees | 503 | 3.5% |
| Federal Government Employees | 361 | 2.5% |
| Unpaid Family Workers | 15 | 0.1% |
| Total | 14,164 | 100.0% |
Employment Status by Age in East Haven
According to the labor force statistics for East Haven, out of the total population over 16 years of age (24,054), 63.5% or 15,274 individuals are in the labor force, with 5.0% or 764 of them unemployed. The age group with the highest labor force participation rate is 25 to 29 years, with 91.9% or 1,322 individuals in the labor force. Within the labor force, the 25 to 29 years age range has the highest percentage of unemployed individuals, with 11.4% or 151 of them being unemployed.
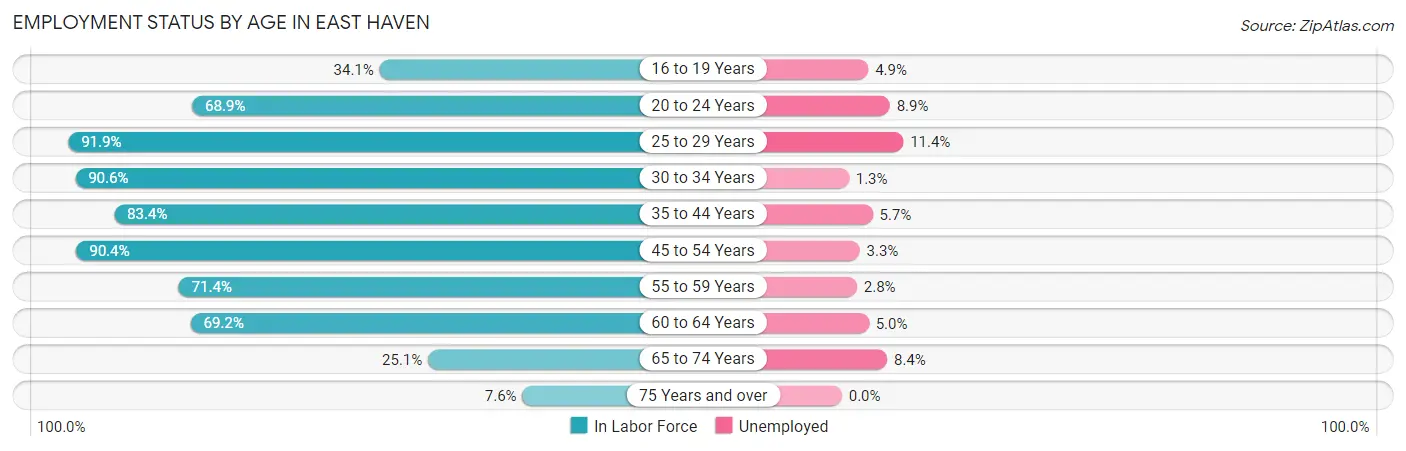
| Age Bracket | In Labor Force | Unemployed |
| 16 to 19 Years | 514 (34.1%) | 25 (4.9%) |
| 20 to 24 Years | 1,219 (68.9%) | 108 (8.9%) |
| 25 to 29 Years | 1,322 (91.9%) | 151 (11.4%) |
| 30 to 34 Years | 1,880 (90.6%) | 24 (1.3%) |
| 35 to 44 Years | 2,725 (83.4%) | 155 (5.7%) |
| 45 to 54 Years | 3,376 (90.4%) | 111 (3.3%) |
| 55 to 59 Years | 1,943 (71.4%) | 54 (2.8%) |
| 60 to 64 Years | 1,360 (69.2%) | 68 (5.0%) |
| 65 to 74 Years | 746 (25.1%) | 63 (8.4%) |
| 75 Years and over | 198 (7.6%) | 0 (0.0%) |
| Total | 15,274 (63.5%) | 764 (5.0%) |
Employment Status by Educational Attainment in East Haven
According to labor force statistics for East Haven, 82.9% of individuals (12,602) out of the total population between 25 and 64 years of age (15,201) are in the labor force, with 4.5% or 567 of them being unemployed. The group with the highest labor force participation rate are those with the educational attainment of bachelor's degree or higher, with 94.4% or 3,641 individuals in the labor force. Within the labor force, individuals with less than high school education have the highest percentage of unemployment, with 8.0% or 42 of them being unemployed.
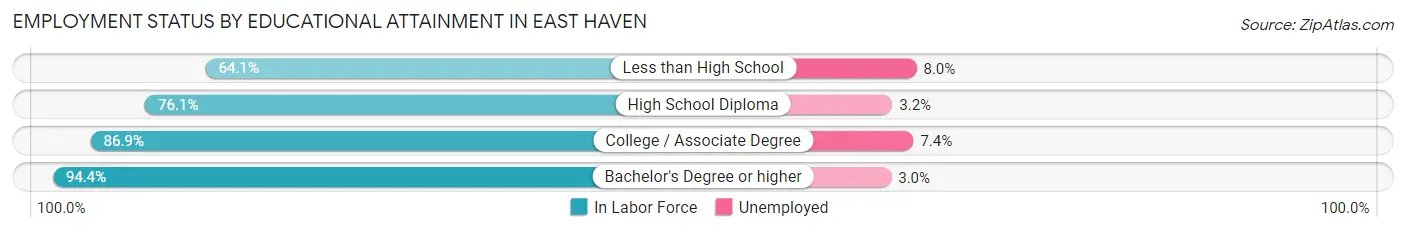
| Educational Attainment | In Labor Force | Unemployed |
| Less than High School | 528 (64.1%) | 66 (8.0%) |
| High School Diploma | 5,023 (76.1%) | 211 (3.2%) |
| College / Associate Degree | 3,406 (86.9%) | 290 (7.4%) |
| Bachelor's Degree or higher | 3,641 (94.4%) | 116 (3.0%) |
| Total | 12,602 (82.9%) | 684 (4.5%) |
Employment Occupations by Sex in East Haven
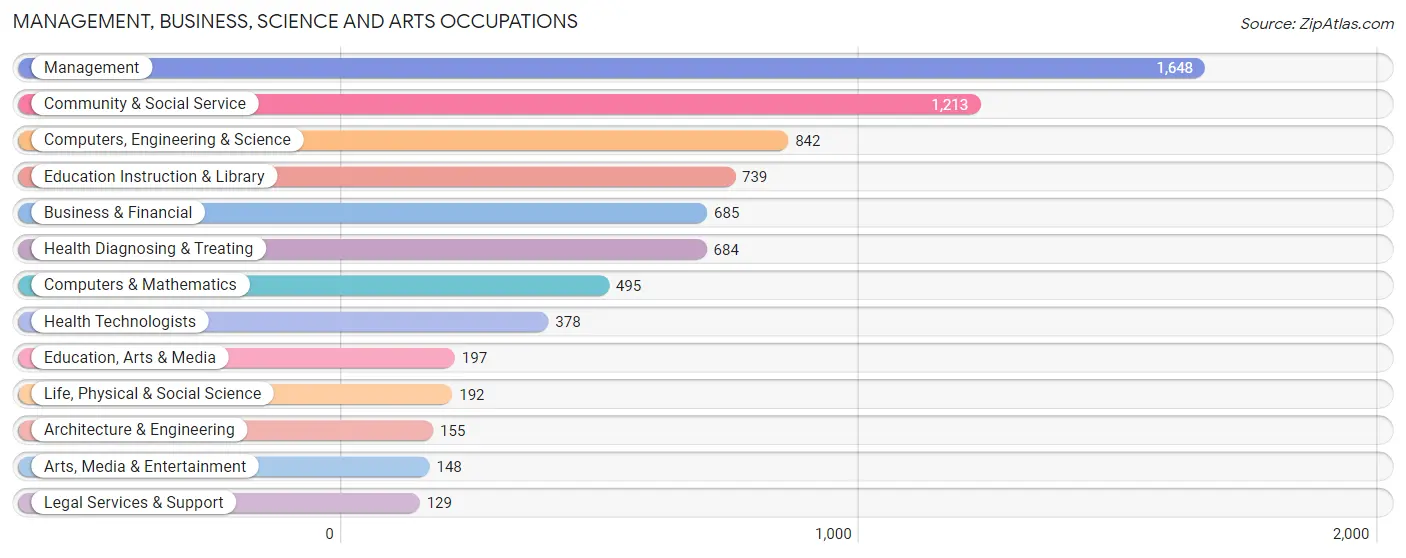
Management, Business, Science and Arts Occupations
The most common Management, Business, Science and Arts occupations in East Haven are Management (1,648 | 11.4%), Community & Social Service (1,213 | 8.4%), Computers, Engineering & Science (842 | 5.8%), Education Instruction & Library (739 | 5.1%), and Business & Financial (685 | 4.7%).
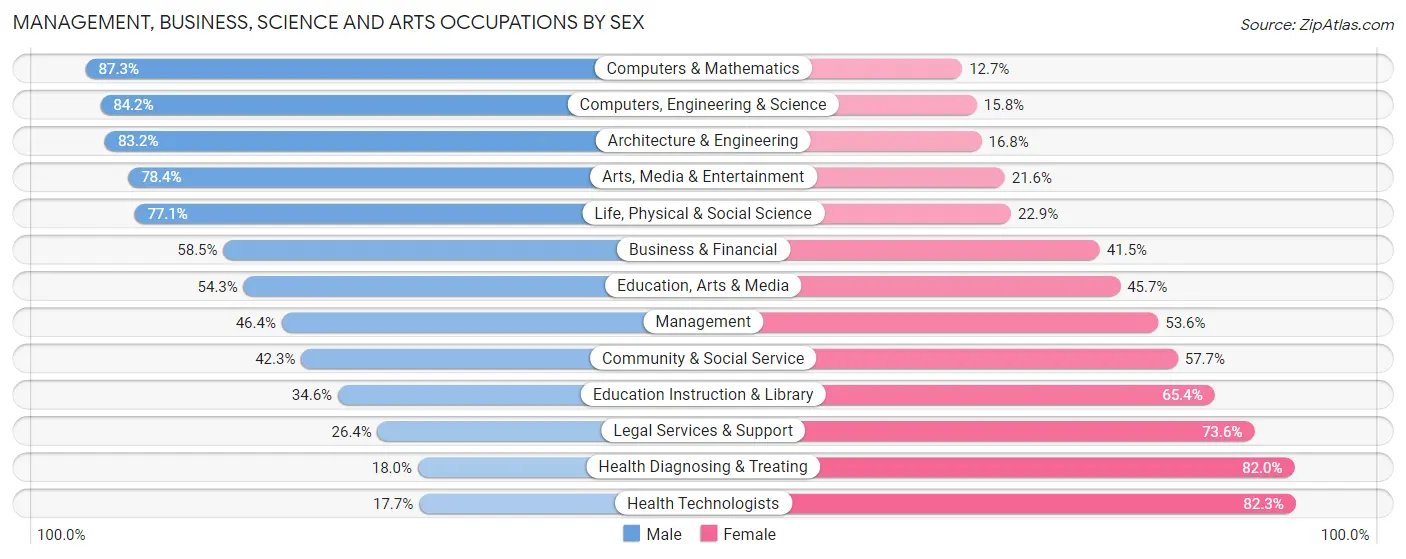
Management, Business, Science and Arts Occupations by Sex
Within the Management, Business, Science and Arts occupations in East Haven, the most male-oriented occupations are Computers & Mathematics (87.3%), Computers, Engineering & Science (84.2%), and Architecture & Engineering (83.2%), while the most female-oriented occupations are Health Technologists (82.3%), Health Diagnosing & Treating (82.0%), and Legal Services & Support (73.6%).
| Occupation | Male | Female |
| Management | 764 (46.4%) | 884 (53.6%) |
| Business & Financial | 401 (58.5%) | 284 (41.5%) |
| Computers, Engineering & Science | 709 (84.2%) | 133 (15.8%) |
| Computers & Mathematics | 432 (87.3%) | 63 (12.7%) |
| Architecture & Engineering | 129 (83.2%) | 26 (16.8%) |
| Life, Physical & Social Science | 148 (77.1%) | 44 (22.9%) |
| Community & Social Service | 513 (42.3%) | 700 (57.7%) |
| Education, Arts & Media | 107 (54.3%) | 90 (45.7%) |
| Legal Services & Support | 34 (26.4%) | 95 (73.6%) |
| Education Instruction & Library | 256 (34.6%) | 483 (65.4%) |
| Arts, Media & Entertainment | 116 (78.4%) | 32 (21.6%) |
| Health Diagnosing & Treating | 123 (18.0%) | 561 (82.0%) |
| Health Technologists | 67 (17.7%) | 311 (82.3%) |
| Total (Category) | 2,510 (49.5%) | 2,562 (50.5%) |
| Total (Overall) | 7,474 (51.6%) | 7,006 (48.4%) |
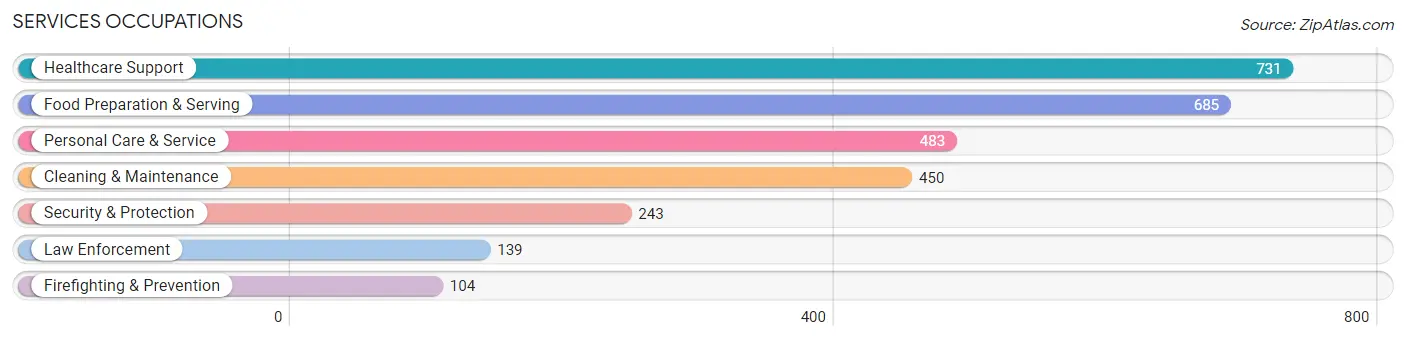
Services Occupations
The most common Services occupations in East Haven are Healthcare Support (731 | 5.1%), Food Preparation & Serving (685 | 4.7%), Personal Care & Service (483 | 3.3%), Cleaning & Maintenance (450 | 3.1%), and Security & Protection (243 | 1.7%).
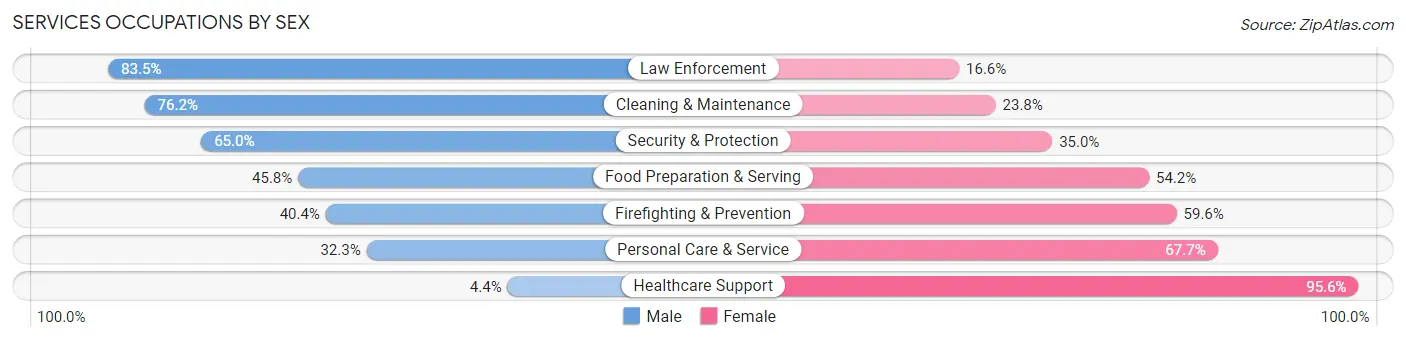
Services Occupations by Sex
Within the Services occupations in East Haven, the most male-oriented occupations are Law Enforcement (83.5%), Cleaning & Maintenance (76.2%), and Security & Protection (65.0%), while the most female-oriented occupations are Healthcare Support (95.6%), Personal Care & Service (67.7%), and Firefighting & Prevention (59.6%).
| Occupation | Male | Female |
| Healthcare Support | 32 (4.4%) | 699 (95.6%) |
| Security & Protection | 158 (65.0%) | 85 (35.0%) |
| Firefighting & Prevention | 42 (40.4%) | 62 (59.6%) |
| Law Enforcement | 116 (83.5%) | 23 (16.6%) |
| Food Preparation & Serving | 314 (45.8%) | 371 (54.2%) |
| Cleaning & Maintenance | 343 (76.2%) | 107 (23.8%) |
| Personal Care & Service | 156 (32.3%) | 327 (67.7%) |
| Total (Category) | 1,003 (38.7%) | 1,589 (61.3%) |
| Total (Overall) | 7,474 (51.6%) | 7,006 (48.4%) |
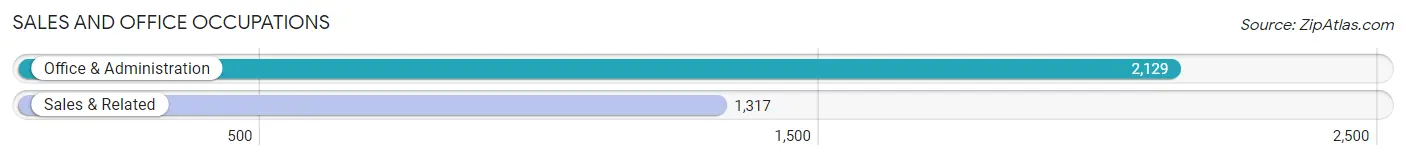
Sales and Office Occupations
The most common Sales and Office occupations in East Haven are Office & Administration (2,129 | 14.7%), and Sales & Related (1,317 | 9.1%).
Sales and Office Occupations by Sex
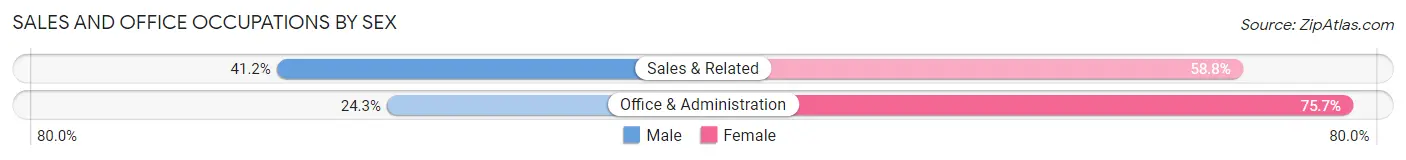
| Occupation | Male | Female |
| Sales & Related | 543 (41.2%) | 774 (58.8%) |
| Office & Administration | 517 (24.3%) | 1,612 (75.7%) |
| Total (Category) | 1,060 (30.8%) | 2,386 (69.2%) |
| Total (Overall) | 7,474 (51.6%) | 7,006 (48.4%) |
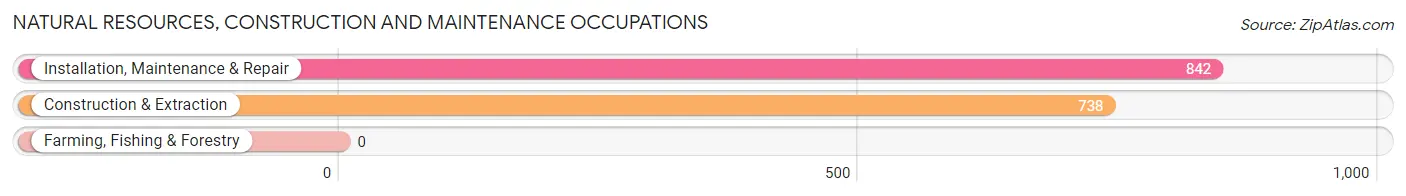
Natural Resources, Construction and Maintenance Occupations
The most common Natural Resources, Construction and Maintenance occupations in East Haven are Installation, Maintenance & Repair (842 | 5.8%), and Construction & Extraction (738 | 5.1%).
Natural Resources, Construction and Maintenance Occupations by Sex
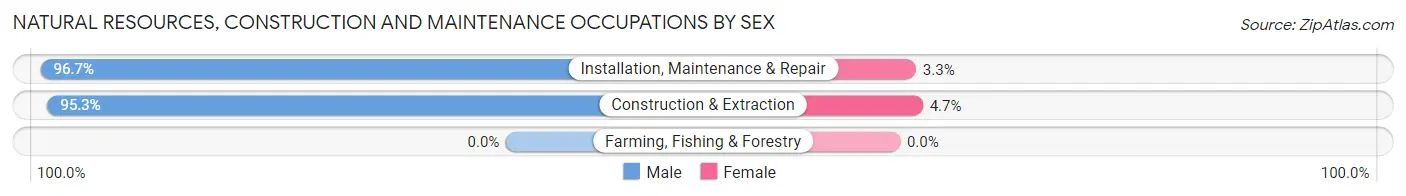
| Occupation | Male | Female |
| Farming, Fishing & Forestry | 0 (0.0%) | 0 (0.0%) |
| Construction & Extraction | 703 (95.3%) | 35 (4.7%) |
| Installation, Maintenance & Repair | 814 (96.7%) | 28 (3.3%) |
| Total (Category) | 1,517 (96.0%) | 63 (4.0%) |
| Total (Overall) | 7,474 (51.6%) | 7,006 (48.4%) |
Production, Transportation and Moving Occupations
The most common Production, Transportation and Moving occupations in East Haven are Production (842 | 5.8%), Transportation (716 | 4.9%), and Material Moving (232 | 1.6%).
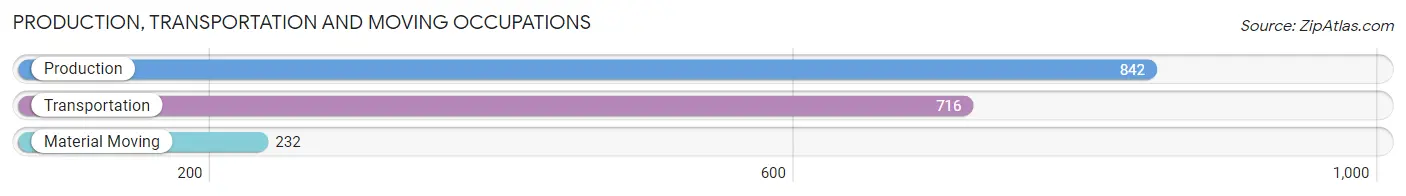
Production, Transportation and Moving Occupations by Sex
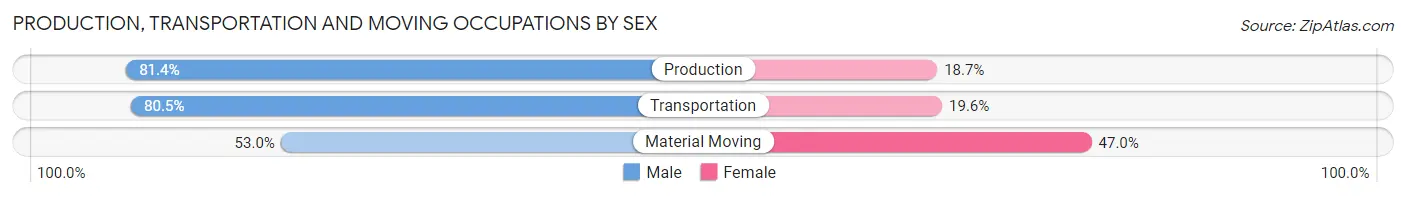
| Occupation | Male | Female |
| Production | 685 (81.4%) | 157 (18.6%) |
| Transportation | 576 (80.4%) | 140 (19.6%) |
| Material Moving | 123 (53.0%) | 109 (47.0%) |
| Total (Category) | 1,384 (77.3%) | 406 (22.7%) |
| Total (Overall) | 7,474 (51.6%) | 7,006 (48.4%) |
Employment Industries by Sex in East Haven
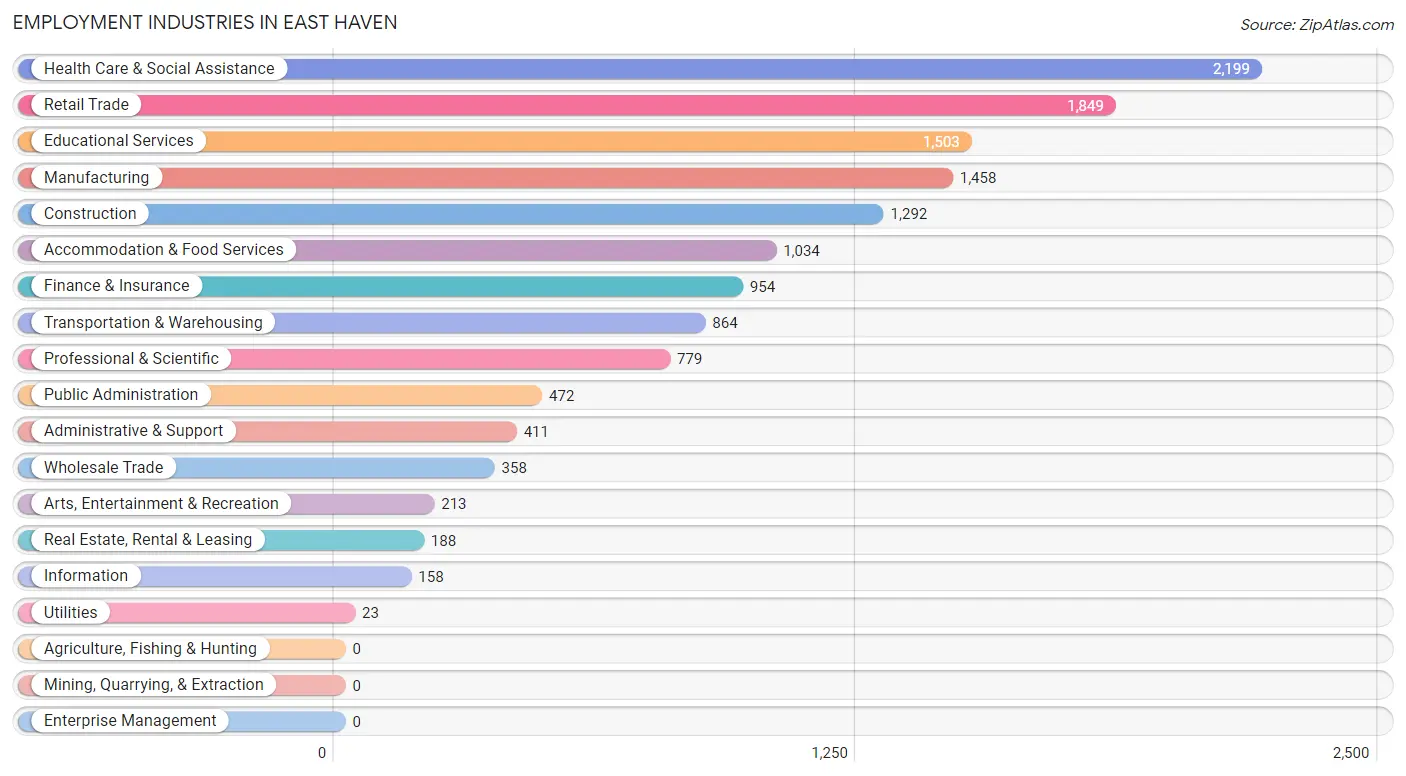
Employment Industries in East Haven
The major employment industries in East Haven include Health Care & Social Assistance (2,199 | 15.2%), Retail Trade (1,849 | 12.8%), Educational Services (1,503 | 10.4%), Manufacturing (1,458 | 10.1%), and Construction (1,292 | 8.9%).
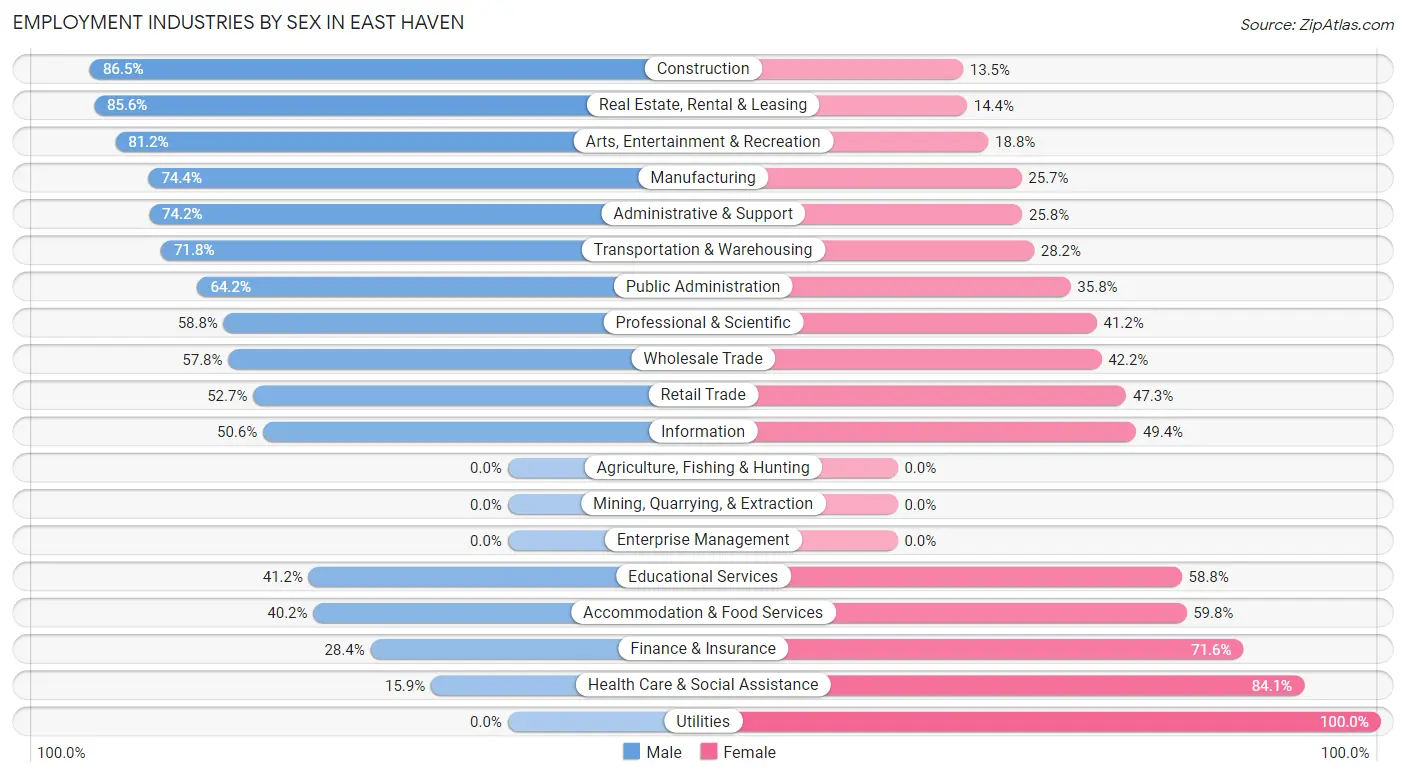
Employment Industries by Sex in East Haven
The East Haven industries that see more men than women are Construction (86.5%), Real Estate, Rental & Leasing (85.6%), and Arts, Entertainment & Recreation (81.2%), whereas the industries that tend to have a higher number of women are Utilities (100.0%), Health Care & Social Assistance (84.1%), and Finance & Insurance (71.6%).
| Industry | Male | Female |
| Agriculture, Fishing & Hunting | 0 (0.0%) | 0 (0.0%) |
| Mining, Quarrying, & Extraction | 0 (0.0%) | 0 (0.0%) |
| Construction | 1,117 (86.5%) | 175 (13.5%) |
| Manufacturing | 1,084 (74.4%) | 374 (25.7%) |
| Wholesale Trade | 207 (57.8%) | 151 (42.2%) |
| Retail Trade | 974 (52.7%) | 875 (47.3%) |
| Transportation & Warehousing | 620 (71.8%) | 244 (28.2%) |
| Utilities | 0 (0.0%) | 23 (100.0%) |
| Information | 80 (50.6%) | 78 (49.4%) |
| Finance & Insurance | 271 (28.4%) | 683 (71.6%) |
| Real Estate, Rental & Leasing | 161 (85.6%) | 27 (14.4%) |
| Professional & Scientific | 458 (58.8%) | 321 (41.2%) |
| Enterprise Management | 0 (0.0%) | 0 (0.0%) |
| Administrative & Support | 305 (74.2%) | 106 (25.8%) |
| Educational Services | 619 (41.2%) | 884 (58.8%) |
| Health Care & Social Assistance | 349 (15.9%) | 1,850 (84.1%) |
| Arts, Entertainment & Recreation | 173 (81.2%) | 40 (18.8%) |
| Accommodation & Food Services | 416 (40.2%) | 618 (59.8%) |
| Public Administration | 303 (64.2%) | 169 (35.8%) |
| Total | 7,474 (51.6%) | 7,006 (48.4%) |
Education in East Haven
School Enrollment in East Haven
The most common levels of schooling among the 5,837 students in East Haven are high school (1,723 | 29.5%), college / undergraduate (1,373 | 23.5%), and elementary school (1,029 | 17.6%).
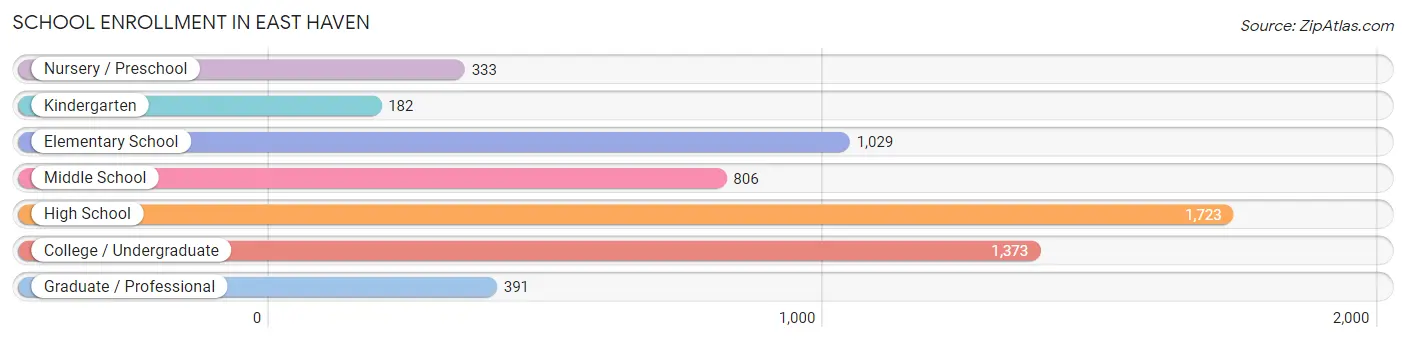
| School Level | # Students | % Students |
| Nursery / Preschool | 333 | 5.7% |
| Kindergarten | 182 | 3.1% |
| Elementary School | 1,029 | 17.6% |
| Middle School | 806 | 13.8% |
| High School | 1,723 | 29.5% |
| College / Undergraduate | 1,373 | 23.5% |
| Graduate / Professional | 391 | 6.7% |
| Total | 5,837 | 100.0% |
School Enrollment by Age by Funding Source in East Haven
Out of a total of 5,837 students who are enrolled in schools in East Haven, 794 (13.6%) attend a private institution, while the remaining 5,043 (86.4%) are enrolled in public schools. The age group of 3 to 4 year olds has the highest likelihood of being enrolled in private schools, with 153 (48.6% in the age bracket) enrolled. Conversely, the age group of 5 to 9 year old has the lowest likelihood of being enrolled in a private school, with 984 (98.6% in the age bracket) attending a public institution.
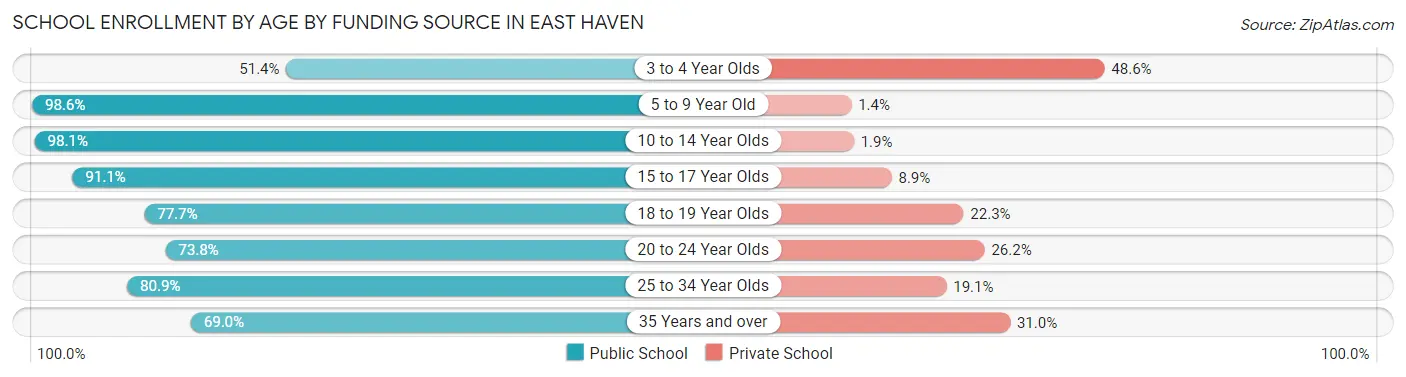
| Age Bracket | Public School | Private School |
| 3 to 4 Year Olds | 162 (51.4%) | 153 (48.6%) |
| 5 to 9 Year Old | 984 (98.6%) | 14 (1.4%) |
| 10 to 14 Year Olds | 1,258 (98.1%) | 24 (1.9%) |
| 15 to 17 Year Olds | 1,207 (91.1%) | 118 (8.9%) |
| 18 to 19 Year Olds | 352 (77.7%) | 101 (22.3%) |
| 20 to 24 Year Olds | 571 (73.8%) | 203 (26.2%) |
| 25 to 34 Year Olds | 237 (80.9%) | 56 (19.1%) |
| 35 Years and over | 274 (69.0%) | 123 (31.0%) |
| Total | 5,043 (86.4%) | 794 (13.6%) |
Educational Attainment by Field of Study in East Haven
Business (1,201 | 22.9%), education (546 | 10.4%), arts & humanities (515 | 9.8%), social sciences (452 | 8.6%), and psychology (368 | 7.0%) are the most common fields of study among 5,243 individuals in East Haven who have obtained a bachelor's degree or higher.
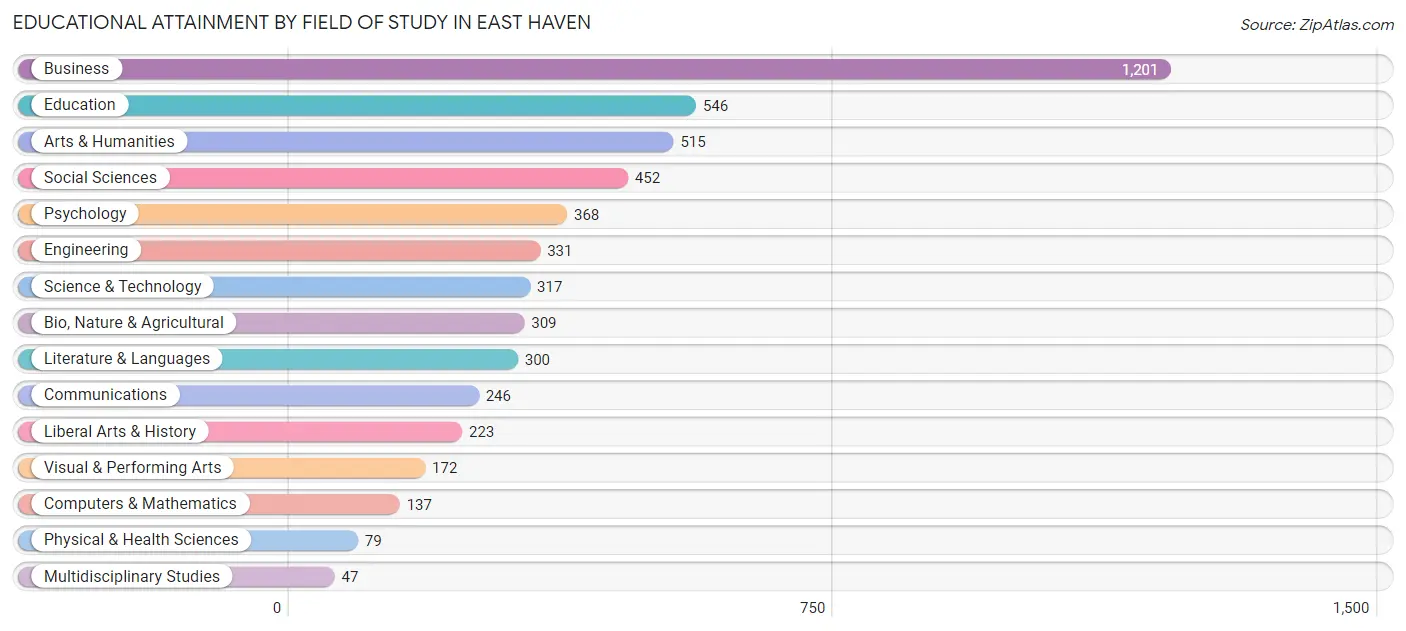
| Field of Study | # Graduates | % Graduates |
| Computers & Mathematics | 137 | 2.6% |
| Bio, Nature & Agricultural | 309 | 5.9% |
| Physical & Health Sciences | 79 | 1.5% |
| Psychology | 368 | 7.0% |
| Social Sciences | 452 | 8.6% |
| Engineering | 331 | 6.3% |
| Multidisciplinary Studies | 47 | 0.9% |
| Science & Technology | 317 | 6.0% |
| Business | 1,201 | 22.9% |
| Education | 546 | 10.4% |
| Literature & Languages | 300 | 5.7% |
| Liberal Arts & History | 223 | 4.3% |
| Visual & Performing Arts | 172 | 3.3% |
| Communications | 246 | 4.7% |
| Arts & Humanities | 515 | 9.8% |
| Total | 5,243 | 100.0% |
Transportation & Commute in East Haven
Vehicle Availability by Sex in East Haven
The most prevalent vehicle ownership categories in East Haven are males with 2 vehicles (2,882, accounting for 39.3%) and females with 2 vehicles (2,640, making up 42.2%).
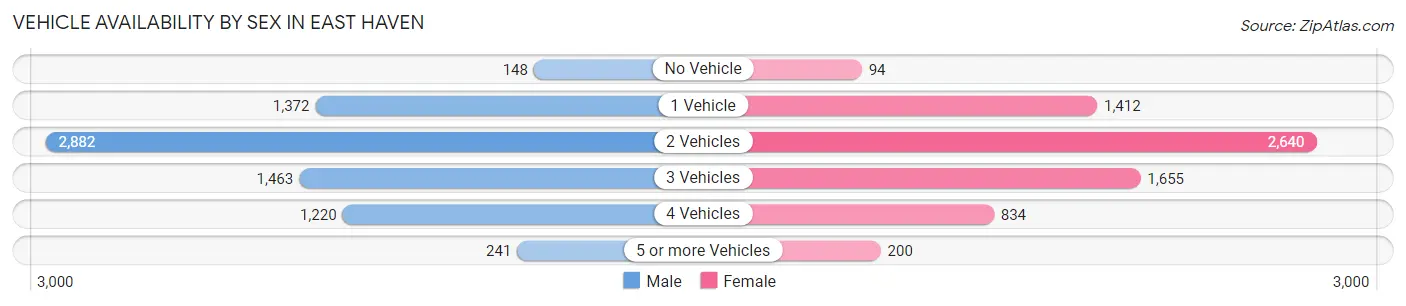
| Vehicles Available | Male | Female |
| No Vehicle | 148 (2.0%) | 94 (1.4%) |
| 1 Vehicle | 1,372 (18.7%) | 1,412 (20.7%) |
| 2 Vehicles | 2,882 (39.3%) | 2,640 (38.6%) |
| 3 Vehicles | 1,463 (20.0%) | 1,655 (24.2%) |
| 4 Vehicles | 1,220 (16.7%) | 834 (12.2%) |
| 5 or more Vehicles | 241 (3.3%) | 200 (2.9%) |
| Total | 7,326 (100.0%) | 6,835 (100.0%) |
Commute Time in East Haven
The most frequently occuring commute durations in East Haven are 15 to 19 minutes (2,605 commuters, 19.8%), 20 to 24 minutes (2,369 commuters, 18.0%), and 10 to 14 minutes (2,194 commuters, 16.7%).
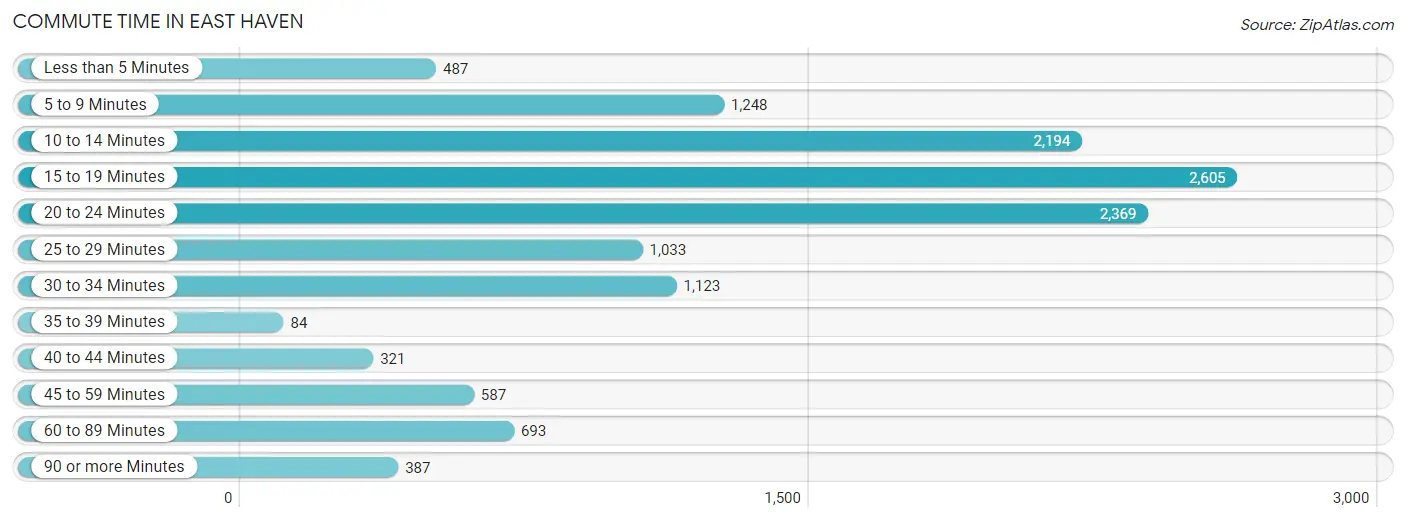
| Commute Time | # Commuters | % Commuters |
| Less than 5 Minutes | 487 | 3.7% |
| 5 to 9 Minutes | 1,248 | 9.5% |
| 10 to 14 Minutes | 2,194 | 16.7% |
| 15 to 19 Minutes | 2,605 | 19.8% |
| 20 to 24 Minutes | 2,369 | 18.0% |
| 25 to 29 Minutes | 1,033 | 7.9% |
| 30 to 34 Minutes | 1,123 | 8.6% |
| 35 to 39 Minutes | 84 | 0.6% |
| 40 to 44 Minutes | 321 | 2.4% |
| 45 to 59 Minutes | 587 | 4.5% |
| 60 to 89 Minutes | 693 | 5.3% |
| 90 or more Minutes | 387 | 2.9% |
Commute Time by Sex in East Haven
The most common commute times in East Haven are 10 to 14 minutes (1,180 commuters, 17.1%) for males and 15 to 19 minutes (1,507 commuters, 24.2%) for females.
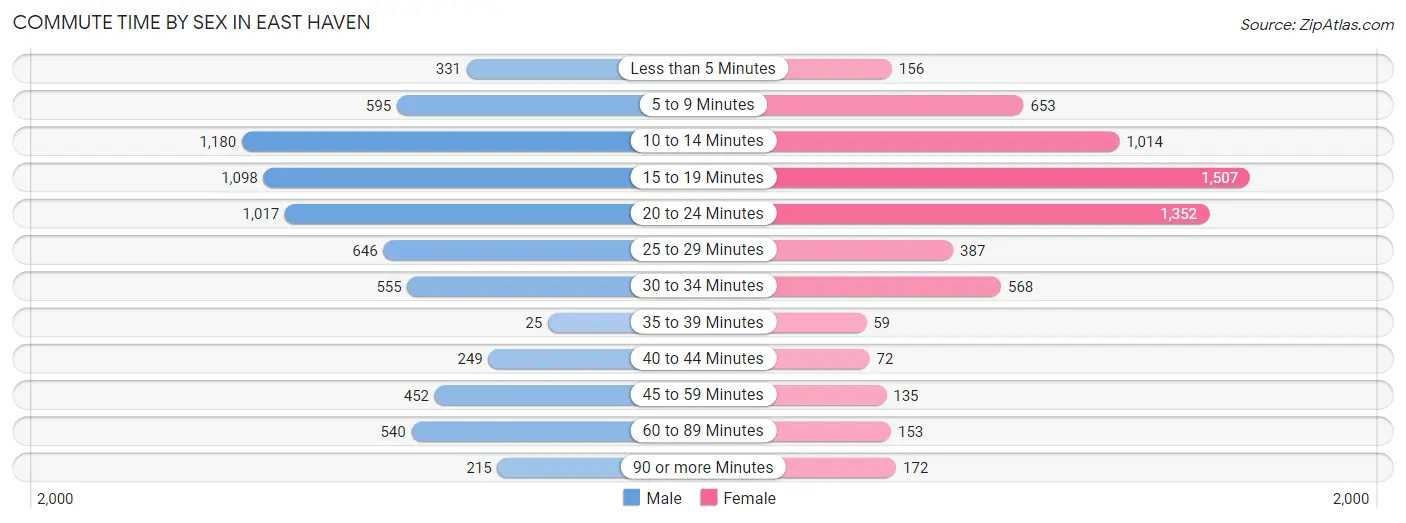
| Commute Time | Male | Female |
| Less than 5 Minutes | 331 (4.8%) | 156 (2.5%) |
| 5 to 9 Minutes | 595 (8.6%) | 653 (10.5%) |
| 10 to 14 Minutes | 1,180 (17.1%) | 1,014 (16.3%) |
| 15 to 19 Minutes | 1,098 (15.9%) | 1,507 (24.2%) |
| 20 to 24 Minutes | 1,017 (14.7%) | 1,352 (21.7%) |
| 25 to 29 Minutes | 646 (9.4%) | 387 (6.2%) |
| 30 to 34 Minutes | 555 (8.0%) | 568 (9.1%) |
| 35 to 39 Minutes | 25 (0.4%) | 59 (0.9%) |
| 40 to 44 Minutes | 249 (3.6%) | 72 (1.2%) |
| 45 to 59 Minutes | 452 (6.6%) | 135 (2.2%) |
| 60 to 89 Minutes | 540 (7.8%) | 153 (2.5%) |
| 90 or more Minutes | 215 (3.1%) | 172 (2.8%) |
Time of Departure to Work by Sex in East Haven
The most frequent times of departure to work in East Haven are 7:00 AM to 7:29 AM (996, 14.4%) for males and 7:00 AM to 7:29 AM (1,081, 17.4%) for females.
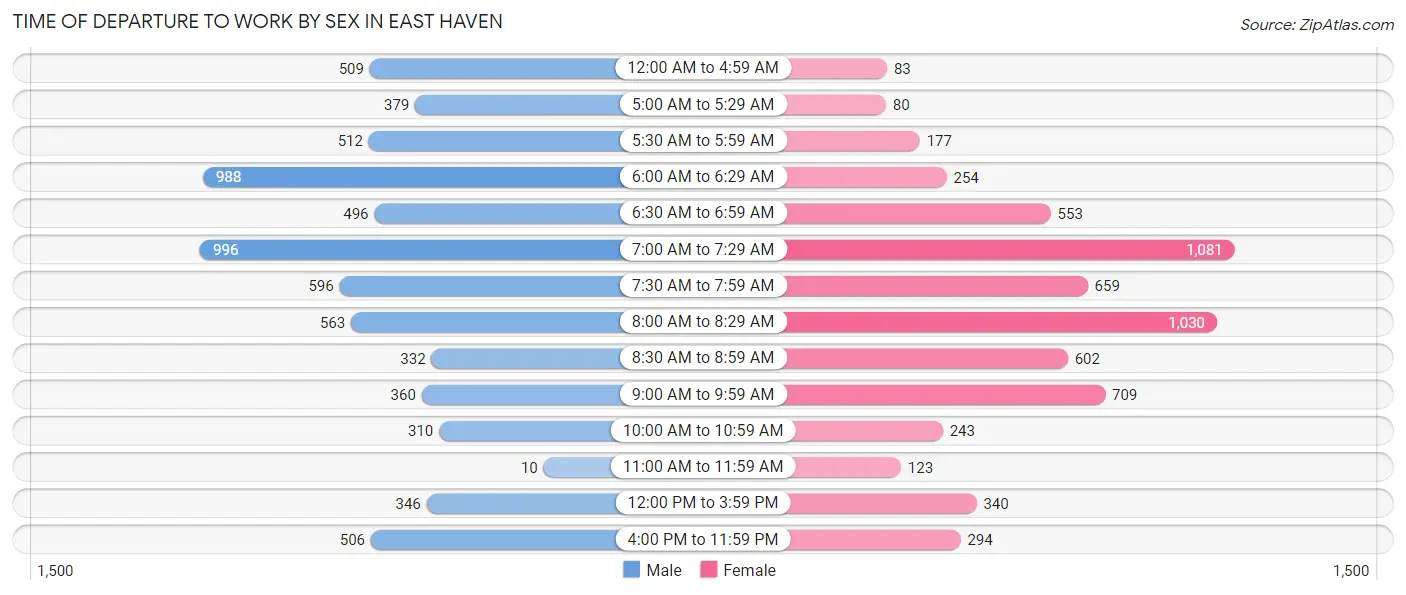
| Time of Departure | Male | Female |
| 12:00 AM to 4:59 AM | 509 (7.4%) | 83 (1.3%) |
| 5:00 AM to 5:29 AM | 379 (5.5%) | 80 (1.3%) |
| 5:30 AM to 5:59 AM | 512 (7.4%) | 177 (2.8%) |
| 6:00 AM to 6:29 AM | 988 (14.3%) | 254 (4.1%) |
| 6:30 AM to 6:59 AM | 496 (7.2%) | 553 (8.9%) |
| 7:00 AM to 7:29 AM | 996 (14.4%) | 1,081 (17.4%) |
| 7:30 AM to 7:59 AM | 596 (8.6%) | 659 (10.6%) |
| 8:00 AM to 8:29 AM | 563 (8.2%) | 1,030 (16.5%) |
| 8:30 AM to 8:59 AM | 332 (4.8%) | 602 (9.7%) |
| 9:00 AM to 9:59 AM | 360 (5.2%) | 709 (11.4%) |
| 10:00 AM to 10:59 AM | 310 (4.5%) | 243 (3.9%) |
| 11:00 AM to 11:59 AM | 10 (0.1%) | 123 (2.0%) |
| 12:00 PM to 3:59 PM | 346 (5.0%) | 340 (5.5%) |
| 4:00 PM to 11:59 PM | 506 (7.3%) | 294 (4.7%) |
| Total | 6,903 (100.0%) | 6,228 (100.0%) |
Housing Occupancy in East Haven
Occupancy by Ownership in East Haven
Of the total 11,028 dwellings in East Haven, owner-occupied units account for 8,323 (75.5%), while renter-occupied units make up 2,705 (24.5%).
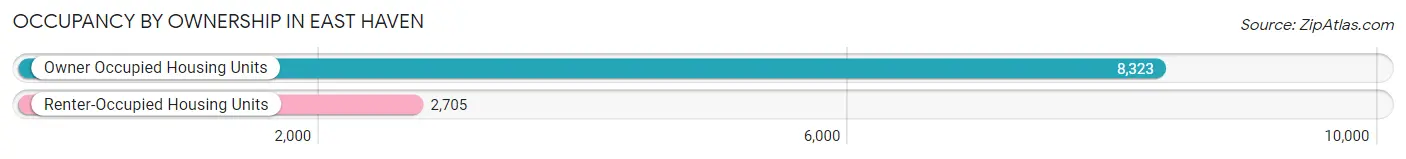
| Occupancy | # Housing Units | % Housing Units |
| Owner Occupied Housing Units | 8,323 | 75.5% |
| Renter-Occupied Housing Units | 2,705 | 24.5% |
| Total Occupied Housing Units | 11,028 | 100.0% |
Occupancy by Household Size in East Haven
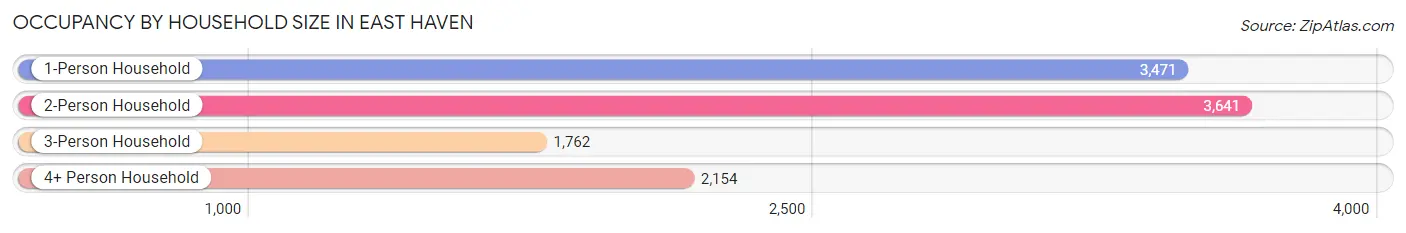
| Household Size | # Housing Units | % Housing Units |
| 1-Person Household | 3,471 | 31.5% |
| 2-Person Household | 3,641 | 33.0% |
| 3-Person Household | 1,762 | 16.0% |
| 4+ Person Household | 2,154 | 19.5% |
| Total Housing Units | 11,028 | 100.0% |
Occupancy by Ownership by Household Size in East Haven
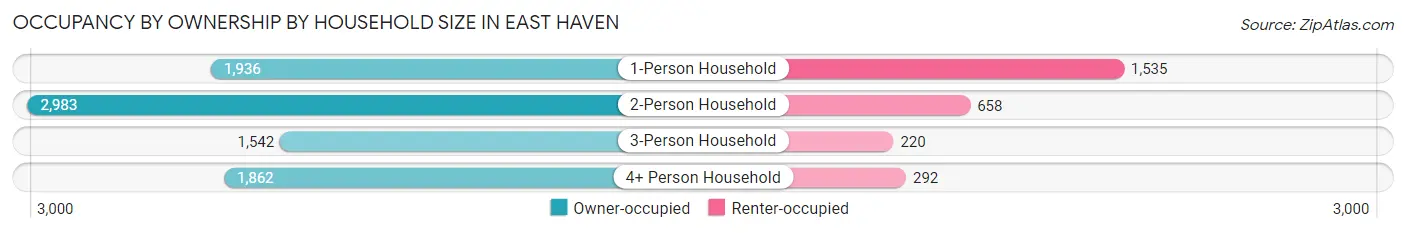
| Household Size | Owner-occupied | Renter-occupied |
| 1-Person Household | 1,936 (55.8%) | 1,535 (44.2%) |
| 2-Person Household | 2,983 (81.9%) | 658 (18.1%) |
| 3-Person Household | 1,542 (87.5%) | 220 (12.5%) |
| 4+ Person Household | 1,862 (86.4%) | 292 (13.6%) |
| Total Housing Units | 8,323 (75.5%) | 2,705 (24.5%) |
Occupancy by Educational Attainment in East Haven
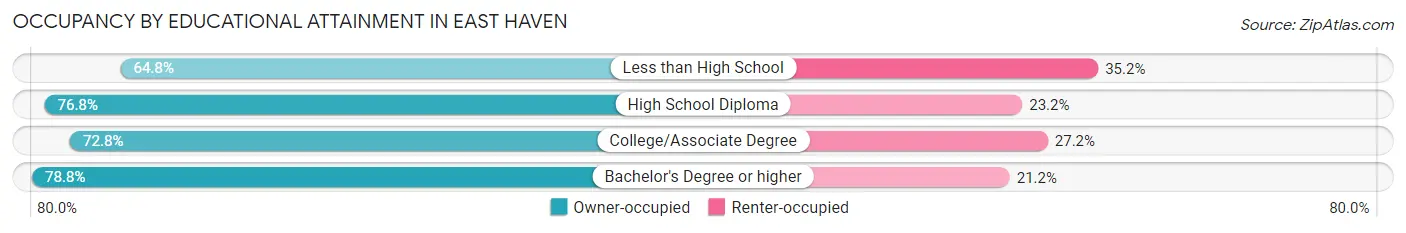
| Household Size | Owner-occupied | Renter-occupied |
| Less than High School | 480 (64.8%) | 261 (35.2%) |
| High School Diploma | 3,234 (76.8%) | 976 (23.2%) |
| College/Associate Degree | 2,167 (72.8%) | 811 (27.2%) |
| Bachelor's Degree or higher | 2,442 (78.8%) | 657 (21.2%) |
Occupancy by Age of Householder in East Haven
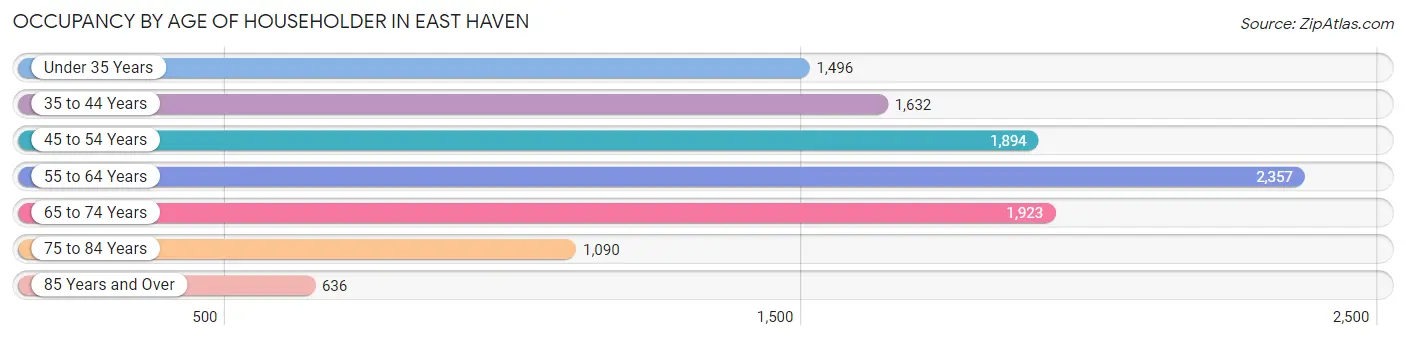
| Age Bracket | # Households | % Households |
| Under 35 Years | 1,496 | 13.6% |
| 35 to 44 Years | 1,632 | 14.8% |
| 45 to 54 Years | 1,894 | 17.2% |
| 55 to 64 Years | 2,357 | 21.4% |
| 65 to 74 Years | 1,923 | 17.4% |
| 75 to 84 Years | 1,090 | 9.9% |
| 85 Years and Over | 636 | 5.8% |
| Total | 11,028 | 100.0% |
Housing Finances in East Haven
Median Income by Occupancy in East Haven
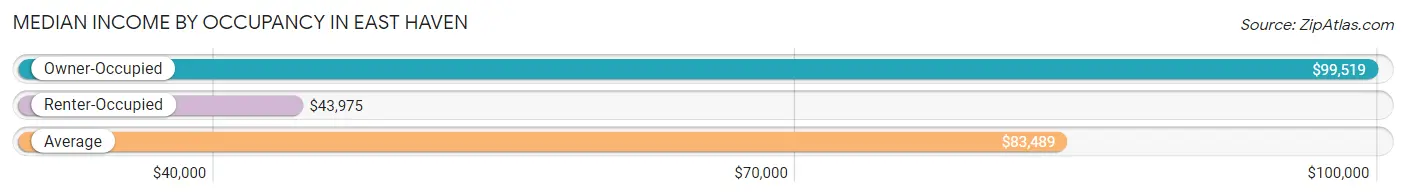
| Occupancy Type | # Households | Median Income |
| Owner-Occupied | 8,323 (75.5%) | $99,519 |
| Renter-Occupied | 2,705 (24.5%) | $43,975 |
| Average | 11,028 (100.0%) | $83,489 |
Occupancy by Householder Income Bracket in East Haven
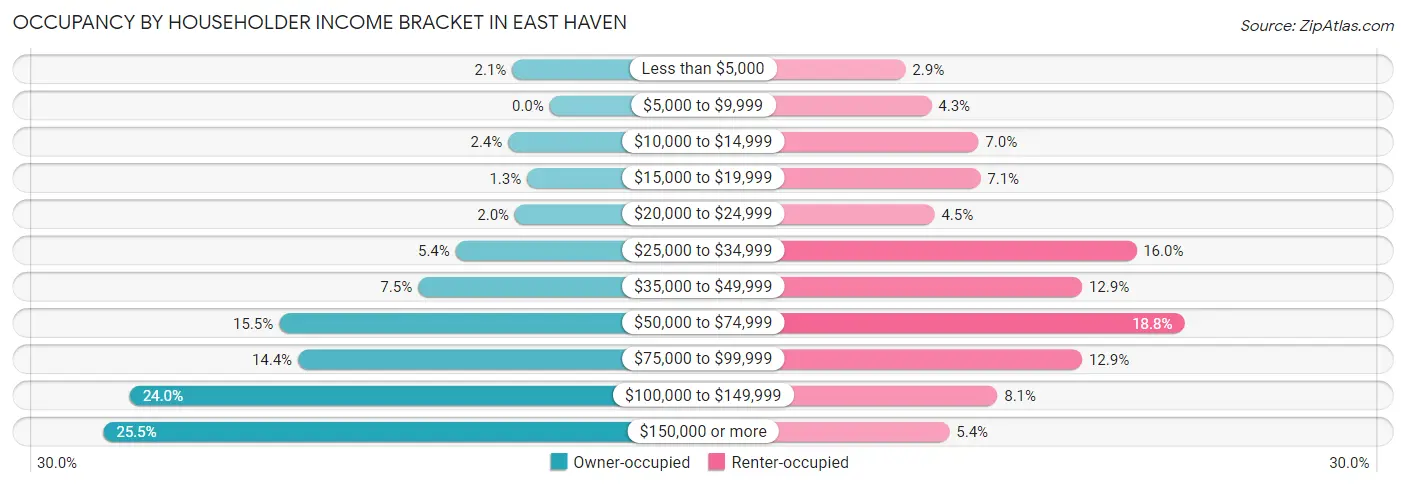
| Income Bracket | Owner-occupied | Renter-occupied |
| Less than $5,000 | 178 (2.1%) | 77 (2.9%) |
| $5,000 to $9,999 | 0 (0.0%) | 117 (4.3%) |
| $10,000 to $14,999 | 197 (2.4%) | 190 (7.0%) |
| $15,000 to $19,999 | 107 (1.3%) | 193 (7.1%) |
| $20,000 to $24,999 | 165 (2.0%) | 122 (4.5%) |
| $25,000 to $34,999 | 447 (5.4%) | 434 (16.0%) |
| $35,000 to $49,999 | 626 (7.5%) | 350 (12.9%) |
| $50,000 to $74,999 | 1,287 (15.5%) | 508 (18.8%) |
| $75,000 to $99,999 | 1,197 (14.4%) | 350 (12.9%) |
| $100,000 to $149,999 | 1,997 (24.0%) | 219 (8.1%) |
| $150,000 or more | 2,122 (25.5%) | 145 (5.4%) |
| Total | 8,323 (100.0%) | 2,705 (100.0%) |
Monthly Housing Cost Tiers in East Haven
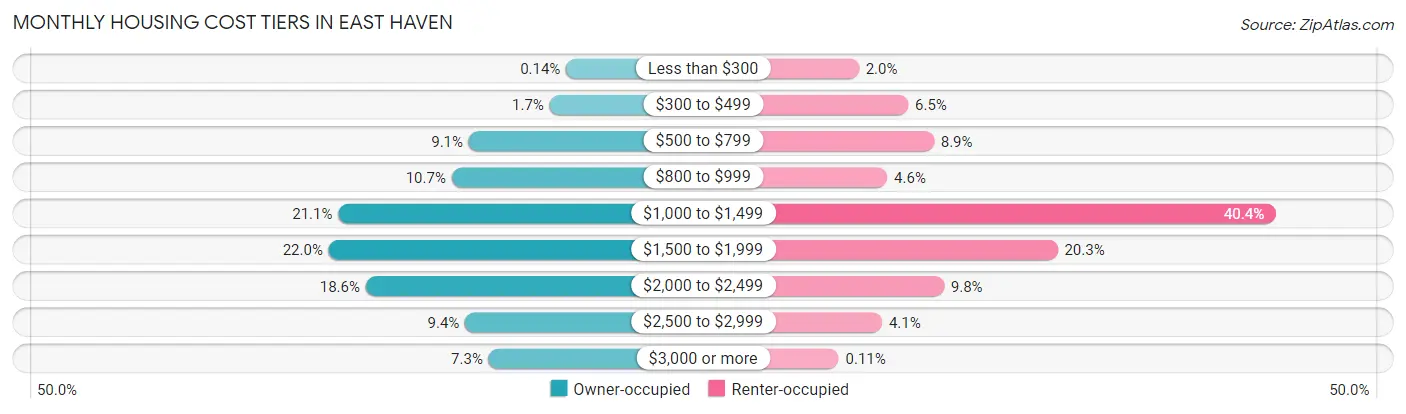
| Monthly Cost | Owner-occupied | Renter-occupied |
| Less than $300 | 12 (0.1%) | 53 (2.0%) |
| $300 to $499 | 138 (1.7%) | 176 (6.5%) |
| $500 to $799 | 757 (9.1%) | 240 (8.9%) |
| $800 to $999 | 889 (10.7%) | 124 (4.6%) |
| $1,000 to $1,499 | 1,758 (21.1%) | 1,092 (40.4%) |
| $1,500 to $1,999 | 1,831 (22.0%) | 548 (20.3%) |
| $2,000 to $2,499 | 1,547 (18.6%) | 265 (9.8%) |
| $2,500 to $2,999 | 786 (9.4%) | 111 (4.1%) |
| $3,000 or more | 605 (7.3%) | 3 (0.1%) |
| Total | 8,323 (100.0%) | 2,705 (100.0%) |
Physical Housing Characteristics in East Haven
Housing Structures in East Haven
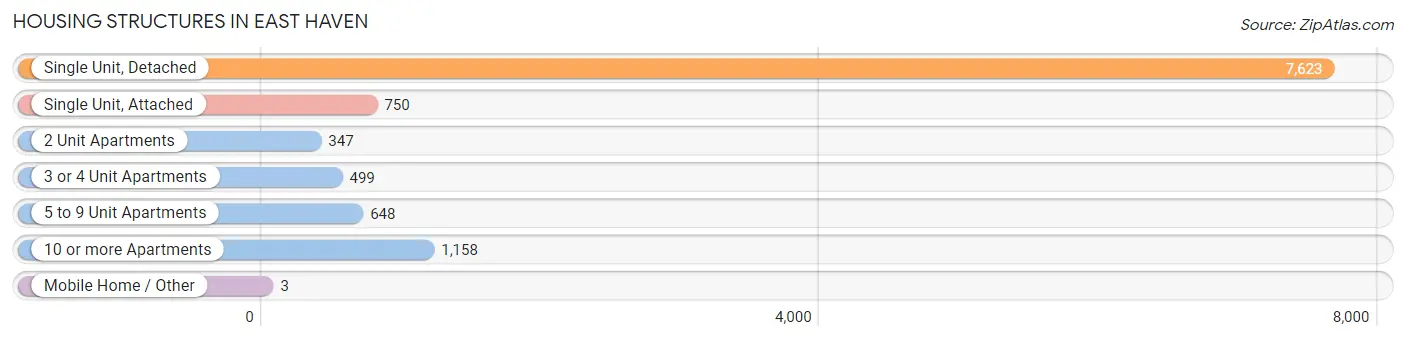
| Structure Type | # Housing Units | % Housing Units |
| Single Unit, Detached | 7,623 | 69.1% |
| Single Unit, Attached | 750 | 6.8% |
| 2 Unit Apartments | 347 | 3.2% |
| 3 or 4 Unit Apartments | 499 | 4.5% |
| 5 to 9 Unit Apartments | 648 | 5.9% |
| 10 or more Apartments | 1,158 | 10.5% |
| Mobile Home / Other | 3 | 0.0% |
| Total | 11,028 | 100.0% |
Housing Structures by Occupancy in East Haven
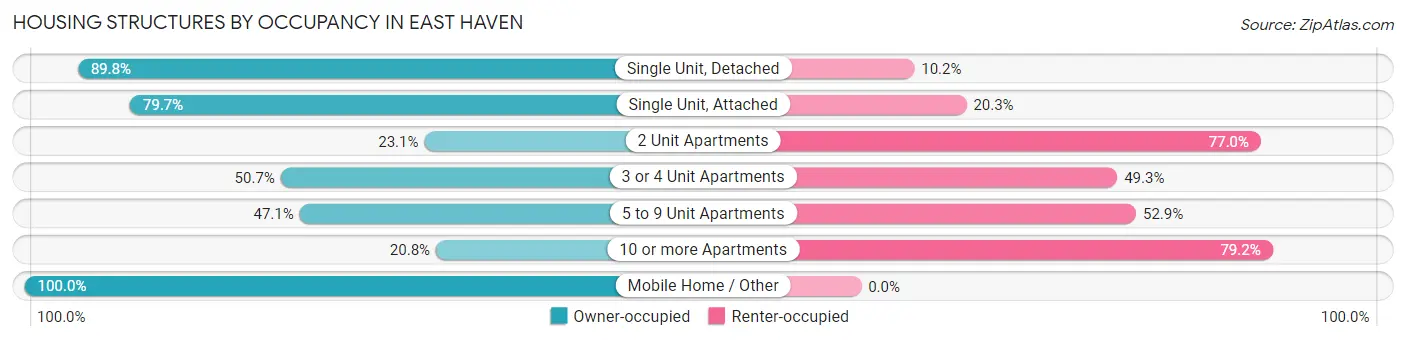
| Structure Type | Owner-occupied | Renter-occupied |
| Single Unit, Detached | 6,843 (89.8%) | 780 (10.2%) |
| Single Unit, Attached | 598 (79.7%) | 152 (20.3%) |
| 2 Unit Apartments | 80 (23.1%) | 267 (76.9%) |
| 3 or 4 Unit Apartments | 253 (50.7%) | 246 (49.3%) |
| 5 to 9 Unit Apartments | 305 (47.1%) | 343 (52.9%) |
| 10 or more Apartments | 241 (20.8%) | 917 (79.2%) |
| Mobile Home / Other | 3 (100.0%) | 0 (0.0%) |
| Total | 8,323 (75.5%) | 2,705 (24.5%) |
Housing Structures by Number of Rooms in East Haven
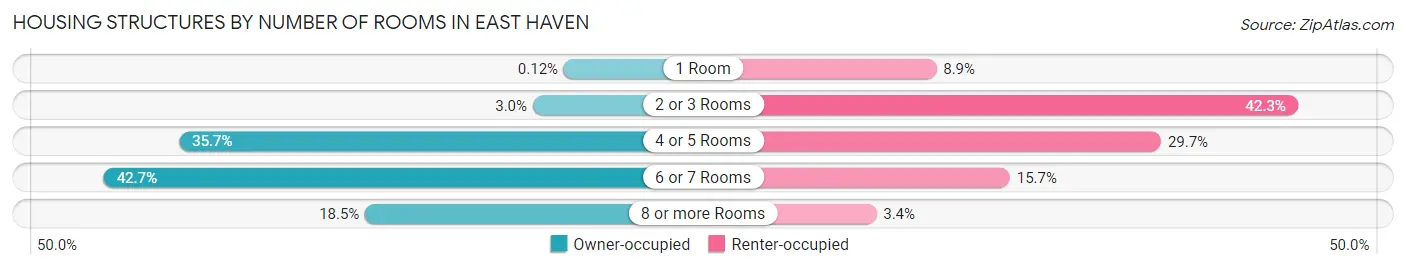
| Number of Rooms | Owner-occupied | Renter-occupied |
| 1 Room | 10 (0.1%) | 241 (8.9%) |
| 2 or 3 Rooms | 249 (3.0%) | 1,145 (42.3%) |
| 4 or 5 Rooms | 2,972 (35.7%) | 803 (29.7%) |
| 6 or 7 Rooms | 3,552 (42.7%) | 425 (15.7%) |
| 8 or more Rooms | 1,540 (18.5%) | 91 (3.4%) |
| Total | 8,323 (100.0%) | 2,705 (100.0%) |
Housing Structure by Heating Type in East Haven
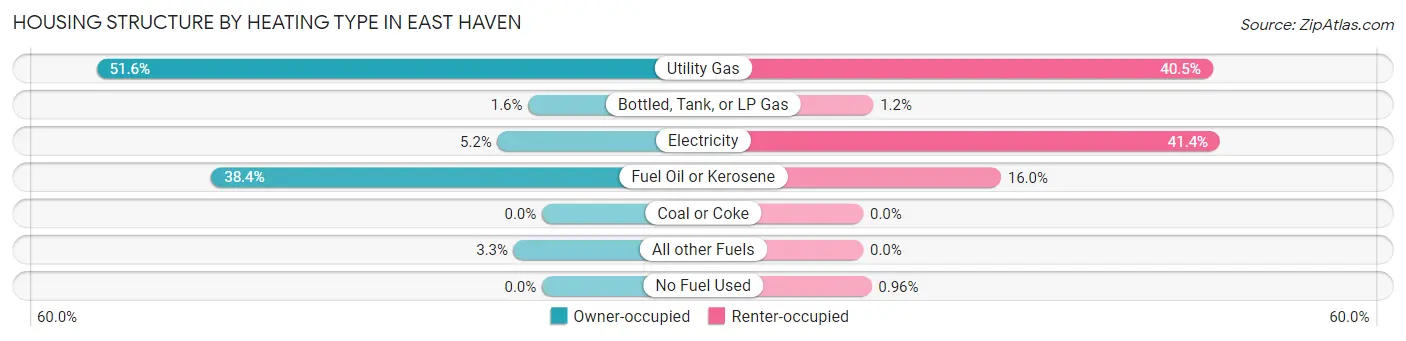
| Heating Type | Owner-occupied | Renter-occupied |
| Utility Gas | 4,298 (51.6%) | 1,096 (40.5%) |
| Bottled, Tank, or LP Gas | 132 (1.6%) | 32 (1.2%) |
| Electricity | 429 (5.1%) | 1,119 (41.4%) |
| Fuel Oil or Kerosene | 3,192 (38.4%) | 432 (16.0%) |
| Coal or Coke | 0 (0.0%) | 0 (0.0%) |
| All other Fuels | 272 (3.3%) | 0 (0.0%) |
| No Fuel Used | 0 (0.0%) | 26 (1.0%) |
| Total | 8,323 (100.0%) | 2,705 (100.0%) |
Household Vehicle Usage in East Haven
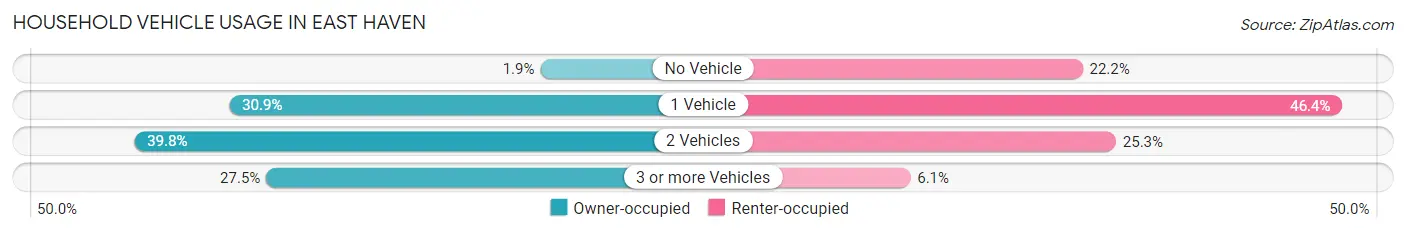
| Vehicles per Household | Owner-occupied | Renter-occupied |
| No Vehicle | 155 (1.9%) | 600 (22.2%) |
| 1 Vehicle | 2,573 (30.9%) | 1,256 (46.4%) |
| 2 Vehicles | 3,310 (39.8%) | 684 (25.3%) |
| 3 or more Vehicles | 2,285 (27.5%) | 165 (6.1%) |
| Total | 8,323 (100.0%) | 2,705 (100.0%) |
Real Estate & Mortgages in East Haven
Real Estate and Mortgage Overview in East Haven
| Characteristic | Without Mortgage | With Mortgage |
| Housing Units | 2,737 | 5,586 |
| Median Property Value | $262,800 | $262,400 |
| Median Household Income | $74,263 | $1,627 |
| Monthly Housing Costs | $933 | $594 |
| Real Estate Taxes | $4,928 | $31 |
Property Value by Mortgage Status in East Haven
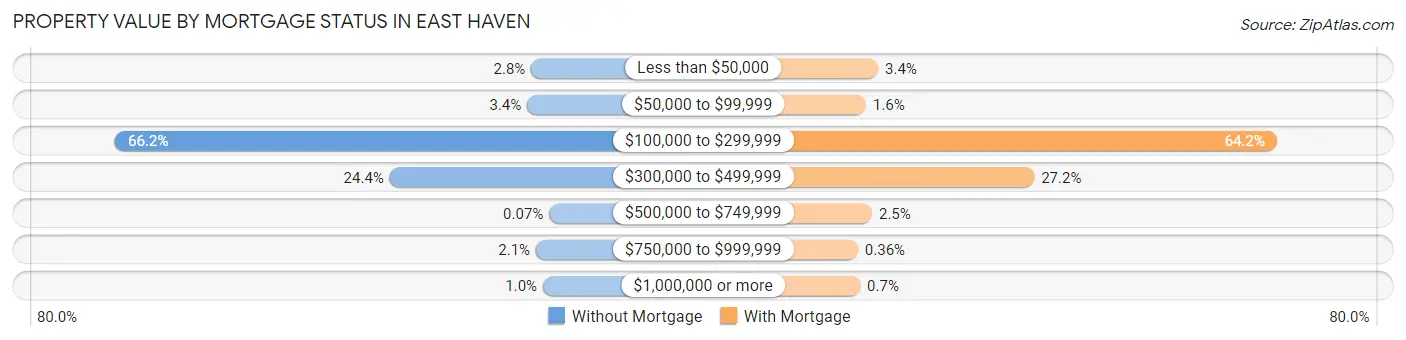
| Property Value | Without Mortgage | With Mortgage |
| Less than $50,000 | 77 (2.8%) | 192 (3.4%) |
| $50,000 to $99,999 | 94 (3.4%) | 89 (1.6%) |
| $100,000 to $299,999 | 1,812 (66.2%) | 3,585 (64.2%) |
| $300,000 to $499,999 | 667 (24.4%) | 1,521 (27.2%) |
| $500,000 to $749,999 | 2 (0.1%) | 140 (2.5%) |
| $750,000 to $999,999 | 57 (2.1%) | 20 (0.4%) |
| $1,000,000 or more | 28 (1.0%) | 39 (0.7%) |
| Total | 2,737 (100.0%) | 5,586 (100.0%) |
Household Income by Mortgage Status in East Haven
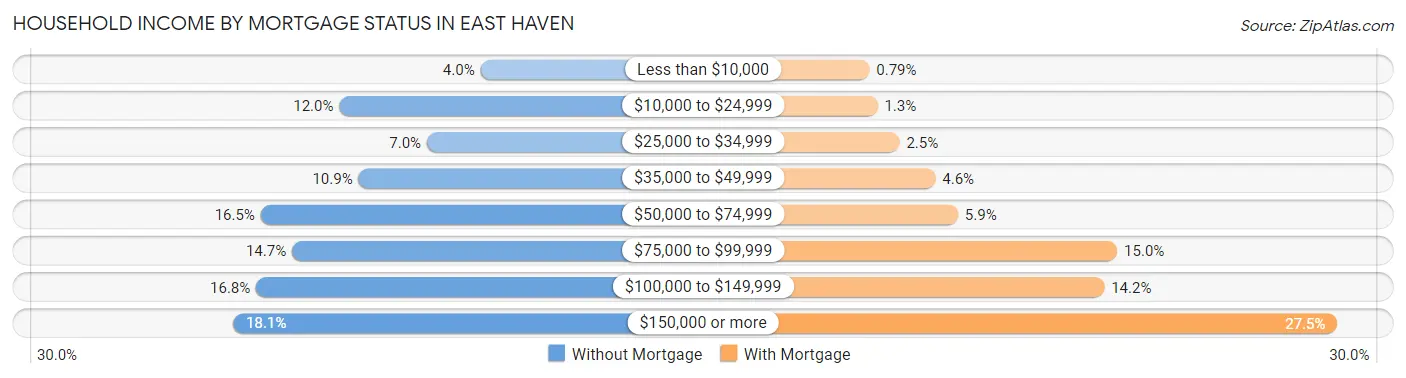
| Household Income | Without Mortgage | With Mortgage |
| Less than $10,000 | 108 (4.0%) | 44 (0.8%) |
| $10,000 to $24,999 | 329 (12.0%) | 70 (1.3%) |
| $25,000 to $34,999 | 192 (7.0%) | 140 (2.5%) |
| $35,000 to $49,999 | 299 (10.9%) | 255 (4.6%) |
| $50,000 to $74,999 | 452 (16.5%) | 327 (5.9%) |
| $75,000 to $99,999 | 403 (14.7%) | 835 (14.9%) |
| $100,000 to $149,999 | 459 (16.8%) | 794 (14.2%) |
| $150,000 or more | 495 (18.1%) | 1,538 (27.5%) |
| Total | 2,737 (100.0%) | 5,586 (100.0%) |
Property Value to Household Income Ratio in East Haven
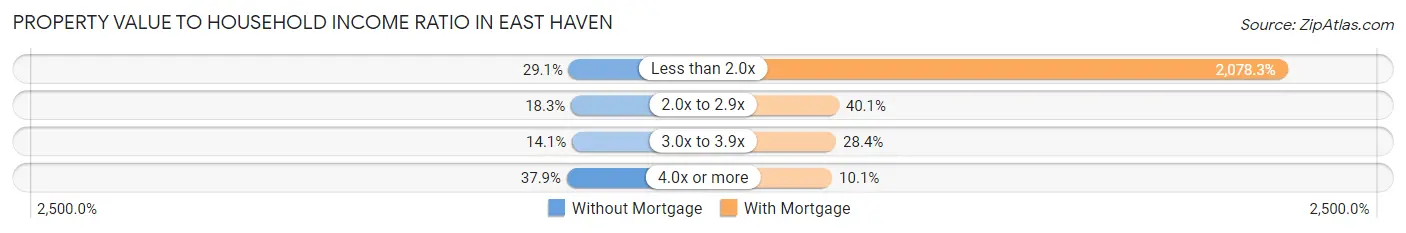
| Value-to-Income Ratio | Without Mortgage | With Mortgage |
| Less than 2.0x | 795 (29.0%) | 116,092 (2,078.3%) |
| 2.0x to 2.9x | 500 (18.3%) | 2,240 (40.1%) |
| 3.0x to 3.9x | 385 (14.1%) | 1,584 (28.4%) |
| 4.0x or more | 1,037 (37.9%) | 563 (10.1%) |
| Total | 2,737 (100.0%) | 5,586 (100.0%) |
Real Estate Taxes by Mortgage Status in East Haven
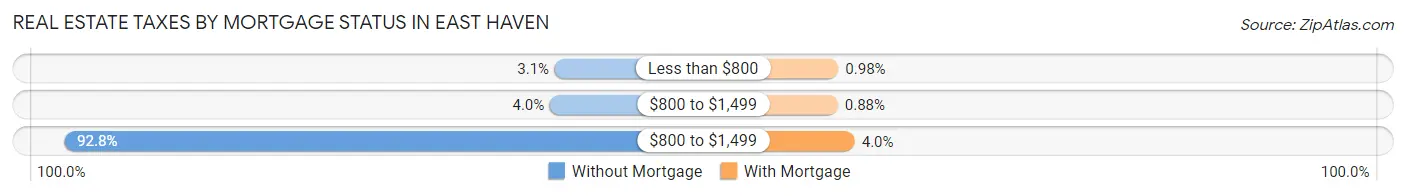
| Property Taxes | Without Mortgage | With Mortgage |
| Less than $800 | 86 (3.1%) | 55 (1.0%) |
| $800 to $1,499 | 110 (4.0%) | 49 (0.9%) |
| $800 to $1,499 | 2,539 (92.8%) | 222 (4.0%) |
| Total | 2,737 (100.0%) | 5,586 (100.0%) |
Health & Disability in East Haven
Health Insurance Coverage by Age in East Haven
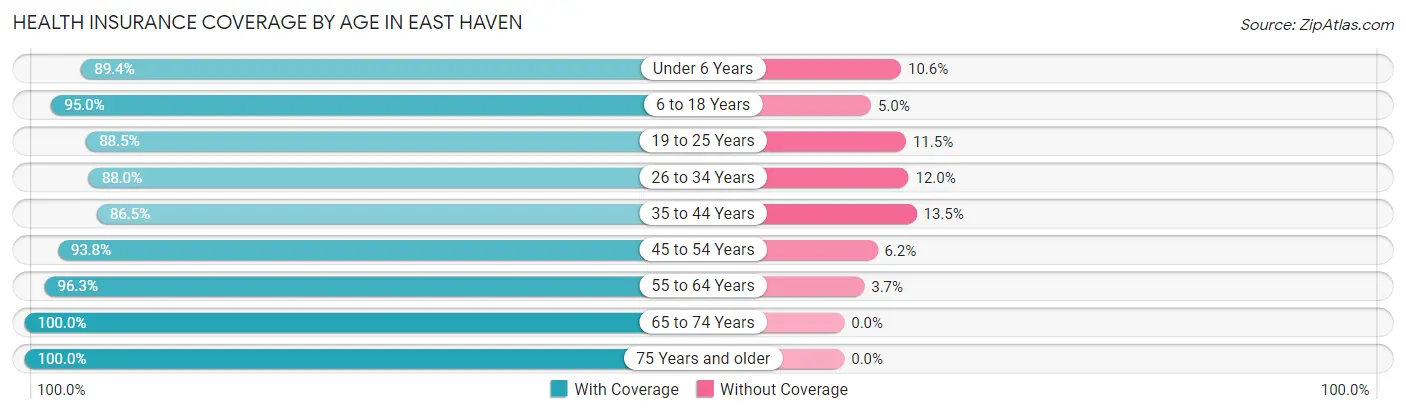
| Age Bracket | With Coverage | Without Coverage |
| Under 6 Years | 1,031 (89.4%) | 122 (10.6%) |
| 6 to 18 Years | 3,660 (95.0%) | 192 (5.0%) |
| 19 to 25 Years | 2,024 (88.5%) | 263 (11.5%) |
| 26 to 34 Years | 2,880 (88.0%) | 392 (12.0%) |
| 35 to 44 Years | 2,827 (86.5%) | 440 (13.5%) |
| 45 to 54 Years | 3,503 (93.8%) | 231 (6.2%) |
| 55 to 64 Years | 4,490 (96.3%) | 174 (3.7%) |
| 65 to 74 Years | 2,941 (100.0%) | 0 (0.0%) |
| 75 Years and older | 2,431 (100.0%) | 0 (0.0%) |
| Total | 25,787 (93.4%) | 1,814 (6.6%) |
Health Insurance Coverage by Citizenship Status in East Haven
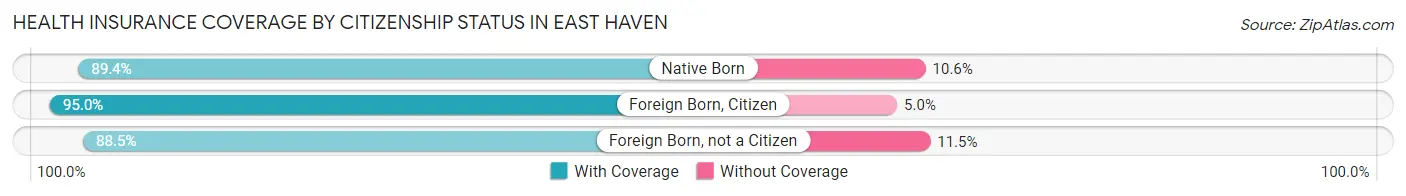
| Citizenship Status | With Coverage | Without Coverage |
| Native Born | 1,031 (89.4%) | 122 (10.6%) |
| Foreign Born, Citizen | 3,660 (95.0%) | 192 (5.0%) |
| Foreign Born, not a Citizen | 2,024 (88.5%) | 263 (11.5%) |
Health Insurance Coverage by Household Income in East Haven
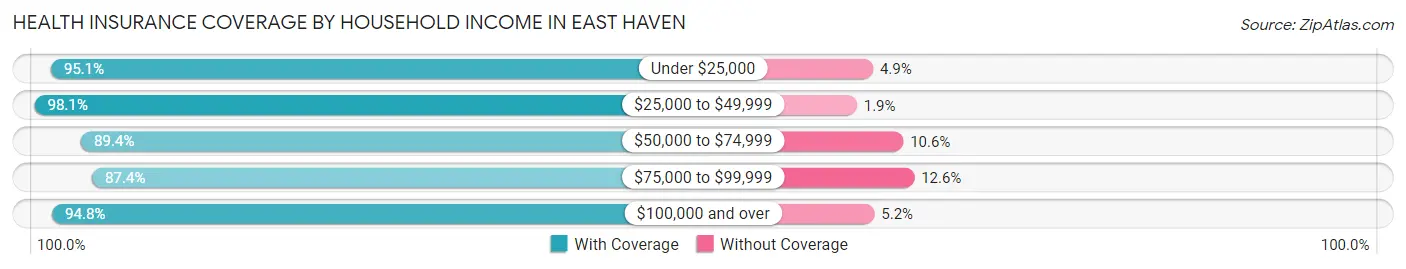
| Household Income | With Coverage | Without Coverage |
| Under $25,000 | 1,898 (95.1%) | 98 (4.9%) |
| $25,000 to $49,999 | 3,099 (98.1%) | 59 (1.9%) |
| $50,000 to $74,999 | 3,757 (89.4%) | 444 (10.6%) |
| $75,000 to $99,999 | 3,190 (87.4%) | 461 (12.6%) |
| $100,000 and over | 13,801 (94.8%) | 752 (5.2%) |
Public vs Private Health Insurance Coverage by Age in East Haven
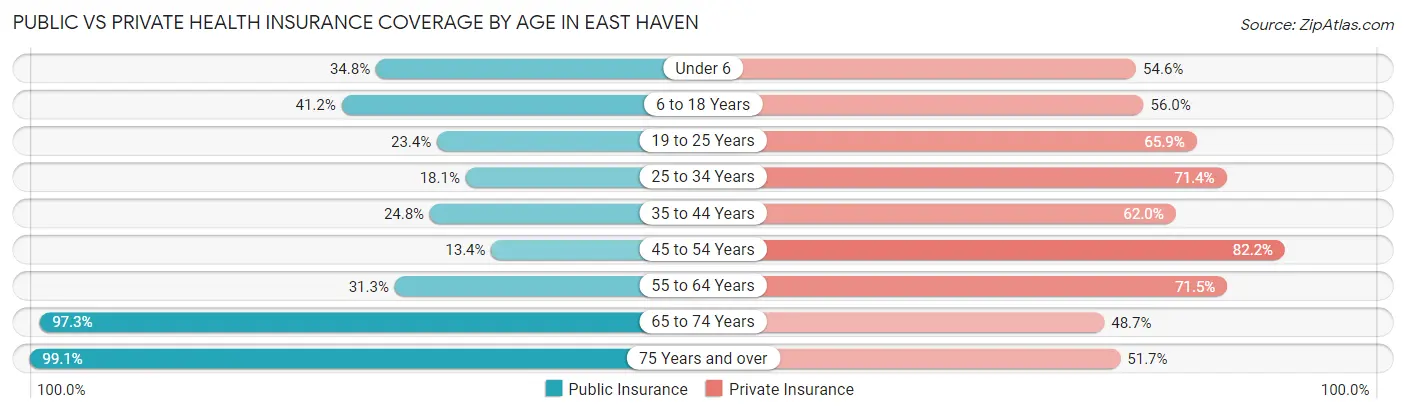
| Age Bracket | Public Insurance | Private Insurance |
| Under 6 | 401 (34.8%) | 630 (54.6%) |
| 6 to 18 Years | 1,586 (41.2%) | 2,158 (56.0%) |
| 19 to 25 Years | 536 (23.4%) | 1,506 (65.8%) |
| 25 to 34 Years | 593 (18.1%) | 2,336 (71.4%) |
| 35 to 44 Years | 809 (24.8%) | 2,024 (62.0%) |
| 45 to 54 Years | 499 (13.4%) | 3,071 (82.2%) |
| 55 to 64 Years | 1,460 (31.3%) | 3,336 (71.5%) |
| 65 to 74 Years | 2,861 (97.3%) | 1,433 (48.7%) |
| 75 Years and over | 2,409 (99.1%) | 1,257 (51.7%) |
| Total | 11,154 (40.4%) | 17,751 (64.3%) |
Disability Status by Sex by Age in East Haven
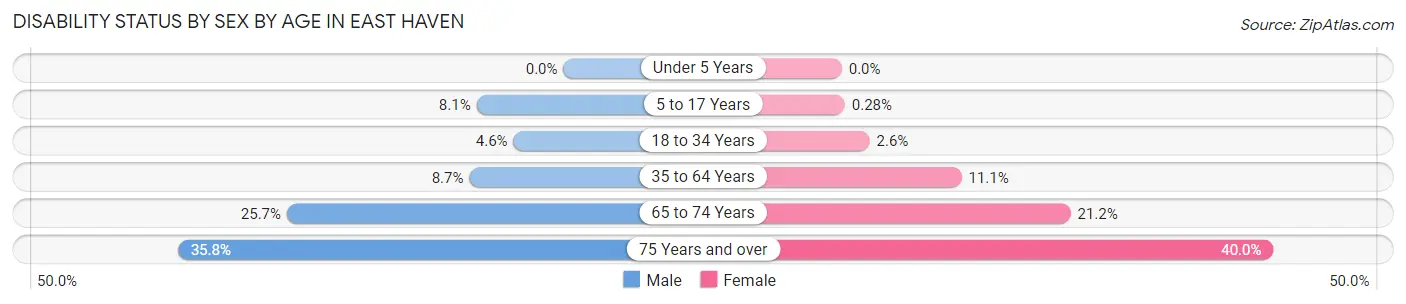
| Age Bracket | Male | Female |
| Under 5 Years | 0 (0.0%) | 0 (0.0%) |
| 5 to 17 Years | 156 (8.1%) | 5 (0.3%) |
| 18 to 34 Years | 140 (4.6%) | 71 (2.6%) |
| 35 to 64 Years | 488 (8.7%) | 675 (11.1%) |
| 65 to 74 Years | 380 (25.7%) | 310 (21.2%) |
| 75 Years and over | 349 (35.8%) | 583 (40.0%) |
Disability Class by Sex by Age in East Haven
Disability Class: Hearing Difficulty
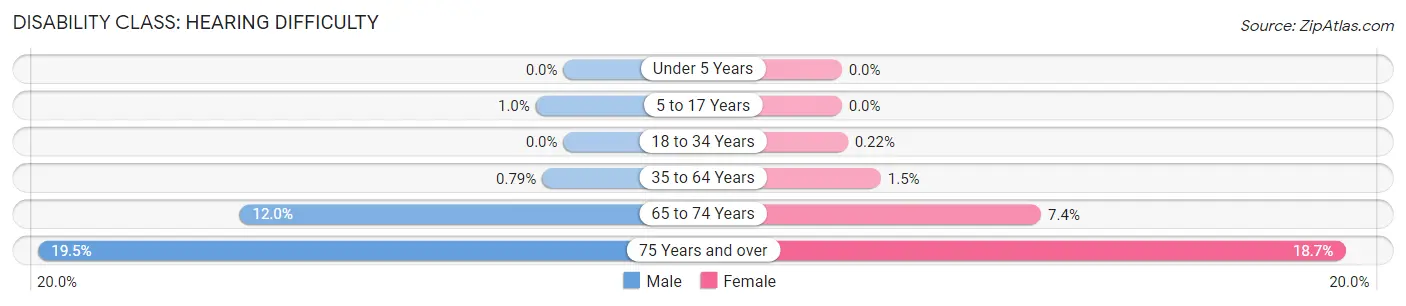
| Age Bracket | Male | Female |
| Under 5 Years | 0 (0.0%) | 0 (0.0%) |
| 5 to 17 Years | 20 (1.0%) | 0 (0.0%) |
| 18 to 34 Years | 0 (0.0%) | 6 (0.2%) |
| 35 to 64 Years | 44 (0.8%) | 88 (1.5%) |
| 65 to 74 Years | 178 (12.0%) | 108 (7.4%) |
| 75 Years and over | 190 (19.5%) | 272 (18.7%) |
Disability Class: Vision Difficulty
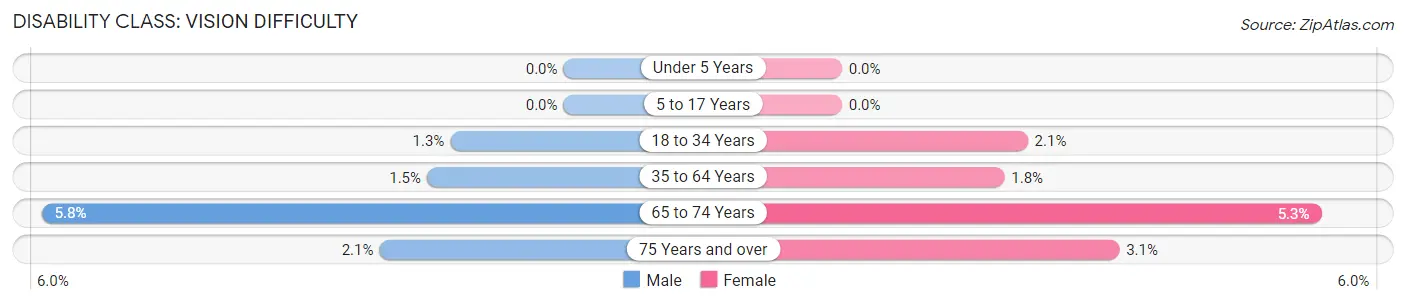
| Age Bracket | Male | Female |
| Under 5 Years | 0 (0.0%) | 0 (0.0%) |
| 5 to 17 Years | 0 (0.0%) | 0 (0.0%) |
| 18 to 34 Years | 38 (1.3%) | 57 (2.1%) |
| 35 to 64 Years | 85 (1.5%) | 110 (1.8%) |
| 65 to 74 Years | 86 (5.8%) | 78 (5.3%) |
| 75 Years and over | 20 (2.1%) | 45 (3.1%) |
Disability Class: Cognitive Difficulty
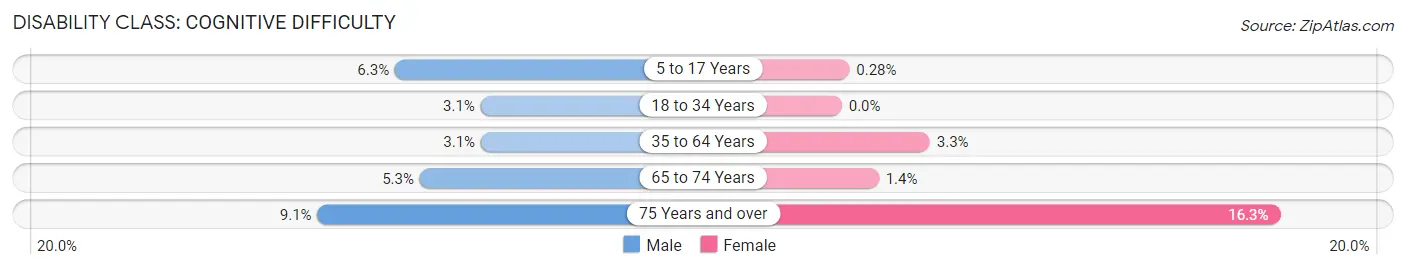
| Age Bracket | Male | Female |
| 5 to 17 Years | 121 (6.2%) | 5 (0.3%) |
| 18 to 34 Years | 93 (3.1%) | 0 (0.0%) |
| 35 to 64 Years | 171 (3.1%) | 199 (3.3%) |
| 65 to 74 Years | 79 (5.3%) | 20 (1.4%) |
| 75 Years and over | 89 (9.1%) | 237 (16.3%) |
Disability Class: Ambulatory Difficulty
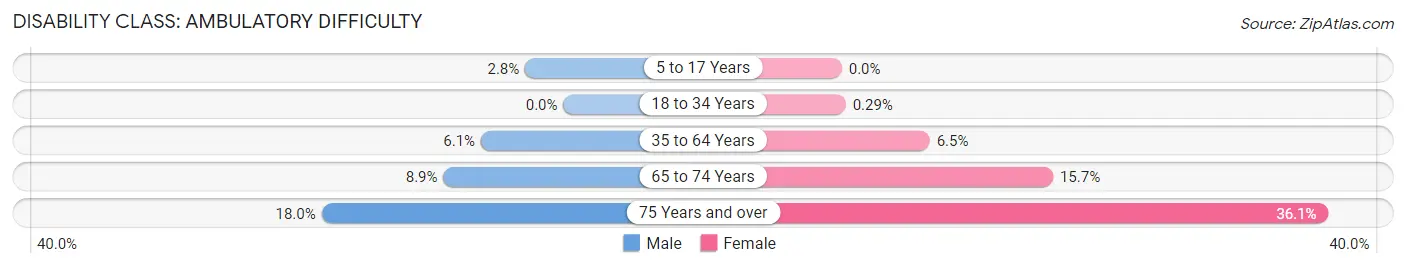
| Age Bracket | Male | Female |
| 5 to 17 Years | 55 (2.8%) | 0 (0.0%) |
| 18 to 34 Years | 0 (0.0%) | 8 (0.3%) |
| 35 to 64 Years | 342 (6.1%) | 397 (6.5%) |
| 65 to 74 Years | 132 (8.9%) | 229 (15.7%) |
| 75 Years and over | 175 (17.9%) | 526 (36.1%) |
Disability Class: Self-Care Difficulty
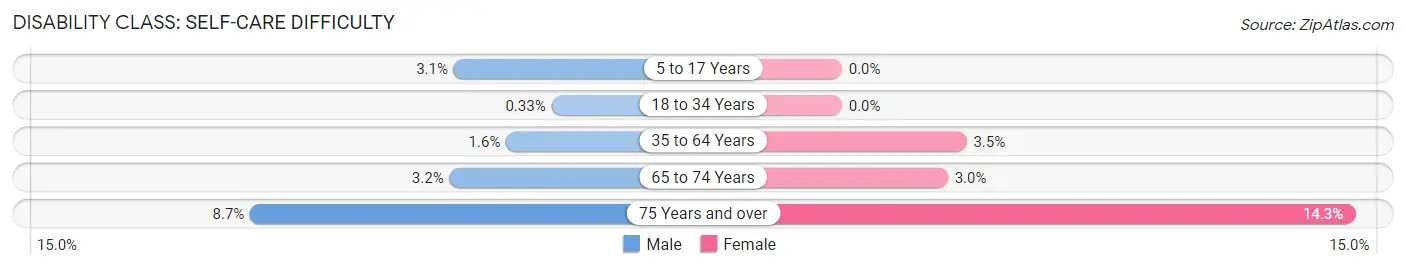
| Age Bracket | Male | Female |
| 5 to 17 Years | 59 (3.0%) | 0 (0.0%) |
| 18 to 34 Years | 10 (0.3%) | 0 (0.0%) |
| 35 to 64 Years | 89 (1.6%) | 211 (3.5%) |
| 65 to 74 Years | 47 (3.2%) | 43 (2.9%) |
| 75 Years and over | 85 (8.7%) | 208 (14.3%) |
Technology Access in East Haven
Computing Device Access in East Haven
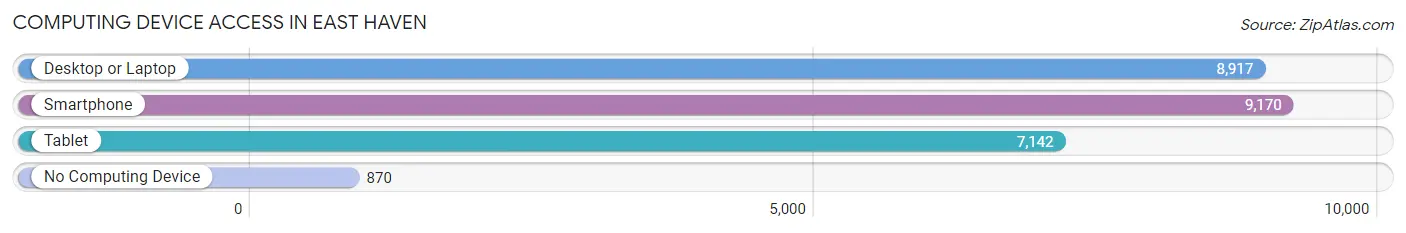
| Device Type | # Households | % Households |
| Desktop or Laptop | 8,917 | 80.9% |
| Smartphone | 9,170 | 83.2% |
| Tablet | 7,142 | 64.8% |
| No Computing Device | 870 | 7.9% |
| Total | 11,028 | 100.0% |
Internet Access in East Haven
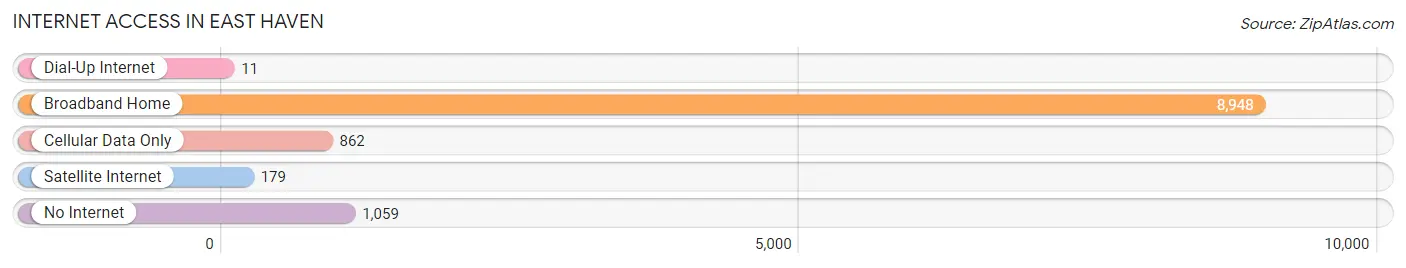
| Internet Type | # Households | % Households |
| Dial-Up Internet | 11 | 0.1% |
| Broadband Home | 8,948 | 81.1% |
| Cellular Data Only | 862 | 7.8% |
| Satellite Internet | 179 | 1.6% |
| No Internet | 1,059 | 9.6% |
| Total | 11,028 | 100.0% |
East Haven Summary
History
East Haven, Connecticut is a small town located in New Haven County, Connecticut. It is situated on the Long Island Sound and is bordered by the towns of Branford, North Branford, and North Haven. The town was first settled in 1638 by Puritan settlers from New Haven and was originally known as “Oyster River”. The town was officially incorporated in 1785 and was renamed East Haven in 1822.
East Haven has a rich history of industry and commerce. In the 19th century, the town was home to several factories, including a paper mill, a grist mill, and a saw mill. The town was also home to several shipyards, which built ships for the US Navy during the Civil War. In the 20th century, East Haven was home to several manufacturing companies, including the East Haven Manufacturing Company, which produced a variety of products, including furniture, tools, and toys.
Geography
East Haven is located in New Haven County, Connecticut. It is situated on the Long Island Sound and is bordered by the towns of Branford, North Branford, and North Haven. The town covers an area of 8.7 square miles and has a population of 28,959 people, as of the 2010 census.
The town is divided into two distinct sections: the East Shore and the West Shore. The East Shore is located along the Long Island Sound and is home to several beaches, including Silver Sands State Park and Cosey Beach. The West Shore is located inland and is home to several parks, including East Haven Town Park and East Haven Green.
Economy
East Haven’s economy is largely based on tourism and manufacturing. The town is home to several tourist attractions, including Silver Sands State Park and Cosey Beach. The town is also home to several manufacturing companies, including the East Haven Manufacturing Company, which produces a variety of products, including furniture, tools, and toys.
The town is also home to several retail stores, restaurants, and other businesses. The town is served by the Metro-North Railroad, which provides commuter rail service to New Haven and other nearby towns.
Demographics
As of the 2010 census, East Haven had a population of 28,959 people. The racial makeup of the town was 87.3% White, 5.2% African American, 0.5% Native American, 2.2% Asian, 0.1% Pacific Islander, 2.2% from other races, and 2.5% from two or more races. Hispanic or Latino of any race were 8.2% of the population.
The median income for a household in East Haven was $60,945, and the median income for a family was $71,945. The per capita income for the town was $27,945. About 5.2% of families and 7.2% of the population were below the poverty line, including 8.2% of those under age 18 and 6.2% of those age 65 or over.
Common Questions
What is Per Capita Income in East Haven?
Per Capita income in East Haven is $41,397.
What is the Median Family Income in East Haven?
Median Family Income in East Haven is $104,821.
What is the Median Household income in East Haven?
Median Household Income in East Haven is $83,489.
What is Income or Wage Gap in East Haven?
Income or Wage Gap in East Haven is 25.4%.
Women in East Haven earn 74.6 cents for every dollar earned by a man.
What is Inequality or Gini Index in East Haven?
Inequality or Gini Index in East Haven is 0.41.
What is the Total Population of East Haven?
Total Population of East Haven is 27,871.
What is the Total Male Population of East Haven?
Total Male Population of East Haven is 13,586.
What is the Total Female Population of East Haven?
Total Female Population of East Haven is 14,285.
What is the Ratio of Males per 100 Females in East Haven?
There are 95.11 Males per 100 Females in East Haven.
What is the Ratio of Females per 100 Males in East Haven?
There are 105.15 Females per 100 Males in East Haven.
What is the Median Population Age in East Haven?
Median Population Age in East Haven is 45.1 Years.
What is the Average Family Size in East Haven
Average Family Size in East Haven is 3.1 People.
What is the Average Household Size in East Haven
Average Household Size in East Haven is 2.5 People.
How Large is the Labor Force in East Haven?
There are 15,274 People in the Labor Forcein in East Haven.
What is the Percentage of People in the Labor Force in East Haven?
63.5% of People are in the Labor Force in East Haven.
What is the Unemployment Rate in East Haven?
Unemployment Rate in East Haven is 5.0%.