Canton Valley, CT Map & Demographics
Canton Valley Map
Canton Valley Overview
$41,879
PER CAPITA INCOME
$84,038
AVG FAMILY INCOME
$70,389
AVG HOUSEHOLD INCOME
0.44
INEQUALITY / GINI INDEX
1,484
TOTAL POPULATION
756
MALE POPULATION
728
FEMALE POPULATION
103.85
MALES / 100 FEMALES
96.30
FEMALES / 100 MALES
40.3
MEDIAN AGE
2.6
AVG FAMILY SIZE
2.0
AVG HOUSEHOLD SIZE
676
LABOR FORCE [ PEOPLE ]
54.2%
PERCENT IN LABOR FORCE
0.3%
UNEMPLOYMENT RATE
Income in Canton Valley
Income Overview in Canton Valley
Per Capita Income in Canton Valley is $41,879, while median incomes of families and households are $84,038 and $70,389 respectively.
| Characteristic | Number | Measure |
| Per Capita Income | 1,484 | $41,879 |
| Median Family Income | 418 | $84,038 |
| Mean Family Income | 418 | $109,781 |
| Median Household Income | 723 | $70,389 |
| Mean Household Income | 723 | $85,475 |
| Income Deficit | 418 | $0 |
| Wage / Income Gap (%) | 1,484 | 0.00% |
| Wage / Income Gap ($) | 1,484 | 100.00¢ per $1 |
| Gini / Inequality Index | 1,484 | 0.44 |
Earnings by Sex in Canton Valley
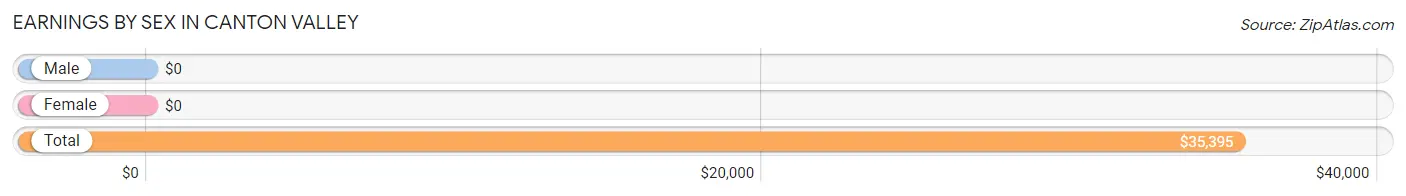
| Sex | Number | Average Earnings |
| Male | 436 (54.6%) | $0 |
| Female | 362 (45.4%) | $0 |
| Total | 798 (100.0%) | $35,395 |
Earnings by Sex by Income Bracket in Canton Valley
The most common earnings brackets in Canton Valley are $100,000+ for men (106 | 24.3%) and $7,500 to $9,999 for women (73 | 20.2%).
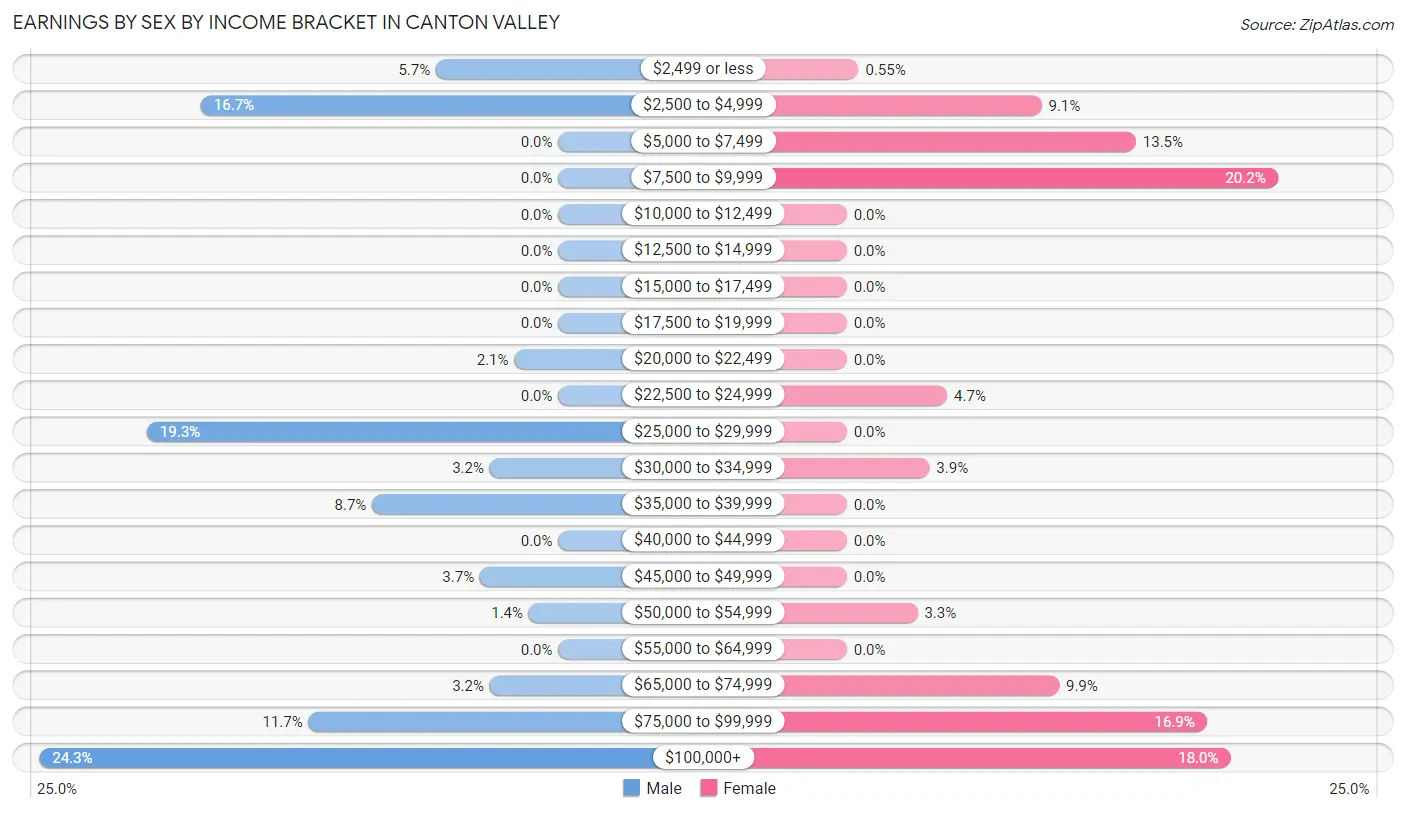
| Income | Male | Female |
| $2,499 or less | 25 (5.7%) | 2 (0.5%) |
| $2,500 to $4,999 | 73 (16.7%) | 33 (9.1%) |
| $5,000 to $7,499 | 0 (0.0%) | 49 (13.5%) |
| $7,500 to $9,999 | 0 (0.0%) | 73 (20.2%) |
| $10,000 to $12,499 | 0 (0.0%) | 0 (0.0%) |
| $12,500 to $14,999 | 0 (0.0%) | 0 (0.0%) |
| $15,000 to $17,499 | 0 (0.0%) | 0 (0.0%) |
| $17,500 to $19,999 | 0 (0.0%) | 0 (0.0%) |
| $20,000 to $22,499 | 9 (2.1%) | 0 (0.0%) |
| $22,500 to $24,999 | 0 (0.0%) | 17 (4.7%) |
| $25,000 to $29,999 | 84 (19.3%) | 0 (0.0%) |
| $30,000 to $34,999 | 14 (3.2%) | 14 (3.9%) |
| $35,000 to $39,999 | 38 (8.7%) | 0 (0.0%) |
| $40,000 to $44,999 | 0 (0.0%) | 0 (0.0%) |
| $45,000 to $49,999 | 16 (3.7%) | 0 (0.0%) |
| $50,000 to $54,999 | 6 (1.4%) | 12 (3.3%) |
| $55,000 to $64,999 | 0 (0.0%) | 0 (0.0%) |
| $65,000 to $74,999 | 14 (3.2%) | 36 (9.9%) |
| $75,000 to $99,999 | 51 (11.7%) | 61 (16.9%) |
| $100,000+ | 106 (24.3%) | 65 (18.0%) |
| Total | 436 (100.0%) | 362 (100.0%) |
Earnings by Sex by Educational Attainment in Canton Valley
Average earnings in Canton Valley are $80,556 for men and $70,066 for women, a difference of 13.0%. Men with an educational attainment of college or associate's degree enjoy the highest average annual earnings of $81,354, while those with college or associate's degree education earn the least with $81,354. Women with an educational attainment of bachelor's degree earn the most with the average annual earnings of $92,692, while those with graduate degree education have the smallest earnings of $88,333.
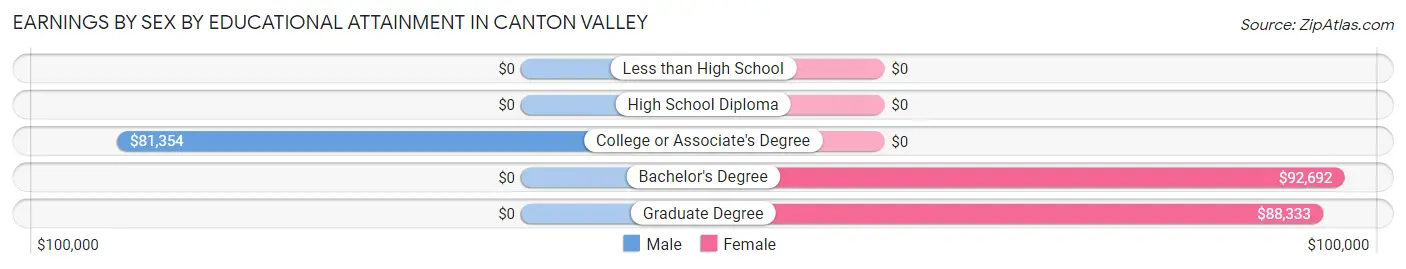
| Educational Attainment | Male Income | Female Income |
| Less than High School | - | - |
| High School Diploma | - | - |
| College or Associate's Degree | $81,354 | $0 |
| Bachelor's Degree | - | - |
| Graduate Degree | - | - |
| Total | $80,556 | $70,066 |
Family Income in Canton Valley
Family Income Brackets in Canton Valley
According to the Canton Valley family income data, there are 94 families falling into the $75,000 to $99,999 income range, which is the most common income bracket and makes up 22.5% of all families.
| Income Bracket | # Families | % Families |
| Less than $10,000 | 0 | 0.0% |
| $10,000 to $14,999 | 0 | 0.0% |
| $15,000 to $24,999 | 59 | 14.1% |
| $25,000 to $34,999 | 0 | 0.0% |
| $35,000 to $49,999 | 84 | 20.1% |
| $50,000 to $74,999 | 43 | 10.3% |
| $75,000 to $99,999 | 94 | 22.5% |
| $100,000 to $149,999 | 2 | 0.5% |
| $150,000 to $199,999 | 59 | 14.1% |
| $200,000+ | 77 | 18.4% |
Family Income by Famaliy Size in Canton Valley
4-person families (32 | 7.7%) account for the highest median family income in Canton Valley with $177,083 per family, while 4-person families (32 | 7.7%) have the highest median income of $44,271 per family member.
| Income Bracket | # Families | Median Income |
| 2-Person Families | 288 (68.9%) | $55,167 |
| 3-Person Families | 62 (14.8%) | $0 |
| 4-Person Families | 32 (7.7%) | $177,083 |
| 5-Person Families | 36 (8.6%) | $0 |
| 6-Person Families | 0 (0.0%) | $0 |
| 7+ Person Families | 0 (0.0%) | $0 |
| Total | 418 (100.0%) | $84,038 |
Family Income by Number of Earners in Canton Valley
| Number of Earners | # Families | Median Income |
| No Earners | 68 (16.3%) | $70,625 |
| 1 Earner | 180 (43.1%) | $38,836 |
| 2 Earners | 170 (40.7%) | $199,200 |
| 3+ Earners | 0 (0.0%) | $0 |
| Total | 418 (100.0%) | $84,038 |
Household Income in Canton Valley
Household Income Brackets in Canton Valley
With 149 households falling in the category, the $15,000 to $24,999 income range is the most frequent in Canton Valley, accounting for 20.6% of all households.
| Income Bracket | # Households | % Households |
| Less than $10,000 | 0 | 0.0% |
| $10,000 to $14,999 | 17 | 2.4% |
| $15,000 to $24,999 | 149 | 20.6% |
| $25,000 to $34,999 | 11 | 1.5% |
| $35,000 to $49,999 | 137 | 18.9% |
| $50,000 to $74,999 | 113 | 15.6% |
| $75,000 to $99,999 | 123 | 17.0% |
| $100,000 to $149,999 | 37 | 5.1% |
| $150,000 to $199,999 | 59 | 8.2% |
| $200,000+ | 77 | 10.7% |
Household Income by Householder Age in Canton Valley
The median household income in Canton Valley is $70,389, with the highest median household income of $88,155 found in the 25 to 44 years age bracket for the primary householder. A total of 145 households (20.1%) fall into this category.
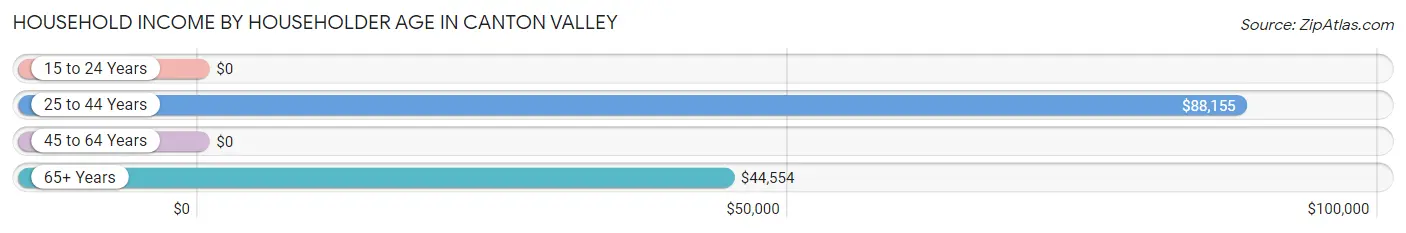
| Income Bracket | # Households | Median Income |
| 15 to 24 Years | 0 (0.0%) | $0 |
| 25 to 44 Years | 145 (20.1%) | $88,155 |
| 45 to 64 Years | 273 (37.8%) | $0 |
| 65+ Years | 305 (42.2%) | $44,554 |
| Total | 723 (100.0%) | $70,389 |
Poverty in Canton Valley
Income Below Poverty by Sex and Age in Canton Valley
With 2.2% poverty level for males and 10.0% for females among the residents of Canton Valley, 55 to 64 year old males and 18 to 24 year old females are the most vulnerable to poverty, with 17 males (14.4%) and 73 females (100.0%) in their respective age groups living below the poverty level.
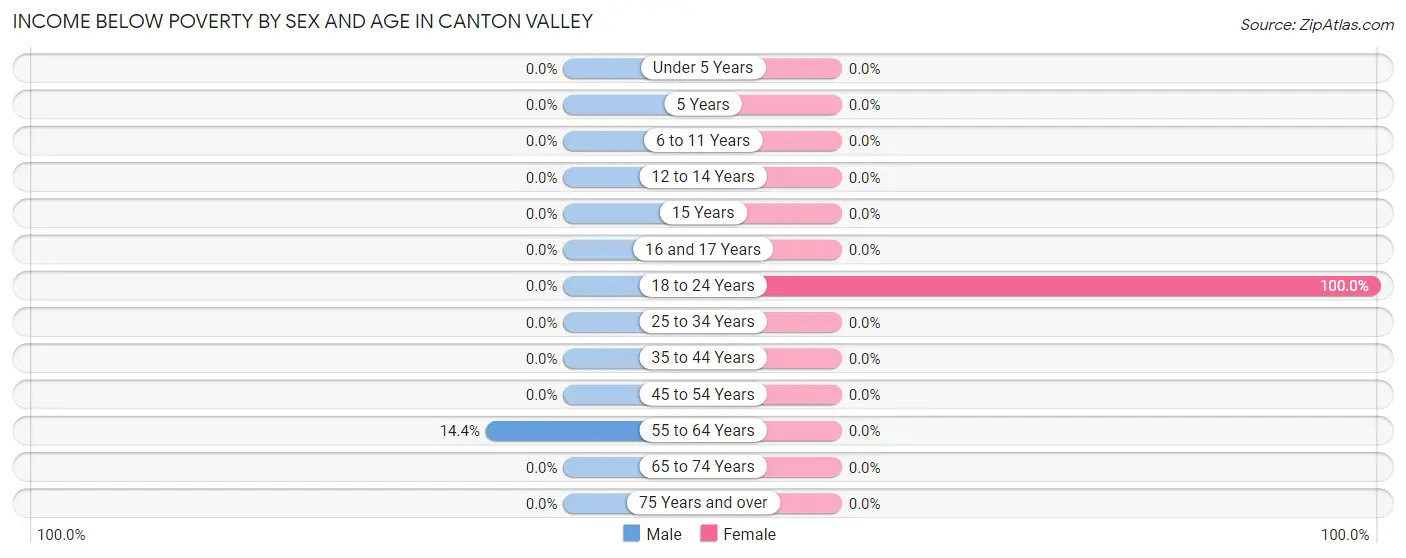
| Age Bracket | Male | Female |
| Under 5 Years | 0 (0.0%) | 0 (0.0%) |
| 5 Years | 0 (0.0%) | 0 (0.0%) |
| 6 to 11 Years | 0 (0.0%) | 0 (0.0%) |
| 12 to 14 Years | 0 (0.0%) | 0 (0.0%) |
| 15 Years | 0 (0.0%) | 0 (0.0%) |
| 16 and 17 Years | 0 (0.0%) | 0 (0.0%) |
| 18 to 24 Years | 0 (0.0%) | 73 (100.0%) |
| 25 to 34 Years | 0 (0.0%) | 0 (0.0%) |
| 35 to 44 Years | 0 (0.0%) | 0 (0.0%) |
| 45 to 54 Years | 0 (0.0%) | 0 (0.0%) |
| 55 to 64 Years | 17 (14.4%) | 0 (0.0%) |
| 65 to 74 Years | 0 (0.0%) | 0 (0.0%) |
| 75 Years and over | 0 (0.0%) | 0 (0.0%) |
| Total | 17 (2.2%) | 73 (10.0%) |
Income Above Poverty by Sex and Age in Canton Valley
According to the poverty statistics in Canton Valley, males aged under 5 years and females aged under 5 years are the age groups that are most secure financially, with 100.0% of males and 100.0% of females in these age groups living above the poverty line.
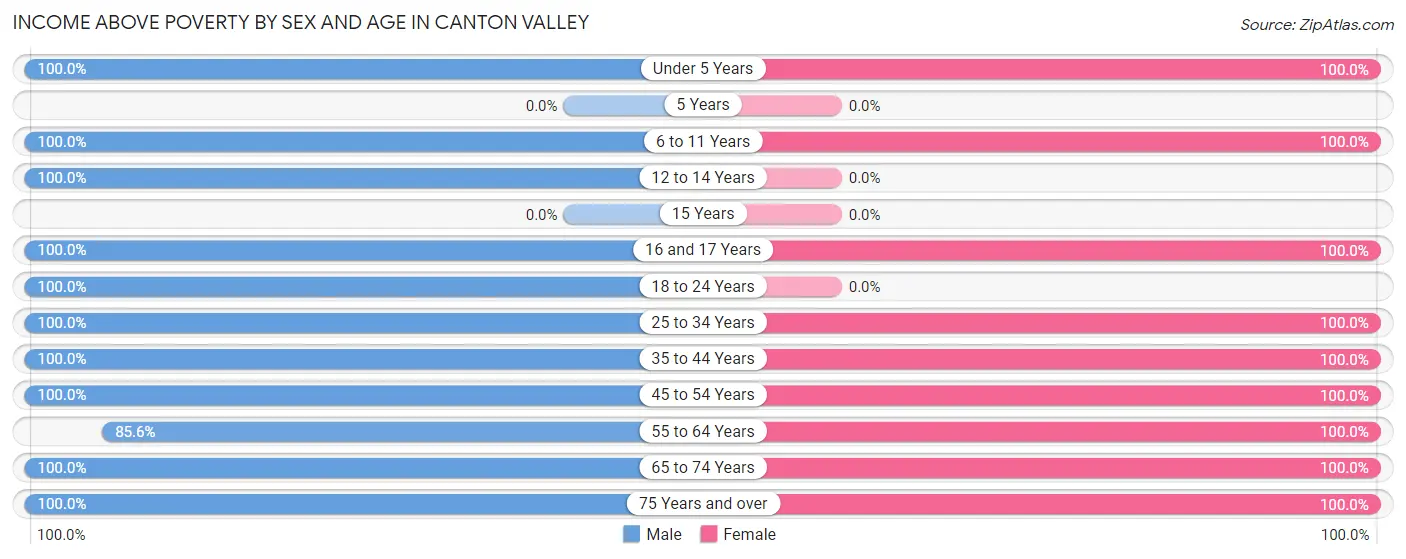
| Age Bracket | Male | Female |
| Under 5 Years | 45 (100.0%) | 61 (100.0%) |
| 5 Years | 0 (0.0%) | 0 (0.0%) |
| 6 to 11 Years | 50 (100.0%) | 35 (100.0%) |
| 12 to 14 Years | 46 (100.0%) | 0 (0.0%) |
| 15 Years | 0 (0.0%) | 0 (0.0%) |
| 16 and 17 Years | 25 (100.0%) | 34 (100.0%) |
| 18 to 24 Years | 143 (100.0%) | 0 (0.0%) |
| 25 to 34 Years | 93 (100.0%) | 79 (100.0%) |
| 35 to 44 Years | 24 (100.0%) | 98 (100.0%) |
| 45 to 54 Years | 56 (100.0%) | 44 (100.0%) |
| 55 to 64 Years | 101 (85.6%) | 75 (100.0%) |
| 65 to 74 Years | 112 (100.0%) | 136 (100.0%) |
| 75 Years and over | 44 (100.0%) | 93 (100.0%) |
| Total | 739 (97.8%) | 655 (90.0%) |
Income Below Poverty Among Married-Couple Families in Canton Valley
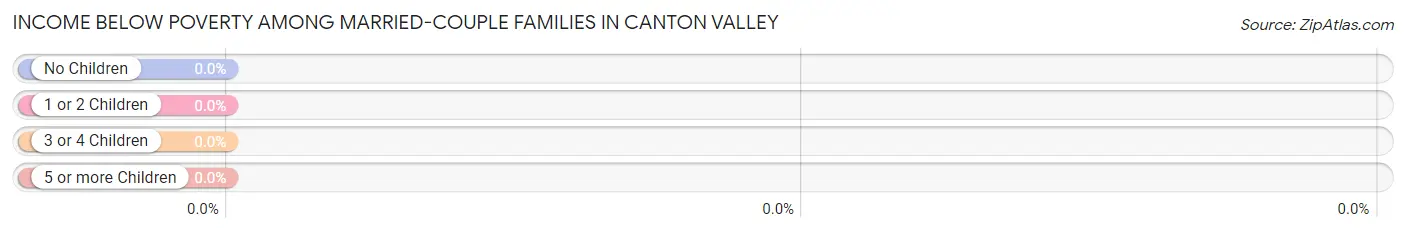
| Children | Above Poverty | Below Poverty |
| No Children | 88 (100.0%) | 0 (0.0%) |
| 1 or 2 Children | 92 (100.0%) | 0 (0.0%) |
| 3 or 4 Children | 36 (100.0%) | 0 (0.0%) |
| 5 or more Children | 0 (0.0%) | 0 (0.0%) |
| Total | 216 (100.0%) | 0 (0.0%) |
Income Below Poverty Among Single-Parent Households in Canton Valley
| Children | Single Father | Single Mother |
| No Children | 0 (0.0%) | 0 (0.0%) |
| 1 or 2 Children | 0 (0.0%) | 0 (0.0%) |
| 3 or 4 Children | 0 (0.0%) | 0 (0.0%) |
| 5 or more Children | 0 (0.0%) | 0 (0.0%) |
| Total | 0 (0.0%) | 0 (0.0%) |
Income Below Poverty Among Married-Couple vs Single-Parent Households in Canton Valley
| Children | Married-Couple Families | Single-Parent Households |
| No Children | 0 (0.0%) | 0 (0.0%) |
| 1 or 2 Children | 0 (0.0%) | 0 (0.0%) |
| 3 or 4 Children | 0 (0.0%) | 0 (0.0%) |
| 5 or more Children | 0 (0.0%) | 0 (0.0%) |
| Total | 0 (0.0%) | 0 (0.0%) |
Race in Canton Valley
The most populous races in Canton Valley are White / Caucasian (1,484 | 100.0%), and Hispanic or Latino (17 | 1.1%).
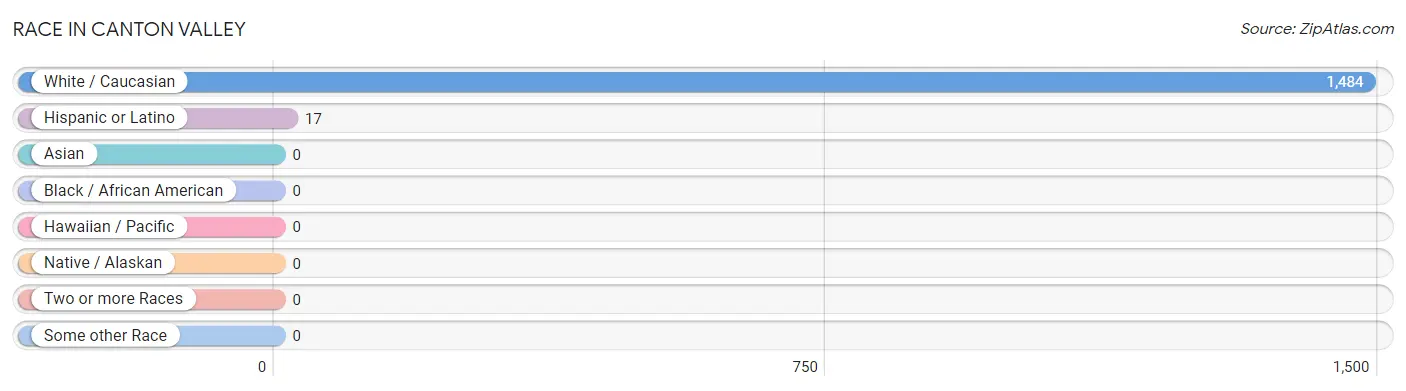
| Race | # Population | % Population |
| Asian | 0 | 0.0% |
| Black / African American | 0 | 0.0% |
| Hawaiian / Pacific | 0 | 0.0% |
| Hispanic or Latino | 17 | 1.1% |
| Native / Alaskan | 0 | 0.0% |
| White / Caucasian | 1,484 | 100.0% |
| Two or more Races | 0 | 0.0% |
| Some other Race | 0 | 0.0% |
| Total | 1,484 | 100.0% |
Ancestry in Canton Valley
The most populous ancestries reported in Canton Valley are Irish (382 | 25.7%), French (325 | 21.9%), Polish (256 | 17.2%), German (223 | 15.0%), and Italian (178 | 12.0%), together accounting for 91.9% of all Canton Valley residents.
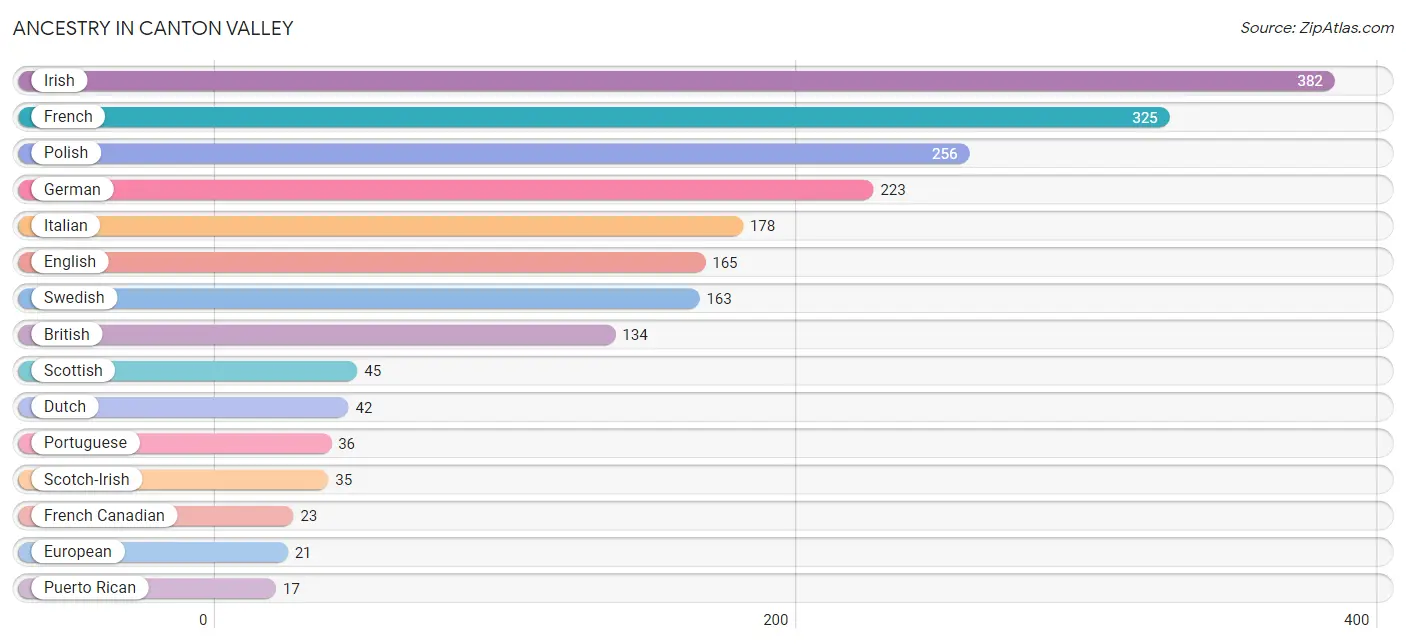
| Ancestry | # Population | % Population |
| American | 9 | 0.6% |
| British | 134 | 9.0% |
| Dutch | 42 | 2.8% |
| English | 165 | 11.1% |
| European | 21 | 1.4% |
| French | 325 | 21.9% |
| French Canadian | 23 | 1.5% |
| German | 223 | 15.0% |
| Irish | 382 | 25.7% |
| Italian | 178 | 12.0% |
| Polish | 256 | 17.2% |
| Portuguese | 36 | 2.4% |
| Puerto Rican | 17 | 1.1% |
| Russian | 15 | 1.0% |
| Scotch-Irish | 35 | 2.4% |
| Scottish | 45 | 3.0% |
| Swedish | 163 | 11.0% | View All 17 Rows |
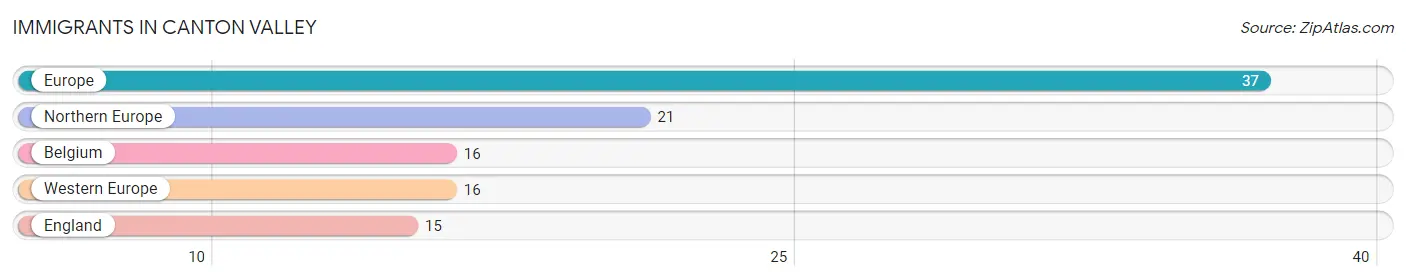
Immigrants in Canton Valley
The most numerous immigrant groups reported in Canton Valley came from Europe (37 | 2.5%), Northern Europe (21 | 1.4%), Belgium (16 | 1.1%), Western Europe (16 | 1.1%), and England (15 | 1.0%), together accounting for 7.1% of all Canton Valley residents.
| Immigration Origin | # Population | % Population |
| Belgium | 16 | 1.1% |
| England | 15 | 1.0% |
| Europe | 37 | 2.5% |
| Northern Europe | 21 | 1.4% |
| Western Europe | 16 | 1.1% | View All 5 Rows |
Sex and Age in Canton Valley
Sex and Age in Canton Valley
The most populous age groups in Canton Valley are 60 to 64 Years (101 | 13.4%) for men and 65 to 69 Years (80 | 11.0%) for women.
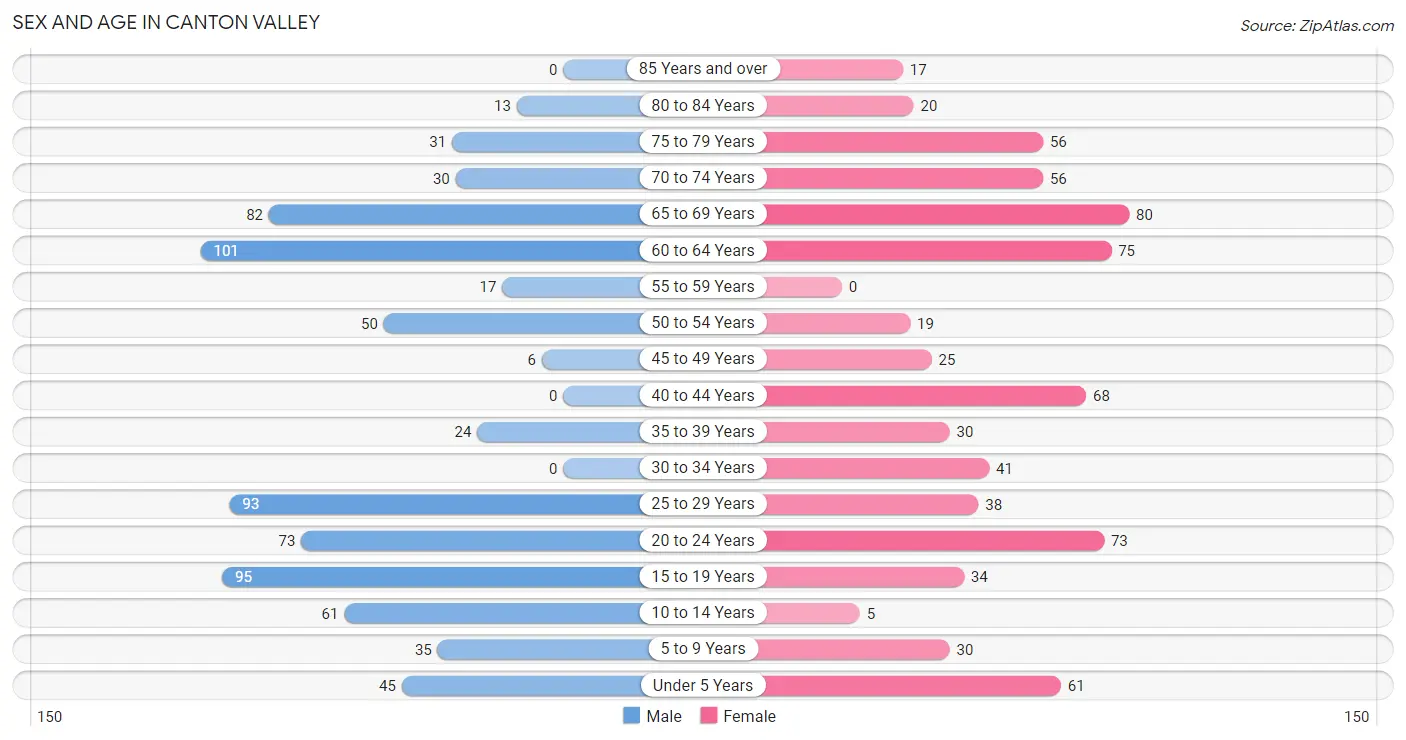
| Age Bracket | Male | Female |
| Under 5 Years | 45 (5.9%) | 61 (8.4%) |
| 5 to 9 Years | 35 (4.6%) | 30 (4.1%) |
| 10 to 14 Years | 61 (8.1%) | 5 (0.7%) |
| 15 to 19 Years | 95 (12.6%) | 34 (4.7%) |
| 20 to 24 Years | 73 (9.7%) | 73 (10.0%) |
| 25 to 29 Years | 93 (12.3%) | 38 (5.2%) |
| 30 to 34 Years | 0 (0.0%) | 41 (5.6%) |
| 35 to 39 Years | 24 (3.2%) | 30 (4.1%) |
| 40 to 44 Years | 0 (0.0%) | 68 (9.3%) |
| 45 to 49 Years | 6 (0.8%) | 25 (3.4%) |
| 50 to 54 Years | 50 (6.6%) | 19 (2.6%) |
| 55 to 59 Years | 17 (2.2%) | 0 (0.0%) |
| 60 to 64 Years | 101 (13.4%) | 75 (10.3%) |
| 65 to 69 Years | 82 (10.8%) | 80 (11.0%) |
| 70 to 74 Years | 30 (4.0%) | 56 (7.7%) |
| 75 to 79 Years | 31 (4.1%) | 56 (7.7%) |
| 80 to 84 Years | 13 (1.7%) | 20 (2.8%) |
| 85 Years and over | 0 (0.0%) | 17 (2.3%) |
| Total | 756 (100.0%) | 728 (100.0%) |
Families and Households in Canton Valley
Median Family Size in Canton Valley
The median family size in Canton Valley is 2.58 persons per family, with married-couple families (216 | 51.7%) accounting for the largest median family size of 3 persons per family. On the other hand, single female/mother families (132 | 31.6%) represent the smallest median family size with 2.11 persons per family.
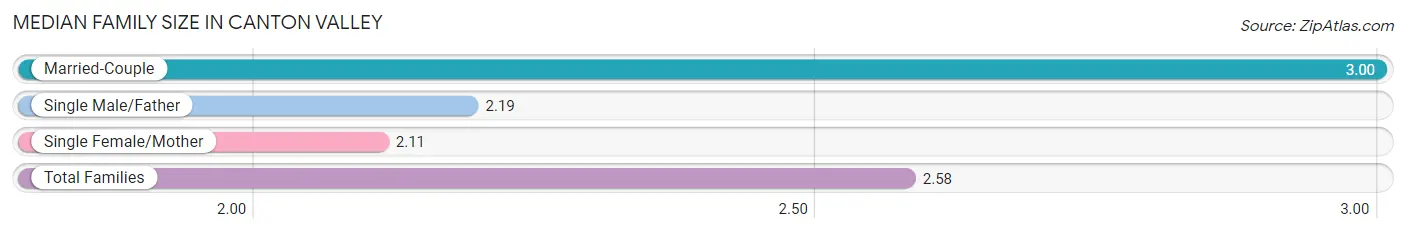
| Family Type | # Families | Family Size |
| Married-Couple | 216 (51.7%) | 3.00 |
| Single Male/Father | 70 (16.8%) | 2.19 |
| Single Female/Mother | 132 (31.6%) | 2.11 |
| Total Families | 418 (100.0%) | 2.58 |
Median Household Size in Canton Valley
The median household size in Canton Valley is 2.05 persons per household, with married-couple households (216 | 29.9%) accounting for the largest median household size of 3 persons per household. non-family households (305 | 42.2%) represent the smallest median household size with 1.04 persons per household.
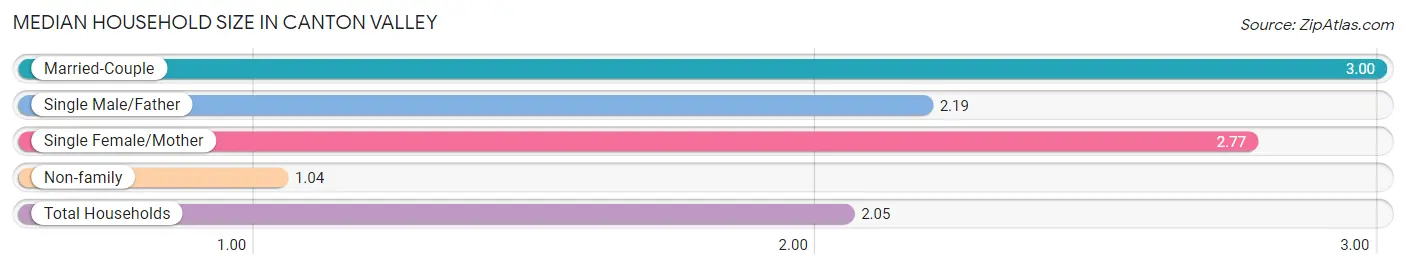
| Household Type | # Households | Household Size |
| Married-Couple | 216 (29.9%) | 3.00 |
| Single Male/Father | 70 (9.7%) | 2.19 |
| Single Female/Mother | 132 (18.3%) | 2.77 |
| Non-family | 305 (42.2%) | 1.04 |
| Total Households | 723 (100.0%) | 2.05 |
Household Size by Marriage Status in Canton Valley
Out of a total of 723 households in Canton Valley, 418 (57.8%) are family households, while 305 (42.2%) are nonfamily households. The most numerous type of family households are 2-person households, comprising 216, and the most common type of nonfamily households are 1-person households, comprising 289.
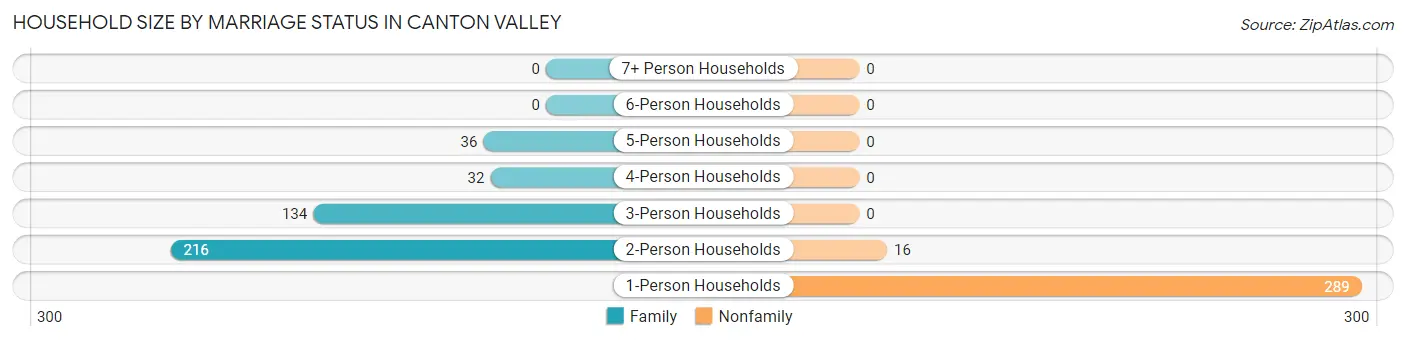
| Household Size | Family Households | Nonfamily Households |
| 1-Person Households | - | 289 (40.0%) |
| 2-Person Households | 216 (29.9%) | 16 (2.2%) |
| 3-Person Households | 134 (18.5%) | 0 (0.0%) |
| 4-Person Households | 32 (4.4%) | 0 (0.0%) |
| 5-Person Households | 36 (5.0%) | 0 (0.0%) |
| 6-Person Households | 0 (0.0%) | 0 (0.0%) |
| 7+ Person Households | 0 (0.0%) | 0 (0.0%) |
| Total | 418 (57.8%) | 305 (42.2%) |
Female Fertility in Canton Valley
Fertility by Age in Canton Valley
Average fertility rate in Canton Valley is 180.0 births per 1,000 women. Women in the age bracket of 20 to 34 years have the highest fertility rate with 388.0 births per 1,000 women. Women in the age bracket of 20 to 34 years acount for 100.0% of all women with births.
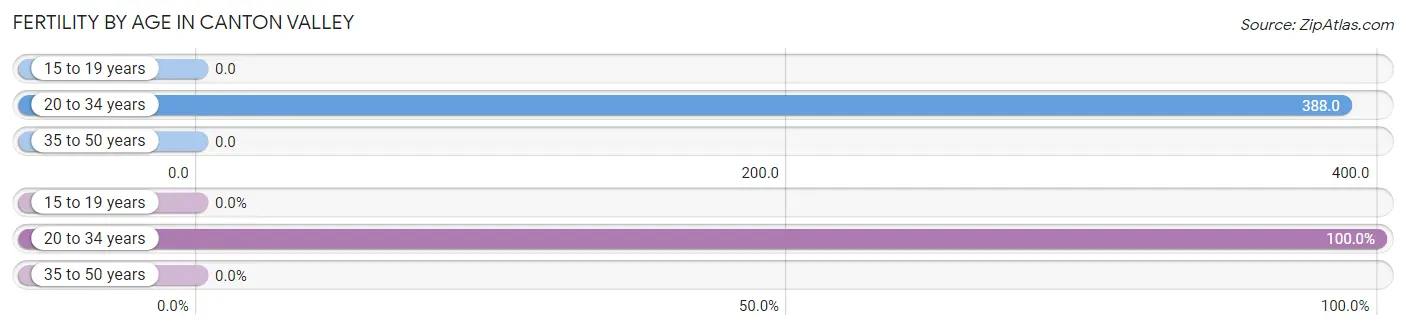
| Age Bracket | Women with Births | Births / 1,000 Women |
| 15 to 19 years | 0 (0.0%) | 0.0 |
| 20 to 34 years | 59 (100.0%) | 388.0 |
| 35 to 50 years | 0 (0.0%) | 0.0 |
| Total | 59 (100.0%) | 180.0 |
Fertility by Age by Marriage Status in Canton Valley
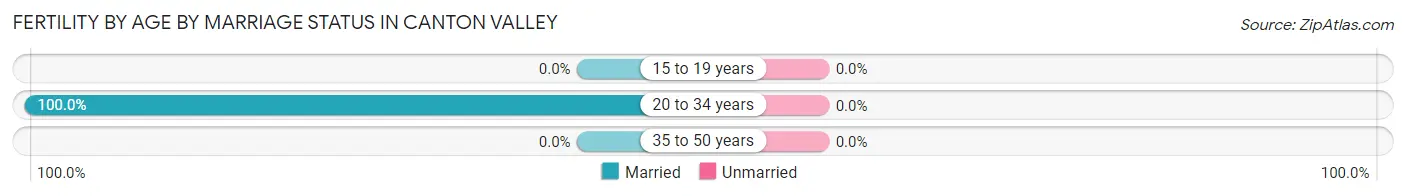
| Age Bracket | Married | Unmarried |
| 15 to 19 years | 0 (0.0%) | 0 (0.0%) |
| 20 to 34 years | 59 (100.0%) | 0 (0.0%) |
| 35 to 50 years | 0 (0.0%) | 0 (0.0%) |
| Total | 59 (100.0%) | 0 (0.0%) |
Fertility by Education in Canton Valley
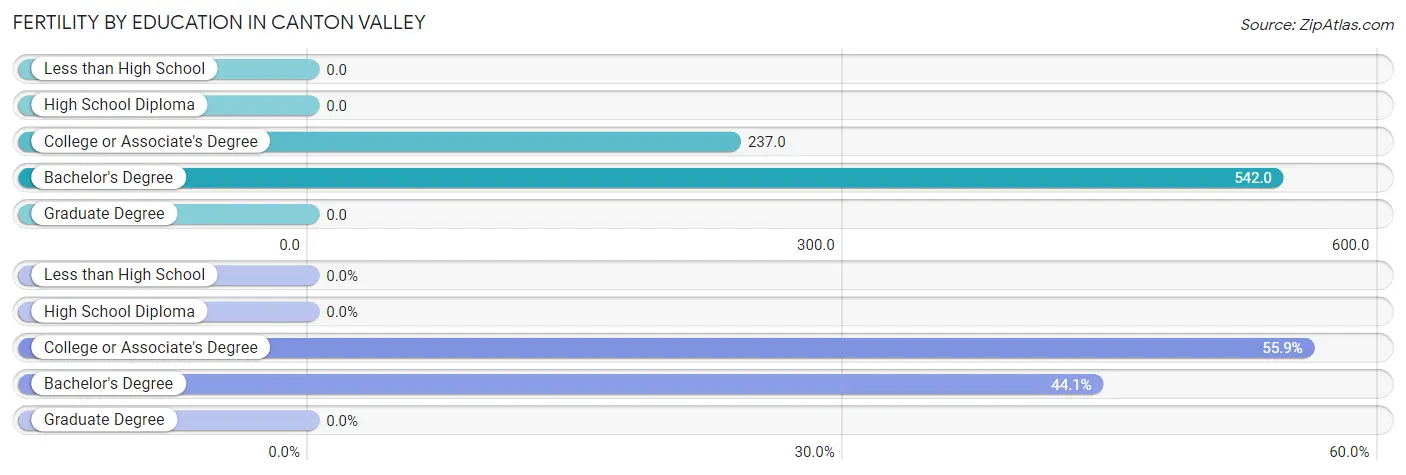
| Educational Attainment | Women with Births | Births / 1,000 Women |
| Less than High School | 0 (0.0%) | 0.0 |
| High School Diploma | 0 (0.0%) | 0.0 |
| College or Associate's Degree | 33 (55.9%) | 237.0 |
| Bachelor's Degree | 26 (44.1%) | 542.0 |
| Graduate Degree | 0 (0.0%) | 0.0 |
| Total | 59 (100.0%) | 180.0 |
Fertility by Education by Marriage Status in Canton Valley
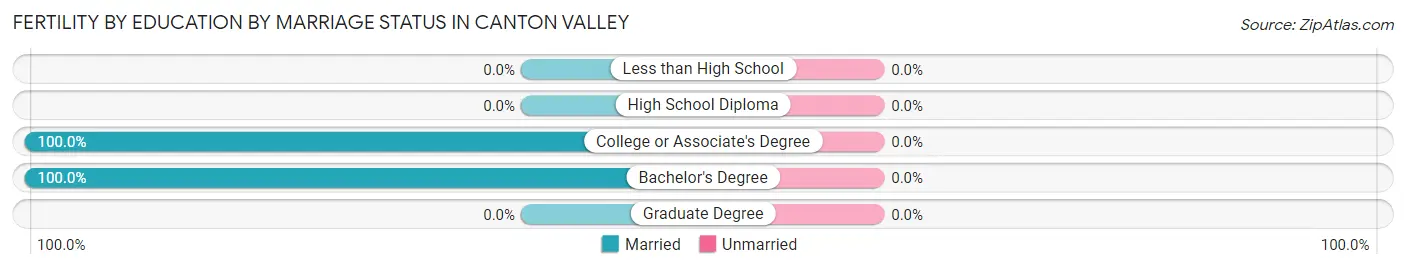
| Educational Attainment | Married | Unmarried |
| Less than High School | 0 (0.0%) | 0 (0.0%) |
| High School Diploma | 0 (0.0%) | 0 (0.0%) |
| College or Associate's Degree | 33 (100.0%) | 0 (0.0%) |
| Bachelor's Degree | 26 (100.0%) | 0 (0.0%) |
| Graduate Degree | 0 (0.0%) | 0 (0.0%) |
| Total | 59 (100.0%) | 0 (0.0%) |
Employment Characteristics in Canton Valley
Employment by Class of Employer in Canton Valley
Among the 641 employed individuals in Canton Valley, private company employees (529 | 82.5%), local government employees (64 | 10.0%), and not-for-profit organizations (26 | 4.1%) make up the most common classes of employment.
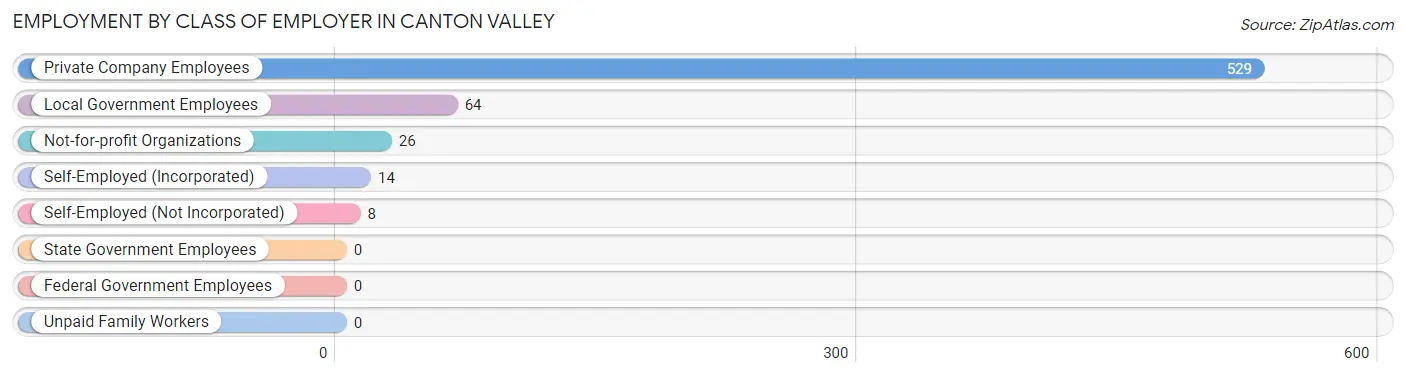
| Employer Class | # Employees | % Employees |
| Private Company Employees | 529 | 82.5% |
| Self-Employed (Incorporated) | 14 | 2.2% |
| Self-Employed (Not Incorporated) | 8 | 1.3% |
| Not-for-profit Organizations | 26 | 4.1% |
| Local Government Employees | 64 | 10.0% |
| State Government Employees | 0 | 0.0% |
| Federal Government Employees | 0 | 0.0% |
| Unpaid Family Workers | 0 | 0.0% |
| Total | 641 | 100.0% |
Employment Status by Age in Canton Valley
According to the labor force statistics for Canton Valley, out of the total population over 16 years of age (1,247), 54.2% or 676 individuals are in the labor force, with 0.3% or 2 of them unemployed. The age group with the highest labor force participation rate is 25 to 29 years, with 100.0% or 131 individuals in the labor force. Within the labor force, the 35 to 44 years age range has the highest percentage of unemployed individuals, with 2.2% or 2 of them being unemployed.
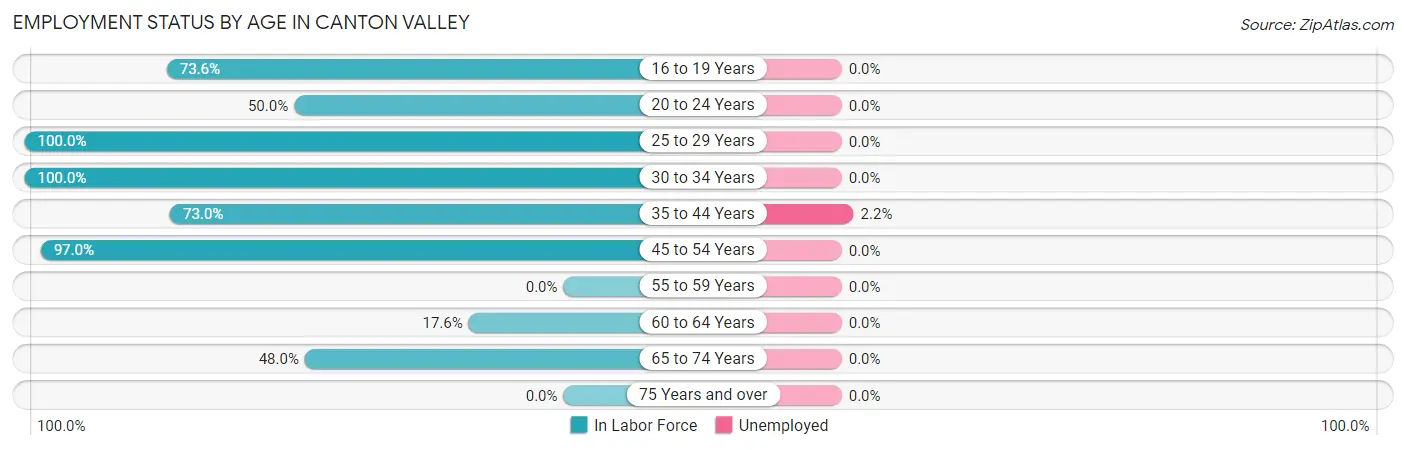
| Age Bracket | In Labor Force | Unemployed |
| 16 to 19 Years | 95 (73.6%) | 0 (0.0%) |
| 20 to 24 Years | 73 (50.0%) | 0 (0.0%) |
| 25 to 29 Years | 131 (100.0%) | 0 (0.0%) |
| 30 to 34 Years | 41 (100.0%) | 0 (0.0%) |
| 35 to 44 Years | 89 (73.0%) | 2 (2.2%) |
| 45 to 54 Years | 97 (97.0%) | 0 (0.0%) |
| 55 to 59 Years | 0 (0.0%) | 0 (0.0%) |
| 60 to 64 Years | 31 (17.6%) | 0 (0.0%) |
| 65 to 74 Years | 119 (48.0%) | 0 (0.0%) |
| 75 Years and over | 0 (0.0%) | 0 (0.0%) |
| Total | 676 (54.2%) | 2 (0.3%) |
Employment Status by Educational Attainment in Canton Valley
According to labor force statistics for Canton Valley, 66.3% of individuals (389) out of the total population between 25 and 64 years of age (587) are in the labor force, with 0.5% or 2 of them being unemployed. The group with the highest labor force participation rate are those with the educational attainment of high school diploma, with 100.0% or 36 individuals in the labor force. Within the labor force, individuals with bachelor's degree or higher education have the highest percentage of unemployment, with 0.7% or 2 of them being unemployed.
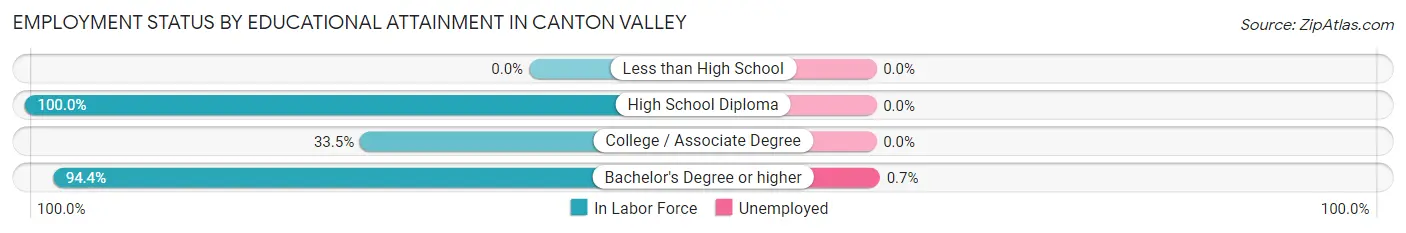
| Educational Attainment | In Labor Force | Unemployed |
| Less than High School | 0 (0.0%) | 0 (0.0%) |
| High School Diploma | 36 (100.0%) | 0 (0.0%) |
| College / Associate Degree | 83 (33.5%) | 0 (0.0%) |
| Bachelor's Degree or higher | 270 (94.4%) | 2 (0.7%) |
| Total | 389 (66.3%) | 3 (0.5%) |
Employment Occupations by Sex in Canton Valley
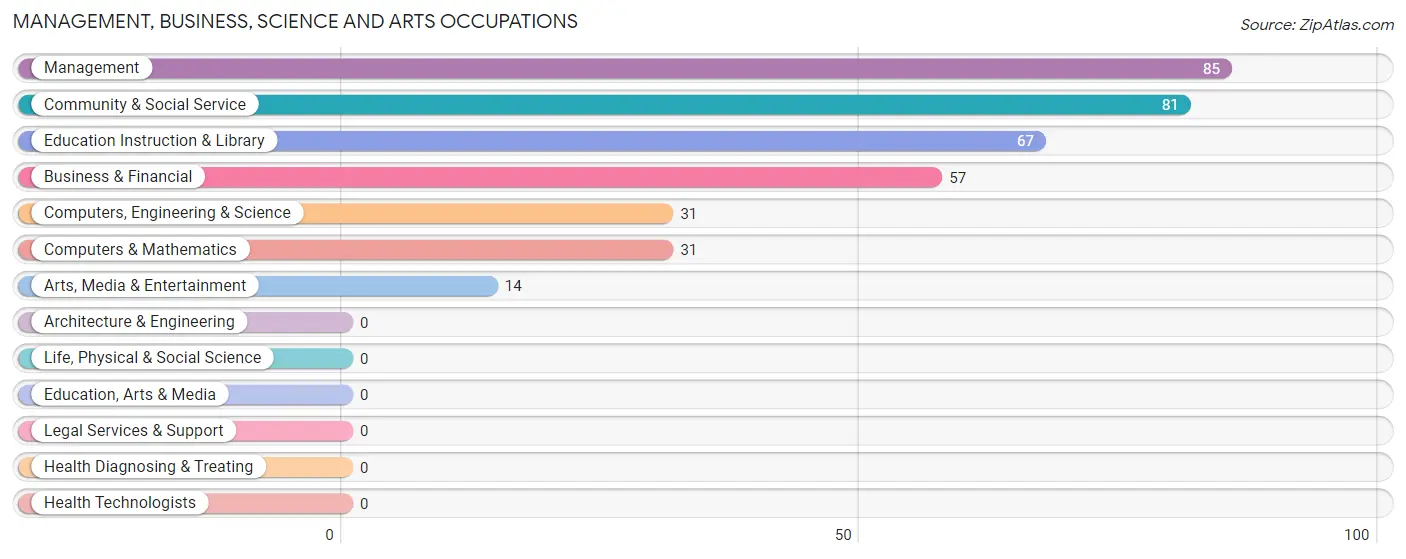
Management, Business, Science and Arts Occupations
The most common Management, Business, Science and Arts occupations in Canton Valley are Management (85 | 12.6%), Community & Social Service (81 | 12.0%), Education Instruction & Library (67 | 9.9%), Business & Financial (57 | 8.5%), and Computers, Engineering & Science (31 | 4.6%).
Management, Business, Science and Arts Occupations by Sex
Within the Management, Business, Science and Arts occupations in Canton Valley, the most male-oriented occupations are Computers, Engineering & Science (100.0%), Computers & Mathematics (100.0%), and Arts, Media & Entertainment (100.0%), while the most female-oriented occupations are Business & Financial (100.0%), Education Instruction & Library (86.6%), and Community & Social Service (71.6%).
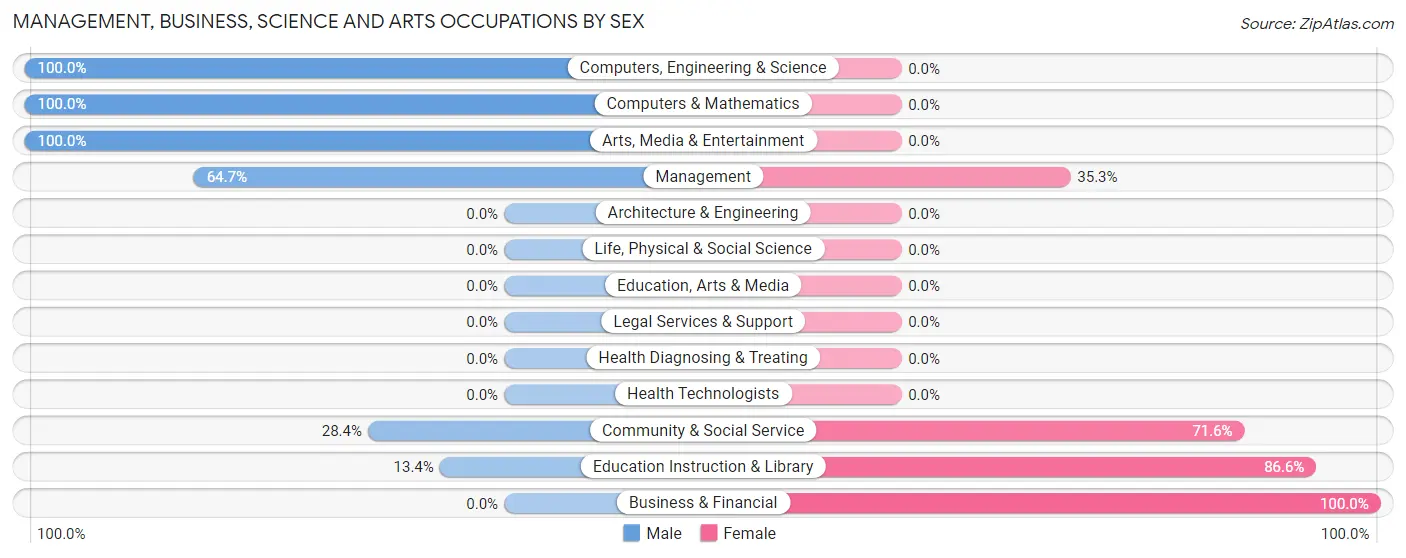
| Occupation | Male | Female |
| Management | 55 (64.7%) | 30 (35.3%) |
| Business & Financial | 0 (0.0%) | 57 (100.0%) |
| Computers, Engineering & Science | 31 (100.0%) | 0 (0.0%) |
| Computers & Mathematics | 31 (100.0%) | 0 (0.0%) |
| Architecture & Engineering | 0 (0.0%) | 0 (0.0%) |
| Life, Physical & Social Science | 0 (0.0%) | 0 (0.0%) |
| Community & Social Service | 23 (28.4%) | 58 (71.6%) |
| Education, Arts & Media | 0 (0.0%) | 0 (0.0%) |
| Legal Services & Support | 0 (0.0%) | 0 (0.0%) |
| Education Instruction & Library | 9 (13.4%) | 58 (86.6%) |
| Arts, Media & Entertainment | 14 (100.0%) | 0 (0.0%) |
| Health Diagnosing & Treating | 0 (0.0%) | 0 (0.0%) |
| Health Technologists | 0 (0.0%) | 0 (0.0%) |
| Total (Category) | 109 (42.9%) | 145 (57.1%) |
| Total (Overall) | 363 (53.9%) | 311 (46.1%) |
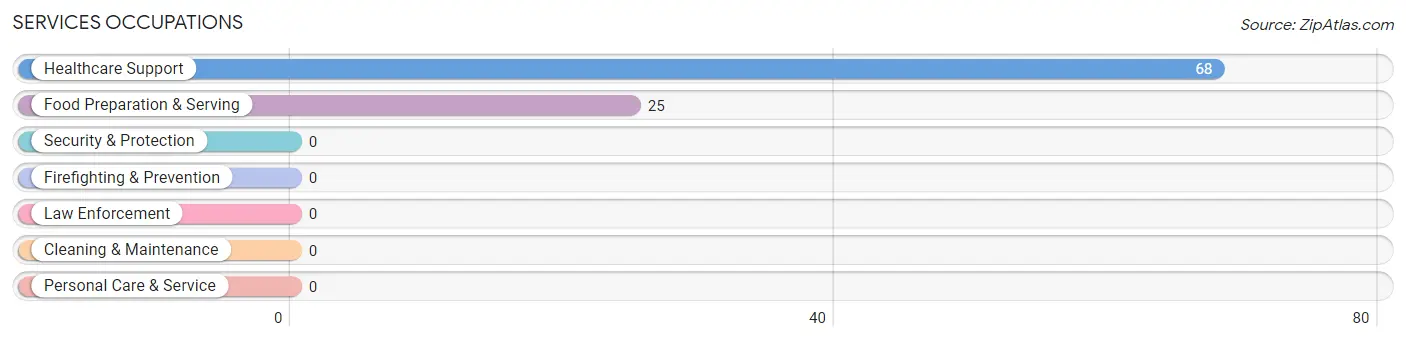
Services Occupations
The most common Services occupations in Canton Valley are Healthcare Support (68 | 10.1%), and Food Preparation & Serving (25 | 3.7%).
Services Occupations by Sex
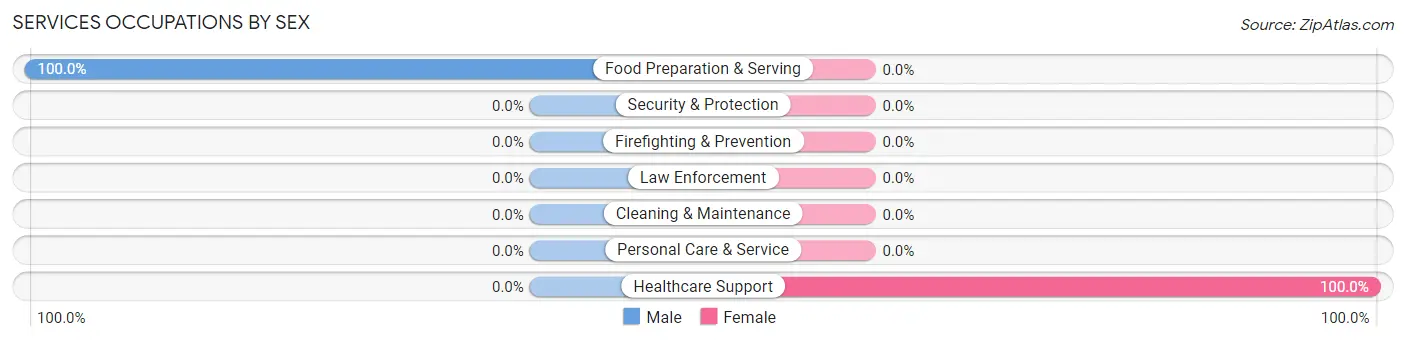
| Occupation | Male | Female |
| Healthcare Support | 0 (0.0%) | 68 (100.0%) |
| Security & Protection | 0 (0.0%) | 0 (0.0%) |
| Firefighting & Prevention | 0 (0.0%) | 0 (0.0%) |
| Law Enforcement | 0 (0.0%) | 0 (0.0%) |
| Food Preparation & Serving | 25 (100.0%) | 0 (0.0%) |
| Cleaning & Maintenance | 0 (0.0%) | 0 (0.0%) |
| Personal Care & Service | 0 (0.0%) | 0 (0.0%) |
| Total (Category) | 25 (26.9%) | 68 (73.1%) |
| Total (Overall) | 363 (53.9%) | 311 (46.1%) |
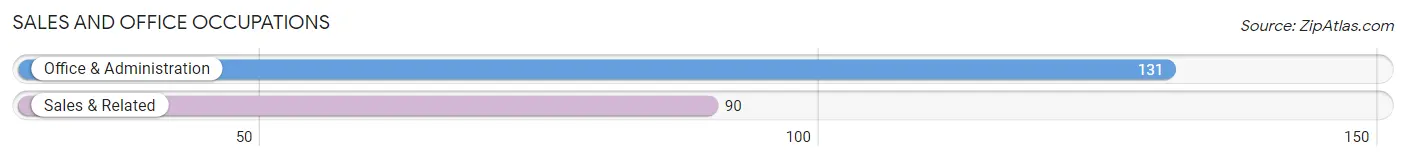
Sales and Office Occupations
The most common Sales and Office occupations in Canton Valley are Office & Administration (131 | 19.4%), and Sales & Related (90 | 13.4%).
Sales and Office Occupations by Sex
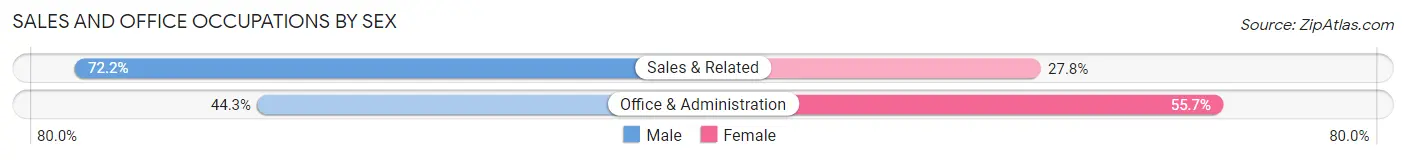
| Occupation | Male | Female |
| Sales & Related | 65 (72.2%) | 25 (27.8%) |
| Office & Administration | 58 (44.3%) | 73 (55.7%) |
| Total (Category) | 123 (55.7%) | 98 (44.3%) |
| Total (Overall) | 363 (53.9%) | 311 (46.1%) |
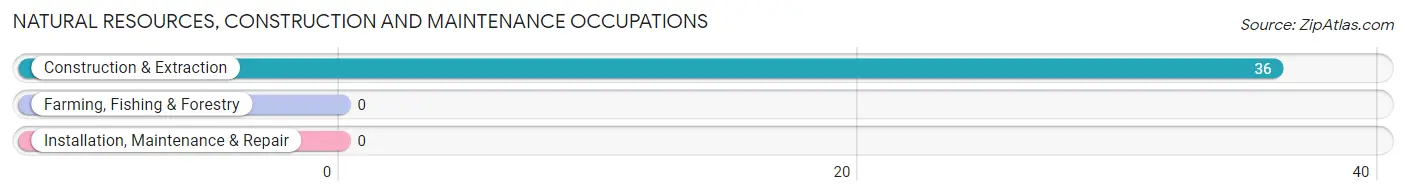
Natural Resources, Construction and Maintenance Occupations
The most common Natural Resources, Construction and Maintenance occupations in Canton Valley are , and Construction & Extraction (36 | 5.3%).
Natural Resources, Construction and Maintenance Occupations by Sex
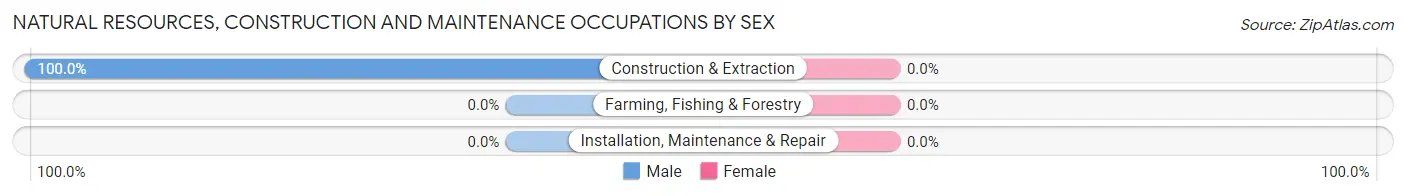
| Occupation | Male | Female |
| Farming, Fishing & Forestry | 0 (0.0%) | 0 (0.0%) |
| Construction & Extraction | 36 (100.0%) | 0 (0.0%) |
| Installation, Maintenance & Repair | 0 (0.0%) | 0 (0.0%) |
| Total (Category) | 36 (100.0%) | 0 (0.0%) |
| Total (Overall) | 363 (53.9%) | 311 (46.1%) |
Production, Transportation and Moving Occupations
The most common Production, Transportation and Moving occupations in Canton Valley are , and Production (70 | 10.4%).
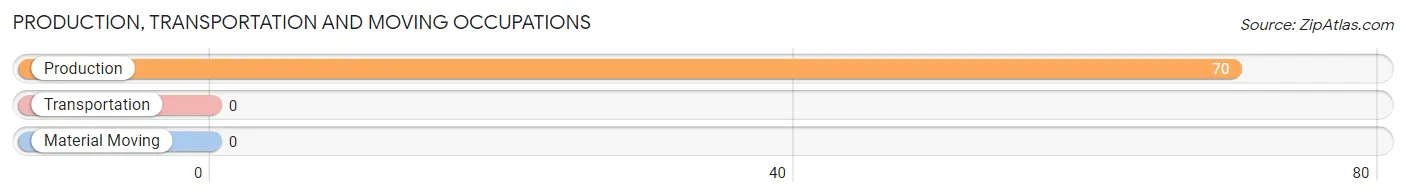
Production, Transportation and Moving Occupations by Sex
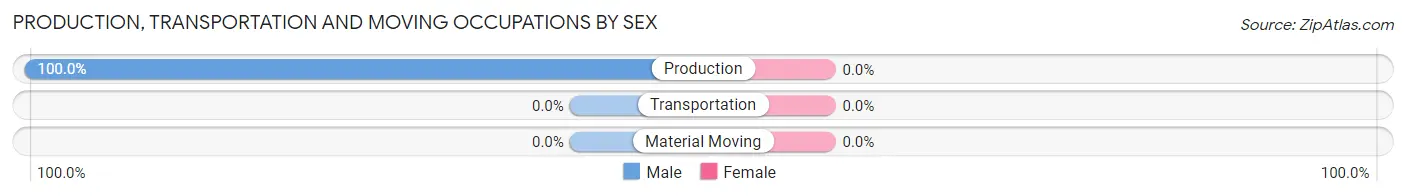
| Occupation | Male | Female |
| Production | 70 (100.0%) | 0 (0.0%) |
| Transportation | 0 (0.0%) | 0 (0.0%) |
| Material Moving | 0 (0.0%) | 0 (0.0%) |
| Total (Category) | 70 (100.0%) | 0 (0.0%) |
| Total (Overall) | 363 (53.9%) | 311 (46.1%) |
Employment Industries by Sex in Canton Valley
Employment Industries in Canton Valley
The major employment industries in Canton Valley include Retail Trade (186 | 27.6%), Finance & Insurance (85 | 12.6%), Educational Services (78 | 11.6%), Professional & Scientific (69 | 10.2%), and Construction (68 | 10.1%).
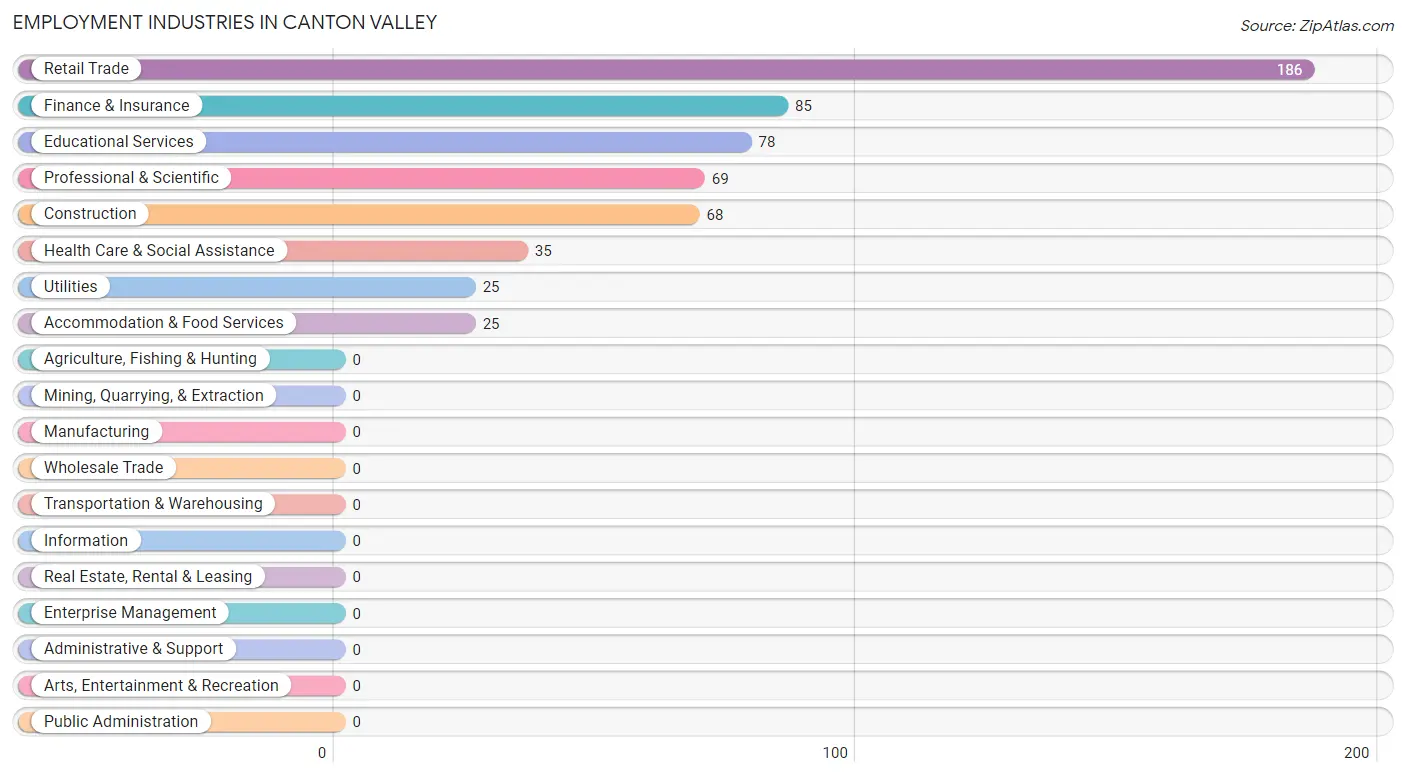
Employment Industries by Sex in Canton Valley
The Canton Valley industries that see more men than women are Construction (100.0%), Utilities (100.0%), and Accommodation & Food Services (100.0%), whereas the industries that tend to have a higher number of women are Health Care & Social Assistance (100.0%), Finance & Insurance (82.4%), and Educational Services (80.8%).
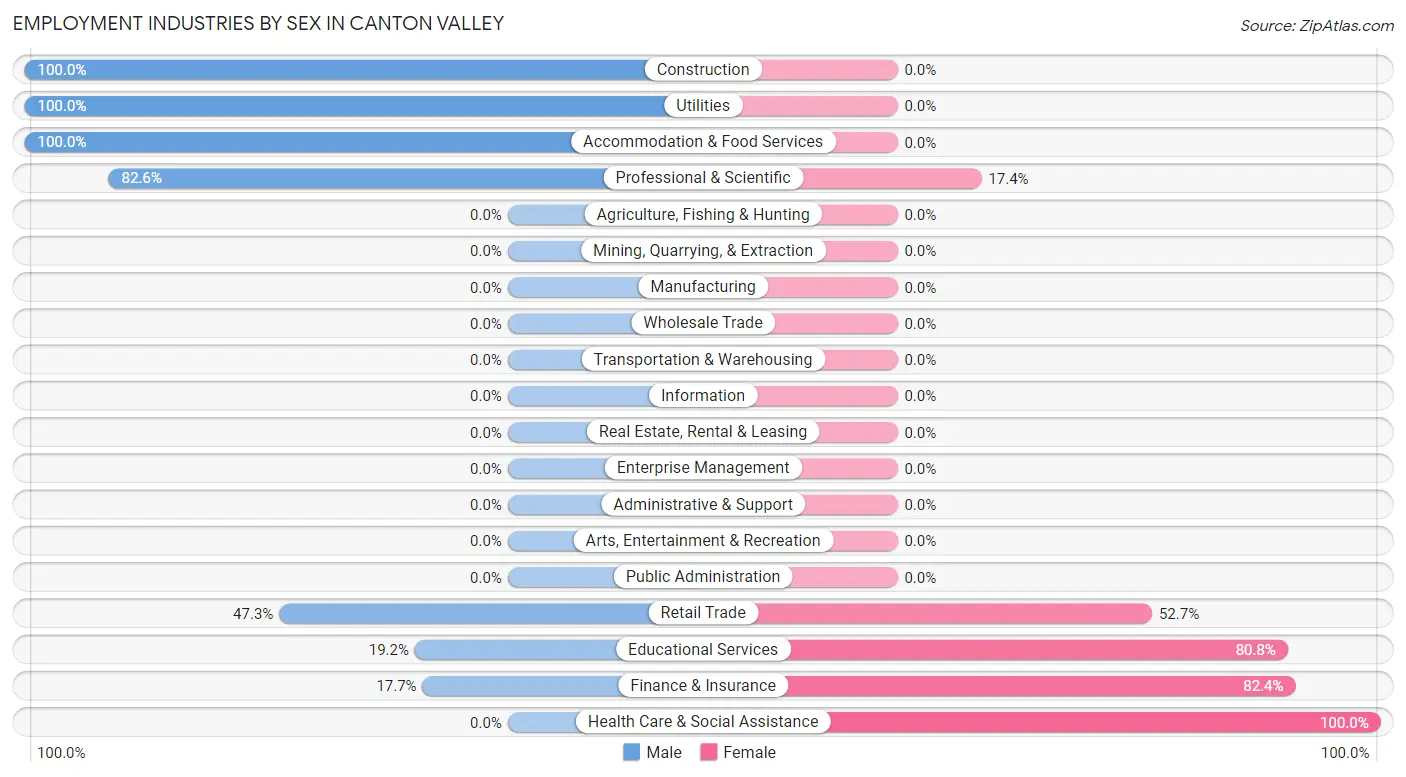
| Industry | Male | Female |
| Agriculture, Fishing & Hunting | 0 (0.0%) | 0 (0.0%) |
| Mining, Quarrying, & Extraction | 0 (0.0%) | 0 (0.0%) |
| Construction | 68 (100.0%) | 0 (0.0%) |
| Manufacturing | 0 (0.0%) | 0 (0.0%) |
| Wholesale Trade | 0 (0.0%) | 0 (0.0%) |
| Retail Trade | 88 (47.3%) | 98 (52.7%) |
| Transportation & Warehousing | 0 (0.0%) | 0 (0.0%) |
| Utilities | 25 (100.0%) | 0 (0.0%) |
| Information | 0 (0.0%) | 0 (0.0%) |
| Finance & Insurance | 15 (17.6%) | 70 (82.4%) |
| Real Estate, Rental & Leasing | 0 (0.0%) | 0 (0.0%) |
| Professional & Scientific | 57 (82.6%) | 12 (17.4%) |
| Enterprise Management | 0 (0.0%) | 0 (0.0%) |
| Administrative & Support | 0 (0.0%) | 0 (0.0%) |
| Educational Services | 15 (19.2%) | 63 (80.8%) |
| Health Care & Social Assistance | 0 (0.0%) | 35 (100.0%) |
| Arts, Entertainment & Recreation | 0 (0.0%) | 0 (0.0%) |
| Accommodation & Food Services | 25 (100.0%) | 0 (0.0%) |
| Public Administration | 0 (0.0%) | 0 (0.0%) |
| Total | 363 (53.9%) | 311 (46.1%) |
Education in Canton Valley
School Enrollment in Canton Valley
The most common levels of schooling among the 349 students in Canton Valley are college / undergraduate (143 | 41.0%), middle school (66 | 18.9%), and elementary school (60 | 17.2%).
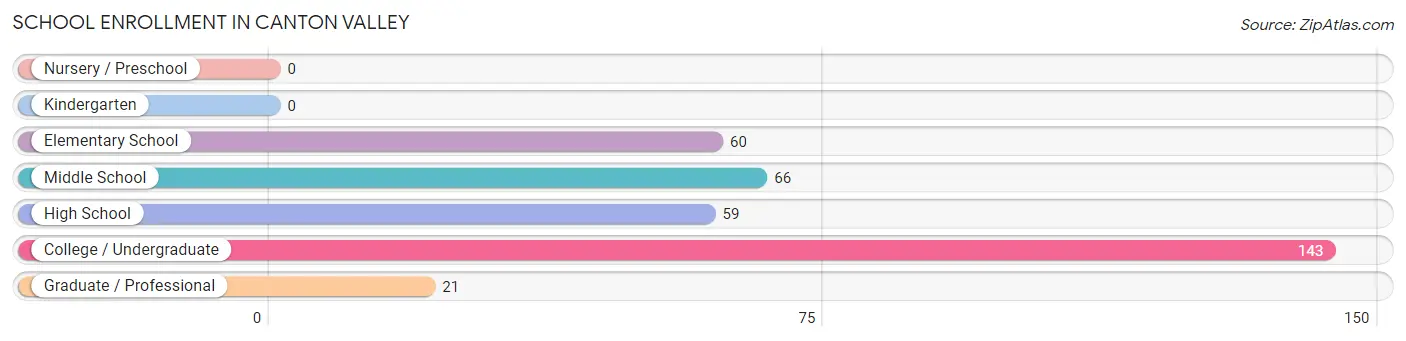
| School Level | # Students | % Students |
| Nursery / Preschool | 0 | 0.0% |
| Kindergarten | 0 | 0.0% |
| Elementary School | 60 | 17.2% |
| Middle School | 66 | 18.9% |
| High School | 59 | 16.9% |
| College / Undergraduate | 143 | 41.0% |
| Graduate / Professional | 21 | 6.0% |
| Total | 349 | 100.0% |
School Enrollment by Age by Funding Source in Canton Valley
Out of a total of 349 students who are enrolled in schools in Canton Valley, 9 (2.6%) attend a private institution, while the remaining 340 (97.4%) are enrolled in public schools. The age group of 35 years and over has the highest likelihood of being enrolled in private schools, with 9 (100.0% in the age bracket) enrolled. Conversely, the age group of 5 to 9 year old has the lowest likelihood of being enrolled in a private school, with 60 (100.0% in the age bracket) attending a public institution.
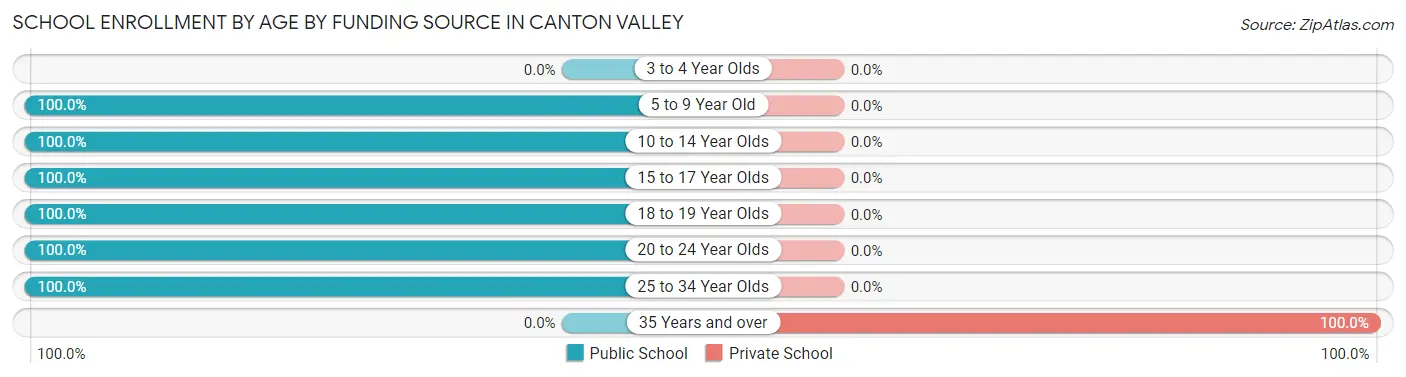
| Age Bracket | Public School | Private School |
| 3 to 4 Year Olds | 0 (0.0%) | 0 (0.0%) |
| 5 to 9 Year Old | 60 (100.0%) | 0 (0.0%) |
| 10 to 14 Year Olds | 66 (100.0%) | 0 (0.0%) |
| 15 to 17 Year Olds | 59 (100.0%) | 0 (0.0%) |
| 18 to 19 Year Olds | 70 (100.0%) | 0 (0.0%) |
| 20 to 24 Year Olds | 73 (100.0%) | 0 (0.0%) |
| 25 to 34 Year Olds | 12 (100.0%) | 0 (0.0%) |
| 35 Years and over | 0 (0.0%) | 9 (100.0%) |
| Total | 340 (97.4%) | 9 (2.6%) |
Educational Attainment by Field of Study in Canton Valley
Business (99 | 26.8%), education (69 | 18.6%), literature & languages (51 | 13.8%), social sciences (48 | 13.0%), and computers & mathematics (41 | 11.1%) are the most common fields of study among 370 individuals in Canton Valley who have obtained a bachelor's degree or higher.
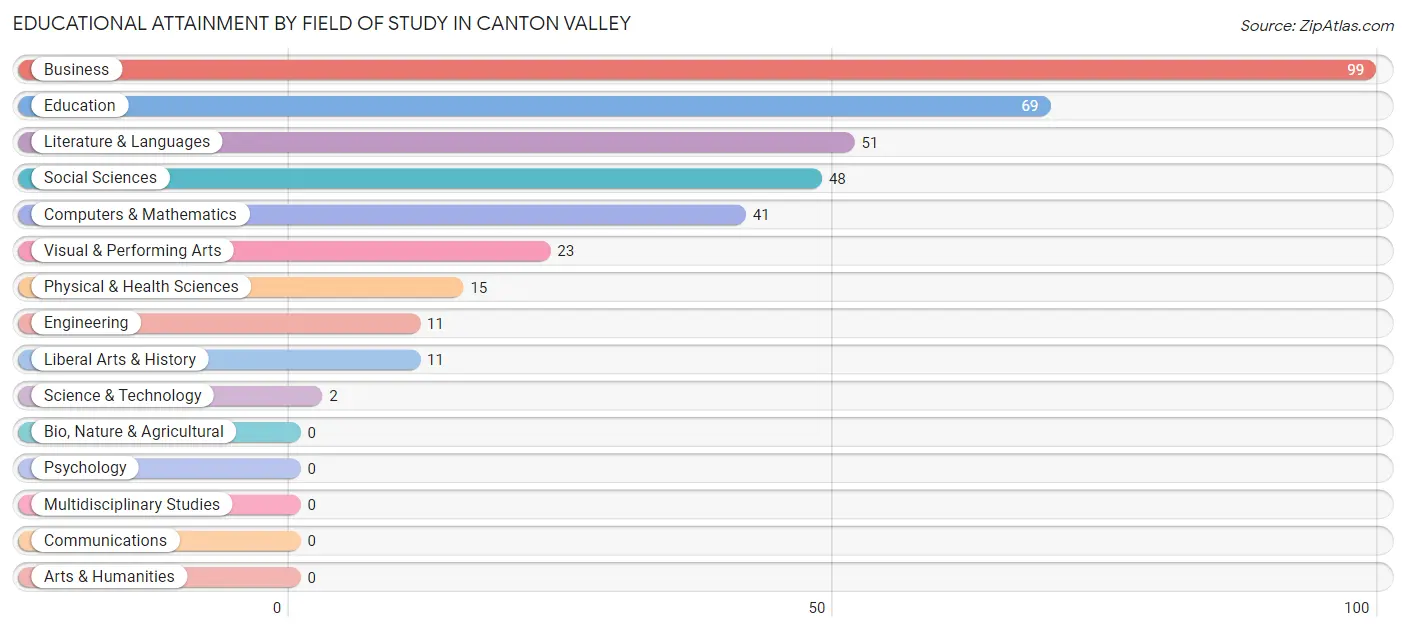
| Field of Study | # Graduates | % Graduates |
| Computers & Mathematics | 41 | 11.1% |
| Bio, Nature & Agricultural | 0 | 0.0% |
| Physical & Health Sciences | 15 | 4.1% |
| Psychology | 0 | 0.0% |
| Social Sciences | 48 | 13.0% |
| Engineering | 11 | 3.0% |
| Multidisciplinary Studies | 0 | 0.0% |
| Science & Technology | 2 | 0.5% |
| Business | 99 | 26.8% |
| Education | 69 | 18.6% |
| Literature & Languages | 51 | 13.8% |
| Liberal Arts & History | 11 | 3.0% |
| Visual & Performing Arts | 23 | 6.2% |
| Communications | 0 | 0.0% |
| Arts & Humanities | 0 | 0.0% |
| Total | 370 | 100.0% |
Transportation & Commute in Canton Valley
Vehicle Availability by Sex in Canton Valley
The most prevalent vehicle ownership categories in Canton Valley are males with 2 vehicles (134, accounting for 36.9%) and females with 2 vehicles (80, making up 48.2%).
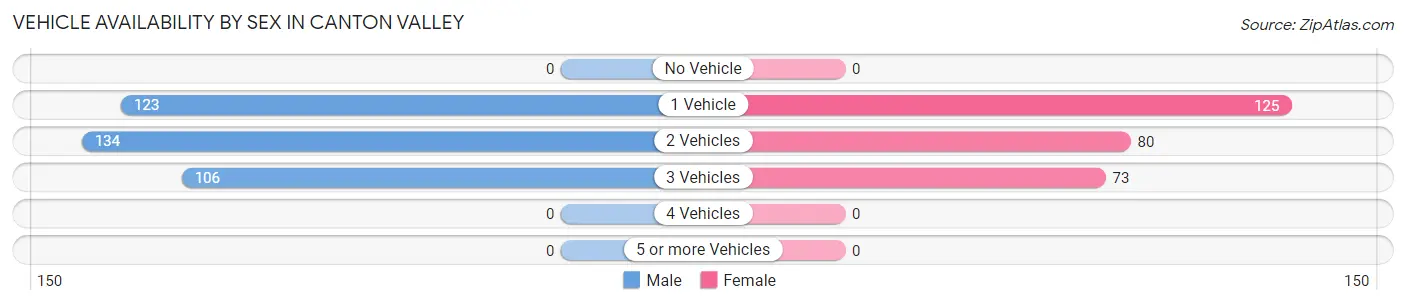
| Vehicles Available | Male | Female |
| No Vehicle | 0 (0.0%) | 0 (0.0%) |
| 1 Vehicle | 123 (33.9%) | 125 (45.0%) |
| 2 Vehicles | 134 (36.9%) | 80 (28.8%) |
| 3 Vehicles | 106 (29.2%) | 73 (26.3%) |
| 4 Vehicles | 0 (0.0%) | 0 (0.0%) |
| 5 or more Vehicles | 0 (0.0%) | 0 (0.0%) |
| Total | 363 (100.0%) | 278 (100.0%) |
Commute Time in Canton Valley
The most frequently occuring commute durations in Canton Valley are 10 to 14 minutes (106 commuters, 19.2%), 35 to 39 minutes (94 commuters, 17.1%), and 45 to 59 minutes (88 commuters, 16.0%).
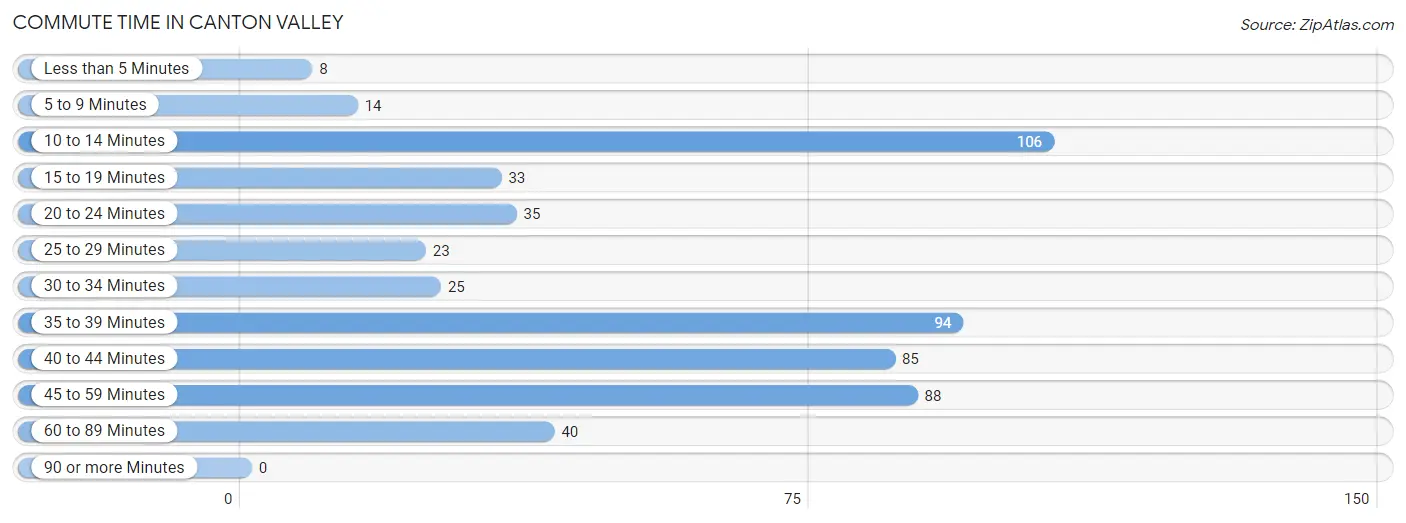
| Commute Time | # Commuters | % Commuters |
| Less than 5 Minutes | 8 | 1.5% |
| 5 to 9 Minutes | 14 | 2.5% |
| 10 to 14 Minutes | 106 | 19.2% |
| 15 to 19 Minutes | 33 | 6.0% |
| 20 to 24 Minutes | 35 | 6.4% |
| 25 to 29 Minutes | 23 | 4.2% |
| 30 to 34 Minutes | 25 | 4.5% |
| 35 to 39 Minutes | 94 | 17.1% |
| 40 to 44 Minutes | 85 | 15.4% |
| 45 to 59 Minutes | 88 | 16.0% |
| 60 to 89 Minutes | 40 | 7.3% |
| 90 or more Minutes | 0 | 0.0% |
Commute Time by Sex in Canton Valley
The most common commute times in Canton Valley are 10 to 14 minutes (89 commuters, 26.5%) for males and 35 to 39 minutes (94 commuters, 43.7%) for females.
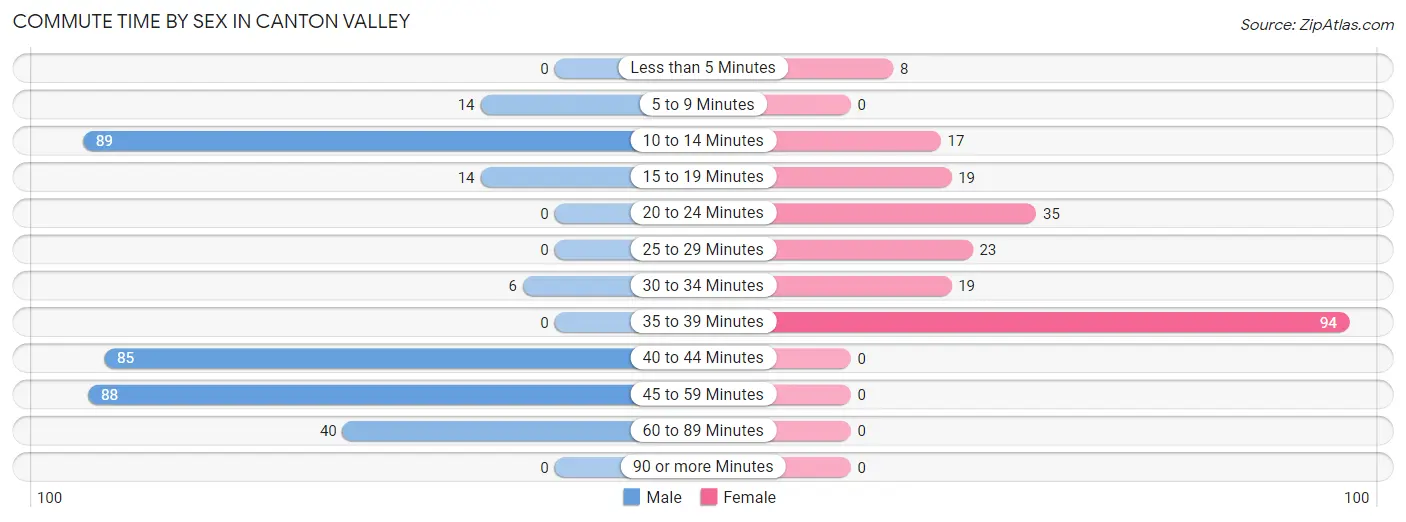
| Commute Time | Male | Female |
| Less than 5 Minutes | 0 (0.0%) | 8 (3.7%) |
| 5 to 9 Minutes | 14 (4.2%) | 0 (0.0%) |
| 10 to 14 Minutes | 89 (26.5%) | 17 (7.9%) |
| 15 to 19 Minutes | 14 (4.2%) | 19 (8.8%) |
| 20 to 24 Minutes | 0 (0.0%) | 35 (16.3%) |
| 25 to 29 Minutes | 0 (0.0%) | 23 (10.7%) |
| 30 to 34 Minutes | 6 (1.8%) | 19 (8.8%) |
| 35 to 39 Minutes | 0 (0.0%) | 94 (43.7%) |
| 40 to 44 Minutes | 85 (25.3%) | 0 (0.0%) |
| 45 to 59 Minutes | 88 (26.2%) | 0 (0.0%) |
| 60 to 89 Minutes | 40 (11.9%) | 0 (0.0%) |
| 90 or more Minutes | 0 (0.0%) | 0 (0.0%) |
Time of Departure to Work by Sex in Canton Valley
The most frequent times of departure to work in Canton Valley are 6:00 AM to 6:29 AM (172, 51.2%) for males and 7:00 AM to 7:29 AM (113, 52.6%) for females.
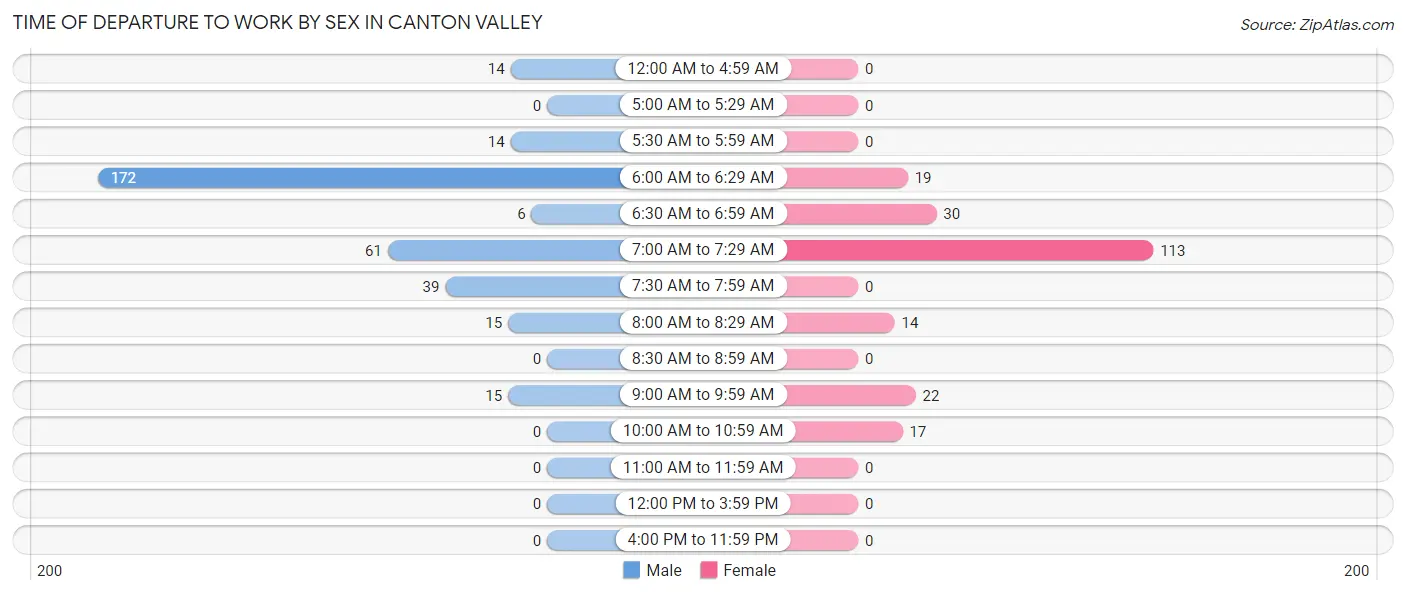
| Time of Departure | Male | Female |
| 12:00 AM to 4:59 AM | 14 (4.2%) | 0 (0.0%) |
| 5:00 AM to 5:29 AM | 0 (0.0%) | 0 (0.0%) |
| 5:30 AM to 5:59 AM | 14 (4.2%) | 0 (0.0%) |
| 6:00 AM to 6:29 AM | 172 (51.2%) | 19 (8.8%) |
| 6:30 AM to 6:59 AM | 6 (1.8%) | 30 (14.0%) |
| 7:00 AM to 7:29 AM | 61 (18.1%) | 113 (52.6%) |
| 7:30 AM to 7:59 AM | 39 (11.6%) | 0 (0.0%) |
| 8:00 AM to 8:29 AM | 15 (4.5%) | 14 (6.5%) |
| 8:30 AM to 8:59 AM | 0 (0.0%) | 0 (0.0%) |
| 9:00 AM to 9:59 AM | 15 (4.5%) | 22 (10.2%) |
| 10:00 AM to 10:59 AM | 0 (0.0%) | 17 (7.9%) |
| 11:00 AM to 11:59 AM | 0 (0.0%) | 0 (0.0%) |
| 12:00 PM to 3:59 PM | 0 (0.0%) | 0 (0.0%) |
| 4:00 PM to 11:59 PM | 0 (0.0%) | 0 (0.0%) |
| Total | 336 (100.0%) | 215 (100.0%) |
Housing Occupancy in Canton Valley
Occupancy by Ownership in Canton Valley
Of the total 723 dwellings in Canton Valley, owner-occupied units account for 450 (62.2%), while renter-occupied units make up 273 (37.8%).
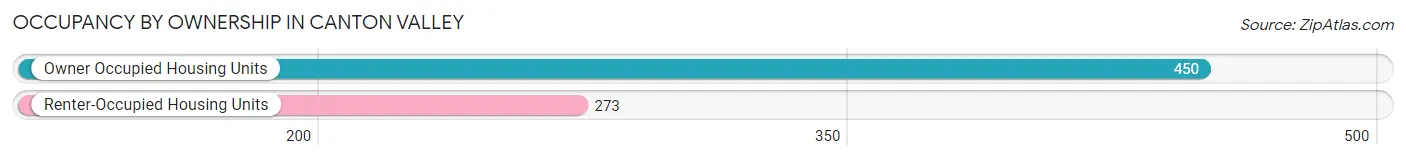
| Occupancy | # Housing Units | % Housing Units |
| Owner Occupied Housing Units | 450 | 62.2% |
| Renter-Occupied Housing Units | 273 | 37.8% |
| Total Occupied Housing Units | 723 | 100.0% |
Occupancy by Household Size in Canton Valley
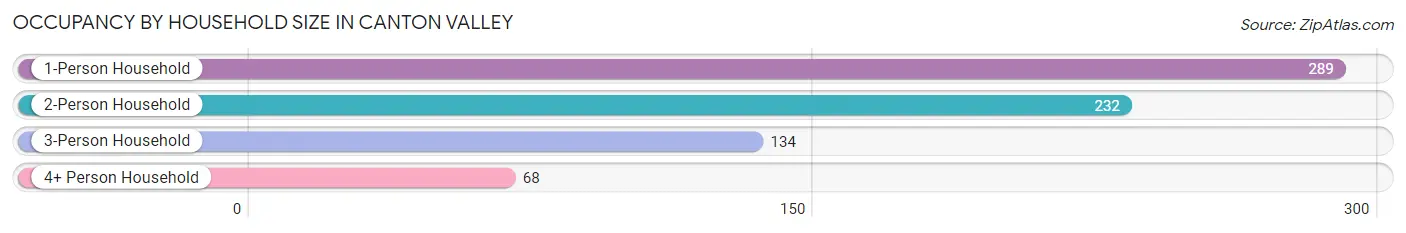
| Household Size | # Housing Units | % Housing Units |
| 1-Person Household | 289 | 40.0% |
| 2-Person Household | 232 | 32.1% |
| 3-Person Household | 134 | 18.5% |
| 4+ Person Household | 68 | 9.4% |
| Total Housing Units | 723 | 100.0% |
Occupancy by Ownership by Household Size in Canton Valley
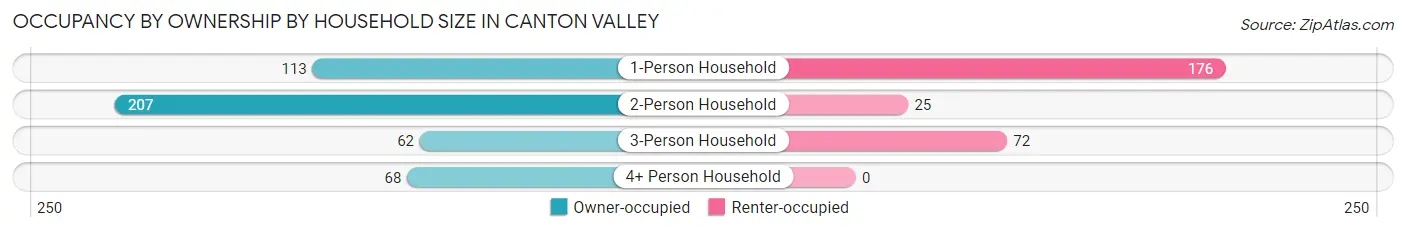
| Household Size | Owner-occupied | Renter-occupied |
| 1-Person Household | 113 (39.1%) | 176 (60.9%) |
| 2-Person Household | 207 (89.2%) | 25 (10.8%) |
| 3-Person Household | 62 (46.3%) | 72 (53.7%) |
| 4+ Person Household | 68 (100.0%) | 0 (0.0%) |
| Total Housing Units | 450 (62.2%) | 273 (37.8%) |
Occupancy by Educational Attainment in Canton Valley
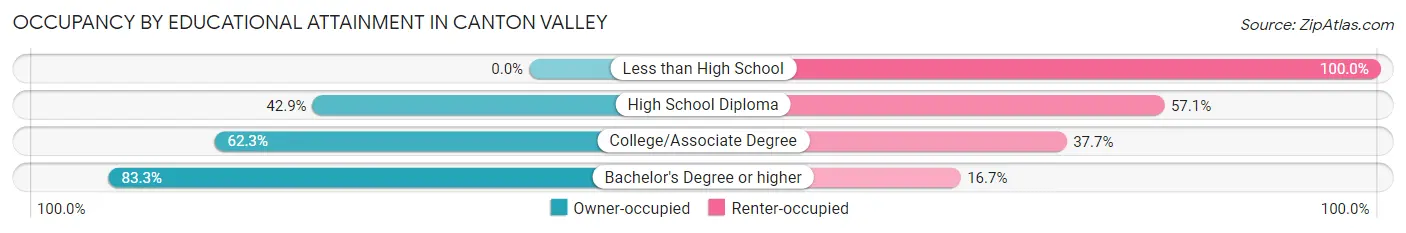
| Household Size | Owner-occupied | Renter-occupied |
| Less than High School | 0 (0.0%) | 31 (100.0%) |
| High School Diploma | 73 (42.9%) | 97 (57.1%) |
| College/Associate Degree | 172 (62.3%) | 104 (37.7%) |
| Bachelor's Degree or higher | 205 (83.3%) | 41 (16.7%) |
Occupancy by Age of Householder in Canton Valley
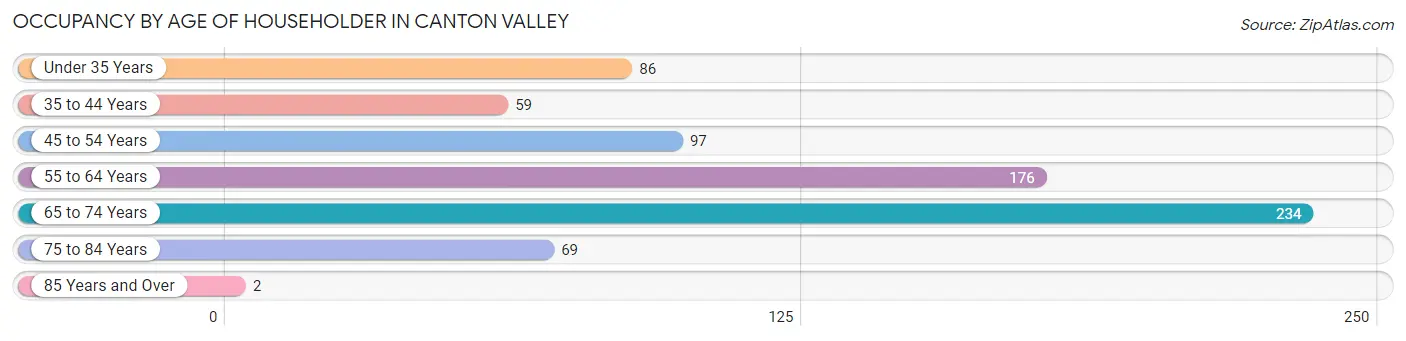
| Age Bracket | # Households | % Households |
| Under 35 Years | 86 | 11.9% |
| 35 to 44 Years | 59 | 8.2% |
| 45 to 54 Years | 97 | 13.4% |
| 55 to 64 Years | 176 | 24.3% |
| 65 to 74 Years | 234 | 32.4% |
| 75 to 84 Years | 69 | 9.5% |
| 85 Years and Over | 2 | 0.3% |
| Total | 723 | 100.0% |
Housing Finances in Canton Valley
Median Income by Occupancy in Canton Valley
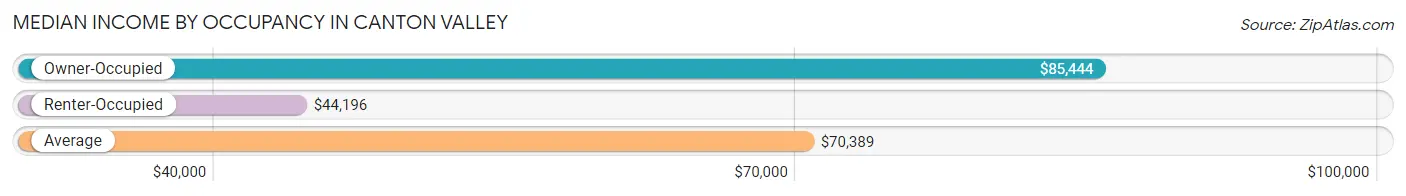
| Occupancy Type | # Households | Median Income |
| Owner-Occupied | 450 (62.2%) | $85,444 |
| Renter-Occupied | 273 (37.8%) | $44,196 |
| Average | 723 (100.0%) | $70,389 |
Occupancy by Householder Income Bracket in Canton Valley
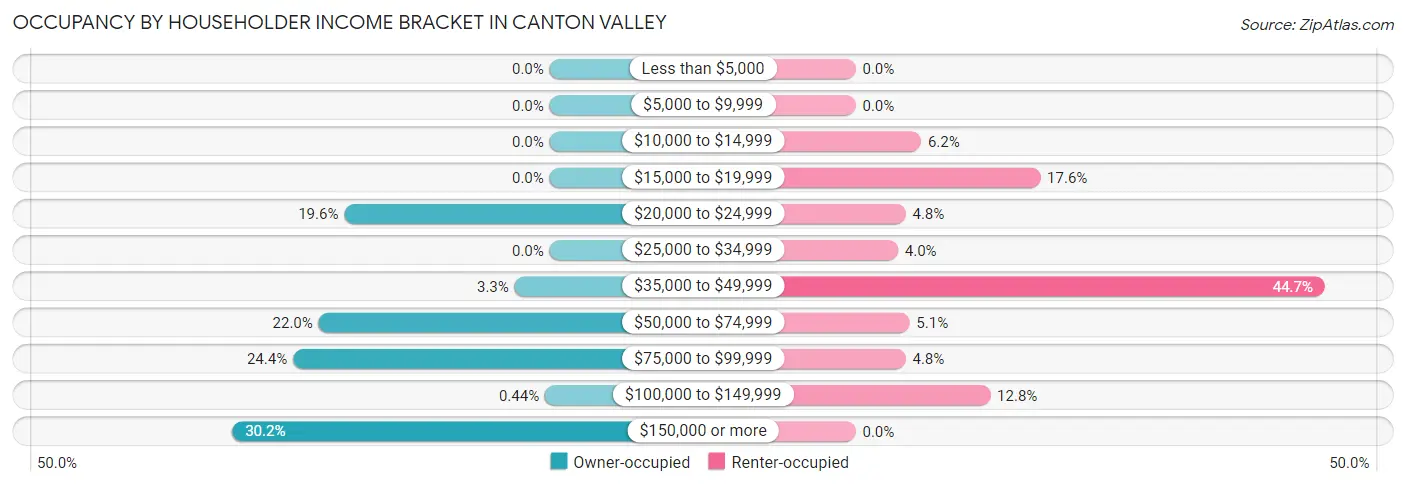
| Income Bracket | Owner-occupied | Renter-occupied |
| Less than $5,000 | 0 (0.0%) | 0 (0.0%) |
| $5,000 to $9,999 | 0 (0.0%) | 0 (0.0%) |
| $10,000 to $14,999 | 0 (0.0%) | 17 (6.2%) |
| $15,000 to $19,999 | 0 (0.0%) | 48 (17.6%) |
| $20,000 to $24,999 | 88 (19.6%) | 13 (4.8%) |
| $25,000 to $34,999 | 0 (0.0%) | 11 (4.0%) |
| $35,000 to $49,999 | 15 (3.3%) | 122 (44.7%) |
| $50,000 to $74,999 | 99 (22.0%) | 14 (5.1%) |
| $75,000 to $99,999 | 110 (24.4%) | 13 (4.8%) |
| $100,000 to $149,999 | 2 (0.4%) | 35 (12.8%) |
| $150,000 or more | 136 (30.2%) | 0 (0.0%) |
| Total | 450 (100.0%) | 273 (100.0%) |
Monthly Housing Cost Tiers in Canton Valley
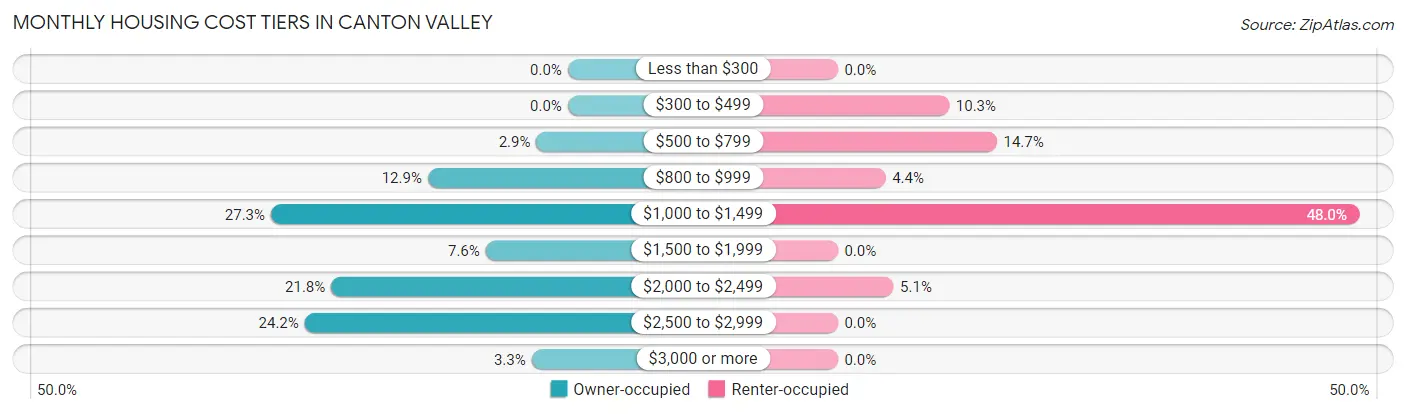
| Monthly Cost | Owner-occupied | Renter-occupied |
| Less than $300 | 0 (0.0%) | 0 (0.0%) |
| $300 to $499 | 0 (0.0%) | 28 (10.3%) |
| $500 to $799 | 13 (2.9%) | 40 (14.6%) |
| $800 to $999 | 58 (12.9%) | 12 (4.4%) |
| $1,000 to $1,499 | 123 (27.3%) | 131 (48.0%) |
| $1,500 to $1,999 | 34 (7.6%) | 0 (0.0%) |
| $2,000 to $2,499 | 98 (21.8%) | 14 (5.1%) |
| $2,500 to $2,999 | 109 (24.2%) | 0 (0.0%) |
| $3,000 or more | 15 (3.3%) | 0 (0.0%) |
| Total | 450 (100.0%) | 273 (100.0%) |
Physical Housing Characteristics in Canton Valley
Housing Structures in Canton Valley
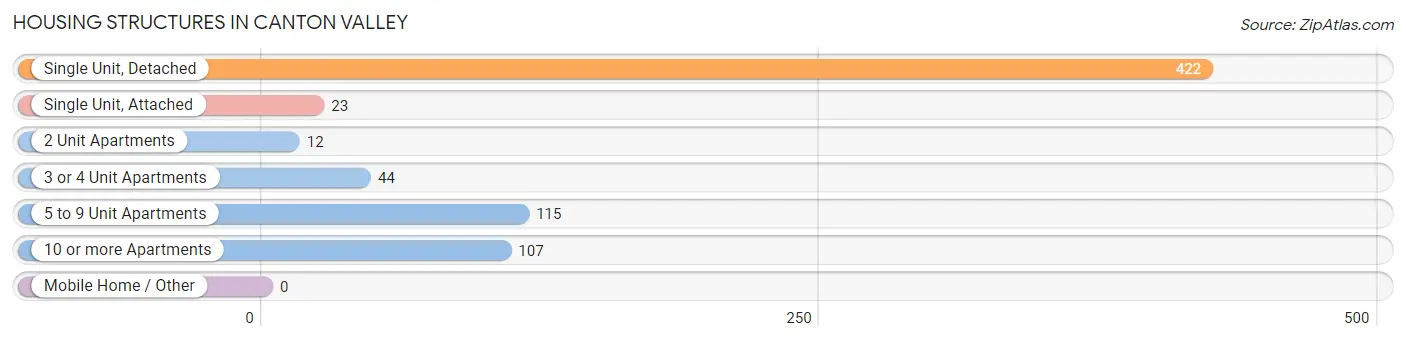
| Structure Type | # Housing Units | % Housing Units |
| Single Unit, Detached | 422 | 58.4% |
| Single Unit, Attached | 23 | 3.2% |
| 2 Unit Apartments | 12 | 1.7% |
| 3 or 4 Unit Apartments | 44 | 6.1% |
| 5 to 9 Unit Apartments | 115 | 15.9% |
| 10 or more Apartments | 107 | 14.8% |
| Mobile Home / Other | 0 | 0.0% |
| Total | 723 | 100.0% |
Housing Structures by Occupancy in Canton Valley
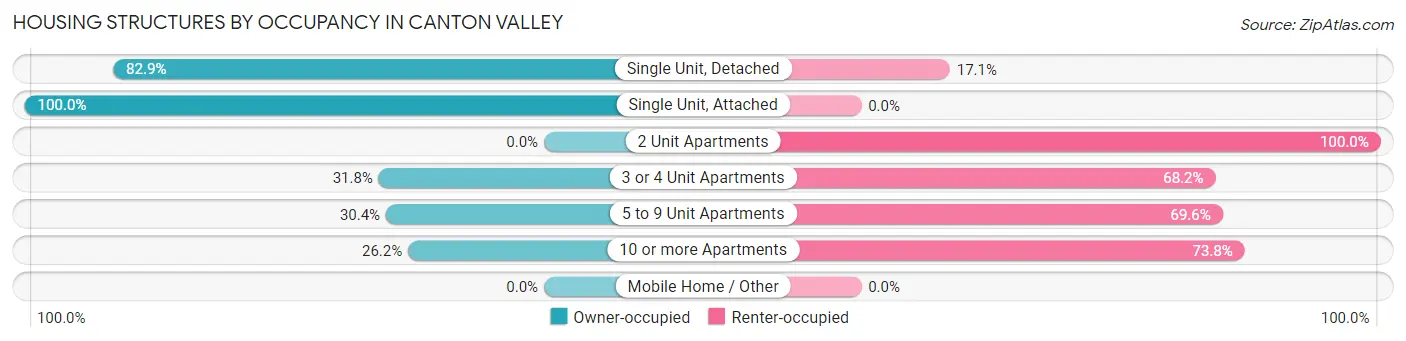
| Structure Type | Owner-occupied | Renter-occupied |
| Single Unit, Detached | 350 (82.9%) | 72 (17.1%) |
| Single Unit, Attached | 23 (100.0%) | 0 (0.0%) |
| 2 Unit Apartments | 0 (0.0%) | 12 (100.0%) |
| 3 or 4 Unit Apartments | 14 (31.8%) | 30 (68.2%) |
| 5 to 9 Unit Apartments | 35 (30.4%) | 80 (69.6%) |
| 10 or more Apartments | 28 (26.2%) | 79 (73.8%) |
| Mobile Home / Other | 0 (0.0%) | 0 (0.0%) |
| Total | 450 (62.2%) | 273 (37.8%) |
Housing Structures by Number of Rooms in Canton Valley
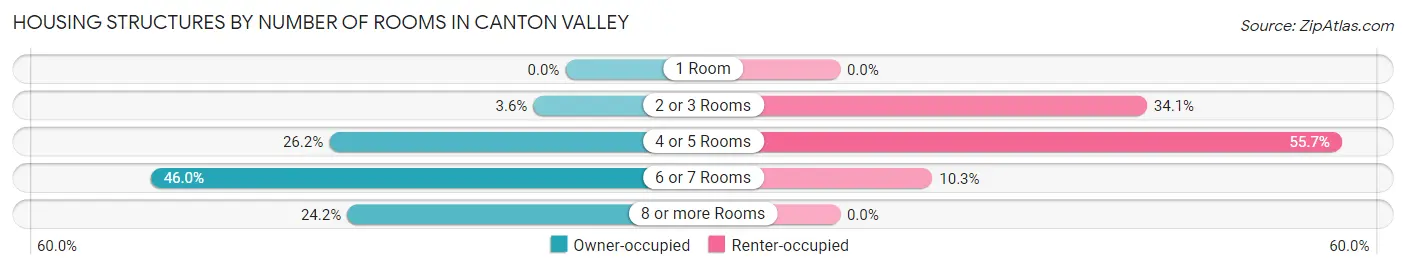
| Number of Rooms | Owner-occupied | Renter-occupied |
| 1 Room | 0 (0.0%) | 0 (0.0%) |
| 2 or 3 Rooms | 16 (3.6%) | 93 (34.1%) |
| 4 or 5 Rooms | 118 (26.2%) | 152 (55.7%) |
| 6 or 7 Rooms | 207 (46.0%) | 28 (10.3%) |
| 8 or more Rooms | 109 (24.2%) | 0 (0.0%) |
| Total | 450 (100.0%) | 273 (100.0%) |
Housing Structure by Heating Type in Canton Valley
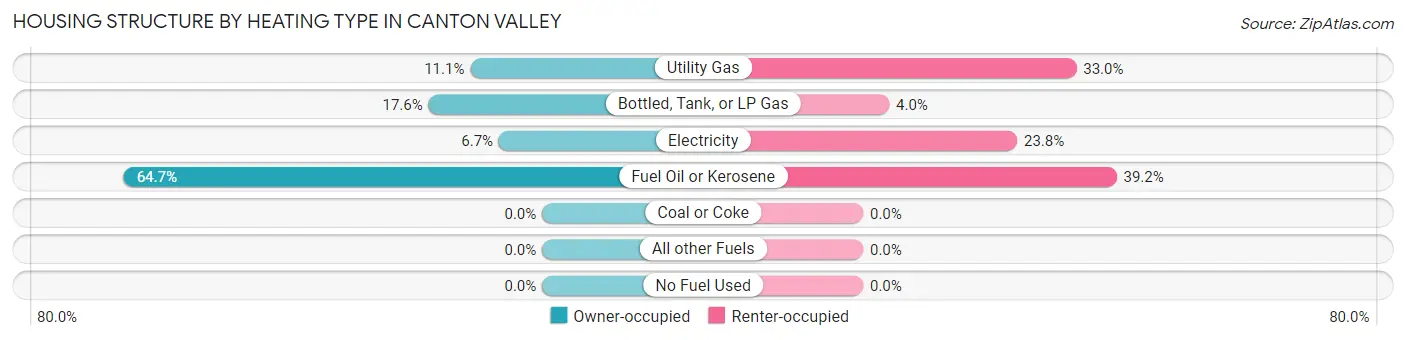
| Heating Type | Owner-occupied | Renter-occupied |
| Utility Gas | 50 (11.1%) | 90 (33.0%) |
| Bottled, Tank, or LP Gas | 79 (17.6%) | 11 (4.0%) |
| Electricity | 30 (6.7%) | 65 (23.8%) |
| Fuel Oil or Kerosene | 291 (64.7%) | 107 (39.2%) |
| Coal or Coke | 0 (0.0%) | 0 (0.0%) |
| All other Fuels | 0 (0.0%) | 0 (0.0%) |
| No Fuel Used | 0 (0.0%) | 0 (0.0%) |
| Total | 450 (100.0%) | 273 (100.0%) |
Household Vehicle Usage in Canton Valley
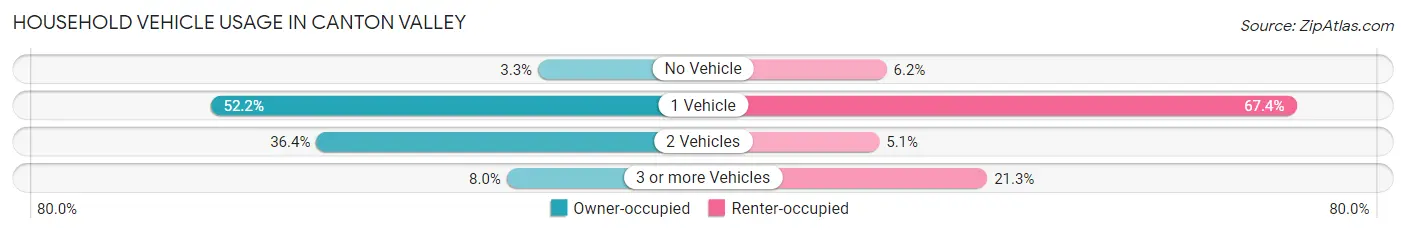
| Vehicles per Household | Owner-occupied | Renter-occupied |
| No Vehicle | 15 (3.3%) | 17 (6.2%) |
| 1 Vehicle | 235 (52.2%) | 184 (67.4%) |
| 2 Vehicles | 164 (36.4%) | 14 (5.1%) |
| 3 or more Vehicles | 36 (8.0%) | 58 (21.2%) |
| Total | 450 (100.0%) | 273 (100.0%) |
Real Estate & Mortgages in Canton Valley
Real Estate and Mortgage Overview in Canton Valley
| Characteristic | Without Mortgage | With Mortgage |
| Housing Units | 82 | 368 |
| Median Property Value | $173,200 | $341,000 |
| Median Household Income | $57,167 | $136 |
| Monthly Housing Costs | $848 | $15 |
| Real Estate Taxes | $5,625 | $0 |
Property Value by Mortgage Status in Canton Valley
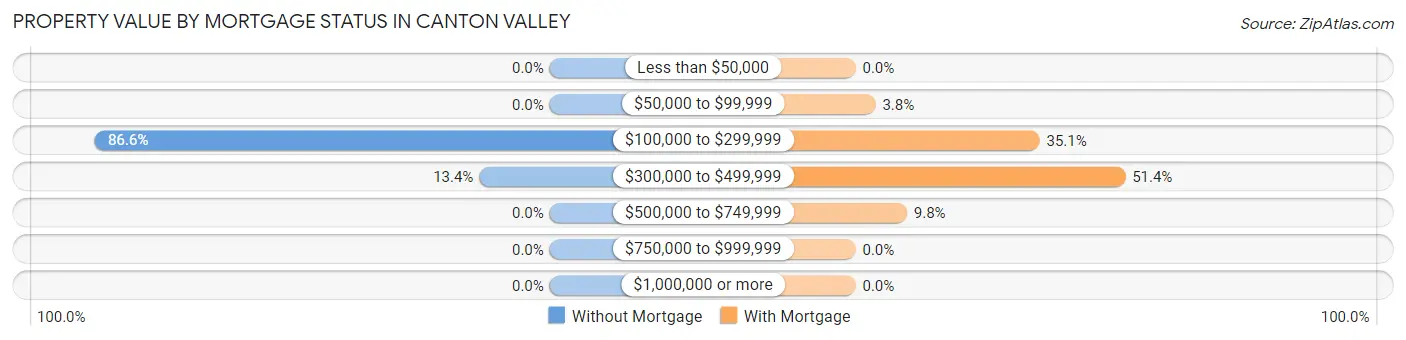
| Property Value | Without Mortgage | With Mortgage |
| Less than $50,000 | 0 (0.0%) | 0 (0.0%) |
| $50,000 to $99,999 | 0 (0.0%) | 14 (3.8%) |
| $100,000 to $299,999 | 71 (86.6%) | 129 (35.0%) |
| $300,000 to $499,999 | 11 (13.4%) | 189 (51.4%) |
| $500,000 to $749,999 | 0 (0.0%) | 36 (9.8%) |
| $750,000 to $999,999 | 0 (0.0%) | 0 (0.0%) |
| $1,000,000 or more | 0 (0.0%) | 0 (0.0%) |
| Total | 82 (100.0%) | 368 (100.0%) |
Household Income by Mortgage Status in Canton Valley
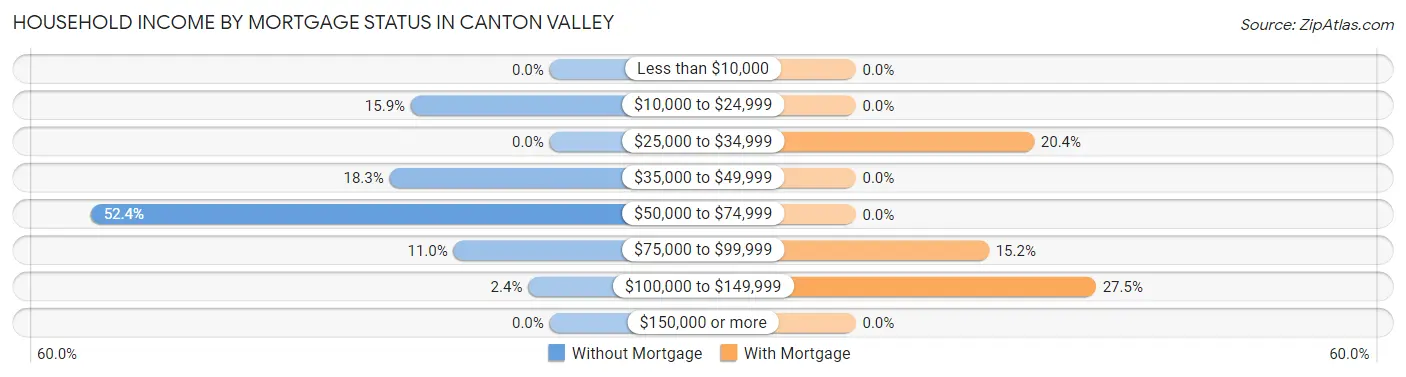
| Household Income | Without Mortgage | With Mortgage |
| Less than $10,000 | 0 (0.0%) | 0 (0.0%) |
| $10,000 to $24,999 | 13 (15.9%) | 0 (0.0%) |
| $25,000 to $34,999 | 0 (0.0%) | 75 (20.4%) |
| $35,000 to $49,999 | 15 (18.3%) | 0 (0.0%) |
| $50,000 to $74,999 | 43 (52.4%) | 0 (0.0%) |
| $75,000 to $99,999 | 9 (11.0%) | 56 (15.2%) |
| $100,000 to $149,999 | 2 (2.4%) | 101 (27.5%) |
| $150,000 or more | 0 (0.0%) | 0 (0.0%) |
| Total | 82 (100.0%) | 368 (100.0%) |
Property Value to Household Income Ratio in Canton Valley
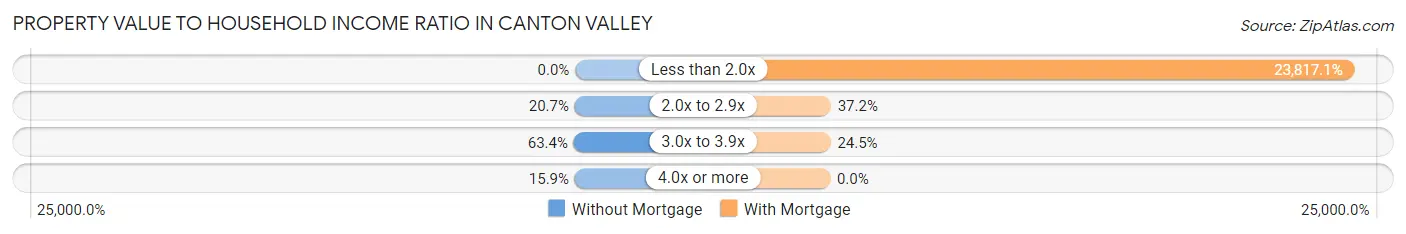
| Value-to-Income Ratio | Without Mortgage | With Mortgage |
| Less than 2.0x | 0 (0.0%) | 87,647 (23,817.1%) |
| 2.0x to 2.9x | 17 (20.7%) | 137 (37.2%) |
| 3.0x to 3.9x | 52 (63.4%) | 90 (24.5%) |
| 4.0x or more | 13 (15.9%) | 0 (0.0%) |
| Total | 82 (100.0%) | 368 (100.0%) |
Real Estate Taxes by Mortgage Status in Canton Valley
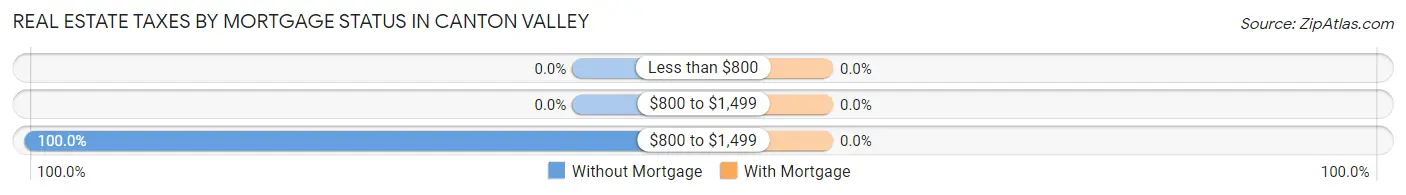
| Property Taxes | Without Mortgage | With Mortgage |
| Less than $800 | 0 (0.0%) | 0 (0.0%) |
| $800 to $1,499 | 0 (0.0%) | 0 (0.0%) |
| $800 to $1,499 | 82 (100.0%) | 0 (0.0%) |
| Total | 82 (100.0%) | 368 (100.0%) |
Health & Disability in Canton Valley
Health Insurance Coverage by Age in Canton Valley
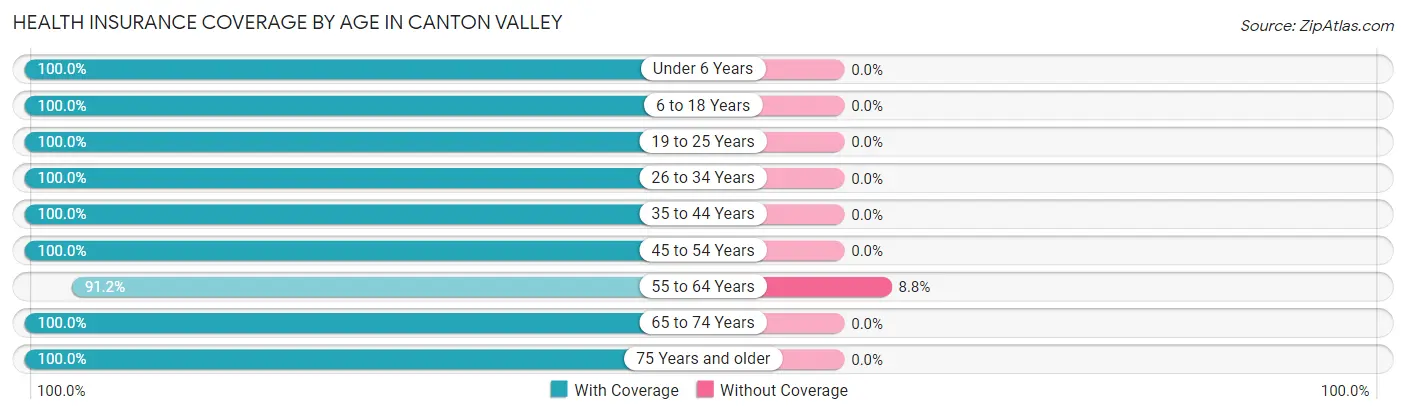
| Age Bracket | With Coverage | Without Coverage |
| Under 6 Years | 106 (100.0%) | 0 (0.0%) |
| 6 to 18 Years | 190 (100.0%) | 0 (0.0%) |
| 19 to 25 Years | 244 (100.0%) | 0 (0.0%) |
| 26 to 34 Years | 144 (100.0%) | 0 (0.0%) |
| 35 to 44 Years | 122 (100.0%) | 0 (0.0%) |
| 45 to 54 Years | 100 (100.0%) | 0 (0.0%) |
| 55 to 64 Years | 176 (91.2%) | 17 (8.8%) |
| 65 to 74 Years | 248 (100.0%) | 0 (0.0%) |
| 75 Years and older | 137 (100.0%) | 0 (0.0%) |
| Total | 1,467 (98.9%) | 17 (1.1%) |
Health Insurance Coverage by Citizenship Status in Canton Valley
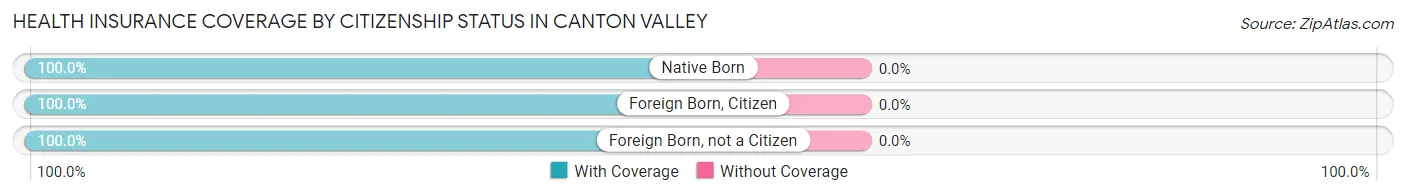
| Citizenship Status | With Coverage | Without Coverage |
| Native Born | 106 (100.0%) | 0 (0.0%) |
| Foreign Born, Citizen | 190 (100.0%) | 0 (0.0%) |
| Foreign Born, not a Citizen | 244 (100.0%) | 0 (0.0%) |
Health Insurance Coverage by Household Income in Canton Valley
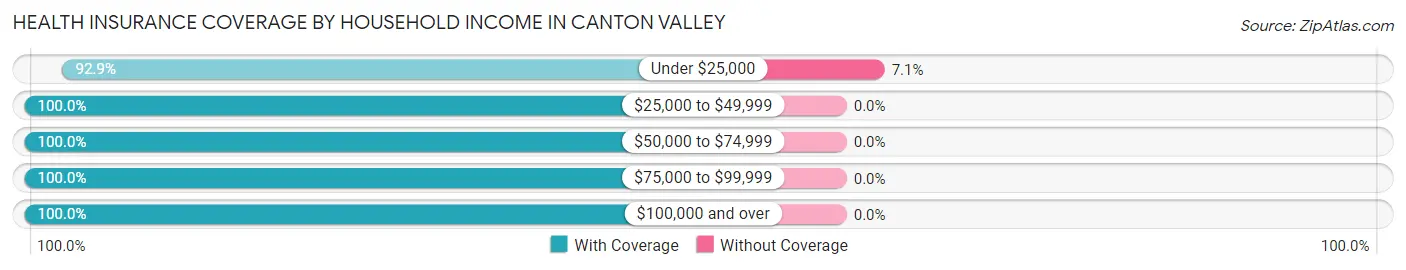
| Household Income | With Coverage | Without Coverage |
| Under $25,000 | 222 (92.9%) | 17 (7.1%) |
| $25,000 to $49,999 | 299 (100.0%) | 0 (0.0%) |
| $50,000 to $74,999 | 187 (100.0%) | 0 (0.0%) |
| $75,000 to $99,999 | 350 (100.0%) | 0 (0.0%) |
| $100,000 and over | 409 (100.0%) | 0 (0.0%) |
Public vs Private Health Insurance Coverage by Age in Canton Valley
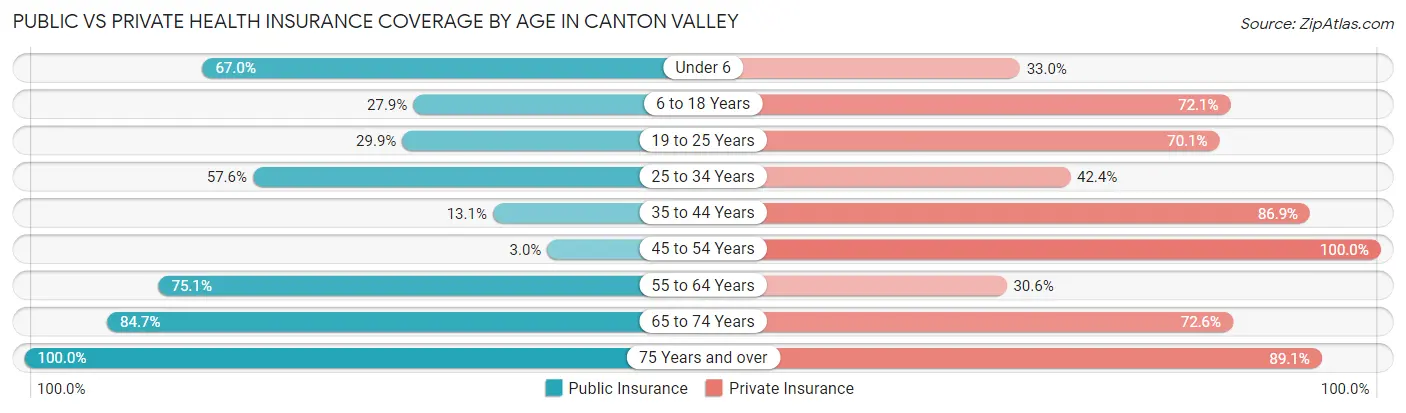
| Age Bracket | Public Insurance | Private Insurance |
| Under 6 | 71 (67.0%) | 35 (33.0%) |
| 6 to 18 Years | 53 (27.9%) | 137 (72.1%) |
| 19 to 25 Years | 73 (29.9%) | 171 (70.1%) |
| 25 to 34 Years | 83 (57.6%) | 61 (42.4%) |
| 35 to 44 Years | 16 (13.1%) | 106 (86.9%) |
| 45 to 54 Years | 3 (3.0%) | 100 (100.0%) |
| 55 to 64 Years | 145 (75.1%) | 59 (30.6%) |
| 65 to 74 Years | 210 (84.7%) | 180 (72.6%) |
| 75 Years and over | 137 (100.0%) | 122 (89.0%) |
| Total | 791 (53.3%) | 971 (65.4%) |
Disability Status by Sex by Age in Canton Valley
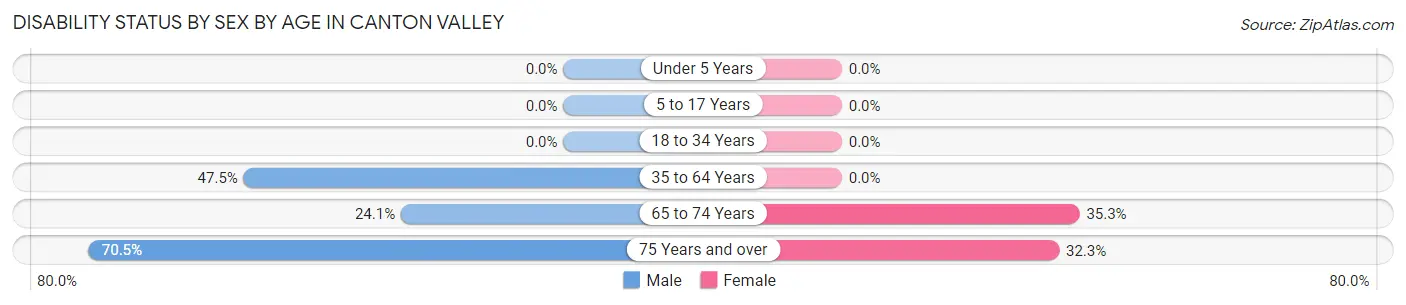
| Age Bracket | Male | Female |
| Under 5 Years | 0 (0.0%) | 0 (0.0%) |
| 5 to 17 Years | 0 (0.0%) | 0 (0.0%) |
| 18 to 34 Years | 0 (0.0%) | 0 (0.0%) |
| 35 to 64 Years | 94 (47.5%) | 0 (0.0%) |
| 65 to 74 Years | 27 (24.1%) | 48 (35.3%) |
| 75 Years and over | 31 (70.5%) | 30 (32.3%) |
Disability Class by Sex by Age in Canton Valley
Disability Class: Hearing Difficulty
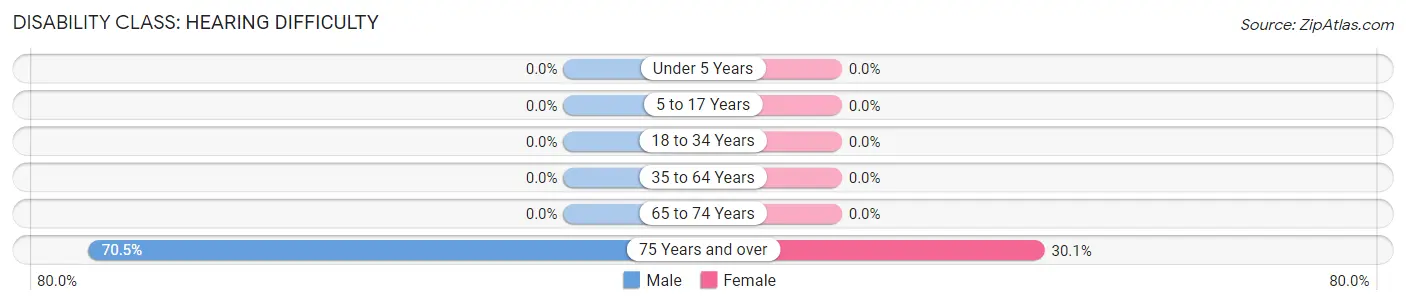
| Age Bracket | Male | Female |
| Under 5 Years | 0 (0.0%) | 0 (0.0%) |
| 5 to 17 Years | 0 (0.0%) | 0 (0.0%) |
| 18 to 34 Years | 0 (0.0%) | 0 (0.0%) |
| 35 to 64 Years | 0 (0.0%) | 0 (0.0%) |
| 65 to 74 Years | 0 (0.0%) | 0 (0.0%) |
| 75 Years and over | 31 (70.5%) | 28 (30.1%) |
Disability Class: Vision Difficulty
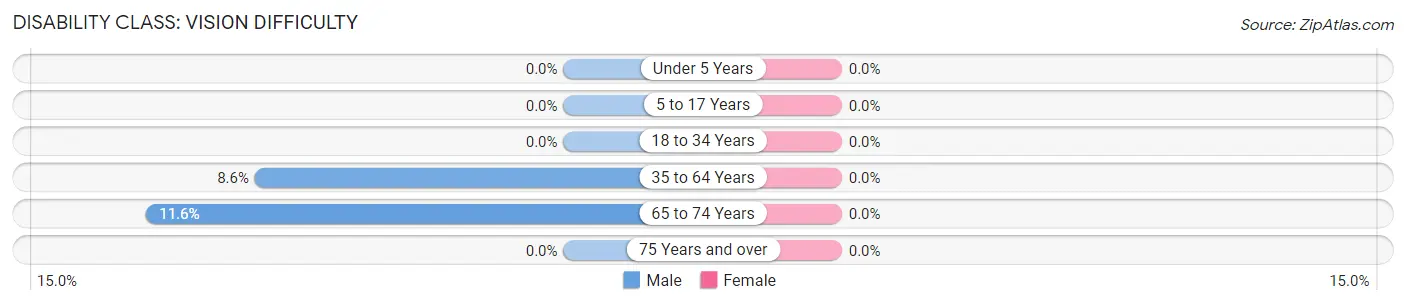
| Age Bracket | Male | Female |
| Under 5 Years | 0 (0.0%) | 0 (0.0%) |
| 5 to 17 Years | 0 (0.0%) | 0 (0.0%) |
| 18 to 34 Years | 0 (0.0%) | 0 (0.0%) |
| 35 to 64 Years | 17 (8.6%) | 0 (0.0%) |
| 65 to 74 Years | 13 (11.6%) | 0 (0.0%) |
| 75 Years and over | 0 (0.0%) | 0 (0.0%) |
Disability Class: Cognitive Difficulty
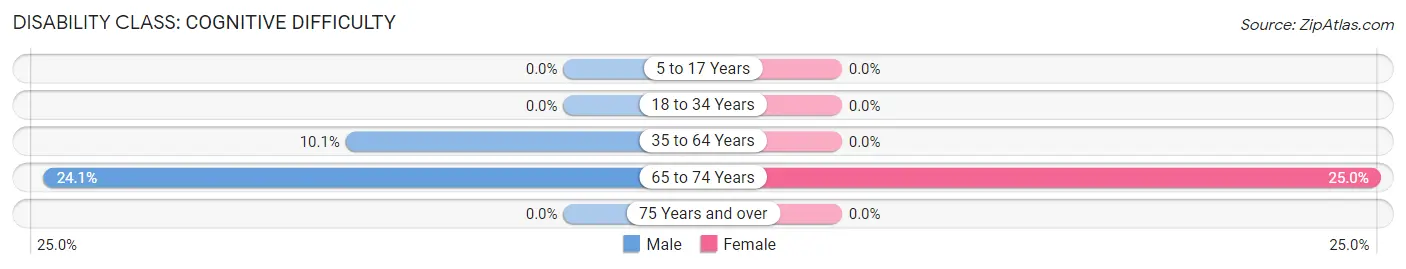
| Age Bracket | Male | Female |
| 5 to 17 Years | 0 (0.0%) | 0 (0.0%) |
| 18 to 34 Years | 0 (0.0%) | 0 (0.0%) |
| 35 to 64 Years | 20 (10.1%) | 0 (0.0%) |
| 65 to 74 Years | 27 (24.1%) | 34 (25.0%) |
| 75 Years and over | 0 (0.0%) | 0 (0.0%) |
Disability Class: Ambulatory Difficulty
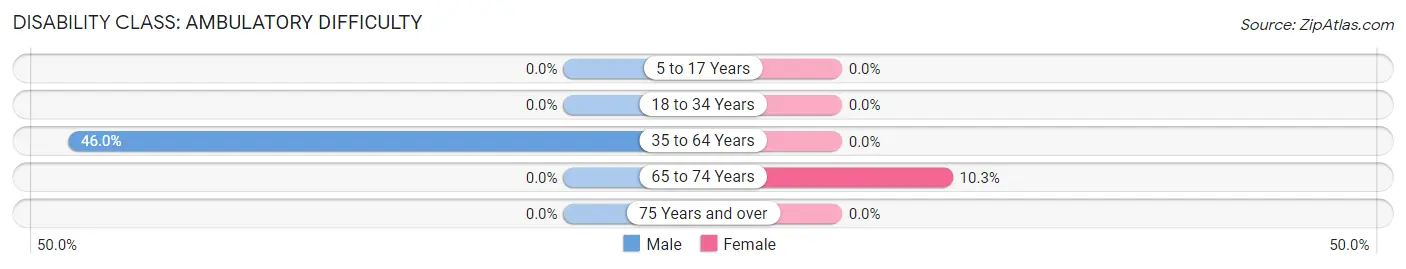
| Age Bracket | Male | Female |
| 5 to 17 Years | 0 (0.0%) | 0 (0.0%) |
| 18 to 34 Years | 0 (0.0%) | 0 (0.0%) |
| 35 to 64 Years | 91 (46.0%) | 0 (0.0%) |
| 65 to 74 Years | 0 (0.0%) | 14 (10.3%) |
| 75 Years and over | 0 (0.0%) | 0 (0.0%) |
Disability Class: Self-Care Difficulty
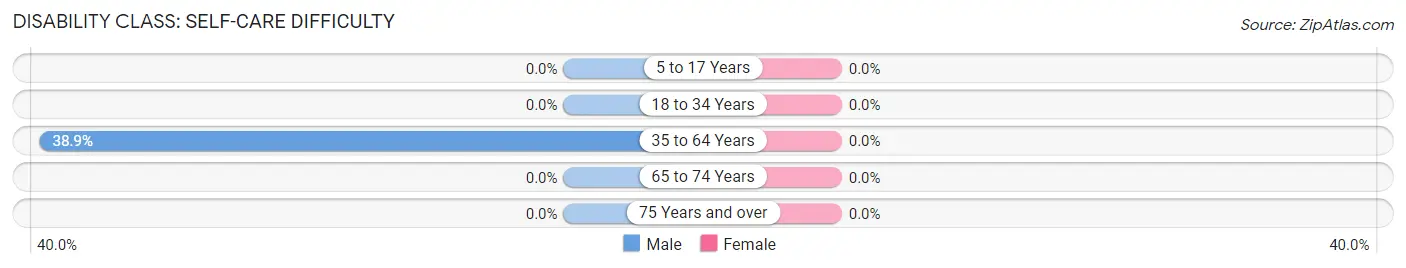
| Age Bracket | Male | Female |
| 5 to 17 Years | 0 (0.0%) | 0 (0.0%) |
| 18 to 34 Years | 0 (0.0%) | 0 (0.0%) |
| 35 to 64 Years | 77 (38.9%) | 0 (0.0%) |
| 65 to 74 Years | 0 (0.0%) | 0 (0.0%) |
| 75 Years and over | 0 (0.0%) | 0 (0.0%) |
Technology Access in Canton Valley
Computing Device Access in Canton Valley
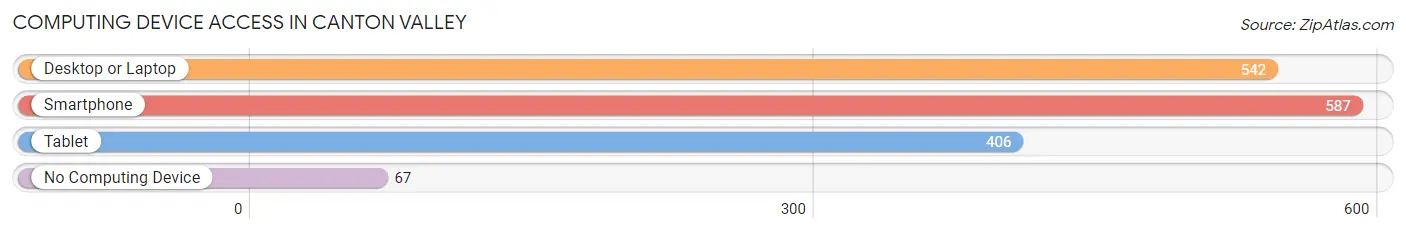
| Device Type | # Households | % Households |
| Desktop or Laptop | 542 | 75.0% |
| Smartphone | 587 | 81.2% |
| Tablet | 406 | 56.1% |
| No Computing Device | 67 | 9.3% |
| Total | 723 | 100.0% |
Internet Access in Canton Valley
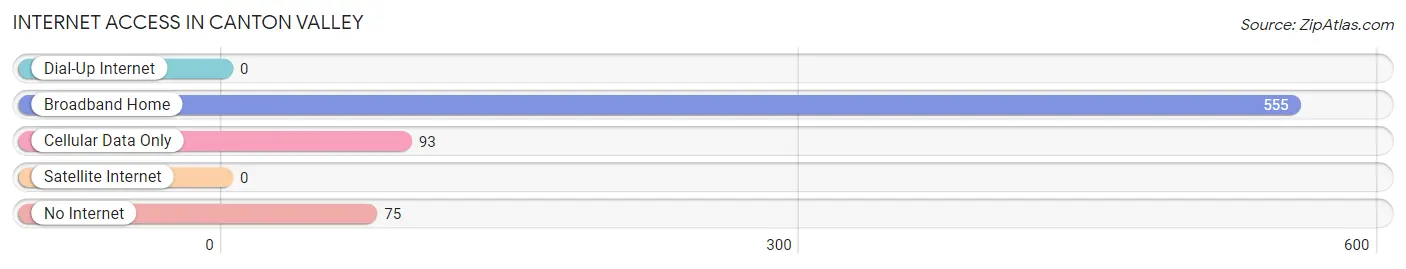
| Internet Type | # Households | % Households |
| Dial-Up Internet | 0 | 0.0% |
| Broadband Home | 555 | 76.8% |
| Cellular Data Only | 93 | 12.9% |
| Satellite Internet | 0 | 0.0% |
| No Internet | 75 | 10.4% |
| Total | 723 | 100.0% |
Canton Valley Summary
Canton Valley is a small town located in the Farmington Valley region of Connecticut. It is situated in the town of Canton, which is part of Hartford County. The town is bordered by the towns of Avon, Burlington, and Simsbury. The population of Canton Valley was 4,845 at the 2010 census.
History
The area that is now Canton Valley was originally inhabited by the Tunxis Native American tribe. The first European settlers arrived in the area in the late 17th century. The town of Canton was incorporated in 1806, and the area that is now Canton Valley was part of the town. The area was primarily agricultural, with some small-scale industry.
In the late 19th century, the area began to develop as a residential suburb of Hartford. The town of Canton was divided into two parts in 1871, with the northern part becoming the town of Avon. The area that is now Canton Valley remained part of the town of Canton.
In the early 20th century, the area began to develop as a residential suburb of Hartford. The town of Canton was divided into two parts in 1871, with the northern part becoming the town of Avon. The area that is now Canton Valley remained part of the town of Canton.
In the 1950s, the area began to develop as a residential suburb of Hartford. The town of Canton was divided into two parts in 1871, with the northern part becoming the town of Avon. The area that is now Canton Valley remained part of the town of Canton.
In the late 20th century, the area began to develop as a residential suburb of Hartford. The town of Canton was divided into two parts in 1871, with the northern part becoming the town of Avon. The area that is now Canton Valley remained part of the town of Canton.
Geography
Canton Valley is located in the Farmington Valley region of Connecticut. It is situated in the town of Canton, which is part of Hartford County. The town is bordered by the towns of Avon, Burlington, and Simsbury. The town is located in the western part of the state, about 20 miles from Hartford.
The terrain of Canton Valley is mostly hilly, with some flat areas. The town is located in the Farmington River Valley, and the river runs through the town. The town is also home to several small lakes and ponds.
Economy
The economy of Canton Valley is primarily based on services and retail. The town is home to several small businesses, including restaurants, shops, and professional services. The town is also home to several large employers, including the University of Connecticut Health Center and the Hartford Hospital.
The town is also home to several small manufacturing companies, including a plastics manufacturer and a metal fabrication company. The town is also home to several small farms, which produce a variety of crops.
Demographics
As of the 2010 census, the population of Canton Valley was 4,845. The population is primarily white (90.2%), with small percentages of African American (3.2%), Asian (2.3%), and Hispanic (2.2%) residents. The median household income is $90,945, and the median home value is $323,400.
The town is served by the Canton Public Schools, which includes four elementary schools, one middle school, and one high school. The town is also home to several private schools, including the Canton Academy and the Canton Country Day School.
Conclusion
Canton Valley is a small town located in the Farmington Valley region of Connecticut. It is situated in the town of Canton, which is part of Hartford County. The town is bordered by the towns of Avon, Burlington, and Simsbury. The population of Canton Valley was 4,845 at the 2010 census. The economy of Canton Valley is primarily based on services and retail, and the town is home to several large employers. The population is primarily white, with small percentages of African American, Asian, and Hispanic residents. The town is served by the Canton Public Schools, and is also home to several private schools.
Common Questions
What is Per Capita Income in Canton Valley?
Per Capita income in Canton Valley is $41,879.
What is the Median Family Income in Canton Valley?
Median Family Income in Canton Valley is $84,038.
What is the Median Household income in Canton Valley?
Median Household Income in Canton Valley is $70,389.
What is Inequality or Gini Index in Canton Valley?
Inequality or Gini Index in Canton Valley is 0.44.
What is the Total Population of Canton Valley?
Total Population of Canton Valley is 1,484.
What is the Total Male Population of Canton Valley?
Total Male Population of Canton Valley is 756.
What is the Total Female Population of Canton Valley?
Total Female Population of Canton Valley is 728.
What is the Ratio of Males per 100 Females in Canton Valley?
There are 103.85 Males per 100 Females in Canton Valley.
What is the Ratio of Females per 100 Males in Canton Valley?
There are 96.30 Females per 100 Males in Canton Valley.
What is the Median Population Age in Canton Valley?
Median Population Age in Canton Valley is 40.3 Years.
What is the Average Family Size in Canton Valley
Average Family Size in Canton Valley is 2.6 People.
What is the Average Household Size in Canton Valley
Average Household Size in Canton Valley is 2.0 People.
How Large is the Labor Force in Canton Valley?
There are 676 People in the Labor Forcein in Canton Valley.
What is the Percentage of People in the Labor Force in Canton Valley?
54.2% of People are in the Labor Force in Canton Valley.
What is the Unemployment Rate in Canton Valley?
Unemployment Rate in Canton Valley is 0.3%.