Cities with the Highest Percentage of Self-Employed / Incorporated in Connecticut
RELATED REPORTS & OPTIONS
Self-Employed / Incorporated
Connecticut
Compare Cities
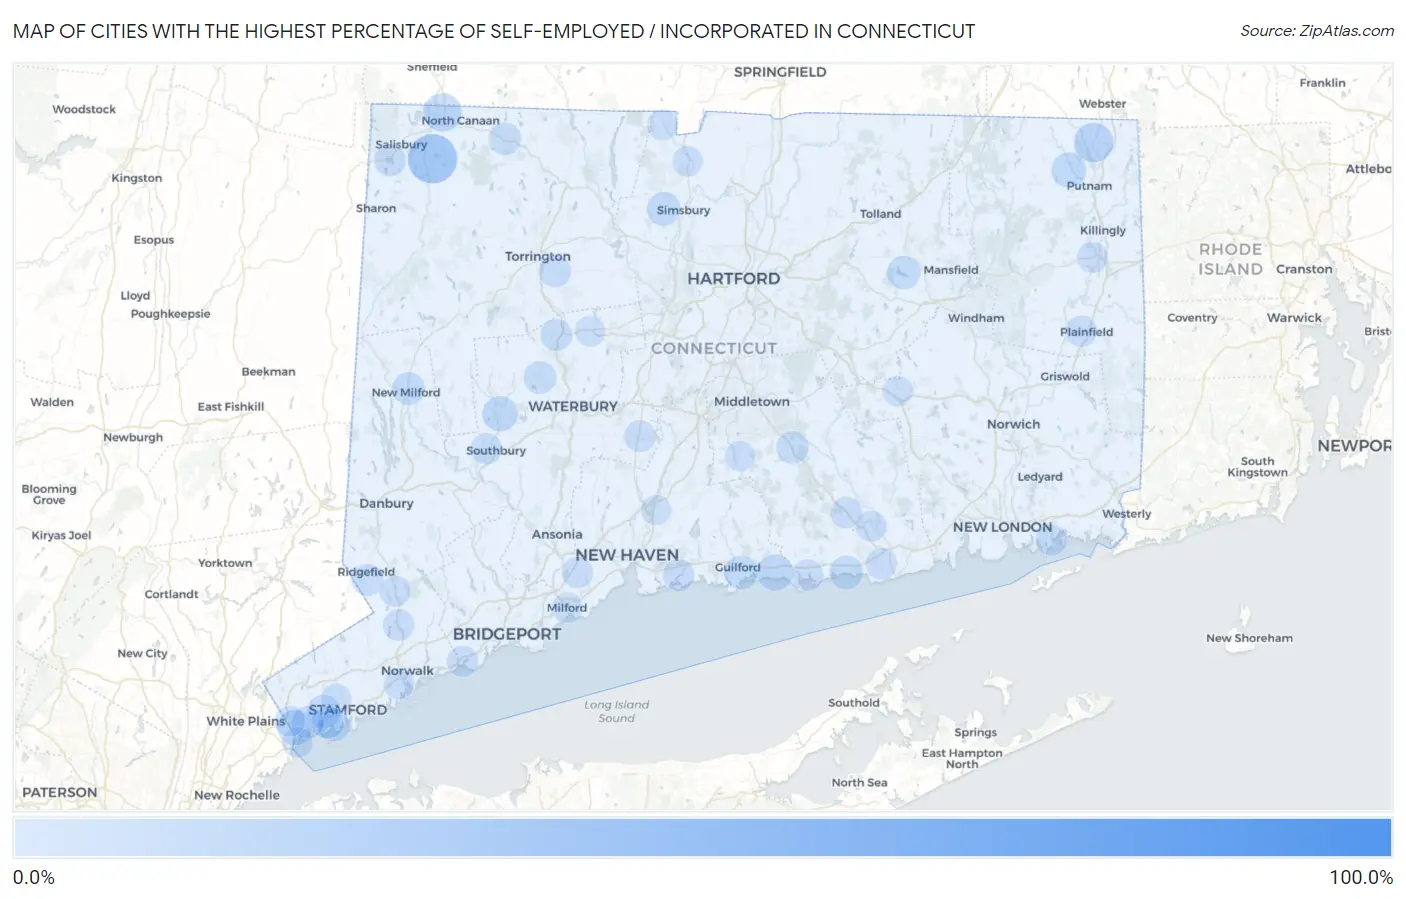
Map of Cities with the Highest Percentage of Self-Employed / Incorporated in Connecticut
0.0%
100.0%
Cities with the Highest Percentage of Self-Employed / Incorporated in Connecticut
| City | % Self-Employed / Incorporated | vs State | vs National | |
| 1. | Chimney Point | 100.0% | 3.5%(+96.5)#1 | 3.8%(+96.2)#6 |
| 2. | Sherman | 52.2% | 3.5%(+48.7)#2 | 3.8%(+48.4)#82 |
| 3. | Falls Village | 31.5% | 3.5%(+28.0)#3 | 3.8%(+27.7)#230 |
| 4. | Hawleyville | 26.3% | 3.5%(+22.8)#4 | 3.8%(+22.5)#340 |
| 5. | Mill Plain | 21.5% | 3.5%(+18.0)#5 | 3.8%(+17.7)#517 |
| 6. | Redding Center | 19.0% | 3.5%(+15.6)#6 | 3.8%(+15.2)#695 |
| 7. | North Grosvenor Dale | 17.0% | 3.5%(+13.5)#7 | 3.8%(+13.1)#862 |
| 8. | Rock Ridge | 16.1% | 3.5%(+12.6)#8 | 3.8%(+12.3)#934 |
| 9. | Canaan | 15.2% | 3.5%(+11.7)#9 | 3.8%(+11.4)#1,043 |
| 10. | Old Hill | 14.7% | 3.5%(+11.2)#10 | 3.8%(+10.9)#1,123 |
| 11. | West Mountain | 14.2% | 3.5%(+10.7)#11 | 3.8%(+10.4)#1,193 |
| 12. | Route 7 Gateway | 14.0% | 3.5%(+10.5)#12 | 3.8%(+10.2)#1,240 |
| 13. | Coleytown | 13.5% | 3.5%(+10.0)#13 | 3.8%(+9.68)#1,325 |
| 14. | Poplar Plains | 13.0% | 3.5%(+9.51)#14 | 3.8%(+9.18)#1,424 |
| 15. | Madison Center | 12.0% | 3.5%(+8.52)#15 | 3.8%(+8.19)#1,657 |
| 16. | Candlewood Shores | 11.3% | 3.5%(+7.83)#16 | 3.8%(+7.50)#1,846 |
| 17. | Woodbury Center | 10.9% | 3.5%(+7.46)#17 | 3.8%(+7.13)#1,955 |
| 18. | Pemberwick | 10.9% | 3.5%(+7.43)#18 | 3.8%(+7.10)#1,962 |
| 19. | Greens Farms | 10.9% | 3.5%(+7.42)#19 | 3.8%(+7.09)#1,963 |
| 20. | South Woodstock | 10.4% | 3.5%(+6.93)#20 | 3.8%(+6.60)#2,134 |
| 21. | South Wilton | 10.0% | 3.5%(+6.55)#21 | 3.8%(+6.22)#2,264 |
| 22. | Witches Woods | 10.0% | 3.5%(+6.51)#22 | 3.8%(+6.18)#2,275 |
| 23. | Staples | 9.8% | 3.5%(+6.35)#23 | 3.8%(+6.02)#2,364 |
| 24. | Bridgewater | 9.7% | 3.5%(+6.23)#24 | 3.8%(+5.91)#2,395 |
| 25. | Cornwall Bridge | 9.6% | 3.5%(+6.09)#25 | 3.8%(+5.76)#2,455 |
| 26. | Groton Long Point Borough | 9.1% | 3.5%(+5.60)#26 | 3.8%(+5.27)#2,644 |
| 27. | West Simsbury | 8.8% | 3.5%(+5.32)#27 | 3.8%(+4.99)#2,813 |
| 28. | Guilford Center | 8.7% | 3.5%(+5.23)#28 | 3.8%(+4.90)#2,870 |
| 29. | Cornwall | 8.6% | 3.5%(+5.08)#29 | 3.8%(+4.75)#2,943 |
| 30. | Westbrook Center | 8.5% | 3.5%(+5.02)#30 | 3.8%(+4.69)#2,986 |
| 31. | Lakes East | 8.2% | 3.5%(+4.67)#31 | 3.8%(+4.34)#3,236 |
| 32. | South Coventry | 8.0% | 3.5%(+4.55)#32 | 3.8%(+4.22)#3,313 |
| 33. | Cos Cob | 7.8% | 3.5%(+4.27)#33 | 3.8%(+3.94)#3,523 |
| 34. | New Milford | 7.6% | 3.5%(+4.14)#34 | 3.8%(+3.82)#3,635 |
| 35. | Old Greenwich | 7.6% | 3.5%(+4.13)#35 | 3.8%(+3.80)#3,645 |
| 36. | Tokeneke | 7.4% | 3.5%(+3.88)#36 | 3.8%(+3.56)#3,843 |
| 37. | Watertown | 7.3% | 3.5%(+3.79)#37 | 3.8%(+3.47)#3,922 |
| 38. | Stonington Borough | 7.2% | 3.5%(+3.75)#38 | 3.8%(+3.42)#3,964 |
| 39. | Murray | 6.9% | 3.5%(+3.44)#39 | 3.8%(+3.11)#4,239 |
| 40. | Indian Field | 6.9% | 3.5%(+3.41)#40 | 3.8%(+3.08)#4,267 |
| 41. | Lordship | 6.9% | 3.5%(+3.40)#41 | 3.8%(+3.07)#4,286 |
| 42. | Greenwich | 6.8% | 3.5%(+3.36)#42 | 3.8%(+3.03)#4,341 |
| 43. | Ball Pond | 6.8% | 3.5%(+3.34)#43 | 3.8%(+3.01)#4,354 |
| 44. | Norfolk | 6.8% | 3.5%(+3.32)#44 | 3.8%(+2.99)#4,380 |
| 45. | Higganum | 6.7% | 3.5%(+3.24)#45 | 3.8%(+2.91)#4,456 |
| 46. | Mamanasco Lake | 6.6% | 3.5%(+3.14)#46 | 3.8%(+2.82)#4,553 |
| 47. | Noroton Heights | 6.6% | 3.5%(+3.10)#47 | 3.8%(+2.77)#4,609 |
| 48. | Riverside | 6.6% | 3.5%(+3.07)#48 | 3.8%(+2.74)#4,637 |
| 49. | Ridgebury | 6.6% | 3.5%(+3.06)#49 | 3.8%(+2.74)#4,645 |
| 50. | Weston | 6.3% | 3.5%(+2.79)#50 | 3.8%(+2.46)#4,926 |
| 51. | Trumbull Center | 6.1% | 3.5%(+2.65)#51 | 3.8%(+2.32)#5,097 |
| 52. | Lakeville | 6.1% | 3.5%(+2.65)#52 | 3.8%(+2.32)#5,098 |
| 53. | Stepney | 6.0% | 3.5%(+2.56)#53 | 3.8%(+2.23)#5,231 |
| 54. | Northwest Harwinton | 6.0% | 3.5%(+2.55)#54 | 3.8%(+2.22)#5,238 |
| 55. | Daniels Farm | 6.0% | 3.5%(+2.51)#55 | 3.8%(+2.18)#5,296 |
| 56. | Woodmont Borough | 6.0% | 3.5%(+2.50)#56 | 3.8%(+2.17)#5,306 |
| 57. | Thomaston | 6.0% | 3.5%(+2.49)#57 | 3.8%(+2.16)#5,312 |
| 58. | Westport | 5.9% | 3.5%(+2.40)#58 | 3.8%(+2.07)#5,426 |
| 59. | Cheshire Village | 5.7% | 3.5%(+2.24)#59 | 3.8%(+1.91)#5,658 |
| 60. | Dayville | 5.7% | 3.5%(+2.21)#60 | 3.8%(+1.88)#5,703 |
| 61. | Noroton | 5.6% | 3.5%(+2.13)#61 | 3.8%(+1.80)#5,805 |
| 62. | Branford Center | 5.6% | 3.5%(+2.09)#62 | 3.8%(+1.77)#5,846 |
| 63. | Ridgefield | 5.5% | 3.5%(+2.05)#63 | 3.8%(+1.72)#5,915 |
| 64. | Wilton Center | 5.5% | 3.5%(+1.97)#64 | 3.8%(+1.65)#6,031 |
| 65. | Clinton | 5.4% | 3.5%(+1.89)#65 | 3.8%(+1.56)#6,164 |
| 66. | Old Saybrook Center | 5.3% | 3.5%(+1.78)#66 | 3.8%(+1.45)#6,328 |
| 67. | Plainfield Village | 5.2% | 3.5%(+1.76)#67 | 3.8%(+1.43)#6,376 |
| 68. | Newtown Borough | 5.1% | 3.5%(+1.65)#68 | 3.8%(+1.32)#6,550 |
| 69. | Deep River Center | 5.0% | 3.5%(+1.56)#69 | 3.8%(+1.23)#6,694 |
| 70. | Compo | 5.0% | 3.5%(+1.53)#70 | 3.8%(+1.20)#6,737 |
| 71. | Tashua | 4.9% | 3.5%(+1.45)#71 | 3.8%(+1.12)#6,889 |
| 72. | Orange | 4.9% | 3.5%(+1.44)#72 | 3.8%(+1.11)#6,894 |
| 73. | Saugatuck | 4.9% | 3.5%(+1.42)#73 | 3.8%(+1.10)#6,933 |
| 74. | Sandy Hook | 4.8% | 3.5%(+1.34)#74 | 3.8%(+1.02)#7,058 |
| 75. | Heritage Village | 4.8% | 3.5%(+1.34)#75 | 3.8%(+1.01)#7,076 |
| 76. | Noank | 4.8% | 3.5%(+1.27)#76 | 3.8%(+0.940)#7,210 |
| 77. | Mechanicsville | 4.7% | 3.5%(+1.20)#77 | 3.8%(+0.874)#7,331 |
| 78. | Northford | 4.6% | 3.5%(+1.07)#78 | 3.8%(+0.745)#7,585 |
| 79. | Essex Village | 4.5% | 3.5%(+1.06)#79 | 3.8%(+0.731)#7,616 |
| 80. | Southport | 4.5% | 3.5%(+1.05)#80 | 3.8%(+0.723)#7,652 |
| 81. | Norwalk | 4.3% | 3.5%(+0.808)#81 | 3.8%(+0.480)#8,167 |
| 82. | East Brooklyn | 4.3% | 3.5%(+0.771)#82 | 3.8%(+0.443)#8,257 |
| 83. | Georgetown | 4.2% | 3.5%(+0.754)#83 | 3.8%(+0.426)#8,302 |
| 84. | Plattsville | 4.2% | 3.5%(+0.737)#84 | 3.8%(+0.408)#8,329 |
| 85. | Byram | 4.1% | 3.5%(+0.657)#85 | 3.8%(+0.329)#8,528 |
| 86. | North Granby | 4.1% | 3.5%(+0.650)#86 | 3.8%(+0.322)#8,546 |
| 87. | Milford City Balance | 4.1% | 3.5%(+0.628)#87 | 3.8%(+0.300)#8,595 |
| 88. | Salmon Brook | 4.0% | 3.5%(+0.558)#88 | 3.8%(+0.230)#8,753 |
| 89. | Stratford Downtown | 4.0% | 3.5%(+0.511)#89 | 3.8%(+0.183)#8,869 |
| 90. | Naugatuck Borough | 4.0% | 3.5%(+0.485)#90 | 3.8%(+0.157)#8,959 |
| 91. | Riverton | 3.9% | 3.5%(+0.459)#91 | 3.8%(+0.130)#9,020 |
| 92. | Terryville | 3.9% | 3.5%(+0.442)#92 | 3.8%(+0.113)#9,065 |
| 93. | Glenville | 3.8% | 3.5%(+0.341)#93 | 3.8%(+0.012)#9,336 |
| 94. | Candlewood Isle | 3.8% | 3.5%(+0.314)#94 | 3.8%(-0.015)#9,397 |
| 95. | Colchester | 3.8% | 3.5%(+0.277)#95 | 3.8%(-0.052)#9,499 |
| 96. | Durham | 3.8% | 3.5%(+0.275)#96 | 3.8%(-0.054)#9,503 |
| 97. | Stamford | 3.7% | 3.5%(+0.215)#97 | 3.8%(-0.113)#9,644 |
| 98. | Litchfield Borough | 3.7% | 3.5%(+0.215)#98 | 3.8%(-0.113)#9,647 |
| 99. | Bigelow Corners | 3.6% | 3.5%(+0.121)#99 | 3.8%(-0.207)#9,944 |
| 100. | North Haven | 3.4% | 3.5%(-0.073)#100 | 3.8%(-0.402)#10,535 |
Common Questions
What are the Top 10 Cities with the Highest Percentage of Self-Employed / Incorporated in Connecticut?
Top 10 Cities with the Highest Percentage of Self-Employed / Incorporated in Connecticut are:
#1
31.5%
#2
17.0%
#3
15.2%
#4
12.0%
#5
10.9%
#6
10.9%
#7
10.4%
#8
8.8%
#9
8.7%
#10
8.5%
What city has the Highest Percentage of Self-Employed / Incorporated in Connecticut?
Falls Village has the Highest Percentage of Self-Employed / Incorporated in Connecticut with 31.5%.
What is the Percentage of Self-Employed / Incorporated in the State of Connecticut?
Percentage of Self-Employed / Incorporated in Connecticut is 3.5%.
What is the Percentage of Self-Employed / Incorporated in the United States?
Percentage of Self-Employed / Incorporated in the United States is 3.8%.