Quinebaug, CT Map & Demographics
Quinebaug Map
Quinebaug Overview
$43,066
PER CAPITA INCOME
$86,658
AVG FAMILY INCOME
$73,565
AVG HOUSEHOLD INCOME
64.1%
WAGE / INCOME GAP [ % ]
35.9¢/ $1
WAGE / INCOME GAP [ $ ]
0.36
INEQUALITY / GINI INDEX
946
TOTAL POPULATION
503
MALE POPULATION
443
FEMALE POPULATION
113.54
MALES / 100 FEMALES
88.07
FEMALES / 100 MALES
65.1
MEDIAN AGE
2.2
AVG FAMILY SIZE
1.7
AVG HOUSEHOLD SIZE
532
LABOR FORCE [ PEOPLE ]
58.3%
PERCENT IN LABOR FORCE
10.2%
UNEMPLOYMENT RATE
Quinebaug Zip Codes
Quinebaug Area Codes
Income in Quinebaug
Income Overview in Quinebaug
Per Capita Income in Quinebaug is $43,066, while median incomes of families and households are $86,658 and $73,565 respectively.
| Characteristic | Number | Measure |
| Per Capita Income | 946 | $43,066 |
| Median Family Income | 309 | $86,658 |
| Mean Family Income | 309 | $106,913 |
| Median Household Income | 550 | $73,565 |
| Mean Household Income | 550 | $81,727 |
| Income Deficit | 309 | $0 |
| Wage / Income Gap (%) | 946 | 64.08% |
| Wage / Income Gap ($) | 946 | 35.92¢ per $1 |
| Gini / Inequality Index | 946 | 0.36 |
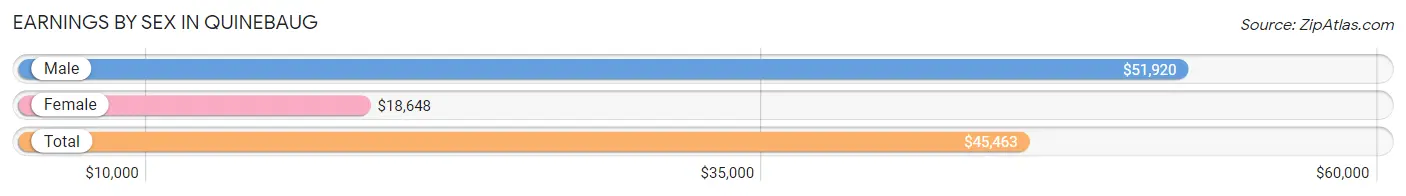
Earnings by Sex in Quinebaug
Average Earnings in Quinebaug are $45,463, $51,920 for men and $18,648 for women, a difference of 64.1%.
| Sex | Number | Average Earnings |
| Male | 285 (51.4%) | $51,920 |
| Female | 269 (48.6%) | $18,648 |
| Total | 554 (100.0%) | $45,463 |
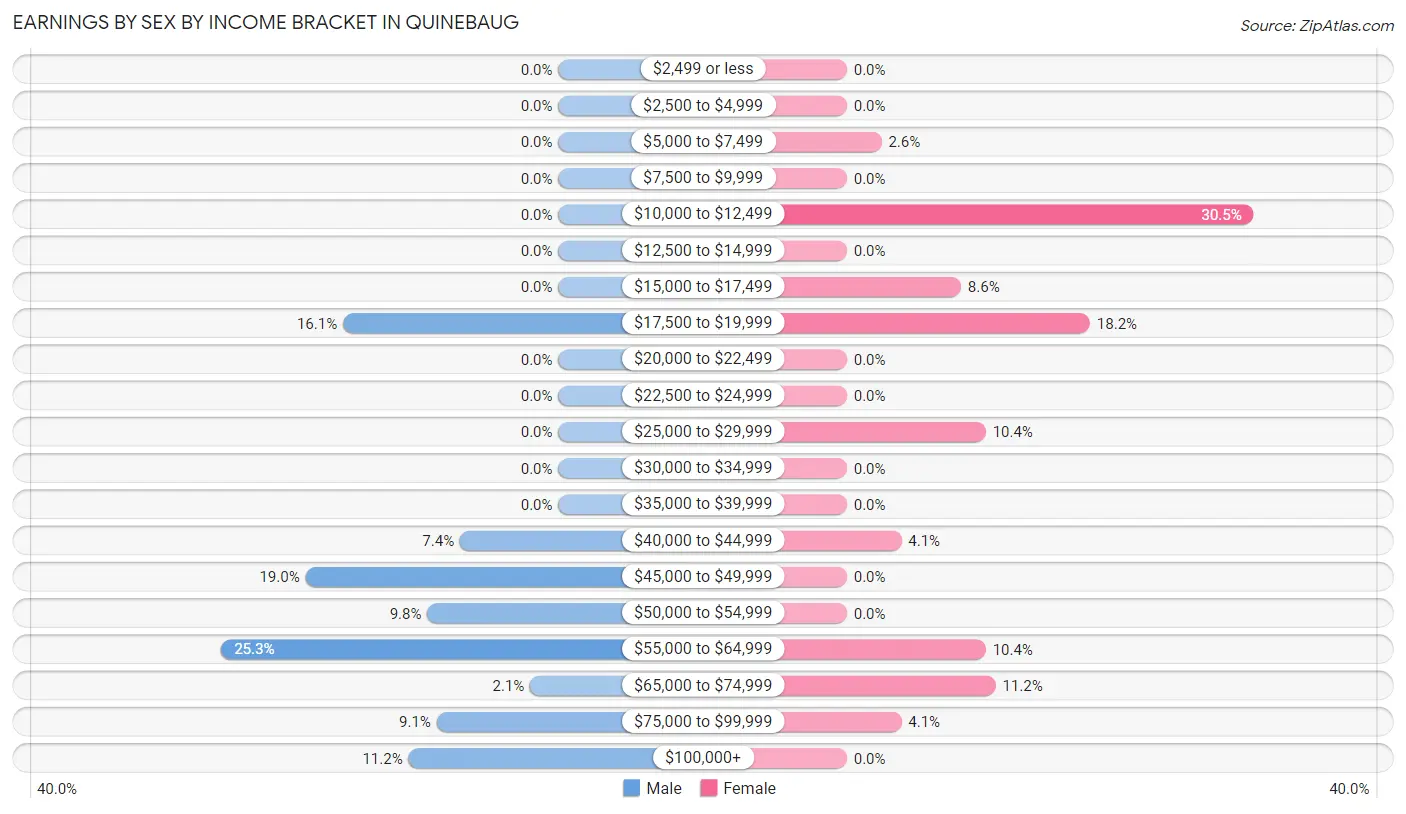
Earnings by Sex by Income Bracket in Quinebaug
The most common earnings brackets in Quinebaug are $55,000 to $64,999 for men (72 | 25.3%) and $10,000 to $12,499 for women (82 | 30.5%).
| Income | Male | Female |
| $2,499 or less | 0 (0.0%) | 0 (0.0%) |
| $2,500 to $4,999 | 0 (0.0%) | 0 (0.0%) |
| $5,000 to $7,499 | 0 (0.0%) | 7 (2.6%) |
| $7,500 to $9,999 | 0 (0.0%) | 0 (0.0%) |
| $10,000 to $12,499 | 0 (0.0%) | 82 (30.5%) |
| $12,500 to $14,999 | 0 (0.0%) | 0 (0.0%) |
| $15,000 to $17,499 | 0 (0.0%) | 23 (8.6%) |
| $17,500 to $19,999 | 46 (16.1%) | 49 (18.2%) |
| $20,000 to $22,499 | 0 (0.0%) | 0 (0.0%) |
| $22,500 to $24,999 | 0 (0.0%) | 0 (0.0%) |
| $25,000 to $29,999 | 0 (0.0%) | 28 (10.4%) |
| $30,000 to $34,999 | 0 (0.0%) | 0 (0.0%) |
| $35,000 to $39,999 | 0 (0.0%) | 0 (0.0%) |
| $40,000 to $44,999 | 21 (7.4%) | 11 (4.1%) |
| $45,000 to $49,999 | 54 (19.0%) | 0 (0.0%) |
| $50,000 to $54,999 | 28 (9.8%) | 0 (0.0%) |
| $55,000 to $64,999 | 72 (25.3%) | 28 (10.4%) |
| $65,000 to $74,999 | 6 (2.1%) | 30 (11.2%) |
| $75,000 to $99,999 | 26 (9.1%) | 11 (4.1%) |
| $100,000+ | 32 (11.2%) | 0 (0.0%) |
| Total | 285 (100.0%) | 269 (100.0%) |
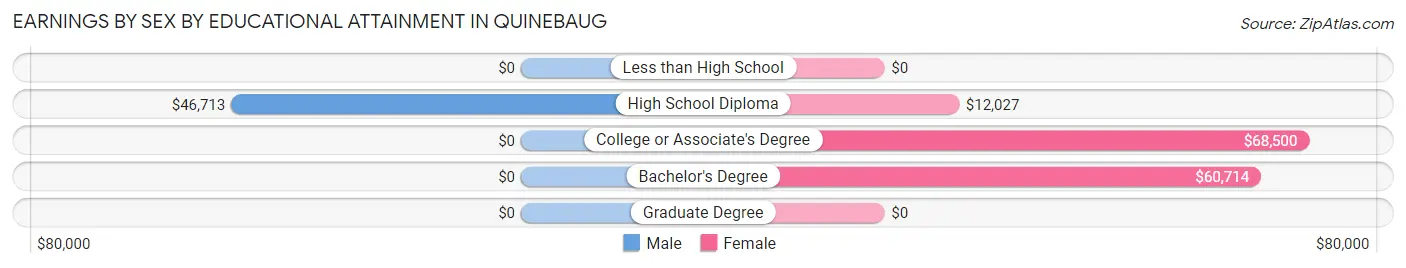
Earnings by Sex by Educational Attainment in Quinebaug
Average earnings in Quinebaug are $51,920 for men and $18,648 for women, a difference of 64.1%. Men with an educational attainment of high school diploma enjoy the highest average annual earnings of $46,713, while those with high school diploma education earn the least with $46,713. Women with an educational attainment of college or associate's degree earn the most with the average annual earnings of $68,500, while those with high school diploma education have the smallest earnings of $12,027.
| Educational Attainment | Male Income | Female Income |
| Less than High School | - | - |
| High School Diploma | $46,713 | $12,027 |
| College or Associate's Degree | - | - |
| Bachelor's Degree | - | - |
| Graduate Degree | - | - |
| Total | $51,920 | $18,648 |
Family Income in Quinebaug
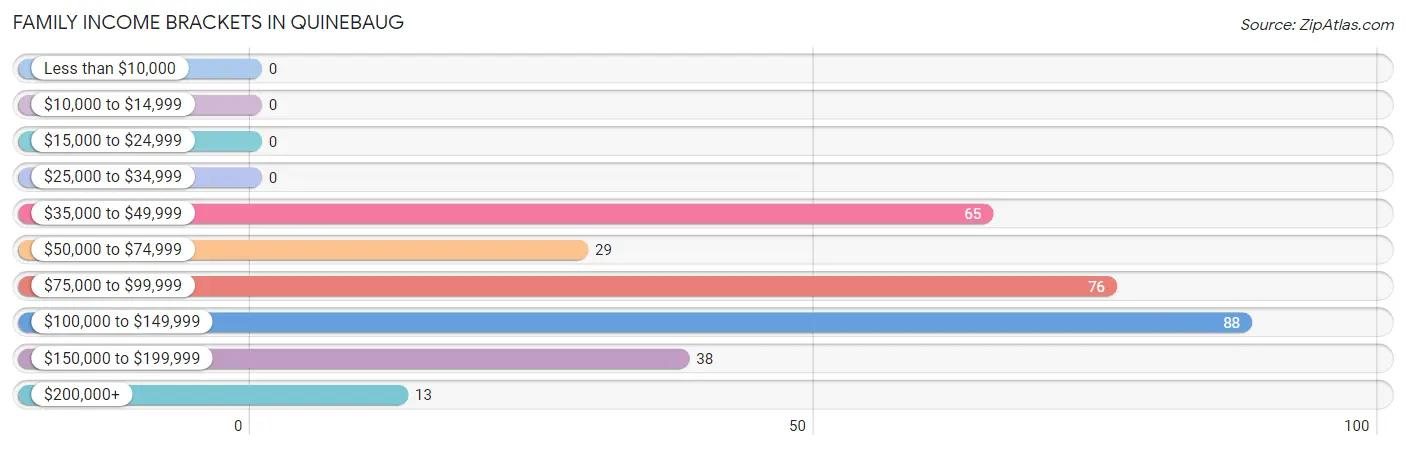
Family Income Brackets in Quinebaug
According to the Quinebaug family income data, there are 88 families falling into the $100,000 to $149,999 income range, which is the most common income bracket and makes up 28.5% of all families.
| Income Bracket | # Families | % Families |
| Less than $10,000 | 0 | 0.0% |
| $10,000 to $14,999 | 0 | 0.0% |
| $15,000 to $24,999 | 0 | 0.0% |
| $25,000 to $34,999 | 0 | 0.0% |
| $35,000 to $49,999 | 65 | 21.0% |
| $50,000 to $74,999 | 29 | 9.4% |
| $75,000 to $99,999 | 76 | 24.6% |
| $100,000 to $149,999 | 88 | 28.5% |
| $150,000 to $199,999 | 38 | 12.3% |
| $200,000+ | 13 | 4.2% |
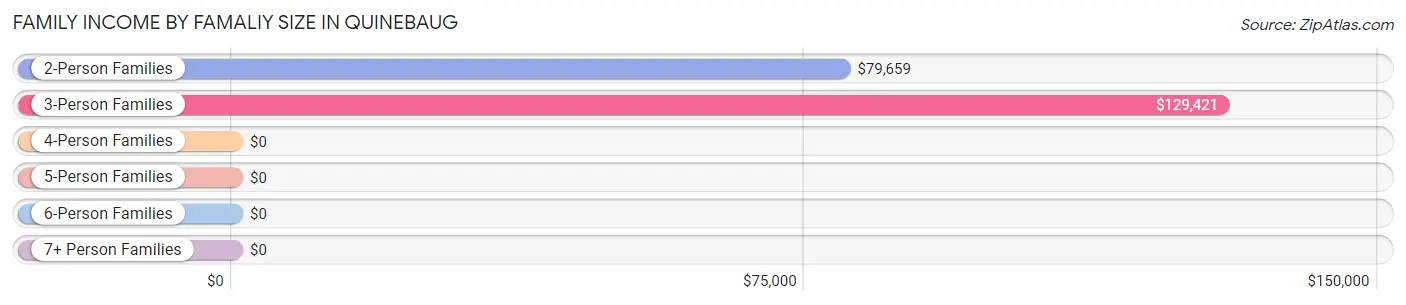
Family Income by Famaliy Size in Quinebaug
3-person families (127 | 41.1%) account for the highest median family income in Quinebaug with $129,421 per family, while 3-person families (127 | 41.1%) have the highest median income of $43,140 per family member.
| Income Bracket | # Families | Median Income |
| 2-Person Families | 182 (58.9%) | $79,659 |
| 3-Person Families | 127 (41.1%) | $129,421 |
| 4-Person Families | 0 (0.0%) | $0 |
| 5-Person Families | 0 (0.0%) | $0 |
| 6-Person Families | 0 (0.0%) | $0 |
| 7+ Person Families | 0 (0.0%) | $0 |
| Total | 309 (100.0%) | $86,658 |
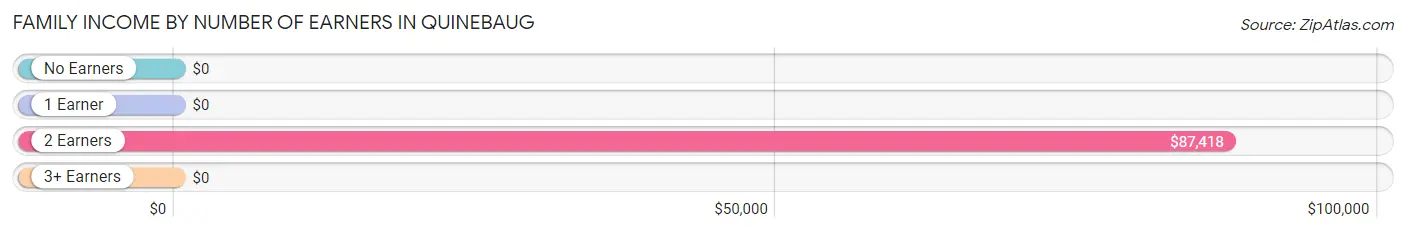
Family Income by Number of Earners in Quinebaug
| Number of Earners | # Families | Median Income |
| No Earners | 74 (23.9%) | $0 |
| 1 Earner | 34 (11.0%) | $0 |
| 2 Earners | 147 (47.6%) | $87,418 |
| 3+ Earners | 54 (17.5%) | $0 |
| Total | 309 (100.0%) | $86,658 |
Household Income in Quinebaug
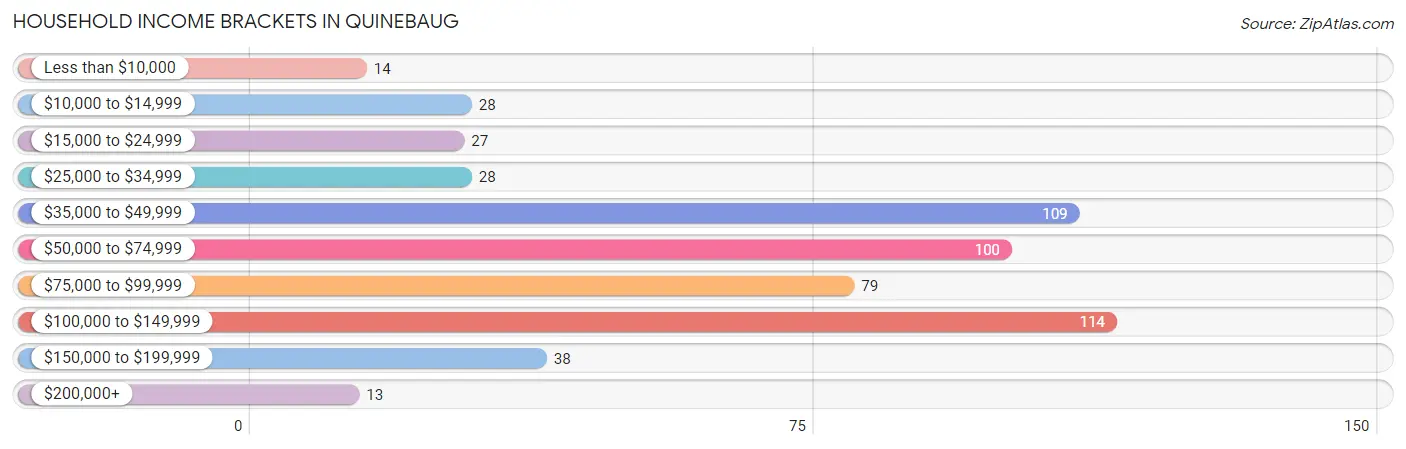
Household Income Brackets in Quinebaug
With 114 households falling in the category, the $100,000 to $149,999 income range is the most frequent in Quinebaug, accounting for 20.7% of all households. In contrast, only 13 households (2.4%) fall into the $200,000+ income bracket, making it the least populous group.
| Income Bracket | # Households | % Households |
| Less than $10,000 | 14 | 2.5% |
| $10,000 to $14,999 | 28 | 5.1% |
| $15,000 to $24,999 | 27 | 4.9% |
| $25,000 to $34,999 | 28 | 5.1% |
| $35,000 to $49,999 | 109 | 19.8% |
| $50,000 to $74,999 | 100 | 18.2% |
| $75,000 to $99,999 | 79 | 14.4% |
| $100,000 to $149,999 | 114 | 20.7% |
| $150,000 to $199,999 | 38 | 6.9% |
| $200,000+ | 13 | 2.4% |
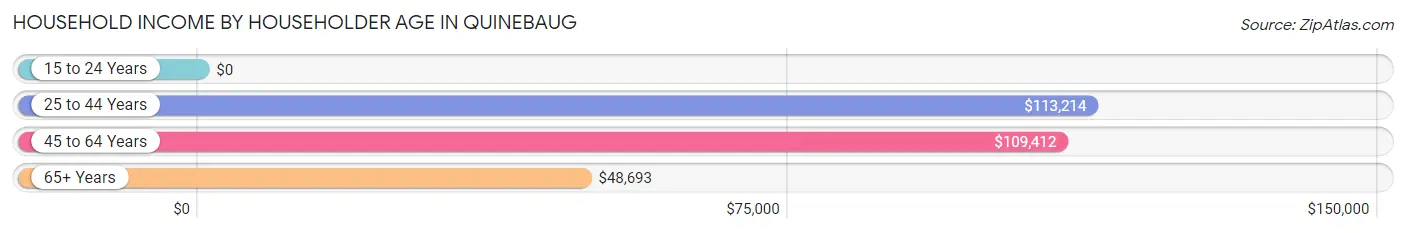
Household Income by Householder Age in Quinebaug
The median household income in Quinebaug is $73,565, with the highest median household income of $113,214 found in the 25 to 44 years age bracket for the primary householder. A total of 62 households (11.3%) fall into this category.
| Income Bracket | # Households | Median Income |
| 15 to 24 Years | 0 (0.0%) | $0 |
| 25 to 44 Years | 62 (11.3%) | $113,214 |
| 45 to 64 Years | 132 (24.0%) | $109,412 |
| 65+ Years | 356 (64.7%) | $48,693 |
| Total | 550 (100.0%) | $73,565 |
Poverty in Quinebaug
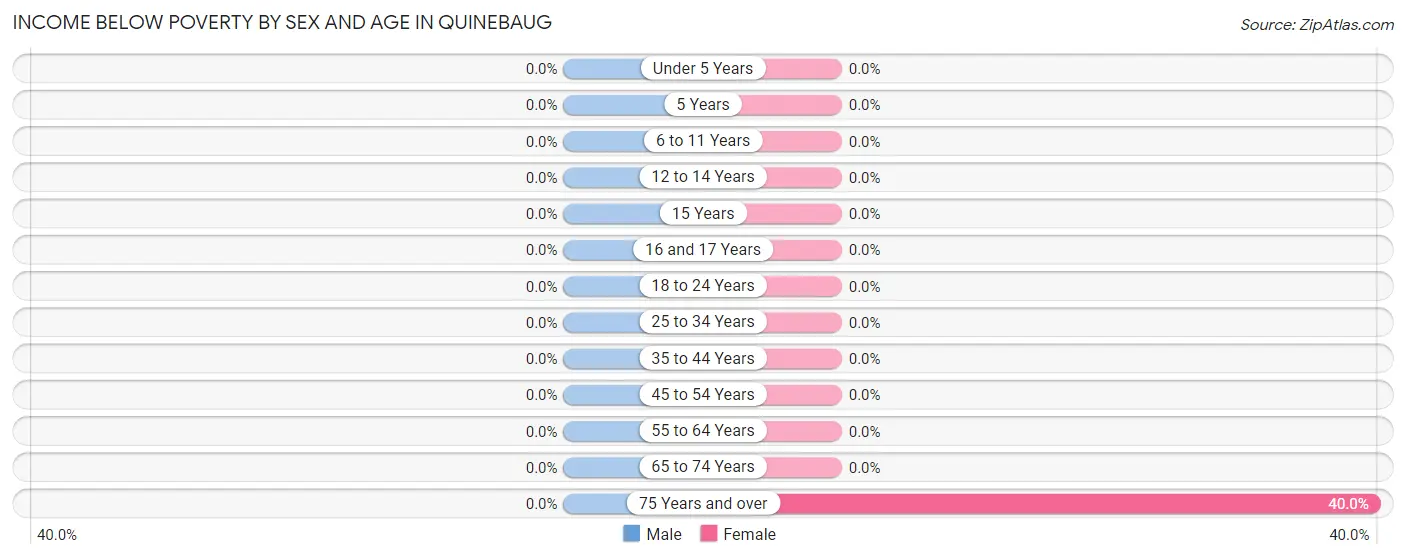
Income Below Poverty by Sex and Age in Quinebaug
| Age Bracket | Male | Female |
| Under 5 Years | 0 (0.0%) | 0 (0.0%) |
| 5 Years | 0 (0.0%) | 0 (0.0%) |
| 6 to 11 Years | 0 (0.0%) | 0 (0.0%) |
| 12 to 14 Years | 0 (0.0%) | 0 (0.0%) |
| 15 Years | 0 (0.0%) | 0 (0.0%) |
| 16 and 17 Years | 0 (0.0%) | 0 (0.0%) |
| 18 to 24 Years | 0 (0.0%) | 0 (0.0%) |
| 25 to 34 Years | 0 (0.0%) | 0 (0.0%) |
| 35 to 44 Years | 0 (0.0%) | 0 (0.0%) |
| 45 to 54 Years | 0 (0.0%) | 0 (0.0%) |
| 55 to 64 Years | 0 (0.0%) | 0 (0.0%) |
| 65 to 74 Years | 0 (0.0%) | 0 (0.0%) |
| 75 Years and over | 0 (0.0%) | 14 (40.0%) |
| Total | 0 (0.0%) | 14 (3.2%) |
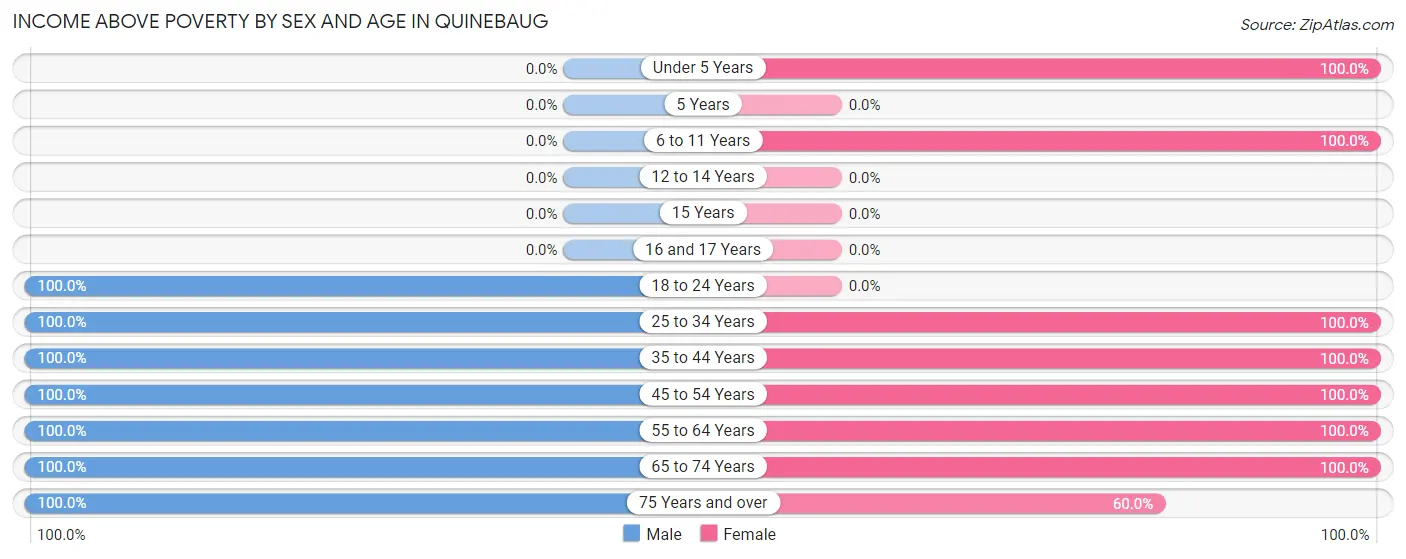
Income Above Poverty by Sex and Age in Quinebaug
According to the poverty statistics in Quinebaug, males aged 18 to 24 years and females aged under 5 years are the age groups that are most secure financially, with 100.0% of males and 100.0% of females in these age groups living above the poverty line.
| Age Bracket | Male | Female |
| Under 5 Years | 0 (0.0%) | 12 (100.0%) |
| 5 Years | 0 (0.0%) | 0 (0.0%) |
| 6 to 11 Years | 0 (0.0%) | 22 (100.0%) |
| 12 to 14 Years | 0 (0.0%) | 0 (0.0%) |
| 15 Years | 0 (0.0%) | 0 (0.0%) |
| 16 and 17 Years | 0 (0.0%) | 0 (0.0%) |
| 18 to 24 Years | 17 (100.0%) | 0 (0.0%) |
| 25 to 34 Years | 75 (100.0%) | 67 (100.0%) |
| 35 to 44 Years | 39 (100.0%) | 18 (100.0%) |
| 45 to 54 Years | 54 (100.0%) | 55 (100.0%) |
| 55 to 64 Years | 75 (100.0%) | 29 (100.0%) |
| 65 to 74 Years | 176 (100.0%) | 205 (100.0%) |
| 75 Years and over | 67 (100.0%) | 21 (60.0%) |
| Total | 503 (100.0%) | 429 (96.8%) |
Income Below Poverty Among Married-Couple Families in Quinebaug
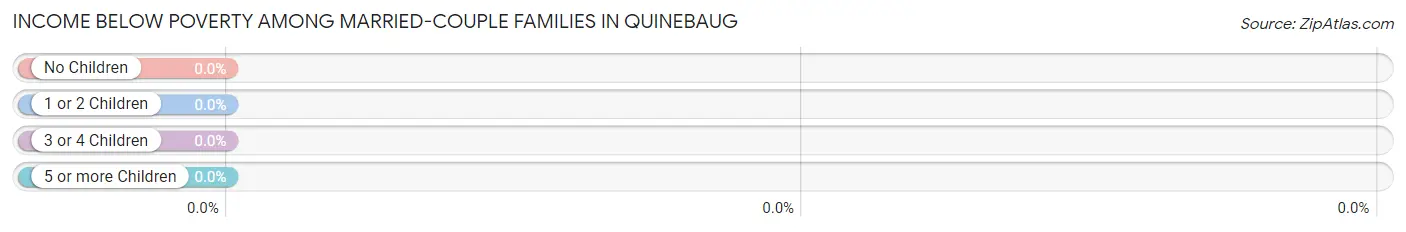
| Children | Above Poverty | Below Poverty |
| No Children | 277 (100.0%) | 0 (0.0%) |
| 1 or 2 Children | 11 (100.0%) | 0 (0.0%) |
| 3 or 4 Children | 0 (0.0%) | 0 (0.0%) |
| 5 or more Children | 0 (0.0%) | 0 (0.0%) |
| Total | 288 (100.0%) | 0 (0.0%) |
Income Below Poverty Among Single-Parent Households in Quinebaug
| Children | Single Father | Single Mother |
| No Children | 0 (0.0%) | 0 (0.0%) |
| 1 or 2 Children | 0 (0.0%) | 0 (0.0%) |
| 3 or 4 Children | 0 (0.0%) | 0 (0.0%) |
| 5 or more Children | 0 (0.0%) | 0 (0.0%) |
| Total | 0 (0.0%) | 0 (0.0%) |
Income Below Poverty Among Married-Couple vs Single-Parent Households in Quinebaug
| Children | Married-Couple Families | Single-Parent Households |
| No Children | 0 (0.0%) | 0 (0.0%) |
| 1 or 2 Children | 0 (0.0%) | 0 (0.0%) |
| 3 or 4 Children | 0 (0.0%) | 0 (0.0%) |
| 5 or more Children | 0 (0.0%) | 0 (0.0%) |
| Total | 0 (0.0%) | 0 (0.0%) |
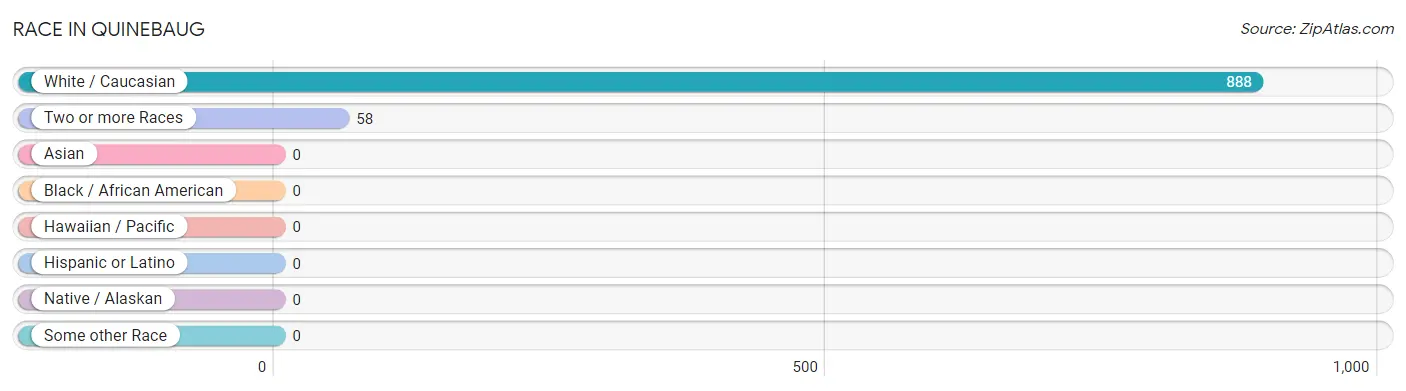
Race in Quinebaug
The most populous races in Quinebaug are White / Caucasian (888 | 93.9%), and Two or more Races (58 | 6.1%).
| Race | # Population | % Population |
| Asian | 0 | 0.0% |
| Black / African American | 0 | 0.0% |
| Hawaiian / Pacific | 0 | 0.0% |
| Hispanic or Latino | 0 | 0.0% |
| Native / Alaskan | 0 | 0.0% |
| White / Caucasian | 888 | 93.9% |
| Two or more Races | 58 | 6.1% |
| Some other Race | 0 | 0.0% |
| Total | 946 | 100.0% |
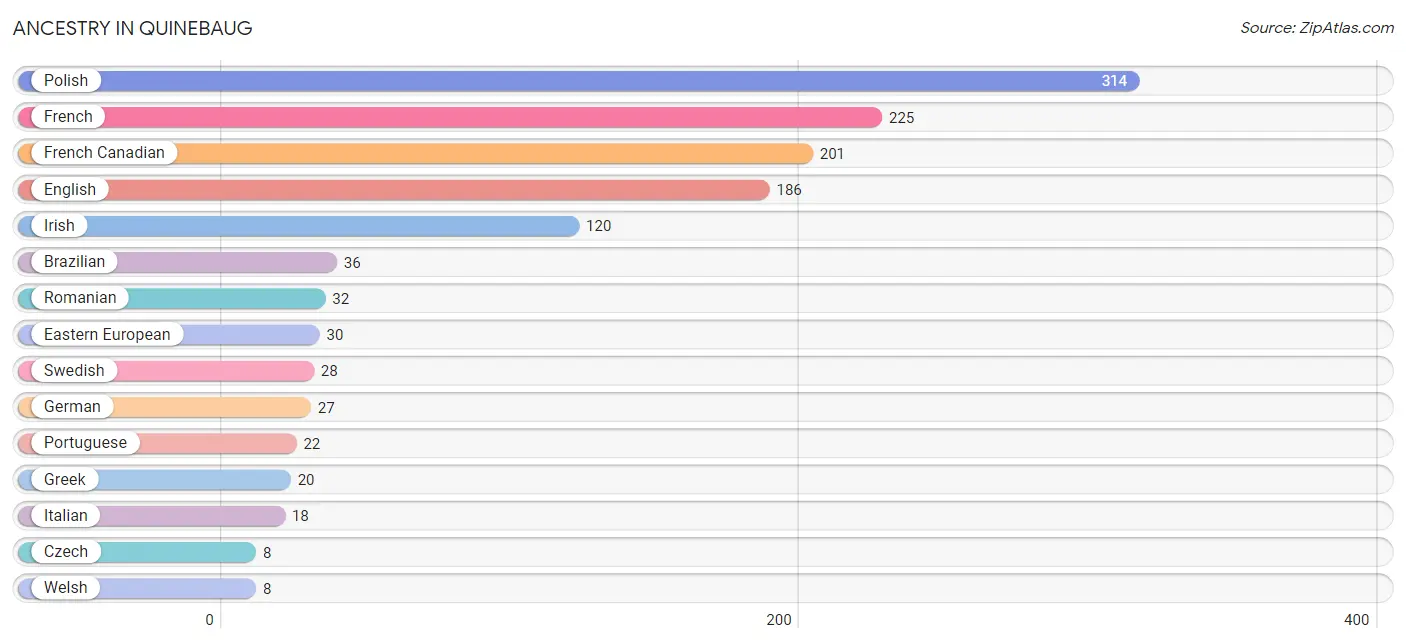
Ancestry in Quinebaug
The most populous ancestries reported in Quinebaug are Polish (314 | 33.2%), French (225 | 23.8%), French Canadian (201 | 21.2%), English (186 | 19.7%), and Irish (120 | 12.7%), together accounting for 110.6% of all Quinebaug residents.
| Ancestry | # Population | % Population |
| Brazilian | 36 | 3.8% |
| Czech | 8 | 0.9% |
| Eastern European | 30 | 3.2% |
| English | 186 | 19.7% |
| European | 7 | 0.7% |
| French | 225 | 23.8% |
| French Canadian | 201 | 21.2% |
| German | 27 | 2.9% |
| Greek | 20 | 2.1% |
| Irish | 120 | 12.7% |
| Italian | 18 | 1.9% |
| Polish | 314 | 33.2% |
| Portuguese | 22 | 2.3% |
| Romanian | 32 | 3.4% |
| Swedish | 28 | 3.0% |
| Welsh | 8 | 0.9% | View All 16 Rows |
Immigrants in Quinebaug
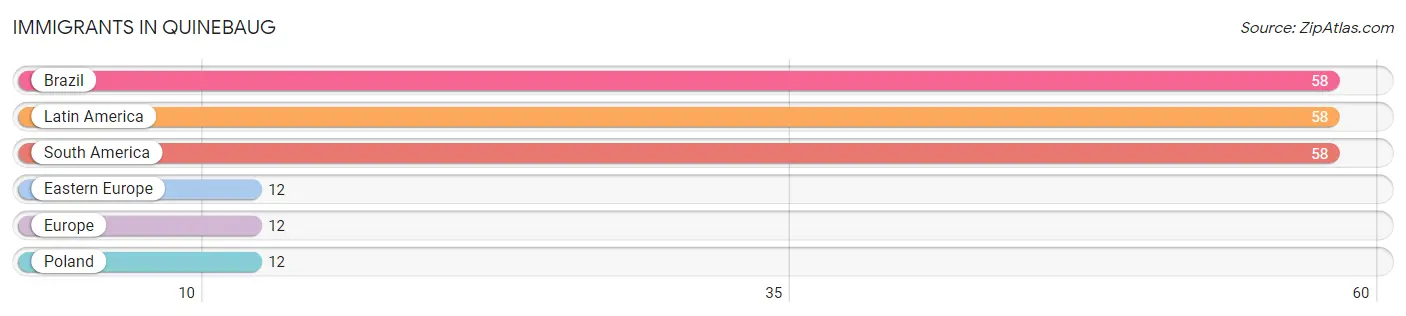
The most numerous immigrant groups reported in Quinebaug came from Brazil (58 | 6.1%), Latin America (58 | 6.1%), South America (58 | 6.1%), Eastern Europe (12 | 1.3%), and Europe (12 | 1.3%), together accounting for 20.9% of all Quinebaug residents.
| Immigration Origin | # Population | % Population |
| Brazil | 58 | 6.1% |
| Eastern Europe | 12 | 1.3% |
| Europe | 12 | 1.3% |
| Latin America | 58 | 6.1% |
| Poland | 12 | 1.3% |
| South America | 58 | 6.1% | View All 6 Rows |
Sex and Age in Quinebaug
Sex and Age in Quinebaug
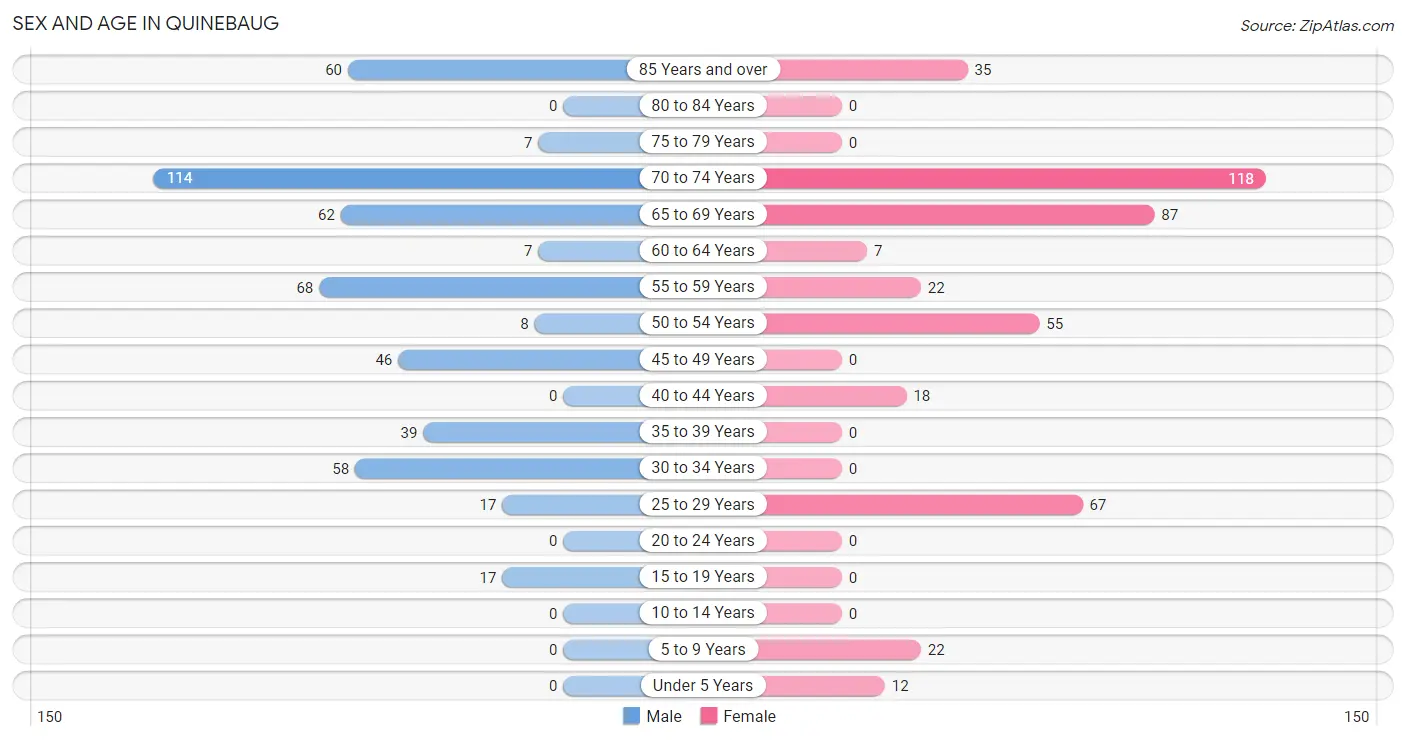
The most populous age groups in Quinebaug are 70 to 74 Years (114 | 22.7%) for men and 70 to 74 Years (118 | 26.6%) for women.
| Age Bracket | Male | Female |
| Under 5 Years | 0 (0.0%) | 12 (2.7%) |
| 5 to 9 Years | 0 (0.0%) | 22 (5.0%) |
| 10 to 14 Years | 0 (0.0%) | 0 (0.0%) |
| 15 to 19 Years | 17 (3.4%) | 0 (0.0%) |
| 20 to 24 Years | 0 (0.0%) | 0 (0.0%) |
| 25 to 29 Years | 17 (3.4%) | 67 (15.1%) |
| 30 to 34 Years | 58 (11.5%) | 0 (0.0%) |
| 35 to 39 Years | 39 (7.7%) | 0 (0.0%) |
| 40 to 44 Years | 0 (0.0%) | 18 (4.1%) |
| 45 to 49 Years | 46 (9.1%) | 0 (0.0%) |
| 50 to 54 Years | 8 (1.6%) | 55 (12.4%) |
| 55 to 59 Years | 68 (13.5%) | 22 (5.0%) |
| 60 to 64 Years | 7 (1.4%) | 7 (1.6%) |
| 65 to 69 Years | 62 (12.3%) | 87 (19.6%) |
| 70 to 74 Years | 114 (22.7%) | 118 (26.6%) |
| 75 to 79 Years | 7 (1.4%) | 0 (0.0%) |
| 80 to 84 Years | 0 (0.0%) | 0 (0.0%) |
| 85 Years and over | 60 (11.9%) | 35 (7.9%) |
| Total | 503 (100.0%) | 443 (100.0%) |
Families and Households in Quinebaug
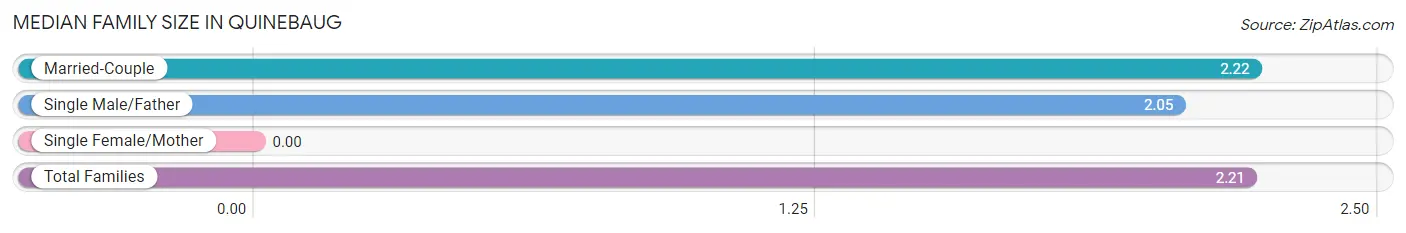
Median Family Size in Quinebaug
| Family Type | # Families | Family Size |
| Married-Couple | 288 (93.2%) | 2.22 |
| Single Male/Father | 21 (6.8%) | 2.05 |
| Single Female/Mother | 0 (0.0%) | - |
| Total Families | 309 (100.0%) | 2.21 |
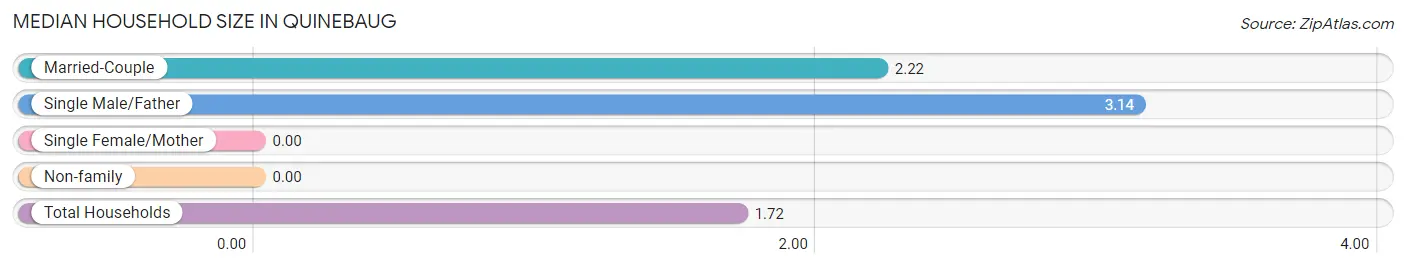
Median Household Size in Quinebaug
| Household Type | # Households | Household Size |
| Married-Couple | 288 (52.4%) | 2.22 |
| Single Male/Father | 21 (3.8%) | 3.14 |
| Single Female/Mother | 0 (0.0%) | - |
| Non-family | 241 (43.8%) | - |
| Total Households | 550 (100.0%) | 1.72 |
Household Size by Marriage Status in Quinebaug
Out of a total of 550 households in Quinebaug, 309 (56.2%) are family households, while 241 (43.8%) are nonfamily households. The most numerous type of family households are 2-person households, comprising 161, and the most common type of nonfamily households are 1-person households, comprising 241.
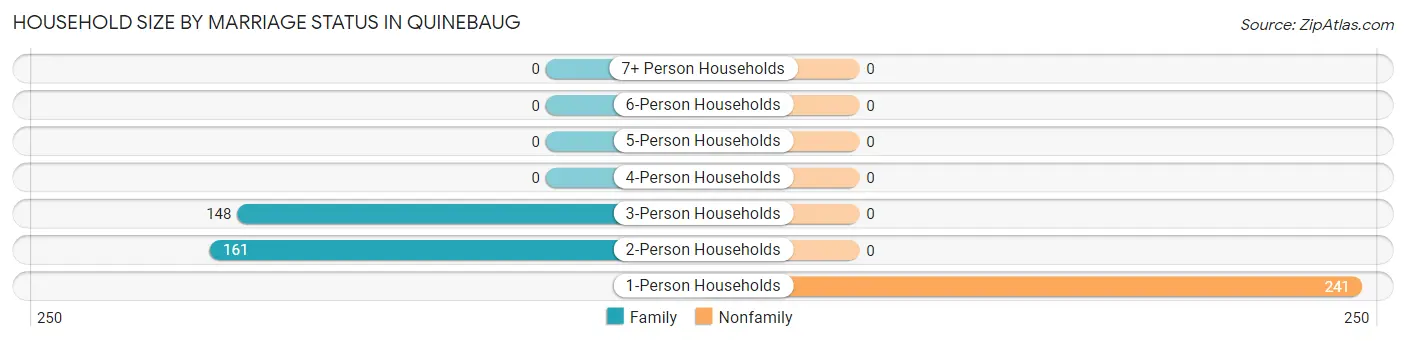
| Household Size | Family Households | Nonfamily Households |
| 1-Person Households | - | 241 (43.8%) |
| 2-Person Households | 161 (29.3%) | 0 (0.0%) |
| 3-Person Households | 148 (26.9%) | 0 (0.0%) |
| 4-Person Households | 0 (0.0%) | 0 (0.0%) |
| 5-Person Households | 0 (0.0%) | 0 (0.0%) |
| 6-Person Households | 0 (0.0%) | 0 (0.0%) |
| 7+ Person Households | 0 (0.0%) | 0 (0.0%) |
| Total | 309 (56.2%) | 241 (43.8%) |
Female Fertility in Quinebaug
Fertility by Age in Quinebaug
| Age Bracket | Women with Births | Births / 1,000 Women |
| 15 to 19 years | 0 (0.0%) | 0.0 |
| 20 to 34 years | 0 (0.0%) | 0.0 |
| 35 to 50 years | 0 (0.0%) | 0.0 |
| Total | 0 (0.0%) | 0.0 |
Fertility by Age by Marriage Status in Quinebaug
| Age Bracket | Married | Unmarried |
| 15 to 19 years | 0 (0.0%) | 0 (0.0%) |
| 20 to 34 years | 0 (0.0%) | 0 (0.0%) |
| 35 to 50 years | 0 (0.0%) | 0 (0.0%) |
| Total | 0 (0.0%) | 0 (0.0%) |
Fertility by Education in Quinebaug
| Educational Attainment | Women with Births | Births / 1,000 Women |
| Less than High School | 0 (0.0%) | 0.0 |
| High School Diploma | 0 (0.0%) | 0.0 |
| College or Associate's Degree | 0 (0.0%) | 0.0 |
| Bachelor's Degree | 0 (0.0%) | 0.0 |
| Graduate Degree | 0 (0.0%) | 0.0 |
| Total | 0 (0.0%) | 0.0 |
Fertility by Education by Marriage Status in Quinebaug
| Educational Attainment | Married | Unmarried |
| Less than High School | 0 (0.0%) | 0 (0.0%) |
| High School Diploma | 0 (0.0%) | 0 (0.0%) |
| College or Associate's Degree | 0 (0.0%) | 0 (0.0%) |
| Bachelor's Degree | 0 (0.0%) | 0 (0.0%) |
| Graduate Degree | 0 (0.0%) | 0 (0.0%) |
| Total | 0 (0.0%) | 0 (0.0%) |
Employment Characteristics in Quinebaug
Employment by Class of Employer in Quinebaug
Among the 473 employed individuals in Quinebaug, private company employees (320 | 67.6%), self-employed (not incorporated) (83 | 17.5%), and not-for-profit organizations (70 | 14.8%) make up the most common classes of employment.
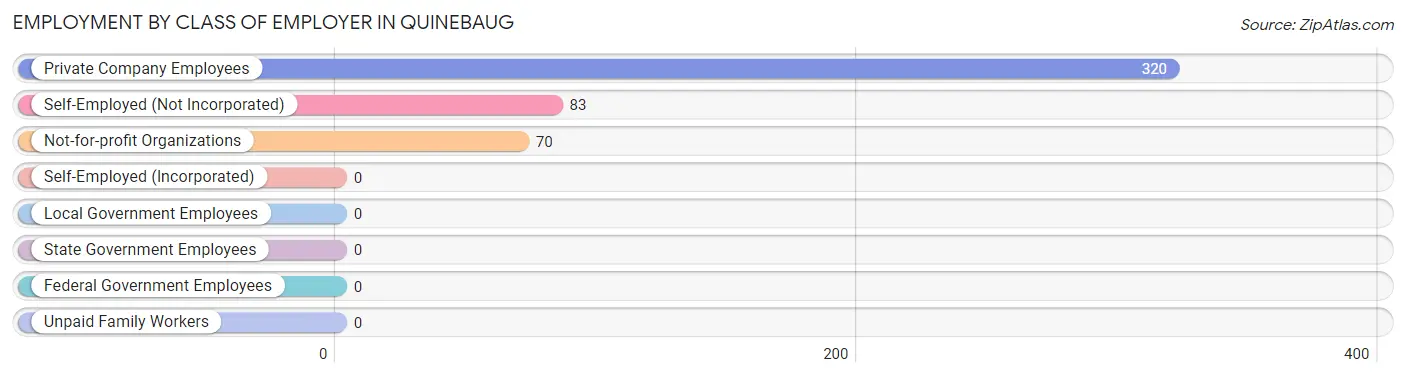
| Employer Class | # Employees | % Employees |
| Private Company Employees | 320 | 67.6% |
| Self-Employed (Incorporated) | 0 | 0.0% |
| Self-Employed (Not Incorporated) | 83 | 17.5% |
| Not-for-profit Organizations | 70 | 14.8% |
| Local Government Employees | 0 | 0.0% |
| State Government Employees | 0 | 0.0% |
| Federal Government Employees | 0 | 0.0% |
| Unpaid Family Workers | 0 | 0.0% |
| Total | 473 | 100.0% |
Employment Status by Age in Quinebaug
According to the labor force statistics for Quinebaug, out of the total population over 16 years of age (912), 58.3% or 532 individuals are in the labor force, with 10.2% or 54 of them unemployed. The age group with the highest labor force participation rate is 30 to 34 years, with 100.0% or 58 individuals in the labor force. Within the labor force, the 55 to 59 years age range has the highest percentage of unemployed individuals, with 79.4% or 54 of them being unemployed.
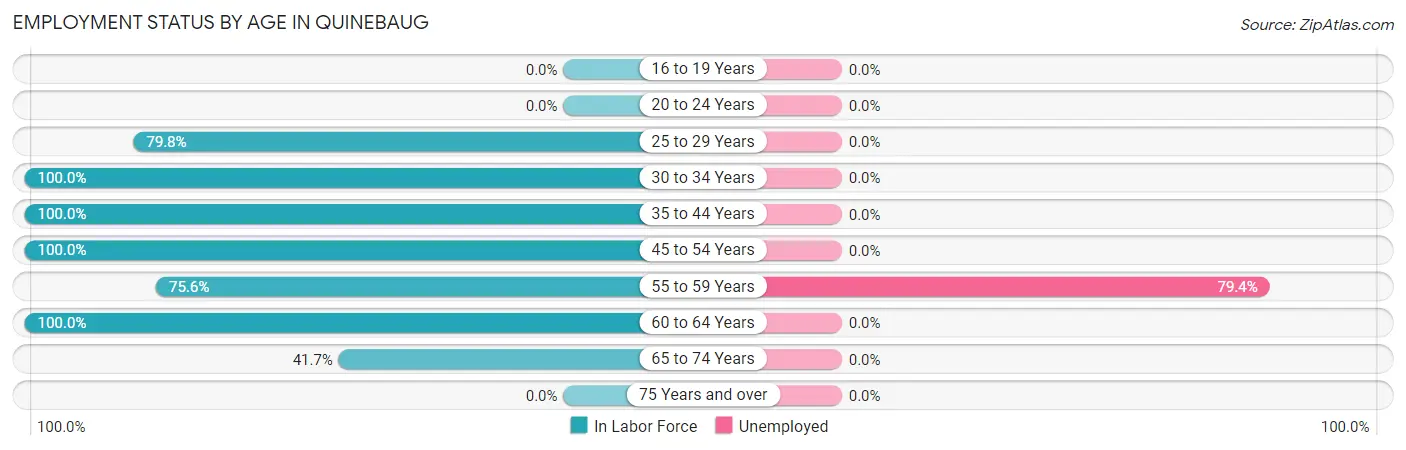
| Age Bracket | In Labor Force | Unemployed |
| 16 to 19 Years | 0 (0.0%) | 0 (0.0%) |
| 20 to 24 Years | 0 (0.0%) | 0 (0.0%) |
| 25 to 29 Years | 67 (79.8%) | 0 (0.0%) |
| 30 to 34 Years | 58 (100.0%) | 0 (0.0%) |
| 35 to 44 Years | 57 (100.0%) | 0 (0.0%) |
| 45 to 54 Years | 109 (100.0%) | 0 (0.0%) |
| 55 to 59 Years | 68 (75.6%) | 54 (79.4%) |
| 60 to 64 Years | 14 (100.0%) | 0 (0.0%) |
| 65 to 74 Years | 159 (41.7%) | 0 (0.0%) |
| 75 Years and over | 0 (0.0%) | 0 (0.0%) |
| Total | 532 (58.3%) | 54 (10.2%) |
Employment Status by Educational Attainment in Quinebaug
According to labor force statistics for Quinebaug, 90.5% of individuals (373) out of the total population between 25 and 64 years of age (412) are in the labor force, with 14.5% or 54 of them being unemployed. The group with the highest labor force participation rate are those with the educational attainment of less than high school, with 100.0% or 79 individuals in the labor force. Within the labor force, individuals with high school diploma education have the highest percentage of unemployment, with 29.2% or 54 of them being unemployed.
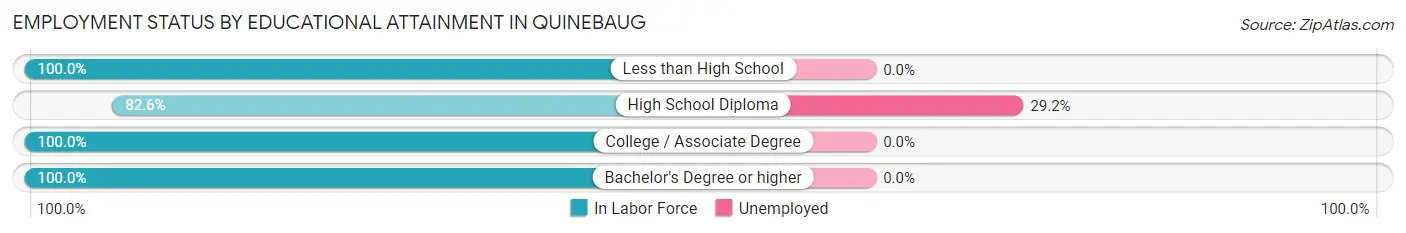
| Educational Attainment | In Labor Force | Unemployed |
| Less than High School | 79 (100.0%) | 0 (0.0%) |
| High School Diploma | 185 (82.6%) | 65 (29.2%) |
| College / Associate Degree | 39 (100.0%) | 0 (0.0%) |
| Bachelor's Degree or higher | 70 (100.0%) | 0 (0.0%) |
| Total | 373 (90.5%) | 60 (14.5%) |
Employment Occupations by Sex in Quinebaug
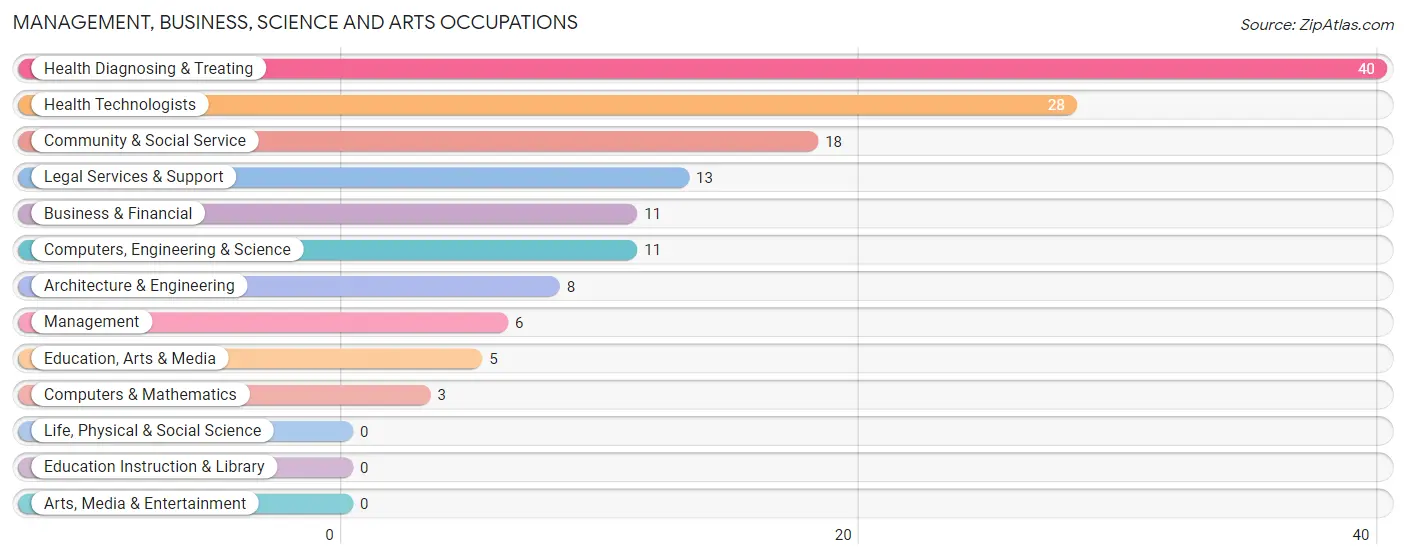
Management, Business, Science and Arts Occupations
The most common Management, Business, Science and Arts occupations in Quinebaug are Health Diagnosing & Treating (40 | 8.4%), Health Technologists (28 | 5.9%), Community & Social Service (18 | 3.8%), Legal Services & Support (13 | 2.7%), and Business & Financial (11 | 2.3%).
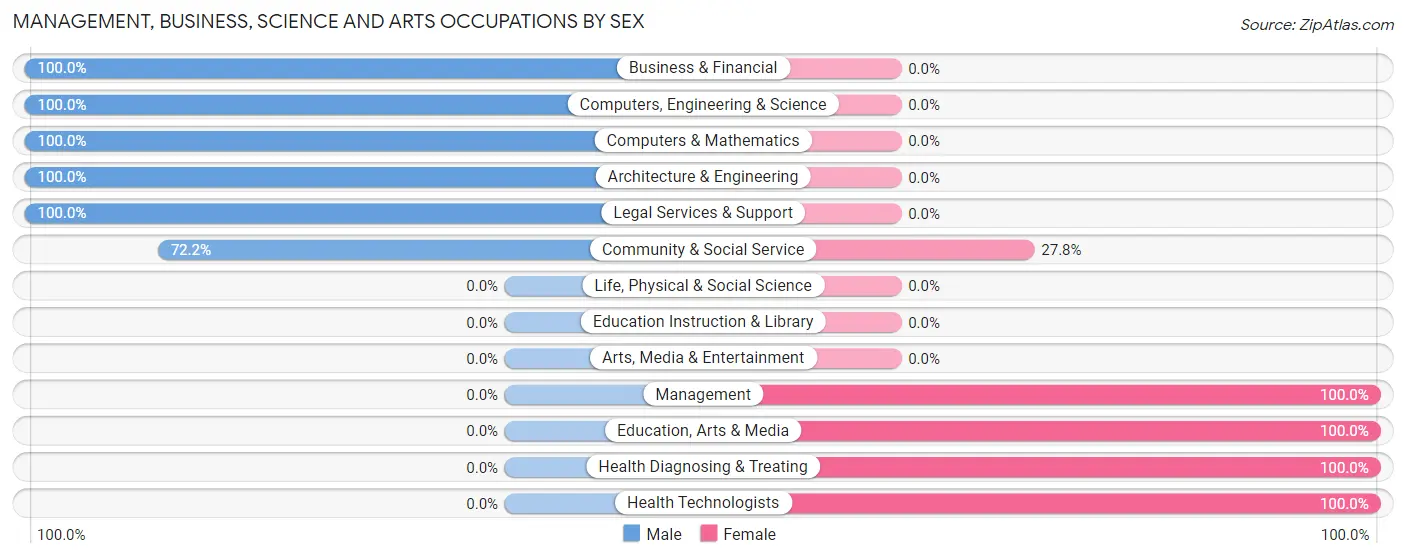
Management, Business, Science and Arts Occupations by Sex
Within the Management, Business, Science and Arts occupations in Quinebaug, the most male-oriented occupations are Business & Financial (100.0%), Computers, Engineering & Science (100.0%), and Computers & Mathematics (100.0%), while the most female-oriented occupations are Management (100.0%), Education, Arts & Media (100.0%), and Health Diagnosing & Treating (100.0%).
| Occupation | Male | Female |
| Management | 0 (0.0%) | 6 (100.0%) |
| Business & Financial | 11 (100.0%) | 0 (0.0%) |
| Computers, Engineering & Science | 11 (100.0%) | 0 (0.0%) |
| Computers & Mathematics | 3 (100.0%) | 0 (0.0%) |
| Architecture & Engineering | 8 (100.0%) | 0 (0.0%) |
| Life, Physical & Social Science | 0 (0.0%) | 0 (0.0%) |
| Community & Social Service | 13 (72.2%) | 5 (27.8%) |
| Education, Arts & Media | 0 (0.0%) | 5 (100.0%) |
| Legal Services & Support | 13 (100.0%) | 0 (0.0%) |
| Education Instruction & Library | 0 (0.0%) | 0 (0.0%) |
| Arts, Media & Entertainment | 0 (0.0%) | 0 (0.0%) |
| Health Diagnosing & Treating | 0 (0.0%) | 40 (100.0%) |
| Health Technologists | 0 (0.0%) | 28 (100.0%) |
| Total (Category) | 35 (40.7%) | 51 (59.3%) |
| Total (Overall) | 231 (48.3%) | 247 (51.7%) |
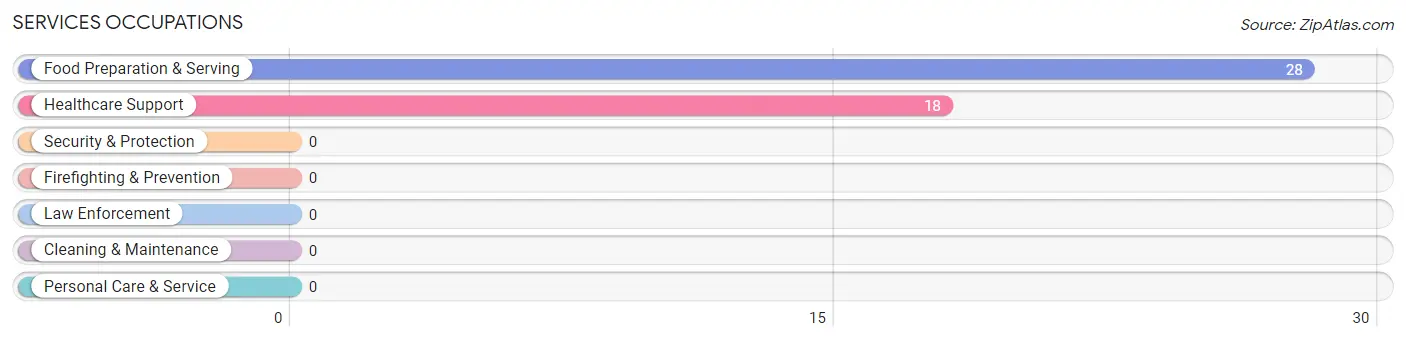
Services Occupations
The most common Services occupations in Quinebaug are Food Preparation & Serving (28 | 5.9%), and Healthcare Support (18 | 3.8%).
Services Occupations by Sex
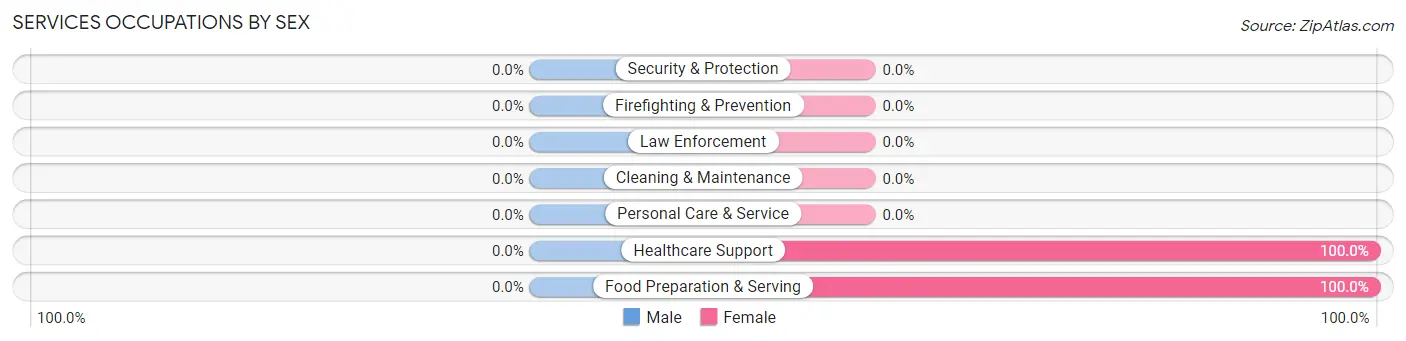
| Occupation | Male | Female |
| Healthcare Support | 0 (0.0%) | 18 (100.0%) |
| Security & Protection | 0 (0.0%) | 0 (0.0%) |
| Firefighting & Prevention | 0 (0.0%) | 0 (0.0%) |
| Law Enforcement | 0 (0.0%) | 0 (0.0%) |
| Food Preparation & Serving | 0 (0.0%) | 28 (100.0%) |
| Cleaning & Maintenance | 0 (0.0%) | 0 (0.0%) |
| Personal Care & Service | 0 (0.0%) | 0 (0.0%) |
| Total (Category) | 0 (0.0%) | 46 (100.0%) |
| Total (Overall) | 231 (48.3%) | 247 (51.7%) |
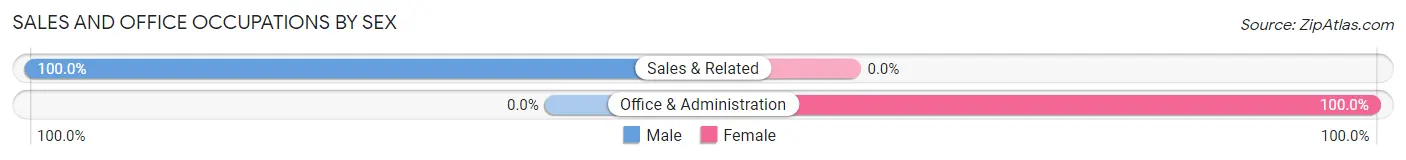
Sales and Office Occupations
The most common Sales and Office occupations in Quinebaug are Office & Administration (90 | 18.8%), and Sales & Related (63 | 13.2%).
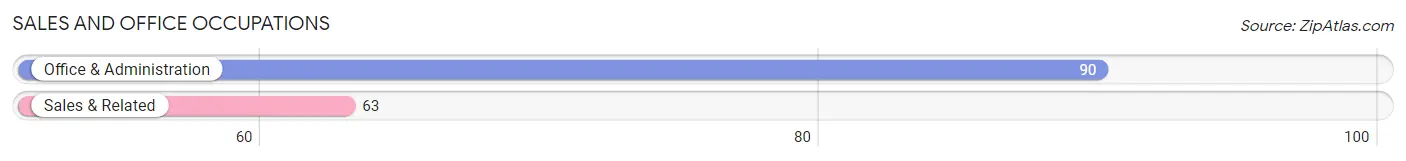
Sales and Office Occupations by Sex
| Occupation | Male | Female |
| Sales & Related | 63 (100.0%) | 0 (0.0%) |
| Office & Administration | 0 (0.0%) | 90 (100.0%) |
| Total (Category) | 63 (41.2%) | 90 (58.8%) |
| Total (Overall) | 231 (48.3%) | 247 (51.7%) |
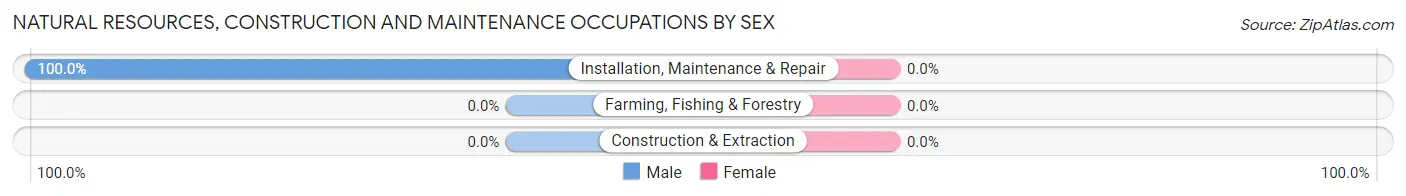
Natural Resources, Construction and Maintenance Occupations
The most common Natural Resources, Construction and Maintenance occupations in Quinebaug are , and Installation, Maintenance & Repair (46 | 9.6%).
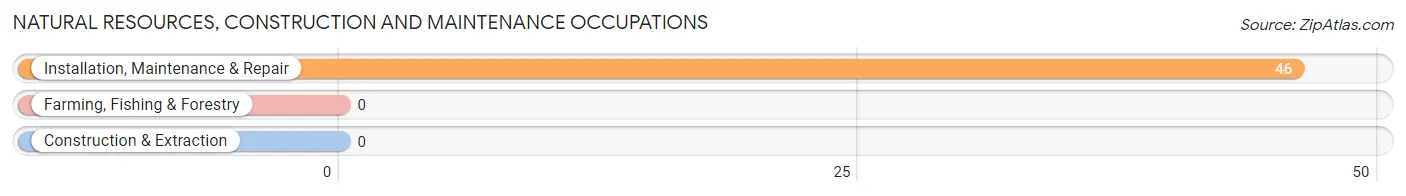
Natural Resources, Construction and Maintenance Occupations by Sex
| Occupation | Male | Female |
| Farming, Fishing & Forestry | 0 (0.0%) | 0 (0.0%) |
| Construction & Extraction | 0 (0.0%) | 0 (0.0%) |
| Installation, Maintenance & Repair | 46 (100.0%) | 0 (0.0%) |
| Total (Category) | 46 (100.0%) | 0 (0.0%) |
| Total (Overall) | 231 (48.3%) | 247 (51.7%) |
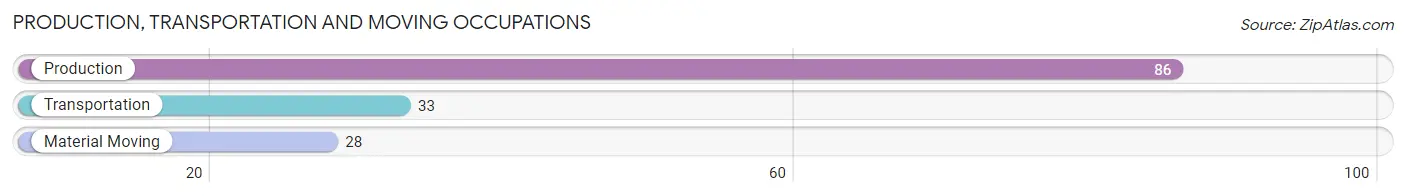
Production, Transportation and Moving Occupations
The most common Production, Transportation and Moving occupations in Quinebaug are Production (86 | 18.0%), Transportation (33 | 6.9%), and Material Moving (28 | 5.9%).
Production, Transportation and Moving Occupations by Sex
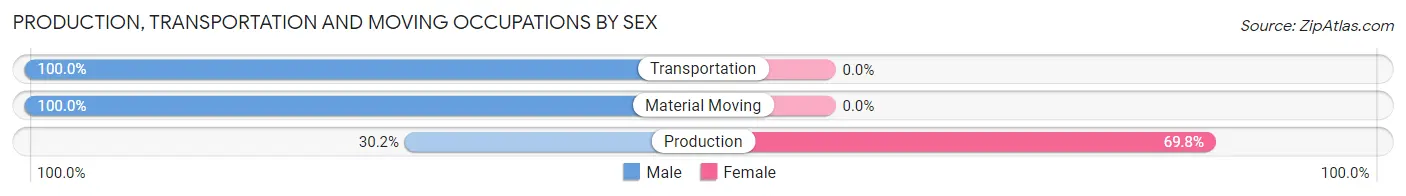
| Occupation | Male | Female |
| Production | 26 (30.2%) | 60 (69.8%) |
| Transportation | 33 (100.0%) | 0 (0.0%) |
| Material Moving | 28 (100.0%) | 0 (0.0%) |
| Total (Category) | 87 (59.2%) | 60 (40.8%) |
| Total (Overall) | 231 (48.3%) | 247 (51.7%) |
Employment Industries by Sex in Quinebaug
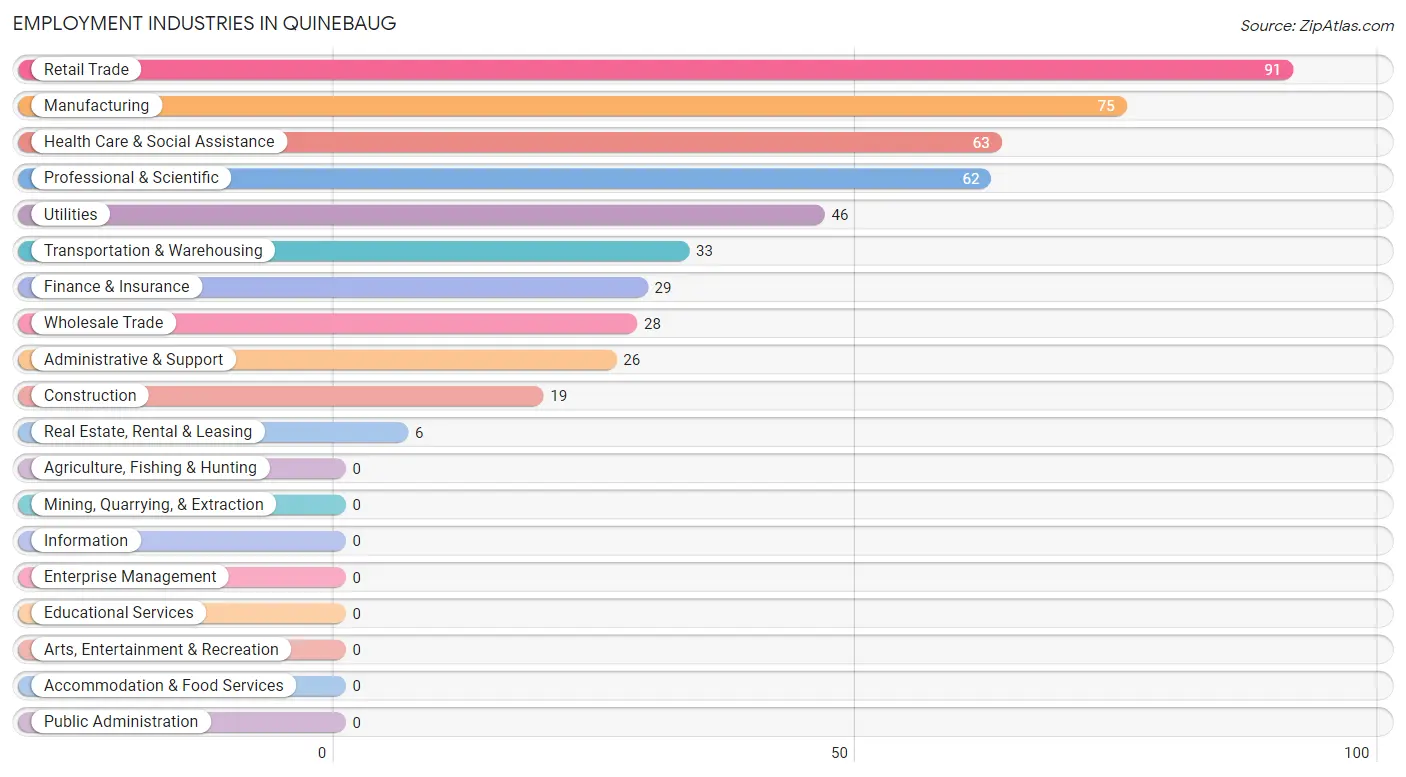
Employment Industries in Quinebaug
The major employment industries in Quinebaug include Retail Trade (91 | 19.0%), Manufacturing (75 | 15.7%), Health Care & Social Assistance (63 | 13.2%), Professional & Scientific (62 | 13.0%), and Utilities (46 | 9.6%).
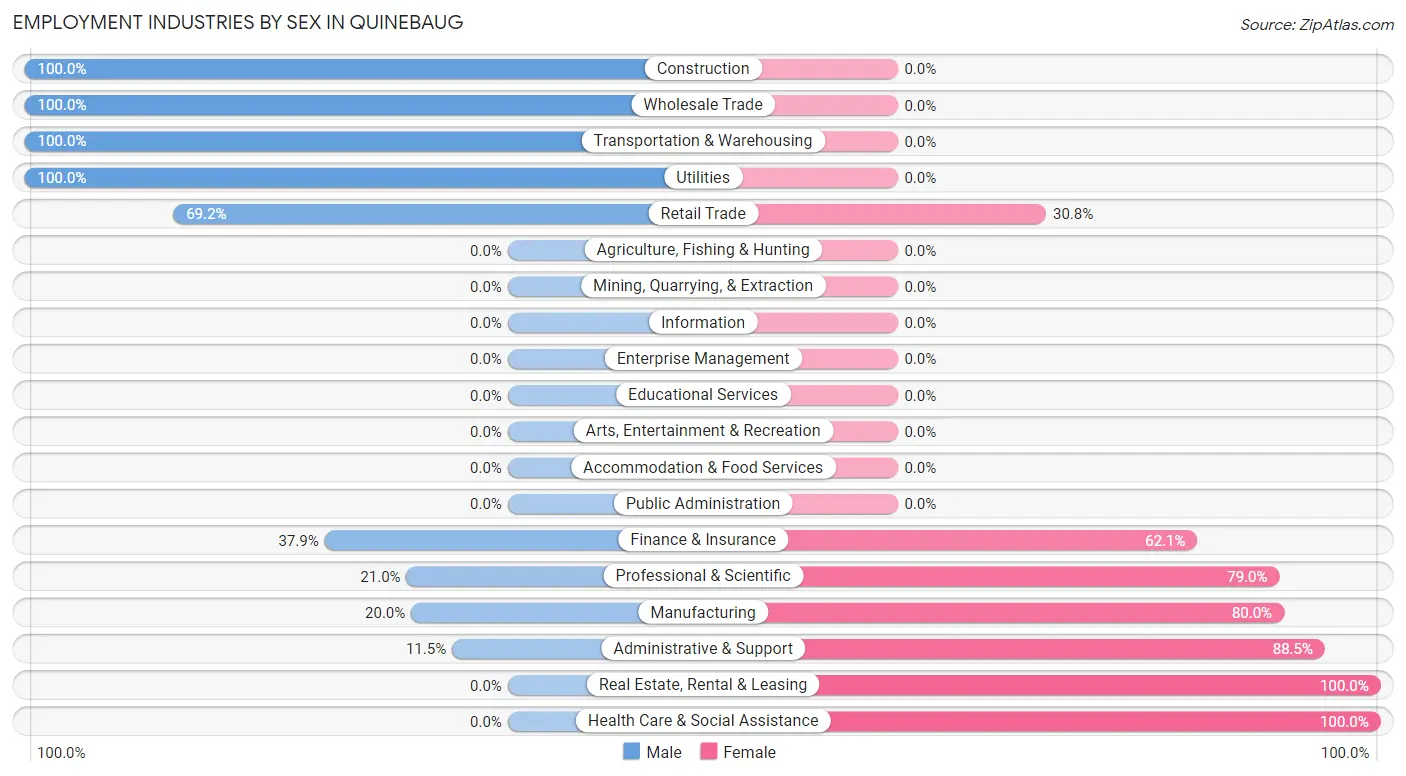
Employment Industries by Sex in Quinebaug
The Quinebaug industries that see more men than women are Construction (100.0%), Wholesale Trade (100.0%), and Transportation & Warehousing (100.0%), whereas the industries that tend to have a higher number of women are Real Estate, Rental & Leasing (100.0%), Health Care & Social Assistance (100.0%), and Administrative & Support (88.5%).
| Industry | Male | Female |
| Agriculture, Fishing & Hunting | 0 (0.0%) | 0 (0.0%) |
| Mining, Quarrying, & Extraction | 0 (0.0%) | 0 (0.0%) |
| Construction | 19 (100.0%) | 0 (0.0%) |
| Manufacturing | 15 (20.0%) | 60 (80.0%) |
| Wholesale Trade | 28 (100.0%) | 0 (0.0%) |
| Retail Trade | 63 (69.2%) | 28 (30.8%) |
| Transportation & Warehousing | 33 (100.0%) | 0 (0.0%) |
| Utilities | 46 (100.0%) | 0 (0.0%) |
| Information | 0 (0.0%) | 0 (0.0%) |
| Finance & Insurance | 11 (37.9%) | 18 (62.1%) |
| Real Estate, Rental & Leasing | 0 (0.0%) | 6 (100.0%) |
| Professional & Scientific | 13 (21.0%) | 49 (79.0%) |
| Enterprise Management | 0 (0.0%) | 0 (0.0%) |
| Administrative & Support | 3 (11.5%) | 23 (88.5%) |
| Educational Services | 0 (0.0%) | 0 (0.0%) |
| Health Care & Social Assistance | 0 (0.0%) | 63 (100.0%) |
| Arts, Entertainment & Recreation | 0 (0.0%) | 0 (0.0%) |
| Accommodation & Food Services | 0 (0.0%) | 0 (0.0%) |
| Public Administration | 0 (0.0%) | 0 (0.0%) |
| Total | 231 (48.3%) | 247 (51.7%) |
Education in Quinebaug
School Enrollment in Quinebaug
The most common levels of schooling among the 51 students in Quinebaug are elementary school (22 | 43.1%), college / undergraduate (17 | 33.3%), and nursery / preschool (12 | 23.5%).
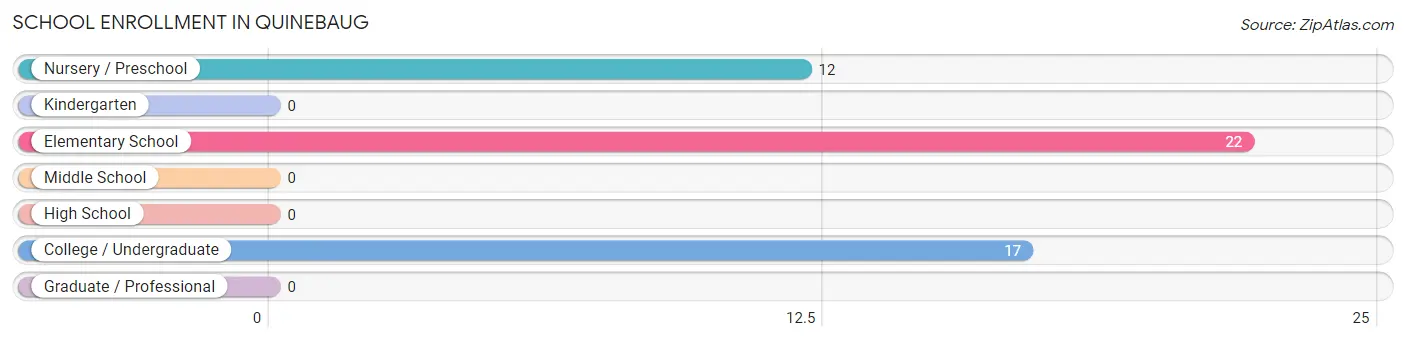
| School Level | # Students | % Students |
| Nursery / Preschool | 12 | 23.5% |
| Kindergarten | 0 | 0.0% |
| Elementary School | 22 | 43.1% |
| Middle School | 0 | 0.0% |
| High School | 0 | 0.0% |
| College / Undergraduate | 17 | 33.3% |
| Graduate / Professional | 0 | 0.0% |
| Total | 51 | 100.0% |
School Enrollment by Age by Funding Source in Quinebaug
Out of a total of 51 students who are enrolled in schools in Quinebaug, 17 (33.3%) attend a private institution, while the remaining 34 (66.7%) are enrolled in public schools. The age group of 18 to 19 year olds has the highest likelihood of being enrolled in private schools, with 17 (100.0% in the age bracket) enrolled. Conversely, the age group of 3 to 4 year olds has the lowest likelihood of being enrolled in a private school, with 12 (100.0% in the age bracket) attending a public institution.
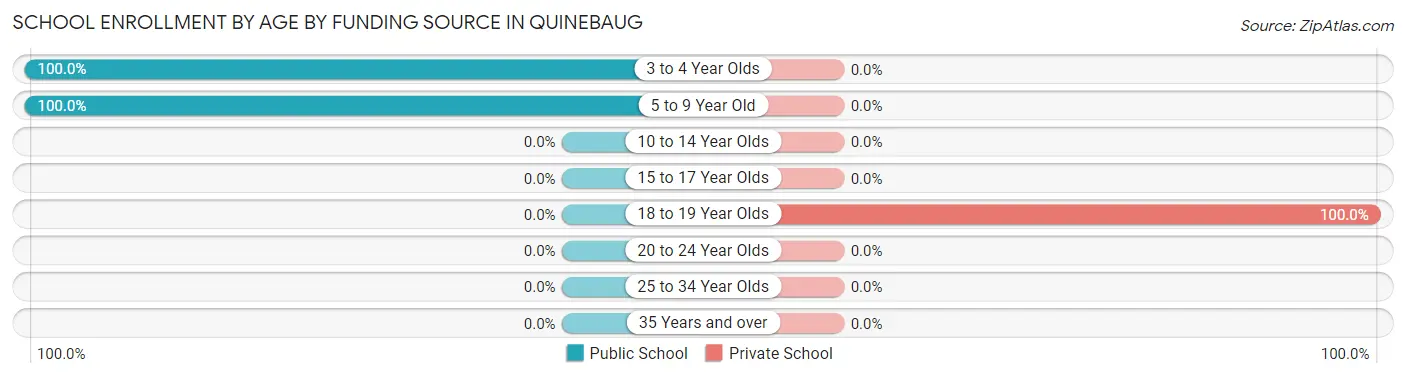
| Age Bracket | Public School | Private School |
| 3 to 4 Year Olds | 12 (100.0%) | 0 (0.0%) |
| 5 to 9 Year Old | 22 (100.0%) | 0 (0.0%) |
| 10 to 14 Year Olds | 0 (0.0%) | 0 (0.0%) |
| 15 to 17 Year Olds | 0 (0.0%) | 0 (0.0%) |
| 18 to 19 Year Olds | 0 (0.0%) | 17 (100.0%) |
| 20 to 24 Year Olds | 0 (0.0%) | 0 (0.0%) |
| 25 to 34 Year Olds | 0 (0.0%) | 0 (0.0%) |
| 35 Years and over | 0 (0.0%) | 0 (0.0%) |
| Total | 34 (66.7%) | 17 (33.3%) |
Educational Attainment by Field of Study in Quinebaug
Engineering (35 | 23.2%), business (29 | 19.2%), science & technology (28 | 18.5%), psychology (20 | 13.3%), and liberal arts & history (20 | 13.3%) are the most common fields of study among 151 individuals in Quinebaug who have obtained a bachelor's degree or higher.
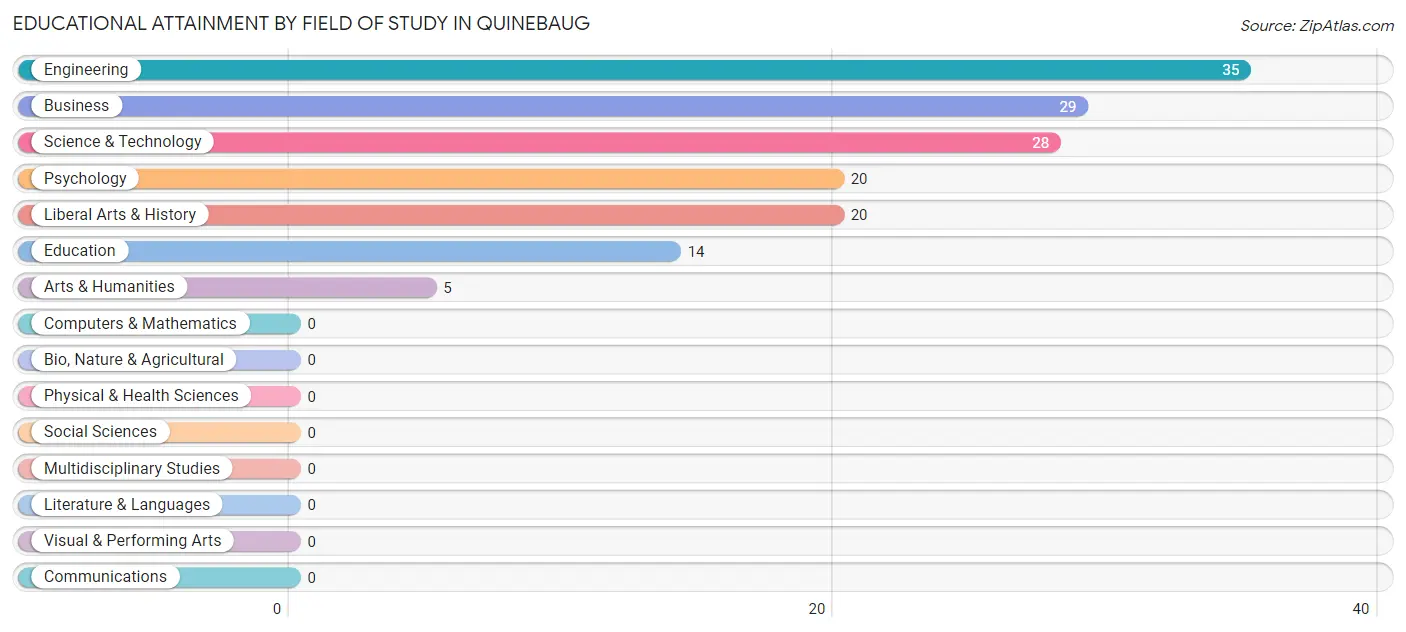
| Field of Study | # Graduates | % Graduates |
| Computers & Mathematics | 0 | 0.0% |
| Bio, Nature & Agricultural | 0 | 0.0% |
| Physical & Health Sciences | 0 | 0.0% |
| Psychology | 20 | 13.3% |
| Social Sciences | 0 | 0.0% |
| Engineering | 35 | 23.2% |
| Multidisciplinary Studies | 0 | 0.0% |
| Science & Technology | 28 | 18.5% |
| Business | 29 | 19.2% |
| Education | 14 | 9.3% |
| Literature & Languages | 0 | 0.0% |
| Liberal Arts & History | 20 | 13.3% |
| Visual & Performing Arts | 0 | 0.0% |
| Communications | 0 | 0.0% |
| Arts & Humanities | 5 | 3.3% |
| Total | 151 | 100.0% |
Transportation & Commute in Quinebaug
Vehicle Availability by Sex in Quinebaug
The most prevalent vehicle ownership categories in Quinebaug are males with 1 vehicle (76, accounting for 32.9%) and females with 1 vehicle (135, making up 31.4%).
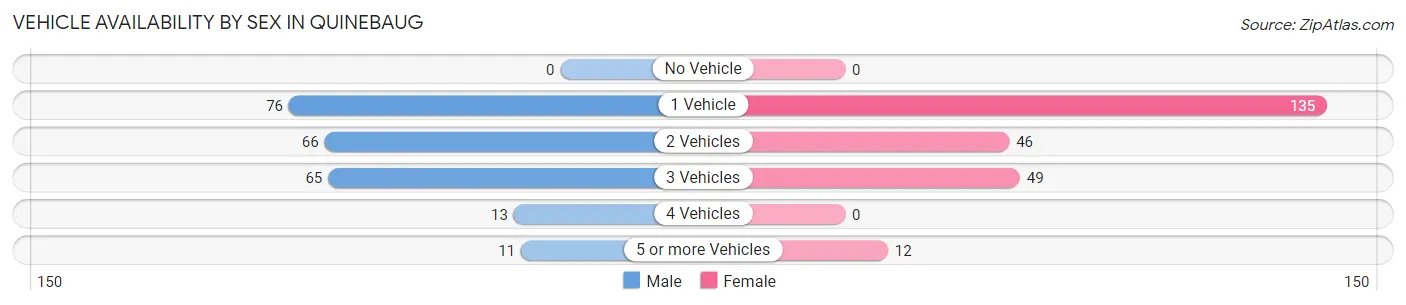
| Vehicles Available | Male | Female |
| No Vehicle | 0 (0.0%) | 0 (0.0%) |
| 1 Vehicle | 76 (32.9%) | 135 (55.8%) |
| 2 Vehicles | 66 (28.6%) | 46 (19.0%) |
| 3 Vehicles | 65 (28.1%) | 49 (20.3%) |
| 4 Vehicles | 13 (5.6%) | 0 (0.0%) |
| 5 or more Vehicles | 11 (4.8%) | 12 (5.0%) |
| Total | 231 (100.0%) | 242 (100.0%) |
Commute Time in Quinebaug
The most frequently occuring commute durations in Quinebaug are 15 to 19 minutes (98 commuters, 25.7%), 20 to 24 minutes (80 commuters, 21.0%), and 30 to 34 minutes (80 commuters, 21.0%).
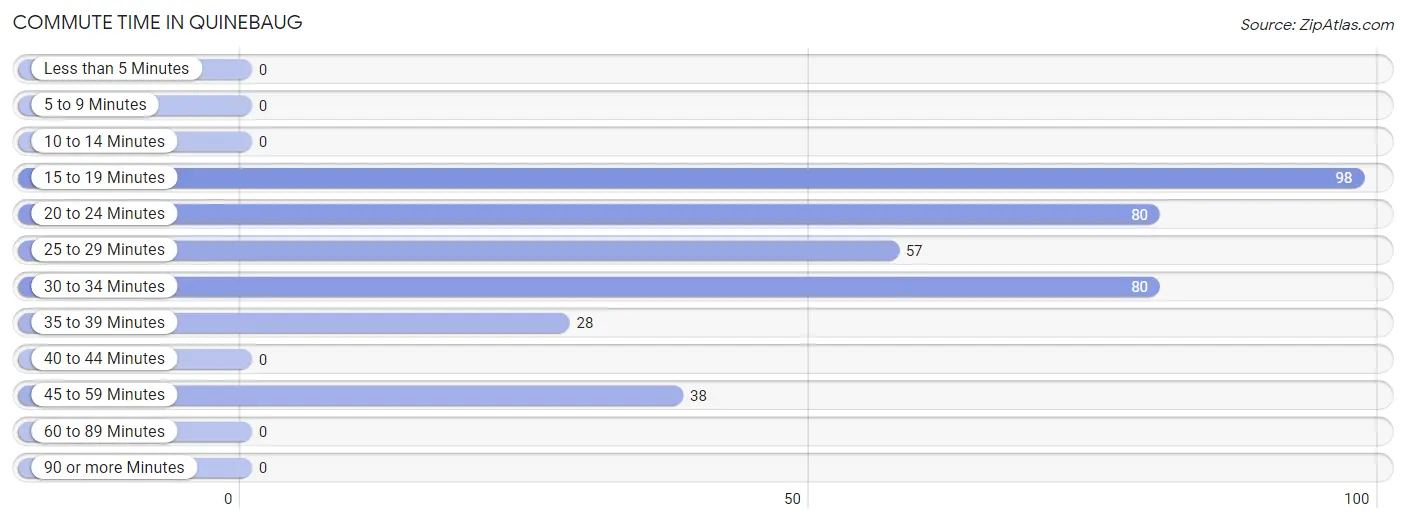
| Commute Time | # Commuters | % Commuters |
| Less than 5 Minutes | 0 | 0.0% |
| 5 to 9 Minutes | 0 | 0.0% |
| 10 to 14 Minutes | 0 | 0.0% |
| 15 to 19 Minutes | 98 | 25.7% |
| 20 to 24 Minutes | 80 | 21.0% |
| 25 to 29 Minutes | 57 | 15.0% |
| 30 to 34 Minutes | 80 | 21.0% |
| 35 to 39 Minutes | 28 | 7.3% |
| 40 to 44 Minutes | 0 | 0.0% |
| 45 to 59 Minutes | 38 | 10.0% |
| 60 to 89 Minutes | 0 | 0.0% |
| 90 or more Minutes | 0 | 0.0% |
Commute Time by Sex in Quinebaug
The most common commute times in Quinebaug are 25 to 29 minutes (57 commuters, 28.6%) for males and 20 to 24 minutes (57 commuters, 31.3%) for females.
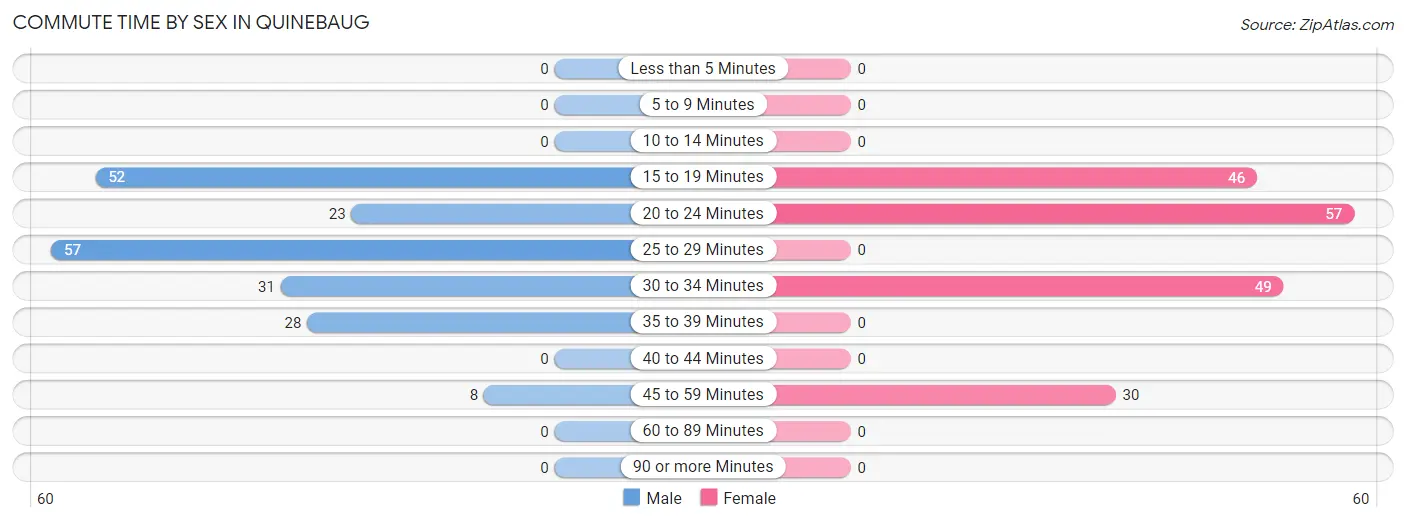
| Commute Time | Male | Female |
| Less than 5 Minutes | 0 (0.0%) | 0 (0.0%) |
| 5 to 9 Minutes | 0 (0.0%) | 0 (0.0%) |
| 10 to 14 Minutes | 0 (0.0%) | 0 (0.0%) |
| 15 to 19 Minutes | 52 (26.1%) | 46 (25.3%) |
| 20 to 24 Minutes | 23 (11.6%) | 57 (31.3%) |
| 25 to 29 Minutes | 57 (28.6%) | 0 (0.0%) |
| 30 to 34 Minutes | 31 (15.6%) | 49 (26.9%) |
| 35 to 39 Minutes | 28 (14.1%) | 0 (0.0%) |
| 40 to 44 Minutes | 0 (0.0%) | 0 (0.0%) |
| 45 to 59 Minutes | 8 (4.0%) | 30 (16.5%) |
| 60 to 89 Minutes | 0 (0.0%) | 0 (0.0%) |
| 90 or more Minutes | 0 (0.0%) | 0 (0.0%) |
Time of Departure to Work by Sex in Quinebaug
The most frequent times of departure to work in Quinebaug are 6:30 AM to 6:59 AM (138, 69.4%) for males and 7:30 AM to 7:59 AM (60, 33.0%) for females.
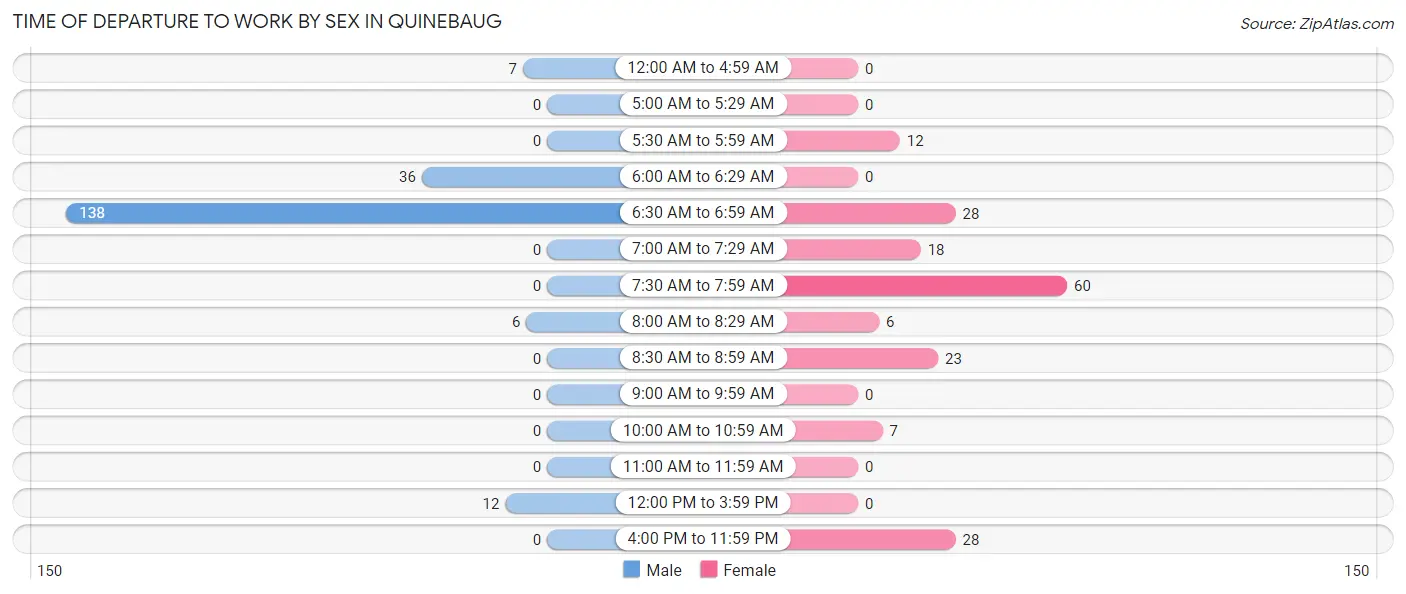
| Time of Departure | Male | Female |
| 12:00 AM to 4:59 AM | 7 (3.5%) | 0 (0.0%) |
| 5:00 AM to 5:29 AM | 0 (0.0%) | 0 (0.0%) |
| 5:30 AM to 5:59 AM | 0 (0.0%) | 12 (6.6%) |
| 6:00 AM to 6:29 AM | 36 (18.1%) | 0 (0.0%) |
| 6:30 AM to 6:59 AM | 138 (69.4%) | 28 (15.4%) |
| 7:00 AM to 7:29 AM | 0 (0.0%) | 18 (9.9%) |
| 7:30 AM to 7:59 AM | 0 (0.0%) | 60 (33.0%) |
| 8:00 AM to 8:29 AM | 6 (3.0%) | 6 (3.3%) |
| 8:30 AM to 8:59 AM | 0 (0.0%) | 23 (12.6%) |
| 9:00 AM to 9:59 AM | 0 (0.0%) | 0 (0.0%) |
| 10:00 AM to 10:59 AM | 0 (0.0%) | 7 (3.8%) |
| 11:00 AM to 11:59 AM | 0 (0.0%) | 0 (0.0%) |
| 12:00 PM to 3:59 PM | 12 (6.0%) | 0 (0.0%) |
| 4:00 PM to 11:59 PM | 0 (0.0%) | 28 (15.4%) |
| Total | 199 (100.0%) | 182 (100.0%) |
Housing Occupancy in Quinebaug
Occupancy by Ownership in Quinebaug
Of the total 550 dwellings in Quinebaug, owner-occupied units account for 493 (89.6%), while renter-occupied units make up 57 (10.4%).
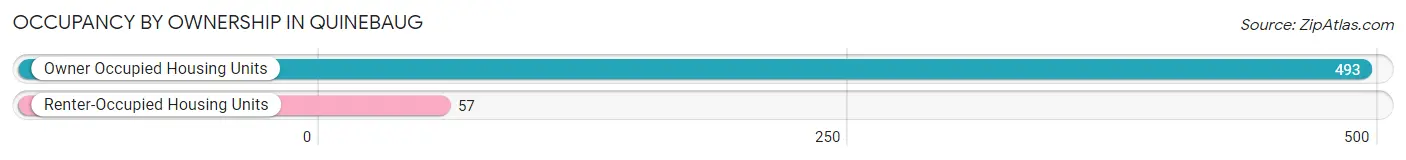
| Occupancy | # Housing Units | % Housing Units |
| Owner Occupied Housing Units | 493 | 89.6% |
| Renter-Occupied Housing Units | 57 | 10.4% |
| Total Occupied Housing Units | 550 | 100.0% |
Occupancy by Household Size in Quinebaug

| Household Size | # Housing Units | % Housing Units |
| 1-Person Household | 241 | 43.8% |
| 2-Person Household | 161 | 29.3% |
| 3-Person Household | 148 | 26.9% |
| 4+ Person Household | 0 | 0.0% |
| Total Housing Units | 550 | 100.0% |
Occupancy by Ownership by Household Size in Quinebaug
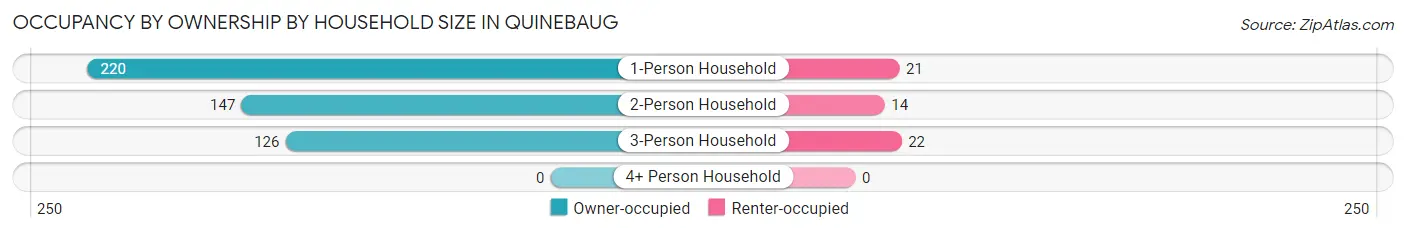
| Household Size | Owner-occupied | Renter-occupied |
| 1-Person Household | 220 (91.3%) | 21 (8.7%) |
| 2-Person Household | 147 (91.3%) | 14 (8.7%) |
| 3-Person Household | 126 (85.1%) | 22 (14.9%) |
| 4+ Person Household | 0 (0.0%) | 0 (0.0%) |
| Total Housing Units | 493 (89.6%) | 57 (10.4%) |
Occupancy by Educational Attainment in Quinebaug
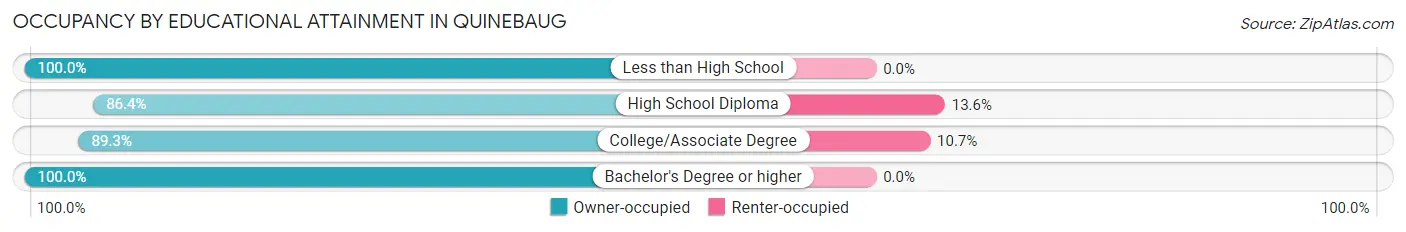
| Household Size | Owner-occupied | Renter-occupied |
| Less than High School | 46 (100.0%) | 0 (0.0%) |
| High School Diploma | 273 (86.4%) | 43 (13.6%) |
| College/Associate Degree | 117 (89.3%) | 14 (10.7%) |
| Bachelor's Degree or higher | 57 (100.0%) | 0 (0.0%) |
Occupancy by Age of Householder in Quinebaug
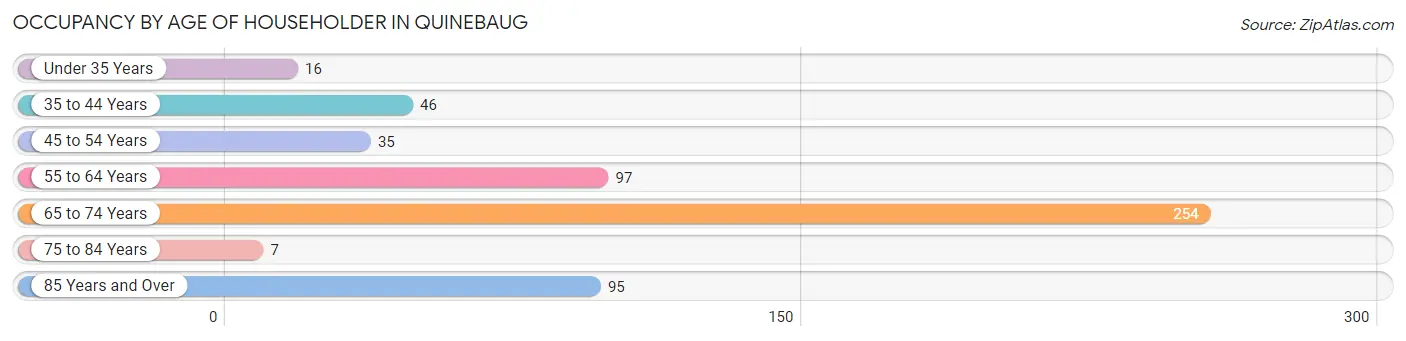
| Age Bracket | # Households | % Households |
| Under 35 Years | 16 | 2.9% |
| 35 to 44 Years | 46 | 8.4% |
| 45 to 54 Years | 35 | 6.4% |
| 55 to 64 Years | 97 | 17.6% |
| 65 to 74 Years | 254 | 46.2% |
| 75 to 84 Years | 7 | 1.3% |
| 85 Years and Over | 95 | 17.3% |
| Total | 550 | 100.0% |
Housing Finances in Quinebaug
Median Income by Occupancy in Quinebaug
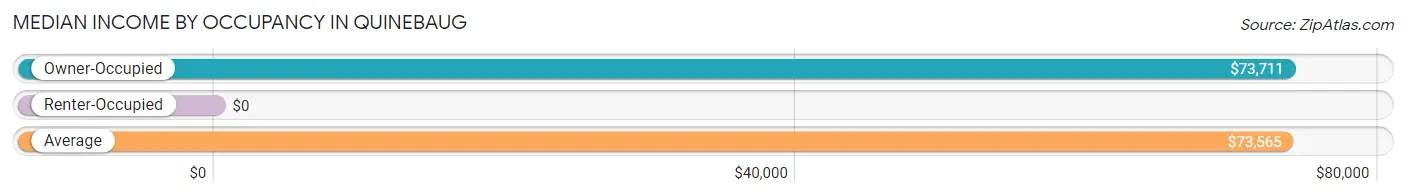
| Occupancy Type | # Households | Median Income |
| Owner-Occupied | 493 (89.6%) | $73,711 |
| Renter-Occupied | 57 (10.4%) | $0 |
| Average | 550 (100.0%) | $73,565 |
Occupancy by Householder Income Bracket in Quinebaug
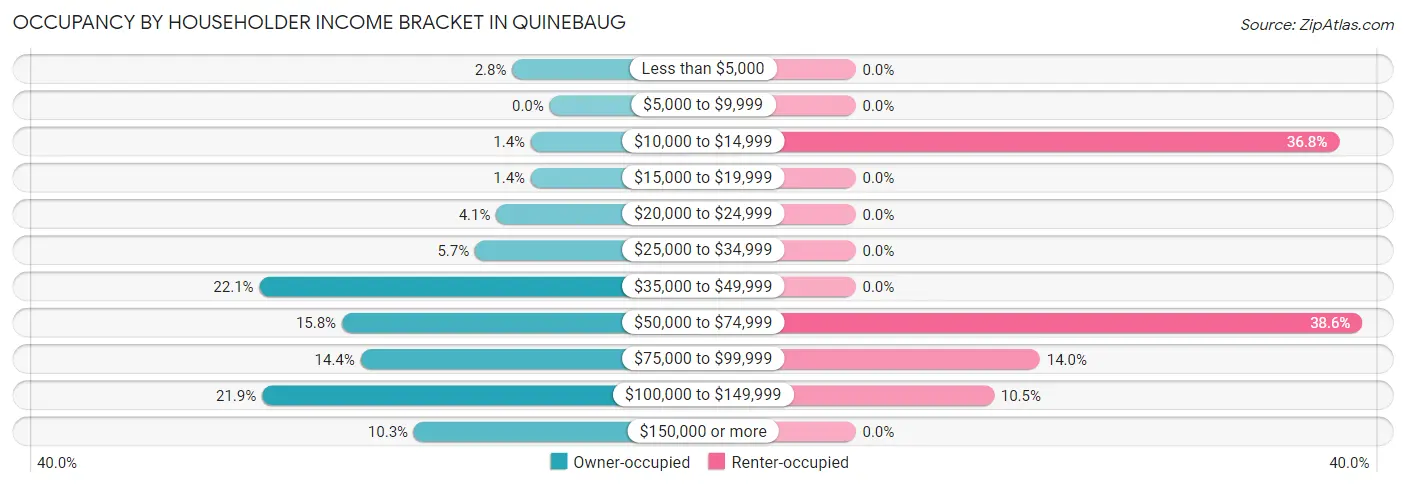
| Income Bracket | Owner-occupied | Renter-occupied |
| Less than $5,000 | 14 (2.8%) | 0 (0.0%) |
| $5,000 to $9,999 | 0 (0.0%) | 0 (0.0%) |
| $10,000 to $14,999 | 7 (1.4%) | 21 (36.8%) |
| $15,000 to $19,999 | 7 (1.4%) | 0 (0.0%) |
| $20,000 to $24,999 | 20 (4.1%) | 0 (0.0%) |
| $25,000 to $34,999 | 28 (5.7%) | 0 (0.0%) |
| $35,000 to $49,999 | 109 (22.1%) | 0 (0.0%) |
| $50,000 to $74,999 | 78 (15.8%) | 22 (38.6%) |
| $75,000 to $99,999 | 71 (14.4%) | 8 (14.0%) |
| $100,000 to $149,999 | 108 (21.9%) | 6 (10.5%) |
| $150,000 or more | 51 (10.3%) | 0 (0.0%) |
| Total | 493 (100.0%) | 57 (100.0%) |
Monthly Housing Cost Tiers in Quinebaug
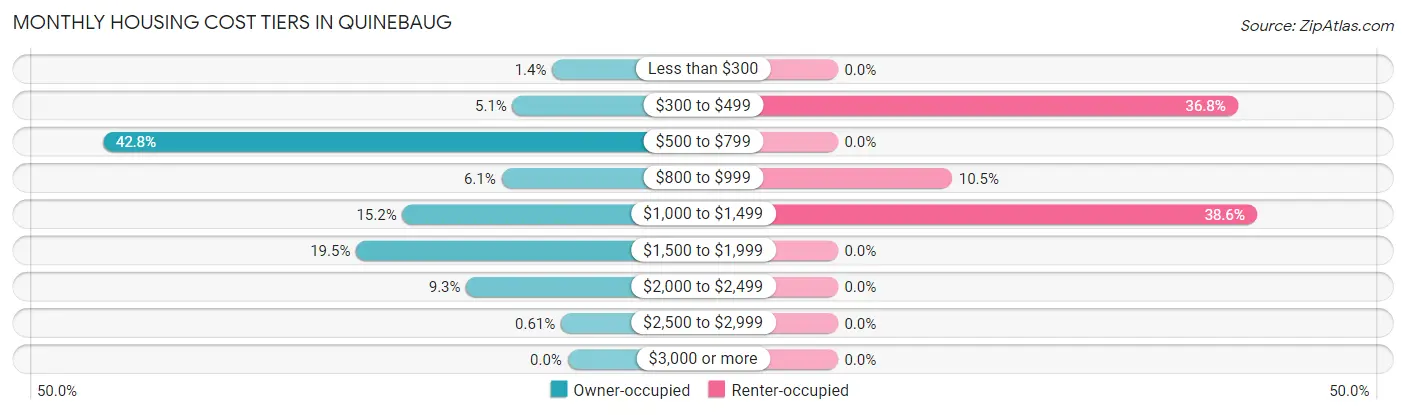
| Monthly Cost | Owner-occupied | Renter-occupied |
| Less than $300 | 7 (1.4%) | 0 (0.0%) |
| $300 to $499 | 25 (5.1%) | 21 (36.8%) |
| $500 to $799 | 211 (42.8%) | 0 (0.0%) |
| $800 to $999 | 30 (6.1%) | 6 (10.5%) |
| $1,000 to $1,499 | 75 (15.2%) | 22 (38.6%) |
| $1,500 to $1,999 | 96 (19.5%) | 0 (0.0%) |
| $2,000 to $2,499 | 46 (9.3%) | 0 (0.0%) |
| $2,500 to $2,999 | 3 (0.6%) | 0 (0.0%) |
| $3,000 or more | 0 (0.0%) | 0 (0.0%) |
| Total | 493 (100.0%) | 57 (100.0%) |
Physical Housing Characteristics in Quinebaug
Housing Structures in Quinebaug
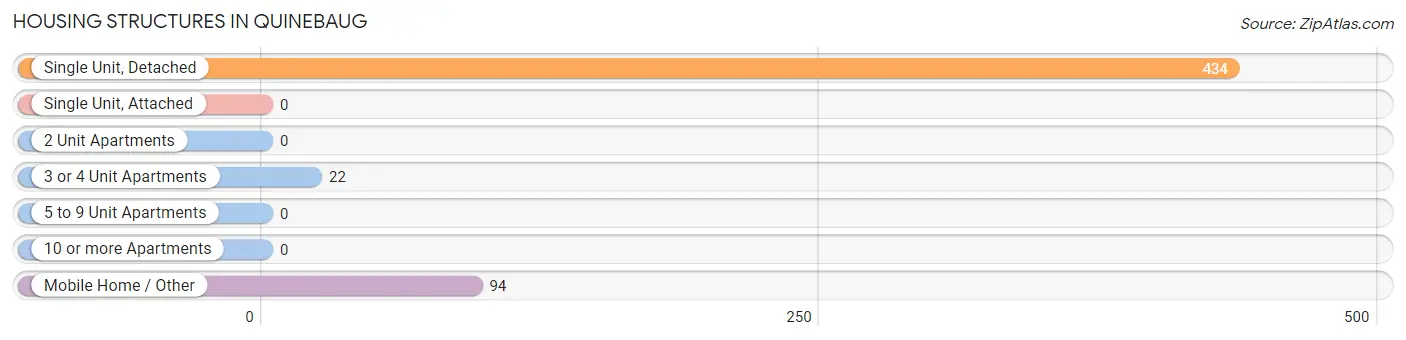
| Structure Type | # Housing Units | % Housing Units |
| Single Unit, Detached | 434 | 78.9% |
| Single Unit, Attached | 0 | 0.0% |
| 2 Unit Apartments | 0 | 0.0% |
| 3 or 4 Unit Apartments | 22 | 4.0% |
| 5 to 9 Unit Apartments | 0 | 0.0% |
| 10 or more Apartments | 0 | 0.0% |
| Mobile Home / Other | 94 | 17.1% |
| Total | 550 | 100.0% |
Housing Structures by Occupancy in Quinebaug
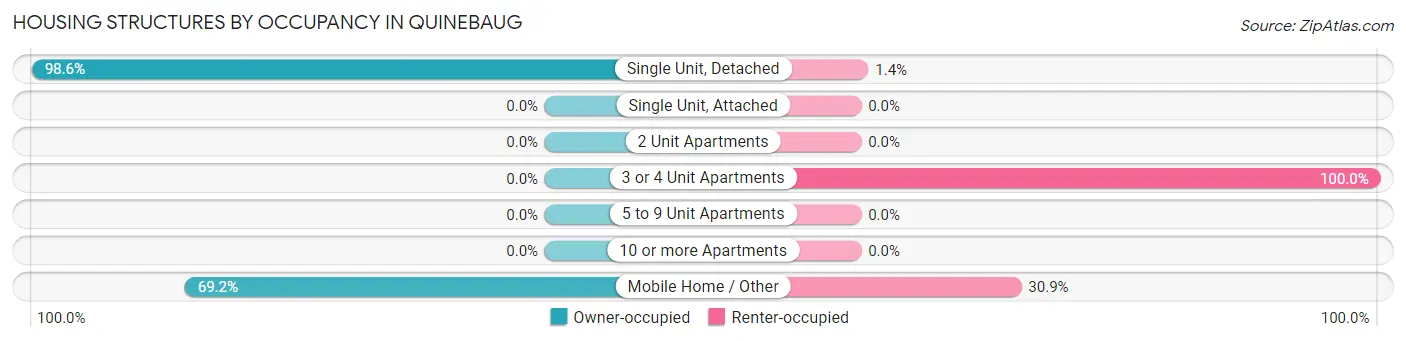
| Structure Type | Owner-occupied | Renter-occupied |
| Single Unit, Detached | 428 (98.6%) | 6 (1.4%) |
| Single Unit, Attached | 0 (0.0%) | 0 (0.0%) |
| 2 Unit Apartments | 0 (0.0%) | 0 (0.0%) |
| 3 or 4 Unit Apartments | 0 (0.0%) | 22 (100.0%) |
| 5 to 9 Unit Apartments | 0 (0.0%) | 0 (0.0%) |
| 10 or more Apartments | 0 (0.0%) | 0 (0.0%) |
| Mobile Home / Other | 65 (69.2%) | 29 (30.8%) |
| Total | 493 (89.6%) | 57 (10.4%) |
Housing Structures by Number of Rooms in Quinebaug
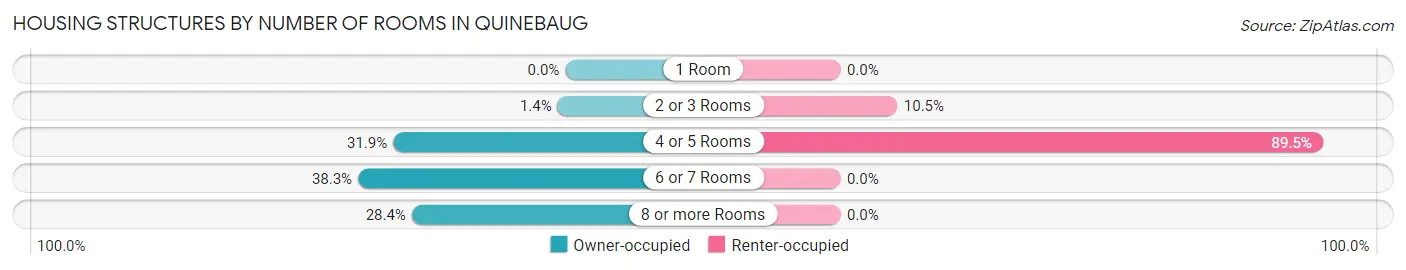
| Number of Rooms | Owner-occupied | Renter-occupied |
| 1 Room | 0 (0.0%) | 0 (0.0%) |
| 2 or 3 Rooms | 7 (1.4%) | 6 (10.5%) |
| 4 or 5 Rooms | 157 (31.9%) | 51 (89.5%) |
| 6 or 7 Rooms | 189 (38.3%) | 0 (0.0%) |
| 8 or more Rooms | 140 (28.4%) | 0 (0.0%) |
| Total | 493 (100.0%) | 57 (100.0%) |
Housing Structure by Heating Type in Quinebaug
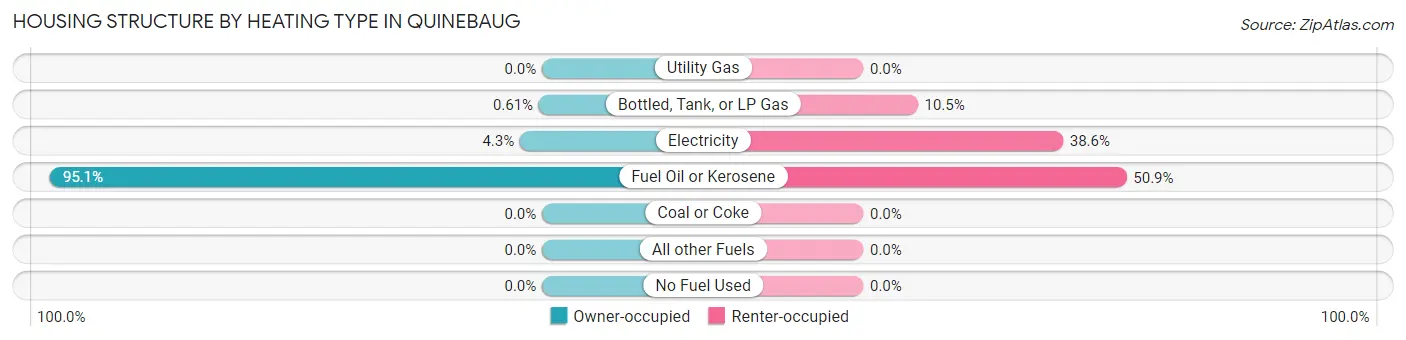
| Heating Type | Owner-occupied | Renter-occupied |
| Utility Gas | 0 (0.0%) | 0 (0.0%) |
| Bottled, Tank, or LP Gas | 3 (0.6%) | 6 (10.5%) |
| Electricity | 21 (4.3%) | 22 (38.6%) |
| Fuel Oil or Kerosene | 469 (95.1%) | 29 (50.9%) |
| Coal or Coke | 0 (0.0%) | 0 (0.0%) |
| All other Fuels | 0 (0.0%) | 0 (0.0%) |
| No Fuel Used | 0 (0.0%) | 0 (0.0%) |
| Total | 493 (100.0%) | 57 (100.0%) |
Household Vehicle Usage in Quinebaug
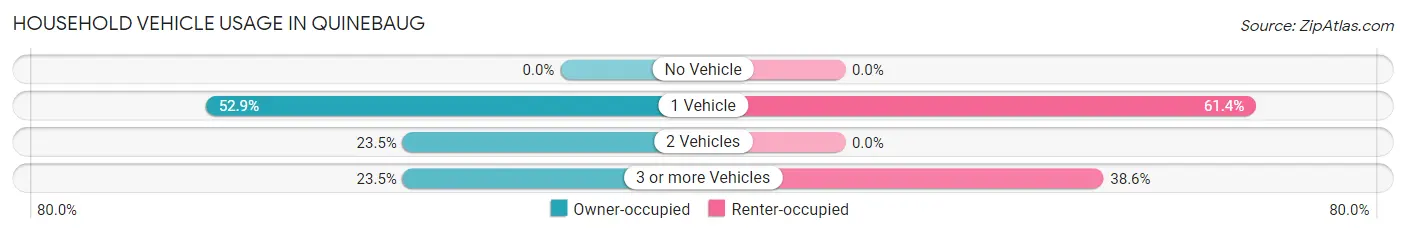
| Vehicles per Household | Owner-occupied | Renter-occupied |
| No Vehicle | 0 (0.0%) | 0 (0.0%) |
| 1 Vehicle | 261 (52.9%) | 35 (61.4%) |
| 2 Vehicles | 116 (23.5%) | 0 (0.0%) |
| 3 or more Vehicles | 116 (23.5%) | 22 (38.6%) |
| Total | 493 (100.0%) | 57 (100.0%) |
Real Estate & Mortgages in Quinebaug
Real Estate and Mortgage Overview in Quinebaug
| Characteristic | Without Mortgage | With Mortgage |
| Housing Units | 290 | 203 |
| Median Property Value | $198,400 | $196,700 |
| Median Household Income | $48,125 | $11 |
| Monthly Housing Costs | $589 | $0 |
| Real Estate Taxes | $2,817 | $0 |
Property Value by Mortgage Status in Quinebaug
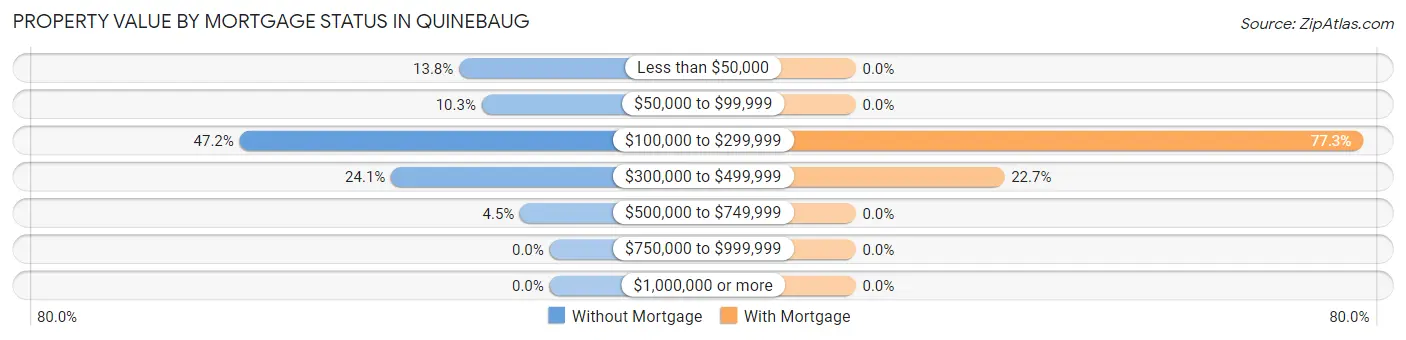
| Property Value | Without Mortgage | With Mortgage |
| Less than $50,000 | 40 (13.8%) | 0 (0.0%) |
| $50,000 to $99,999 | 30 (10.3%) | 0 (0.0%) |
| $100,000 to $299,999 | 137 (47.2%) | 157 (77.3%) |
| $300,000 to $499,999 | 70 (24.1%) | 46 (22.7%) |
| $500,000 to $749,999 | 13 (4.5%) | 0 (0.0%) |
| $750,000 to $999,999 | 0 (0.0%) | 0 (0.0%) |
| $1,000,000 or more | 0 (0.0%) | 0 (0.0%) |
| Total | 290 (100.0%) | 203 (100.0%) |
Household Income by Mortgage Status in Quinebaug
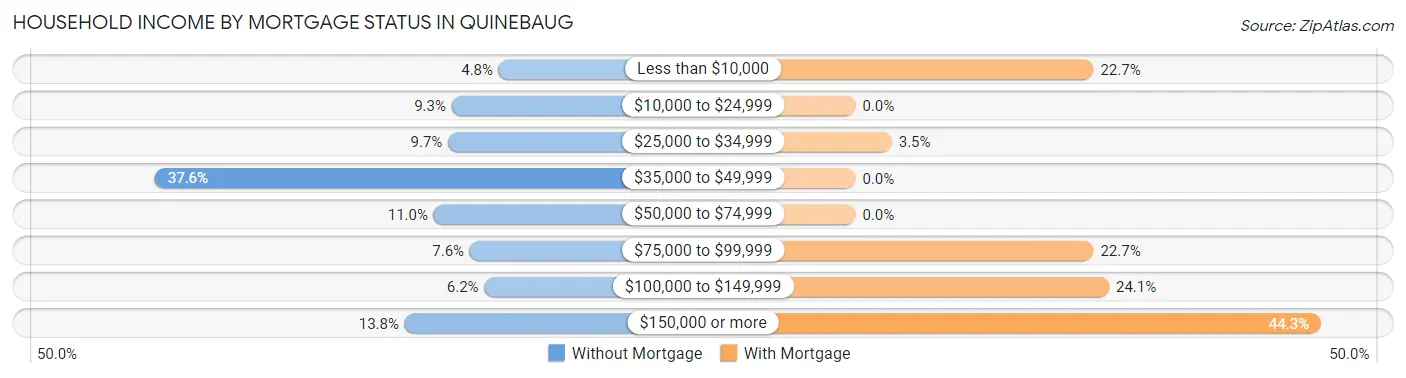
| Household Income | Without Mortgage | With Mortgage |
| Less than $10,000 | 14 (4.8%) | 46 (22.7%) |
| $10,000 to $24,999 | 27 (9.3%) | 0 (0.0%) |
| $25,000 to $34,999 | 28 (9.7%) | 7 (3.5%) |
| $35,000 to $49,999 | 109 (37.6%) | 0 (0.0%) |
| $50,000 to $74,999 | 32 (11.0%) | 0 (0.0%) |
| $75,000 to $99,999 | 22 (7.6%) | 46 (22.7%) |
| $100,000 to $149,999 | 18 (6.2%) | 49 (24.1%) |
| $150,000 or more | 40 (13.8%) | 90 (44.3%) |
| Total | 290 (100.0%) | 203 (100.0%) |
Property Value to Household Income Ratio in Quinebaug
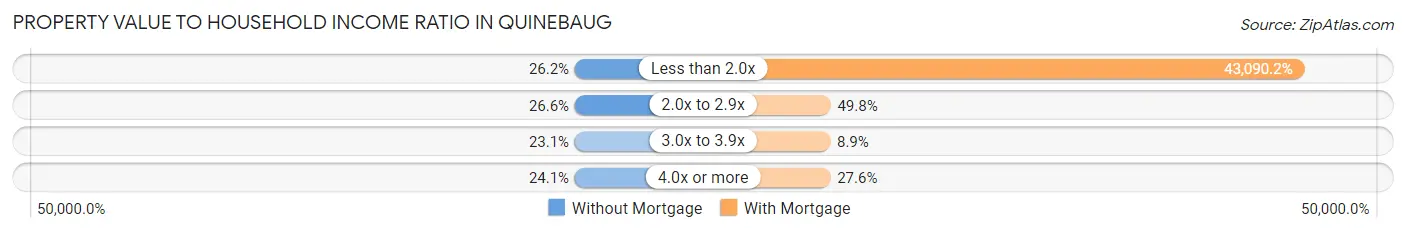
| Value-to-Income Ratio | Without Mortgage | With Mortgage |
| Less than 2.0x | 76 (26.2%) | 87,473 (43,090.1%) |
| 2.0x to 2.9x | 77 (26.6%) | 101 (49.7%) |
| 3.0x to 3.9x | 67 (23.1%) | 18 (8.9%) |
| 4.0x or more | 70 (24.1%) | 56 (27.6%) |
| Total | 290 (100.0%) | 203 (100.0%) |
Real Estate Taxes by Mortgage Status in Quinebaug
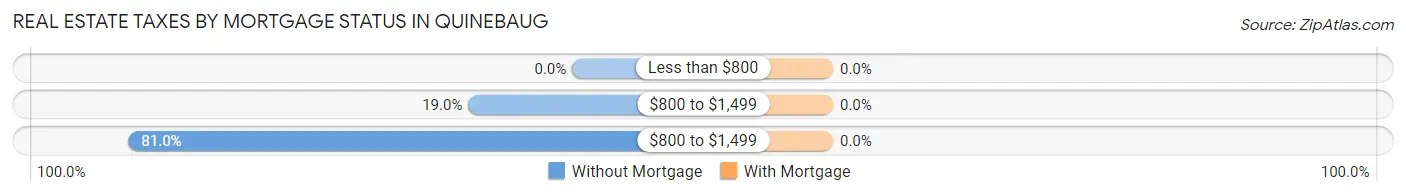
| Property Taxes | Without Mortgage | With Mortgage |
| Less than $800 | 0 (0.0%) | 0 (0.0%) |
| $800 to $1,499 | 55 (19.0%) | 0 (0.0%) |
| $800 to $1,499 | 235 (81.0%) | 0 (0.0%) |
| Total | 290 (100.0%) | 203 (100.0%) |
Health & Disability in Quinebaug
Health Insurance Coverage by Age in Quinebaug
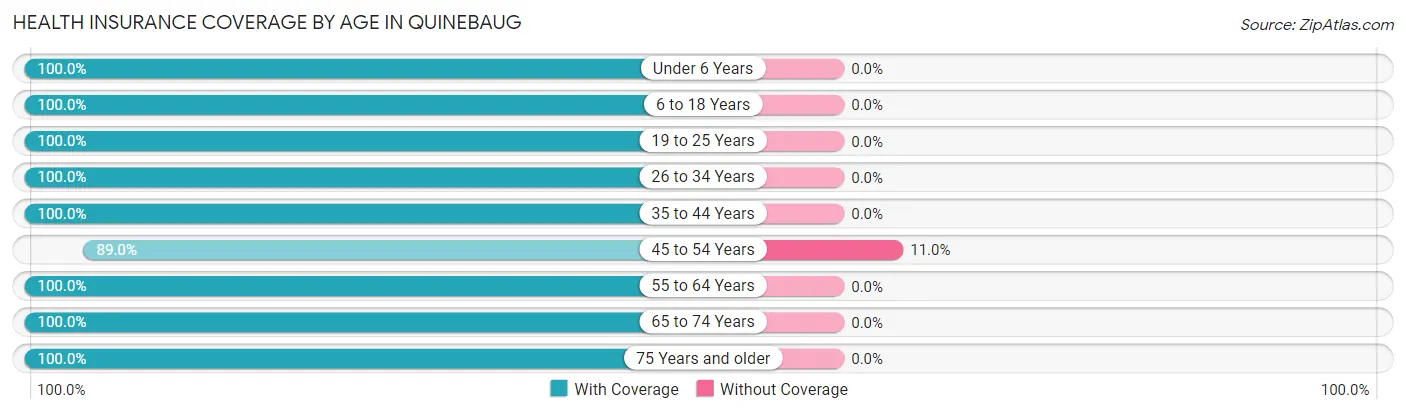
| Age Bracket | With Coverage | Without Coverage |
| Under 6 Years | 12 (100.0%) | 0 (0.0%) |
| 6 to 18 Years | 22 (100.0%) | 0 (0.0%) |
| 19 to 25 Years | 17 (100.0%) | 0 (0.0%) |
| 26 to 34 Years | 142 (100.0%) | 0 (0.0%) |
| 35 to 44 Years | 57 (100.0%) | 0 (0.0%) |
| 45 to 54 Years | 97 (89.0%) | 12 (11.0%) |
| 55 to 64 Years | 104 (100.0%) | 0 (0.0%) |
| 65 to 74 Years | 381 (100.0%) | 0 (0.0%) |
| 75 Years and older | 102 (100.0%) | 0 (0.0%) |
| Total | 934 (98.7%) | 12 (1.3%) |
Health Insurance Coverage by Citizenship Status in Quinebaug
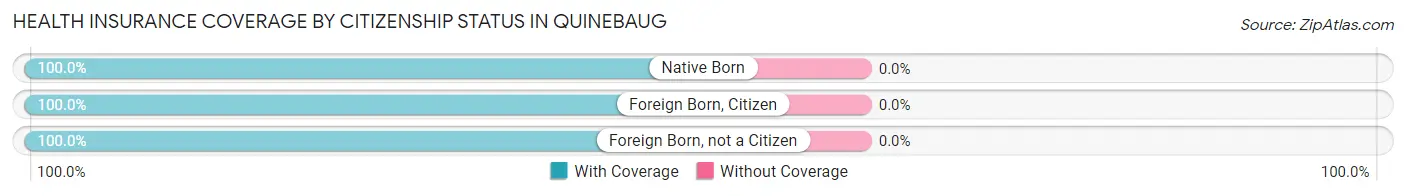
| Citizenship Status | With Coverage | Without Coverage |
| Native Born | 12 (100.0%) | 0 (0.0%) |
| Foreign Born, Citizen | 22 (100.0%) | 0 (0.0%) |
| Foreign Born, not a Citizen | 17 (100.0%) | 0 (0.0%) |
Health Insurance Coverage by Household Income in Quinebaug
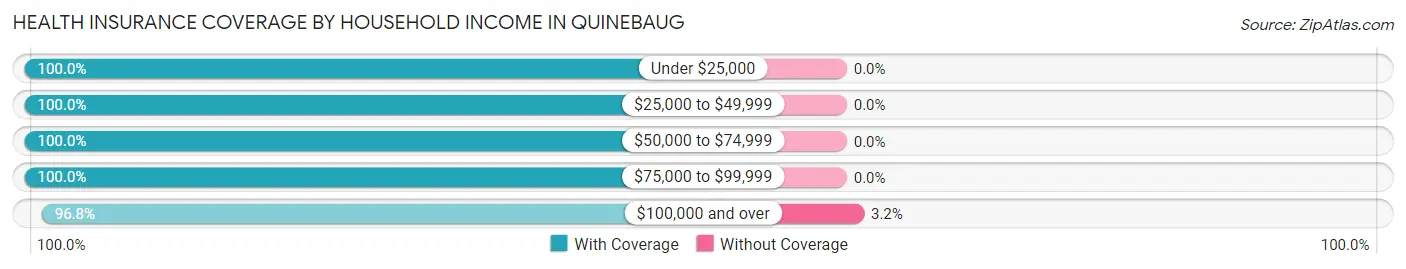
| Household Income | With Coverage | Without Coverage |
| Under $25,000 | 69 (100.0%) | 0 (0.0%) |
| $25,000 to $49,999 | 179 (100.0%) | 0 (0.0%) |
| $50,000 to $74,999 | 188 (100.0%) | 0 (0.0%) |
| $75,000 to $99,999 | 138 (100.0%) | 0 (0.0%) |
| $100,000 and over | 360 (96.8%) | 12 (3.2%) |
Public vs Private Health Insurance Coverage by Age in Quinebaug
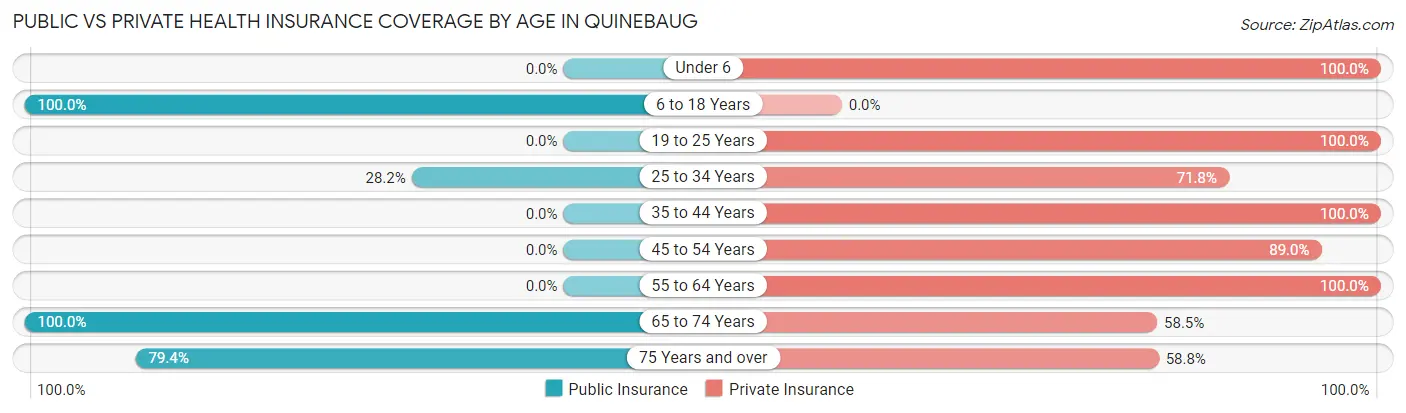
| Age Bracket | Public Insurance | Private Insurance |
| Under 6 | 0 (0.0%) | 12 (100.0%) |
| 6 to 18 Years | 22 (100.0%) | 0 (0.0%) |
| 19 to 25 Years | 0 (0.0%) | 17 (100.0%) |
| 25 to 34 Years | 40 (28.2%) | 102 (71.8%) |
| 35 to 44 Years | 0 (0.0%) | 57 (100.0%) |
| 45 to 54 Years | 0 (0.0%) | 97 (89.0%) |
| 55 to 64 Years | 0 (0.0%) | 104 (100.0%) |
| 65 to 74 Years | 381 (100.0%) | 223 (58.5%) |
| 75 Years and over | 81 (79.4%) | 60 (58.8%) |
| Total | 524 (55.4%) | 672 (71.0%) |
Disability Status by Sex by Age in Quinebaug
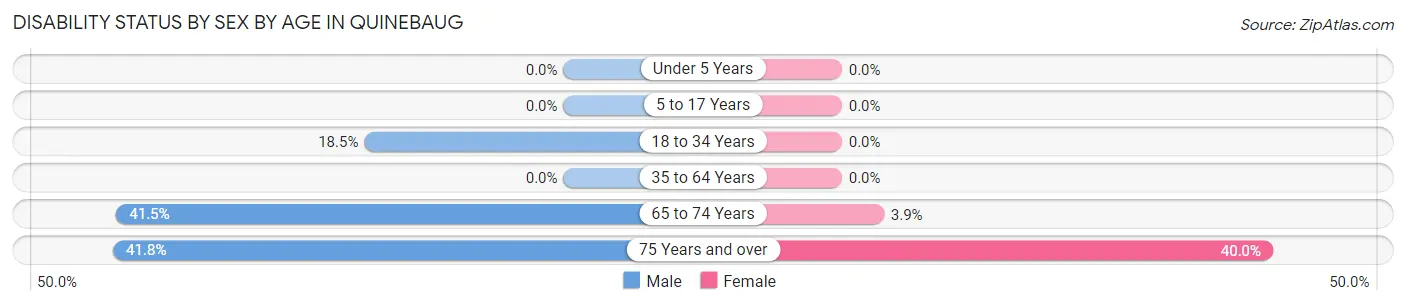
| Age Bracket | Male | Female |
| Under 5 Years | 0 (0.0%) | 0 (0.0%) |
| 5 to 17 Years | 0 (0.0%) | 0 (0.0%) |
| 18 to 34 Years | 17 (18.5%) | 0 (0.0%) |
| 35 to 64 Years | 0 (0.0%) | 0 (0.0%) |
| 65 to 74 Years | 73 (41.5%) | 8 (3.9%) |
| 75 Years and over | 28 (41.8%) | 14 (40.0%) |
Disability Class by Sex by Age in Quinebaug
Disability Class: Hearing Difficulty
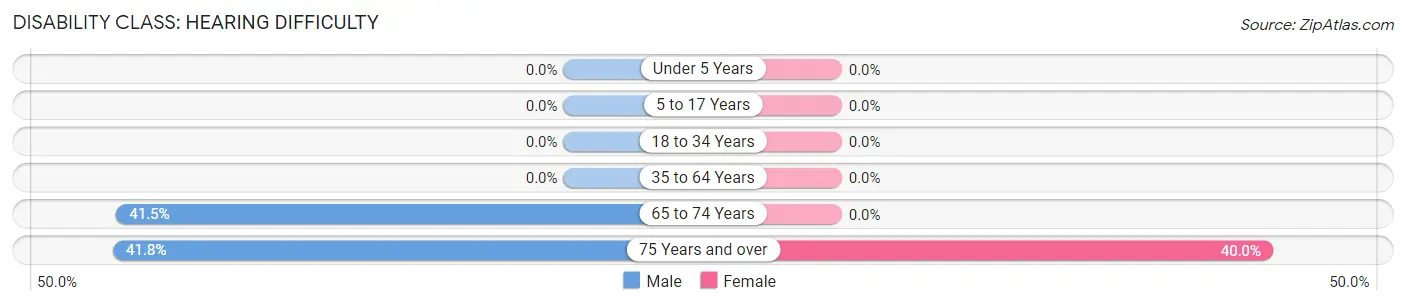
| Age Bracket | Male | Female |
| Under 5 Years | 0 (0.0%) | 0 (0.0%) |
| 5 to 17 Years | 0 (0.0%) | 0 (0.0%) |
| 18 to 34 Years | 0 (0.0%) | 0 (0.0%) |
| 35 to 64 Years | 0 (0.0%) | 0 (0.0%) |
| 65 to 74 Years | 73 (41.5%) | 0 (0.0%) |
| 75 Years and over | 28 (41.8%) | 14 (40.0%) |
Disability Class: Vision Difficulty
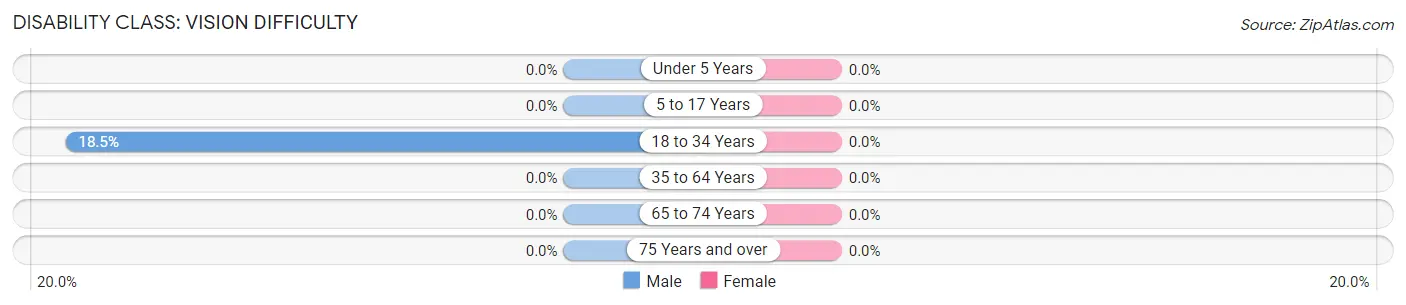
| Age Bracket | Male | Female |
| Under 5 Years | 0 (0.0%) | 0 (0.0%) |
| 5 to 17 Years | 0 (0.0%) | 0 (0.0%) |
| 18 to 34 Years | 17 (18.5%) | 0 (0.0%) |
| 35 to 64 Years | 0 (0.0%) | 0 (0.0%) |
| 65 to 74 Years | 0 (0.0%) | 0 (0.0%) |
| 75 Years and over | 0 (0.0%) | 0 (0.0%) |
Disability Class: Cognitive Difficulty
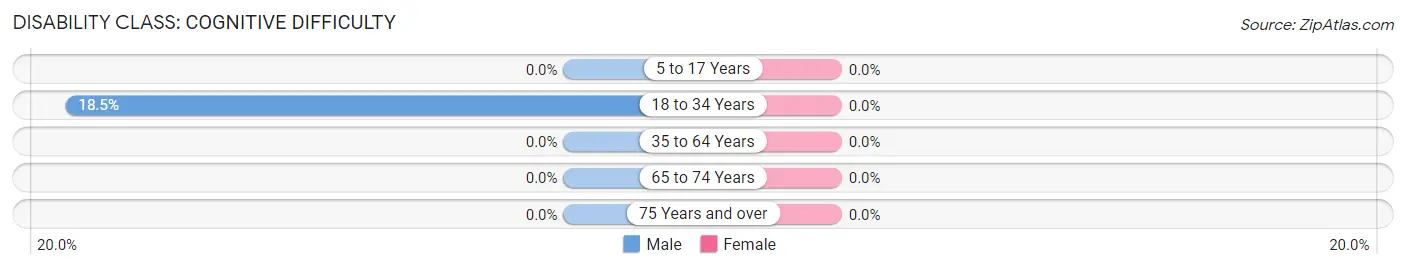
| Age Bracket | Male | Female |
| 5 to 17 Years | 0 (0.0%) | 0 (0.0%) |
| 18 to 34 Years | 17 (18.5%) | 0 (0.0%) |
| 35 to 64 Years | 0 (0.0%) | 0 (0.0%) |
| 65 to 74 Years | 0 (0.0%) | 0 (0.0%) |
| 75 Years and over | 0 (0.0%) | 0 (0.0%) |
Disability Class: Ambulatory Difficulty
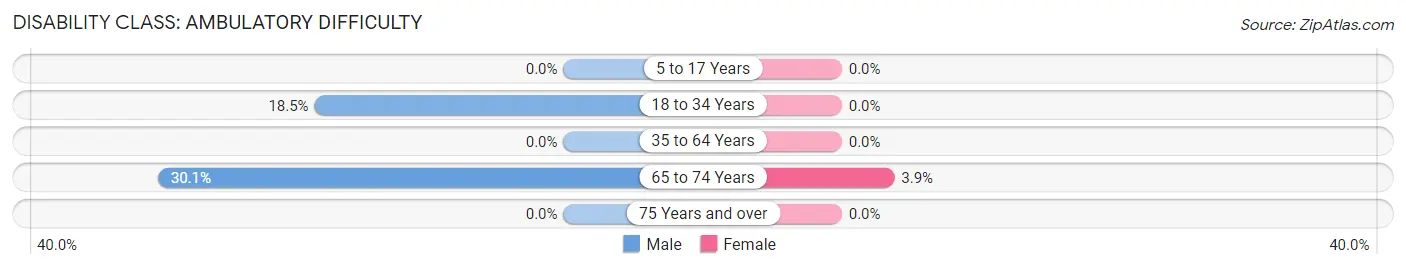
| Age Bracket | Male | Female |
| 5 to 17 Years | 0 (0.0%) | 0 (0.0%) |
| 18 to 34 Years | 17 (18.5%) | 0 (0.0%) |
| 35 to 64 Years | 0 (0.0%) | 0 (0.0%) |
| 65 to 74 Years | 53 (30.1%) | 8 (3.9%) |
| 75 Years and over | 0 (0.0%) | 0 (0.0%) |
Disability Class: Self-Care Difficulty
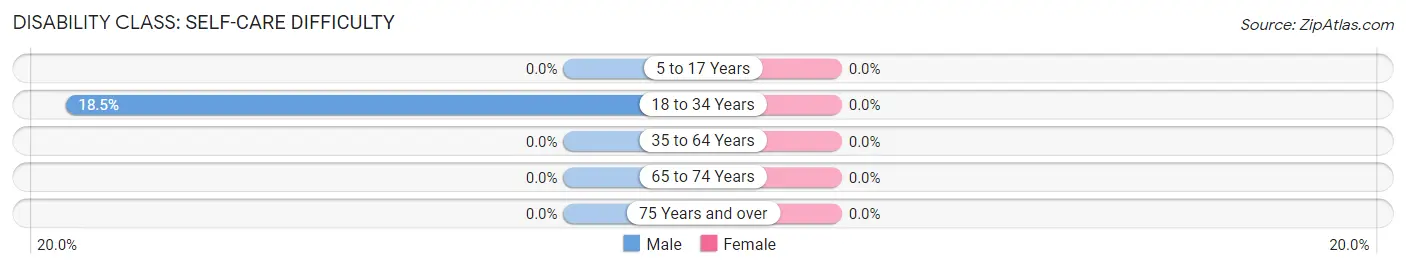
| Age Bracket | Male | Female |
| 5 to 17 Years | 0 (0.0%) | 0 (0.0%) |
| 18 to 34 Years | 17 (18.5%) | 0 (0.0%) |
| 35 to 64 Years | 0 (0.0%) | 0 (0.0%) |
| 65 to 74 Years | 0 (0.0%) | 0 (0.0%) |
| 75 Years and over | 0 (0.0%) | 0 (0.0%) |
Technology Access in Quinebaug
Computing Device Access in Quinebaug
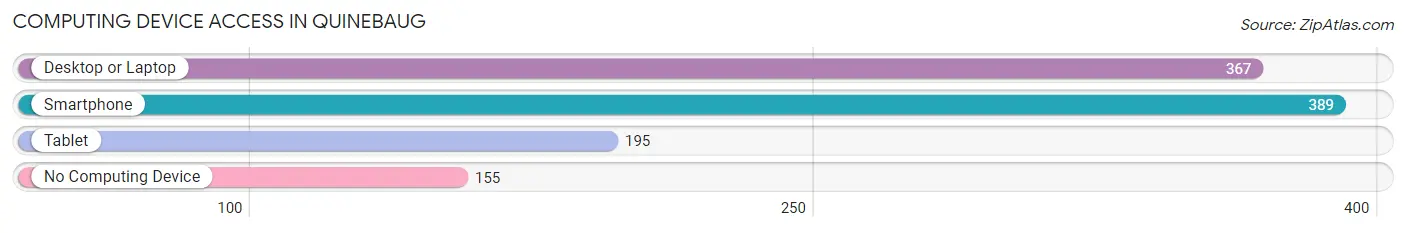
| Device Type | # Households | % Households |
| Desktop or Laptop | 367 | 66.7% |
| Smartphone | 389 | 70.7% |
| Tablet | 195 | 35.4% |
| No Computing Device | 155 | 28.2% |
| Total | 550 | 100.0% |
Internet Access in Quinebaug
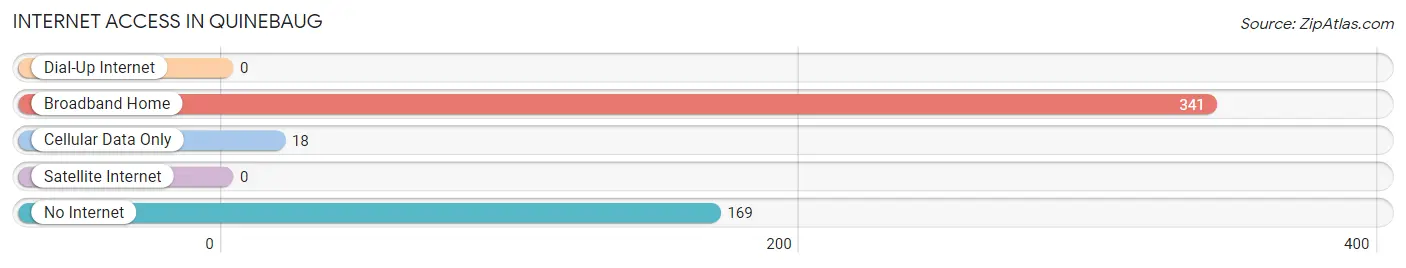
| Internet Type | # Households | % Households |
| Dial-Up Internet | 0 | 0.0% |
| Broadband Home | 341 | 62.0% |
| Cellular Data Only | 18 | 3.3% |
| Satellite Internet | 0 | 0.0% |
| No Internet | 169 | 30.7% |
| Total | 550 | 100.0% |
Quinebaug Summary
Quinebaug, Connecticut is a small town located in Windham County in the northeastern part of the state. It is bordered by the towns of Brooklyn, Canterbury, Plainfield, and Thompson. The town was incorporated in 1719 and is named after the Quinebaug River, which runs through the town. The population of Quinebaug was 2,945 at the 2010 census.
Geography
Quinebaug is located in the Quinebaug Valley, which is a narrow valley that runs from the Massachusetts border to the Rhode Island border. The town is located in the eastern part of the state, about 25 miles from Hartford and about 50 miles from Providence, Rhode Island. The town is mostly rural, with a few small villages and hamlets scattered throughout. The terrain is mostly rolling hills, with some flat areas near the river. The highest point in the town is the summit of Quinebaug Hill, which is 890 feet above sea level.
The Quinebaug River runs through the town, and is a popular spot for fishing and canoeing. The river is also home to several species of fish, including trout, bass, and catfish. The river is also home to several species of birds, including ducks, geese, and herons.
Economy
The economy of Quinebaug is largely based on agriculture and tourism. The town is home to several farms, which produce a variety of crops, including corn, hay, and vegetables. The town is also home to several wineries, which produce a variety of wines.
Tourism is also an important part of the economy. The town is home to several historic sites, including the Quinebaug Valley Historical Society, which is located in the town center. The town is also home to several parks, including Quinebaug State Park, which offers camping, fishing, and hiking.
Demographics
As of the 2010 census, the population of Quinebaug was 2,945. The racial makeup of the town was 95.3% White, 1.2% African American, 0.3% Native American, 0.7% Asian, 0.1% Pacific Islander, 0.7% from other races, and 1.9% from two or more races. Hispanic or Latino of any race were 2.2% of the population.
The median income for a household in the town was $50,938, and the median income for a family was $60,938. The per capita income for the town was $24,938. About 5.3% of families and 7.2% of the population were below the poverty line, including 8.3% of those under age 18 and 5.2% of those age 65 or over.
Quinebaug is a small town with a rich history and a strong sense of community. The town is home to several farms, wineries, and historic sites, and is a popular destination for tourists. The town is also home to a diverse population, with a variety of racial and ethnic backgrounds. The town is a great place to live, work, and raise a family.
Common Questions
What is Per Capita Income in Quinebaug?
Per Capita income in Quinebaug is $43,066.
What is the Median Family Income in Quinebaug?
Median Family Income in Quinebaug is $86,658.
What is the Median Household income in Quinebaug?
Median Household Income in Quinebaug is $73,565.
What is Income or Wage Gap in Quinebaug?
Income or Wage Gap in Quinebaug is 64.1%.
Women in Quinebaug earn 35.9 cents for every dollar earned by a man.
What is Inequality or Gini Index in Quinebaug?
Inequality or Gini Index in Quinebaug is 0.36.
What is the Total Population of Quinebaug?
Total Population of Quinebaug is 946.
What is the Total Male Population of Quinebaug?
Total Male Population of Quinebaug is 503.
What is the Total Female Population of Quinebaug?
Total Female Population of Quinebaug is 443.
What is the Ratio of Males per 100 Females in Quinebaug?
There are 113.54 Males per 100 Females in Quinebaug.
What is the Ratio of Females per 100 Males in Quinebaug?
There are 88.07 Females per 100 Males in Quinebaug.
What is the Median Population Age in Quinebaug?
Median Population Age in Quinebaug is 65.1 Years.
What is the Average Family Size in Quinebaug
Average Family Size in Quinebaug is 2.2 People.
What is the Average Household Size in Quinebaug
Average Household Size in Quinebaug is 1.7 People.
How Large is the Labor Force in Quinebaug?
There are 532 People in the Labor Forcein in Quinebaug.
What is the Percentage of People in the Labor Force in Quinebaug?
58.3% of People are in the Labor Force in Quinebaug.
What is the Unemployment Rate in Quinebaug?
Unemployment Rate in Quinebaug is 10.2%.