Long Hill, CT Map & Demographics
Long Hill Map
Long Hill Overview
$43,121
PER CAPITA INCOME
$102,925
AVG FAMILY INCOME
$81,750
AVG HOUSEHOLD INCOME
39.0%
WAGE / INCOME GAP [ % ]
61.0¢/ $1
WAGE / INCOME GAP [ $ ]
$14,579
FAMILY INCOME DEFICIT
0.34
INEQUALITY / GINI INDEX
4,520
TOTAL POPULATION
2,372
MALE POPULATION
2,148
FEMALE POPULATION
110.43
MALES / 100 FEMALES
90.56
FEMALES / 100 MALES
31.4
MEDIAN AGE
2.8
AVG FAMILY SIZE
2.0
AVG HOUSEHOLD SIZE
2,827
LABOR FORCE [ PEOPLE ]
72.5%
PERCENT IN LABOR FORCE
5.5%
UNEMPLOYMENT RATE
Income in Long Hill
Income Overview in Long Hill
Per Capita Income in Long Hill is $43,121, while median incomes of families and households are $102,925 and $81,750 respectively.
| Characteristic | Number | Measure |
| Per Capita Income | 4,520 | $43,121 |
| Median Family Income | 848 | $102,925 |
| Mean Family Income | 848 | $109,116 |
| Median Household Income | 2,128 | $81,750 |
| Mean Household Income | 2,128 | $88,404 |
| Income Deficit | 848 | $14,579 |
| Wage / Income Gap (%) | 4,520 | 38.98% |
| Wage / Income Gap ($) | 4,520 | 61.02¢ per $1 |
| Gini / Inequality Index | 4,520 | 0.34 |
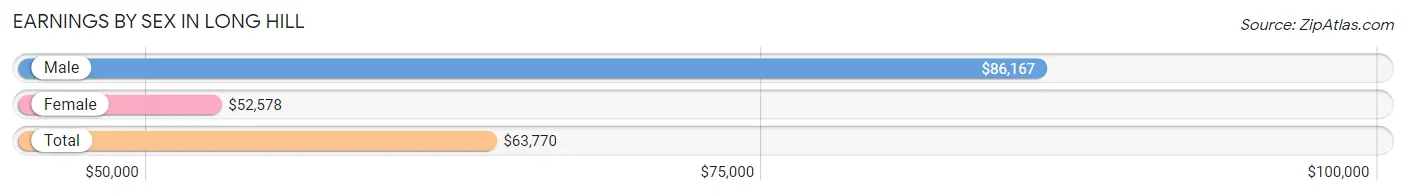
Earnings by Sex in Long Hill
Average Earnings in Long Hill are $63,770, $86,167 for men and $52,578 for women, a difference of 39.0%.
| Sex | Number | Average Earnings |
| Male | 1,678 (57.7%) | $86,167 |
| Female | 1,232 (42.3%) | $52,578 |
| Total | 2,910 (100.0%) | $63,770 |
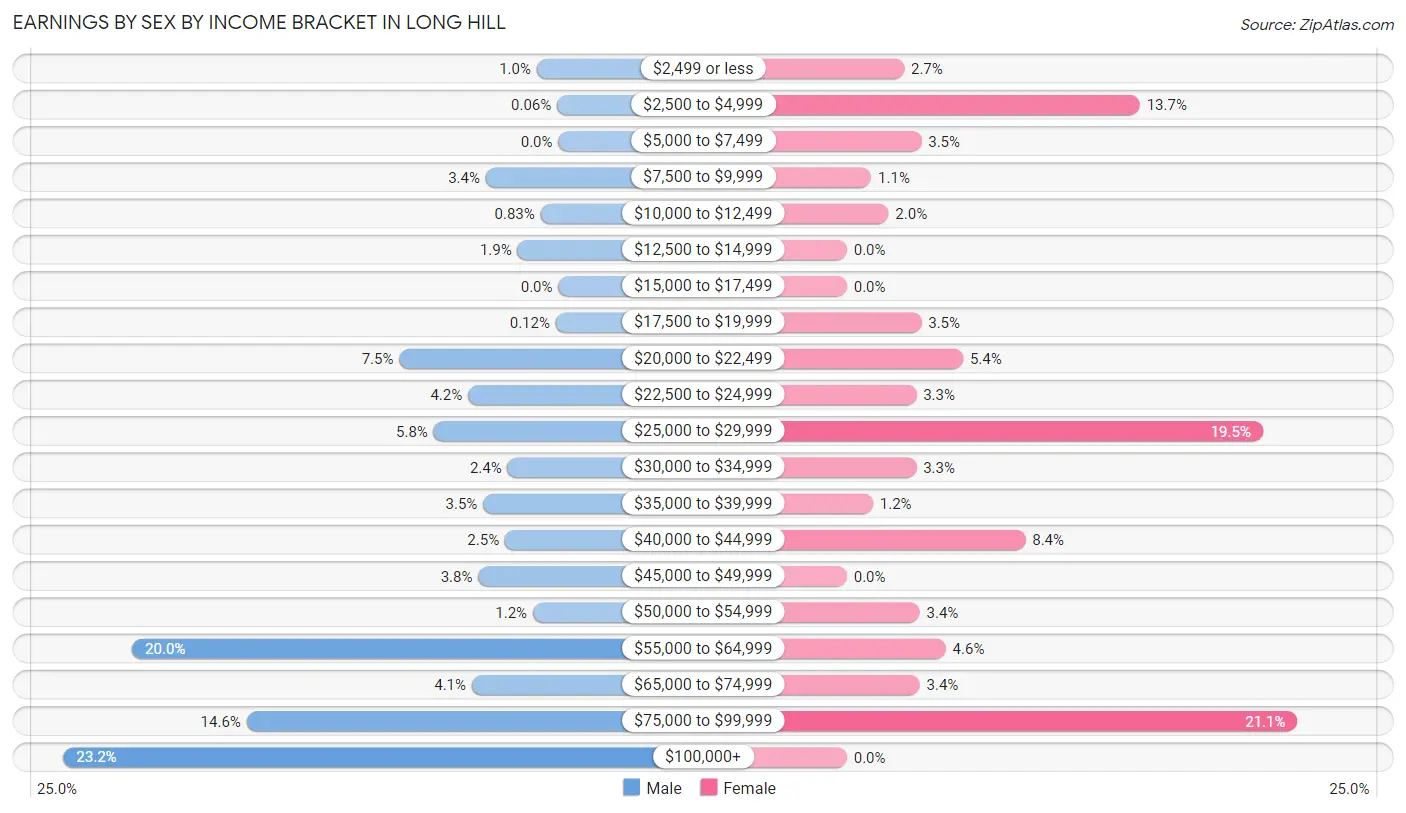
Earnings by Sex by Income Bracket in Long Hill
The most common earnings brackets in Long Hill are $100,000+ for men (389 | 23.2%) and $75,000 to $99,999 for women (260 | 21.1%).
| Income | Male | Female |
| $2,499 or less | 17 (1.0%) | 33 (2.7%) |
| $2,500 to $4,999 | 1 (0.1%) | 169 (13.7%) |
| $5,000 to $7,499 | 0 (0.0%) | 43 (3.5%) |
| $7,500 to $9,999 | 57 (3.4%) | 14 (1.1%) |
| $10,000 to $12,499 | 14 (0.8%) | 24 (1.9%) |
| $12,500 to $14,999 | 32 (1.9%) | 0 (0.0%) |
| $15,000 to $17,499 | 0 (0.0%) | 0 (0.0%) |
| $17,500 to $19,999 | 2 (0.1%) | 43 (3.5%) |
| $20,000 to $22,499 | 125 (7.4%) | 67 (5.4%) |
| $22,500 to $24,999 | 71 (4.2%) | 40 (3.3%) |
| $25,000 to $29,999 | 98 (5.8%) | 240 (19.5%) |
| $30,000 to $34,999 | 40 (2.4%) | 40 (3.3%) |
| $35,000 to $39,999 | 59 (3.5%) | 15 (1.2%) |
| $40,000 to $44,999 | 42 (2.5%) | 103 (8.4%) |
| $45,000 to $49,999 | 63 (3.7%) | 0 (0.0%) |
| $50,000 to $54,999 | 20 (1.2%) | 42 (3.4%) |
| $55,000 to $64,999 | 335 (20.0%) | 57 (4.6%) |
| $65,000 to $74,999 | 68 (4.1%) | 42 (3.4%) |
| $75,000 to $99,999 | 245 (14.6%) | 260 (21.1%) |
| $100,000+ | 389 (23.2%) | 0 (0.0%) |
| Total | 1,678 (100.0%) | 1,232 (100.0%) |
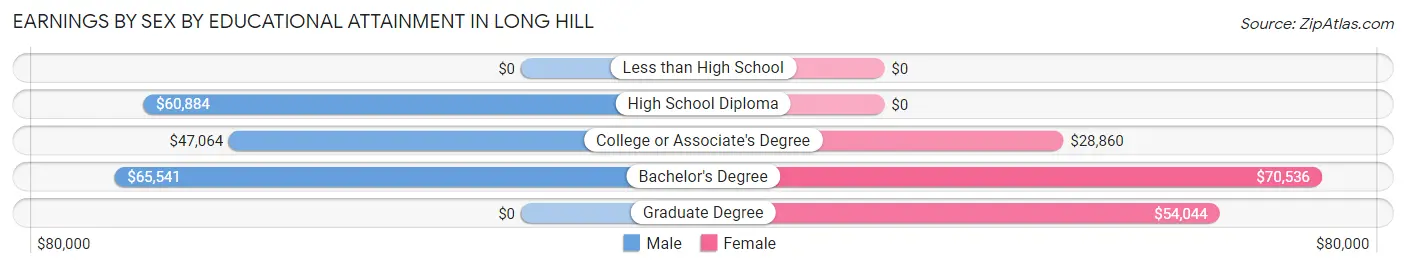
Earnings by Sex by Educational Attainment in Long Hill
Average earnings in Long Hill are $59,787 for men and $28,870 for women, a difference of 51.7%. Men with an educational attainment of bachelor's degree enjoy the highest average annual earnings of $65,541, while those with college or associate's degree education earn the least with $47,064. Women with an educational attainment of bachelor's degree earn the most with the average annual earnings of $70,536, while those with college or associate's degree education have the smallest earnings of $28,860.
| Educational Attainment | Male Income | Female Income |
| Less than High School | - | - |
| High School Diploma | $60,884 | $0 |
| College or Associate's Degree | $47,064 | $28,860 |
| Bachelor's Degree | $65,541 | $70,536 |
| Graduate Degree | - | - |
| Total | $59,787 | $28,870 |
Family Income in Long Hill
Family Income Brackets in Long Hill
According to the Long Hill family income data, there are 261 families falling into the $100,000 to $149,999 income range, which is the most common income bracket and makes up 30.8% of all families.
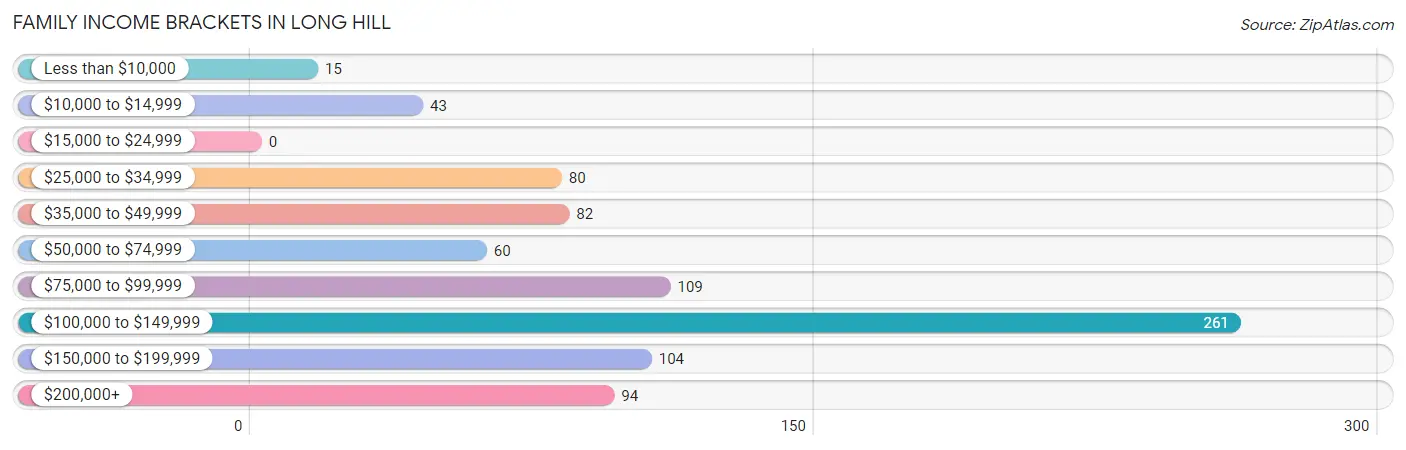
| Income Bracket | # Families | % Families |
| Less than $10,000 | 15 | 1.8% |
| $10,000 to $14,999 | 43 | 5.1% |
| $15,000 to $24,999 | 0 | 0.0% |
| $25,000 to $34,999 | 80 | 9.4% |
| $35,000 to $49,999 | 82 | 9.7% |
| $50,000 to $74,999 | 60 | 7.1% |
| $75,000 to $99,999 | 109 | 12.9% |
| $100,000 to $149,999 | 261 | 30.8% |
| $150,000 to $199,999 | 104 | 12.3% |
| $200,000+ | 94 | 11.1% |
Family Income by Famaliy Size in Long Hill
3-person families (276 | 32.6%) account for the highest median family income in Long Hill with $101,923 per family, while 2-person families (479 | 56.5%) have the highest median income of $49,799 per family member.
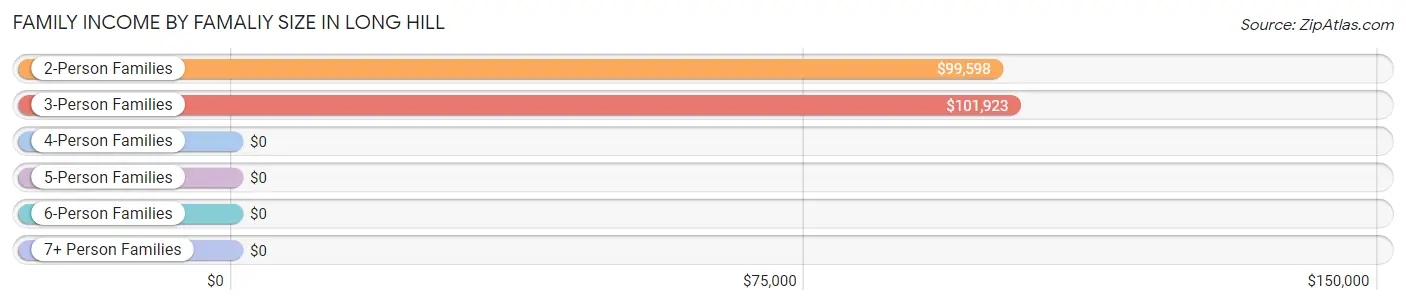
| Income Bracket | # Families | Median Income |
| 2-Person Families | 479 (56.5%) | $99,598 |
| 3-Person Families | 276 (32.6%) | $101,923 |
| 4-Person Families | 48 (5.7%) | $0 |
| 5-Person Families | 45 (5.3%) | $0 |
| 6-Person Families | 0 (0.0%) | $0 |
| 7+ Person Families | 0 (0.0%) | $0 |
| Total | 848 (100.0%) | $102,925 |
Family Income by Number of Earners in Long Hill
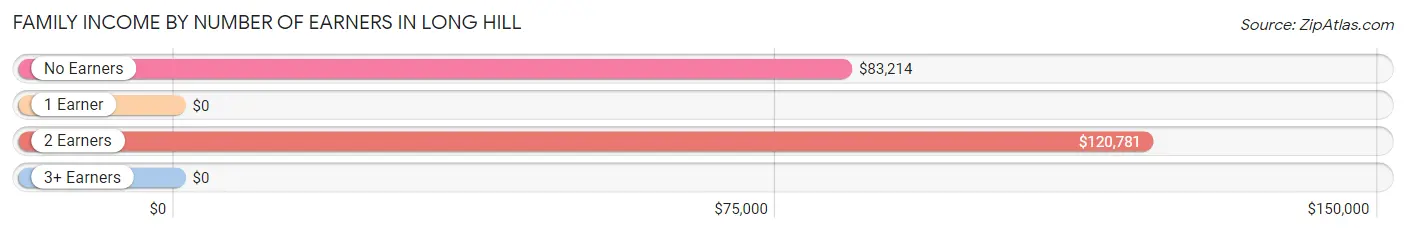
| Number of Earners | # Families | Median Income |
| No Earners | 150 (17.7%) | $83,214 |
| 1 Earner | 352 (41.5%) | $0 |
| 2 Earners | 234 (27.6%) | $120,781 |
| 3+ Earners | 112 (13.2%) | $0 |
| Total | 848 (100.0%) | $102,925 |
Household Income in Long Hill
Household Income Brackets in Long Hill
With 481 households falling in the category, the $75,000 to $99,999 income range is the most frequent in Long Hill, accounting for 22.6% of all households. In contrast, only 34 households (1.6%) fall into the less than $10,000 income bracket, making it the least populous group.
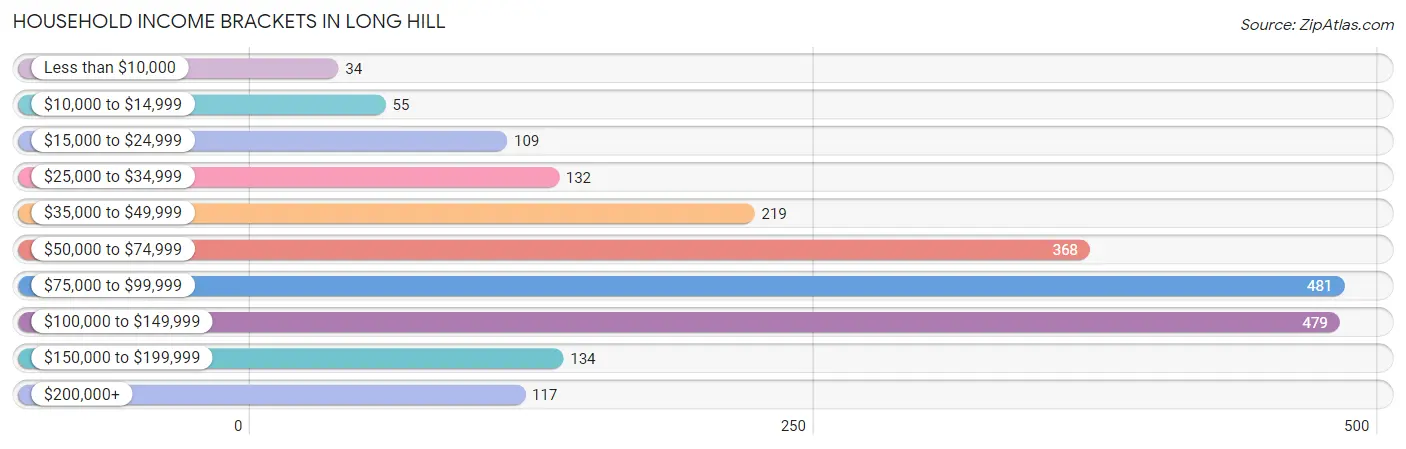
| Income Bracket | # Households | % Households |
| Less than $10,000 | 34 | 1.6% |
| $10,000 to $14,999 | 55 | 2.6% |
| $15,000 to $24,999 | 109 | 5.1% |
| $25,000 to $34,999 | 132 | 6.2% |
| $35,000 to $49,999 | 219 | 10.3% |
| $50,000 to $74,999 | 368 | 17.3% |
| $75,000 to $99,999 | 481 | 22.6% |
| $100,000 to $149,999 | 479 | 22.5% |
| $150,000 to $199,999 | 134 | 6.3% |
| $200,000+ | 117 | 5.5% |
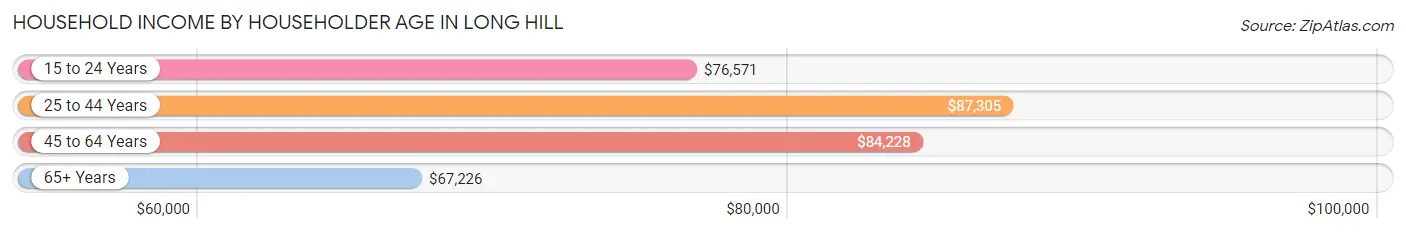
Household Income by Householder Age in Long Hill
The median household income in Long Hill is $81,750, with the highest median household income of $87,305 found in the 25 to 44 years age bracket for the primary householder. A total of 1,031 households (48.4%) fall into this category. Meanwhile, the 65+ years age bracket for the primary householder has the lowest median household income of $67,226, with 401 households (18.8%) in this group.
| Income Bracket | # Households | Median Income |
| 15 to 24 Years | 264 (12.4%) | $76,571 |
| 25 to 44 Years | 1,031 (48.4%) | $87,305 |
| 45 to 64 Years | 432 (20.3%) | $84,228 |
| 65+ Years | 401 (18.8%) | $67,226 |
| Total | 2,128 (100.0%) | $81,750 |
Poverty in Long Hill
Income Below Poverty by Sex and Age in Long Hill
With 8.0% poverty level for males and 10.1% for females among the residents of Long Hill, 15 year old males and under 5 year old females are the most vulnerable to poverty, with 16 males (100.0%) and 30 females (52.6%) in their respective age groups living below the poverty level.
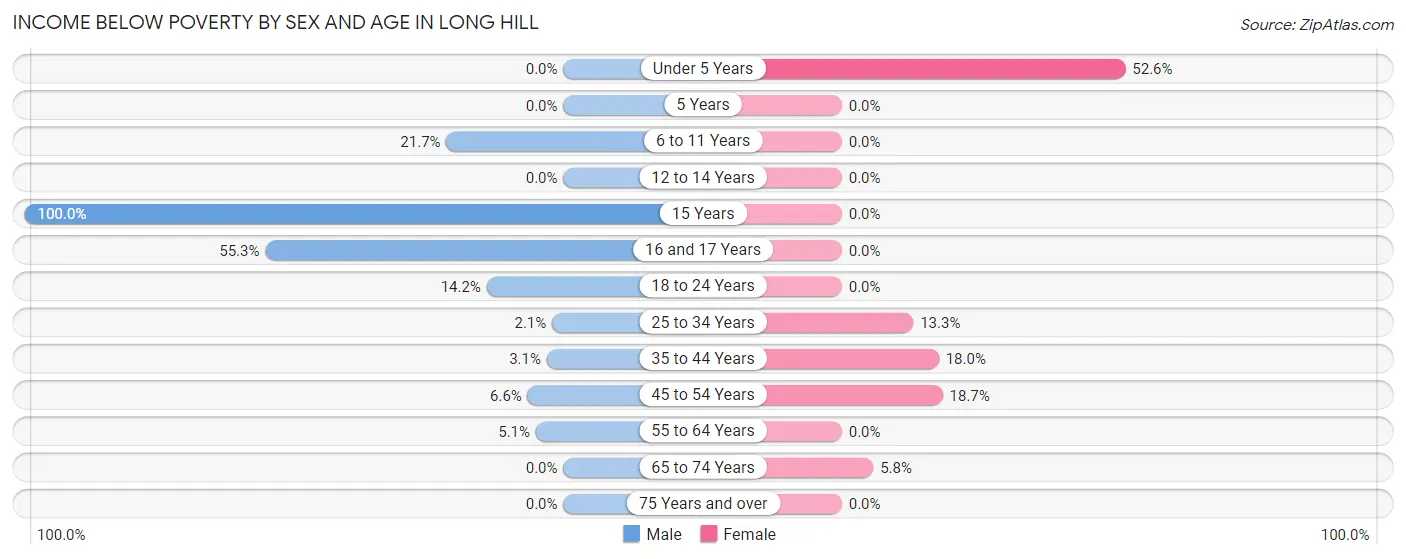
| Age Bracket | Male | Female |
| Under 5 Years | 0 (0.0%) | 30 (52.6%) |
| 5 Years | 0 (0.0%) | 0 (0.0%) |
| 6 to 11 Years | 56 (21.7%) | 0 (0.0%) |
| 12 to 14 Years | 0 (0.0%) | 0 (0.0%) |
| 15 Years | 16 (100.0%) | 0 (0.0%) |
| 16 and 17 Years | 26 (55.3%) | 0 (0.0%) |
| 18 to 24 Years | 38 (14.2%) | 0 (0.0%) |
| 25 to 34 Years | 17 (2.1%) | 87 (13.3%) |
| 35 to 44 Years | 5 (3.1%) | 34 (18.0%) |
| 45 to 54 Years | 18 (6.6%) | 32 (18.7%) |
| 55 to 64 Years | 8 (5.1%) | 0 (0.0%) |
| 65 to 74 Years | 0 (0.0%) | 19 (5.8%) |
| 75 Years and over | 0 (0.0%) | 0 (0.0%) |
| Total | 184 (8.0%) | 202 (10.1%) |
Income Above Poverty by Sex and Age in Long Hill
According to the poverty statistics in Long Hill, males aged under 5 years and females aged 6 to 11 years are the age groups that are most secure financially, with 100.0% of males and 100.0% of females in these age groups living above the poverty line.
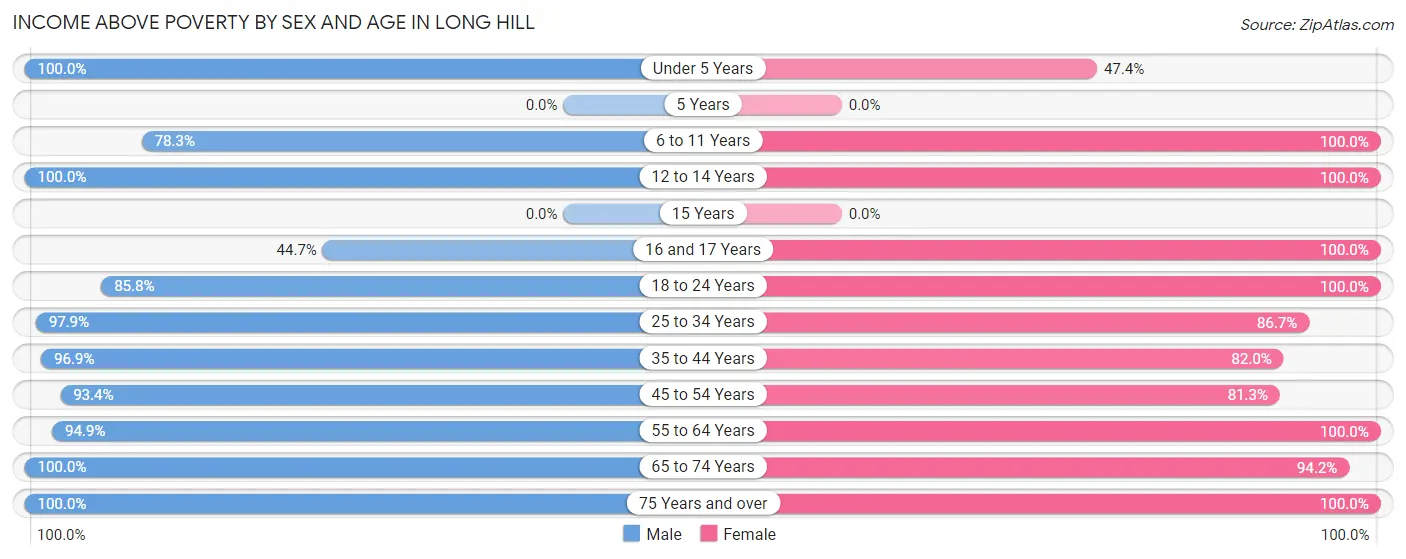
| Age Bracket | Male | Female |
| Under 5 Years | 73 (100.0%) | 27 (47.4%) |
| 5 Years | 0 (0.0%) | 0 (0.0%) |
| 6 to 11 Years | 202 (78.3%) | 17 (100.0%) |
| 12 to 14 Years | 28 (100.0%) | 102 (100.0%) |
| 15 Years | 0 (0.0%) | 0 (0.0%) |
| 16 and 17 Years | 21 (44.7%) | 46 (100.0%) |
| 18 to 24 Years | 229 (85.8%) | 198 (100.0%) |
| 25 to 34 Years | 797 (97.9%) | 569 (86.7%) |
| 35 to 44 Years | 158 (96.9%) | 155 (82.0%) |
| 45 to 54 Years | 254 (93.4%) | 139 (81.3%) |
| 55 to 64 Years | 149 (94.9%) | 136 (100.0%) |
| 65 to 74 Years | 41 (100.0%) | 307 (94.2%) |
| 75 Years and over | 153 (100.0%) | 95 (100.0%) |
| Total | 2,105 (92.0%) | 1,791 (89.9%) |
Income Below Poverty Among Married-Couple Families in Long Hill
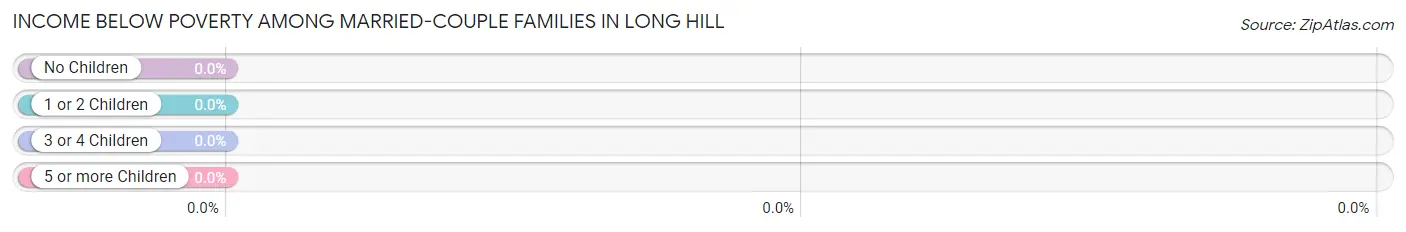
| Children | Above Poverty | Below Poverty |
| No Children | 334 (100.0%) | 0 (0.0%) |
| 1 or 2 Children | 169 (100.0%) | 0 (0.0%) |
| 3 or 4 Children | 0 (0.0%) | 0 (0.0%) |
| 5 or more Children | 0 (0.0%) | 0 (0.0%) |
| Total | 503 (100.0%) | 0 (0.0%) |
Income Below Poverty Among Single-Parent Households in Long Hill
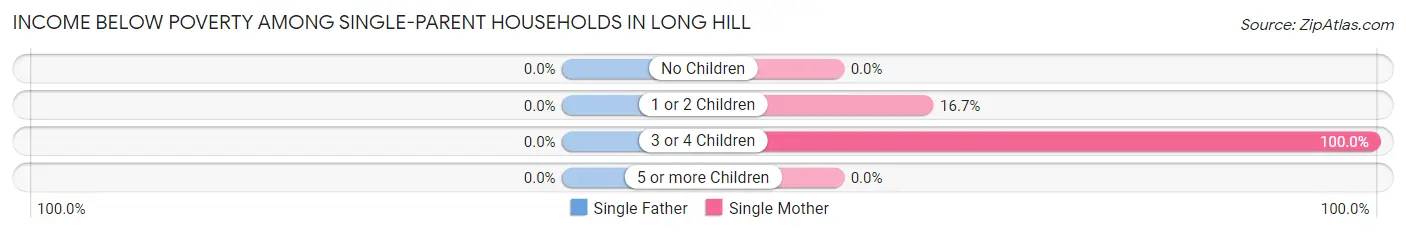
| Children | Single Father | Single Mother |
| No Children | 0 (0.0%) | 0 (0.0%) |
| 1 or 2 Children | 0 (0.0%) | 31 (16.7%) |
| 3 or 4 Children | 0 (0.0%) | 27 (100.0%) |
| 5 or more Children | 0 (0.0%) | 0 (0.0%) |
| Total | 0 (0.0%) | 58 (23.8%) |
Income Below Poverty Among Married-Couple vs Single-Parent Households in Long Hill
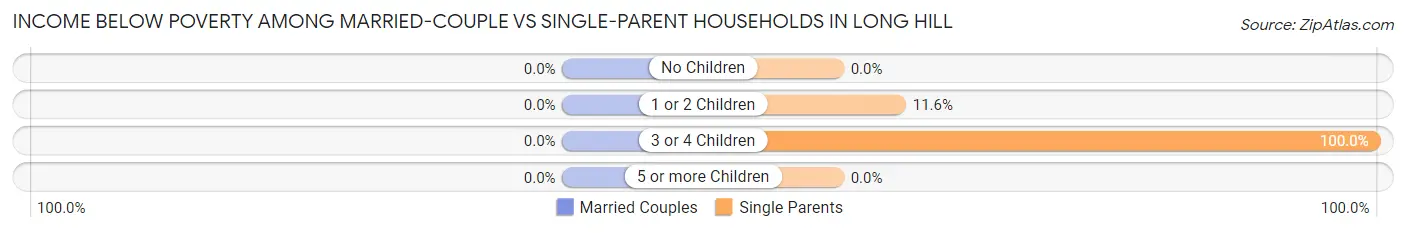
| Children | Married-Couple Families | Single-Parent Households |
| No Children | 0 (0.0%) | 0 (0.0%) |
| 1 or 2 Children | 0 (0.0%) | 31 (11.6%) |
| 3 or 4 Children | 0 (0.0%) | 27 (100.0%) |
| 5 or more Children | 0 (0.0%) | 0 (0.0%) |
| Total | 0 (0.0%) | 58 (16.8%) |
Race in Long Hill
The most populous races in Long Hill are White / Caucasian (2,893 | 64.0%), Asian (846 | 18.7%), and Black / African American (396 | 8.8%).
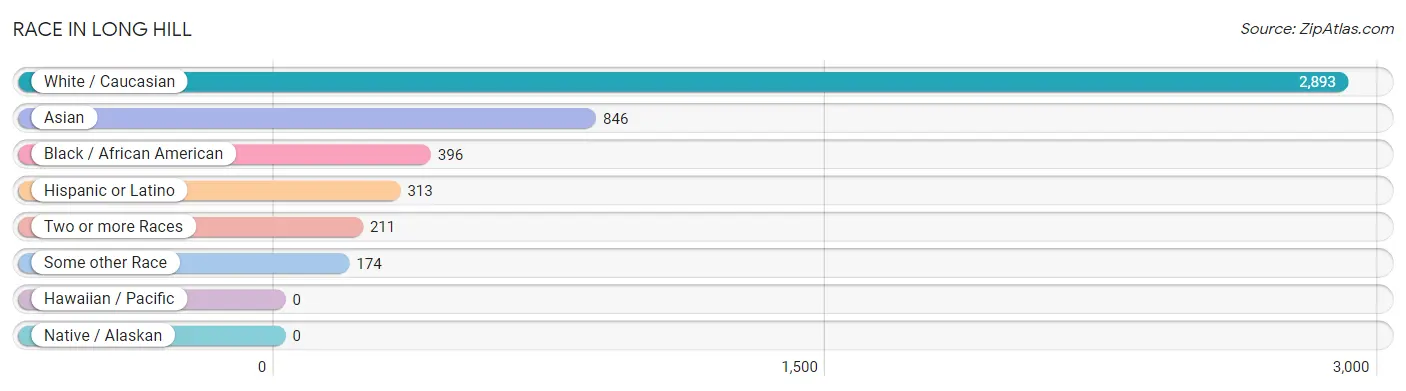
| Race | # Population | % Population |
| Asian | 846 | 18.7% |
| Black / African American | 396 | 8.8% |
| Hawaiian / Pacific | 0 | 0.0% |
| Hispanic or Latino | 313 | 6.9% |
| Native / Alaskan | 0 | 0.0% |
| White / Caucasian | 2,893 | 64.0% |
| Two or more Races | 211 | 4.7% |
| Some other Race | 174 | 3.8% |
| Total | 4,520 | 100.0% |
Ancestry in Long Hill
The most populous ancestries reported in Long Hill are Irish (859 | 19.0%), Korean (450 | 10.0%), German (413 | 9.1%), Italian (362 | 8.0%), and Thai (351 | 7.8%), together accounting for 53.9% of all Long Hill residents.
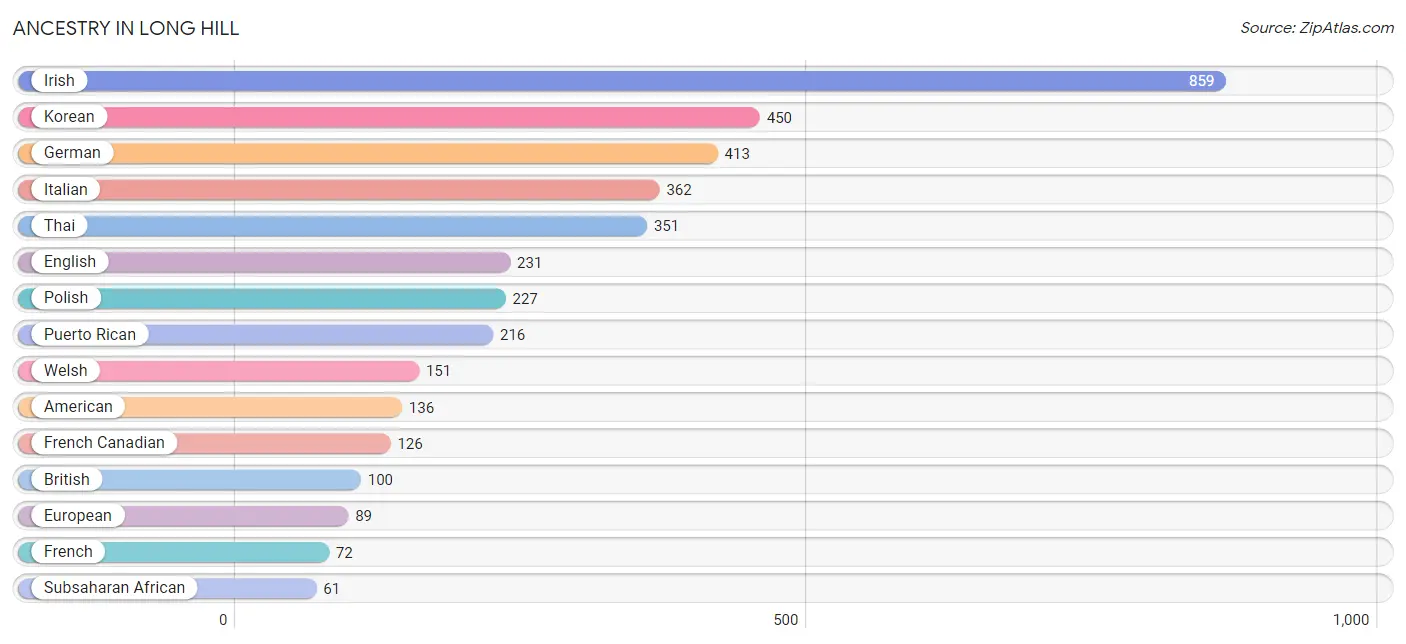
| Ancestry | # Population | % Population |
| African | 31 | 0.7% |
| American | 136 | 3.0% |
| Arab | 17 | 0.4% |
| Austrian | 6 | 0.1% |
| Barbadian | 7 | 0.2% |
| British | 100 | 2.2% |
| Burmese | 8 | 0.2% |
| Canadian | 33 | 0.7% |
| Cape Verdean | 13 | 0.3% |
| Colombian | 11 | 0.2% |
| Croatian | 11 | 0.2% |
| Cuban | 23 | 0.5% |
| Danish | 16 | 0.4% |
| Dutch | 27 | 0.6% |
| Eastern European | 16 | 0.4% |
| English | 231 | 5.1% |
| European | 89 | 2.0% |
| French | 72 | 1.6% |
| French Canadian | 126 | 2.8% |
| German | 413 | 9.1% |
| Greek | 20 | 0.4% |
| Haitian | 5 | 0.1% |
| Indian (Asian) | 56 | 1.2% |
| Irish | 859 | 19.0% |
| Italian | 362 | 8.0% |
| Kenyan | 17 | 0.4% |
| Korean | 450 | 10.0% |
| Lithuanian | 13 | 0.3% |
| Mexican | 25 | 0.5% |
| Navajo | 29 | 0.6% |
| Norwegian | 11 | 0.2% |
| Polish | 227 | 5.0% |
| Portuguese | 32 | 0.7% |
| Puerto Rican | 216 | 4.8% |
| Scottish | 12 | 0.3% |
| Serbian | 11 | 0.2% |
| Slavic | 20 | 0.4% |
| South American | 11 | 0.2% |
| Spaniard | 32 | 0.7% |
| Spanish | 6 | 0.1% |
| Subsaharan African | 61 | 1.3% |
| Swedish | 46 | 1.0% |
| Thai | 351 | 7.8% |
| Turkish | 48 | 1.1% |
| Ukrainian | 23 | 0.5% |
| Welsh | 151 | 3.3% |
| West Indian | 13 | 0.3% | View All 47 Rows |
Immigrants in Long Hill
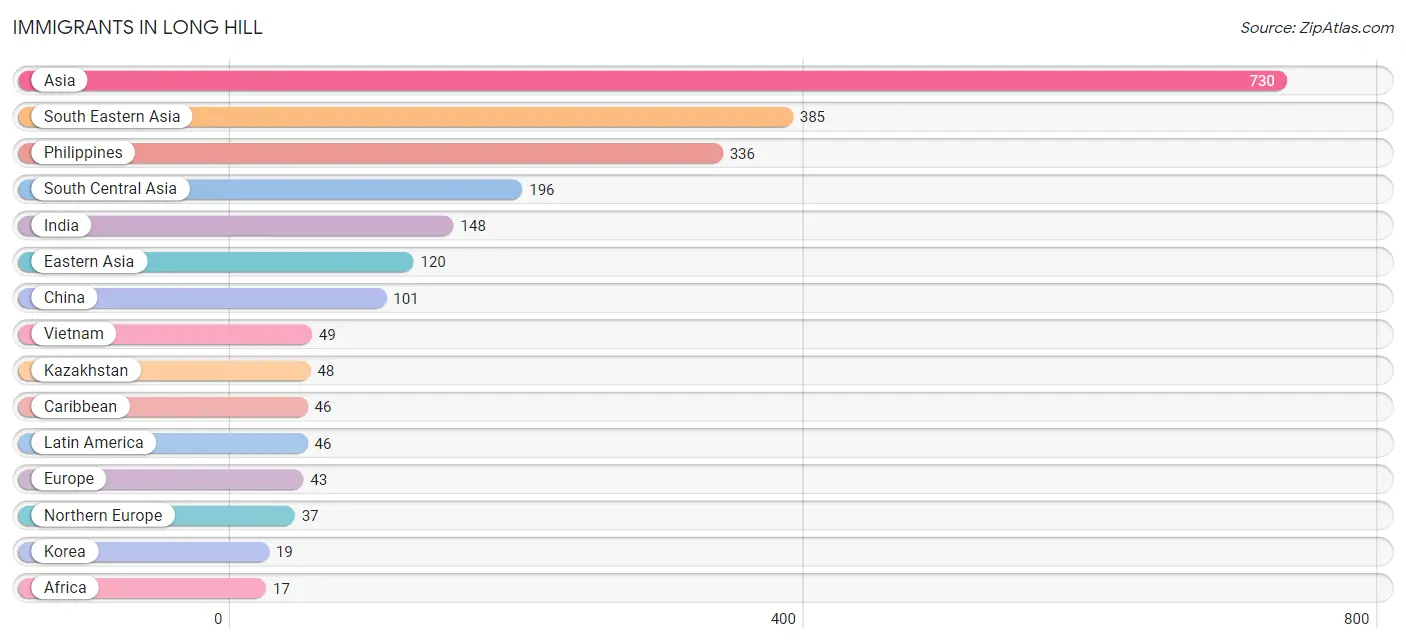
The most numerous immigrant groups reported in Long Hill came from Asia (730 | 16.2%), South Eastern Asia (385 | 8.5%), Philippines (336 | 7.4%), South Central Asia (196 | 4.3%), and India (148 | 3.3%), together accounting for 39.7% of all Long Hill residents.
| Immigration Origin | # Population | % Population |
| Africa | 17 | 0.4% |
| Asia | 730 | 16.2% |
| Austria | 6 | 0.1% |
| Caribbean | 46 | 1.0% |
| China | 101 | 2.2% |
| Eastern Africa | 17 | 0.4% |
| Eastern Asia | 120 | 2.6% |
| Europe | 43 | 0.9% |
| Haiti | 5 | 0.1% |
| India | 148 | 3.3% |
| Kazakhstan | 48 | 1.1% |
| Kenya | 17 | 0.4% |
| Korea | 19 | 0.4% |
| Latin America | 46 | 1.0% |
| Northern Europe | 37 | 0.8% |
| Philippines | 336 | 7.4% |
| South Central Asia | 196 | 4.3% |
| South Eastern Asia | 385 | 8.5% |
| Vietnam | 49 | 1.1% |
| Western Europe | 6 | 0.1% | View All 20 Rows |
Sex and Age in Long Hill
Sex and Age in Long Hill
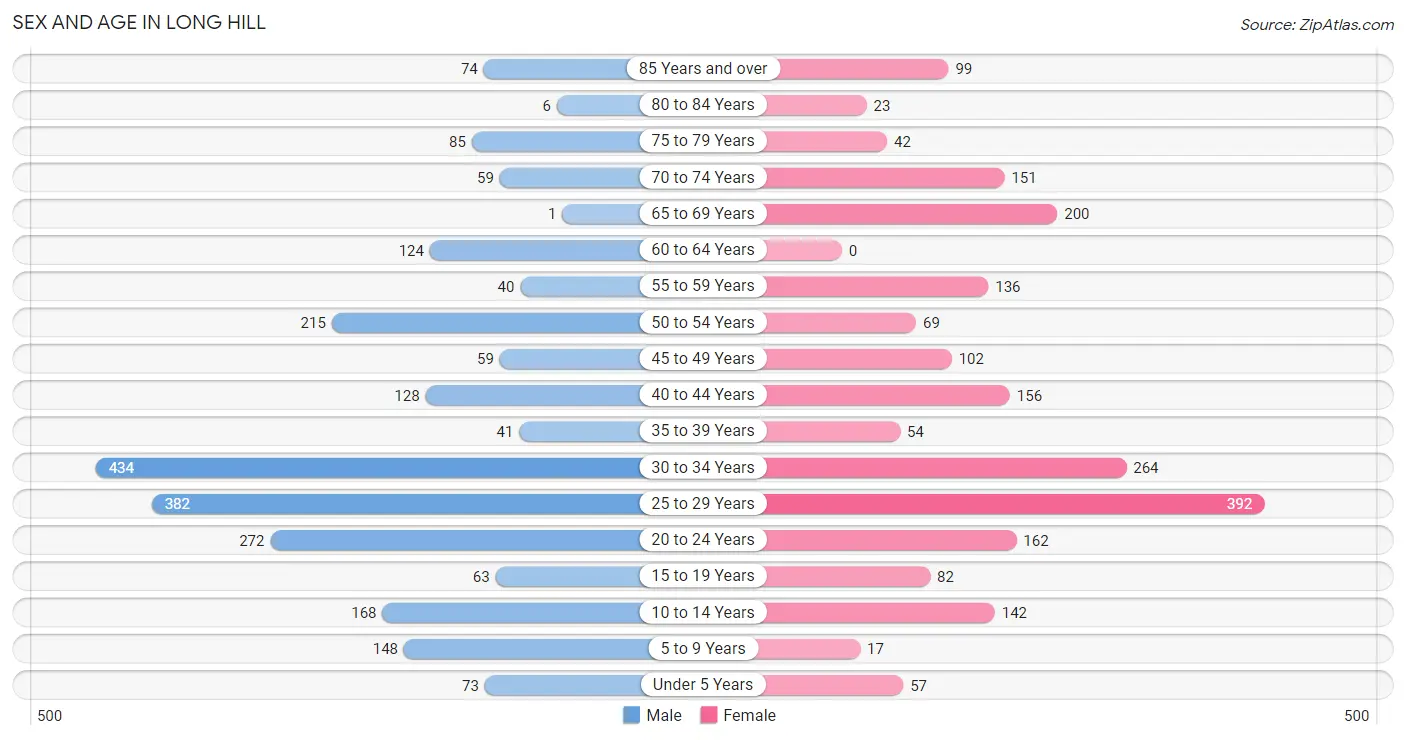
The most populous age groups in Long Hill are 30 to 34 Years (434 | 18.3%) for men and 25 to 29 Years (392 | 18.2%) for women.
| Age Bracket | Male | Female |
| Under 5 Years | 73 (3.1%) | 57 (2.6%) |
| 5 to 9 Years | 148 (6.2%) | 17 (0.8%) |
| 10 to 14 Years | 168 (7.1%) | 142 (6.6%) |
| 15 to 19 Years | 63 (2.7%) | 82 (3.8%) |
| 20 to 24 Years | 272 (11.5%) | 162 (7.5%) |
| 25 to 29 Years | 382 (16.1%) | 392 (18.2%) |
| 30 to 34 Years | 434 (18.3%) | 264 (12.3%) |
| 35 to 39 Years | 41 (1.7%) | 54 (2.5%) |
| 40 to 44 Years | 128 (5.4%) | 156 (7.3%) |
| 45 to 49 Years | 59 (2.5%) | 102 (4.8%) |
| 50 to 54 Years | 215 (9.1%) | 69 (3.2%) |
| 55 to 59 Years | 40 (1.7%) | 136 (6.3%) |
| 60 to 64 Years | 124 (5.2%) | 0 (0.0%) |
| 65 to 69 Years | 1 (0.0%) | 200 (9.3%) |
| 70 to 74 Years | 59 (2.5%) | 151 (7.0%) |
| 75 to 79 Years | 85 (3.6%) | 42 (2.0%) |
| 80 to 84 Years | 6 (0.3%) | 23 (1.1%) |
| 85 Years and over | 74 (3.1%) | 99 (4.6%) |
| Total | 2,372 (100.0%) | 2,148 (100.0%) |
Families and Households in Long Hill
Median Family Size in Long Hill
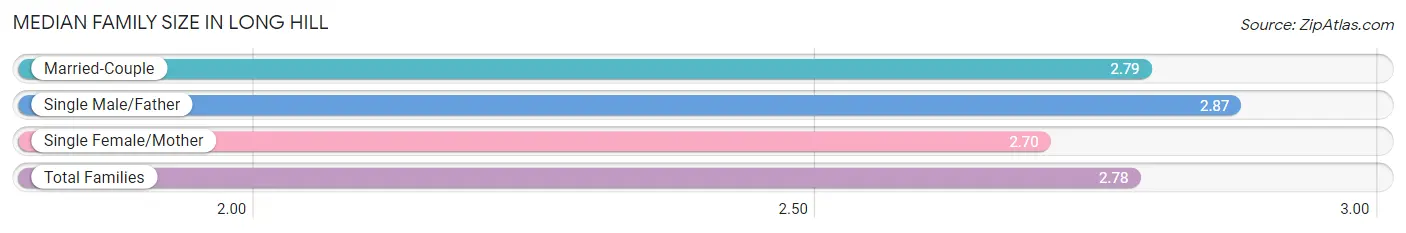
The median family size in Long Hill is 2.78 persons per family, with single male/father families (101 | 11.9%) accounting for the largest median family size of 2.87 persons per family. On the other hand, single female/mother families (244 | 28.8%) represent the smallest median family size with 2.70 persons per family.
| Family Type | # Families | Family Size |
| Married-Couple | 503 (59.3%) | 2.79 |
| Single Male/Father | 101 (11.9%) | 2.87 |
| Single Female/Mother | 244 (28.8%) | 2.70 |
| Total Families | 848 (100.0%) | 2.78 |
Median Household Size in Long Hill
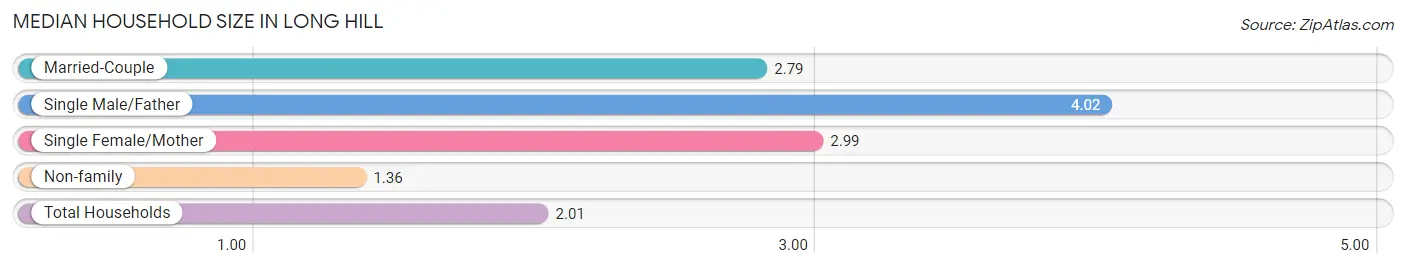
The median household size in Long Hill is 2.01 persons per household, with single male/father households (101 | 4.8%) accounting for the largest median household size of 4.02 persons per household. non-family households (1,280 | 60.2%) represent the smallest median household size with 1.36 persons per household.
| Household Type | # Households | Household Size |
| Married-Couple | 503 (23.6%) | 2.79 |
| Single Male/Father | 101 (4.8%) | 4.02 |
| Single Female/Mother | 244 (11.5%) | 2.99 |
| Non-family | 1,280 (60.2%) | 1.36 |
| Total Households | 2,128 (100.0%) | 2.01 |
Household Size by Marriage Status in Long Hill
Out of a total of 2,128 households in Long Hill, 848 (39.9%) are family households, while 1,280 (60.2%) are nonfamily households. The most numerous type of family households are 2-person households, comprising 420, and the most common type of nonfamily households are 1-person households, comprising 931.
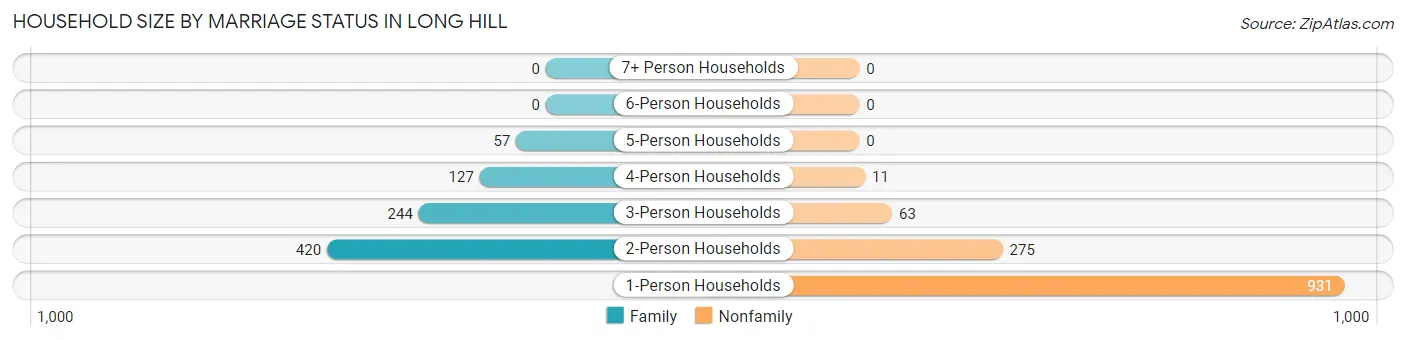
| Household Size | Family Households | Nonfamily Households |
| 1-Person Households | - | 931 (43.8%) |
| 2-Person Households | 420 (19.7%) | 275 (12.9%) |
| 3-Person Households | 244 (11.5%) | 63 (3.0%) |
| 4-Person Households | 127 (6.0%) | 11 (0.5%) |
| 5-Person Households | 57 (2.7%) | 0 (0.0%) |
| 6-Person Households | 0 (0.0%) | 0 (0.0%) |
| 7+ Person Households | 0 (0.0%) | 0 (0.0%) |
| Total | 848 (39.9%) | 1,280 (60.2%) |
Female Fertility in Long Hill
Fertility by Age in Long Hill
Average fertility rate in Long Hill is 56.0 births per 1,000 women. Women in the age bracket of 20 to 34 years have the highest fertility rate with 64.0 births per 1,000 women. Women in the age bracket of 20 to 34 years acount for 74.3% of all women with births.
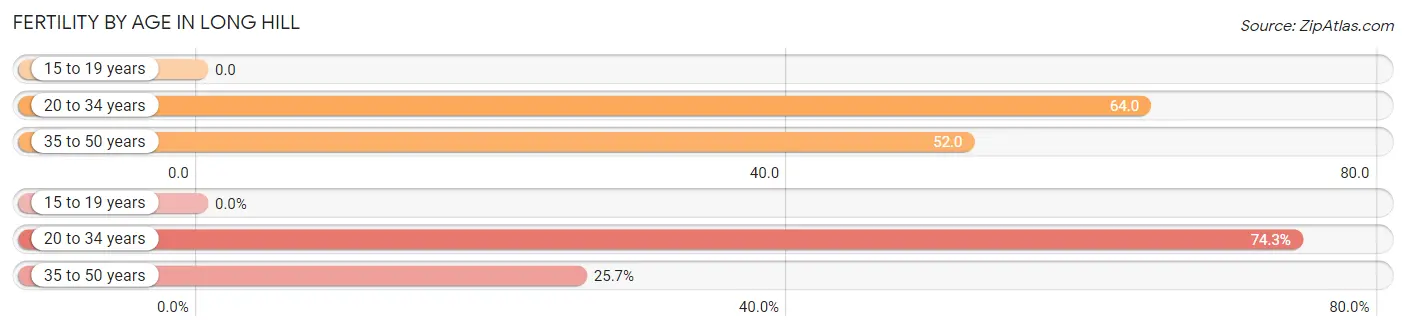
| Age Bracket | Women with Births | Births / 1,000 Women |
| 15 to 19 years | 0 (0.0%) | 0.0 |
| 20 to 34 years | 52 (74.3%) | 64.0 |
| 35 to 50 years | 18 (25.7%) | 52.0 |
| Total | 70 (100.0%) | 56.0 |
Fertility by Age by Marriage Status in Long Hill
35.7% of women with births (70) in Long Hill are married. The highest percentage of unmarried women with births falls into 35 to 50 years age bracket with 100.0% of them unmarried at the time of birth, while the lowest percentage of unmarried women with births belong to 20 to 34 years age bracket with 51.9% of them unmarried.
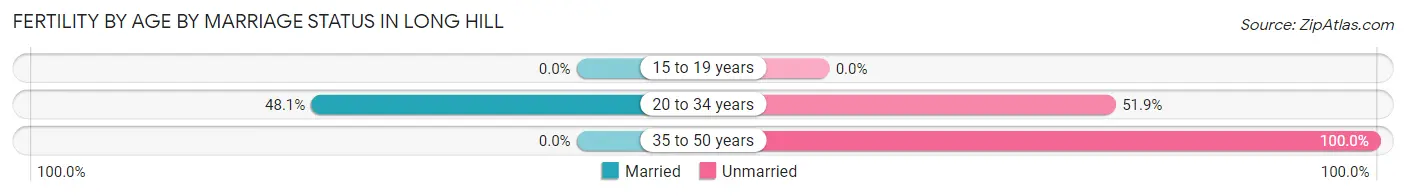
| Age Bracket | Married | Unmarried |
| 15 to 19 years | 0 (0.0%) | 0 (0.0%) |
| 20 to 34 years | 25 (48.1%) | 27 (51.9%) |
| 35 to 50 years | 0 (0.0%) | 18 (100.0%) |
| Total | 25 (35.7%) | 45 (64.3%) |
Fertility by Education in Long Hill
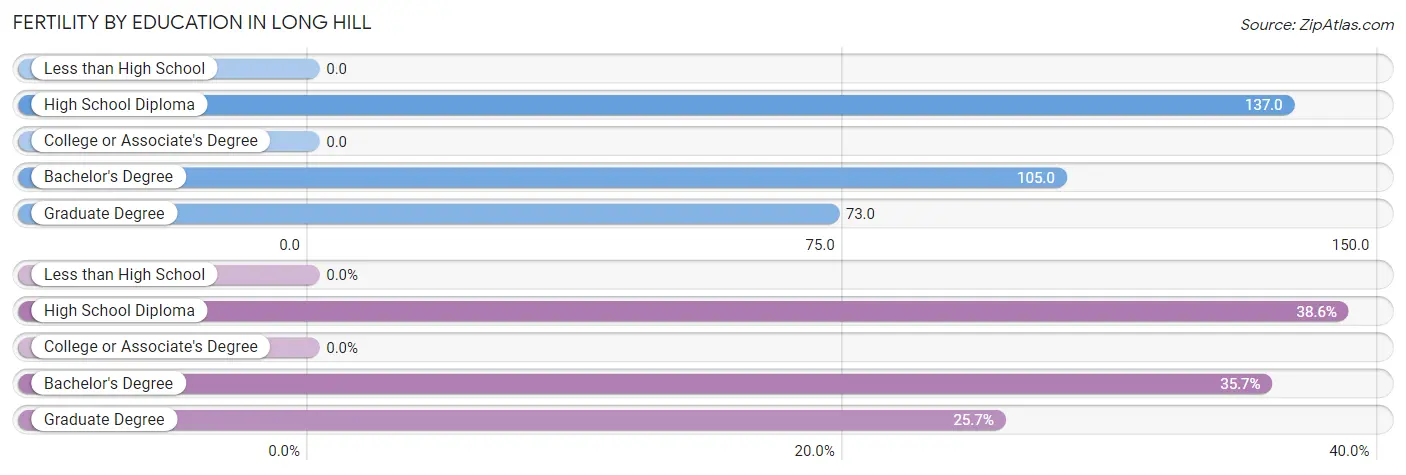
| Educational Attainment | Women with Births | Births / 1,000 Women |
| Less than High School | 0 (0.0%) | 0.0 |
| High School Diploma | 27 (38.6%) | 137.0 |
| College or Associate's Degree | 0 (0.0%) | 0.0 |
| Bachelor's Degree | 25 (35.7%) | 105.0 |
| Graduate Degree | 18 (25.7%) | 73.0 |
| Total | 70 (100.0%) | 56.0 |
Fertility by Education by Marriage Status in Long Hill
64.3% of women with births in Long Hill are unmarried. Women with the educational attainment of bachelor's degree are most likely to be married with 100.0% of them married at childbirth, while women with the educational attainment of high school diploma are least likely to be married with 100.0% of them unmarried at childbirth.
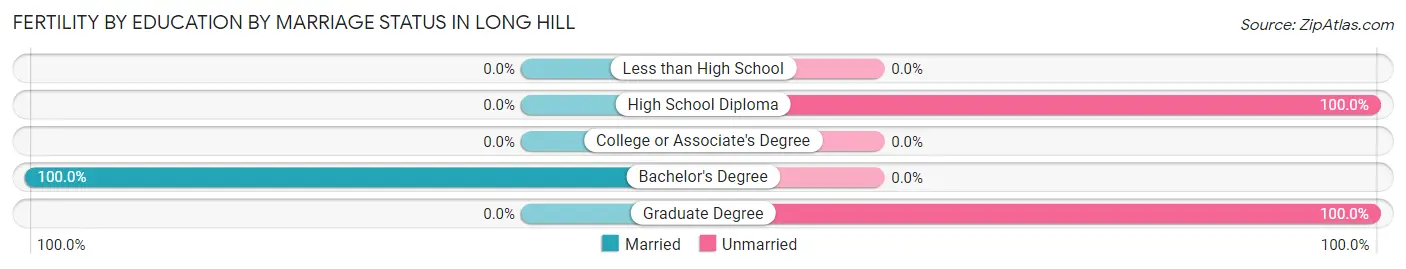
| Educational Attainment | Married | Unmarried |
| Less than High School | 0 (0.0%) | 0 (0.0%) |
| High School Diploma | 0 (0.0%) | 27 (100.0%) |
| College or Associate's Degree | 0 (0.0%) | 0 (0.0%) |
| Bachelor's Degree | 25 (100.0%) | 0 (0.0%) |
| Graduate Degree | 0 (0.0%) | 18 (100.0%) |
| Total | 25 (35.7%) | 45 (64.3%) |
Employment Characteristics in Long Hill
Employment by Class of Employer in Long Hill
Among the 2,642 employed individuals in Long Hill, private company employees (2,071 | 78.4%), federal government employees (254 | 9.6%), and not-for-profit organizations (118 | 4.5%) make up the most common classes of employment.
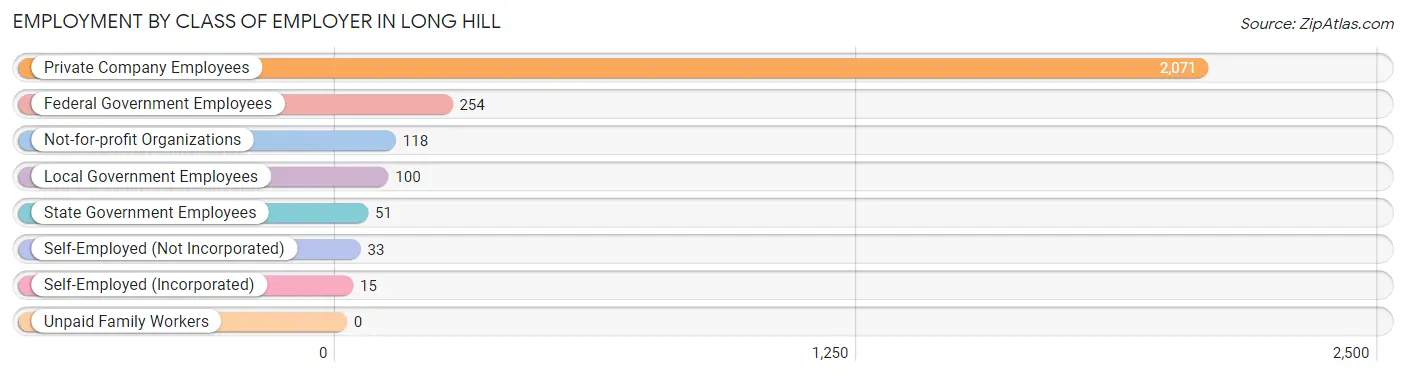
| Employer Class | # Employees | % Employees |
| Private Company Employees | 2,071 | 78.4% |
| Self-Employed (Incorporated) | 15 | 0.6% |
| Self-Employed (Not Incorporated) | 33 | 1.3% |
| Not-for-profit Organizations | 118 | 4.5% |
| Local Government Employees | 100 | 3.8% |
| State Government Employees | 51 | 1.9% |
| Federal Government Employees | 254 | 9.6% |
| Unpaid Family Workers | 0 | 0.0% |
| Total | 2,642 | 100.0% |
Employment Status by Age in Long Hill
According to the labor force statistics for Long Hill, out of the total population over 16 years of age (3,899), 72.5% or 2,827 individuals are in the labor force, with 5.5% or 155 of them unemployed. The age group with the highest labor force participation rate is 25 to 29 years, with 97.8% or 757 individuals in the labor force. Within the labor force, the 16 to 19 years age range has the highest percentage of unemployed individuals, with 50.0% or 21 of them being unemployed.
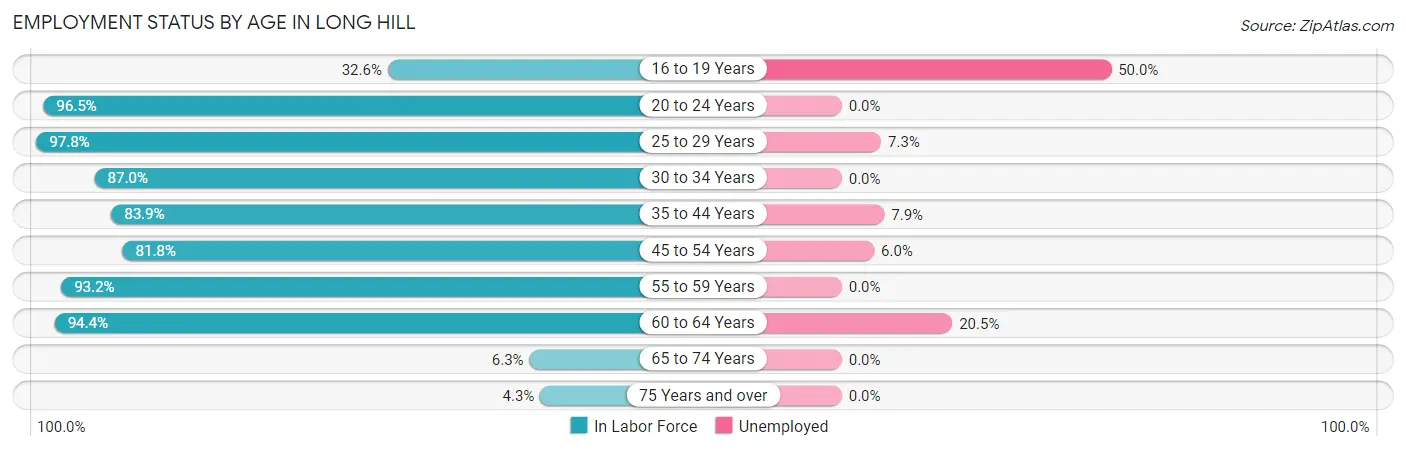
| Age Bracket | In Labor Force | Unemployed |
| 16 to 19 Years | 42 (32.6%) | 21 (50.0%) |
| 20 to 24 Years | 419 (96.5%) | 0 (0.0%) |
| 25 to 29 Years | 757 (97.8%) | 55 (7.3%) |
| 30 to 34 Years | 607 (87.0%) | 0 (0.0%) |
| 35 to 44 Years | 318 (83.9%) | 25 (7.9%) |
| 45 to 54 Years | 364 (81.8%) | 22 (6.0%) |
| 55 to 59 Years | 164 (93.2%) | 0 (0.0%) |
| 60 to 64 Years | 117 (94.4%) | 24 (20.5%) |
| 65 to 74 Years | 26 (6.3%) | 0 (0.0%) |
| 75 Years and over | 14 (4.3%) | 0 (0.0%) |
| Total | 2,827 (72.5%) | 155 (5.5%) |
Employment Status by Educational Attainment in Long Hill
According to labor force statistics for Long Hill, 89.6% of individuals (2,326) out of the total population between 25 and 64 years of age (2,596) are in the labor force, with 5.6% or 130 of them being unemployed. The group with the highest labor force participation rate are those with the educational attainment of high school diploma, with 93.4% or 467 individuals in the labor force. Within the labor force, individuals with college / associate degree education have the highest percentage of unemployment, with 8.7% or 64 of them being unemployed.
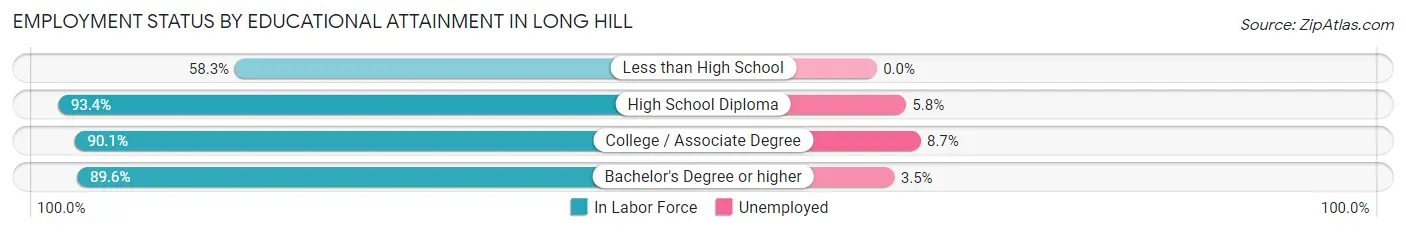
| Educational Attainment | In Labor Force | Unemployed |
| Less than High School | 42 (58.3%) | 0 (0.0%) |
| High School Diploma | 467 (93.4%) | 29 (5.8%) |
| College / Associate Degree | 738 (90.1%) | 71 (8.7%) |
| Bachelor's Degree or higher | 1,080 (89.6%) | 42 (3.5%) |
| Total | 2,326 (89.6%) | 145 (5.6%) |
Employment Occupations by Sex in Long Hill
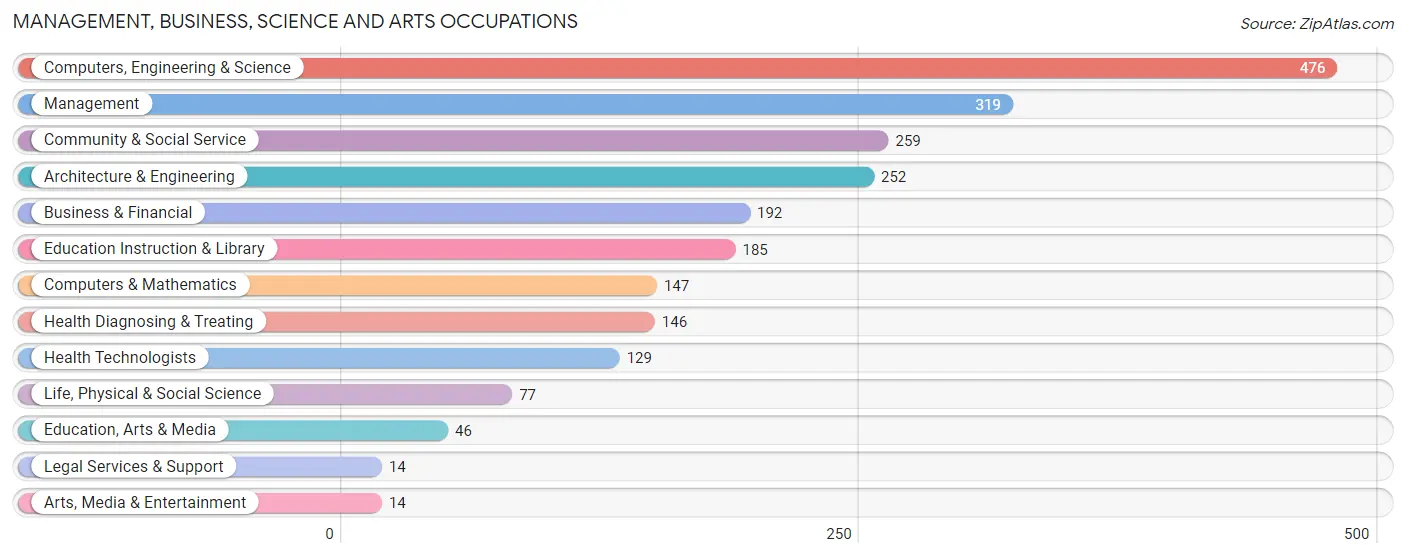
Management, Business, Science and Arts Occupations
The most common Management, Business, Science and Arts occupations in Long Hill are Computers, Engineering & Science (476 | 18.9%), Management (319 | 12.7%), Community & Social Service (259 | 10.3%), Architecture & Engineering (252 | 10.0%), and Business & Financial (192 | 7.6%).
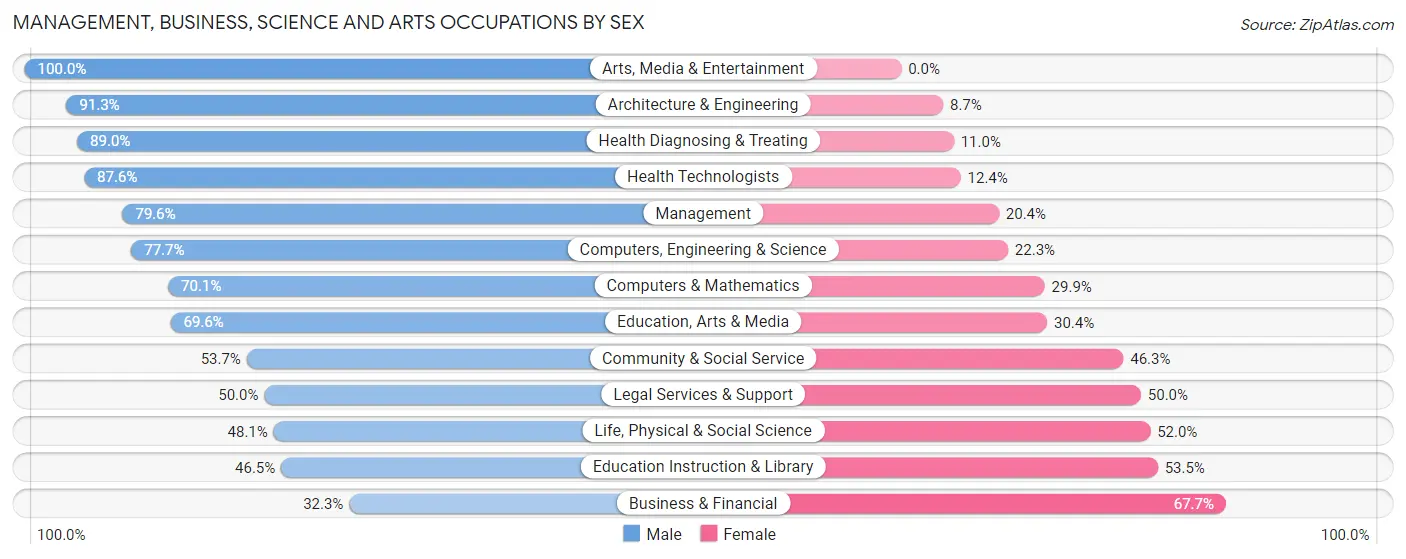
Management, Business, Science and Arts Occupations by Sex
Within the Management, Business, Science and Arts occupations in Long Hill, the most male-oriented occupations are Arts, Media & Entertainment (100.0%), Architecture & Engineering (91.3%), and Health Diagnosing & Treating (89.0%), while the most female-oriented occupations are Business & Financial (67.7%), Education Instruction & Library (53.5%), and Life, Physical & Social Science (51.9%).
| Occupation | Male | Female |
| Management | 254 (79.6%) | 65 (20.4%) |
| Business & Financial | 62 (32.3%) | 130 (67.7%) |
| Computers, Engineering & Science | 370 (77.7%) | 106 (22.3%) |
| Computers & Mathematics | 103 (70.1%) | 44 (29.9%) |
| Architecture & Engineering | 230 (91.3%) | 22 (8.7%) |
| Life, Physical & Social Science | 37 (48.0%) | 40 (51.9%) |
| Community & Social Service | 139 (53.7%) | 120 (46.3%) |
| Education, Arts & Media | 32 (69.6%) | 14 (30.4%) |
| Legal Services & Support | 7 (50.0%) | 7 (50.0%) |
| Education Instruction & Library | 86 (46.5%) | 99 (53.5%) |
| Arts, Media & Entertainment | 14 (100.0%) | 0 (0.0%) |
| Health Diagnosing & Treating | 130 (89.0%) | 16 (11.0%) |
| Health Technologists | 113 (87.6%) | 16 (12.4%) |
| Total (Category) | 955 (68.6%) | 437 (31.4%) |
| Total (Overall) | 1,455 (57.9%) | 1,060 (42.1%) |
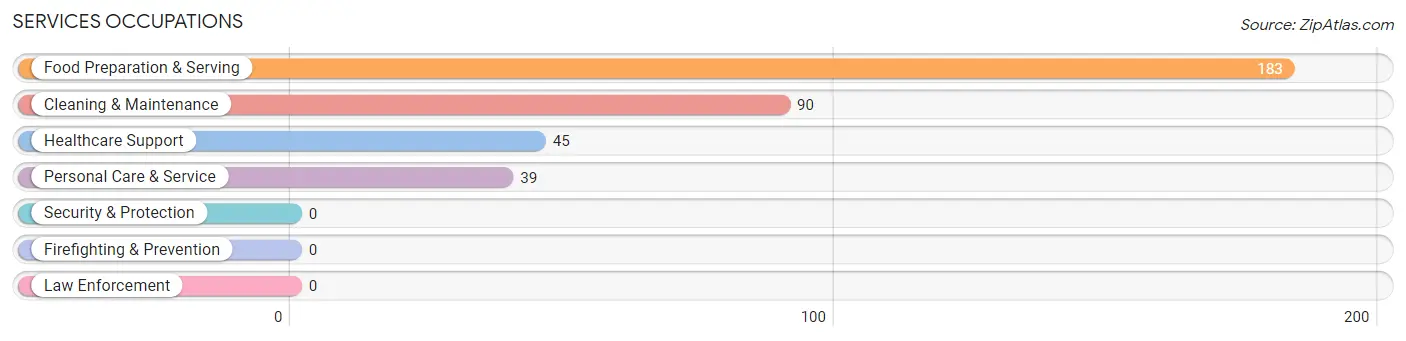
Services Occupations
The most common Services occupations in Long Hill are Food Preparation & Serving (183 | 7.3%), Cleaning & Maintenance (90 | 3.6%), Healthcare Support (45 | 1.8%), and Personal Care & Service (39 | 1.5%).
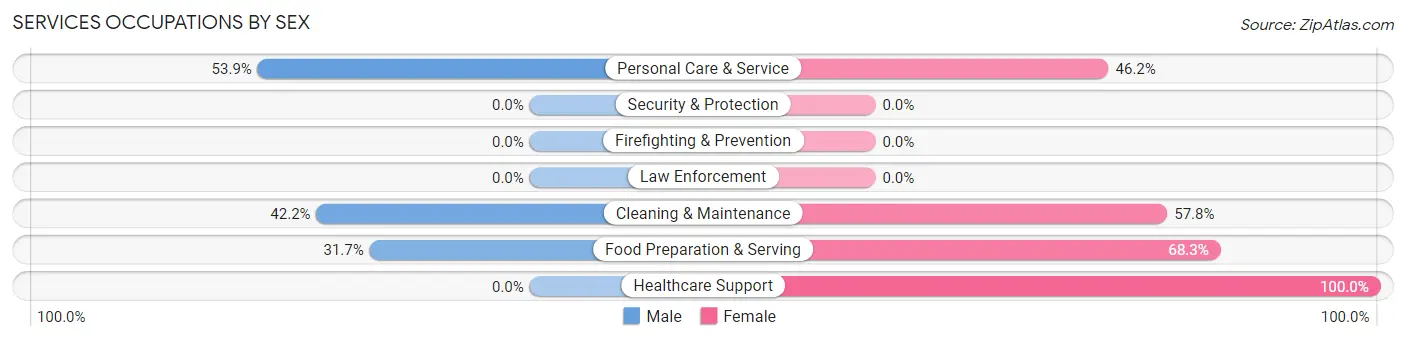
Services Occupations by Sex
Within the Services occupations in Long Hill, the most male-oriented occupations are Personal Care & Service (53.8%), Cleaning & Maintenance (42.2%), and Food Preparation & Serving (31.7%), while the most female-oriented occupations are Healthcare Support (100.0%), Food Preparation & Serving (68.3%), and Cleaning & Maintenance (57.8%).
| Occupation | Male | Female |
| Healthcare Support | 0 (0.0%) | 45 (100.0%) |
| Security & Protection | 0 (0.0%) | 0 (0.0%) |
| Firefighting & Prevention | 0 (0.0%) | 0 (0.0%) |
| Law Enforcement | 0 (0.0%) | 0 (0.0%) |
| Food Preparation & Serving | 58 (31.7%) | 125 (68.3%) |
| Cleaning & Maintenance | 38 (42.2%) | 52 (57.8%) |
| Personal Care & Service | 21 (53.8%) | 18 (46.2%) |
| Total (Category) | 117 (32.8%) | 240 (67.2%) |
| Total (Overall) | 1,455 (57.9%) | 1,060 (42.1%) |
Sales and Office Occupations
The most common Sales and Office occupations in Long Hill are Office & Administration (326 | 13.0%), and Sales & Related (127 | 5.1%).
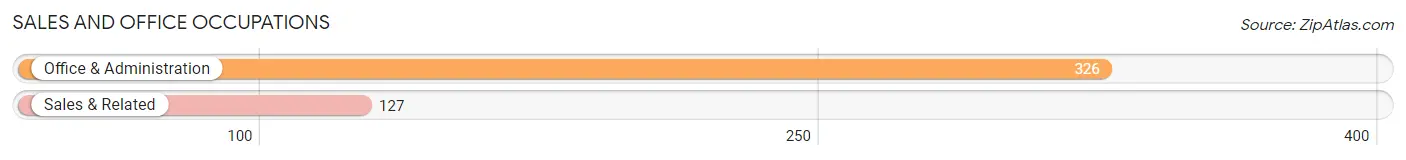
Sales and Office Occupations by Sex
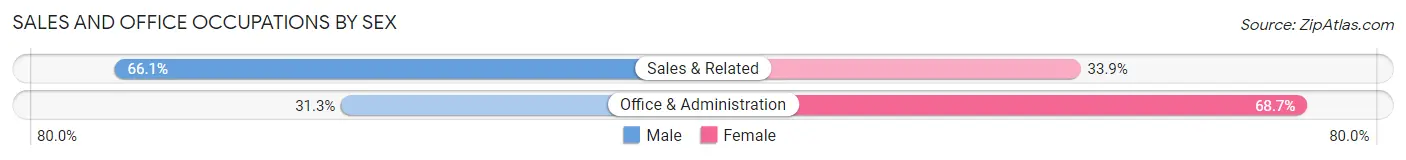
| Occupation | Male | Female |
| Sales & Related | 84 (66.1%) | 43 (33.9%) |
| Office & Administration | 102 (31.3%) | 224 (68.7%) |
| Total (Category) | 186 (41.1%) | 267 (58.9%) |
| Total (Overall) | 1,455 (57.9%) | 1,060 (42.1%) |
Natural Resources, Construction and Maintenance Occupations
The most common Natural Resources, Construction and Maintenance occupations in Long Hill are Installation, Maintenance & Repair (65 | 2.6%), Construction & Extraction (15 | 0.6%), and Farming, Fishing & Forestry (2 | 0.1%).
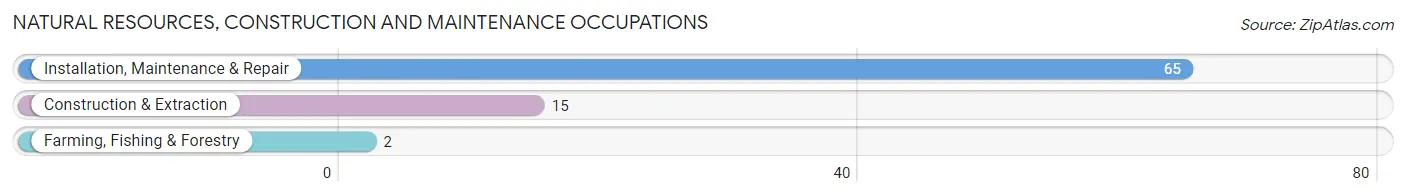
Natural Resources, Construction and Maintenance Occupations by Sex
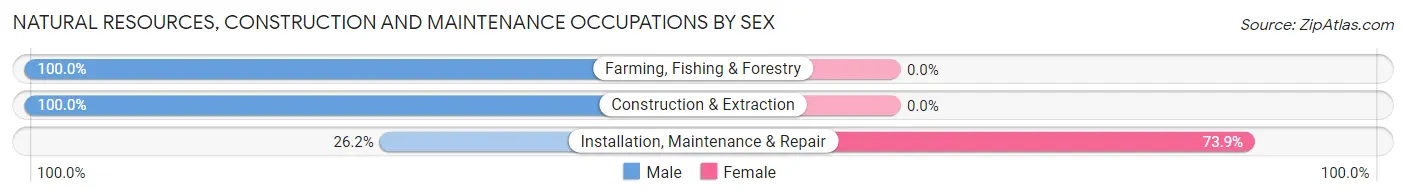
| Occupation | Male | Female |
| Farming, Fishing & Forestry | 2 (100.0%) | 0 (0.0%) |
| Construction & Extraction | 15 (100.0%) | 0 (0.0%) |
| Installation, Maintenance & Repair | 17 (26.2%) | 48 (73.9%) |
| Total (Category) | 34 (41.5%) | 48 (58.5%) |
| Total (Overall) | 1,455 (57.9%) | 1,060 (42.1%) |
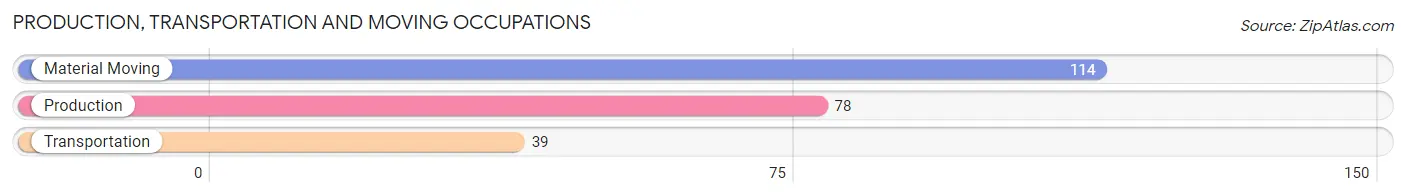
Production, Transportation and Moving Occupations
The most common Production, Transportation and Moving occupations in Long Hill are Material Moving (114 | 4.5%), Production (78 | 3.1%), and Transportation (39 | 1.5%).
Production, Transportation and Moving Occupations by Sex
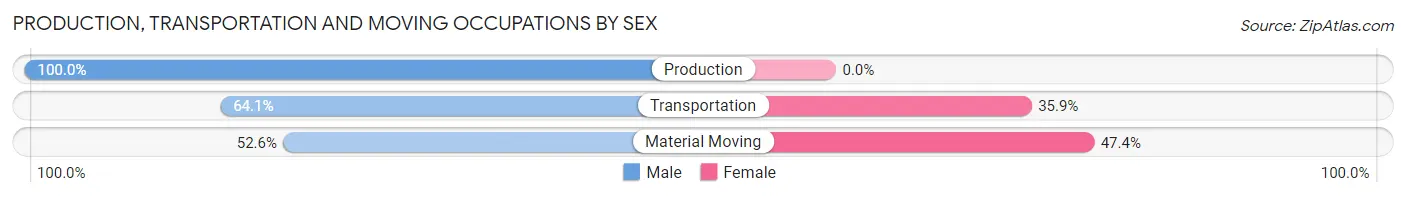
| Occupation | Male | Female |
| Production | 78 (100.0%) | 0 (0.0%) |
| Transportation | 25 (64.1%) | 14 (35.9%) |
| Material Moving | 60 (52.6%) | 54 (47.4%) |
| Total (Category) | 163 (70.6%) | 68 (29.4%) |
| Total (Overall) | 1,455 (57.9%) | 1,060 (42.1%) |
Employment Industries by Sex in Long Hill
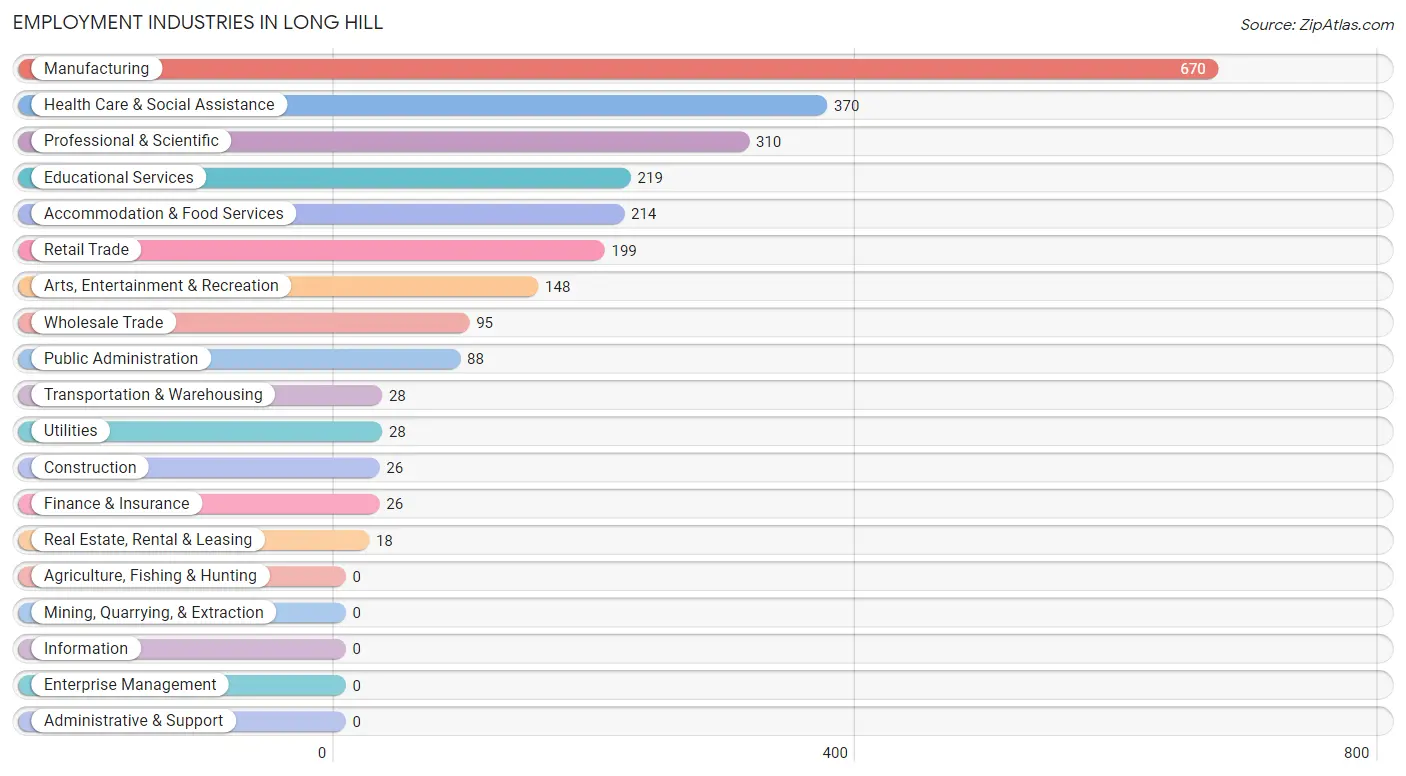
Employment Industries in Long Hill
The major employment industries in Long Hill include Manufacturing (670 | 26.6%), Health Care & Social Assistance (370 | 14.7%), Professional & Scientific (310 | 12.3%), Educational Services (219 | 8.7%), and Accommodation & Food Services (214 | 8.5%).
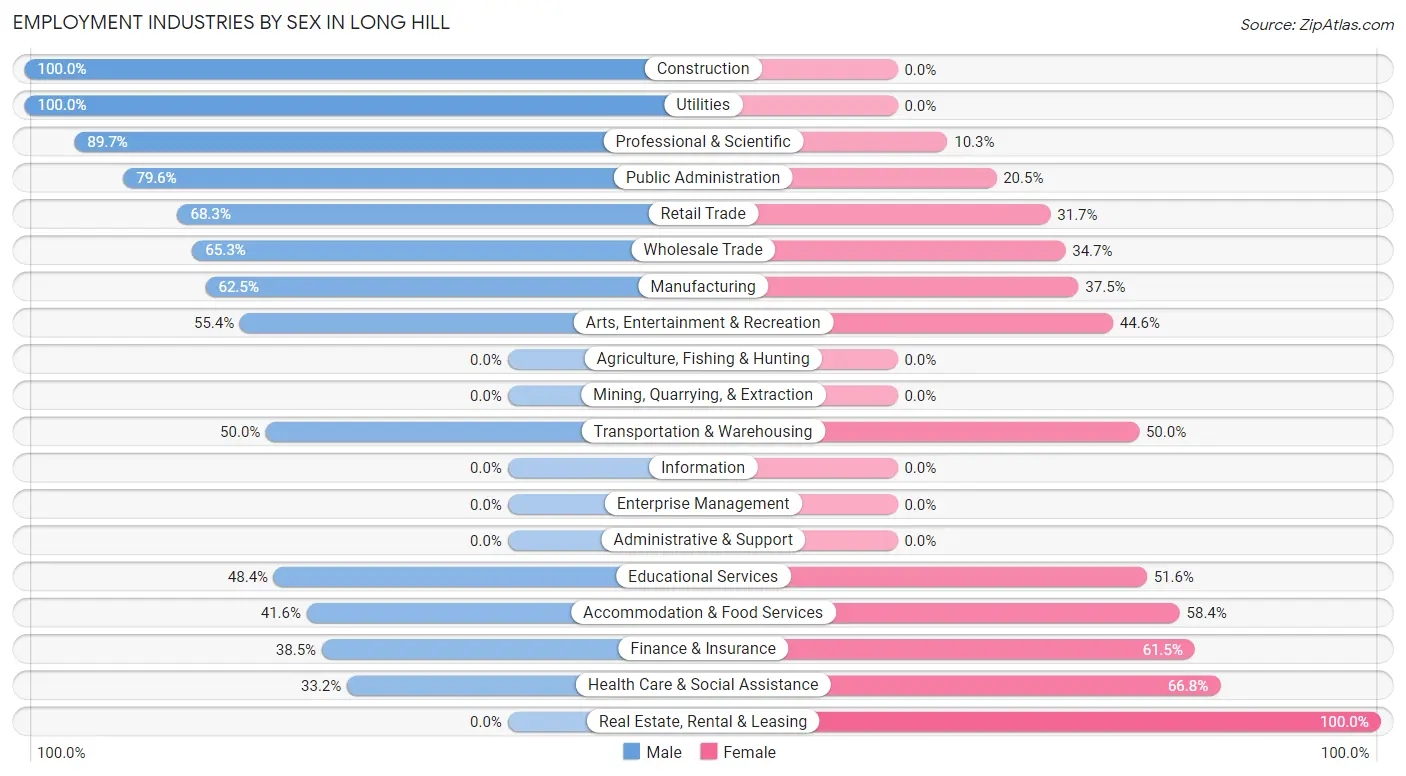
Employment Industries by Sex in Long Hill
The Long Hill industries that see more men than women are Construction (100.0%), Utilities (100.0%), and Professional & Scientific (89.7%), whereas the industries that tend to have a higher number of women are Real Estate, Rental & Leasing (100.0%), Health Care & Social Assistance (66.8%), and Finance & Insurance (61.5%).
| Industry | Male | Female |
| Agriculture, Fishing & Hunting | 0 (0.0%) | 0 (0.0%) |
| Mining, Quarrying, & Extraction | 0 (0.0%) | 0 (0.0%) |
| Construction | 26 (100.0%) | 0 (0.0%) |
| Manufacturing | 419 (62.5%) | 251 (37.5%) |
| Wholesale Trade | 62 (65.3%) | 33 (34.7%) |
| Retail Trade | 136 (68.3%) | 63 (31.7%) |
| Transportation & Warehousing | 14 (50.0%) | 14 (50.0%) |
| Utilities | 28 (100.0%) | 0 (0.0%) |
| Information | 0 (0.0%) | 0 (0.0%) |
| Finance & Insurance | 10 (38.5%) | 16 (61.5%) |
| Real Estate, Rental & Leasing | 0 (0.0%) | 18 (100.0%) |
| Professional & Scientific | 278 (89.7%) | 32 (10.3%) |
| Enterprise Management | 0 (0.0%) | 0 (0.0%) |
| Administrative & Support | 0 (0.0%) | 0 (0.0%) |
| Educational Services | 106 (48.4%) | 113 (51.6%) |
| Health Care & Social Assistance | 123 (33.2%) | 247 (66.8%) |
| Arts, Entertainment & Recreation | 82 (55.4%) | 66 (44.6%) |
| Accommodation & Food Services | 89 (41.6%) | 125 (58.4%) |
| Public Administration | 70 (79.5%) | 18 (20.4%) |
| Total | 1,455 (57.9%) | 1,060 (42.1%) |
Education in Long Hill
School Enrollment in Long Hill
The most common levels of schooling among the 1,071 students in Long Hill are college / undergraduate (311 | 29.0%), middle school (241 | 22.5%), and high school (178 | 16.6%).
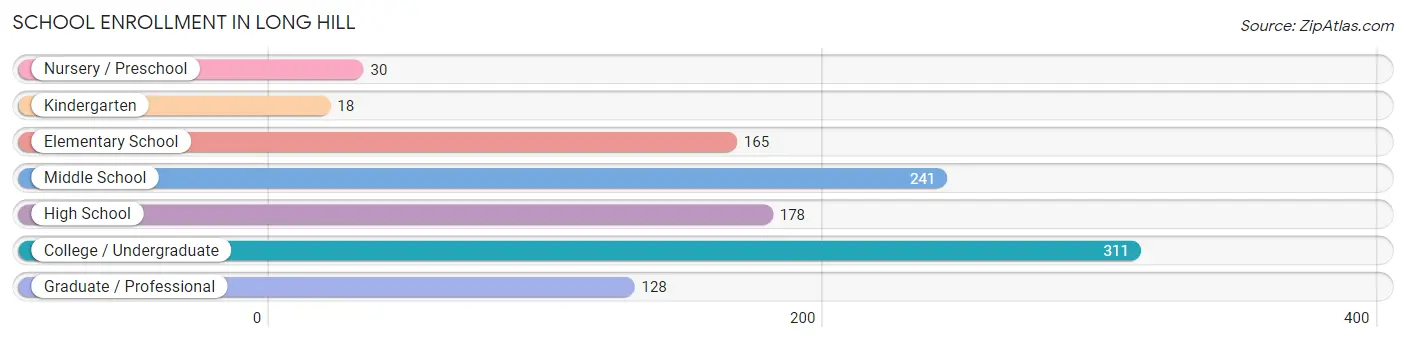
| School Level | # Students | % Students |
| Nursery / Preschool | 30 | 2.8% |
| Kindergarten | 18 | 1.7% |
| Elementary School | 165 | 15.4% |
| Middle School | 241 | 22.5% |
| High School | 178 | 16.6% |
| College / Undergraduate | 311 | 29.0% |
| Graduate / Professional | 128 | 11.9% |
| Total | 1,071 | 100.0% |
School Enrollment by Age by Funding Source in Long Hill
Out of a total of 1,071 students who are enrolled in schools in Long Hill, 247 (23.1%) attend a private institution, while the remaining 824 (76.9%) are enrolled in public schools. The age group of 5 to 9 year old has the highest likelihood of being enrolled in private schools, with 104 (63.0% in the age bracket) enrolled. Conversely, the age group of 10 to 14 year olds has the lowest likelihood of being enrolled in a private school, with 310 (100.0% in the age bracket) attending a public institution.
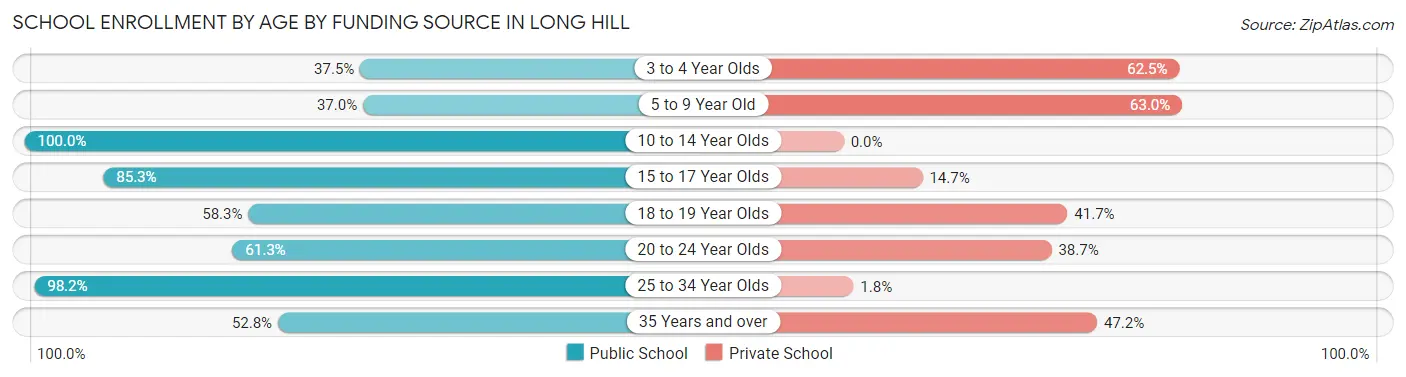
| Age Bracket | Public School | Private School |
| 3 to 4 Year Olds | 18 (37.5%) | 30 (62.5%) |
| 5 to 9 Year Old | 61 (37.0%) | 104 (63.0%) |
| 10 to 14 Year Olds | 310 (100.0%) | 0 (0.0%) |
| 15 to 17 Year Olds | 93 (85.3%) | 16 (14.7%) |
| 18 to 19 Year Olds | 21 (58.3%) | 15 (41.7%) |
| 20 to 24 Year Olds | 57 (61.3%) | 36 (38.7%) |
| 25 to 34 Year Olds | 217 (98.2%) | 4 (1.8%) |
| 35 Years and over | 47 (52.8%) | 42 (47.2%) |
| Total | 824 (76.9%) | 247 (23.1%) |
Educational Attainment by Field of Study in Long Hill
Engineering (311 | 17.3%), bio, nature & agricultural (249 | 13.8%), computers & mathematics (226 | 12.6%), science & technology (184 | 10.2%), and physical & health sciences (168 | 9.3%) are the most common fields of study among 1,800 individuals in Long Hill who have obtained a bachelor's degree or higher.
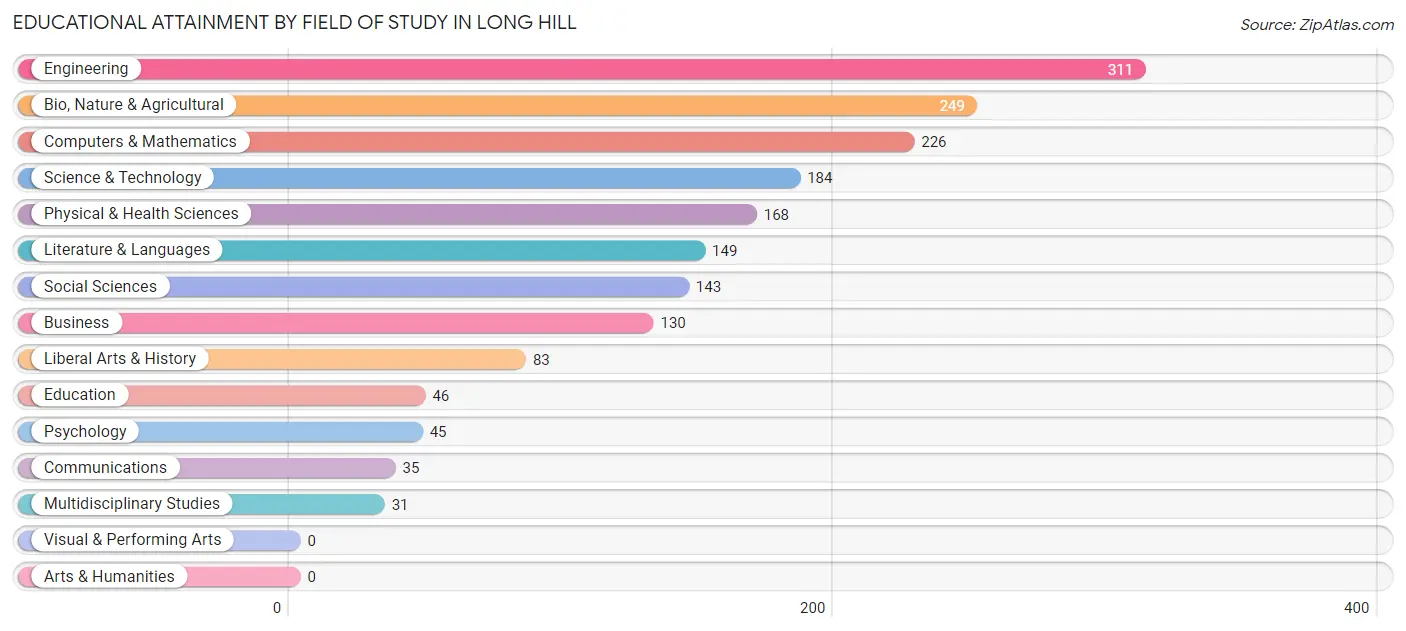
| Field of Study | # Graduates | % Graduates |
| Computers & Mathematics | 226 | 12.6% |
| Bio, Nature & Agricultural | 249 | 13.8% |
| Physical & Health Sciences | 168 | 9.3% |
| Psychology | 45 | 2.5% |
| Social Sciences | 143 | 7.9% |
| Engineering | 311 | 17.3% |
| Multidisciplinary Studies | 31 | 1.7% |
| Science & Technology | 184 | 10.2% |
| Business | 130 | 7.2% |
| Education | 46 | 2.6% |
| Literature & Languages | 149 | 8.3% |
| Liberal Arts & History | 83 | 4.6% |
| Visual & Performing Arts | 0 | 0.0% |
| Communications | 35 | 1.9% |
| Arts & Humanities | 0 | 0.0% |
| Total | 1,800 | 100.0% |
Transportation & Commute in Long Hill
Vehicle Availability by Sex in Long Hill
The most prevalent vehicle ownership categories in Long Hill are males with 2 vehicles (783, accounting for 48.8%) and females with 2 vehicles (429, making up 75.6%).
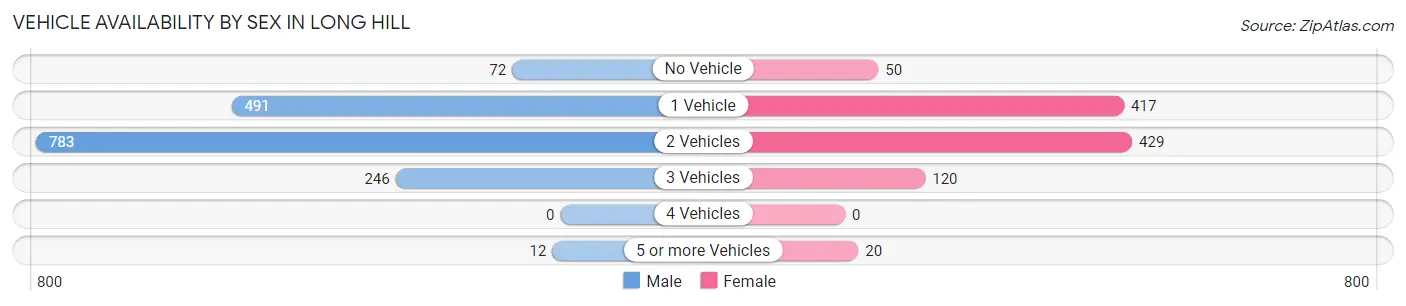
| Vehicles Available | Male | Female |
| No Vehicle | 72 (4.5%) | 50 (4.8%) |
| 1 Vehicle | 491 (30.6%) | 417 (40.3%) |
| 2 Vehicles | 783 (48.8%) | 429 (41.4%) |
| 3 Vehicles | 246 (15.3%) | 120 (11.6%) |
| 4 Vehicles | 0 (0.0%) | 0 (0.0%) |
| 5 or more Vehicles | 12 (0.7%) | 20 (1.9%) |
| Total | 1,604 (100.0%) | 1,036 (100.0%) |
Commute Time in Long Hill
The most frequently occuring commute durations in Long Hill are 10 to 14 minutes (818 commuters, 34.7%), 15 to 19 minutes (368 commuters, 15.6%), and 30 to 34 minutes (300 commuters, 12.7%).
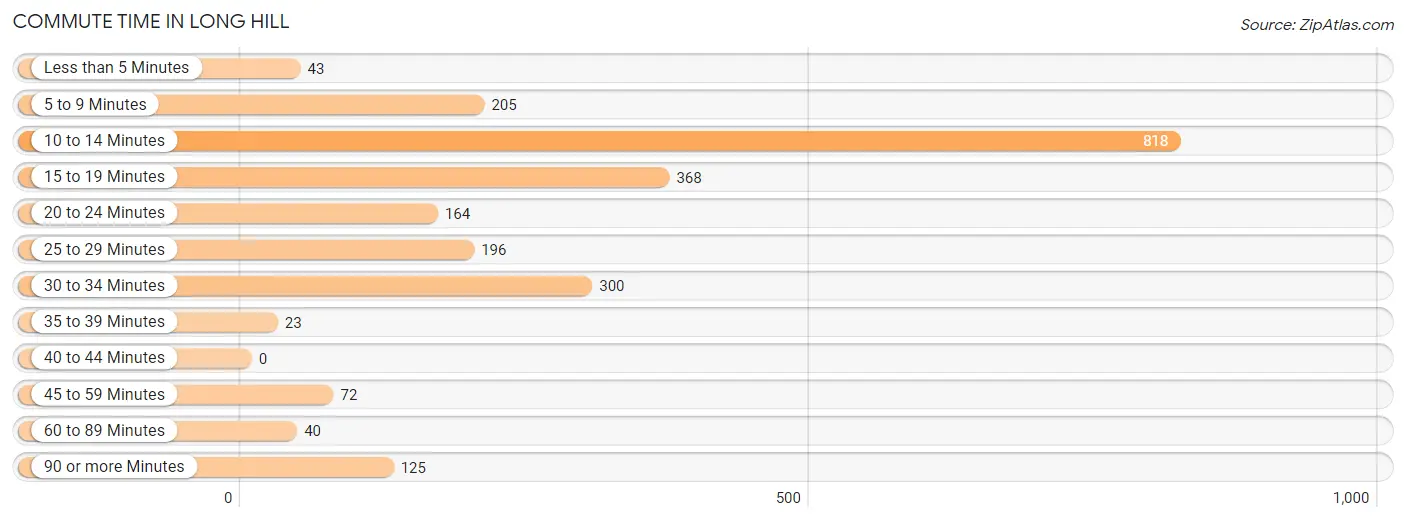
| Commute Time | # Commuters | % Commuters |
| Less than 5 Minutes | 43 | 1.8% |
| 5 to 9 Minutes | 205 | 8.7% |
| 10 to 14 Minutes | 818 | 34.7% |
| 15 to 19 Minutes | 368 | 15.6% |
| 20 to 24 Minutes | 164 | 7.0% |
| 25 to 29 Minutes | 196 | 8.3% |
| 30 to 34 Minutes | 300 | 12.7% |
| 35 to 39 Minutes | 23 | 1.0% |
| 40 to 44 Minutes | 0 | 0.0% |
| 45 to 59 Minutes | 72 | 3.1% |
| 60 to 89 Minutes | 40 | 1.7% |
| 90 or more Minutes | 125 | 5.3% |
Commute Time by Sex in Long Hill
The most common commute times in Long Hill are 10 to 14 minutes (441 commuters, 31.8%) for males and 10 to 14 minutes (377 commuters, 39.0%) for females.
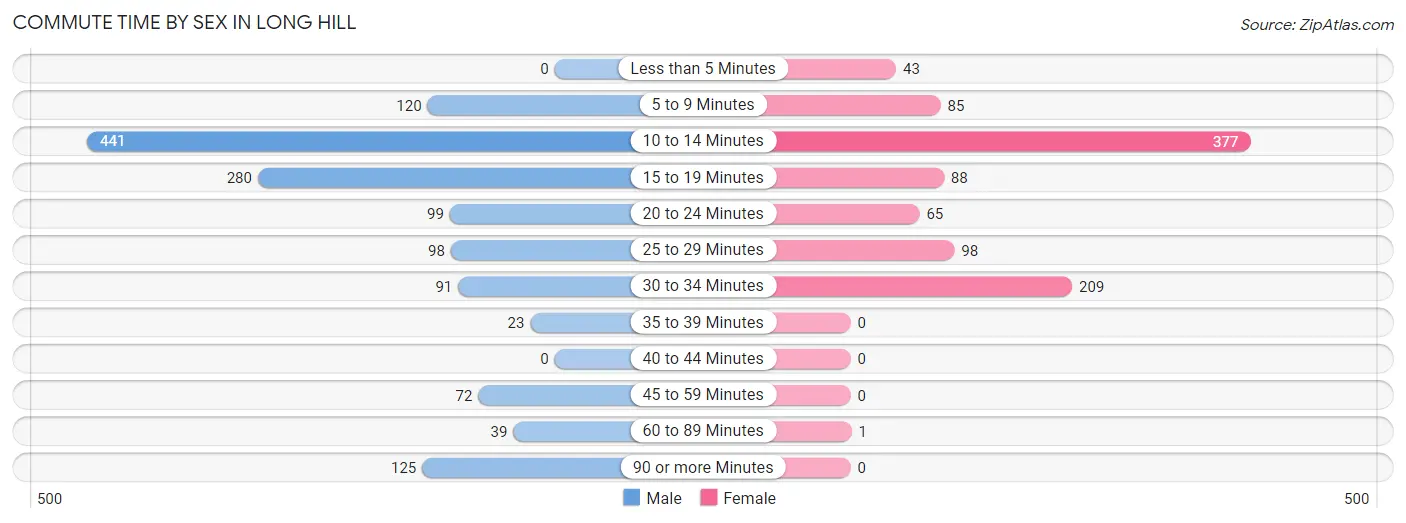
| Commute Time | Male | Female |
| Less than 5 Minutes | 0 (0.0%) | 43 (4.4%) |
| 5 to 9 Minutes | 120 (8.6%) | 85 (8.8%) |
| 10 to 14 Minutes | 441 (31.8%) | 377 (39.0%) |
| 15 to 19 Minutes | 280 (20.2%) | 88 (9.1%) |
| 20 to 24 Minutes | 99 (7.1%) | 65 (6.7%) |
| 25 to 29 Minutes | 98 (7.1%) | 98 (10.1%) |
| 30 to 34 Minutes | 91 (6.6%) | 209 (21.6%) |
| 35 to 39 Minutes | 23 (1.7%) | 0 (0.0%) |
| 40 to 44 Minutes | 0 (0.0%) | 0 (0.0%) |
| 45 to 59 Minutes | 72 (5.2%) | 0 (0.0%) |
| 60 to 89 Minutes | 39 (2.8%) | 1 (0.1%) |
| 90 or more Minutes | 125 (9.0%) | 0 (0.0%) |
Time of Departure to Work by Sex in Long Hill
The most frequent times of departure to work in Long Hill are 7:00 AM to 7:29 AM (255, 18.4%) for males and 8:00 AM to 8:29 AM (242, 25.1%) for females.
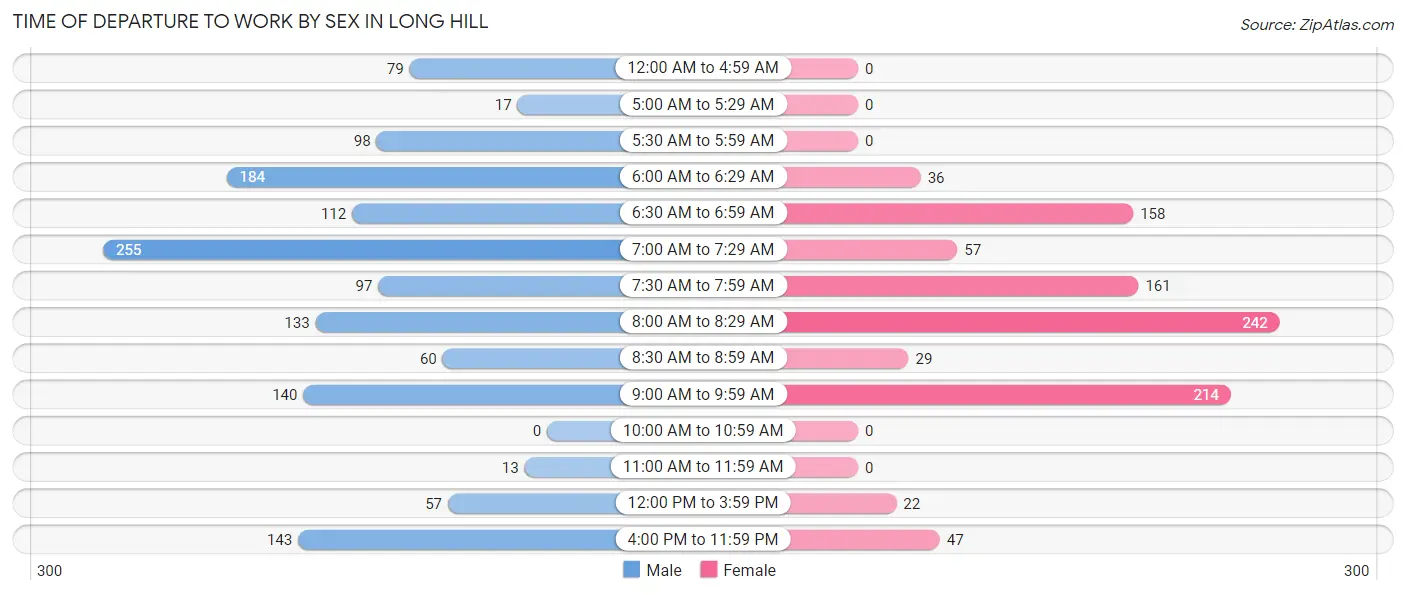
| Time of Departure | Male | Female |
| 12:00 AM to 4:59 AM | 79 (5.7%) | 0 (0.0%) |
| 5:00 AM to 5:29 AM | 17 (1.2%) | 0 (0.0%) |
| 5:30 AM to 5:59 AM | 98 (7.1%) | 0 (0.0%) |
| 6:00 AM to 6:29 AM | 184 (13.3%) | 36 (3.7%) |
| 6:30 AM to 6:59 AM | 112 (8.1%) | 158 (16.4%) |
| 7:00 AM to 7:29 AM | 255 (18.4%) | 57 (5.9%) |
| 7:30 AM to 7:59 AM | 97 (7.0%) | 161 (16.7%) |
| 8:00 AM to 8:29 AM | 133 (9.6%) | 242 (25.1%) |
| 8:30 AM to 8:59 AM | 60 (4.3%) | 29 (3.0%) |
| 9:00 AM to 9:59 AM | 140 (10.1%) | 214 (22.2%) |
| 10:00 AM to 10:59 AM | 0 (0.0%) | 0 (0.0%) |
| 11:00 AM to 11:59 AM | 13 (0.9%) | 0 (0.0%) |
| 12:00 PM to 3:59 PM | 57 (4.1%) | 22 (2.3%) |
| 4:00 PM to 11:59 PM | 143 (10.3%) | 47 (4.9%) |
| Total | 1,388 (100.0%) | 966 (100.0%) |
Housing Occupancy in Long Hill
Occupancy by Ownership in Long Hill
Of the total 2,681 dwellings in Long Hill, owner-occupied units account for 2,449 (91.3%), while renter-occupied units make up 232 (8.6%).
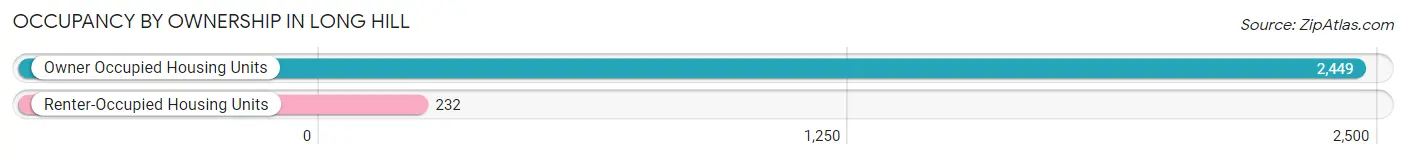
| Occupancy | # Housing Units | % Housing Units |
| Owner Occupied Housing Units | 2,449 | 91.3% |
| Renter-Occupied Housing Units | 232 | 8.6% |
| Total Occupied Housing Units | 2,681 | 100.0% |
Occupancy by Household Size in Long Hill
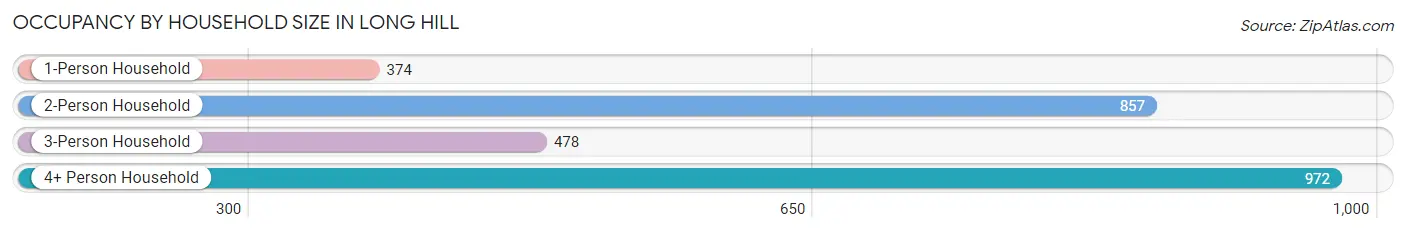
| Household Size | # Housing Units | % Housing Units |
| 1-Person Household | 374 | 14.0% |
| 2-Person Household | 857 | 32.0% |
| 3-Person Household | 478 | 17.8% |
| 4+ Person Household | 972 | 36.3% |
| Total Housing Units | 2,681 | 100.0% |
Occupancy by Ownership by Household Size in Long Hill
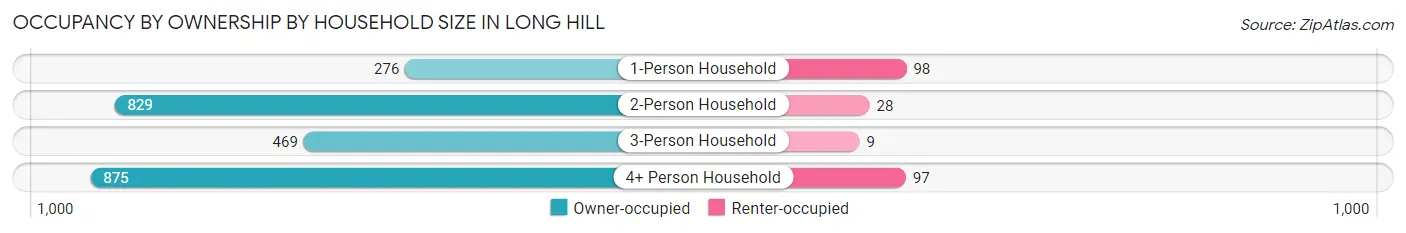
| Household Size | Owner-occupied | Renter-occupied |
| 1-Person Household | 276 (73.8%) | 98 (26.2%) |
| 2-Person Household | 829 (96.7%) | 28 (3.3%) |
| 3-Person Household | 469 (98.1%) | 9 (1.9%) |
| 4+ Person Household | 875 (90.0%) | 97 (10.0%) |
| Total Housing Units | 2,449 (91.3%) | 232 (8.6%) |
Occupancy by Educational Attainment in Long Hill
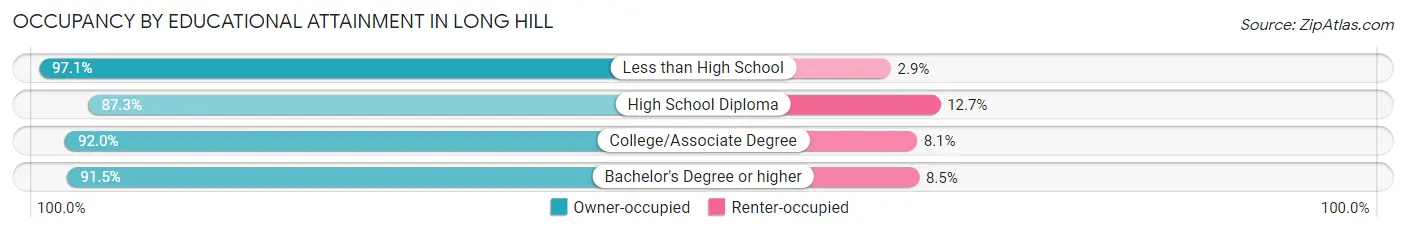
| Household Size | Owner-occupied | Renter-occupied |
| Less than High School | 170 (97.1%) | 5 (2.9%) |
| High School Diploma | 344 (87.3%) | 50 (12.7%) |
| College/Associate Degree | 491 (91.9%) | 43 (8.1%) |
| Bachelor's Degree or higher | 1,444 (91.5%) | 134 (8.5%) |
Occupancy by Age of Householder in Long Hill
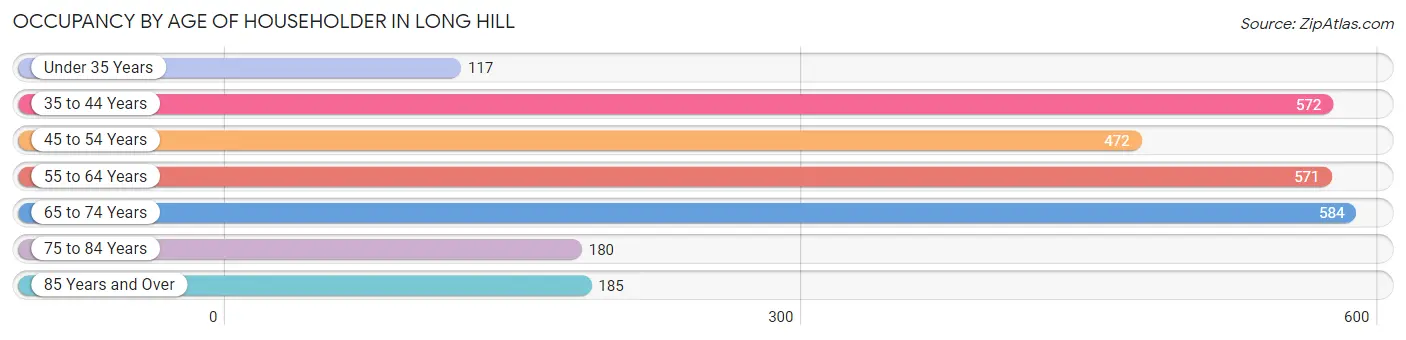
| Age Bracket | # Households | % Households |
| Under 35 Years | 117 | 4.4% |
| 35 to 44 Years | 572 | 21.3% |
| 45 to 54 Years | 472 | 17.6% |
| 55 to 64 Years | 571 | 21.3% |
| 65 to 74 Years | 584 | 21.8% |
| 75 to 84 Years | 180 | 6.7% |
| 85 Years and Over | 185 | 6.9% |
| Total | 2,681 | 100.0% |
Housing Finances in Long Hill
Median Income by Occupancy in Long Hill
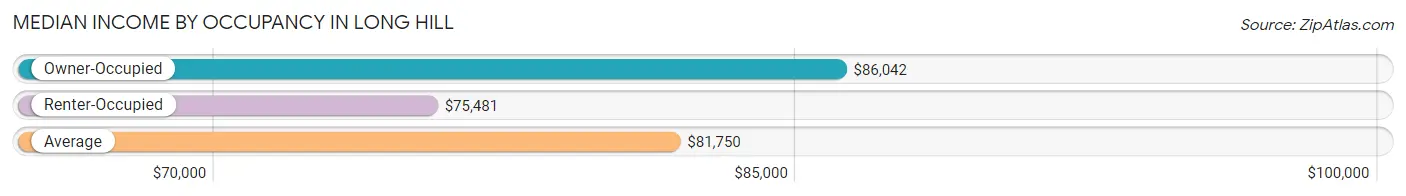
| Occupancy Type | # Households | Median Income |
| Owner-Occupied | 530 (24.9%) | $86,042 |
| Renter-Occupied | 1,598 (75.1%) | $75,481 |
| Average | 2,128 (100.0%) | $81,750 |
Occupancy by Householder Income Bracket in Long Hill
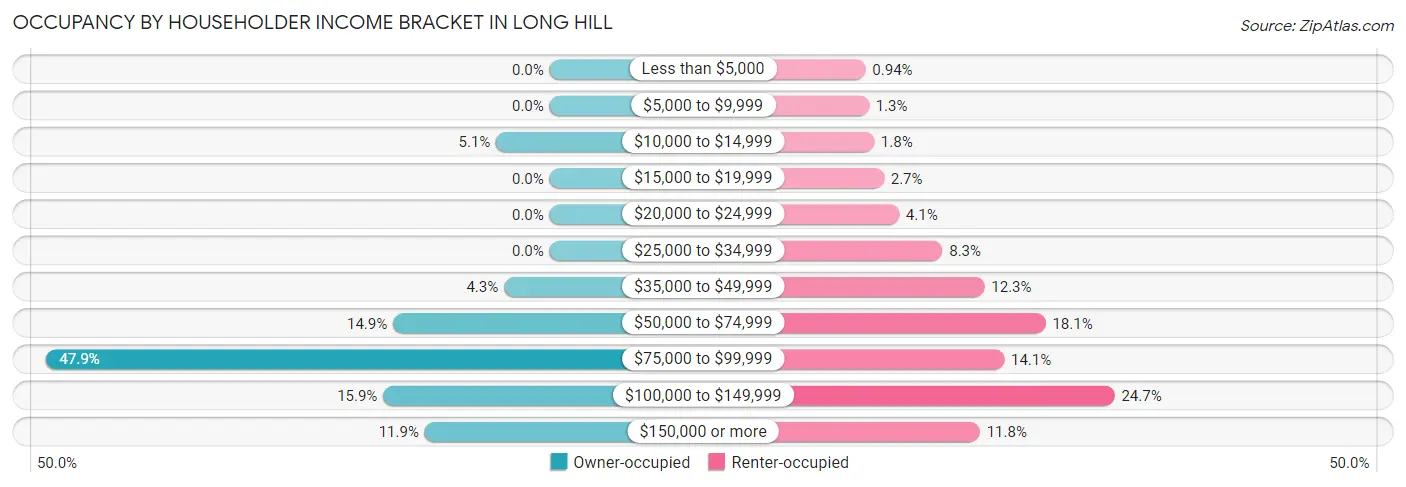
| Income Bracket | Owner-occupied | Renter-occupied |
| Less than $5,000 | 0 (0.0%) | 15 (0.9%) |
| $5,000 to $9,999 | 0 (0.0%) | 20 (1.3%) |
| $10,000 to $14,999 | 27 (5.1%) | 28 (1.8%) |
| $15,000 to $19,999 | 0 (0.0%) | 43 (2.7%) |
| $20,000 to $24,999 | 0 (0.0%) | 66 (4.1%) |
| $25,000 to $34,999 | 0 (0.0%) | 132 (8.3%) |
| $35,000 to $49,999 | 23 (4.3%) | 196 (12.3%) |
| $50,000 to $74,999 | 79 (14.9%) | 289 (18.1%) |
| $75,000 to $99,999 | 254 (47.9%) | 226 (14.1%) |
| $100,000 to $149,999 | 84 (15.9%) | 394 (24.7%) |
| $150,000 or more | 63 (11.9%) | 189 (11.8%) |
| Total | 530 (100.0%) | 1,598 (100.0%) |
Monthly Housing Cost Tiers in Long Hill
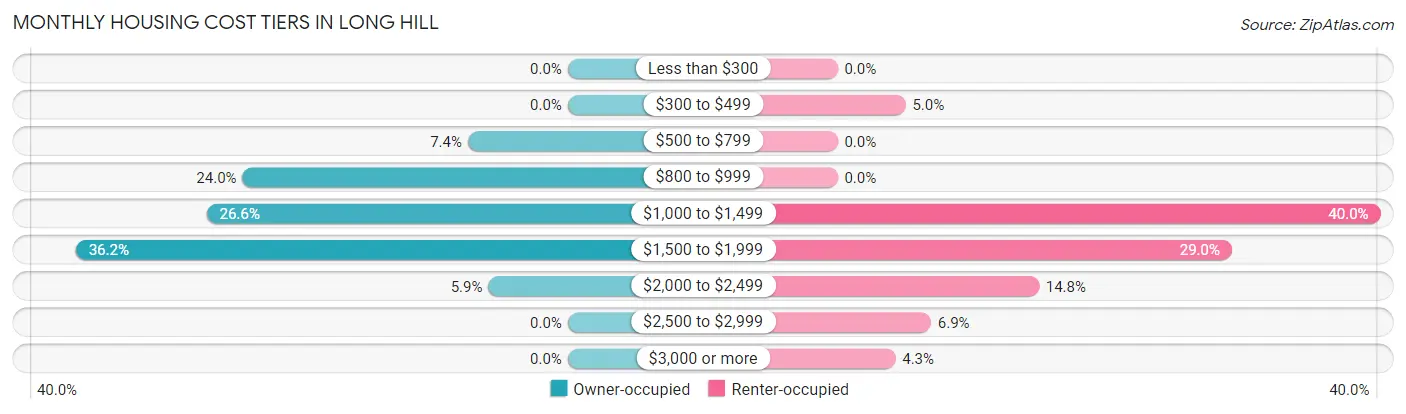
| Monthly Cost | Owner-occupied | Renter-occupied |
| Less than $300 | 0 (0.0%) | 0 (0.0%) |
| $300 to $499 | 0 (0.0%) | 80 (5.0%) |
| $500 to $799 | 39 (7.4%) | 0 (0.0%) |
| $800 to $999 | 127 (24.0%) | 0 (0.0%) |
| $1,000 to $1,499 | 141 (26.6%) | 639 (40.0%) |
| $1,500 to $1,999 | 192 (36.2%) | 464 (29.0%) |
| $2,000 to $2,499 | 31 (5.9%) | 237 (14.8%) |
| $2,500 to $2,999 | 0 (0.0%) | 110 (6.9%) |
| $3,000 or more | 0 (0.0%) | 68 (4.3%) |
| Total | 530 (100.0%) | 1,598 (100.0%) |
Physical Housing Characteristics in Long Hill
Housing Structures in Long Hill
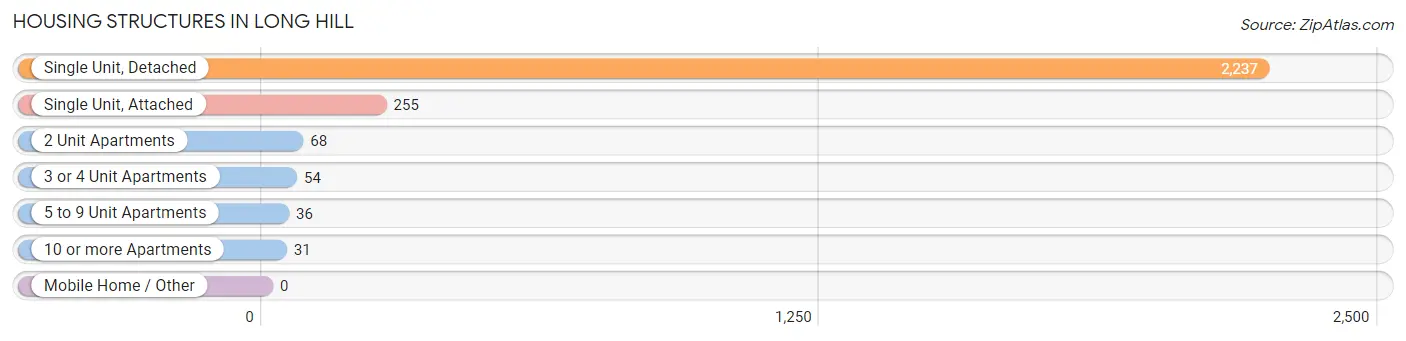
| Structure Type | # Housing Units | % Housing Units |
| Single Unit, Detached | 2,237 | 83.4% |
| Single Unit, Attached | 255 | 9.5% |
| 2 Unit Apartments | 68 | 2.5% |
| 3 or 4 Unit Apartments | 54 | 2.0% |
| 5 to 9 Unit Apartments | 36 | 1.3% |
| 10 or more Apartments | 31 | 1.2% |
| Mobile Home / Other | 0 | 0.0% |
| Total | 2,681 | 100.0% |
Housing Structures by Occupancy in Long Hill
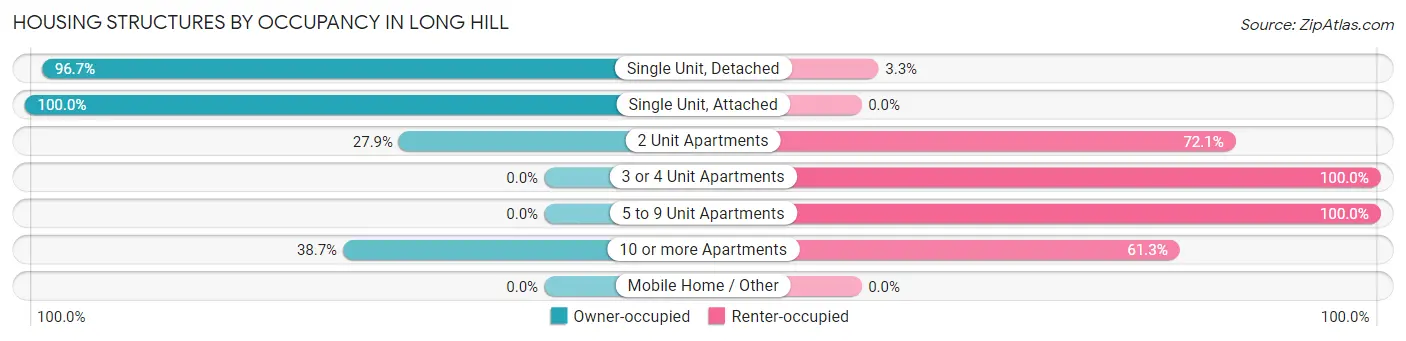
| Structure Type | Owner-occupied | Renter-occupied |
| Single Unit, Detached | 2,163 (96.7%) | 74 (3.3%) |
| Single Unit, Attached | 255 (100.0%) | 0 (0.0%) |
| 2 Unit Apartments | 19 (27.9%) | 49 (72.1%) |
| 3 or 4 Unit Apartments | 0 (0.0%) | 54 (100.0%) |
| 5 to 9 Unit Apartments | 0 (0.0%) | 36 (100.0%) |
| 10 or more Apartments | 12 (38.7%) | 19 (61.3%) |
| Mobile Home / Other | 0 (0.0%) | 0 (0.0%) |
| Total | 2,449 (91.3%) | 232 (8.6%) |
Housing Structures by Number of Rooms in Long Hill
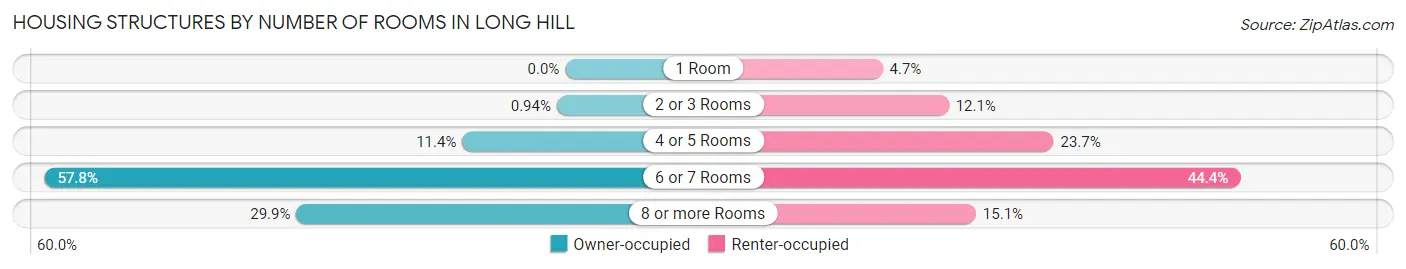
| Number of Rooms | Owner-occupied | Renter-occupied |
| 1 Room | 0 (0.0%) | 11 (4.7%) |
| 2 or 3 Rooms | 23 (0.9%) | 28 (12.1%) |
| 4 or 5 Rooms | 280 (11.4%) | 55 (23.7%) |
| 6 or 7 Rooms | 1,415 (57.8%) | 103 (44.4%) |
| 8 or more Rooms | 731 (29.8%) | 35 (15.1%) |
| Total | 2,449 (100.0%) | 232 (100.0%) |
Housing Structure by Heating Type in Long Hill
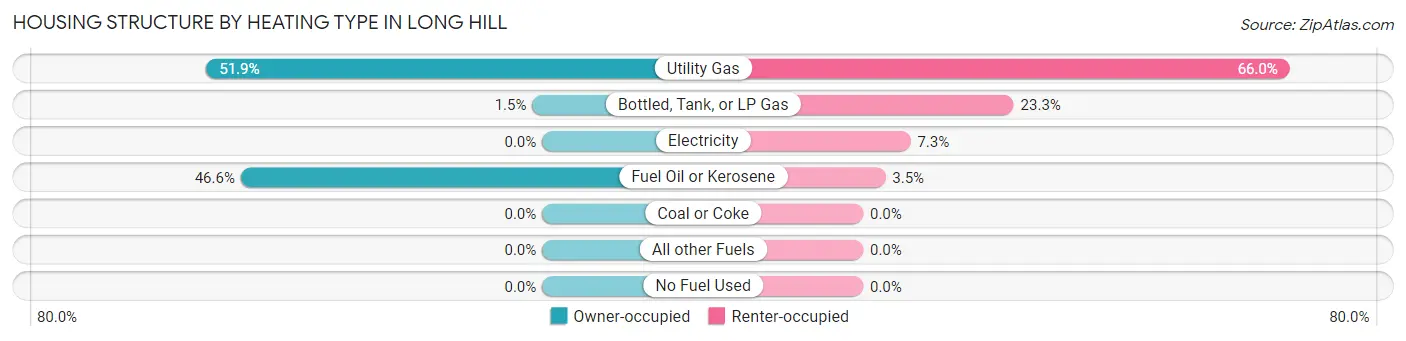
| Heating Type | Owner-occupied | Renter-occupied |
| Utility Gas | 1,271 (51.9%) | 153 (65.9%) |
| Bottled, Tank, or LP Gas | 37 (1.5%) | 54 (23.3%) |
| Electricity | 0 (0.0%) | 17 (7.3%) |
| Fuel Oil or Kerosene | 1,141 (46.6%) | 8 (3.5%) |
| Coal or Coke | 0 (0.0%) | 0 (0.0%) |
| All other Fuels | 0 (0.0%) | 0 (0.0%) |
| No Fuel Used | 0 (0.0%) | 0 (0.0%) |
| Total | 2,449 (100.0%) | 232 (100.0%) |
Household Vehicle Usage in Long Hill
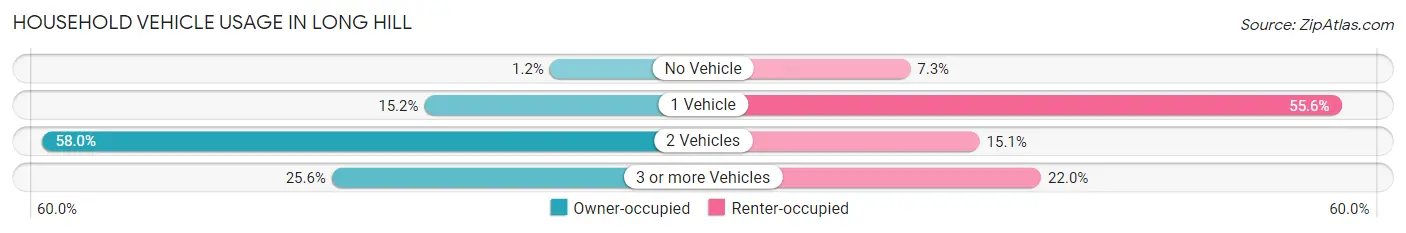
| Vehicles per Household | Owner-occupied | Renter-occupied |
| No Vehicle | 29 (1.2%) | 17 (7.3%) |
| 1 Vehicle | 373 (15.2%) | 129 (55.6%) |
| 2 Vehicles | 1,420 (58.0%) | 35 (15.1%) |
| 3 or more Vehicles | 627 (25.6%) | 51 (22.0%) |
| Total | 2,449 (100.0%) | 232 (100.0%) |
Real Estate & Mortgages in Long Hill
Real Estate and Mortgage Overview in Long Hill
| Characteristic | Without Mortgage | With Mortgage |
| Housing Units | 697 | 414 |
| Median Property Value | $437,000 | $166,300 |
| Median Household Income | $111,417 | $63 |
| Monthly Housing Costs | $1,396 | $0 |
| Real Estate Taxes | $9,529 | $0 |
Property Value by Mortgage Status in Long Hill
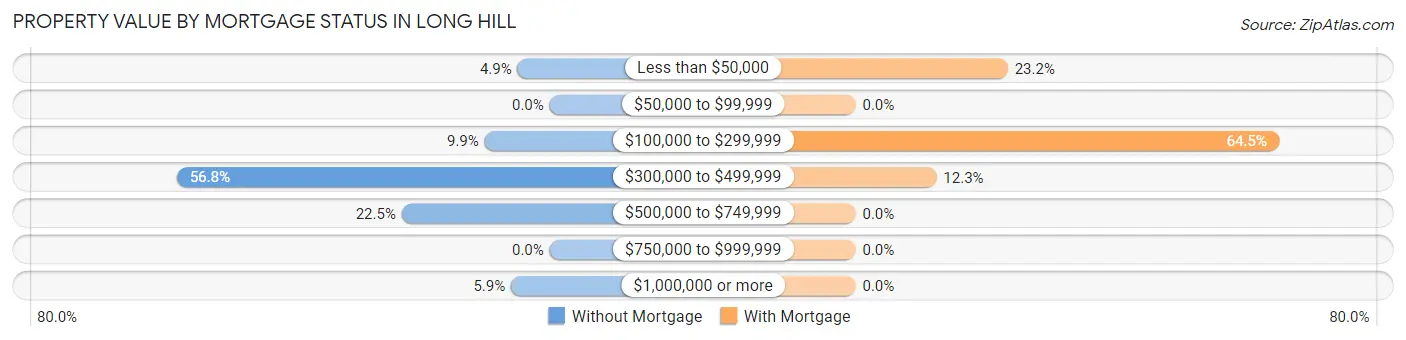
| Property Value | Without Mortgage | With Mortgage |
| Less than $50,000 | 34 (4.9%) | 96 (23.2%) |
| $50,000 to $99,999 | 0 (0.0%) | 0 (0.0%) |
| $100,000 to $299,999 | 69 (9.9%) | 267 (64.5%) |
| $300,000 to $499,999 | 396 (56.8%) | 51 (12.3%) |
| $500,000 to $749,999 | 157 (22.5%) | 0 (0.0%) |
| $750,000 to $999,999 | 0 (0.0%) | 0 (0.0%) |
| $1,000,000 or more | 41 (5.9%) | 0 (0.0%) |
| Total | 697 (100.0%) | 414 (100.0%) |
Household Income by Mortgage Status in Long Hill
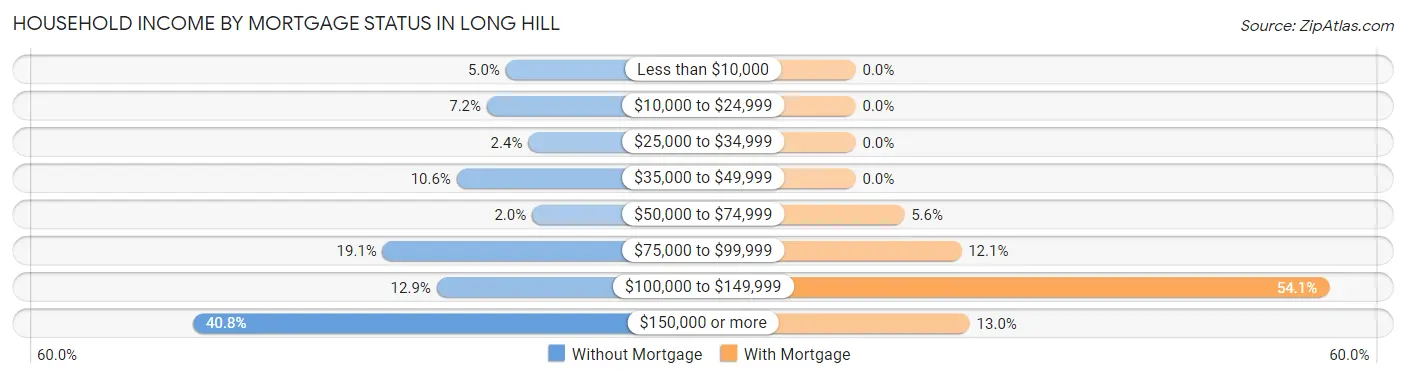
| Household Income | Without Mortgage | With Mortgage |
| Less than $10,000 | 35 (5.0%) | 0 (0.0%) |
| $10,000 to $24,999 | 50 (7.2%) | 0 (0.0%) |
| $25,000 to $34,999 | 17 (2.4%) | 0 (0.0%) |
| $35,000 to $49,999 | 74 (10.6%) | 0 (0.0%) |
| $50,000 to $74,999 | 14 (2.0%) | 23 (5.6%) |
| $75,000 to $99,999 | 133 (19.1%) | 50 (12.1%) |
| $100,000 to $149,999 | 90 (12.9%) | 224 (54.1%) |
| $150,000 or more | 284 (40.7%) | 54 (13.0%) |
| Total | 697 (100.0%) | 414 (100.0%) |
Property Value to Household Income Ratio in Long Hill
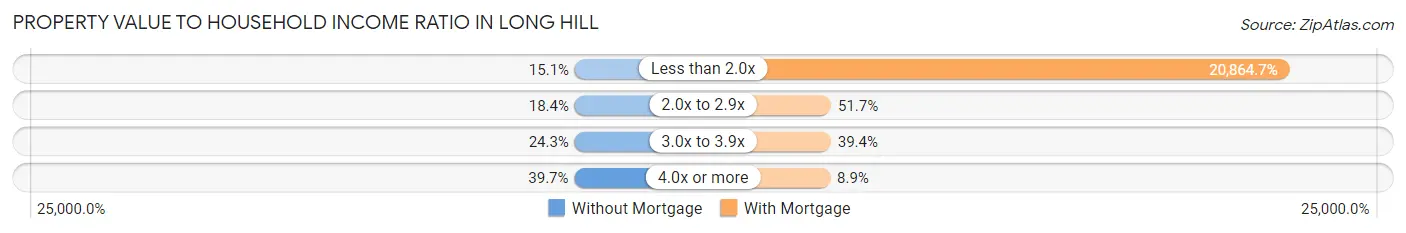
| Value-to-Income Ratio | Without Mortgage | With Mortgage |
| Less than 2.0x | 105 (15.1%) | 86,380 (20,864.7%) |
| 2.0x to 2.9x | 128 (18.4%) | 214 (51.7%) |
| 3.0x to 3.9x | 169 (24.2%) | 163 (39.4%) |
| 4.0x or more | 277 (39.7%) | 37 (8.9%) |
| Total | 697 (100.0%) | 414 (100.0%) |
Real Estate Taxes by Mortgage Status in Long Hill
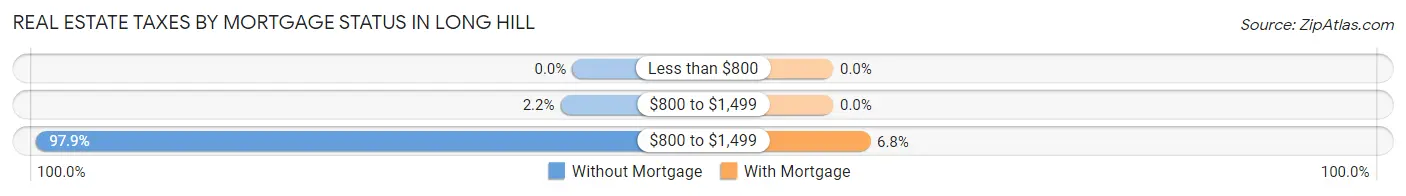
| Property Taxes | Without Mortgage | With Mortgage |
| Less than $800 | 0 (0.0%) | 0 (0.0%) |
| $800 to $1,499 | 15 (2.1%) | 0 (0.0%) |
| $800 to $1,499 | 682 (97.9%) | 28 (6.8%) |
| Total | 697 (100.0%) | 414 (100.0%) |
Health & Disability in Long Hill
Health Insurance Coverage by Age in Long Hill
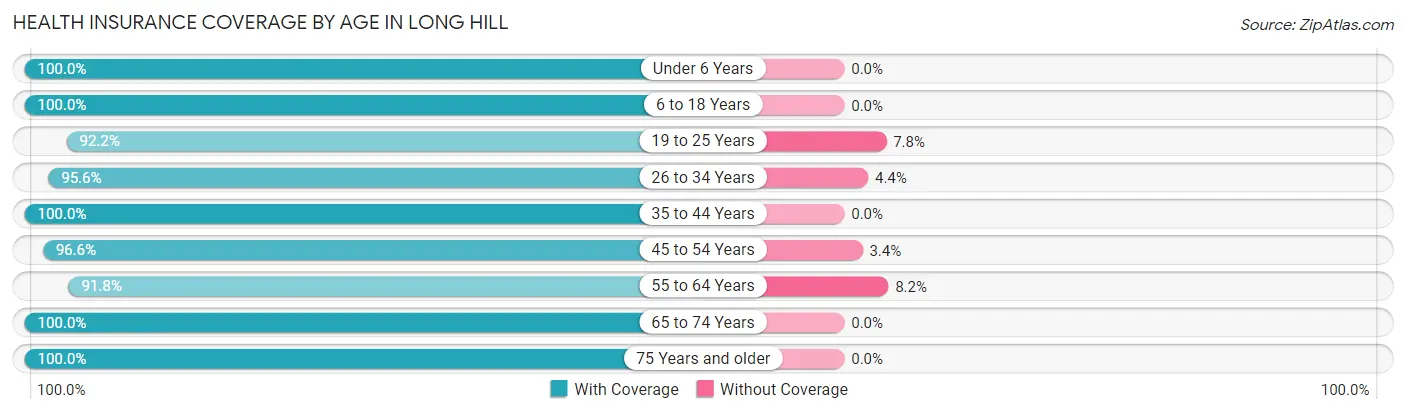
| Age Bracket | With Coverage | Without Coverage |
| Under 6 Years | 130 (100.0%) | 0 (0.0%) |
| 6 to 18 Years | 584 (100.0%) | 0 (0.0%) |
| 19 to 25 Years | 436 (92.2%) | 37 (7.8%) |
| 26 to 34 Years | 1,252 (95.6%) | 58 (4.4%) |
| 35 to 44 Years | 336 (100.0%) | 0 (0.0%) |
| 45 to 54 Years | 428 (96.6%) | 15 (3.4%) |
| 55 to 64 Years | 269 (91.8%) | 24 (8.2%) |
| 65 to 74 Years | 367 (100.0%) | 0 (0.0%) |
| 75 Years and older | 248 (100.0%) | 0 (0.0%) |
| Total | 4,050 (96.8%) | 134 (3.2%) |
Health Insurance Coverage by Citizenship Status in Long Hill
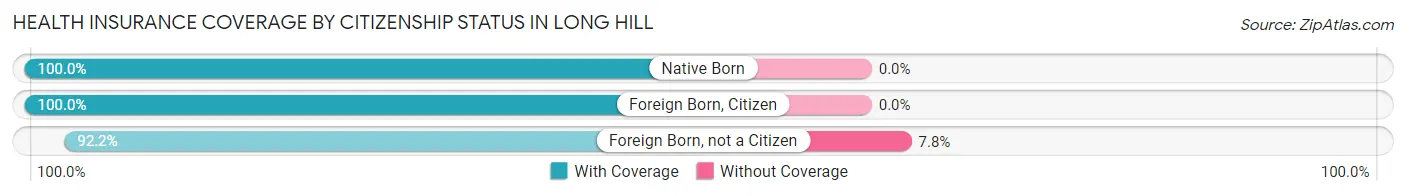
| Citizenship Status | With Coverage | Without Coverage |
| Native Born | 130 (100.0%) | 0 (0.0%) |
| Foreign Born, Citizen | 584 (100.0%) | 0 (0.0%) |
| Foreign Born, not a Citizen | 436 (92.2%) | 37 (7.8%) |
Health Insurance Coverage by Household Income in Long Hill
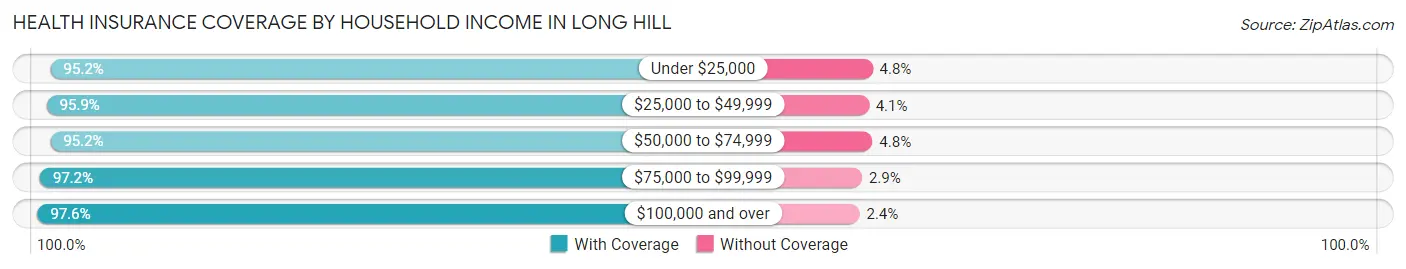
| Household Income | With Coverage | Without Coverage |
| Under $25,000 | 295 (95.2%) | 15 (4.8%) |
| $25,000 to $49,999 | 701 (95.9%) | 30 (4.1%) |
| $50,000 to $74,999 | 476 (95.2%) | 24 (4.8%) |
| $75,000 to $99,999 | 751 (97.2%) | 22 (2.9%) |
| $100,000 and over | 1,758 (97.6%) | 43 (2.4%) |
Public vs Private Health Insurance Coverage by Age in Long Hill
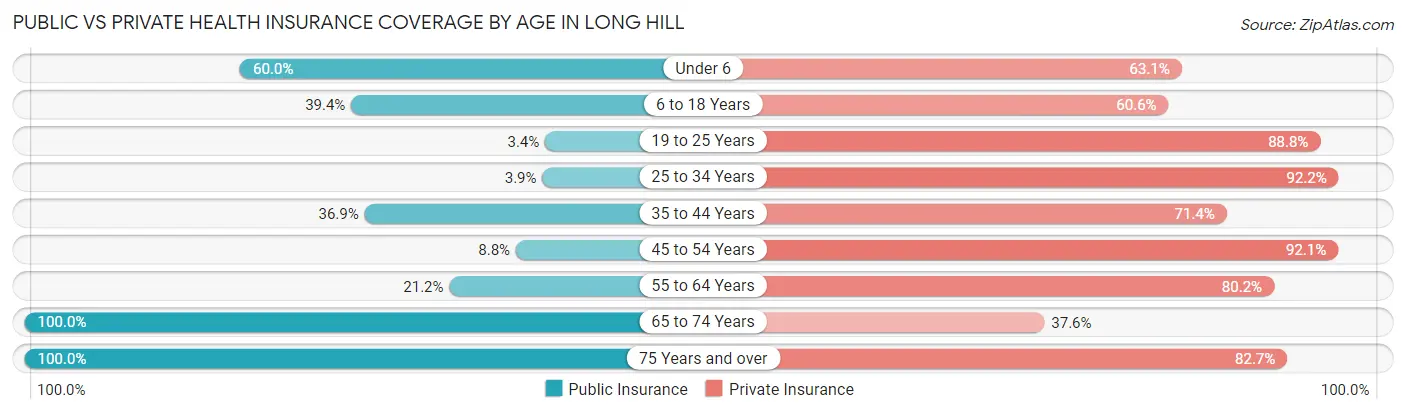
| Age Bracket | Public Insurance | Private Insurance |
| Under 6 | 78 (60.0%) | 82 (63.1%) |
| 6 to 18 Years | 230 (39.4%) | 354 (60.6%) |
| 19 to 25 Years | 16 (3.4%) | 420 (88.8%) |
| 25 to 34 Years | 51 (3.9%) | 1,208 (92.2%) |
| 35 to 44 Years | 124 (36.9%) | 240 (71.4%) |
| 45 to 54 Years | 39 (8.8%) | 408 (92.1%) |
| 55 to 64 Years | 62 (21.2%) | 235 (80.2%) |
| 65 to 74 Years | 367 (100.0%) | 138 (37.6%) |
| 75 Years and over | 248 (100.0%) | 205 (82.7%) |
| Total | 1,215 (29.0%) | 3,290 (78.6%) |
Disability Status by Sex by Age in Long Hill
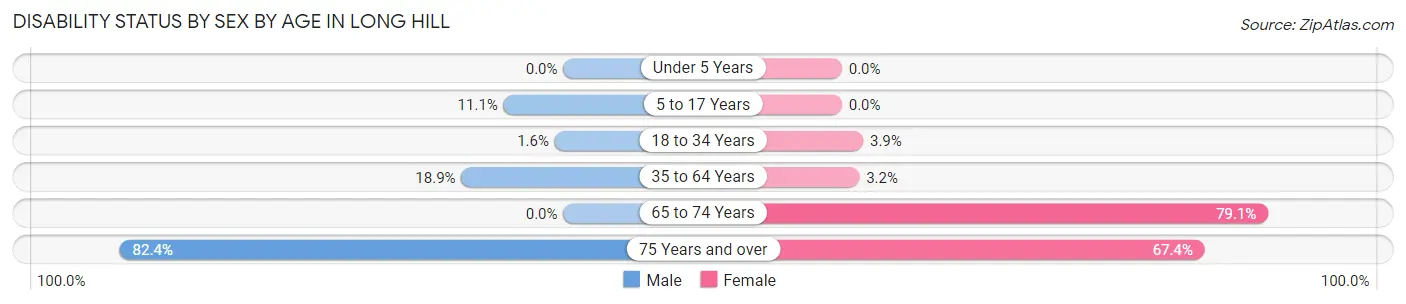
| Age Bracket | Male | Female |
| Under 5 Years | 0 (0.0%) | 0 (0.0%) |
| 5 to 17 Years | 42 (11.1%) | 0 (0.0%) |
| 18 to 34 Years | 15 (1.6%) | 33 (3.9%) |
| 35 to 64 Years | 109 (18.9%) | 16 (3.2%) |
| 65 to 74 Years | 0 (0.0%) | 258 (79.1%) |
| 75 Years and over | 126 (82.4%) | 64 (67.4%) |
Disability Class by Sex by Age in Long Hill
Disability Class: Hearing Difficulty
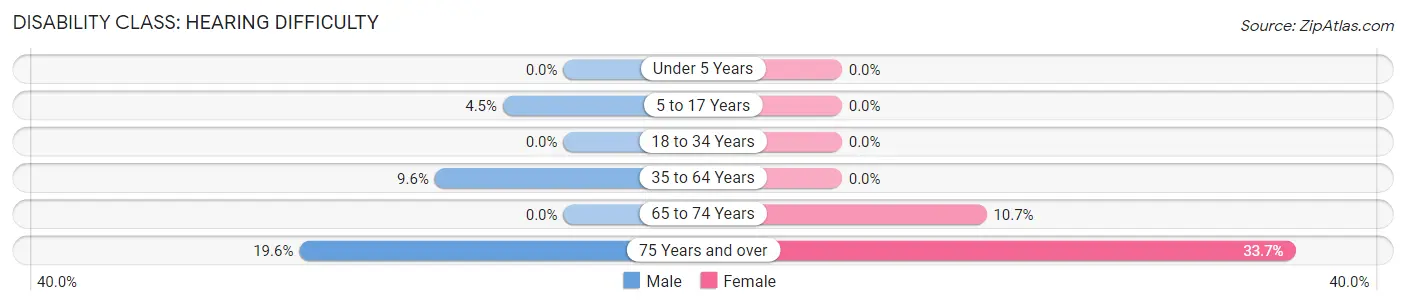
| Age Bracket | Male | Female |
| Under 5 Years | 0 (0.0%) | 0 (0.0%) |
| 5 to 17 Years | 17 (4.5%) | 0 (0.0%) |
| 18 to 34 Years | 0 (0.0%) | 0 (0.0%) |
| 35 to 64 Years | 55 (9.6%) | 0 (0.0%) |
| 65 to 74 Years | 0 (0.0%) | 35 (10.7%) |
| 75 Years and over | 30 (19.6%) | 32 (33.7%) |
Disability Class: Vision Difficulty
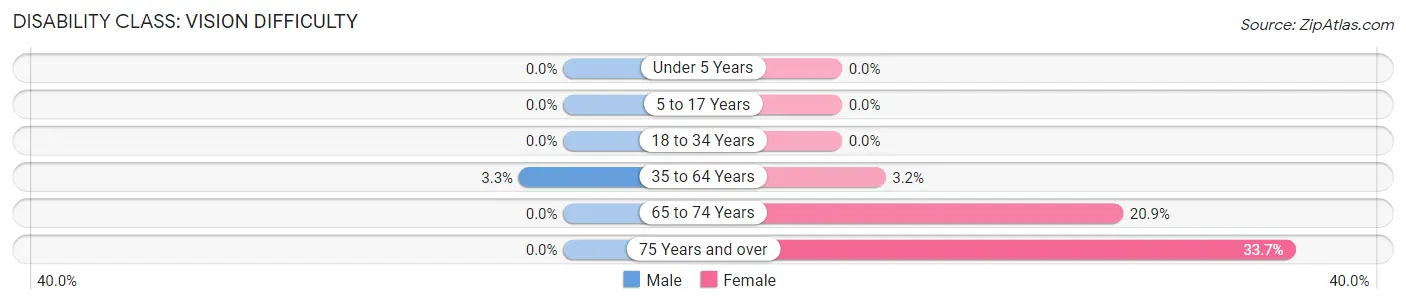
| Age Bracket | Male | Female |
| Under 5 Years | 0 (0.0%) | 0 (0.0%) |
| 5 to 17 Years | 0 (0.0%) | 0 (0.0%) |
| 18 to 34 Years | 0 (0.0%) | 0 (0.0%) |
| 35 to 64 Years | 19 (3.3%) | 16 (3.2%) |
| 65 to 74 Years | 0 (0.0%) | 68 (20.9%) |
| 75 Years and over | 0 (0.0%) | 32 (33.7%) |
Disability Class: Cognitive Difficulty
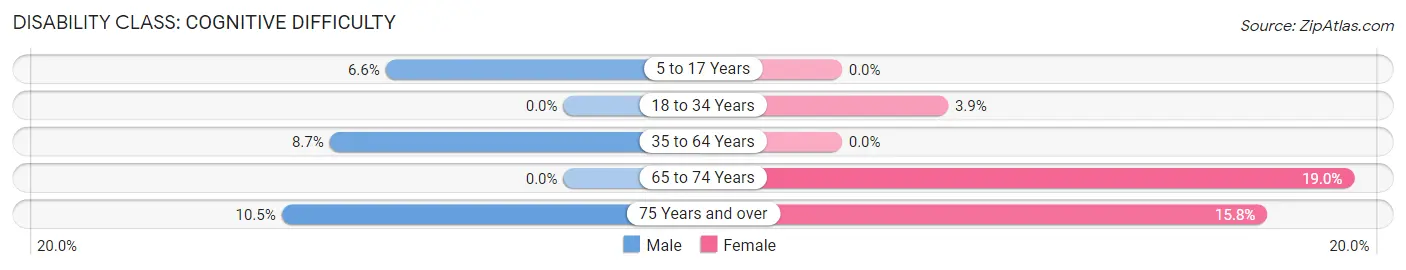
| Age Bracket | Male | Female |
| 5 to 17 Years | 25 (6.6%) | 0 (0.0%) |
| 18 to 34 Years | 0 (0.0%) | 33 (3.9%) |
| 35 to 64 Years | 50 (8.7%) | 0 (0.0%) |
| 65 to 74 Years | 0 (0.0%) | 62 (19.0%) |
| 75 Years and over | 16 (10.5%) | 15 (15.8%) |
Disability Class: Ambulatory Difficulty
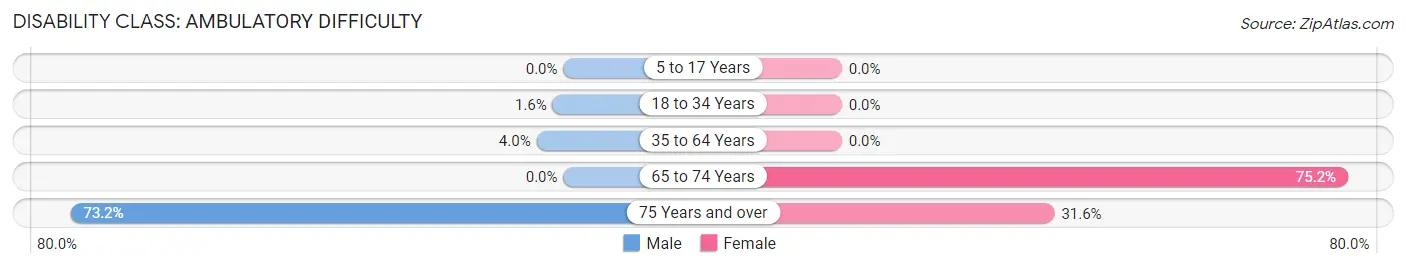
| Age Bracket | Male | Female |
| 5 to 17 Years | 0 (0.0%) | 0 (0.0%) |
| 18 to 34 Years | 15 (1.6%) | 0 (0.0%) |
| 35 to 64 Years | 23 (4.0%) | 0 (0.0%) |
| 65 to 74 Years | 0 (0.0%) | 245 (75.1%) |
| 75 Years and over | 112 (73.2%) | 30 (31.6%) |
Disability Class: Self-Care Difficulty
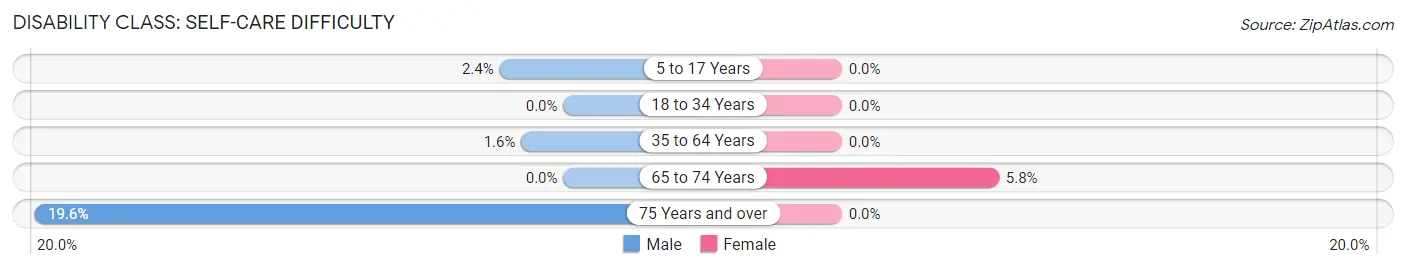
| Age Bracket | Male | Female |
| 5 to 17 Years | 9 (2.4%) | 0 (0.0%) |
| 18 to 34 Years | 0 (0.0%) | 0 (0.0%) |
| 35 to 64 Years | 9 (1.6%) | 0 (0.0%) |
| 65 to 74 Years | 0 (0.0%) | 19 (5.8%) |
| 75 Years and over | 30 (19.6%) | 0 (0.0%) |
Technology Access in Long Hill
Computing Device Access in Long Hill
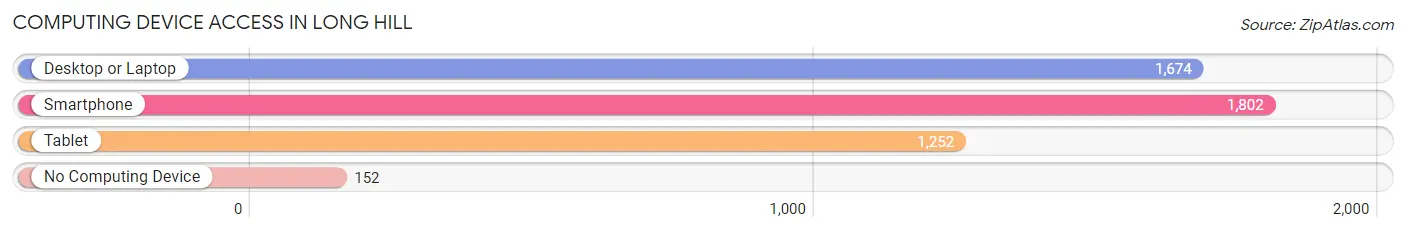
| Device Type | # Households | % Households |
| Desktop or Laptop | 1,674 | 78.7% |
| Smartphone | 1,802 | 84.7% |
| Tablet | 1,252 | 58.8% |
| No Computing Device | 152 | 7.1% |
| Total | 2,128 | 100.0% |
Internet Access in Long Hill
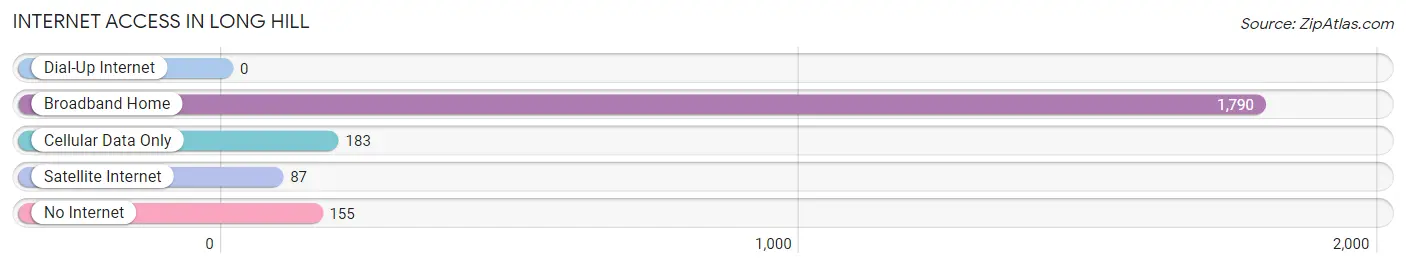
| Internet Type | # Households | % Households |
| Dial-Up Internet | 0 | 0.0% |
| Broadband Home | 1,790 | 84.1% |
| Cellular Data Only | 183 | 8.6% |
| Satellite Internet | 87 | 4.1% |
| No Internet | 155 | 7.3% |
| Total | 2,128 | 100.0% |
Long Hill Summary
Long Hill is a town located in the state of Connecticut in the United States. It is situated in the southwestern corner of the state, in Fairfield County, and is bordered by the towns of Trumbull, Monroe, and Shelton. The town has a population of approximately 8,000 people, and covers an area of 8.7 square miles.
History
Long Hill was originally part of the town of Stratford, which was established in 1639. In 1725, the area was separated from Stratford and incorporated as the town of Huntington. In 1821, the town was renamed Long Hill, after the long ridge of hills that run through the town.
The town was primarily agricultural in its early years, with the main crops being corn, wheat, and hay. In the late 19th century, the town began to develop into a residential community, with the construction of several large estates. The town also became a popular summer resort destination, with many wealthy New Yorkers building summer homes in the area.
Geography
Long Hill is located in southwestern Connecticut, in Fairfield County. It is bordered by the towns of Trumbull to the north, Monroe to the east, and Shelton to the south. The town is situated on a ridge of hills, which run from the Housatonic River in the west to the Naugatuck River in the east. The highest point in the town is the summit of Long Hill, which rises to an elevation of 590 feet.
The town is mostly rural in nature, with a mix of woodlands, wetlands, and open fields. The main waterway in the town is the Housatonic River, which forms the western border of the town. Other bodies of water in the town include the Pequonnock River, the Naugatuck River, and several small ponds and lakes.
Economy
Long Hill is primarily a residential community, with most of its residents commuting to nearby cities for work. The town does have a few small businesses, including a few retail stores, restaurants, and a few small manufacturing companies. The town is also home to a few large estates, which are used for private events and weddings.
The town is served by the Metro-North Railroad, which provides service to New York City and other nearby cities. The town is also served by several major highways, including Interstate 95, Route 8, and Route 25.
Demographics
As of the 2010 census, Long Hill had a population of 8,000 people. The racial makeup of the town was 94.3% White, 2.2% African American, 0.7% Asian, 0.3% Native American, and 2.5% from other races. The median household income in the town was $90,000, and the median home value was $400,000.
The town is served by the Long Hill School District, which consists of two elementary schools, one middle school, and one high school. The town is also home to several private schools, including the Long Hill Academy and the Long Hill Preparatory School.
Common Questions
What is Per Capita Income in Long Hill?
Per Capita income in Long Hill is $43,121.
What is the Median Family Income in Long Hill?
Median Family Income in Long Hill is $102,925.
What is the Median Household income in Long Hill?
Median Household Income in Long Hill is $81,750.
What is Income or Wage Gap in Long Hill?
Income or Wage Gap in Long Hill is 39.0%.
Women in Long Hill earn 61.0 cents for every dollar earned by a man.
What is Family Income Deficit in Long Hill?
Family Income Deficit in Long Hill is $14,579.
Families that are below poverty line in Long Hill earn $14,579 less on average than the poverty threshold level.
What is Inequality or Gini Index in Long Hill?
Inequality or Gini Index in Long Hill is 0.34.
What is the Total Population of Long Hill?
Total Population of Long Hill is 4,520.
What is the Total Male Population of Long Hill?
Total Male Population of Long Hill is 2,372.
What is the Total Female Population of Long Hill?
Total Female Population of Long Hill is 2,148.
What is the Ratio of Males per 100 Females in Long Hill?
There are 110.43 Males per 100 Females in Long Hill.
What is the Ratio of Females per 100 Males in Long Hill?
There are 90.56 Females per 100 Males in Long Hill.
What is the Median Population Age in Long Hill?
Median Population Age in Long Hill is 31.4 Years.
What is the Average Family Size in Long Hill
Average Family Size in Long Hill is 2.8 People.
What is the Average Household Size in Long Hill
Average Household Size in Long Hill is 2.0 People.
How Large is the Labor Force in Long Hill?
There are 2,827 People in the Labor Forcein in Long Hill.
What is the Percentage of People in the Labor Force in Long Hill?
72.5% of People are in the Labor Force in Long Hill.
What is the Unemployment Rate in Long Hill?
Unemployment Rate in Long Hill is 5.5%.