Zip Codes with the Highest Percentage of Population Employed in Food Preparation & Serving in Stamford, CT
RELATED REPORTS & OPTIONS
Food Preparation & Serving
Stamford
Compare Zip Codes
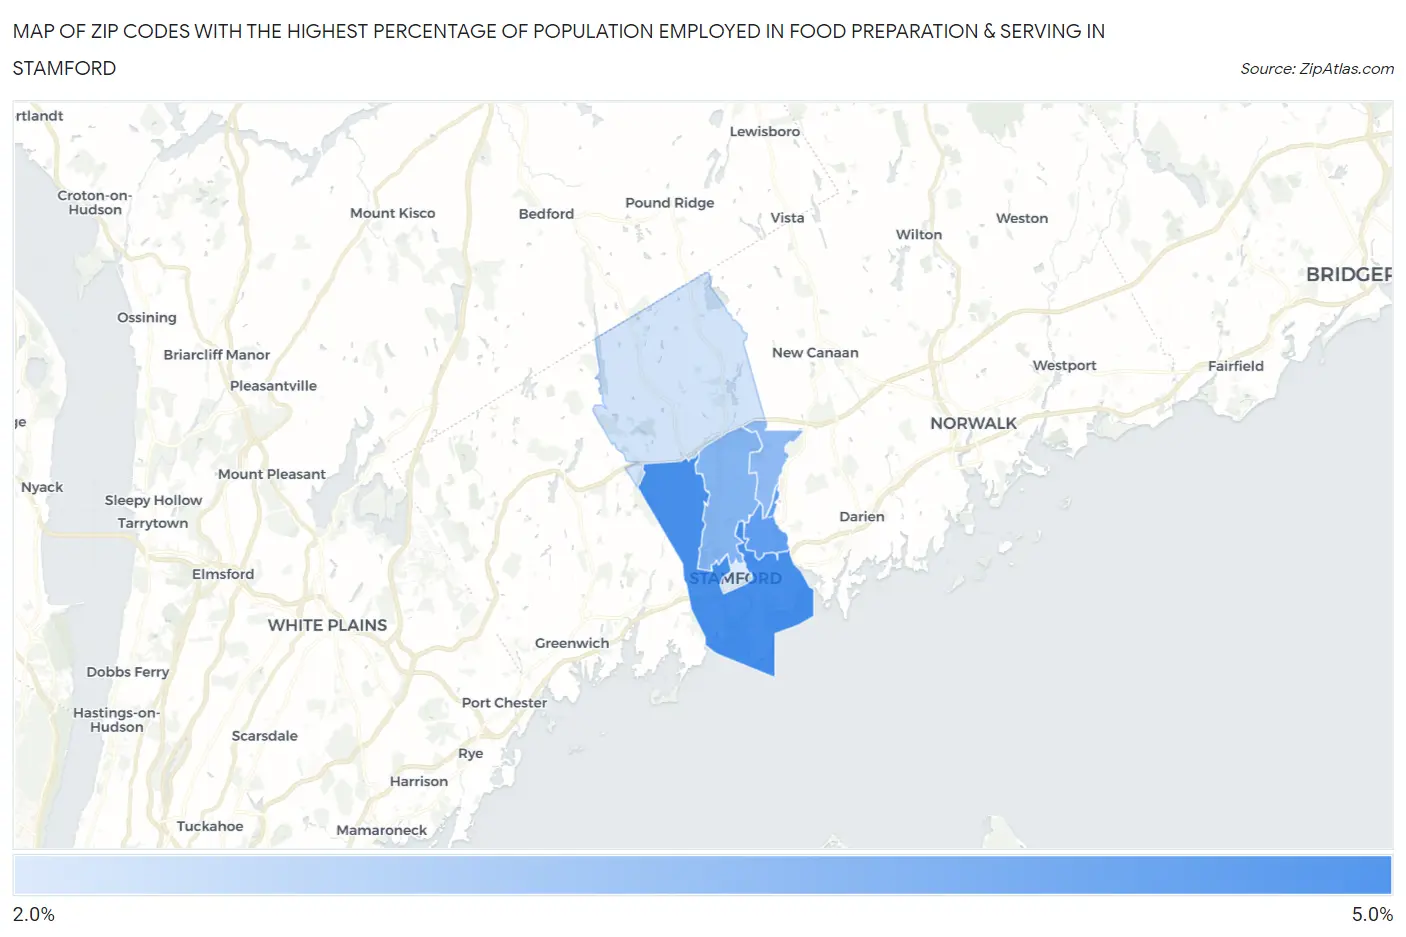
Map of Zip Codes with the Highest Percentage of Population Employed in Food Preparation & Serving in Stamford
2.2%
4.1%
Zip Codes with the Highest Percentage of Population Employed in Food Preparation & Serving in Stamford, CT
| Zip Code | % Employed | vs State | vs National | |
| 1. | 06902 | 4.1% | 4.7%(-0.534)#115 | 5.3%(-1.14)#16,504 |
| 2. | 06906 | 3.8% | 4.7%(-0.875)#130 | 5.3%(-1.48)#17,904 |
| 3. | 06905 | 3.4% | 4.7%(-1.33)#153 | 5.3%(-1.93)#19,797 |
| 4. | 06907 | 3.2% | 4.7%(-1.47)#161 | 5.3%(-2.07)#20,441 |
| 5. | 06903 | 2.3% | 4.7%(-2.36)#208 | 5.3%(-2.96)#23,713 |
| 6. | 06901 | 2.2% | 4.7%(-2.51)#213 | 5.3%(-3.11)#24,169 |
1
Common Questions
What are the Top 5 Zip Codes with the Highest Percentage of Population Employed in Food Preparation & Serving in Stamford, CT?
Top 5 Zip Codes with the Highest Percentage of Population Employed in Food Preparation & Serving in Stamford, CT are:
What zip code has the Highest Percentage of Population Employed in Food Preparation & Serving in Stamford, CT?
06902 has the Highest Percentage of Population Employed in Food Preparation & Serving in Stamford, CT with 4.1%.
What is the Percentage of Population Employed in Food Preparation & Serving in Stamford, CT?
Percentage of Population Employed in Food Preparation & Serving in Stamford is 3.6%.
What is the Percentage of Population Employed in Food Preparation & Serving in Connecticut?
Percentage of Population Employed in Food Preparation & Serving in Connecticut is 4.7%.
What is the Percentage of Population Employed in Food Preparation & Serving in the United States?
Percentage of Population Employed in Food Preparation & Serving in the United States is 5.3%.