Norfolk, CT Map & Demographics
Norfolk Map
Norfolk Overview
$53,042
PER CAPITA INCOME
$112,083
AVG FAMILY INCOME
$69,750
AVG HOUSEHOLD INCOME
51.9%
WAGE / INCOME GAP [ % ]
48.1¢/ $1
WAGE / INCOME GAP [ $ ]
0.44
INEQUALITY / GINI INDEX
652
TOTAL POPULATION
318
MALE POPULATION
334
FEMALE POPULATION
95.21
MALES / 100 FEMALES
105.03
FEMALES / 100 MALES
47.0
MEDIAN AGE
2.9
AVG FAMILY SIZE
2.0
AVG HOUSEHOLD SIZE
359
LABOR FORCE [ PEOPLE ]
63.1%
PERCENT IN LABOR FORCE
2.2%
UNEMPLOYMENT RATE
Norfolk Zip Codes
Norfolk Area Codes
Income in Norfolk
Income Overview in Norfolk
Per Capita Income in Norfolk is $53,042, while median incomes of families and households are $112,083 and $69,750 respectively.
| Characteristic | Number | Measure |
| Per Capita Income | 652 | $53,042 |
| Median Family Income | 158 | $112,083 |
| Mean Family Income | 158 | $131,611 |
| Median Household Income | 314 | $69,750 |
| Mean Household Income | 314 | $107,159 |
| Income Deficit | 158 | $0 |
| Wage / Income Gap (%) | 652 | 51.94% |
| Wage / Income Gap ($) | 652 | 48.06¢ per $1 |
| Gini / Inequality Index | 652 | 0.44 |
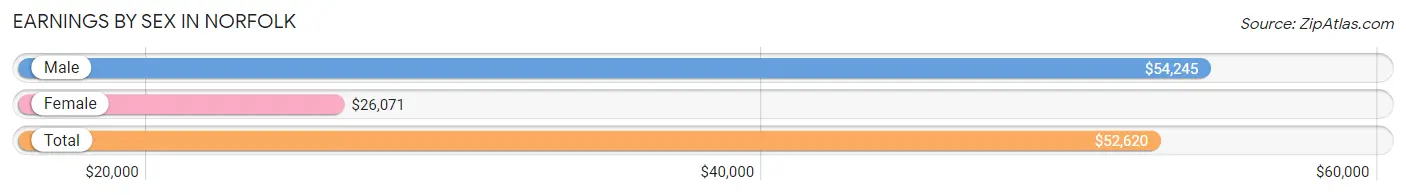
Earnings by Sex in Norfolk
Average Earnings in Norfolk are $52,620, $54,245 for men and $26,071 for women, a difference of 51.9%.
| Sex | Number | Average Earnings |
| Male | 211 (54.2%) | $54,245 |
| Female | 178 (45.8%) | $26,071 |
| Total | 389 (100.0%) | $52,620 |
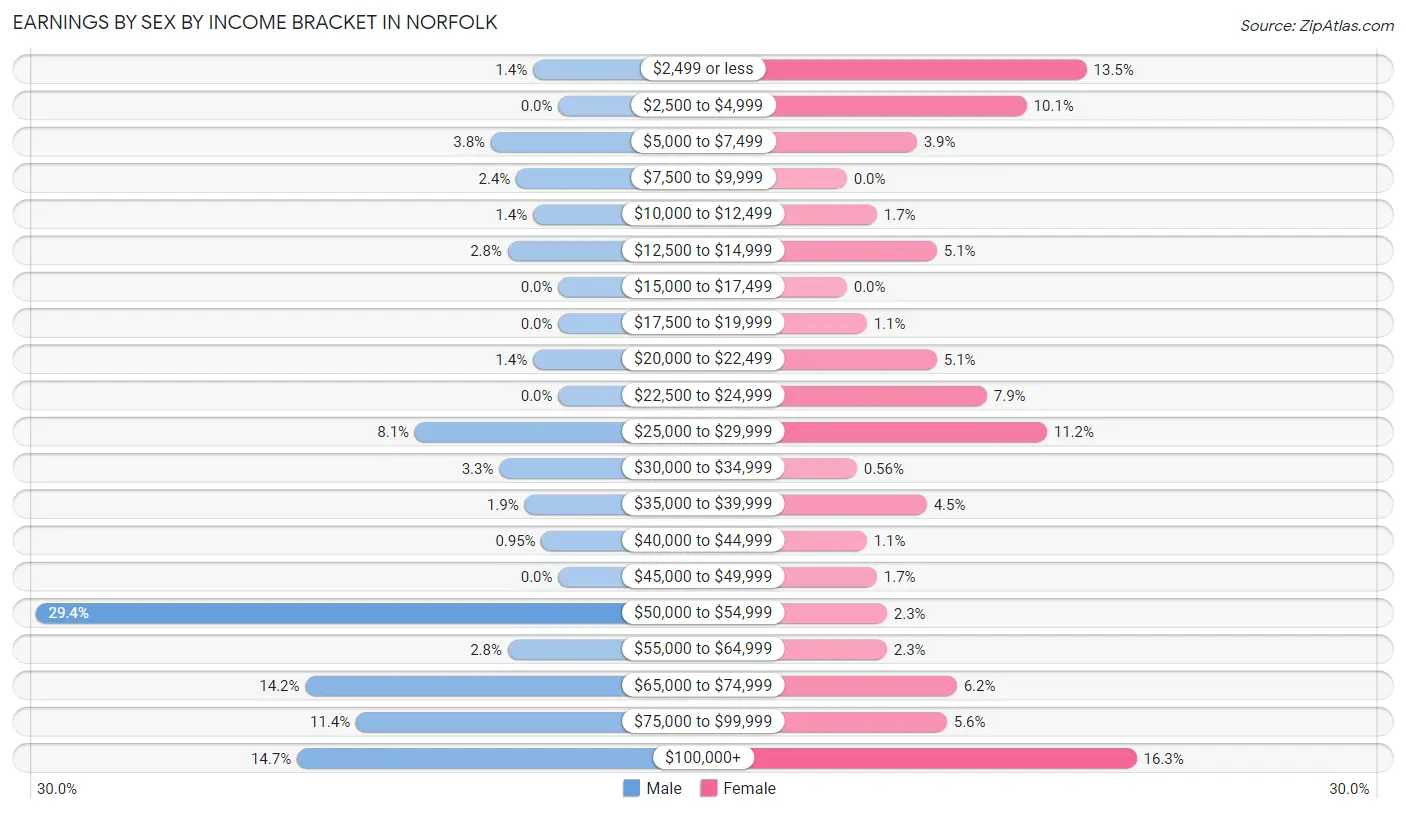
Earnings by Sex by Income Bracket in Norfolk
The most common earnings brackets in Norfolk are $50,000 to $54,999 for men (62 | 29.4%) and $100,000+ for women (29 | 16.3%).
| Income | Male | Female |
| $2,499 or less | 3 (1.4%) | 24 (13.5%) |
| $2,500 to $4,999 | 0 (0.0%) | 18 (10.1%) |
| $5,000 to $7,499 | 8 (3.8%) | 7 (3.9%) |
| $7,500 to $9,999 | 5 (2.4%) | 0 (0.0%) |
| $10,000 to $12,499 | 3 (1.4%) | 3 (1.7%) |
| $12,500 to $14,999 | 6 (2.8%) | 9 (5.1%) |
| $15,000 to $17,499 | 0 (0.0%) | 0 (0.0%) |
| $17,500 to $19,999 | 0 (0.0%) | 2 (1.1%) |
| $20,000 to $22,499 | 3 (1.4%) | 9 (5.1%) |
| $22,500 to $24,999 | 0 (0.0%) | 14 (7.9%) |
| $25,000 to $29,999 | 17 (8.1%) | 20 (11.2%) |
| $30,000 to $34,999 | 7 (3.3%) | 1 (0.6%) |
| $35,000 to $39,999 | 4 (1.9%) | 8 (4.5%) |
| $40,000 to $44,999 | 2 (0.9%) | 2 (1.1%) |
| $45,000 to $49,999 | 0 (0.0%) | 3 (1.7%) |
| $50,000 to $54,999 | 62 (29.4%) | 4 (2.2%) |
| $55,000 to $64,999 | 6 (2.8%) | 4 (2.2%) |
| $65,000 to $74,999 | 30 (14.2%) | 11 (6.2%) |
| $75,000 to $99,999 | 24 (11.4%) | 10 (5.6%) |
| $100,000+ | 31 (14.7%) | 29 (16.3%) |
| Total | 211 (100.0%) | 178 (100.0%) |
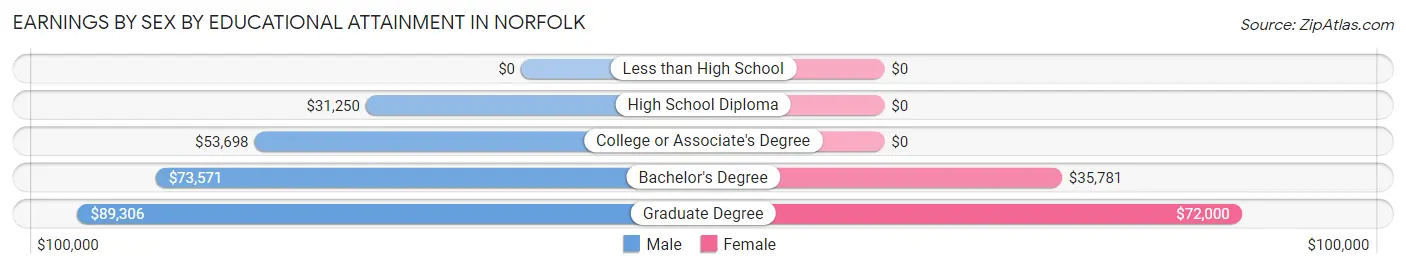
Earnings by Sex by Educational Attainment in Norfolk
Average earnings in Norfolk are $54,401 for men and $26,786 for women, a difference of 50.8%. Men with an educational attainment of graduate degree enjoy the highest average annual earnings of $89,306, while those with high school diploma education earn the least with $31,250. Women with an educational attainment of graduate degree earn the most with the average annual earnings of $72,000, while those with bachelor's degree education have the smallest earnings of $35,781.
| Educational Attainment | Male Income | Female Income |
| Less than High School | - | - |
| High School Diploma | $31,250 | $0 |
| College or Associate's Degree | $53,698 | $0 |
| Bachelor's Degree | $73,571 | $35,781 |
| Graduate Degree | $89,306 | $72,000 |
| Total | $54,401 | $26,786 |
Family Income in Norfolk
Family Income Brackets in Norfolk
According to the Norfolk family income data, there are 38 families falling into the $100,000 to $149,999 income range, which is the most common income bracket and makes up 24.0% of all families.
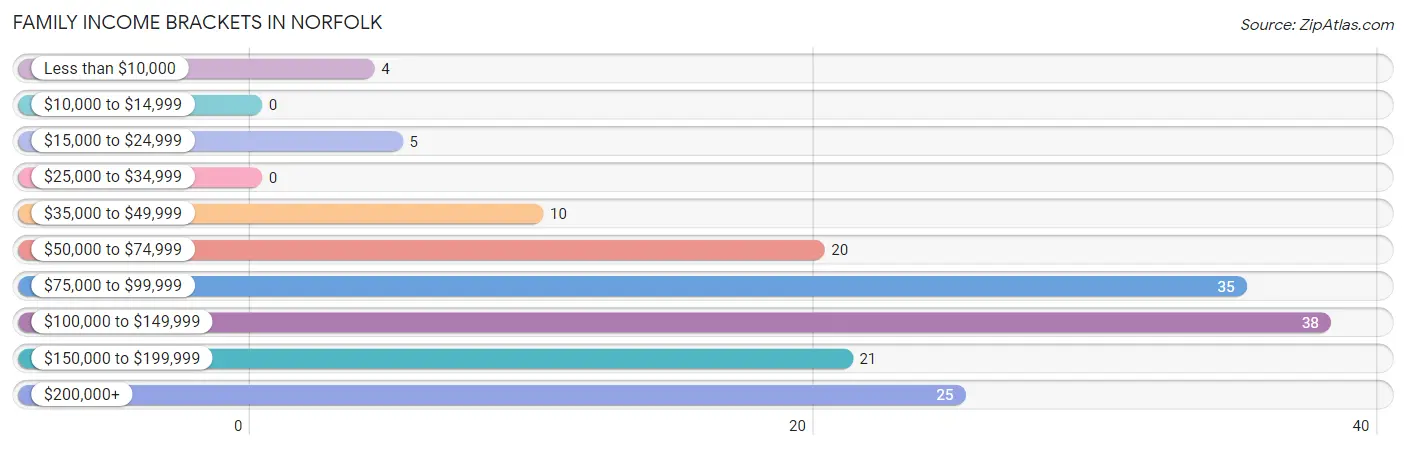
| Income Bracket | # Families | % Families |
| Less than $10,000 | 4 | 2.5% |
| $10,000 to $14,999 | 0 | 0.0% |
| $15,000 to $24,999 | 5 | 3.2% |
| $25,000 to $34,999 | 0 | 0.0% |
| $35,000 to $49,999 | 10 | 6.3% |
| $50,000 to $74,999 | 20 | 12.7% |
| $75,000 to $99,999 | 35 | 22.2% |
| $100,000 to $149,999 | 38 | 24.1% |
| $150,000 to $199,999 | 21 | 13.3% |
| $200,000+ | 25 | 15.8% |
Family Income by Famaliy Size in Norfolk
4-person families (41 | 26.0%) account for the highest median family income in Norfolk with $134,625 per family, while 2-person families (92 | 58.2%) have the highest median income of $46,406 per family member.
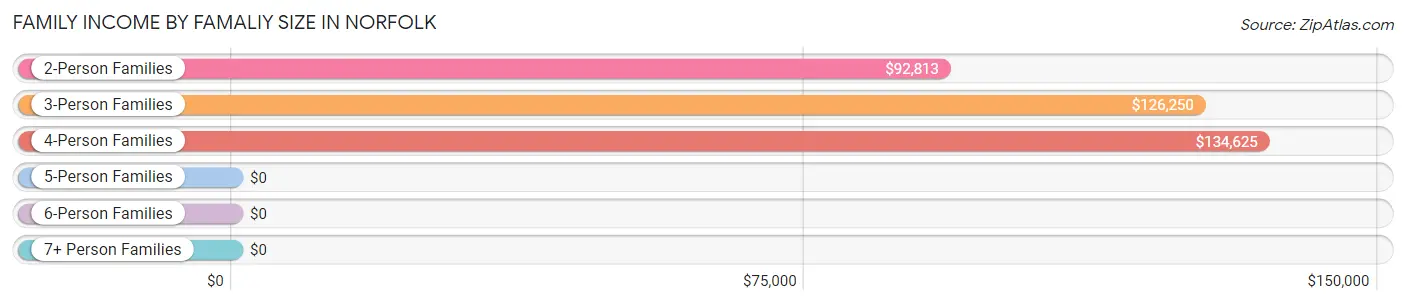
| Income Bracket | # Families | Median Income |
| 2-Person Families | 92 (58.2%) | $92,813 |
| 3-Person Families | 22 (13.9%) | $126,250 |
| 4-Person Families | 41 (26.0%) | $134,625 |
| 5-Person Families | 3 (1.9%) | $0 |
| 6-Person Families | 0 (0.0%) | $0 |
| 7+ Person Families | 0 (0.0%) | $0 |
| Total | 158 (100.0%) | $112,083 |
Family Income by Number of Earners in Norfolk
The median family income in Norfolk is $112,083, with families comprising 2 earners (65) having the highest median family income of $133,375, while families with no earners (30) have the lowest median family income of $69,000, accounting for 41.1% and 19.0% of families, respectively.
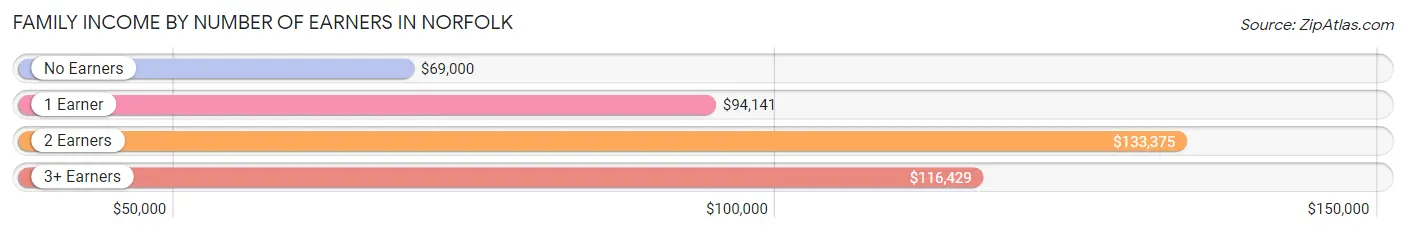
| Number of Earners | # Families | Median Income |
| No Earners | 30 (19.0%) | $69,000 |
| 1 Earner | 51 (32.3%) | $94,141 |
| 2 Earners | 65 (41.1%) | $133,375 |
| 3+ Earners | 12 (7.6%) | $116,429 |
| Total | 158 (100.0%) | $112,083 |
Household Income in Norfolk
Household Income Brackets in Norfolk
With 82 households falling in the category, the $50,000 to $74,999 income range is the most frequent in Norfolk, accounting for 26.1% of all households.
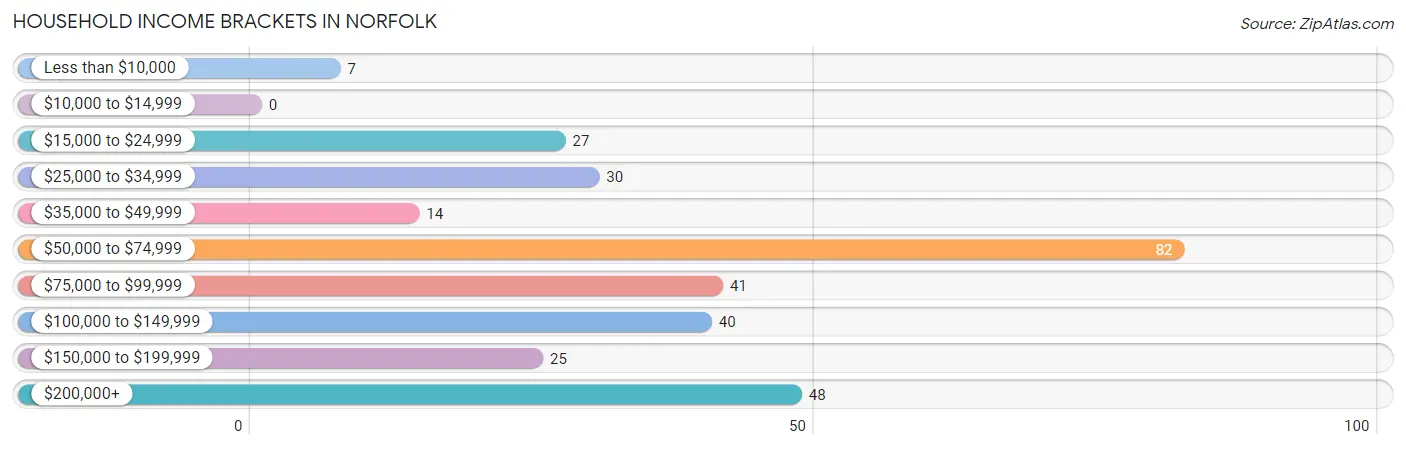
| Income Bracket | # Households | % Households |
| Less than $10,000 | 7 | 2.2% |
| $10,000 to $14,999 | 0 | 0.0% |
| $15,000 to $24,999 | 27 | 8.6% |
| $25,000 to $34,999 | 30 | 9.6% |
| $35,000 to $49,999 | 14 | 4.5% |
| $50,000 to $74,999 | 82 | 26.1% |
| $75,000 to $99,999 | 41 | 13.1% |
| $100,000 to $149,999 | 40 | 12.7% |
| $150,000 to $199,999 | 25 | 8.0% |
| $200,000+ | 48 | 15.3% |
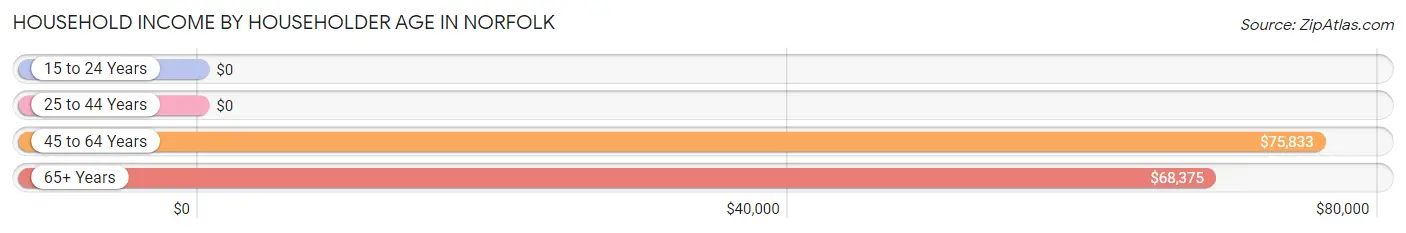
Household Income by Householder Age in Norfolk
The median household income in Norfolk is $69,750, with the highest median household income of $75,833 found in the 45 to 64 years age bracket for the primary householder. A total of 106 households (33.8%) fall into this category.
| Income Bracket | # Households | Median Income |
| 15 to 24 Years | 0 (0.0%) | $0 |
| 25 to 44 Years | 117 (37.3%) | $0 |
| 45 to 64 Years | 106 (33.8%) | $75,833 |
| 65+ Years | 91 (29.0%) | $68,375 |
| Total | 314 (100.0%) | $69,750 |
Poverty in Norfolk
Income Below Poverty by Sex and Age in Norfolk
With 5.3% poverty level for males and 7.2% for females among the residents of Norfolk, 6 to 11 year old males and 25 to 34 year old females are the most vulnerable to poverty, with 7 males (100.0%) and 11 females (25.0%) in their respective age groups living below the poverty level.
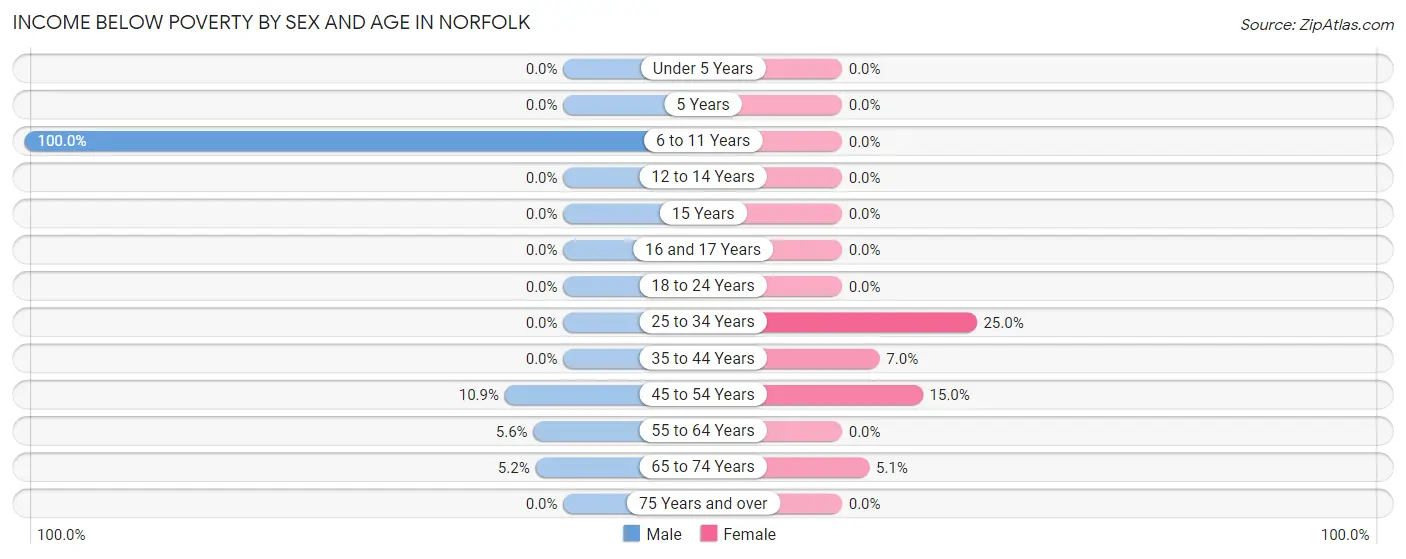
| Age Bracket | Male | Female |
| Under 5 Years | 0 (0.0%) | 0 (0.0%) |
| 5 Years | 0 (0.0%) | 0 (0.0%) |
| 6 to 11 Years | 7 (100.0%) | 0 (0.0%) |
| 12 to 14 Years | 0 (0.0%) | 0 (0.0%) |
| 15 Years | 0 (0.0%) | 0 (0.0%) |
| 16 and 17 Years | 0 (0.0%) | 0 (0.0%) |
| 18 to 24 Years | 0 (0.0%) | 0 (0.0%) |
| 25 to 34 Years | 0 (0.0%) | 11 (25.0%) |
| 35 to 44 Years | 0 (0.0%) | 3 (7.0%) |
| 45 to 54 Years | 5 (10.9%) | 6 (15.0%) |
| 55 to 64 Years | 2 (5.6%) | 0 (0.0%) |
| 65 to 74 Years | 3 (5.2%) | 4 (5.1%) |
| 75 Years and over | 0 (0.0%) | 0 (0.0%) |
| Total | 17 (5.3%) | 24 (7.2%) |
Income Above Poverty by Sex and Age in Norfolk
According to the poverty statistics in Norfolk, males aged under 5 years and females aged under 5 years are the age groups that are most secure financially, with 100.0% of males and 100.0% of females in these age groups living above the poverty line.
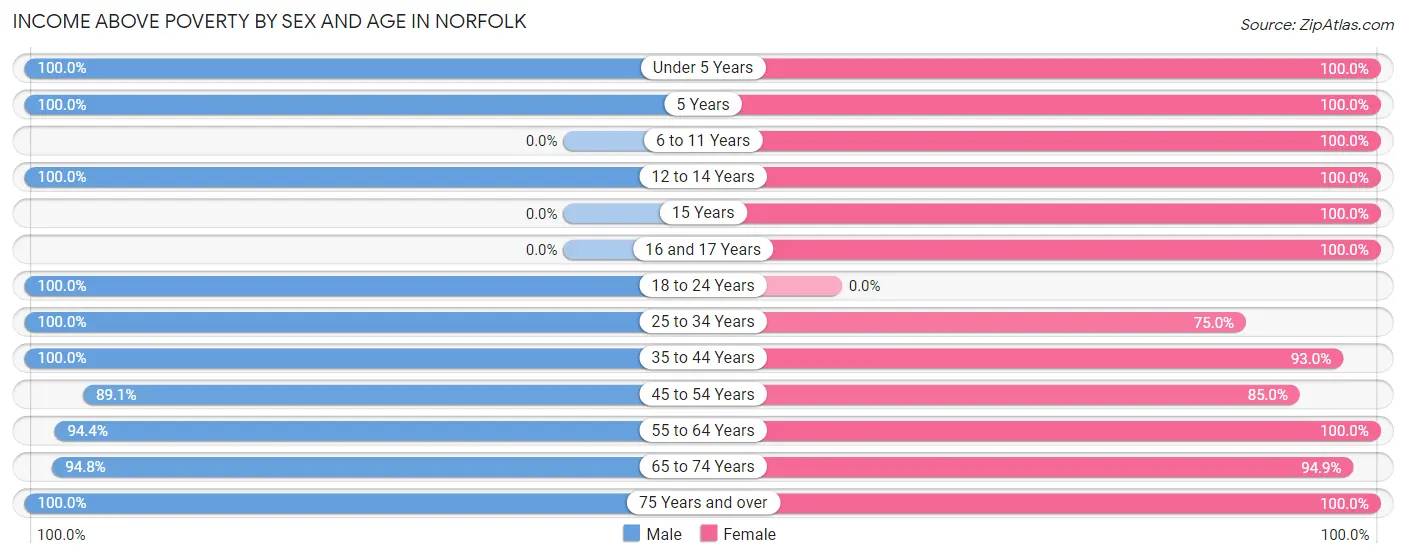
| Age Bracket | Male | Female |
| Under 5 Years | 9 (100.0%) | 15 (100.0%) |
| 5 Years | 10 (100.0%) | 2 (100.0%) |
| 6 to 11 Years | 0 (0.0%) | 26 (100.0%) |
| 12 to 14 Years | 6 (100.0%) | 3 (100.0%) |
| 15 Years | 0 (0.0%) | 5 (100.0%) |
| 16 and 17 Years | 0 (0.0%) | 8 (100.0%) |
| 18 to 24 Years | 6 (100.0%) | 0 (0.0%) |
| 25 to 34 Years | 86 (100.0%) | 33 (75.0%) |
| 35 to 44 Years | 38 (100.0%) | 40 (93.0%) |
| 45 to 54 Years | 41 (89.1%) | 34 (85.0%) |
| 55 to 64 Years | 34 (94.4%) | 46 (100.0%) |
| 65 to 74 Years | 55 (94.8%) | 75 (94.9%) |
| 75 Years and over | 16 (100.0%) | 23 (100.0%) |
| Total | 301 (94.7%) | 310 (92.8%) |
Income Below Poverty Among Married-Couple Families in Norfolk
The poverty statistics for married-couple families in Norfolk show that 2.8% or 4 of the total 141 families live below the poverty line. Families with 1 or 2 children have the highest poverty rate of 9.5%, comprising of 4 families. On the other hand, families with no children have the lowest poverty rate of 0.0%, which includes 0 families.
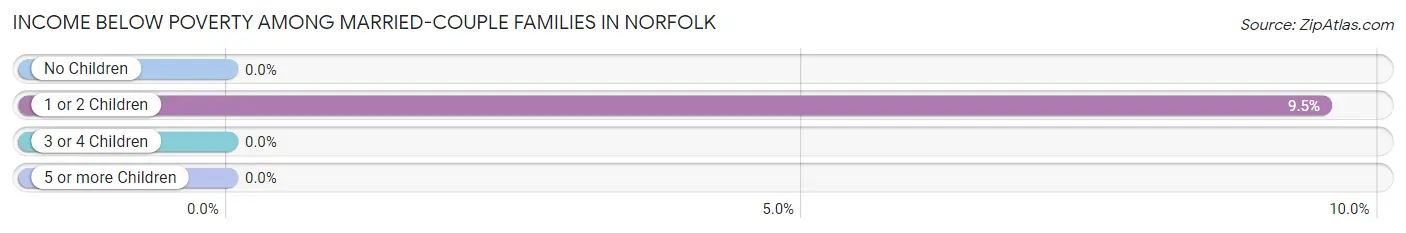
| Children | Above Poverty | Below Poverty |
| No Children | 99 (100.0%) | 0 (0.0%) |
| 1 or 2 Children | 38 (90.5%) | 4 (9.5%) |
| 3 or 4 Children | 0 (0.0%) | 0 (0.0%) |
| 5 or more Children | 0 (0.0%) | 0 (0.0%) |
| Total | 137 (97.2%) | 4 (2.8%) |
Income Below Poverty Among Single-Parent Households in Norfolk
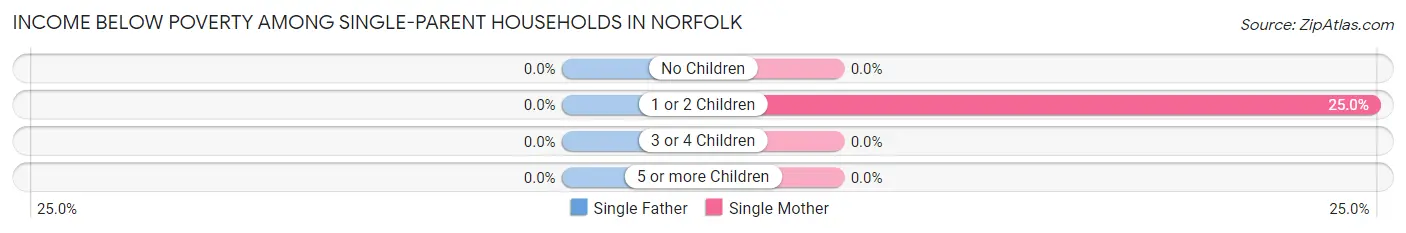
| Children | Single Father | Single Mother |
| No Children | 0 (0.0%) | 0 (0.0%) |
| 1 or 2 Children | 0 (0.0%) | 2 (25.0%) |
| 3 or 4 Children | 0 (0.0%) | 0 (0.0%) |
| 5 or more Children | 0 (0.0%) | 0 (0.0%) |
| Total | 0 (0.0%) | 2 (14.3%) |
Income Below Poverty Among Married-Couple vs Single-Parent Households in Norfolk
The poverty data for Norfolk shows that 4 of the married-couple family households (2.8%) and 2 of the single-parent households (11.8%) are living below the poverty level. Within the married-couple family households, those with 1 or 2 children have the highest poverty rate, with 4 households (9.5%) falling below the poverty line. Among the single-parent households, those with 1 or 2 children have the highest poverty rate, with 2 household (18.2%) living below poverty.
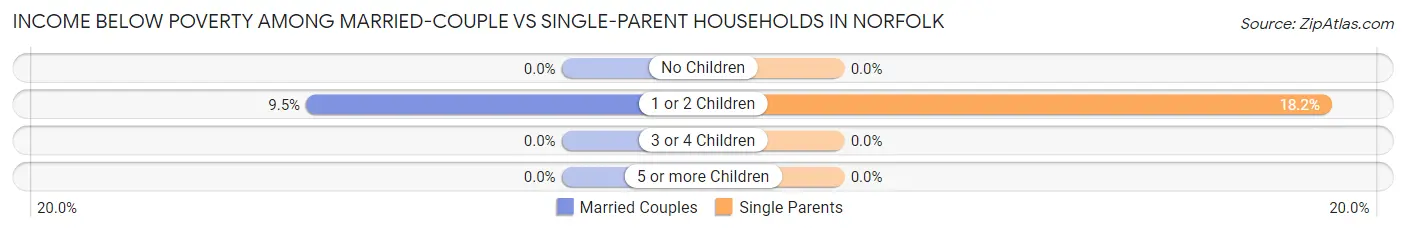
| Children | Married-Couple Families | Single-Parent Households |
| No Children | 0 (0.0%) | 0 (0.0%) |
| 1 or 2 Children | 4 (9.5%) | 2 (18.2%) |
| 3 or 4 Children | 0 (0.0%) | 0 (0.0%) |
| 5 or more Children | 0 (0.0%) | 0 (0.0%) |
| Total | 4 (2.8%) | 2 (11.8%) |
Race in Norfolk
The most populous races in Norfolk are White / Caucasian (558 | 85.6%), Two or more Races (81 | 12.4%), and Hispanic or Latino (49 | 7.5%).
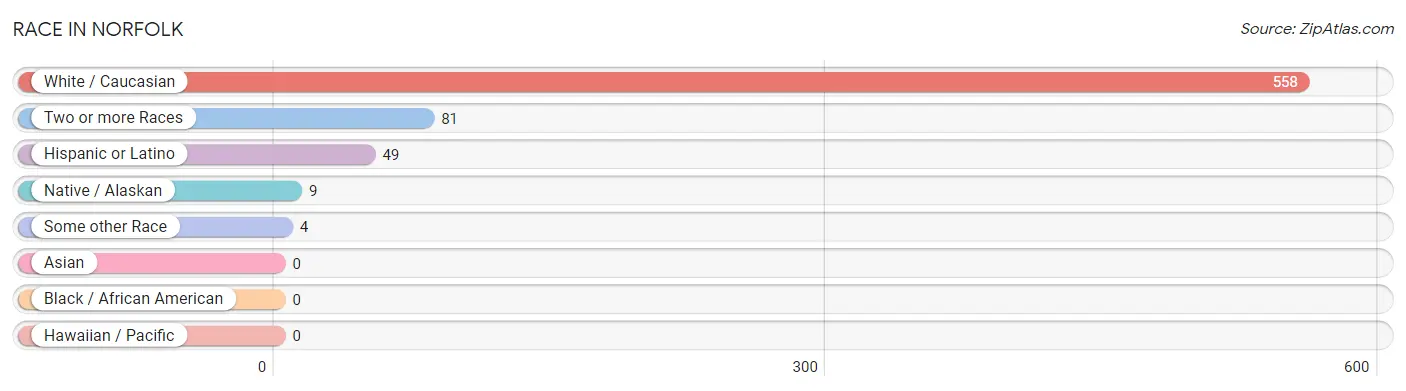
| Race | # Population | % Population |
| Asian | 0 | 0.0% |
| Black / African American | 0 | 0.0% |
| Hawaiian / Pacific | 0 | 0.0% |
| Hispanic or Latino | 49 | 7.5% |
| Native / Alaskan | 9 | 1.4% |
| White / Caucasian | 558 | 85.6% |
| Two or more Races | 81 | 12.4% |
| Some other Race | 4 | 0.6% |
| Total | 652 | 100.0% |
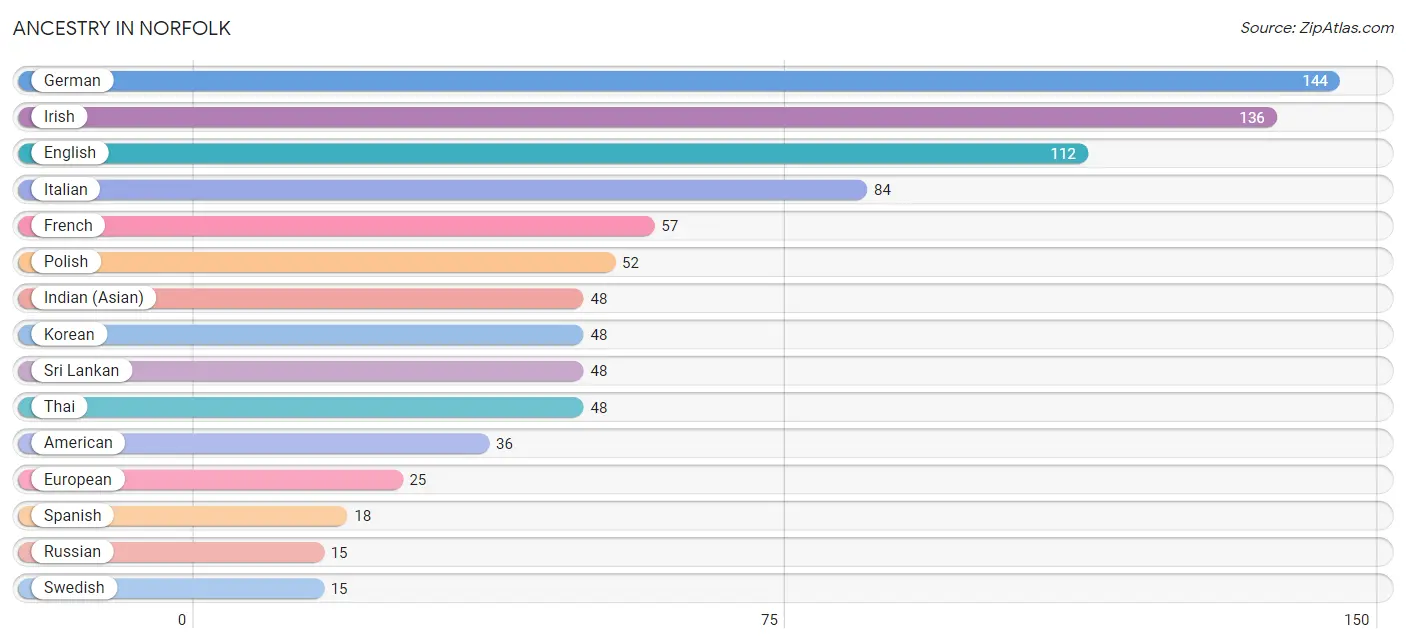
Ancestry in Norfolk
The most populous ancestries reported in Norfolk are German (144 | 22.1%), Irish (136 | 20.9%), English (112 | 17.2%), Italian (84 | 12.9%), and French (57 | 8.7%), together accounting for 81.8% of all Norfolk residents.
| Ancestry | # Population | % Population |
| American | 36 | 5.5% |
| Apache | 9 | 1.4% |
| Arab | 3 | 0.5% |
| British | 6 | 0.9% |
| Canadian | 2 | 0.3% |
| Central American Indian | 11 | 1.7% |
| Cherokee | 4 | 0.6% |
| Colombian | 11 | 1.7% |
| Croatian | 3 | 0.5% |
| Czech | 10 | 1.5% |
| Czechoslovakian | 14 | 2.1% |
| Dutch | 6 | 0.9% |
| Eastern European | 7 | 1.1% |
| English | 112 | 17.2% |
| European | 25 | 3.8% |
| French | 57 | 8.7% |
| French Canadian | 3 | 0.5% |
| German | 144 | 22.1% |
| Hungarian | 10 | 1.5% |
| Indian (Asian) | 48 | 7.4% |
| Iranian | 5 | 0.8% |
| Irish | 136 | 20.9% |
| Italian | 84 | 12.9% |
| Korean | 48 | 7.4% |
| Lebanese | 3 | 0.5% |
| Mexican | 9 | 1.4% |
| Northern European | 2 | 0.3% |
| Norwegian | 13 | 2.0% |
| Polish | 52 | 8.0% |
| Puerto Rican | 11 | 1.7% |
| Russian | 15 | 2.3% |
| Scandinavian | 7 | 1.1% |
| Scotch-Irish | 3 | 0.5% |
| Scottish | 12 | 1.8% |
| South American | 11 | 1.7% |
| Spanish | 18 | 2.8% |
| Sri Lankan | 48 | 7.4% |
| Swedish | 15 | 2.3% |
| Thai | 48 | 7.4% | View All 39 Rows |
Immigrants in Norfolk
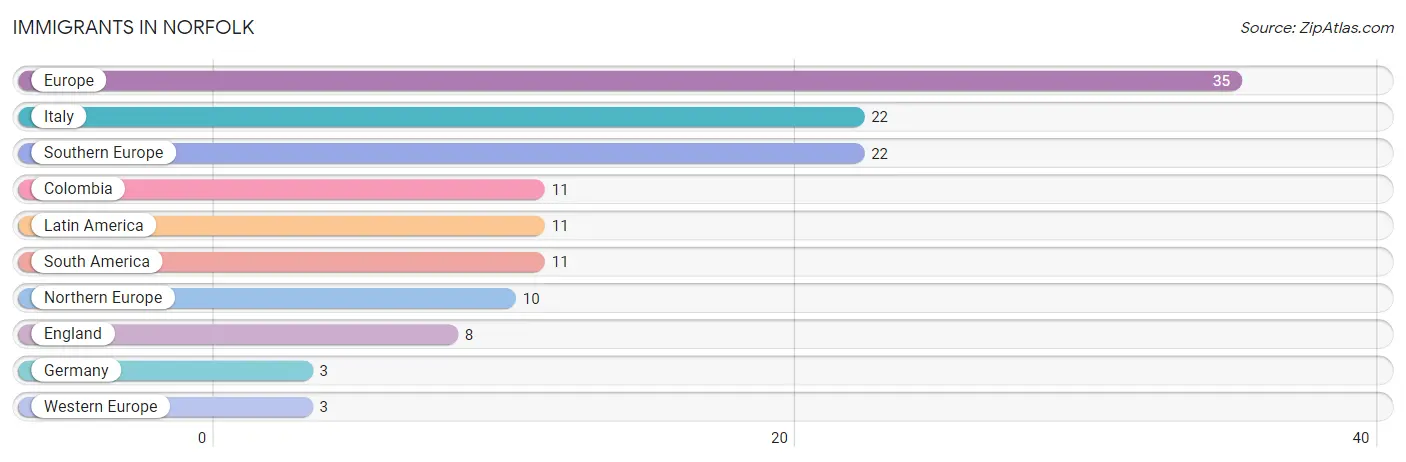
The most numerous immigrant groups reported in Norfolk came from Europe (35 | 5.4%), Italy (22 | 3.4%), Southern Europe (22 | 3.4%), Colombia (11 | 1.7%), and Latin America (11 | 1.7%), together accounting for 15.5% of all Norfolk residents.
| Immigration Origin | # Population | % Population |
| Colombia | 11 | 1.7% |
| England | 8 | 1.2% |
| Europe | 35 | 5.4% |
| Germany | 3 | 0.5% |
| Italy | 22 | 3.4% |
| Latin America | 11 | 1.7% |
| Northern Europe | 10 | 1.5% |
| South America | 11 | 1.7% |
| Southern Europe | 22 | 3.4% |
| Western Europe | 3 | 0.5% | View All 10 Rows |
Sex and Age in Norfolk
Sex and Age in Norfolk
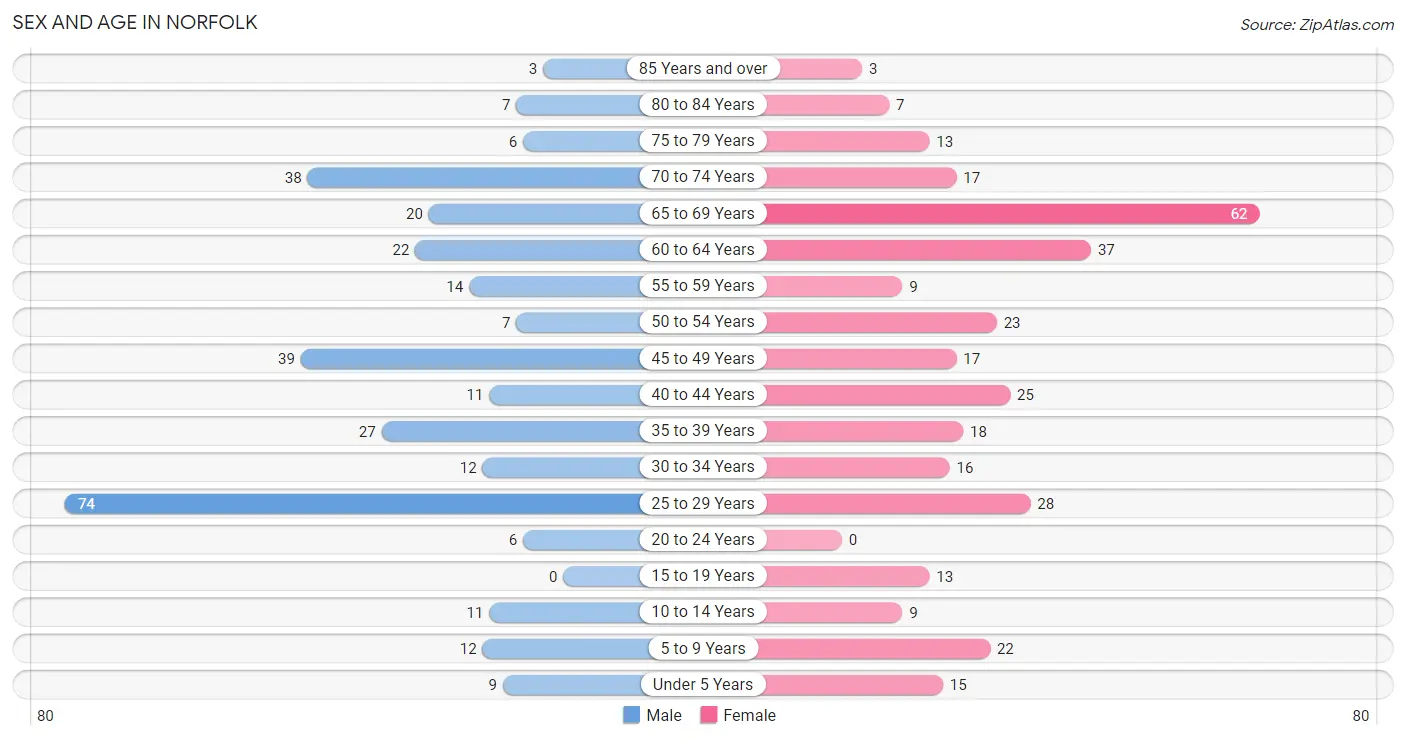
The most populous age groups in Norfolk are 25 to 29 Years (74 | 23.3%) for men and 65 to 69 Years (62 | 18.6%) for women.
| Age Bracket | Male | Female |
| Under 5 Years | 9 (2.8%) | 15 (4.5%) |
| 5 to 9 Years | 12 (3.8%) | 22 (6.6%) |
| 10 to 14 Years | 11 (3.5%) | 9 (2.7%) |
| 15 to 19 Years | 0 (0.0%) | 13 (3.9%) |
| 20 to 24 Years | 6 (1.9%) | 0 (0.0%) |
| 25 to 29 Years | 74 (23.3%) | 28 (8.4%) |
| 30 to 34 Years | 12 (3.8%) | 16 (4.8%) |
| 35 to 39 Years | 27 (8.5%) | 18 (5.4%) |
| 40 to 44 Years | 11 (3.5%) | 25 (7.5%) |
| 45 to 49 Years | 39 (12.3%) | 17 (5.1%) |
| 50 to 54 Years | 7 (2.2%) | 23 (6.9%) |
| 55 to 59 Years | 14 (4.4%) | 9 (2.7%) |
| 60 to 64 Years | 22 (6.9%) | 37 (11.1%) |
| 65 to 69 Years | 20 (6.3%) | 62 (18.6%) |
| 70 to 74 Years | 38 (11.9%) | 17 (5.1%) |
| 75 to 79 Years | 6 (1.9%) | 13 (3.9%) |
| 80 to 84 Years | 7 (2.2%) | 7 (2.1%) |
| 85 Years and over | 3 (0.9%) | 3 (0.9%) |
| Total | 318 (100.0%) | 334 (100.0%) |
Families and Households in Norfolk
Median Family Size in Norfolk
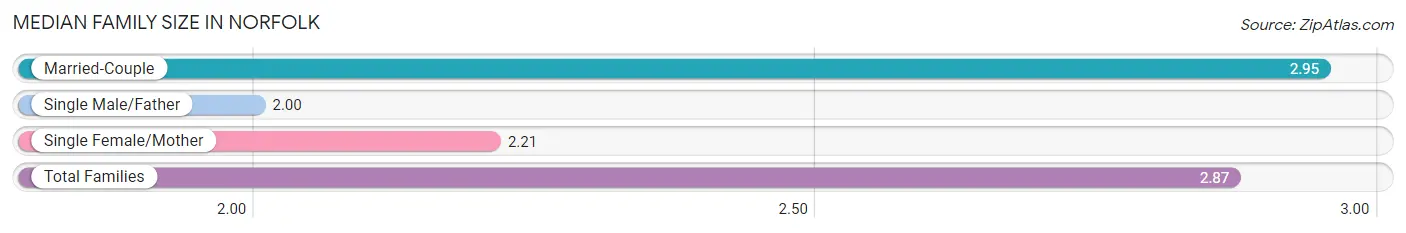
The median family size in Norfolk is 2.87 persons per family, with married-couple families (141 | 89.2%) accounting for the largest median family size of 2.95 persons per family. On the other hand, single male/father families (3 | 1.9%) represent the smallest median family size with 2.00 persons per family.
| Family Type | # Families | Family Size |
| Married-Couple | 141 (89.2%) | 2.95 |
| Single Male/Father | 3 (1.9%) | 2.00 |
| Single Female/Mother | 14 (8.9%) | 2.21 |
| Total Families | 158 (100.0%) | 2.87 |
Median Household Size in Norfolk
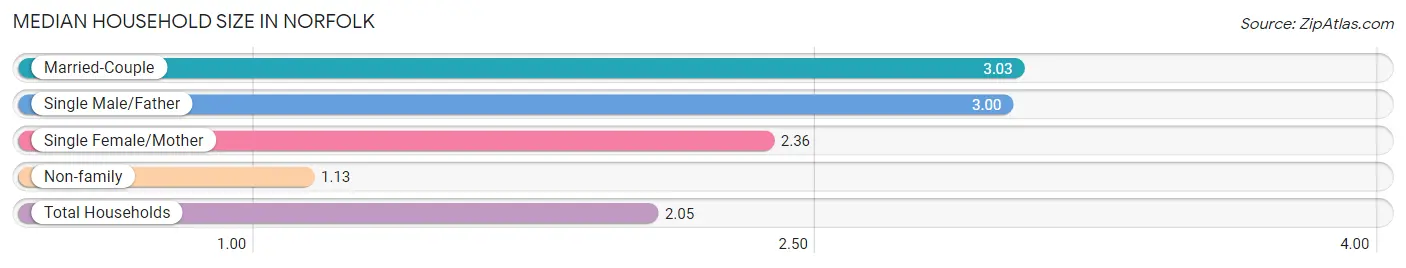
The median household size in Norfolk is 2.05 persons per household, with married-couple households (141 | 44.9%) accounting for the largest median household size of 3.03 persons per household. non-family households (156 | 49.7%) represent the smallest median household size with 1.13 persons per household.
| Household Type | # Households | Household Size |
| Married-Couple | 141 (44.9%) | 3.03 |
| Single Male/Father | 3 (1.0%) | 3.00 |
| Single Female/Mother | 14 (4.5%) | 2.36 |
| Non-family | 156 (49.7%) | 1.13 |
| Total Households | 314 (100.0%) | 2.05 |
Household Size by Marriage Status in Norfolk
Out of a total of 314 households in Norfolk, 158 (50.3%) are family households, while 156 (49.7%) are nonfamily households. The most numerous type of family households are 2-person households, comprising 86, and the most common type of nonfamily households are 1-person households, comprising 147.
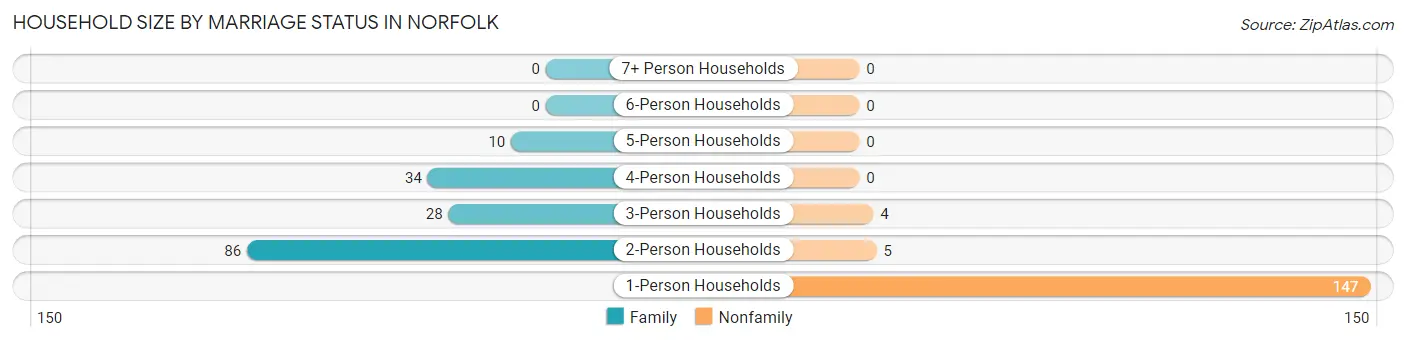
| Household Size | Family Households | Nonfamily Households |
| 1-Person Households | - | 147 (46.8%) |
| 2-Person Households | 86 (27.4%) | 5 (1.6%) |
| 3-Person Households | 28 (8.9%) | 4 (1.3%) |
| 4-Person Households | 34 (10.8%) | 0 (0.0%) |
| 5-Person Households | 10 (3.2%) | 0 (0.0%) |
| 6-Person Households | 0 (0.0%) | 0 (0.0%) |
| 7+ Person Households | 0 (0.0%) | 0 (0.0%) |
| Total | 158 (50.3%) | 156 (49.7%) |
Female Fertility in Norfolk
Fertility by Age in Norfolk
Average fertility rate in Norfolk is 43.0 births per 1,000 women. Women in the age bracket of 35 to 50 years have the highest fertility rate with 83.0 births per 1,000 women. Women in the age bracket of 35 to 50 years acount for 100.0% of all women with births.
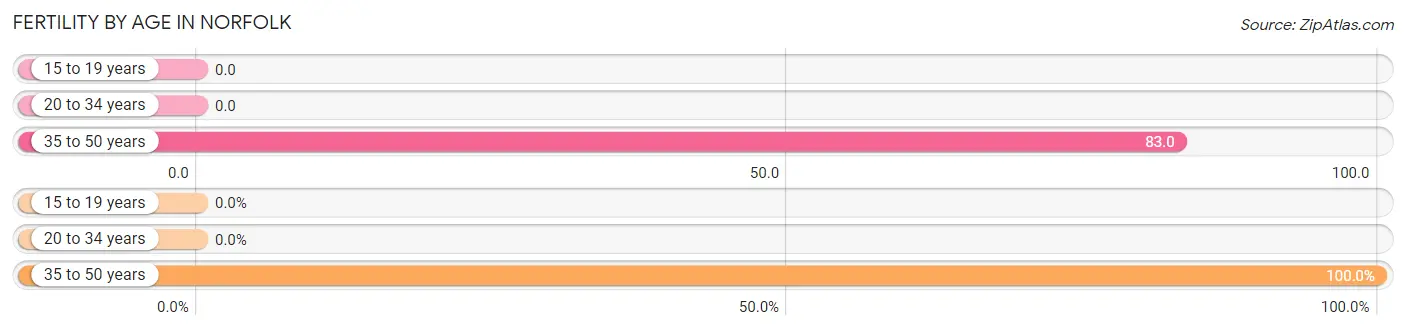
| Age Bracket | Women with Births | Births / 1,000 Women |
| 15 to 19 years | 0 (0.0%) | 0.0 |
| 20 to 34 years | 0 (0.0%) | 0.0 |
| 35 to 50 years | 5 (100.0%) | 83.0 |
| Total | 5 (100.0%) | 43.0 |
Fertility by Age by Marriage Status in Norfolk
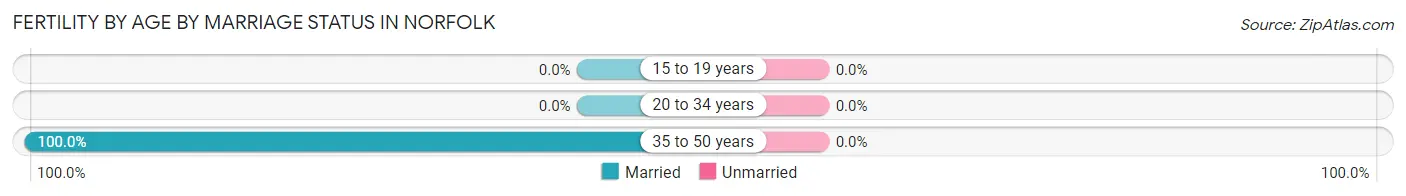
| Age Bracket | Married | Unmarried |
| 15 to 19 years | 0 (0.0%) | 0 (0.0%) |
| 20 to 34 years | 0 (0.0%) | 0 (0.0%) |
| 35 to 50 years | 5 (100.0%) | 0 (0.0%) |
| Total | 5 (100.0%) | 0 (0.0%) |
Fertility by Education in Norfolk
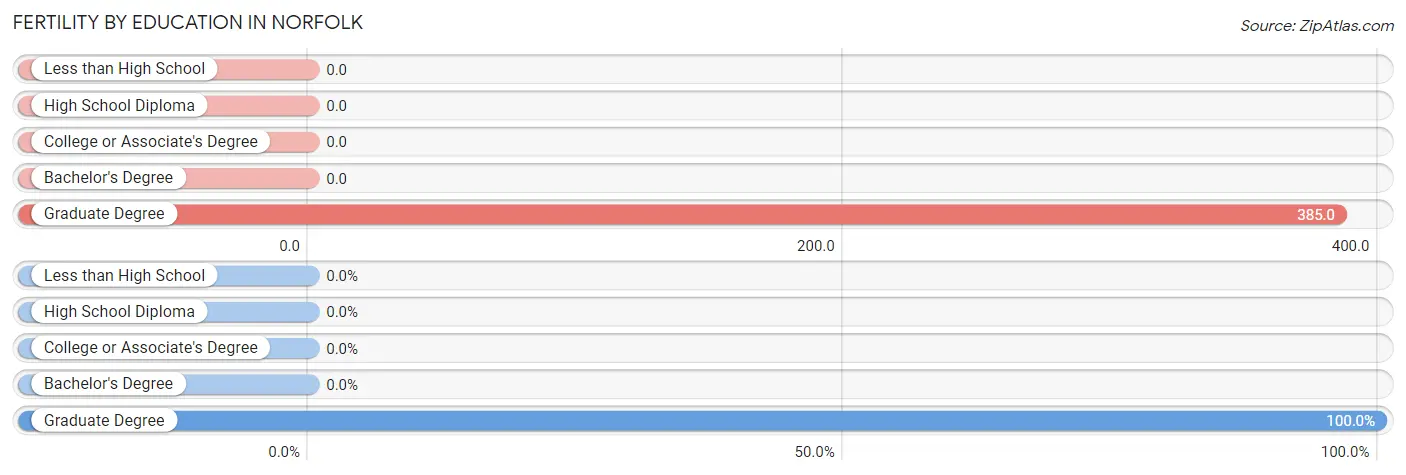
| Educational Attainment | Women with Births | Births / 1,000 Women |
| Less than High School | 0 (0.0%) | 0.0 |
| High School Diploma | 0 (0.0%) | 0.0 |
| College or Associate's Degree | 0 (0.0%) | 0.0 |
| Bachelor's Degree | 0 (0.0%) | 0.0 |
| Graduate Degree | 5 (100.0%) | 385.0 |
| Total | 5 (100.0%) | 43.0 |
Fertility by Education by Marriage Status in Norfolk
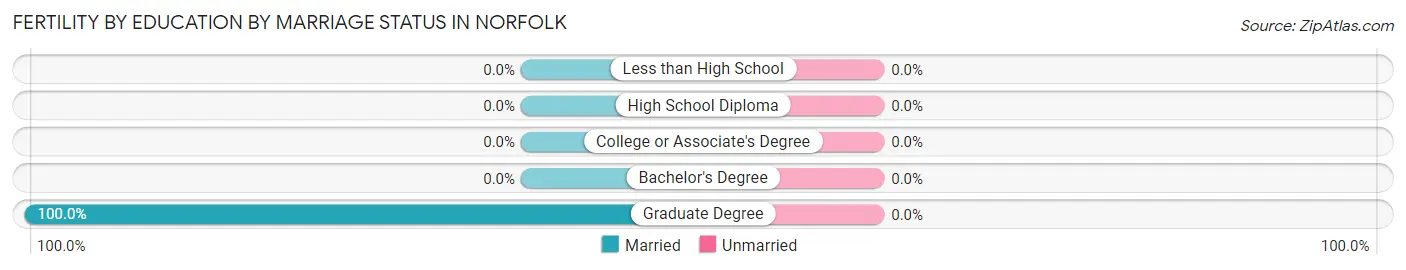
| Educational Attainment | Married | Unmarried |
| Less than High School | 0 (0.0%) | 0 (0.0%) |
| High School Diploma | 0 (0.0%) | 0 (0.0%) |
| College or Associate's Degree | 0 (0.0%) | 0 (0.0%) |
| Bachelor's Degree | 0 (0.0%) | 0 (0.0%) |
| Graduate Degree | 5 (100.0%) | 0 (0.0%) |
| Total | 5 (100.0%) | 0 (0.0%) |
Employment Characteristics in Norfolk
Employment by Class of Employer in Norfolk
Among the 338 employed individuals in Norfolk, private company employees (215 | 63.6%), not-for-profit organizations (29 | 8.6%), and state government employees (28 | 8.3%) make up the most common classes of employment.
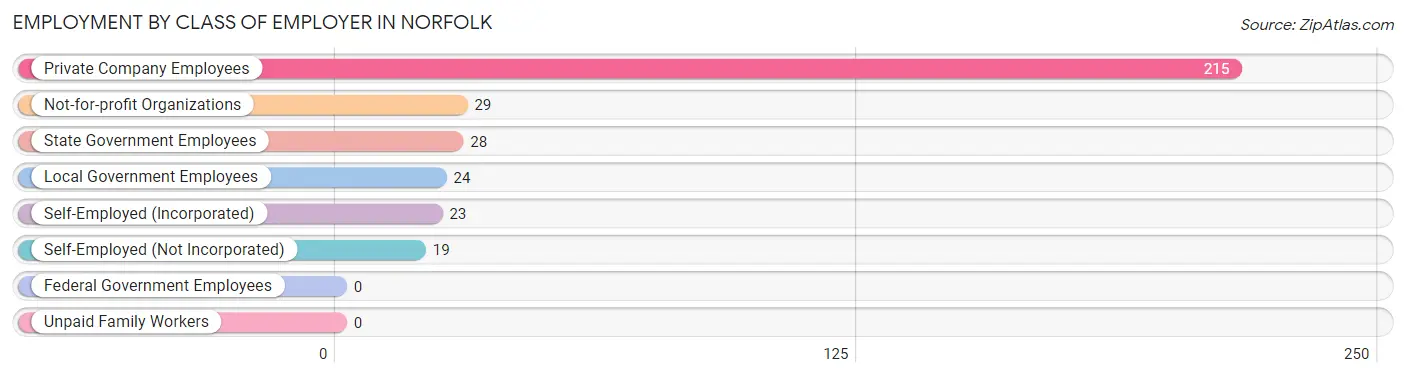
| Employer Class | # Employees | % Employees |
| Private Company Employees | 215 | 63.6% |
| Self-Employed (Incorporated) | 23 | 6.8% |
| Self-Employed (Not Incorporated) | 19 | 5.6% |
| Not-for-profit Organizations | 29 | 8.6% |
| Local Government Employees | 24 | 7.1% |
| State Government Employees | 28 | 8.3% |
| Federal Government Employees | 0 | 0.0% |
| Unpaid Family Workers | 0 | 0.0% |
| Total | 338 | 100.0% |
Employment Status by Age in Norfolk
According to the labor force statistics for Norfolk, out of the total population over 16 years of age (569), 63.1% or 359 individuals are in the labor force, with 2.2% or 8 of them unemployed. The age group with the highest labor force participation rate is 30 to 34 years, with 92.9% or 26 individuals in the labor force. Within the labor force, the 65 to 74 years age range has the highest percentage of unemployed individuals, with 17.6% or 3 of them being unemployed.
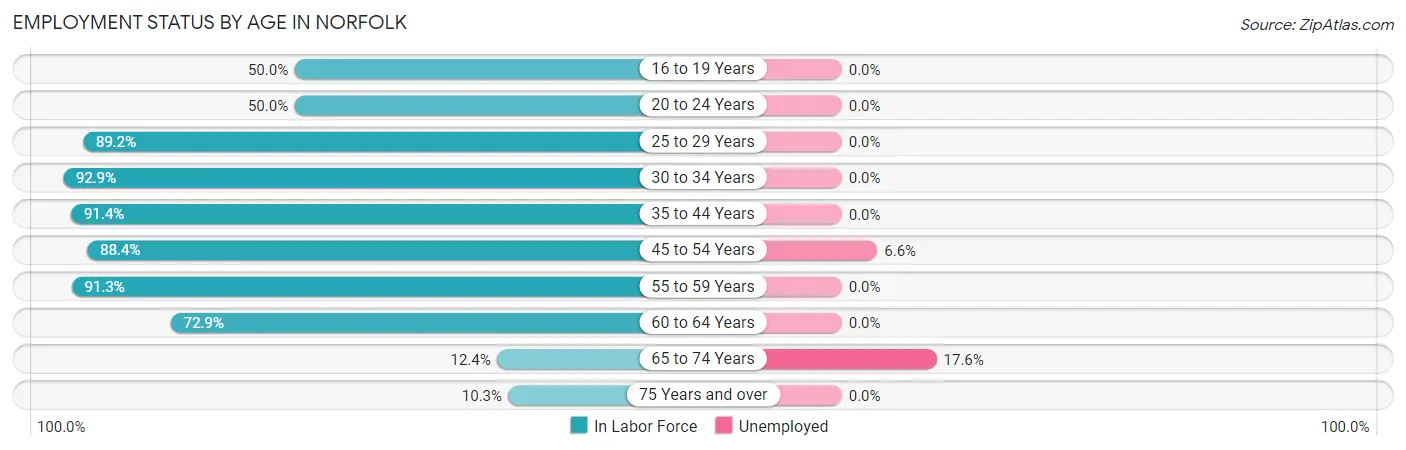
| Age Bracket | In Labor Force | Unemployed |
| 16 to 19 Years | 4 (50.0%) | 0 (0.0%) |
| 20 to 24 Years | 3 (50.0%) | 0 (0.0%) |
| 25 to 29 Years | 91 (89.2%) | 0 (0.0%) |
| 30 to 34 Years | 26 (92.9%) | 0 (0.0%) |
| 35 to 44 Years | 74 (91.4%) | 0 (0.0%) |
| 45 to 54 Years | 76 (88.4%) | 5 (6.6%) |
| 55 to 59 Years | 21 (91.3%) | 0 (0.0%) |
| 60 to 64 Years | 43 (72.9%) | 0 (0.0%) |
| 65 to 74 Years | 17 (12.4%) | 3 (17.6%) |
| 75 Years and over | 4 (10.3%) | 0 (0.0%) |
| Total | 359 (63.1%) | 8 (2.2%) |
Employment Status by Educational Attainment in Norfolk
According to labor force statistics for Norfolk, 87.3% of individuals (331) out of the total population between 25 and 64 years of age (379) are in the labor force, with 1.5% or 5 of them being unemployed. The group with the highest labor force participation rate are those with the educational attainment of college / associate degree, with 91.0% or 132 individuals in the labor force. Within the labor force, individuals with high school diploma education have the highest percentage of unemployment, with 8.6% or 5 of them being unemployed.
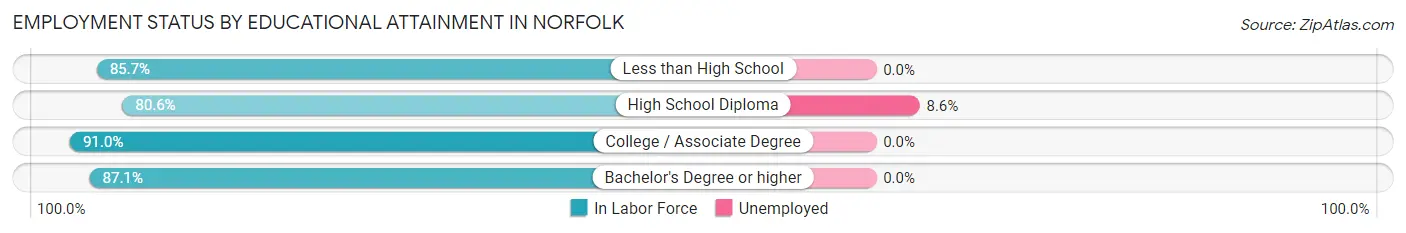
| Educational Attainment | In Labor Force | Unemployed |
| Less than High School | 6 (85.7%) | 0 (0.0%) |
| High School Diploma | 58 (80.6%) | 6 (8.6%) |
| College / Associate Degree | 132 (91.0%) | 0 (0.0%) |
| Bachelor's Degree or higher | 135 (87.1%) | 0 (0.0%) |
| Total | 331 (87.3%) | 6 (1.5%) |
Employment Occupations by Sex in Norfolk
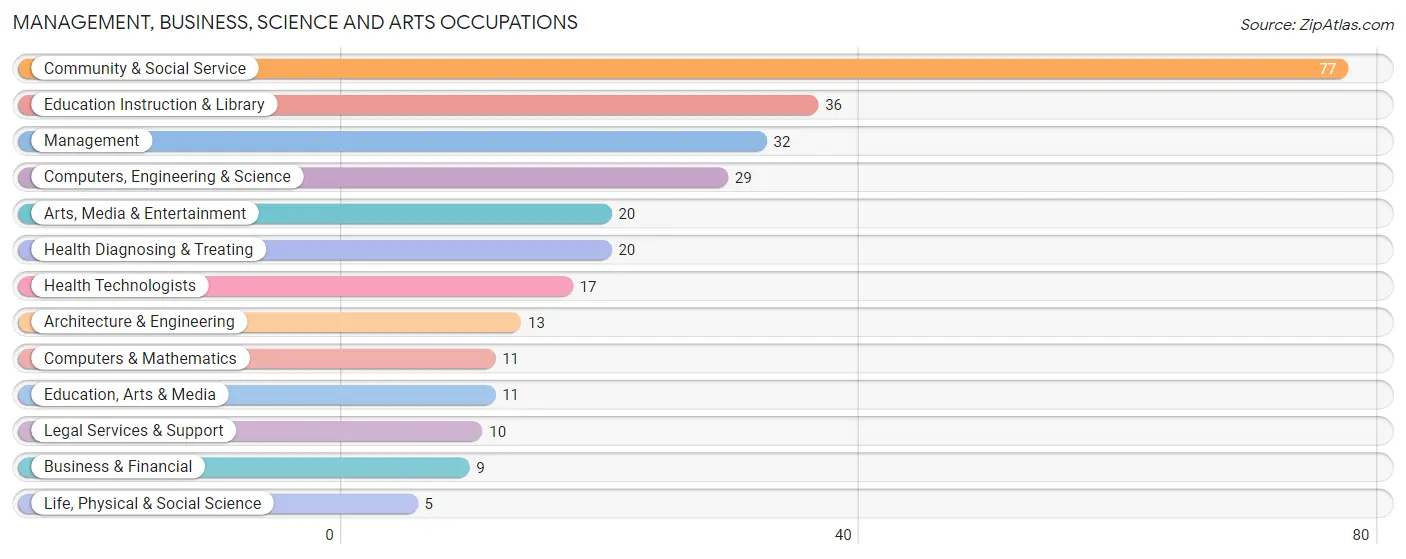
Management, Business, Science and Arts Occupations
The most common Management, Business, Science and Arts occupations in Norfolk are Community & Social Service (77 | 21.9%), Education Instruction & Library (36 | 10.3%), Management (32 | 9.1%), Computers, Engineering & Science (29 | 8.3%), and Arts, Media & Entertainment (20 | 5.7%).
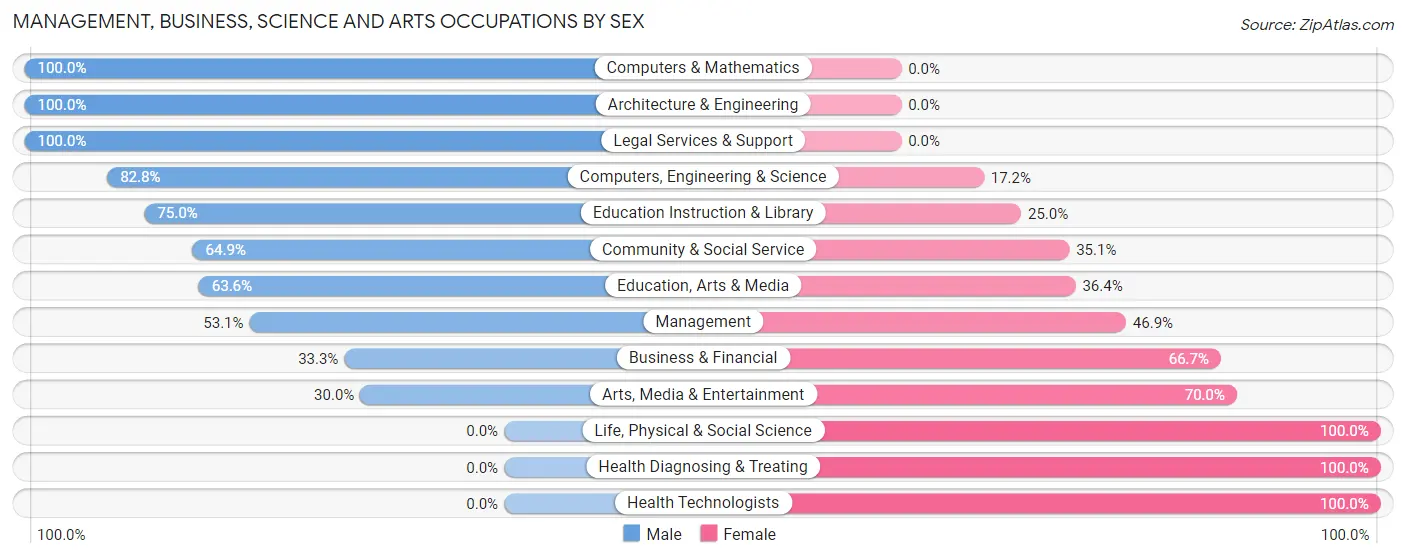
Management, Business, Science and Arts Occupations by Sex
Within the Management, Business, Science and Arts occupations in Norfolk, the most male-oriented occupations are Computers & Mathematics (100.0%), Architecture & Engineering (100.0%), and Legal Services & Support (100.0%), while the most female-oriented occupations are Life, Physical & Social Science (100.0%), Health Diagnosing & Treating (100.0%), and Health Technologists (100.0%).
| Occupation | Male | Female |
| Management | 17 (53.1%) | 15 (46.9%) |
| Business & Financial | 3 (33.3%) | 6 (66.7%) |
| Computers, Engineering & Science | 24 (82.8%) | 5 (17.2%) |
| Computers & Mathematics | 11 (100.0%) | 0 (0.0%) |
| Architecture & Engineering | 13 (100.0%) | 0 (0.0%) |
| Life, Physical & Social Science | 0 (0.0%) | 5 (100.0%) |
| Community & Social Service | 50 (64.9%) | 27 (35.1%) |
| Education, Arts & Media | 7 (63.6%) | 4 (36.4%) |
| Legal Services & Support | 10 (100.0%) | 0 (0.0%) |
| Education Instruction & Library | 27 (75.0%) | 9 (25.0%) |
| Arts, Media & Entertainment | 6 (30.0%) | 14 (70.0%) |
| Health Diagnosing & Treating | 0 (0.0%) | 20 (100.0%) |
| Health Technologists | 0 (0.0%) | 17 (100.0%) |
| Total (Category) | 94 (56.3%) | 73 (43.7%) |
| Total (Overall) | 197 (56.1%) | 154 (43.9%) |
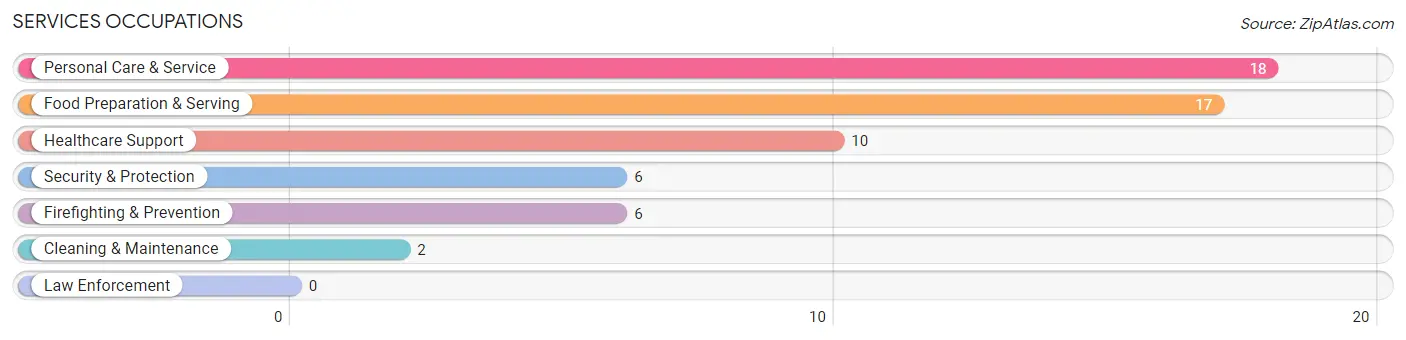
Services Occupations
The most common Services occupations in Norfolk are Personal Care & Service (18 | 5.1%), Food Preparation & Serving (17 | 4.8%), Healthcare Support (10 | 2.9%), Security & Protection (6 | 1.7%), and Firefighting & Prevention (6 | 1.7%).
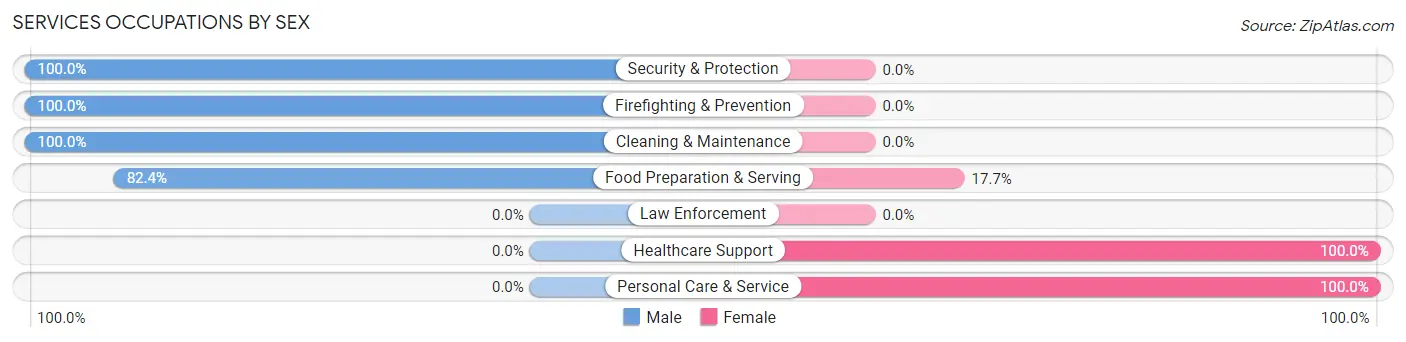
Services Occupations by Sex
Within the Services occupations in Norfolk, the most male-oriented occupations are Security & Protection (100.0%), Firefighting & Prevention (100.0%), and Cleaning & Maintenance (100.0%), while the most female-oriented occupations are Healthcare Support (100.0%), Personal Care & Service (100.0%), and Food Preparation & Serving (17.6%).
| Occupation | Male | Female |
| Healthcare Support | 0 (0.0%) | 10 (100.0%) |
| Security & Protection | 6 (100.0%) | 0 (0.0%) |
| Firefighting & Prevention | 6 (100.0%) | 0 (0.0%) |
| Law Enforcement | 0 (0.0%) | 0 (0.0%) |
| Food Preparation & Serving | 14 (82.4%) | 3 (17.6%) |
| Cleaning & Maintenance | 2 (100.0%) | 0 (0.0%) |
| Personal Care & Service | 0 (0.0%) | 18 (100.0%) |
| Total (Category) | 22 (41.5%) | 31 (58.5%) |
| Total (Overall) | 197 (56.1%) | 154 (43.9%) |
Sales and Office Occupations
The most common Sales and Office occupations in Norfolk are Office & Administration (33 | 9.4%), and Sales & Related (17 | 4.8%).
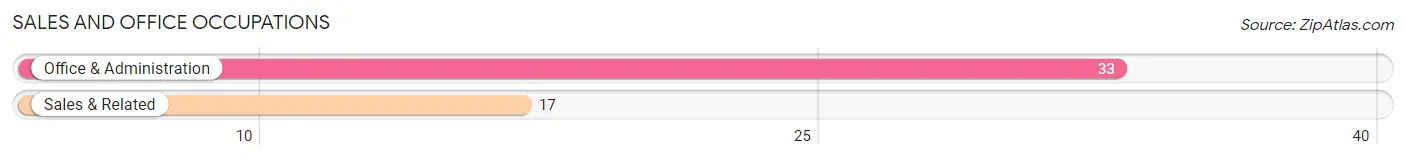
Sales and Office Occupations by Sex
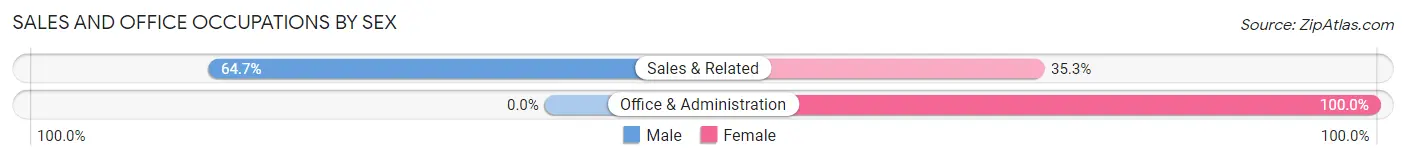
| Occupation | Male | Female |
| Sales & Related | 11 (64.7%) | 6 (35.3%) |
| Office & Administration | 0 (0.0%) | 33 (100.0%) |
| Total (Category) | 11 (22.0%) | 39 (78.0%) |
| Total (Overall) | 197 (56.1%) | 154 (43.9%) |
Natural Resources, Construction and Maintenance Occupations
The most common Natural Resources, Construction and Maintenance occupations in Norfolk are Construction & Extraction (7 | 2.0%), and Installation, Maintenance & Repair (3 | 0.9%).
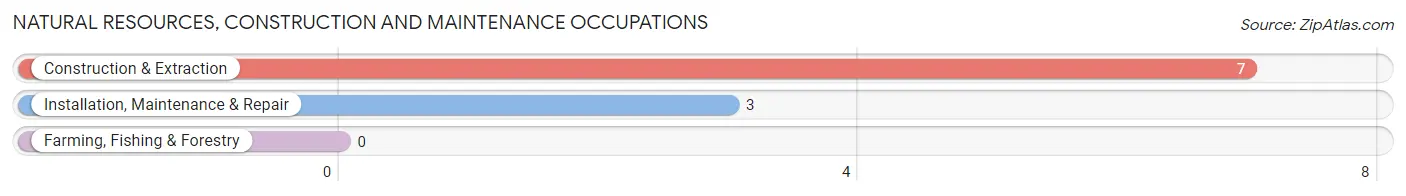
Natural Resources, Construction and Maintenance Occupations by Sex
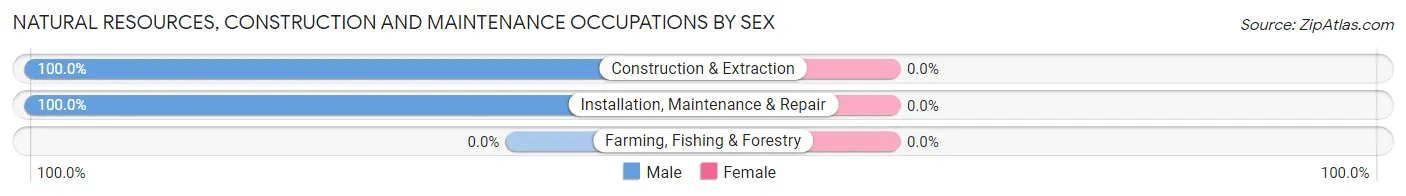
| Occupation | Male | Female |
| Farming, Fishing & Forestry | 0 (0.0%) | 0 (0.0%) |
| Construction & Extraction | 7 (100.0%) | 0 (0.0%) |
| Installation, Maintenance & Repair | 3 (100.0%) | 0 (0.0%) |
| Total (Category) | 10 (100.0%) | 0 (0.0%) |
| Total (Overall) | 197 (56.1%) | 154 (43.9%) |
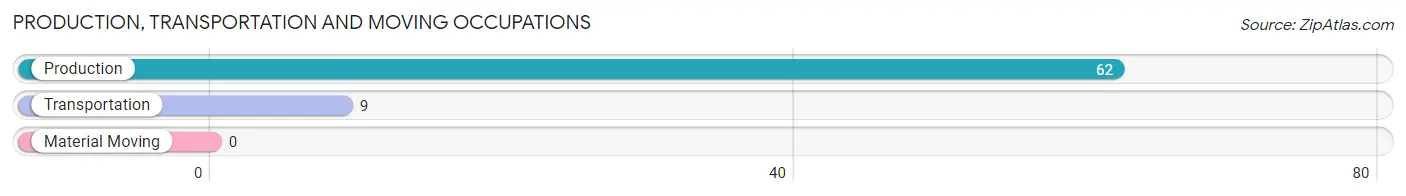
Production, Transportation and Moving Occupations
The most common Production, Transportation and Moving occupations in Norfolk are Production (62 | 17.7%), and Transportation (9 | 2.6%).
Production, Transportation and Moving Occupations by Sex
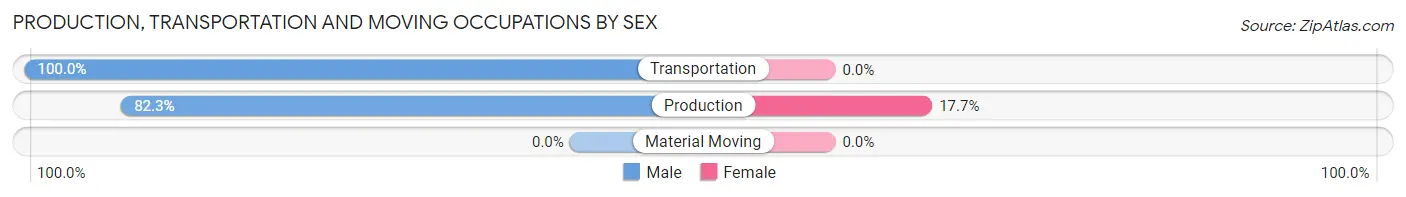
| Occupation | Male | Female |
| Production | 51 (82.3%) | 11 (17.7%) |
| Transportation | 9 (100.0%) | 0 (0.0%) |
| Material Moving | 0 (0.0%) | 0 (0.0%) |
| Total (Category) | 60 (84.5%) | 11 (15.5%) |
| Total (Overall) | 197 (56.1%) | 154 (43.9%) |
Employment Industries by Sex in Norfolk
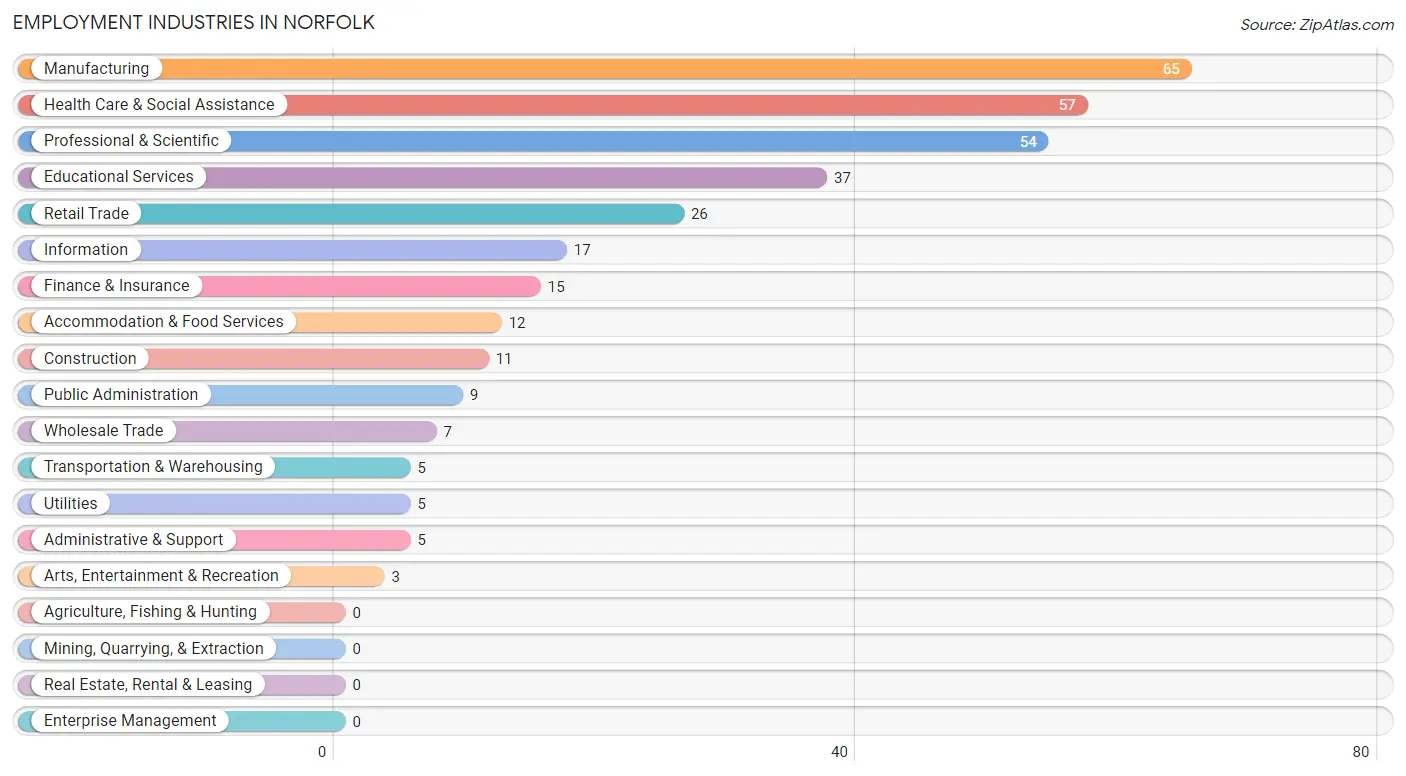
Employment Industries in Norfolk
The major employment industries in Norfolk include Manufacturing (65 | 18.5%), Health Care & Social Assistance (57 | 16.2%), Professional & Scientific (54 | 15.4%), Educational Services (37 | 10.5%), and Retail Trade (26 | 7.4%).
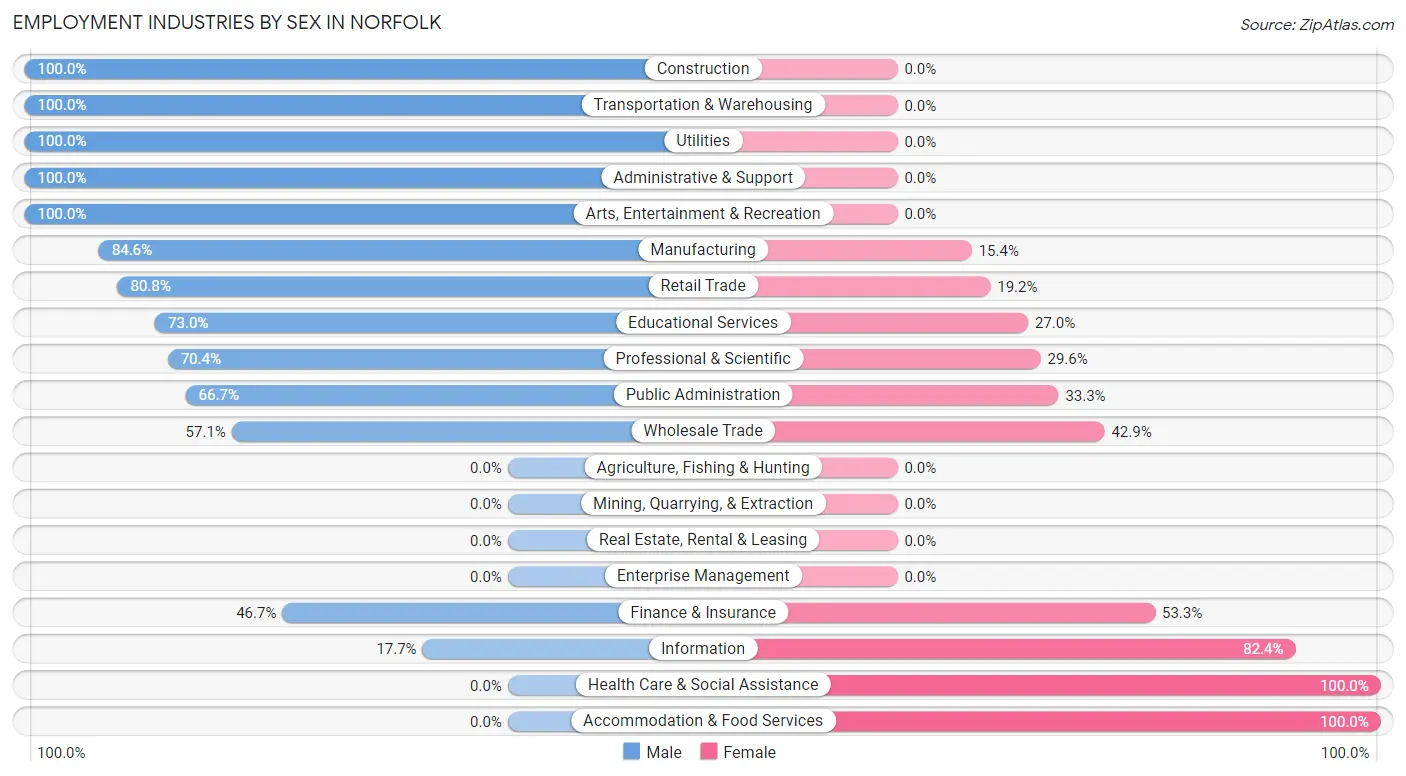
Employment Industries by Sex in Norfolk
The Norfolk industries that see more men than women are Construction (100.0%), Transportation & Warehousing (100.0%), and Utilities (100.0%), whereas the industries that tend to have a higher number of women are Health Care & Social Assistance (100.0%), Accommodation & Food Services (100.0%), and Information (82.4%).
| Industry | Male | Female |
| Agriculture, Fishing & Hunting | 0 (0.0%) | 0 (0.0%) |
| Mining, Quarrying, & Extraction | 0 (0.0%) | 0 (0.0%) |
| Construction | 11 (100.0%) | 0 (0.0%) |
| Manufacturing | 55 (84.6%) | 10 (15.4%) |
| Wholesale Trade | 4 (57.1%) | 3 (42.9%) |
| Retail Trade | 21 (80.8%) | 5 (19.2%) |
| Transportation & Warehousing | 5 (100.0%) | 0 (0.0%) |
| Utilities | 5 (100.0%) | 0 (0.0%) |
| Information | 3 (17.6%) | 14 (82.4%) |
| Finance & Insurance | 7 (46.7%) | 8 (53.3%) |
| Real Estate, Rental & Leasing | 0 (0.0%) | 0 (0.0%) |
| Professional & Scientific | 38 (70.4%) | 16 (29.6%) |
| Enterprise Management | 0 (0.0%) | 0 (0.0%) |
| Administrative & Support | 5 (100.0%) | 0 (0.0%) |
| Educational Services | 27 (73.0%) | 10 (27.0%) |
| Health Care & Social Assistance | 0 (0.0%) | 57 (100.0%) |
| Arts, Entertainment & Recreation | 3 (100.0%) | 0 (0.0%) |
| Accommodation & Food Services | 0 (0.0%) | 12 (100.0%) |
| Public Administration | 6 (66.7%) | 3 (33.3%) |
| Total | 197 (56.1%) | 154 (43.9%) |
Education in Norfolk
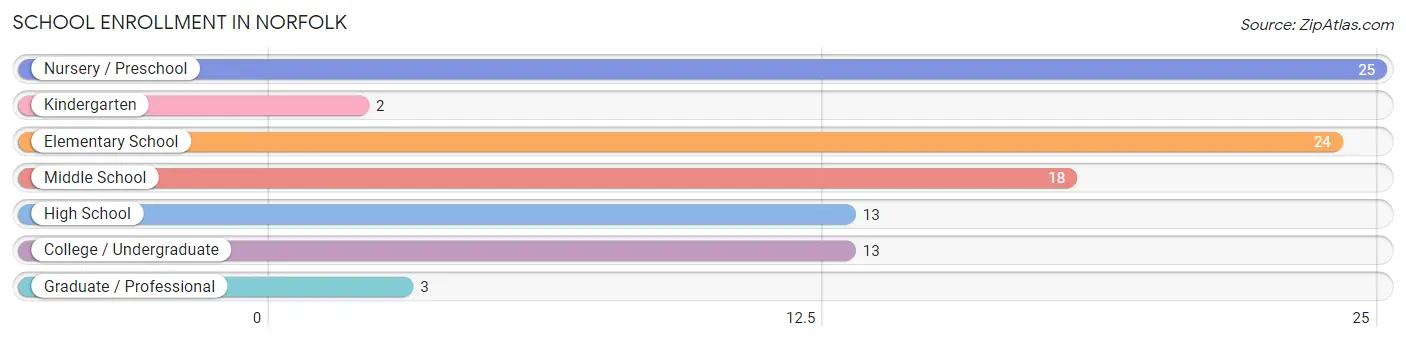
School Enrollment in Norfolk
The most common levels of schooling among the 98 students in Norfolk are nursery / preschool (25 | 25.5%), elementary school (24 | 24.5%), and middle school (18 | 18.4%).
| School Level | # Students | % Students |
| Nursery / Preschool | 25 | 25.5% |
| Kindergarten | 2 | 2.0% |
| Elementary School | 24 | 24.5% |
| Middle School | 18 | 18.4% |
| High School | 13 | 13.3% |
| College / Undergraduate | 13 | 13.3% |
| Graduate / Professional | 3 | 3.1% |
| Total | 98 | 100.0% |
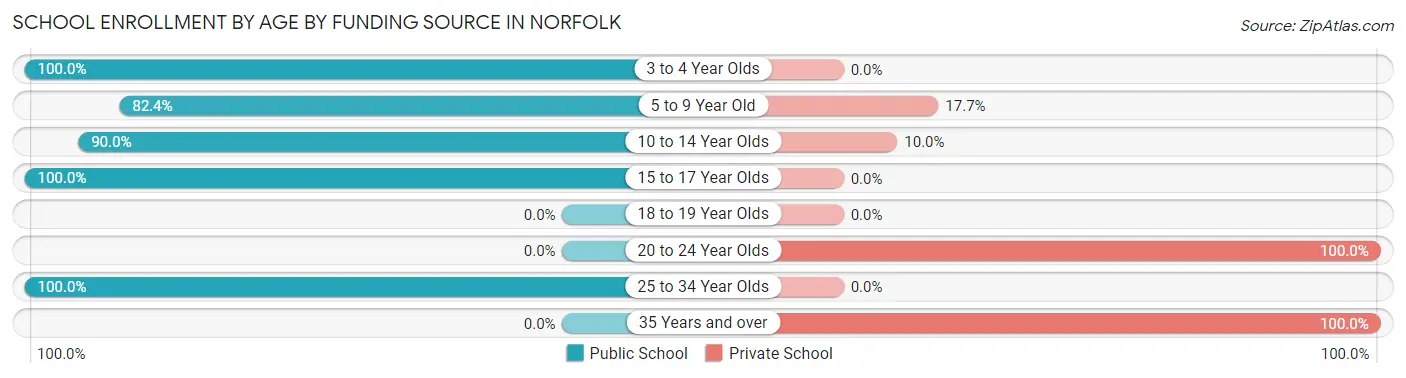
School Enrollment by Age by Funding Source in Norfolk
Out of a total of 98 students who are enrolled in schools in Norfolk, 14 (14.3%) attend a private institution, while the remaining 84 (85.7%) are enrolled in public schools. The age group of 20 to 24 year olds has the highest likelihood of being enrolled in private schools, with 3 (100.0% in the age bracket) enrolled. Conversely, the age group of 3 to 4 year olds has the lowest likelihood of being enrolled in a private school, with 15 (100.0% in the age bracket) attending a public institution.
| Age Bracket | Public School | Private School |
| 3 to 4 Year Olds | 15 (100.0%) | 0 (0.0%) |
| 5 to 9 Year Old | 28 (82.4%) | 6 (17.6%) |
| 10 to 14 Year Olds | 18 (90.0%) | 2 (10.0%) |
| 15 to 17 Year Olds | 13 (100.0%) | 0 (0.0%) |
| 18 to 19 Year Olds | 0 (0.0%) | 0 (0.0%) |
| 20 to 24 Year Olds | 0 (0.0%) | 3 (100.0%) |
| 25 to 34 Year Olds | 10 (100.0%) | 0 (0.0%) |
| 35 Years and over | 0 (0.0%) | 3 (100.0%) |
| Total | 84 (85.7%) | 14 (14.3%) |
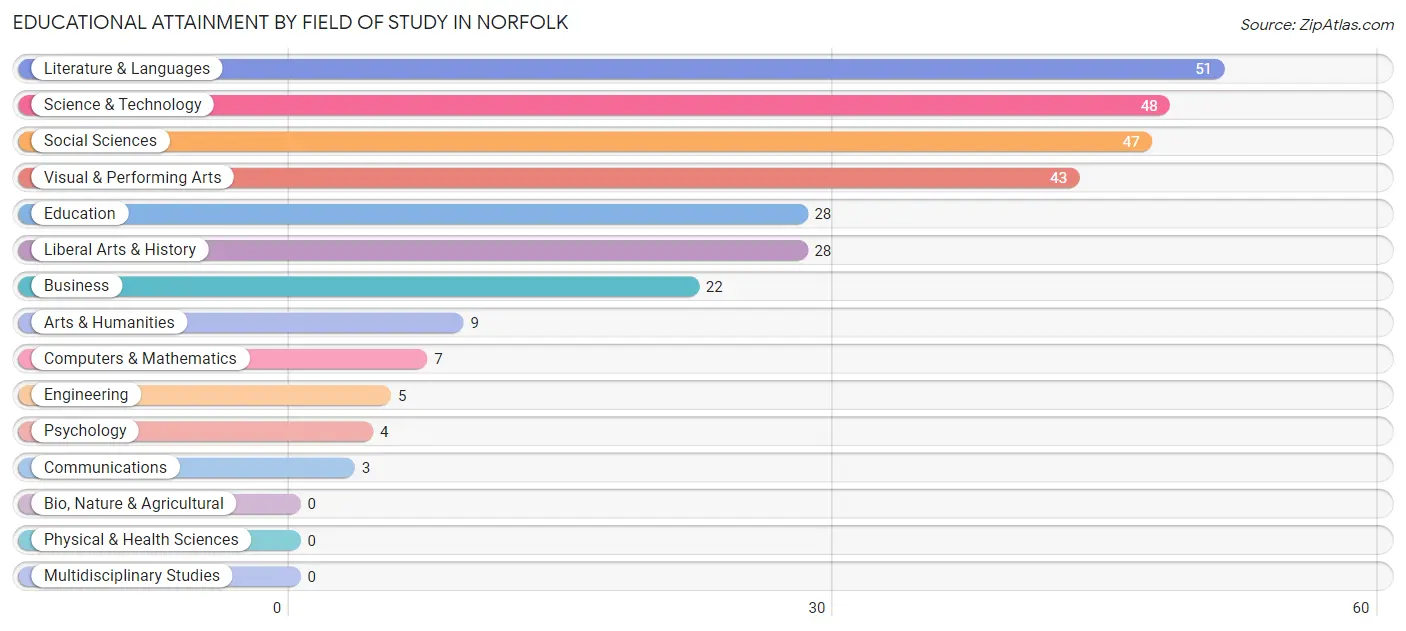
Educational Attainment by Field of Study in Norfolk
Literature & languages (51 | 17.3%), science & technology (48 | 16.3%), social sciences (47 | 15.9%), visual & performing arts (43 | 14.6%), and education (28 | 9.5%) are the most common fields of study among 295 individuals in Norfolk who have obtained a bachelor's degree or higher.
| Field of Study | # Graduates | % Graduates |
| Computers & Mathematics | 7 | 2.4% |
| Bio, Nature & Agricultural | 0 | 0.0% |
| Physical & Health Sciences | 0 | 0.0% |
| Psychology | 4 | 1.4% |
| Social Sciences | 47 | 15.9% |
| Engineering | 5 | 1.7% |
| Multidisciplinary Studies | 0 | 0.0% |
| Science & Technology | 48 | 16.3% |
| Business | 22 | 7.5% |
| Education | 28 | 9.5% |
| Literature & Languages | 51 | 17.3% |
| Liberal Arts & History | 28 | 9.5% |
| Visual & Performing Arts | 43 | 14.6% |
| Communications | 3 | 1.0% |
| Arts & Humanities | 9 | 3.0% |
| Total | 295 | 100.0% |
Transportation & Commute in Norfolk
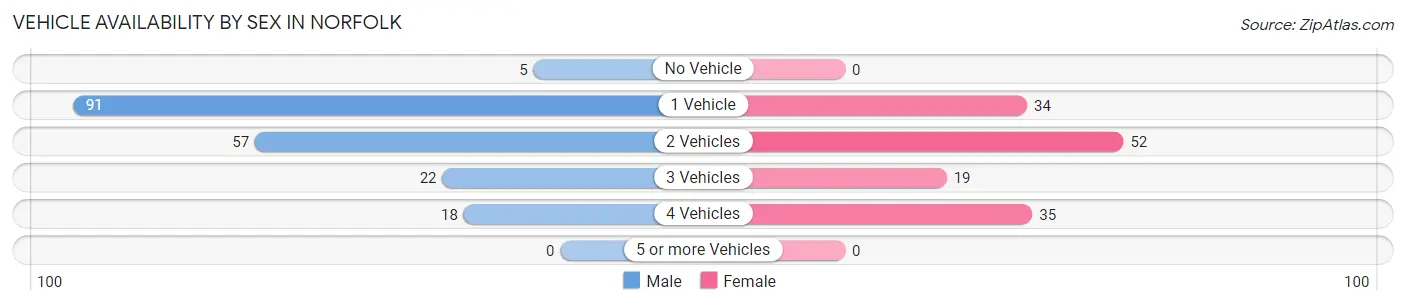
Vehicle Availability by Sex in Norfolk
The most prevalent vehicle ownership categories in Norfolk are males with 1 vehicle (91, accounting for 47.1%) and females with 1 vehicle (34, making up 65.0%).
| Vehicles Available | Male | Female |
| No Vehicle | 5 (2.6%) | 0 (0.0%) |
| 1 Vehicle | 91 (47.1%) | 34 (24.3%) |
| 2 Vehicles | 57 (29.5%) | 52 (37.1%) |
| 3 Vehicles | 22 (11.4%) | 19 (13.6%) |
| 4 Vehicles | 18 (9.3%) | 35 (25.0%) |
| 5 or more Vehicles | 0 (0.0%) | 0 (0.0%) |
| Total | 193 (100.0%) | 140 (100.0%) |
Commute Time in Norfolk
The most frequently occuring commute durations in Norfolk are 25 to 29 minutes (77 commuters, 29.6%), less than 5 minutes (39 commuters, 15.0%), and 20 to 24 minutes (38 commuters, 14.6%).

| Commute Time | # Commuters | % Commuters |
| Less than 5 Minutes | 39 | 15.0% |
| 5 to 9 Minutes | 3 | 1.1% |
| 10 to 14 Minutes | 20 | 7.7% |
| 15 to 19 Minutes | 19 | 7.3% |
| 20 to 24 Minutes | 38 | 14.6% |
| 25 to 29 Minutes | 77 | 29.6% |
| 30 to 34 Minutes | 19 | 7.3% |
| 35 to 39 Minutes | 15 | 5.8% |
| 40 to 44 Minutes | 0 | 0.0% |
| 45 to 59 Minutes | 14 | 5.4% |
| 60 to 89 Minutes | 16 | 6.1% |
| 90 or more Minutes | 0 | 0.0% |
Commute Time by Sex in Norfolk
The most common commute times in Norfolk are 25 to 29 minutes (51 commuters, 35.9%) for males and 25 to 29 minutes (26 commuters, 22.0%) for females.
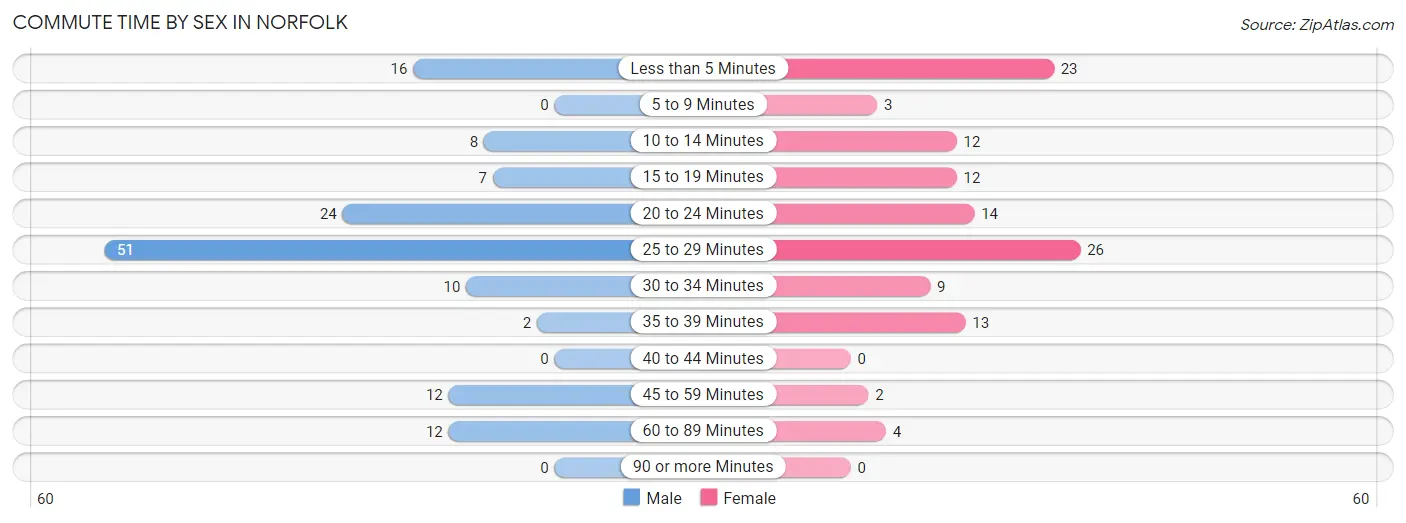
| Commute Time | Male | Female |
| Less than 5 Minutes | 16 (11.3%) | 23 (19.5%) |
| 5 to 9 Minutes | 0 (0.0%) | 3 (2.5%) |
| 10 to 14 Minutes | 8 (5.6%) | 12 (10.2%) |
| 15 to 19 Minutes | 7 (4.9%) | 12 (10.2%) |
| 20 to 24 Minutes | 24 (16.9%) | 14 (11.9%) |
| 25 to 29 Minutes | 51 (35.9%) | 26 (22.0%) |
| 30 to 34 Minutes | 10 (7.0%) | 9 (7.6%) |
| 35 to 39 Minutes | 2 (1.4%) | 13 (11.0%) |
| 40 to 44 Minutes | 0 (0.0%) | 0 (0.0%) |
| 45 to 59 Minutes | 12 (8.5%) | 2 (1.7%) |
| 60 to 89 Minutes | 12 (8.5%) | 4 (3.4%) |
| 90 or more Minutes | 0 (0.0%) | 0 (0.0%) |
Time of Departure to Work by Sex in Norfolk
The most frequent times of departure to work in Norfolk are 4:00 PM to 11:59 PM (48, 33.8%) for males and 8:00 AM to 8:29 AM (31, 26.3%) for females.
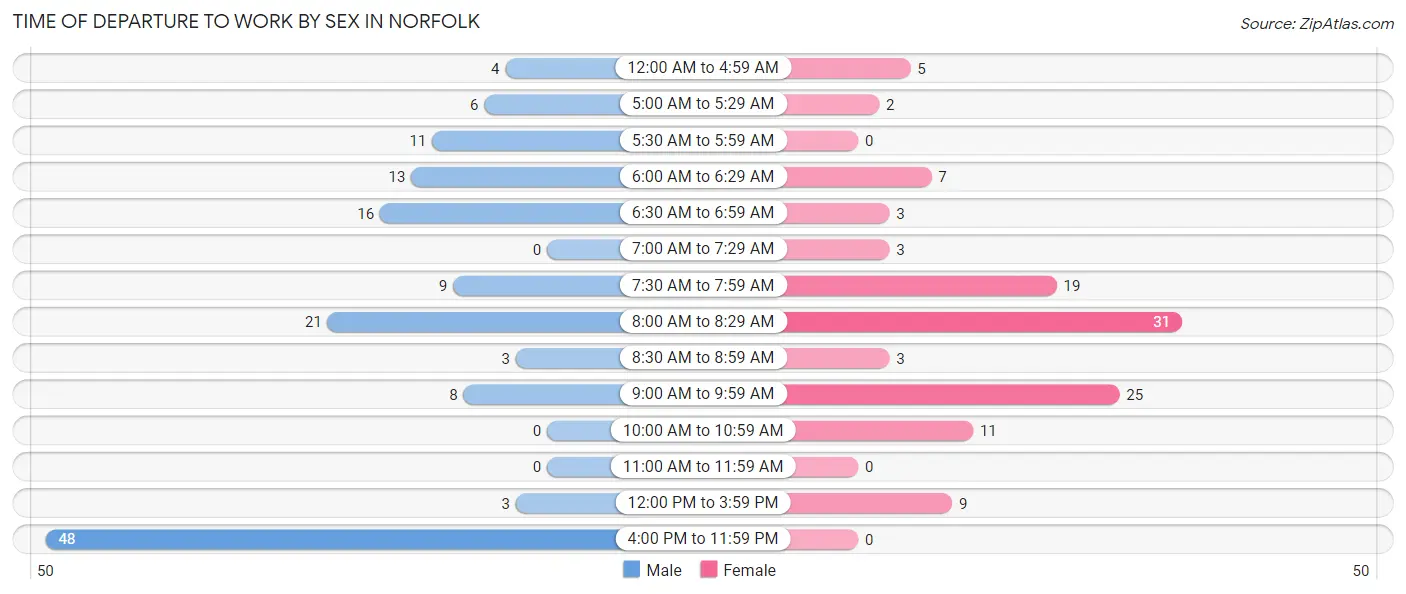
| Time of Departure | Male | Female |
| 12:00 AM to 4:59 AM | 4 (2.8%) | 5 (4.2%) |
| 5:00 AM to 5:29 AM | 6 (4.2%) | 2 (1.7%) |
| 5:30 AM to 5:59 AM | 11 (7.7%) | 0 (0.0%) |
| 6:00 AM to 6:29 AM | 13 (9.1%) | 7 (5.9%) |
| 6:30 AM to 6:59 AM | 16 (11.3%) | 3 (2.5%) |
| 7:00 AM to 7:29 AM | 0 (0.0%) | 3 (2.5%) |
| 7:30 AM to 7:59 AM | 9 (6.3%) | 19 (16.1%) |
| 8:00 AM to 8:29 AM | 21 (14.8%) | 31 (26.3%) |
| 8:30 AM to 8:59 AM | 3 (2.1%) | 3 (2.5%) |
| 9:00 AM to 9:59 AM | 8 (5.6%) | 25 (21.2%) |
| 10:00 AM to 10:59 AM | 0 (0.0%) | 11 (9.3%) |
| 11:00 AM to 11:59 AM | 0 (0.0%) | 0 (0.0%) |
| 12:00 PM to 3:59 PM | 3 (2.1%) | 9 (7.6%) |
| 4:00 PM to 11:59 PM | 48 (33.8%) | 0 (0.0%) |
| Total | 142 (100.0%) | 118 (100.0%) |
Housing Occupancy in Norfolk
Occupancy by Ownership in Norfolk
Of the total 314 dwellings in Norfolk, owner-occupied units account for 191 (60.8%), while renter-occupied units make up 123 (39.2%).
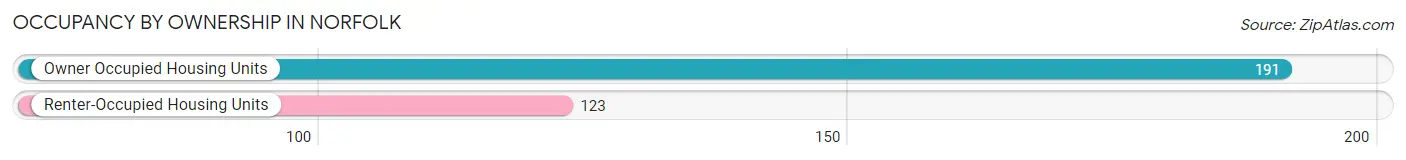
| Occupancy | # Housing Units | % Housing Units |
| Owner Occupied Housing Units | 191 | 60.8% |
| Renter-Occupied Housing Units | 123 | 39.2% |
| Total Occupied Housing Units | 314 | 100.0% |
Occupancy by Household Size in Norfolk
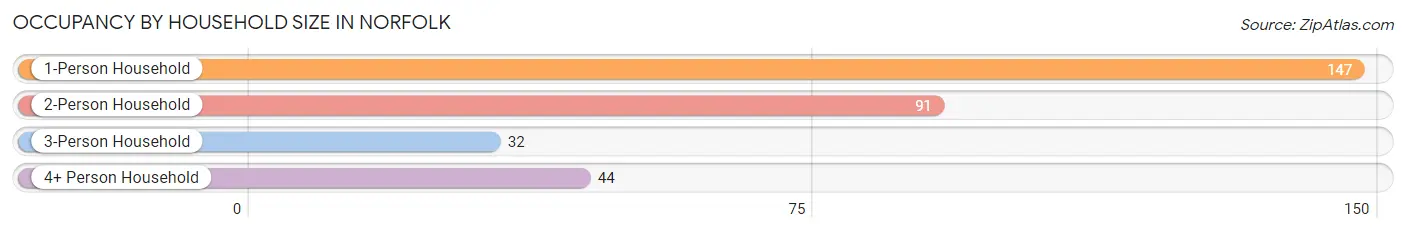
| Household Size | # Housing Units | % Housing Units |
| 1-Person Household | 147 | 46.8% |
| 2-Person Household | 91 | 29.0% |
| 3-Person Household | 32 | 10.2% |
| 4+ Person Household | 44 | 14.0% |
| Total Housing Units | 314 | 100.0% |
Occupancy by Ownership by Household Size in Norfolk
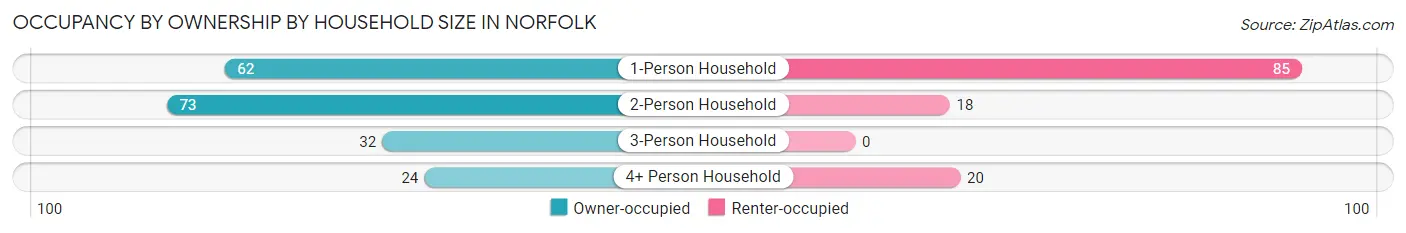
| Household Size | Owner-occupied | Renter-occupied |
| 1-Person Household | 62 (42.2%) | 85 (57.8%) |
| 2-Person Household | 73 (80.2%) | 18 (19.8%) |
| 3-Person Household | 32 (100.0%) | 0 (0.0%) |
| 4+ Person Household | 24 (54.5%) | 20 (45.5%) |
| Total Housing Units | 191 (60.8%) | 123 (39.2%) |
Occupancy by Educational Attainment in Norfolk
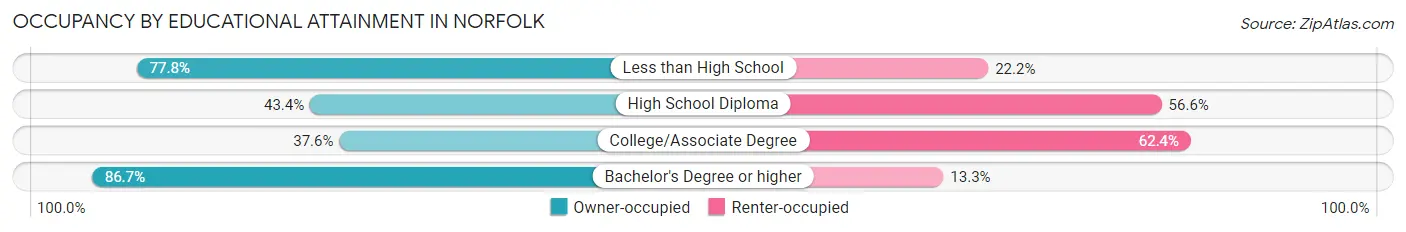
| Household Size | Owner-occupied | Renter-occupied |
| Less than High School | 7 (77.8%) | 2 (22.2%) |
| High School Diploma | 23 (43.4%) | 30 (56.6%) |
| College/Associate Degree | 44 (37.6%) | 73 (62.4%) |
| Bachelor's Degree or higher | 117 (86.7%) | 18 (13.3%) |
Occupancy by Age of Householder in Norfolk
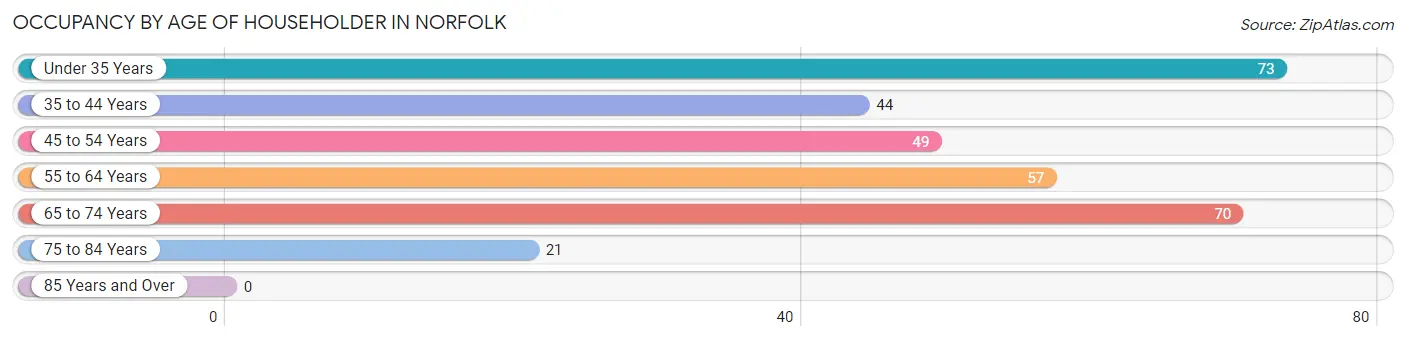
| Age Bracket | # Households | % Households |
| Under 35 Years | 73 | 23.3% |
| 35 to 44 Years | 44 | 14.0% |
| 45 to 54 Years | 49 | 15.6% |
| 55 to 64 Years | 57 | 18.1% |
| 65 to 74 Years | 70 | 22.3% |
| 75 to 84 Years | 21 | 6.7% |
| 85 Years and Over | 0 | 0.0% |
| Total | 314 | 100.0% |
Housing Finances in Norfolk
Median Income by Occupancy in Norfolk
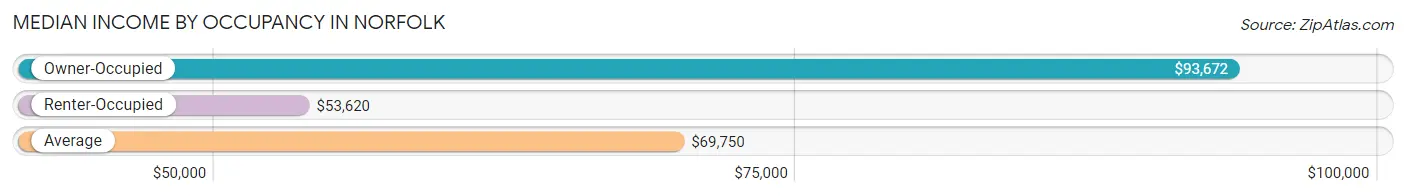
| Occupancy Type | # Households | Median Income |
| Owner-Occupied | 191 (60.8%) | $93,672 |
| Renter-Occupied | 123 (39.2%) | $53,620 |
| Average | 314 (100.0%) | $69,750 |
Occupancy by Householder Income Bracket in Norfolk
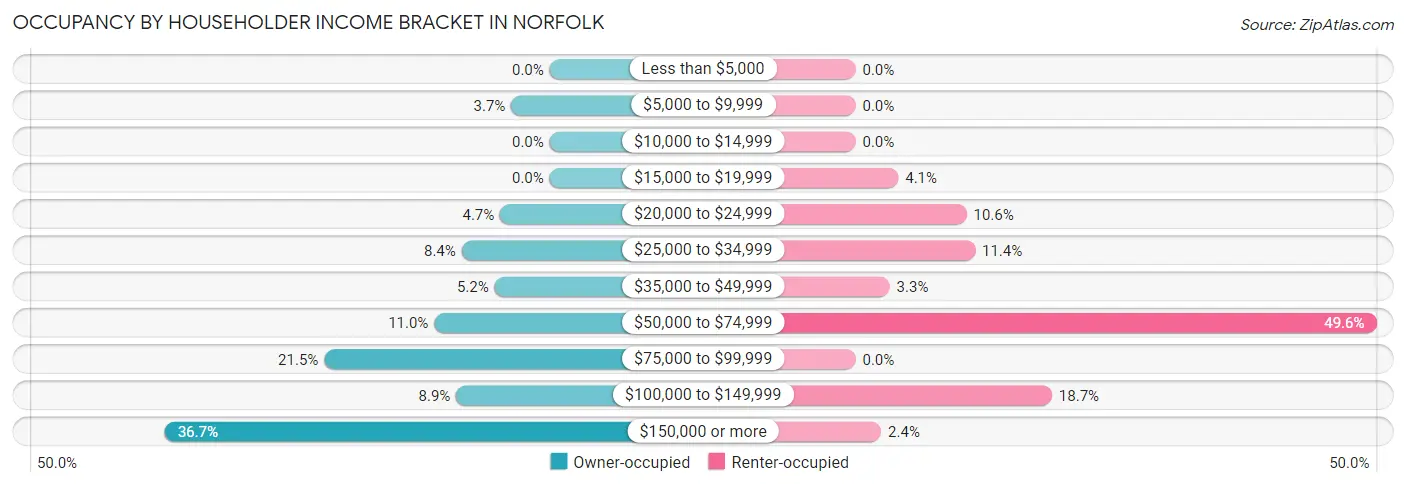
| Income Bracket | Owner-occupied | Renter-occupied |
| Less than $5,000 | 0 (0.0%) | 0 (0.0%) |
| $5,000 to $9,999 | 7 (3.7%) | 0 (0.0%) |
| $10,000 to $14,999 | 0 (0.0%) | 0 (0.0%) |
| $15,000 to $19,999 | 0 (0.0%) | 5 (4.1%) |
| $20,000 to $24,999 | 9 (4.7%) | 13 (10.6%) |
| $25,000 to $34,999 | 16 (8.4%) | 14 (11.4%) |
| $35,000 to $49,999 | 10 (5.2%) | 4 (3.3%) |
| $50,000 to $74,999 | 21 (11.0%) | 61 (49.6%) |
| $75,000 to $99,999 | 41 (21.5%) | 0 (0.0%) |
| $100,000 to $149,999 | 17 (8.9%) | 23 (18.7%) |
| $150,000 or more | 70 (36.6%) | 3 (2.4%) |
| Total | 191 (100.0%) | 123 (100.0%) |
Monthly Housing Cost Tiers in Norfolk
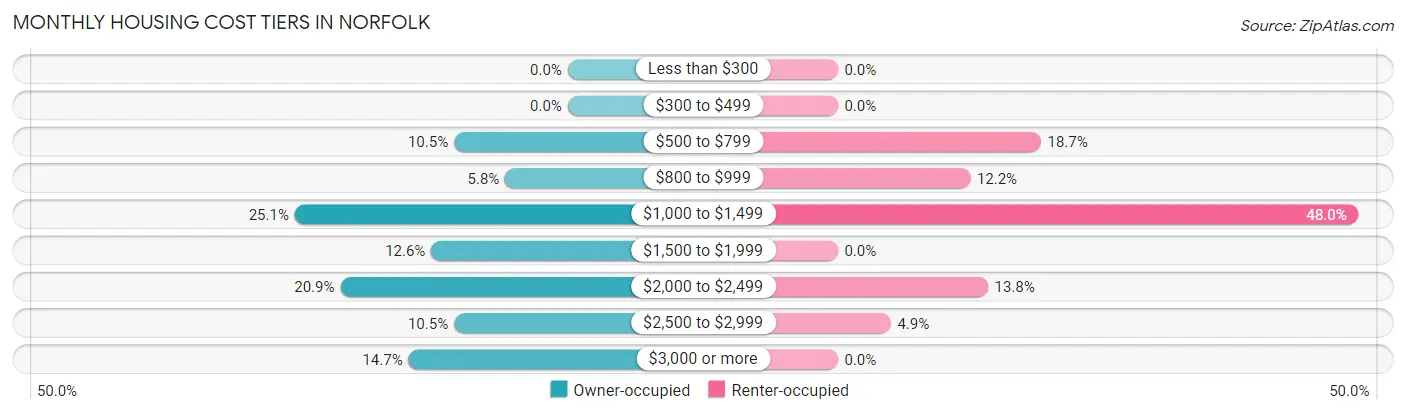
| Monthly Cost | Owner-occupied | Renter-occupied |
| Less than $300 | 0 (0.0%) | 0 (0.0%) |
| $300 to $499 | 0 (0.0%) | 0 (0.0%) |
| $500 to $799 | 20 (10.5%) | 23 (18.7%) |
| $800 to $999 | 11 (5.8%) | 15 (12.2%) |
| $1,000 to $1,499 | 48 (25.1%) | 59 (48.0%) |
| $1,500 to $1,999 | 24 (12.6%) | 0 (0.0%) |
| $2,000 to $2,499 | 40 (20.9%) | 17 (13.8%) |
| $2,500 to $2,999 | 20 (10.5%) | 6 (4.9%) |
| $3,000 or more | 28 (14.7%) | 0 (0.0%) |
| Total | 191 (100.0%) | 123 (100.0%) |
Physical Housing Characteristics in Norfolk
Housing Structures in Norfolk
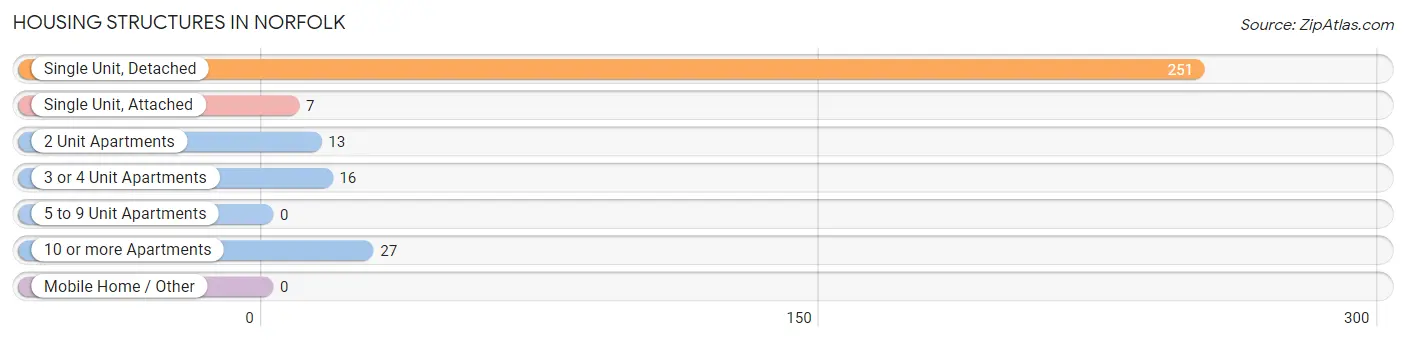
| Structure Type | # Housing Units | % Housing Units |
| Single Unit, Detached | 251 | 79.9% |
| Single Unit, Attached | 7 | 2.2% |
| 2 Unit Apartments | 13 | 4.1% |
| 3 or 4 Unit Apartments | 16 | 5.1% |
| 5 to 9 Unit Apartments | 0 | 0.0% |
| 10 or more Apartments | 27 | 8.6% |
| Mobile Home / Other | 0 | 0.0% |
| Total | 314 | 100.0% |
Housing Structures by Occupancy in Norfolk
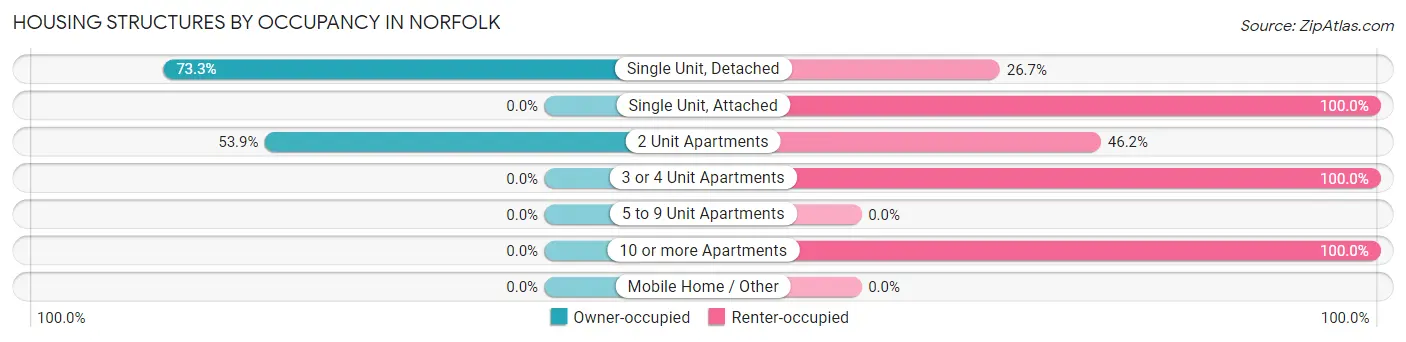
| Structure Type | Owner-occupied | Renter-occupied |
| Single Unit, Detached | 184 (73.3%) | 67 (26.7%) |
| Single Unit, Attached | 0 (0.0%) | 7 (100.0%) |
| 2 Unit Apartments | 7 (53.8%) | 6 (46.2%) |
| 3 or 4 Unit Apartments | 0 (0.0%) | 16 (100.0%) |
| 5 to 9 Unit Apartments | 0 (0.0%) | 0 (0.0%) |
| 10 or more Apartments | 0 (0.0%) | 27 (100.0%) |
| Mobile Home / Other | 0 (0.0%) | 0 (0.0%) |
| Total | 191 (60.8%) | 123 (39.2%) |
Housing Structures by Number of Rooms in Norfolk
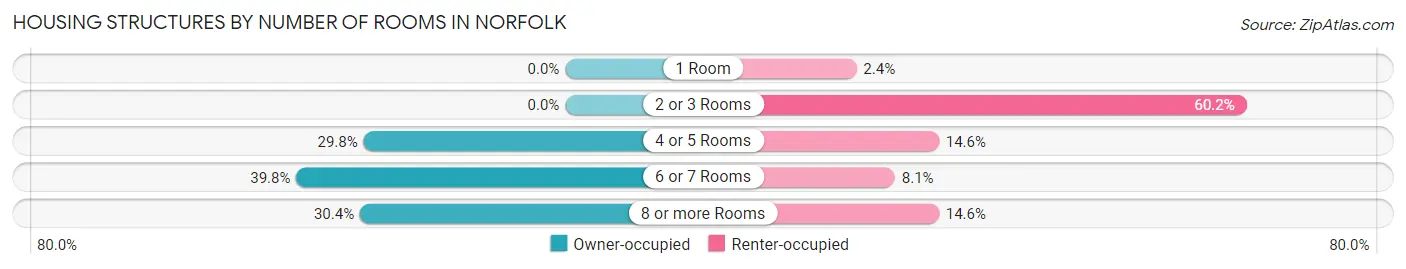
| Number of Rooms | Owner-occupied | Renter-occupied |
| 1 Room | 0 (0.0%) | 3 (2.4%) |
| 2 or 3 Rooms | 0 (0.0%) | 74 (60.2%) |
| 4 or 5 Rooms | 57 (29.8%) | 18 (14.6%) |
| 6 or 7 Rooms | 76 (39.8%) | 10 (8.1%) |
| 8 or more Rooms | 58 (30.4%) | 18 (14.6%) |
| Total | 191 (100.0%) | 123 (100.0%) |
Housing Structure by Heating Type in Norfolk
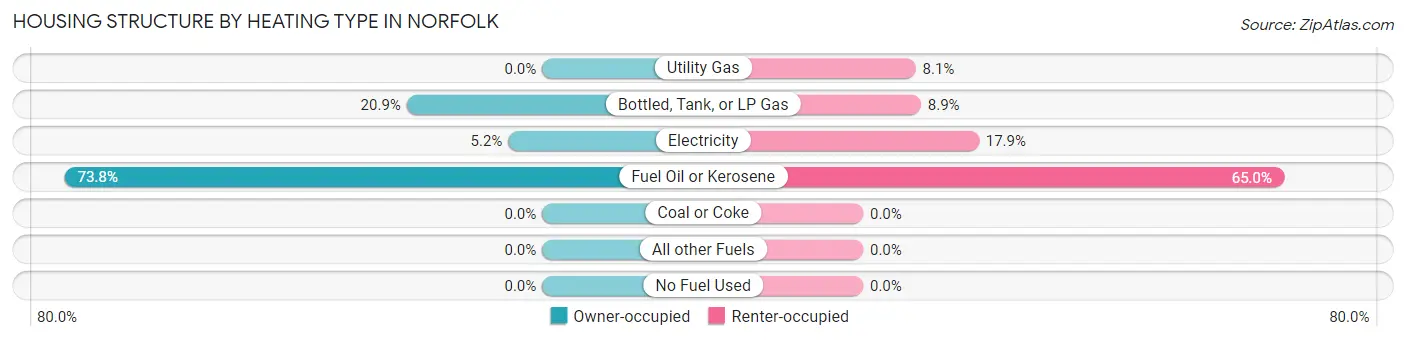
| Heating Type | Owner-occupied | Renter-occupied |
| Utility Gas | 0 (0.0%) | 10 (8.1%) |
| Bottled, Tank, or LP Gas | 40 (20.9%) | 11 (8.9%) |
| Electricity | 10 (5.2%) | 22 (17.9%) |
| Fuel Oil or Kerosene | 141 (73.8%) | 80 (65.0%) |
| Coal or Coke | 0 (0.0%) | 0 (0.0%) |
| All other Fuels | 0 (0.0%) | 0 (0.0%) |
| No Fuel Used | 0 (0.0%) | 0 (0.0%) |
| Total | 191 (100.0%) | 123 (100.0%) |
Household Vehicle Usage in Norfolk
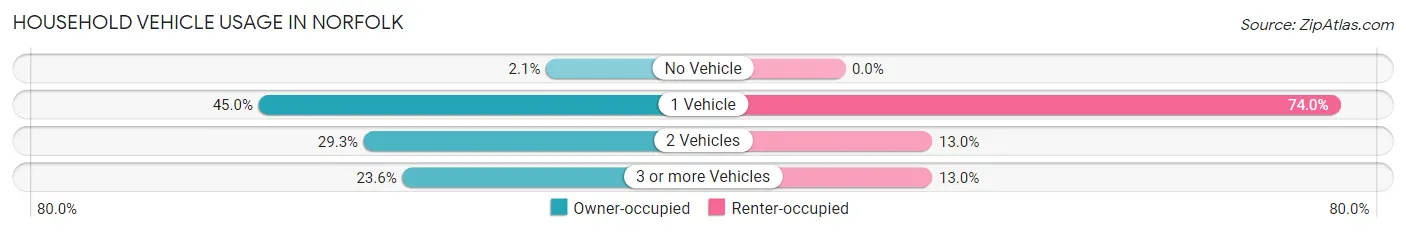
| Vehicles per Household | Owner-occupied | Renter-occupied |
| No Vehicle | 4 (2.1%) | 0 (0.0%) |
| 1 Vehicle | 86 (45.0%) | 91 (74.0%) |
| 2 Vehicles | 56 (29.3%) | 16 (13.0%) |
| 3 or more Vehicles | 45 (23.6%) | 16 (13.0%) |
| Total | 191 (100.0%) | 123 (100.0%) |
Real Estate & Mortgages in Norfolk
Real Estate and Mortgage Overview in Norfolk
| Characteristic | Without Mortgage | With Mortgage |
| Housing Units | 88 | 103 |
| Median Property Value | $375,000 | $275,000 |
| Median Household Income | $68,750 | $60 |
| Monthly Housing Costs | $1,154 | $16 |
| Real Estate Taxes | $5,357 | $0 |
Property Value by Mortgage Status in Norfolk
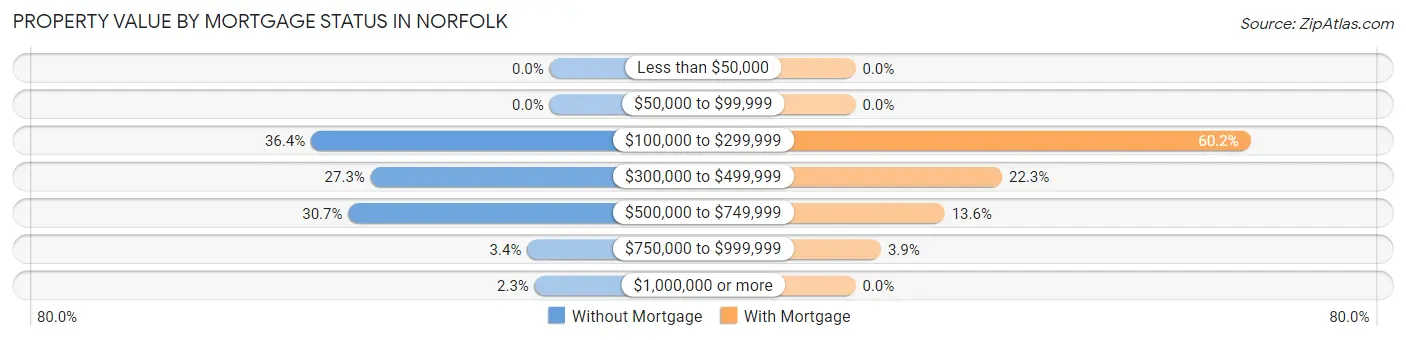
| Property Value | Without Mortgage | With Mortgage |
| Less than $50,000 | 0 (0.0%) | 0 (0.0%) |
| $50,000 to $99,999 | 0 (0.0%) | 0 (0.0%) |
| $100,000 to $299,999 | 32 (36.4%) | 62 (60.2%) |
| $300,000 to $499,999 | 24 (27.3%) | 23 (22.3%) |
| $500,000 to $749,999 | 27 (30.7%) | 14 (13.6%) |
| $750,000 to $999,999 | 3 (3.4%) | 4 (3.9%) |
| $1,000,000 or more | 2 (2.3%) | 0 (0.0%) |
| Total | 88 (100.0%) | 103 (100.0%) |
Household Income by Mortgage Status in Norfolk
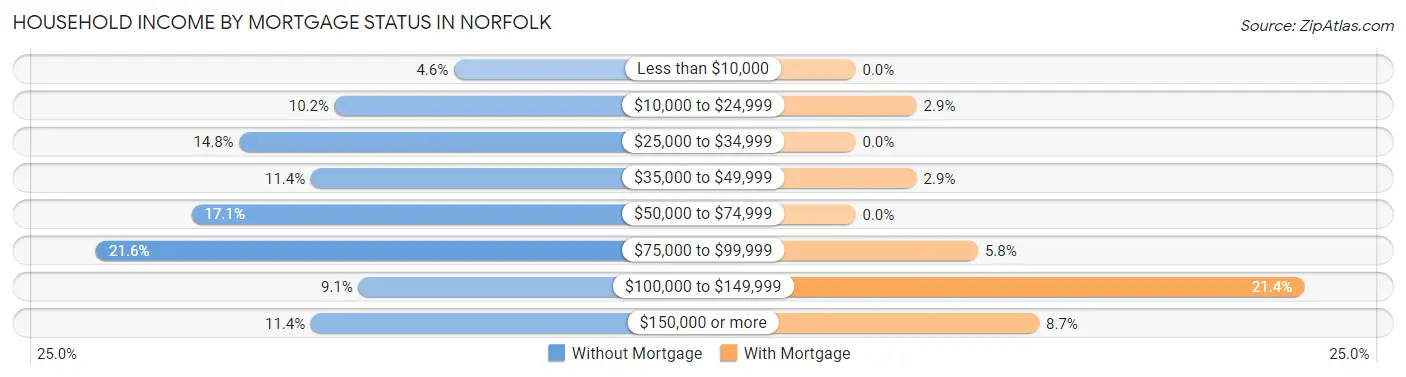
| Household Income | Without Mortgage | With Mortgage |
| Less than $10,000 | 4 (4.5%) | 0 (0.0%) |
| $10,000 to $24,999 | 9 (10.2%) | 3 (2.9%) |
| $25,000 to $34,999 | 13 (14.8%) | 0 (0.0%) |
| $35,000 to $49,999 | 10 (11.4%) | 3 (2.9%) |
| $50,000 to $74,999 | 15 (17.1%) | 0 (0.0%) |
| $75,000 to $99,999 | 19 (21.6%) | 6 (5.8%) |
| $100,000 to $149,999 | 8 (9.1%) | 22 (21.4%) |
| $150,000 or more | 10 (11.4%) | 9 (8.7%) |
| Total | 88 (100.0%) | 103 (100.0%) |
Property Value to Household Income Ratio in Norfolk
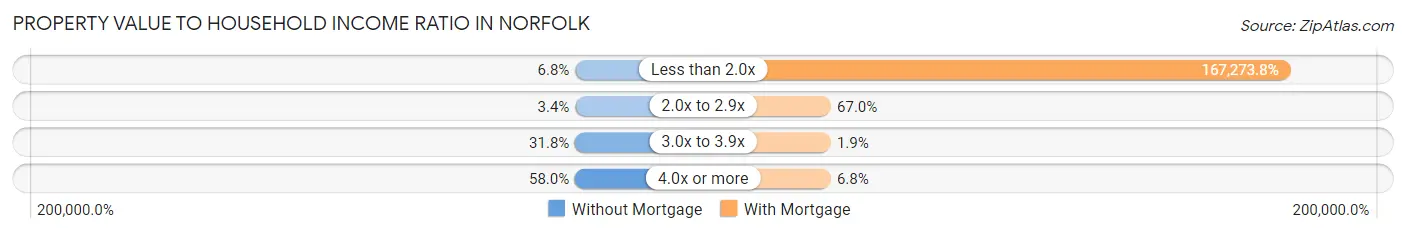
| Value-to-Income Ratio | Without Mortgage | With Mortgage |
| Less than 2.0x | 6 (6.8%) | 172,292 (167,273.8%) |
| 2.0x to 2.9x | 3 (3.4%) | 69 (67.0%) |
| 3.0x to 3.9x | 28 (31.8%) | 2 (1.9%) |
| 4.0x or more | 51 (58.0%) | 7 (6.8%) |
| Total | 88 (100.0%) | 103 (100.0%) |
Real Estate Taxes by Mortgage Status in Norfolk
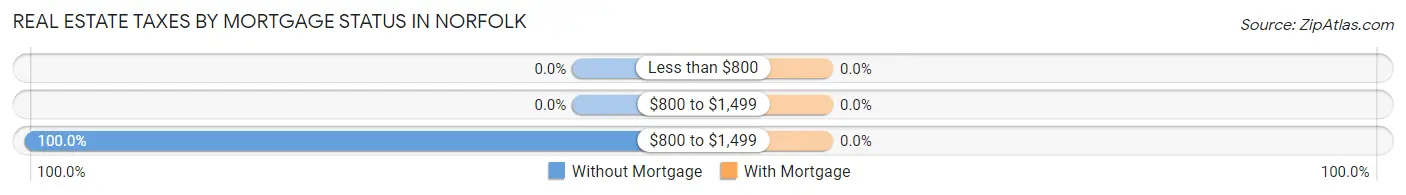
| Property Taxes | Without Mortgage | With Mortgage |
| Less than $800 | 0 (0.0%) | 0 (0.0%) |
| $800 to $1,499 | 0 (0.0%) | 0 (0.0%) |
| $800 to $1,499 | 88 (100.0%) | 0 (0.0%) |
| Total | 88 (100.0%) | 103 (100.0%) |
Health & Disability in Norfolk
Health Insurance Coverage by Age in Norfolk
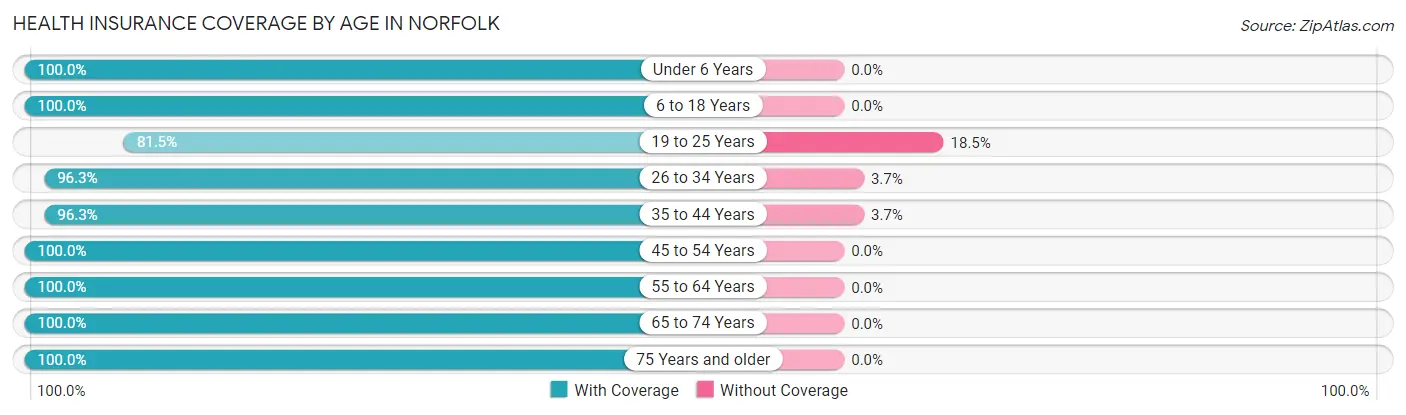
| Age Bracket | With Coverage | Without Coverage |
| Under 6 Years | 36 (100.0%) | 0 (0.0%) |
| 6 to 18 Years | 55 (100.0%) | 0 (0.0%) |
| 19 to 25 Years | 22 (81.5%) | 5 (18.5%) |
| 26 to 34 Years | 105 (96.3%) | 4 (3.7%) |
| 35 to 44 Years | 78 (96.3%) | 3 (3.7%) |
| 45 to 54 Years | 86 (100.0%) | 0 (0.0%) |
| 55 to 64 Years | 82 (100.0%) | 0 (0.0%) |
| 65 to 74 Years | 137 (100.0%) | 0 (0.0%) |
| 75 Years and older | 39 (100.0%) | 0 (0.0%) |
| Total | 640 (98.2%) | 12 (1.8%) |
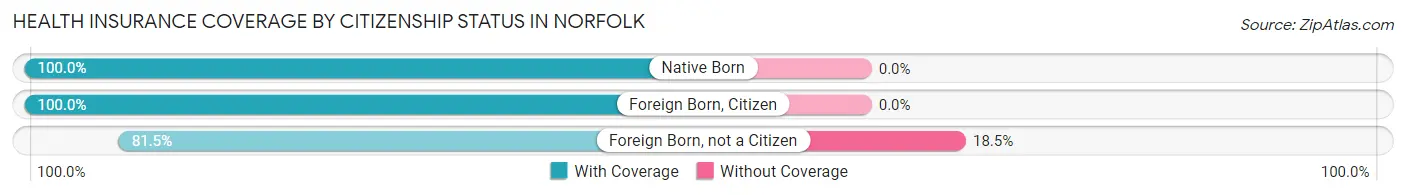
Health Insurance Coverage by Citizenship Status in Norfolk
| Citizenship Status | With Coverage | Without Coverage |
| Native Born | 36 (100.0%) | 0 (0.0%) |
| Foreign Born, Citizen | 55 (100.0%) | 0 (0.0%) |
| Foreign Born, not a Citizen | 22 (81.5%) | 5 (18.5%) |
Health Insurance Coverage by Household Income in Norfolk
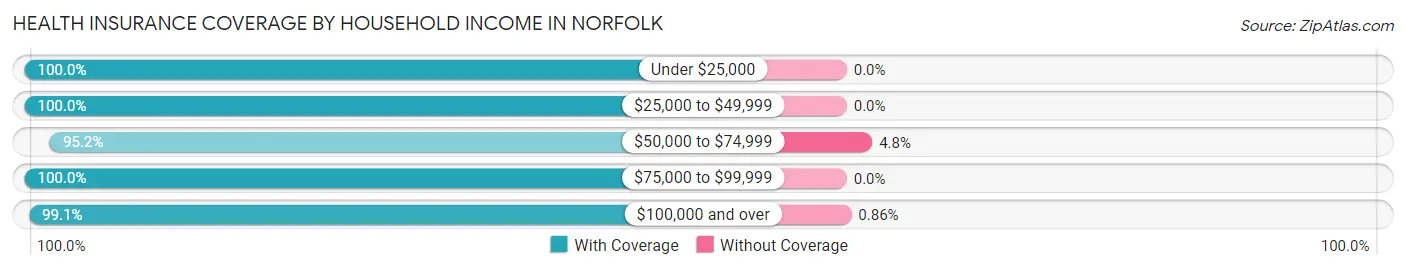
| Household Income | With Coverage | Without Coverage |
| Under $25,000 | 46 (100.0%) | 0 (0.0%) |
| $25,000 to $49,999 | 60 (100.0%) | 0 (0.0%) |
| $50,000 to $74,999 | 100 (95.2%) | 5 (4.8%) |
| $75,000 to $99,999 | 86 (100.0%) | 0 (0.0%) |
| $100,000 and over | 345 (99.1%) | 3 (0.9%) |
Public vs Private Health Insurance Coverage by Age in Norfolk
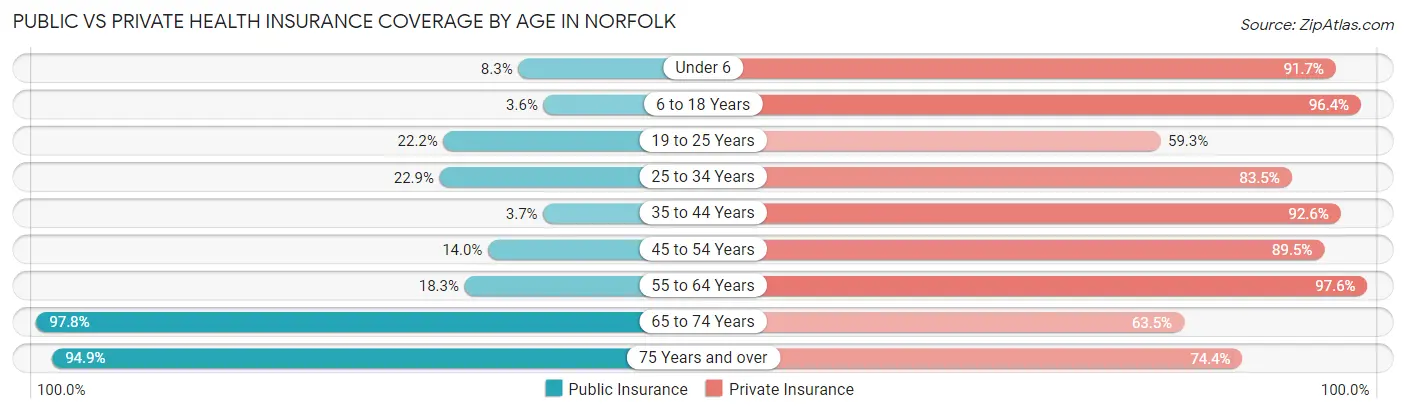
| Age Bracket | Public Insurance | Private Insurance |
| Under 6 | 3 (8.3%) | 33 (91.7%) |
| 6 to 18 Years | 2 (3.6%) | 53 (96.4%) |
| 19 to 25 Years | 6 (22.2%) | 16 (59.3%) |
| 25 to 34 Years | 25 (22.9%) | 91 (83.5%) |
| 35 to 44 Years | 3 (3.7%) | 75 (92.6%) |
| 45 to 54 Years | 12 (14.0%) | 77 (89.5%) |
| 55 to 64 Years | 15 (18.3%) | 80 (97.6%) |
| 65 to 74 Years | 134 (97.8%) | 87 (63.5%) |
| 75 Years and over | 37 (94.9%) | 29 (74.4%) |
| Total | 237 (36.3%) | 541 (83.0%) |
Disability Status by Sex by Age in Norfolk
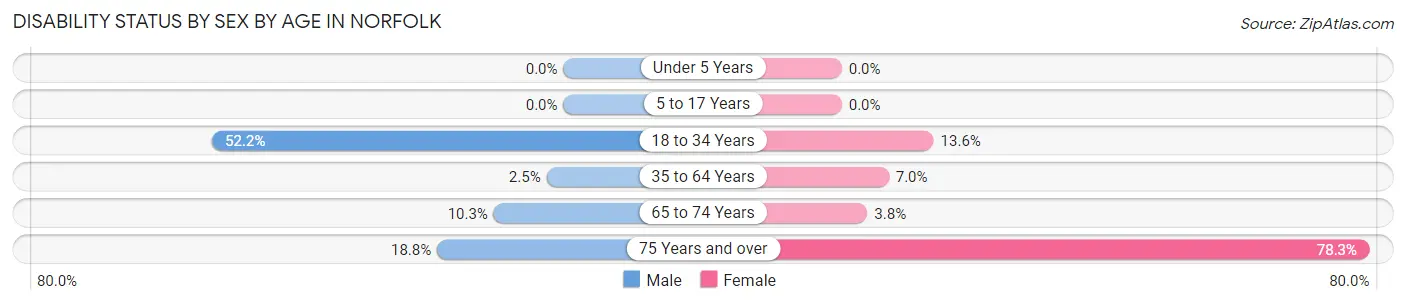
| Age Bracket | Male | Female |
| Under 5 Years | 0 (0.0%) | 0 (0.0%) |
| 5 to 17 Years | 0 (0.0%) | 0 (0.0%) |
| 18 to 34 Years | 48 (52.2%) | 6 (13.6%) |
| 35 to 64 Years | 3 (2.5%) | 9 (7.0%) |
| 65 to 74 Years | 6 (10.3%) | 3 (3.8%) |
| 75 Years and over | 3 (18.8%) | 18 (78.3%) |
Disability Class by Sex by Age in Norfolk
Disability Class: Hearing Difficulty
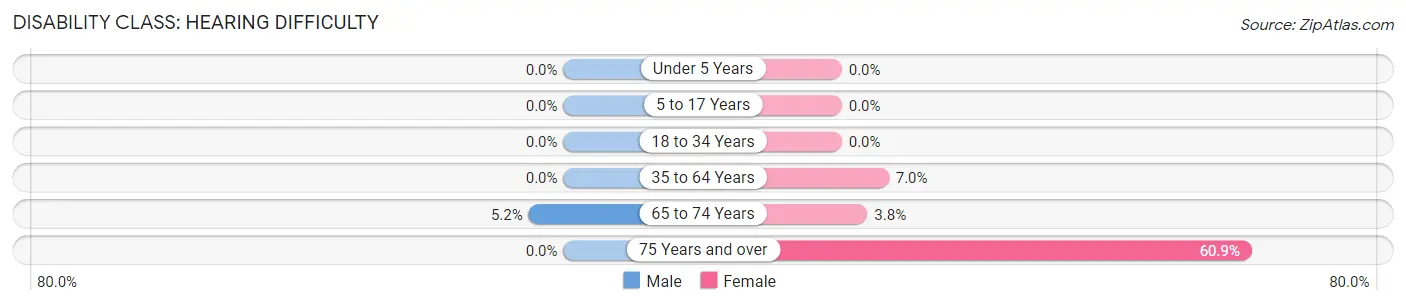
| Age Bracket | Male | Female |
| Under 5 Years | 0 (0.0%) | 0 (0.0%) |
| 5 to 17 Years | 0 (0.0%) | 0 (0.0%) |
| 18 to 34 Years | 0 (0.0%) | 0 (0.0%) |
| 35 to 64 Years | 0 (0.0%) | 9 (7.0%) |
| 65 to 74 Years | 3 (5.2%) | 3 (3.8%) |
| 75 Years and over | 0 (0.0%) | 14 (60.9%) |
Disability Class: Vision Difficulty
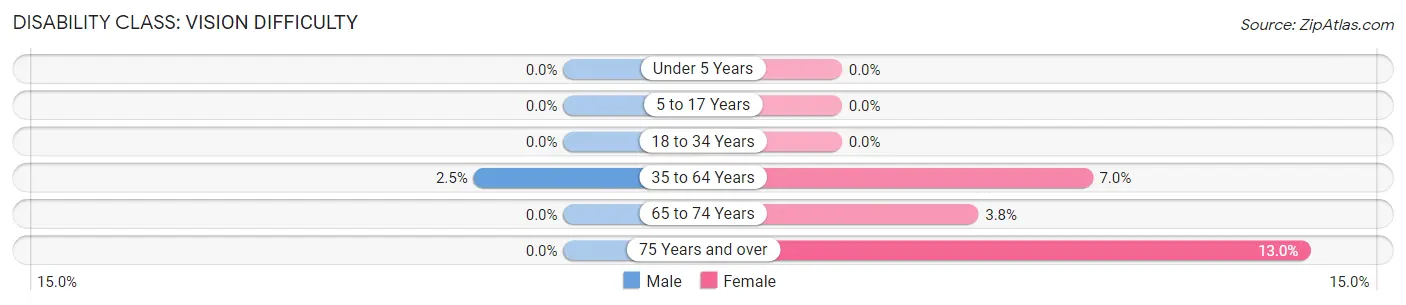
| Age Bracket | Male | Female |
| Under 5 Years | 0 (0.0%) | 0 (0.0%) |
| 5 to 17 Years | 0 (0.0%) | 0 (0.0%) |
| 18 to 34 Years | 0 (0.0%) | 0 (0.0%) |
| 35 to 64 Years | 3 (2.5%) | 9 (7.0%) |
| 65 to 74 Years | 0 (0.0%) | 3 (3.8%) |
| 75 Years and over | 0 (0.0%) | 3 (13.0%) |
Disability Class: Cognitive Difficulty
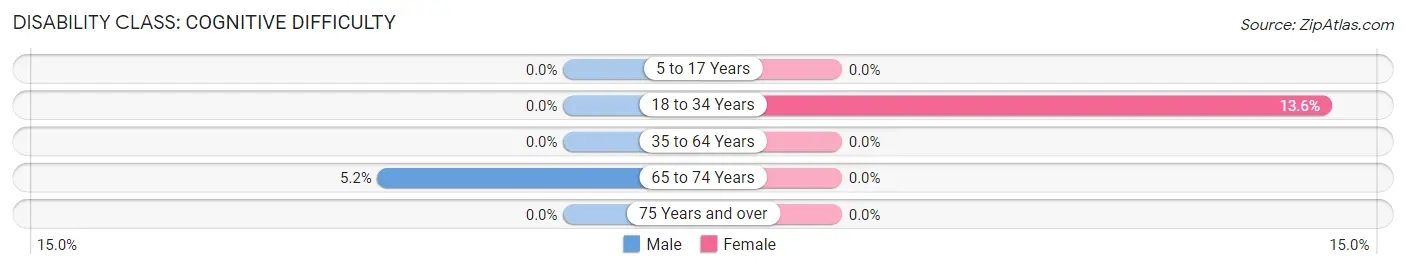
| Age Bracket | Male | Female |
| 5 to 17 Years | 0 (0.0%) | 0 (0.0%) |
| 18 to 34 Years | 0 (0.0%) | 6 (13.6%) |
| 35 to 64 Years | 0 (0.0%) | 0 (0.0%) |
| 65 to 74 Years | 3 (5.2%) | 0 (0.0%) |
| 75 Years and over | 0 (0.0%) | 0 (0.0%) |
Disability Class: Ambulatory Difficulty
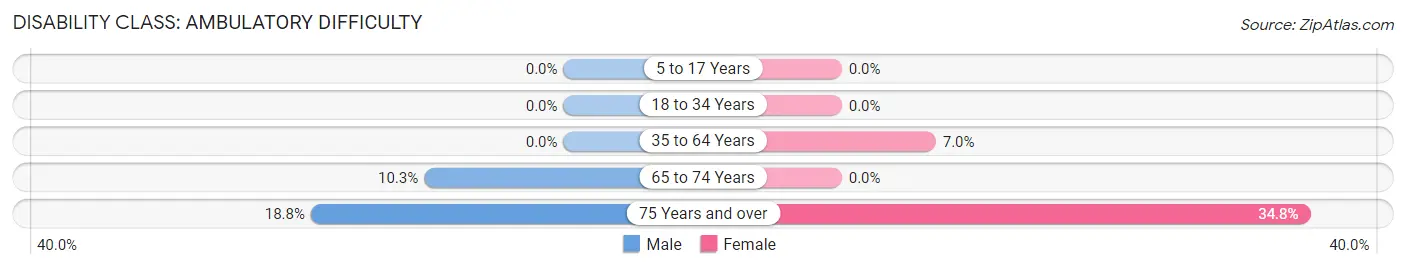
| Age Bracket | Male | Female |
| 5 to 17 Years | 0 (0.0%) | 0 (0.0%) |
| 18 to 34 Years | 0 (0.0%) | 0 (0.0%) |
| 35 to 64 Years | 0 (0.0%) | 9 (7.0%) |
| 65 to 74 Years | 6 (10.3%) | 0 (0.0%) |
| 75 Years and over | 3 (18.8%) | 8 (34.8%) |
Disability Class: Self-Care Difficulty
| Age Bracket | Male | Female |
| 5 to 17 Years | 0 (0.0%) | 0 (0.0%) |
| 18 to 34 Years | 0 (0.0%) | 0 (0.0%) |
| 35 to 64 Years | 0 (0.0%) | 0 (0.0%) |
| 65 to 74 Years | 0 (0.0%) | 0 (0.0%) |
| 75 Years and over | 0 (0.0%) | 0 (0.0%) |
Technology Access in Norfolk
Computing Device Access in Norfolk
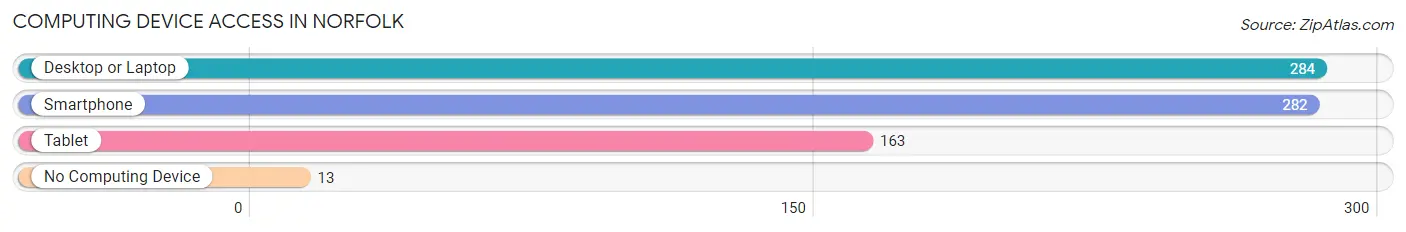
| Device Type | # Households | % Households |
| Desktop or Laptop | 284 | 90.4% |
| Smartphone | 282 | 89.8% |
| Tablet | 163 | 51.9% |
| No Computing Device | 13 | 4.1% |
| Total | 314 | 100.0% |
Internet Access in Norfolk
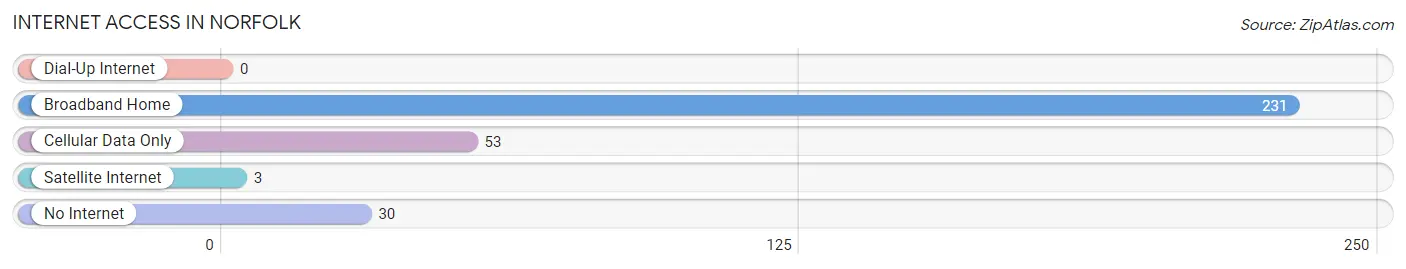
| Internet Type | # Households | % Households |
| Dial-Up Internet | 0 | 0.0% |
| Broadband Home | 231 | 73.6% |
| Cellular Data Only | 53 | 16.9% |
| Satellite Internet | 3 | 1.0% |
| No Internet | 30 | 9.6% |
| Total | 314 | 100.0% |
Norfolk Summary
Norfolk is a town located in Litchfield County, Connecticut, United States. The population was 1,769 at the 2010 census. It is the least populous town in Litchfield County.
History
The area that is now Norfolk was originally part of the town of Windham, which was established in 1726. In 1744, the area was separated from Windham and incorporated as a separate town, named after the English county of Norfolk.
The town was originally a farming community, and the town center was located near the intersection of present-day Routes 44 and 272. In the 19th century, the town became a popular summer resort destination, and several grand hotels were built in the area.
Geography
Norfolk is located in the northwest corner of Litchfield County, bordered by the towns of Canaan to the north, Colebrook to the east, Winchester to the south, and Salisbury to the west. The town is located in the foothills of the Berkshires, and the terrain is mostly hilly and forested. The highest point in town is the summit of Haystack Mountain, at 1,717 feet (523 m) above sea level.
The town is drained by the West Branch of the Housatonic River, which flows through the center of town. The town also contains several small lakes, including Lake Wononskopomuc, Lake Lillinonah, and Lake Zoar.
Economy
The economy of Norfolk is largely based on tourism and recreation. The town is home to several resorts and inns, as well as several campgrounds. The town is also home to several wineries and vineyards, and is a popular destination for wine tasting.
The town is also home to several small businesses, including a general store, a hardware store, and a few restaurants.
Demographics
As of the 2010 census, there were 1,769 people, 745 households, and 486 families residing in the town. The population density was 57.3 people per square mile (22.1/km2). There were 890 housing units at an average density of 28.9 per square mile (11.2/km2). The racial makeup of the town was 97.2% White, 0.7% African American, 0.2% Native American, 0.4% Asian, 0.1% Pacific Islander, 0.2% from other races, and 1.2% from two or more races. Hispanic or Latino of any race were 1.3% of the population.
There were 745 households, out of which 28.2% had children under the age of 18 living with them, 51.7% were married couples living together, 8.3% had a female householder with no husband present, and 35.7% were non-families. 29.7% of all households were made up of individuals, and 11.2% had someone living alone who was 65 years of age or older. The average household size was 2.37 and the average family size was 2.94.
In the town, the population was spread out, with 23.2% under the age of 18, 5.2% from 18 to 24, 25.2% from 25 to 44, 32.2% from 45 to 64, and 14.2% who were 65 years of age or older. The median age was 42 years. For every 100 females, there were 97.2 males. For every 100 females age 18 and over, there were 94.2 males.
The median income for a household in the town was $60,000, and the median income for a family was $71,250. Males had a median income of $50,000 versus $35,000 for females. The per capita income for the town was $30,945. About 4.2% of families and 6.2% of the population were below the poverty line, including 8.2% of those under age 18 and 4.2% of those age 65 or over.
Common Questions
What is Per Capita Income in Norfolk?
Per Capita income in Norfolk is $53,042.
What is the Median Family Income in Norfolk?
Median Family Income in Norfolk is $112,083.
What is the Median Household income in Norfolk?
Median Household Income in Norfolk is $69,750.
What is Income or Wage Gap in Norfolk?
Income or Wage Gap in Norfolk is 51.9%.
Women in Norfolk earn 48.1 cents for every dollar earned by a man.
What is Inequality or Gini Index in Norfolk?
Inequality or Gini Index in Norfolk is 0.44.
What is the Total Population of Norfolk?
Total Population of Norfolk is 652.
What is the Total Male Population of Norfolk?
Total Male Population of Norfolk is 318.
What is the Total Female Population of Norfolk?
Total Female Population of Norfolk is 334.
What is the Ratio of Males per 100 Females in Norfolk?
There are 95.21 Males per 100 Females in Norfolk.
What is the Ratio of Females per 100 Males in Norfolk?
There are 105.03 Females per 100 Males in Norfolk.
What is the Median Population Age in Norfolk?
Median Population Age in Norfolk is 47.0 Years.
What is the Average Family Size in Norfolk
Average Family Size in Norfolk is 2.9 People.
What is the Average Household Size in Norfolk
Average Household Size in Norfolk is 2.0 People.
How Large is the Labor Force in Norfolk?
There are 359 People in the Labor Forcein in Norfolk.
What is the Percentage of People in the Labor Force in Norfolk?
63.1% of People are in the Labor Force in Norfolk.
What is the Unemployment Rate in Norfolk?
Unemployment Rate in Norfolk is 2.2%.