Norwalk, CT Map & Demographics
Norwalk Map
Norwalk Overview
$57,389
PER CAPITA INCOME
$115,631
AVG FAMILY INCOME
$97,879
AVG HOUSEHOLD INCOME
16.2%
WAGE / INCOME GAP [ % ]
83.8¢/ $1
WAGE / INCOME GAP [ $ ]
$10,603
FAMILY INCOME DEFICIT
0.50
INEQUALITY / GINI INDEX
91,050
TOTAL POPULATION
45,680
MALE POPULATION
45,370
FEMALE POPULATION
100.68
MALES / 100 FEMALES
99.32
FEMALES / 100 MALES
40.0
MEDIAN AGE
3.2
AVG FAMILY SIZE
2.6
AVG HOUSEHOLD SIZE
53,309
LABOR FORCE [ PEOPLE ]
70.7%
PERCENT IN LABOR FORCE
5.9%
UNEMPLOYMENT RATE
Norwalk Area Codes
Income in Norwalk
Income Overview in Norwalk
Per Capita Income in Norwalk is $57,389, while median incomes of families and households are $115,631 and $97,879 respectively.
| Characteristic | Number | Measure |
| Per Capita Income | 91,050 | $57,389 |
| Median Family Income | 22,614 | $115,631 |
| Mean Family Income | 22,614 | $169,144 |
| Median Household Income | 35,272 | $97,879 |
| Mean Household Income | 35,272 | $144,892 |
| Income Deficit | 22,614 | $10,603 |
| Wage / Income Gap (%) | 91,050 | 16.18% |
| Wage / Income Gap ($) | 91,050 | 83.82¢ per $1 |
| Gini / Inequality Index | 91,050 | 0.50 |
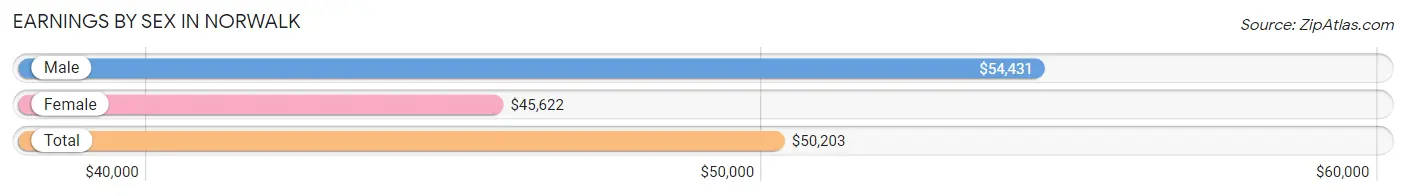
Earnings by Sex in Norwalk
Average Earnings in Norwalk are $50,203, $54,431 for men and $45,622 for women, a difference of 16.2%.
| Sex | Number | Average Earnings |
| Male | 29,061 (53.2%) | $54,431 |
| Female | 25,593 (46.8%) | $45,622 |
| Total | 54,654 (100.0%) | $50,203 |
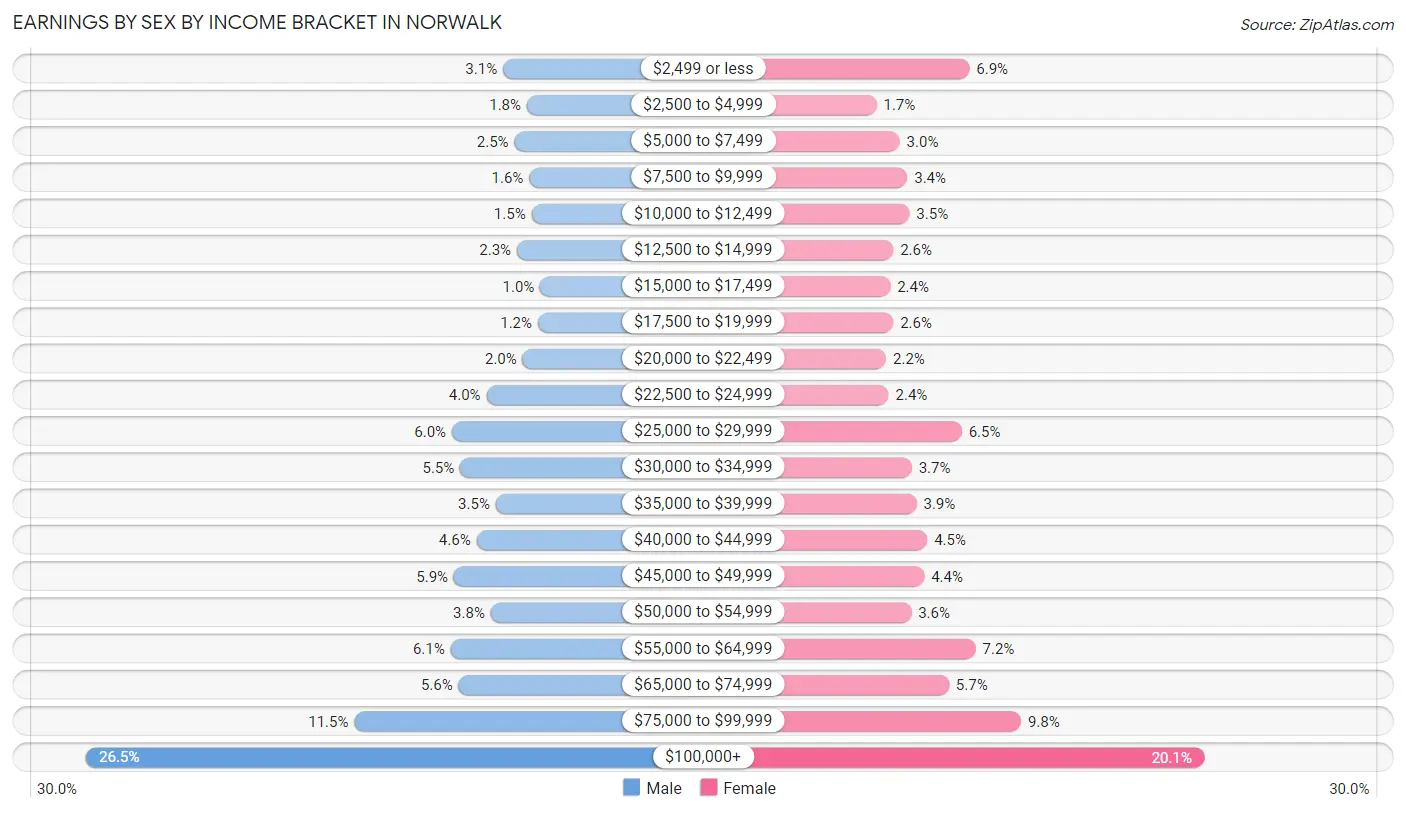
Earnings by Sex by Income Bracket in Norwalk
The most common earnings brackets in Norwalk are $100,000+ for men (7,713 | 26.5%) and $100,000+ for women (5,134 | 20.1%).
| Income | Male | Female |
| $2,499 or less | 904 (3.1%) | 1,763 (6.9%) |
| $2,500 to $4,999 | 513 (1.8%) | 427 (1.7%) |
| $5,000 to $7,499 | 717 (2.5%) | 759 (3.0%) |
| $7,500 to $9,999 | 476 (1.6%) | 869 (3.4%) |
| $10,000 to $12,499 | 439 (1.5%) | 900 (3.5%) |
| $12,500 to $14,999 | 676 (2.3%) | 669 (2.6%) |
| $15,000 to $17,499 | 295 (1.0%) | 625 (2.4%) |
| $17,500 to $19,999 | 335 (1.1%) | 667 (2.6%) |
| $20,000 to $22,499 | 583 (2.0%) | 565 (2.2%) |
| $22,500 to $24,999 | 1,174 (4.0%) | 601 (2.4%) |
| $25,000 to $29,999 | 1,739 (6.0%) | 1,653 (6.5%) |
| $30,000 to $34,999 | 1,603 (5.5%) | 935 (3.6%) |
| $35,000 to $39,999 | 1,024 (3.5%) | 1,002 (3.9%) |
| $40,000 to $44,999 | 1,337 (4.6%) | 1,157 (4.5%) |
| $45,000 to $49,999 | 1,706 (5.9%) | 1,114 (4.3%) |
| $50,000 to $54,999 | 1,104 (3.8%) | 926 (3.6%) |
| $55,000 to $64,999 | 1,760 (6.1%) | 1,853 (7.2%) |
| $65,000 to $74,999 | 1,629 (5.6%) | 1,468 (5.7%) |
| $75,000 to $99,999 | 3,334 (11.5%) | 2,506 (9.8%) |
| $100,000+ | 7,713 (26.5%) | 5,134 (20.1%) |
| Total | 29,061 (100.0%) | 25,593 (100.0%) |
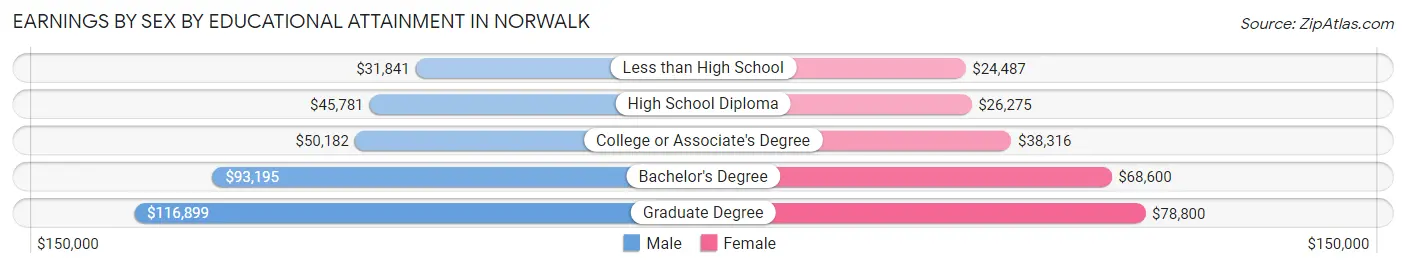
Earnings by Sex by Educational Attainment in Norwalk
Average earnings in Norwalk are $61,268 for men and $49,532 for women, a difference of 19.2%. Men with an educational attainment of graduate degree enjoy the highest average annual earnings of $116,899, while those with less than high school education earn the least with $31,841. Women with an educational attainment of graduate degree earn the most with the average annual earnings of $78,800, while those with less than high school education have the smallest earnings of $24,487.
| Educational Attainment | Male Income | Female Income |
| Less than High School | $31,841 | $24,487 |
| High School Diploma | $45,781 | $26,275 |
| College or Associate's Degree | $50,182 | $38,316 |
| Bachelor's Degree | $93,195 | $68,600 |
| Graduate Degree | $116,899 | $78,800 |
| Total | $61,268 | $49,532 |
Family Income in Norwalk
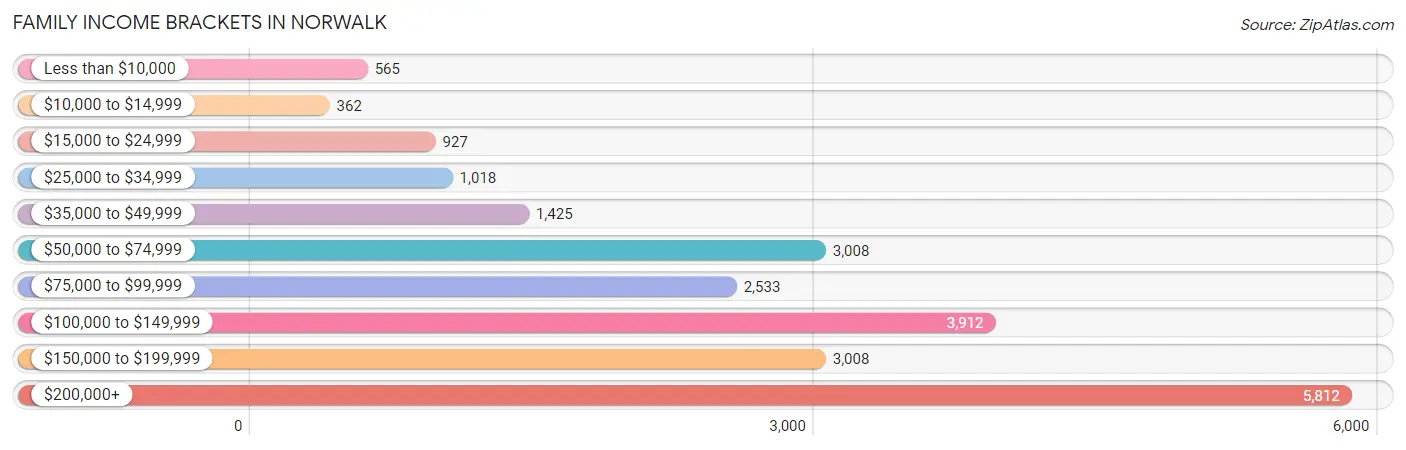
Family Income Brackets in Norwalk
According to the Norwalk family income data, there are 5,812 families falling into the $200,000+ income range, which is the most common income bracket and makes up 25.7% of all families. Conversely, the $10,000 to $14,999 income bracket is the least frequent group with only 362 families (1.6%) belonging to this category.
| Income Bracket | # Families | % Families |
| Less than $10,000 | 565 | 2.5% |
| $10,000 to $14,999 | 362 | 1.6% |
| $15,000 to $24,999 | 927 | 4.1% |
| $25,000 to $34,999 | 1,018 | 4.5% |
| $35,000 to $49,999 | 1,425 | 6.3% |
| $50,000 to $74,999 | 3,008 | 13.3% |
| $75,000 to $99,999 | 2,533 | 11.2% |
| $100,000 to $149,999 | 3,912 | 17.3% |
| $150,000 to $199,999 | 3,008 | 13.3% |
| $200,000+ | 5,812 | 25.7% |
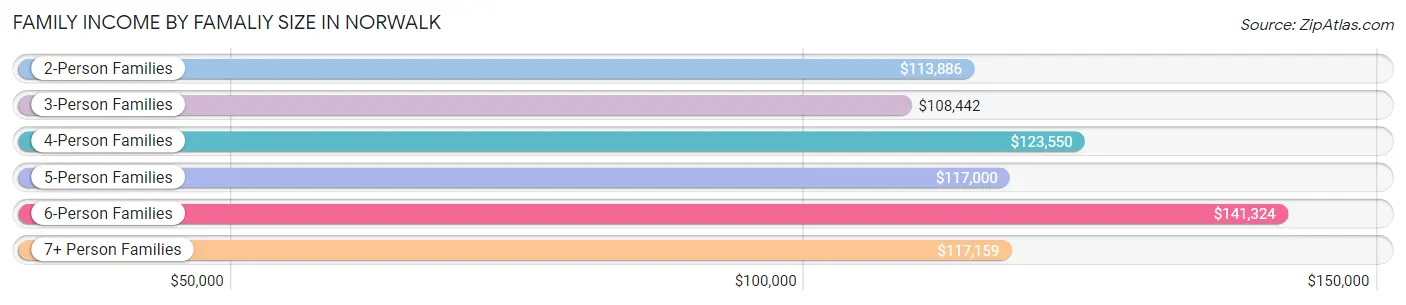
Family Income by Famaliy Size in Norwalk
6-person families (444 | 2.0%) account for the highest median family income in Norwalk with $141,324 per family, while 2-person families (9,479 | 41.9%) have the highest median income of $56,943 per family member.
| Income Bracket | # Families | Median Income |
| 2-Person Families | 9,479 (41.9%) | $113,886 |
| 3-Person Families | 5,482 (24.2%) | $108,442 |
| 4-Person Families | 4,676 (20.7%) | $123,550 |
| 5-Person Families | 2,110 (9.3%) | $117,000 |
| 6-Person Families | 444 (2.0%) | $141,324 |
| 7+ Person Families | 423 (1.9%) | $117,159 |
| Total | 22,614 (100.0%) | $115,631 |
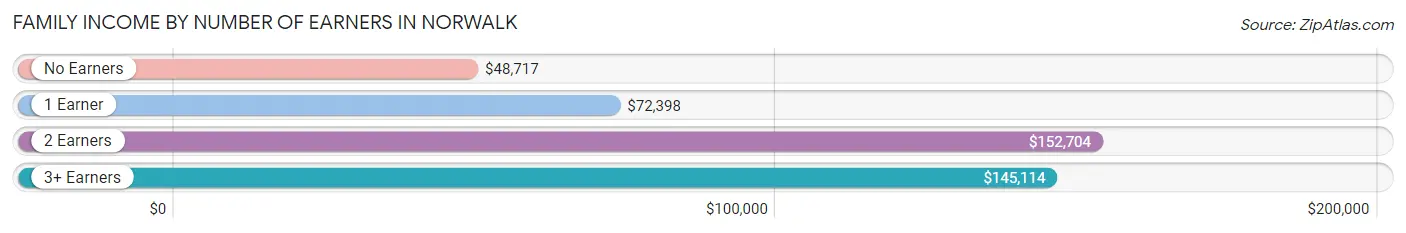
Family Income by Number of Earners in Norwalk
The median family income in Norwalk is $115,631, with families comprising 2 earners (10,638) having the highest median family income of $152,704, while families with no earners (2,339) have the lowest median family income of $48,717, accounting for 47.0% and 10.3% of families, respectively.
| Number of Earners | # Families | Median Income |
| No Earners | 2,339 (10.3%) | $48,717 |
| 1 Earner | 6,202 (27.4%) | $72,398 |
| 2 Earners | 10,638 (47.0%) | $152,704 |
| 3+ Earners | 3,435 (15.2%) | $145,114 |
| Total | 22,614 (100.0%) | $115,631 |
Household Income in Norwalk
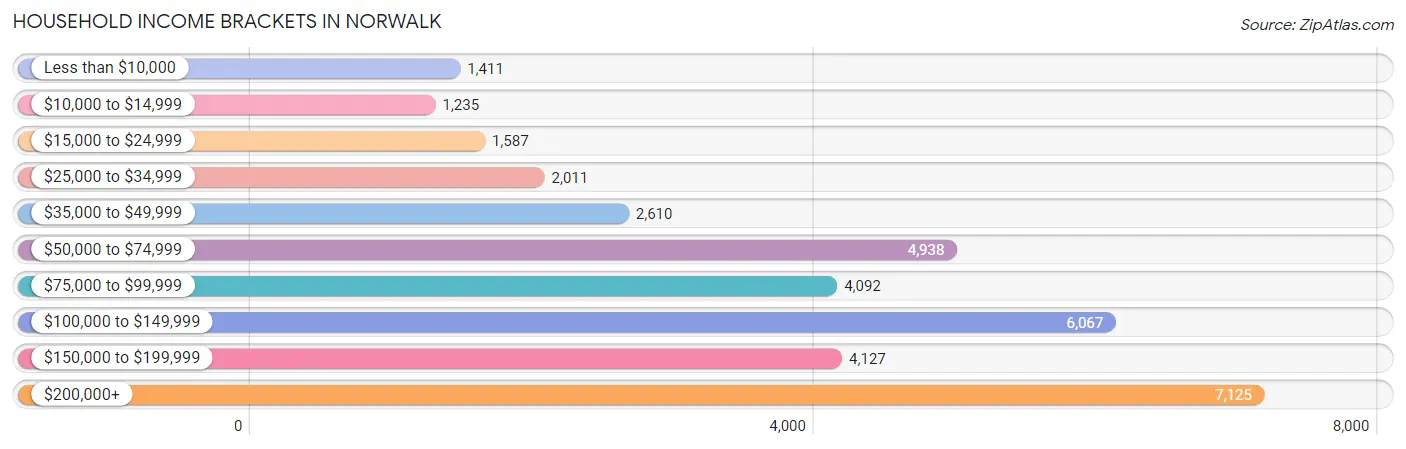
Household Income Brackets in Norwalk
With 7,125 households falling in the category, the $200,000+ income range is the most frequent in Norwalk, accounting for 20.2% of all households. In contrast, only 1,235 households (3.5%) fall into the $10,000 to $14,999 income bracket, making it the least populous group.
| Income Bracket | # Households | % Households |
| Less than $10,000 | 1,411 | 4.0% |
| $10,000 to $14,999 | 1,235 | 3.5% |
| $15,000 to $24,999 | 1,587 | 4.5% |
| $25,000 to $34,999 | 2,011 | 5.7% |
| $35,000 to $49,999 | 2,610 | 7.4% |
| $50,000 to $74,999 | 4,938 | 14.0% |
| $75,000 to $99,999 | 4,092 | 11.6% |
| $100,000 to $149,999 | 6,067 | 17.2% |
| $150,000 to $199,999 | 4,127 | 11.7% |
| $200,000+ | 7,125 | 20.2% |
Household Income by Householder Age in Norwalk
The median household income in Norwalk is $97,879, with the highest median household income of $122,994 found in the 45 to 64 years age bracket for the primary householder. A total of 13,808 households (39.2%) fall into this category. Meanwhile, the 15 to 24 years age bracket for the primary householder has the lowest median household income of $63,839, with 577 households (1.6%) in this group.
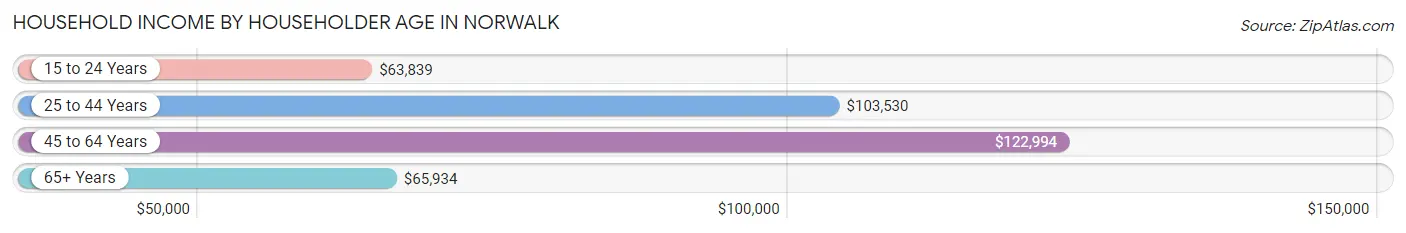
| Income Bracket | # Households | Median Income |
| 15 to 24 Years | 577 (1.6%) | $63,839 |
| 25 to 44 Years | 12,111 (34.3%) | $103,530 |
| 45 to 64 Years | 13,808 (39.2%) | $122,994 |
| 65+ Years | 8,776 (24.9%) | $65,934 |
| Total | 35,272 (100.0%) | $97,879 |
Poverty in Norwalk
Income Below Poverty by Sex and Age in Norwalk
With 9.4% poverty level for males and 12.3% for females among the residents of Norwalk, 6 to 11 year old males and 18 to 24 year old females are the most vulnerable to poverty, with 709 males (23.6%) and 606 females (19.6%) in their respective age groups living below the poverty level.
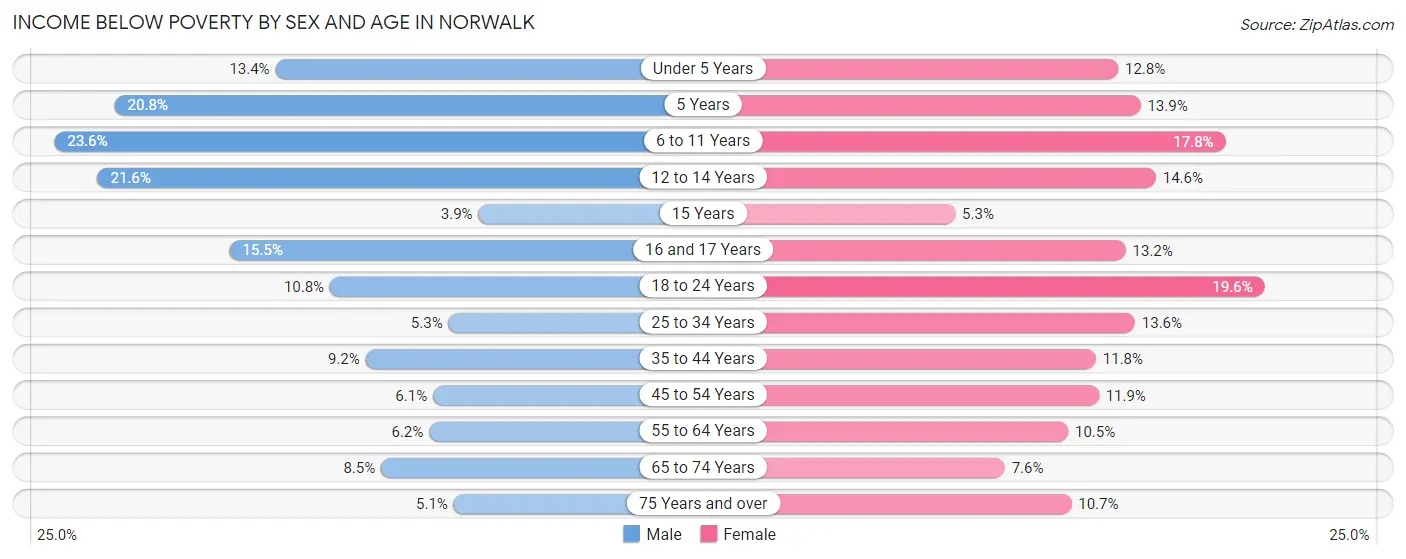
| Age Bracket | Male | Female |
| Under 5 Years | 304 (13.4%) | 326 (12.8%) |
| 5 Years | 76 (20.8%) | 46 (13.9%) |
| 6 to 11 Years | 709 (23.6%) | 405 (17.8%) |
| 12 to 14 Years | 365 (21.6%) | 190 (14.6%) |
| 15 Years | 36 (3.9%) | 31 (5.3%) |
| 16 and 17 Years | 169 (15.5%) | 122 (13.2%) |
| 18 to 24 Years | 459 (10.8%) | 606 (19.6%) |
| 25 to 34 Years | 377 (5.3%) | 929 (13.6%) |
| 35 to 44 Years | 612 (9.2%) | 729 (11.8%) |
| 45 to 54 Years | 341 (6.0%) | 746 (11.9%) |
| 55 to 64 Years | 388 (6.2%) | 713 (10.5%) |
| 65 to 74 Years | 315 (8.5%) | 339 (7.6%) |
| 75 Years and over | 124 (5.1%) | 371 (10.6%) |
| Total | 4,275 (9.4%) | 5,553 (12.3%) |
Income Above Poverty by Sex and Age in Norwalk
According to the poverty statistics in Norwalk, males aged 15 years and females aged 15 years are the age groups that are most secure financially, with 96.1% of males and 94.7% of females in these age groups living above the poverty line.
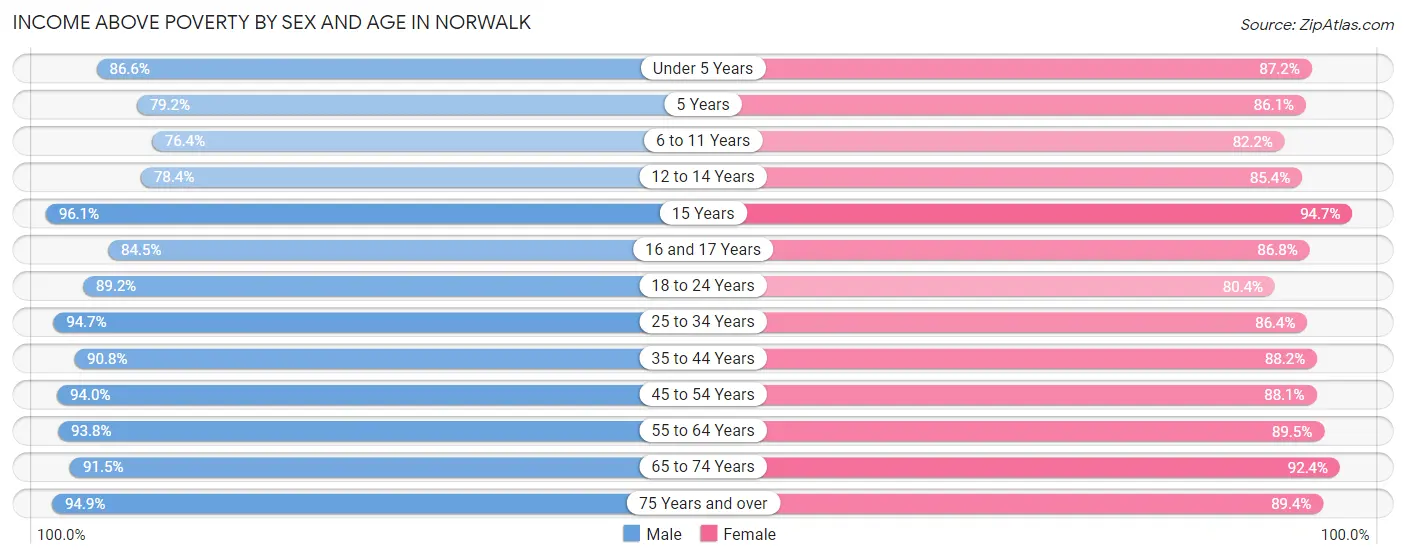
| Age Bracket | Male | Female |
| Under 5 Years | 1,972 (86.6%) | 2,217 (87.2%) |
| 5 Years | 289 (79.2%) | 286 (86.1%) |
| 6 to 11 Years | 2,293 (76.4%) | 1,870 (82.2%) |
| 12 to 14 Years | 1,324 (78.4%) | 1,114 (85.4%) |
| 15 Years | 877 (96.1%) | 558 (94.7%) |
| 16 and 17 Years | 922 (84.5%) | 804 (86.8%) |
| 18 to 24 Years | 3,780 (89.2%) | 2,483 (80.4%) |
| 25 to 34 Years | 6,699 (94.7%) | 5,900 (86.4%) |
| 35 to 44 Years | 6,057 (90.8%) | 5,454 (88.2%) |
| 45 to 54 Years | 5,294 (94.0%) | 5,513 (88.1%) |
| 55 to 64 Years | 5,836 (93.8%) | 6,077 (89.5%) |
| 65 to 74 Years | 3,410 (91.5%) | 4,146 (92.4%) |
| 75 Years and over | 2,314 (94.9%) | 3,114 (89.3%) |
| Total | 41,067 (90.6%) | 39,536 (87.7%) |
Income Below Poverty Among Married-Couple Families in Norwalk
The poverty statistics for married-couple families in Norwalk show that 3.7% or 604 of the total 16,375 families live below the poverty line. Families with 5 or more children have the highest poverty rate of 12.1%, comprising of 13 families. On the other hand, families with no children have the lowest poverty rate of 2.6%, which includes 244 families.
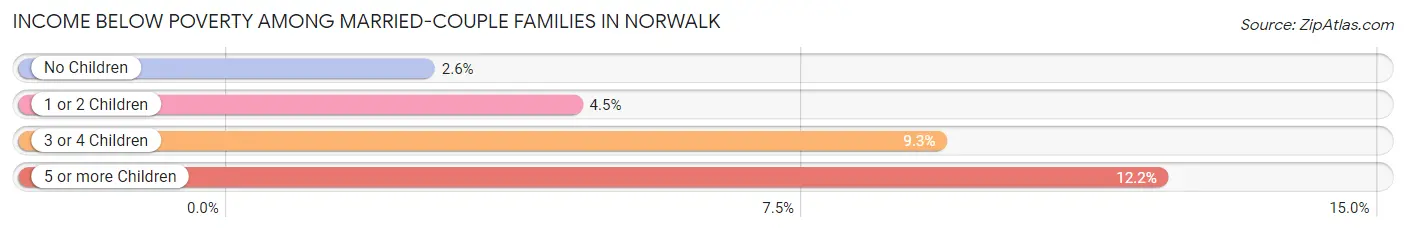
| Children | Above Poverty | Below Poverty |
| No Children | 9,264 (97.4%) | 244 (2.6%) |
| 1 or 2 Children | 5,600 (95.5%) | 264 (4.5%) |
| 3 or 4 Children | 813 (90.7%) | 83 (9.3%) |
| 5 or more Children | 94 (87.8%) | 13 (12.1%) |
| Total | 15,771 (96.3%) | 604 (3.7%) |
Income Below Poverty Among Single-Parent Households in Norwalk
According to the poverty data in Norwalk, 8.6% or 163 single-father households and 25.2% or 1,094 single-mother households are living below the poverty line. Among single-father households, those with 1 or 2 children have the highest poverty rate, with 163 households (15.5%) experiencing poverty. Likewise, among single-mother households, those with 5 or more children have the highest poverty rate, with 69 households (82.1%) falling below the poverty line.
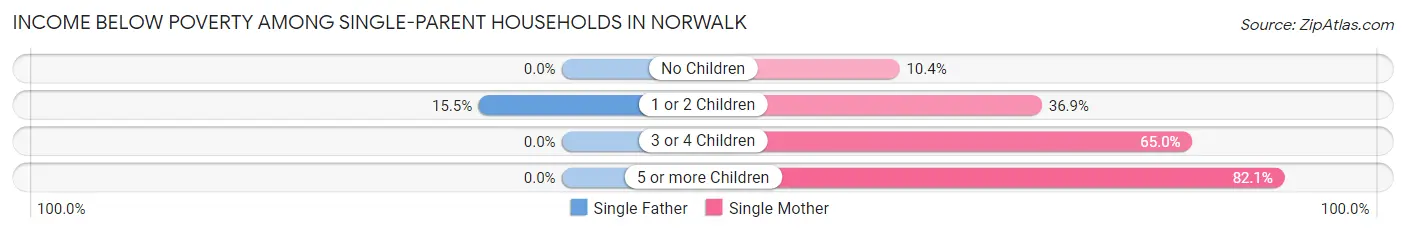
| Children | Single Father | Single Mother |
| No Children | 0 (0.0%) | 238 (10.4%) |
| 1 or 2 Children | 163 (15.5%) | 648 (36.9%) |
| 3 or 4 Children | 0 (0.0%) | 139 (64.9%) |
| 5 or more Children | 0 (0.0%) | 69 (82.1%) |
| Total | 163 (8.6%) | 1,094 (25.2%) |
Income Below Poverty Among Married-Couple vs Single-Parent Households in Norwalk
The poverty data for Norwalk shows that 604 of the married-couple family households (3.7%) and 1,257 of the single-parent households (20.2%) are living below the poverty level. Within the married-couple family households, those with 5 or more children have the highest poverty rate, with 13 households (12.1%) falling below the poverty line. Among the single-parent households, those with 5 or more children have the highest poverty rate, with 69 household (82.1%) living below poverty.
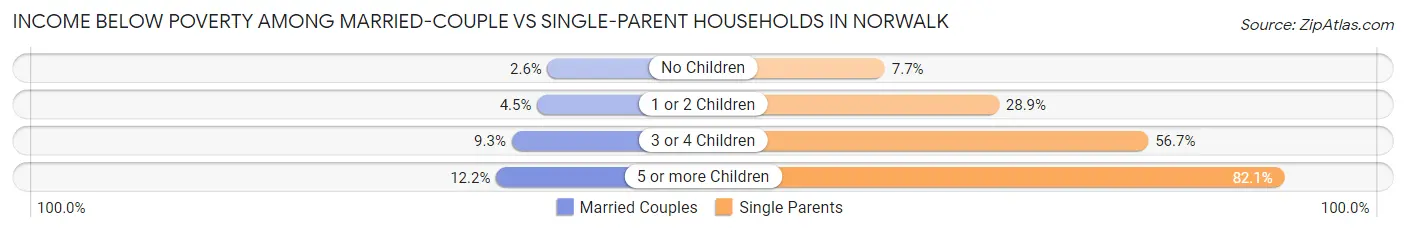
| Children | Married-Couple Families | Single-Parent Households |
| No Children | 244 (2.6%) | 238 (7.7%) |
| 1 or 2 Children | 264 (4.5%) | 811 (28.9%) |
| 3 or 4 Children | 83 (9.3%) | 139 (56.7%) |
| 5 or more Children | 13 (12.1%) | 69 (82.1%) |
| Total | 604 (3.7%) | 1,257 (20.2%) |
Race in Norwalk
The most populous races in Norwalk are White / Caucasian (50,028 | 54.9%), Hispanic or Latino (28,000 | 30.7%), and Black / African American (16,324 | 17.9%).
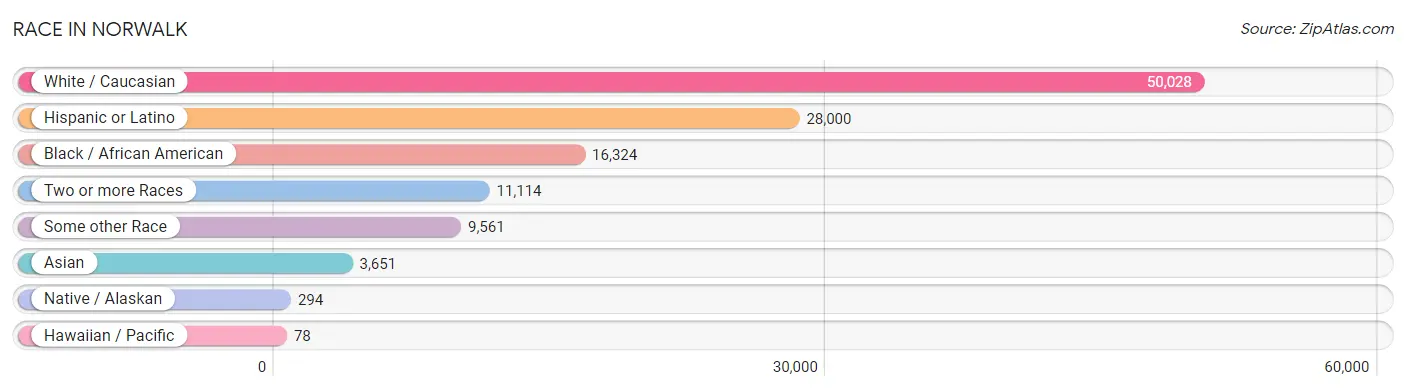
| Race | # Population | % Population |
| Asian | 3,651 | 4.0% |
| Black / African American | 16,324 | 17.9% |
| Hawaiian / Pacific | 78 | 0.1% |
| Hispanic or Latino | 28,000 | 30.7% |
| Native / Alaskan | 294 | 0.3% |
| White / Caucasian | 50,028 | 54.9% |
| Two or more Races | 11,114 | 12.2% |
| Some other Race | 9,561 | 10.5% |
| Total | 91,050 | 100.0% |
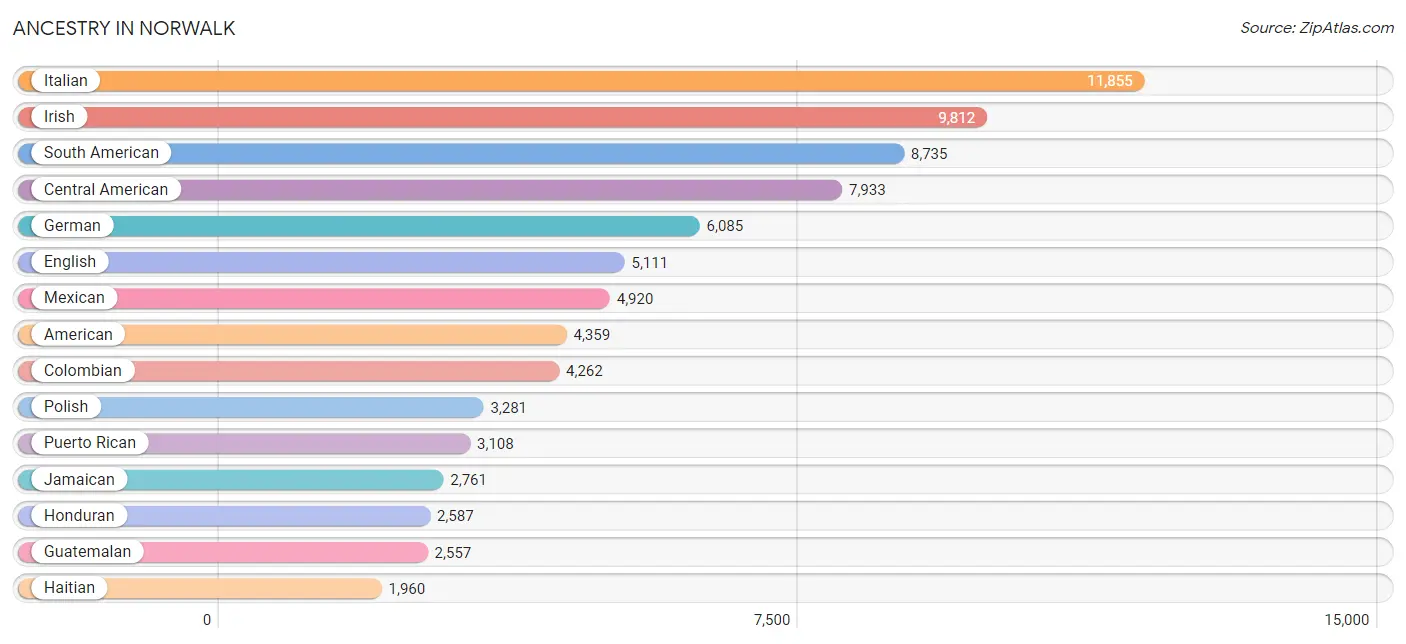
Ancestry in Norwalk
The most populous ancestries reported in Norwalk are Italian (11,855 | 13.0%), Irish (9,812 | 10.8%), South American (8,735 | 9.6%), Central American (7,933 | 8.7%), and German (6,085 | 6.7%), together accounting for 48.8% of all Norwalk residents.
| Ancestry | # Population | % Population |
| African | 627 | 0.7% |
| Albanian | 285 | 0.3% |
| American | 4,359 | 4.8% |
| Arab | 350 | 0.4% |
| Argentinean | 120 | 0.1% |
| Armenian | 99 | 0.1% |
| Australian | 42 | 0.1% |
| Austrian | 257 | 0.3% |
| Bahamian | 41 | 0.1% |
| Barbadian | 269 | 0.3% |
| Basque | 15 | 0.0% |
| Belgian | 57 | 0.1% |
| Bhutanese | 25 | 0.0% |
| Blackfeet | 121 | 0.1% |
| Bolivian | 26 | 0.0% |
| Brazilian | 255 | 0.3% |
| British | 184 | 0.2% |
| British West Indian | 242 | 0.3% |
| Bulgarian | 53 | 0.1% |
| Burmese | 429 | 0.5% |
| Canadian | 132 | 0.1% |
| Cape Verdean | 6 | 0.0% |
| Celtic | 52 | 0.1% |
| Central American | 7,933 | 8.7% |
| Central American Indian | 288 | 0.3% |
| Cherokee | 150 | 0.2% |
| Chilean | 152 | 0.2% |
| Choctaw | 5 | 0.0% |
| Colombian | 4,262 | 4.7% |
| Costa Rican | 1,758 | 1.9% |
| Croatian | 146 | 0.2% |
| Cuban | 252 | 0.3% |
| Cypriot | 20 | 0.0% |
| Czech | 175 | 0.2% |
| Czechoslovakian | 13 | 0.0% |
| Danish | 219 | 0.2% |
| Dominican | 1,783 | 2.0% |
| Dutch | 361 | 0.4% |
| Eastern European | 433 | 0.5% |
| Ecuadorian | 1,819 | 2.0% |
| English | 5,111 | 5.6% |
| Ethiopian | 12 | 0.0% |
| European | 677 | 0.7% |
| Filipino | 85 | 0.1% |
| Finnish | 52 | 0.1% |
| French | 1,269 | 1.4% |
| French Canadian | 688 | 0.8% |
| German | 6,085 | 6.7% |
| Ghanaian | 179 | 0.2% |
| Greek | 1,304 | 1.4% |
| Guamanian / Chamorro | 35 | 0.0% |
| Guatemalan | 2,557 | 2.8% |
| Guyanese | 34 | 0.0% |
| Haitian | 1,960 | 2.1% |
| Honduran | 2,587 | 2.8% |
| Hungarian | 958 | 1.1% |
| Icelander | 36 | 0.0% |
| Indian (Asian) | 1,212 | 1.3% |
| Indonesian | 4 | 0.0% |
| Iranian | 68 | 0.1% |
| Iraqi | 46 | 0.1% |
| Irish | 9,812 | 10.8% |
| Israeli | 19 | 0.0% |
| Italian | 11,855 | 13.0% |
| Jamaican | 2,761 | 3.0% |
| Kenyan | 5 | 0.0% |
| Korean | 716 | 0.8% |
| Laotian | 15 | 0.0% |
| Latvian | 31 | 0.0% |
| Lebanese | 130 | 0.1% |
| Liberian | 20 | 0.0% |
| Lithuanian | 220 | 0.2% |
| Macedonian | 19 | 0.0% |
| Malaysian | 25 | 0.0% |
| Maltese | 7 | 0.0% |
| Mexican | 4,920 | 5.4% |
| Mexican American Indian | 68 | 0.1% |
| Mongolian | 2 | 0.0% |
| Moroccan | 46 | 0.1% |
| Native Hawaiian | 19 | 0.0% |
| Nicaraguan | 149 | 0.2% |
| Nigerian | 296 | 0.3% |
| Northern European | 30 | 0.0% |
| Norwegian | 446 | 0.5% |
| Palestinian | 53 | 0.1% |
| Panamanian | 63 | 0.1% |
| Paraguayan | 95 | 0.1% |
| Pennsylvania German | 23 | 0.0% |
| Peruvian | 963 | 1.1% |
| Polish | 3,281 | 3.6% |
| Portuguese | 459 | 0.5% |
| Puerto Rican | 3,108 | 3.4% |
| Romanian | 125 | 0.1% |
| Russian | 722 | 0.8% |
| Salvadoran | 633 | 0.7% |
| Samoan | 19 | 0.0% |
| Scandinavian | 106 | 0.1% |
| Scotch-Irish | 484 | 0.5% |
| Scottish | 816 | 0.9% |
| Serbian | 20 | 0.0% |
| Sierra Leonean | 69 | 0.1% |
| Slovak | 146 | 0.2% |
| Slovene | 4 | 0.0% |
| South African | 4 | 0.0% |
| South American | 8,735 | 9.6% |
| South American Indian | 69 | 0.1% |
| Spaniard | 227 | 0.3% |
| Spanish | 201 | 0.2% |
| Sri Lankan | 136 | 0.2% |
| Subsaharan African | 1,289 | 1.4% |
| Swedish | 548 | 0.6% |
| Swiss | 666 | 0.7% |
| Syrian | 24 | 0.0% |
| Thai | 1,684 | 1.8% |
| Trinidadian and Tobagonian | 544 | 0.6% |
| Turkish | 100 | 0.1% |
| U.S. Virgin Islander | 87 | 0.1% |
| Ukrainian | 710 | 0.8% |
| Uruguayan | 414 | 0.4% |
| Venezuelan | 840 | 0.9% |
| Vietnamese | 44 | 0.1% |
| Welsh | 137 | 0.2% |
| West Indian | 29 | 0.0% |
| Yaqui | 22 | 0.0% |
| Yugoslavian | 20 | 0.0% | View All 125 Rows |
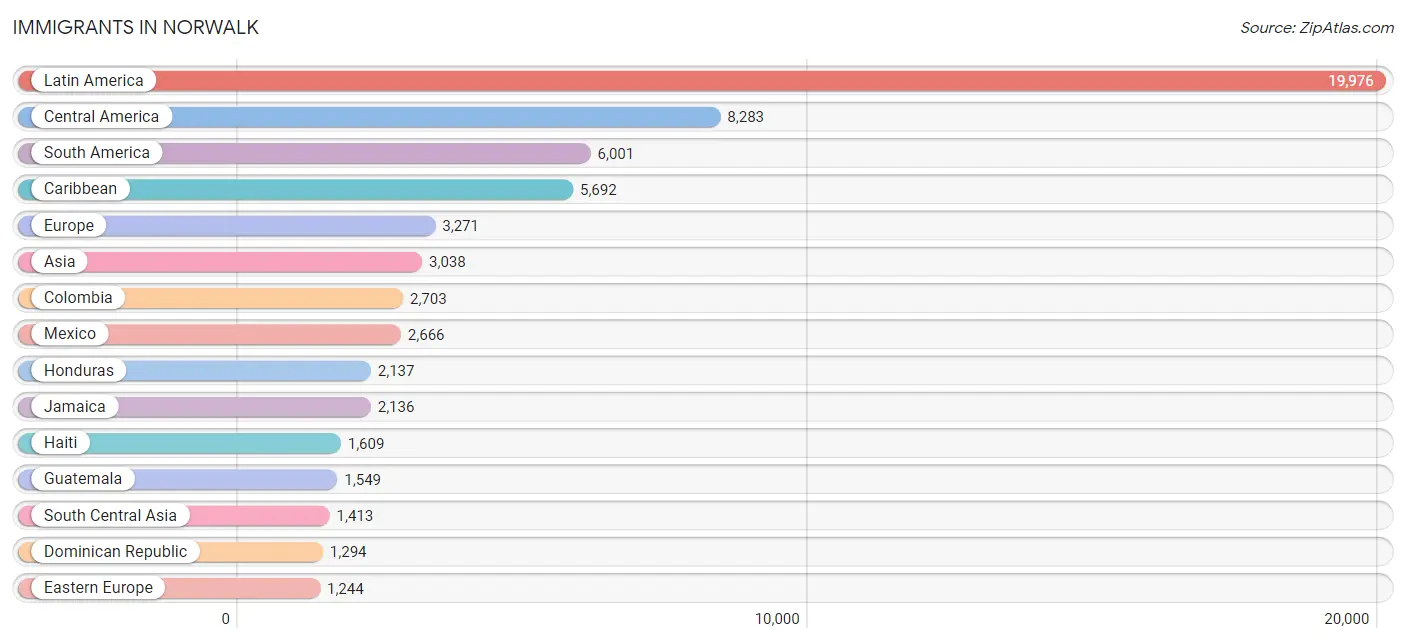
Immigrants in Norwalk
The most numerous immigrant groups reported in Norwalk came from Latin America (19,976 | 21.9%), Central America (8,283 | 9.1%), South America (6,001 | 6.6%), Caribbean (5,692 | 6.2%), and Europe (3,271 | 3.6%), together accounting for 47.5% of all Norwalk residents.
| Immigration Origin | # Population | % Population |
| Africa | 626 | 0.7% |
| Albania | 44 | 0.1% |
| Argentina | 70 | 0.1% |
| Asia | 3,038 | 3.3% |
| Australia | 48 | 0.1% |
| Bahamas | 41 | 0.1% |
| Bangladesh | 82 | 0.1% |
| Barbados | 54 | 0.1% |
| Belarus | 16 | 0.0% |
| Belgium | 16 | 0.0% |
| Bolivia | 26 | 0.0% |
| Brazil | 348 | 0.4% |
| Bulgaria | 7 | 0.0% |
| Canada | 286 | 0.3% |
| Caribbean | 5,692 | 6.2% |
| Central America | 8,283 | 9.1% |
| Chile | 165 | 0.2% |
| China | 702 | 0.8% |
| Colombia | 2,703 | 3.0% |
| Costa Rica | 1,180 | 1.3% |
| Cuba | 127 | 0.1% |
| Denmark | 23 | 0.0% |
| Dominica | 20 | 0.0% |
| Dominican Republic | 1,294 | 1.4% |
| Eastern Africa | 59 | 0.1% |
| Eastern Asia | 931 | 1.0% |
| Eastern Europe | 1,244 | 1.4% |
| Ecuador | 1,153 | 1.3% |
| El Salvador | 367 | 0.4% |
| England | 179 | 0.2% |
| Europe | 3,271 | 3.6% |
| France | 52 | 0.1% |
| Germany | 115 | 0.1% |
| Ghana | 74 | 0.1% |
| Greece | 400 | 0.4% |
| Guatemala | 1,549 | 1.7% |
| Guyana | 45 | 0.1% |
| Haiti | 1,609 | 1.8% |
| Honduras | 2,137 | 2.4% |
| Hong Kong | 31 | 0.0% |
| Hungary | 28 | 0.0% |
| India | 1,141 | 1.3% |
| Indonesia | 15 | 0.0% |
| Iran | 38 | 0.0% |
| Ireland | 129 | 0.1% |
| Israel | 15 | 0.0% |
| Italy | 499 | 0.5% |
| Jamaica | 2,136 | 2.4% |
| Japan | 25 | 0.0% |
| Kazakhstan | 28 | 0.0% |
| Kenya | 5 | 0.0% |
| Korea | 204 | 0.2% |
| Laos | 11 | 0.0% |
| Latin America | 19,976 | 21.9% |
| Latvia | 1 | 0.0% |
| Lebanon | 15 | 0.0% |
| Liberia | 20 | 0.0% |
| Malaysia | 5 | 0.0% |
| Mexico | 2,666 | 2.9% |
| Morocco | 43 | 0.1% |
| Nepal | 35 | 0.0% |
| Netherlands | 20 | 0.0% |
| Nicaragua | 380 | 0.4% |
| Nigeria | 151 | 0.2% |
| Northern Africa | 43 | 0.1% |
| Northern Europe | 580 | 0.6% |
| Norway | 10 | 0.0% |
| Oceania | 63 | 0.1% |
| Pakistan | 15 | 0.0% |
| Peru | 708 | 0.8% |
| Philippines | 341 | 0.4% |
| Poland | 573 | 0.6% |
| Portugal | 141 | 0.2% |
| Romania | 62 | 0.1% |
| Russia | 160 | 0.2% |
| Saudi Arabia | 58 | 0.1% |
| Scotland | 8 | 0.0% |
| Senegal | 17 | 0.0% |
| Serbia | 20 | 0.0% |
| Sierra Leone | 69 | 0.1% |
| Singapore | 3 | 0.0% |
| South Africa | 106 | 0.1% |
| South America | 6,001 | 6.6% |
| South Central Asia | 1,413 | 1.5% |
| South Eastern Asia | 392 | 0.4% |
| Southern Europe | 1,212 | 1.3% |
| Spain | 172 | 0.2% |
| Sri Lanka | 68 | 0.1% |
| St. Vincent and the Grenadines | 45 | 0.1% |
| Sweden | 18 | 0.0% |
| Switzerland | 22 | 0.0% |
| Taiwan | 8 | 0.0% |
| Trinidad and Tobago | 308 | 0.3% |
| Turkey | 85 | 0.1% |
| Uganda | 46 | 0.1% |
| Ukraine | 333 | 0.4% |
| Uruguay | 191 | 0.2% |
| Venezuela | 562 | 0.6% |
| Western Africa | 418 | 0.5% |
| Western Asia | 302 | 0.3% |
| Western Europe | 225 | 0.3% | View All 101 Rows |
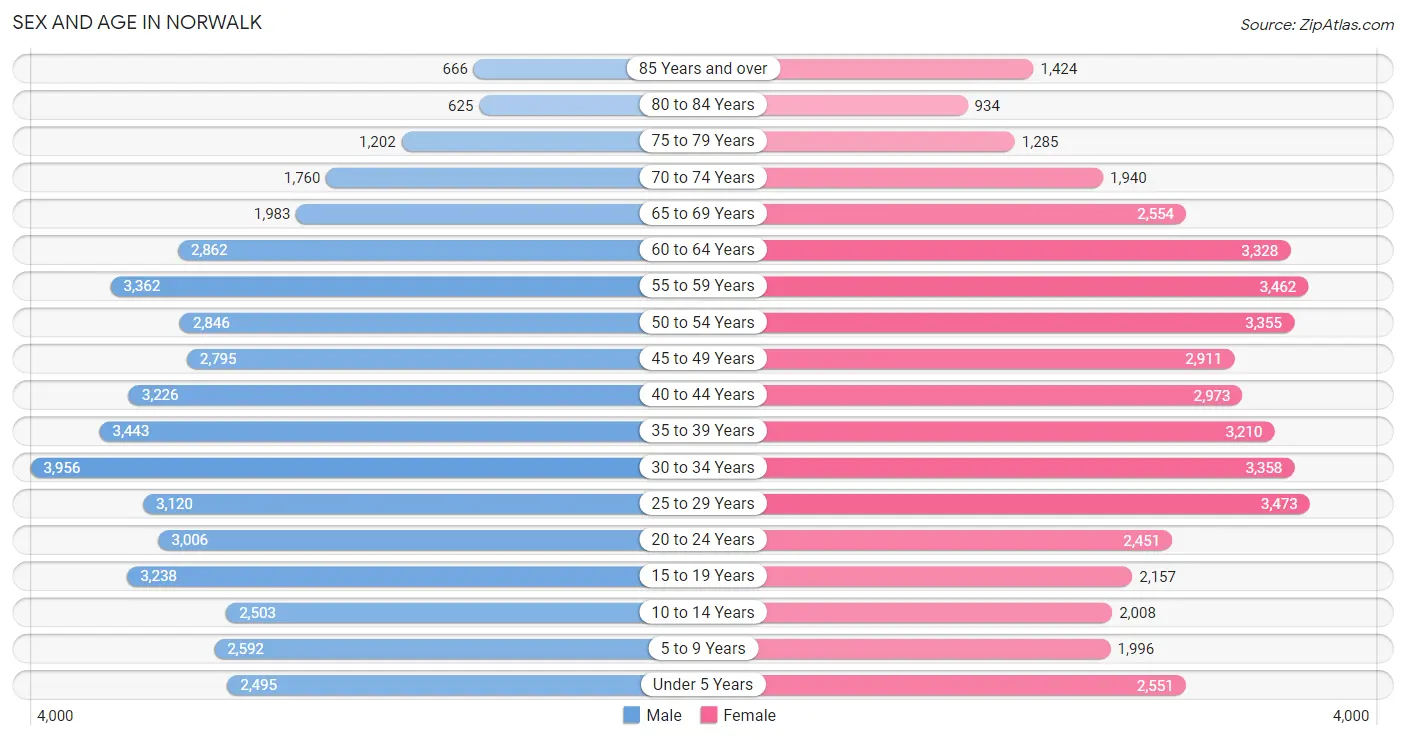
Sex and Age in Norwalk
Sex and Age in Norwalk
The most populous age groups in Norwalk are 30 to 34 Years (3,956 | 8.7%) for men and 25 to 29 Years (3,473 | 7.6%) for women.
| Age Bracket | Male | Female |
| Under 5 Years | 2,495 (5.5%) | 2,551 (5.6%) |
| 5 to 9 Years | 2,592 (5.7%) | 1,996 (4.4%) |
| 10 to 14 Years | 2,503 (5.5%) | 2,008 (4.4%) |
| 15 to 19 Years | 3,238 (7.1%) | 2,157 (4.8%) |
| 20 to 24 Years | 3,006 (6.6%) | 2,451 (5.4%) |
| 25 to 29 Years | 3,120 (6.8%) | 3,473 (7.6%) |
| 30 to 34 Years | 3,956 (8.7%) | 3,358 (7.4%) |
| 35 to 39 Years | 3,443 (7.5%) | 3,210 (7.1%) |
| 40 to 44 Years | 3,226 (7.1%) | 2,973 (6.6%) |
| 45 to 49 Years | 2,795 (6.1%) | 2,911 (6.4%) |
| 50 to 54 Years | 2,846 (6.2%) | 3,355 (7.4%) |
| 55 to 59 Years | 3,362 (7.4%) | 3,462 (7.6%) |
| 60 to 64 Years | 2,862 (6.3%) | 3,328 (7.3%) |
| 65 to 69 Years | 1,983 (4.3%) | 2,554 (5.6%) |
| 70 to 74 Years | 1,760 (3.8%) | 1,940 (4.3%) |
| 75 to 79 Years | 1,202 (2.6%) | 1,285 (2.8%) |
| 80 to 84 Years | 625 (1.4%) | 934 (2.1%) |
| 85 Years and over | 666 (1.5%) | 1,424 (3.1%) |
| Total | 45,680 (100.0%) | 45,370 (100.0%) |
Families and Households in Norwalk
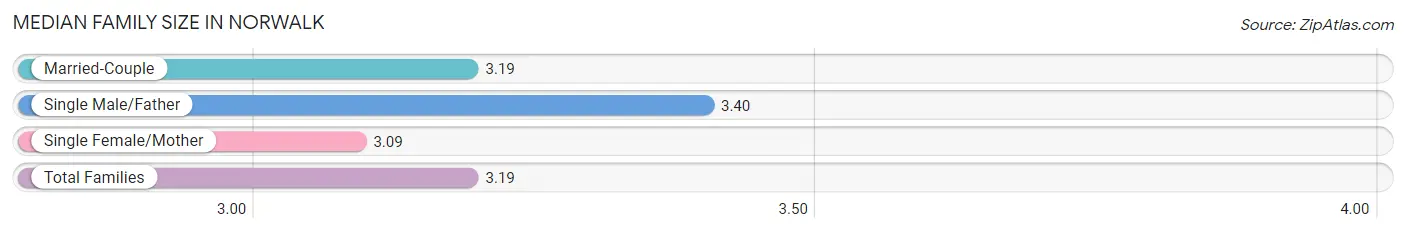
Median Family Size in Norwalk
The median family size in Norwalk is 3.19 persons per family, with single male/father families (1,897 | 8.4%) accounting for the largest median family size of 3.4 persons per family. On the other hand, single female/mother families (4,342 | 19.2%) represent the smallest median family size with 3.09 persons per family.
| Family Type | # Families | Family Size |
| Married-Couple | 16,375 (72.4%) | 3.19 |
| Single Male/Father | 1,897 (8.4%) | 3.40 |
| Single Female/Mother | 4,342 (19.2%) | 3.09 |
| Total Families | 22,614 (100.0%) | 3.19 |
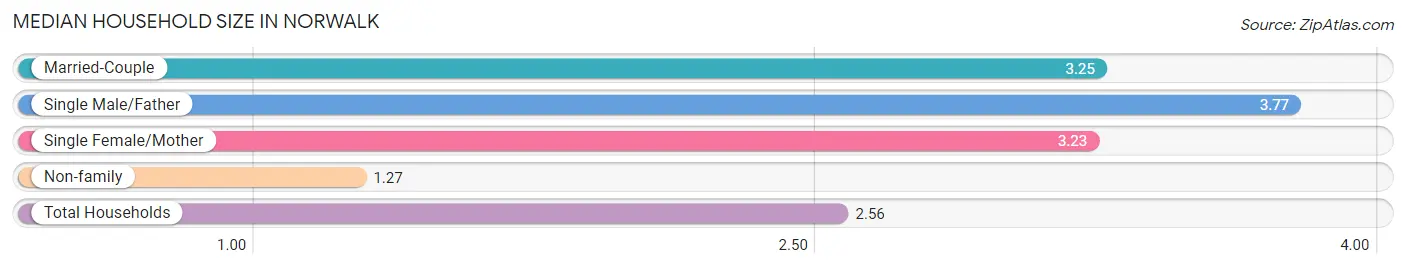
Median Household Size in Norwalk
The median household size in Norwalk is 2.56 persons per household, with single male/father households (1,897 | 5.4%) accounting for the largest median household size of 3.77 persons per household. non-family households (12,658 | 35.9%) represent the smallest median household size with 1.27 persons per household.
| Household Type | # Households | Household Size |
| Married-Couple | 16,375 (46.4%) | 3.25 |
| Single Male/Father | 1,897 (5.4%) | 3.77 |
| Single Female/Mother | 4,342 (12.3%) | 3.23 |
| Non-family | 12,658 (35.9%) | 1.27 |
| Total Households | 35,272 (100.0%) | 2.56 |
Household Size by Marriage Status in Norwalk
Out of a total of 35,272 households in Norwalk, 22,614 (64.1%) are family households, while 12,658 (35.9%) are nonfamily households. The most numerous type of family households are 2-person households, comprising 8,980, and the most common type of nonfamily households are 1-person households, comprising 10,266.
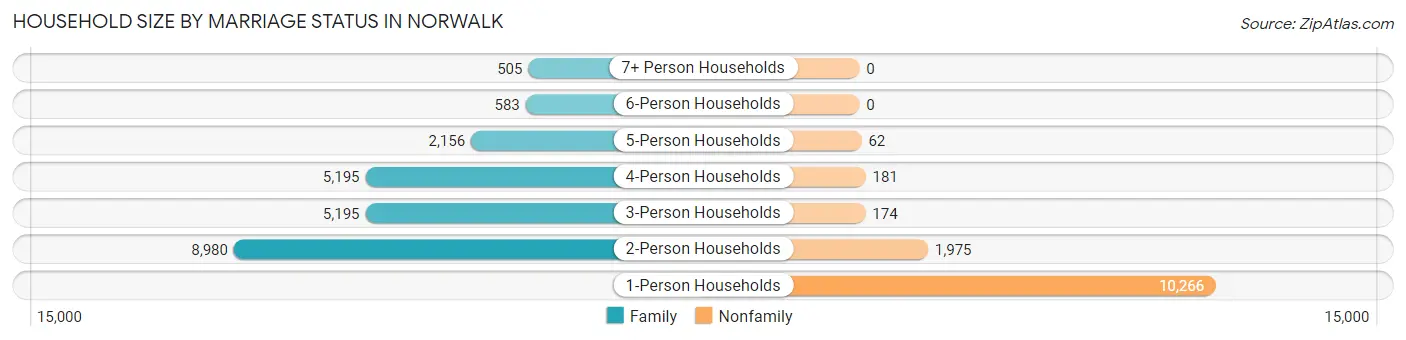
| Household Size | Family Households | Nonfamily Households |
| 1-Person Households | - | 10,266 (29.1%) |
| 2-Person Households | 8,980 (25.5%) | 1,975 (5.6%) |
| 3-Person Households | 5,195 (14.7%) | 174 (0.5%) |
| 4-Person Households | 5,195 (14.7%) | 181 (0.5%) |
| 5-Person Households | 2,156 (6.1%) | 62 (0.2%) |
| 6-Person Households | 583 (1.7%) | 0 (0.0%) |
| 7+ Person Households | 505 (1.4%) | 0 (0.0%) |
| Total | 22,614 (64.1%) | 12,658 (35.9%) |
Female Fertility in Norwalk
Fertility by Age in Norwalk
Average fertility rate in Norwalk is 53.0 births per 1,000 women. Women in the age bracket of 20 to 34 years have the highest fertility rate with 78.0 births per 1,000 women. Women in the age bracket of 20 to 34 years acount for 63.6% of all women with births.
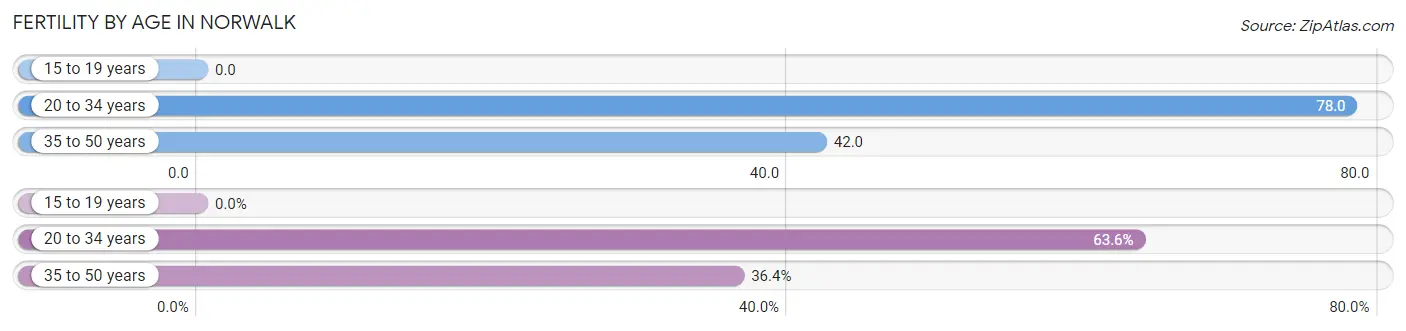
| Age Bracket | Women with Births | Births / 1,000 Women |
| 15 to 19 years | 0 (0.0%) | 0.0 |
| 20 to 34 years | 722 (63.6%) | 78.0 |
| 35 to 50 years | 413 (36.4%) | 42.0 |
| Total | 1,135 (100.0%) | 53.0 |
Fertility by Age by Marriage Status in Norwalk
85.0% of women with births (1,135) in Norwalk are married. The highest percentage of unmarried women with births falls into 20 to 34 years age bracket with 16.1% of them unmarried at the time of birth, while the lowest percentage of unmarried women with births belong to 35 to 50 years age bracket with 13.1% of them unmarried.
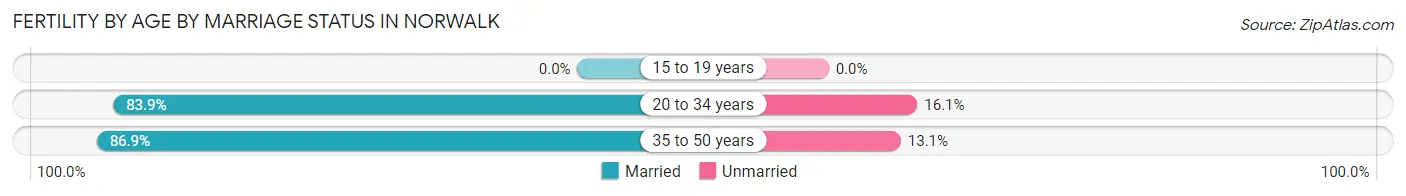
| Age Bracket | Married | Unmarried |
| 15 to 19 years | 0 (0.0%) | 0 (0.0%) |
| 20 to 34 years | 606 (83.9%) | 116 (16.1%) |
| 35 to 50 years | 359 (86.9%) | 54 (13.1%) |
| Total | 965 (85.0%) | 170 (15.0%) |
Fertility by Education in Norwalk
Average fertility rate in Norwalk is 53.0 births per 1,000 women. Women with the education attainment of less than high school have the highest fertility rate of 86.0 births per 1,000 women, while women with the education attainment of college or associate's degree have the lowest fertility at 24.0 births per 1,000 women. Women with the education attainment of bachelor's degree represent 27.6% of all women with births.
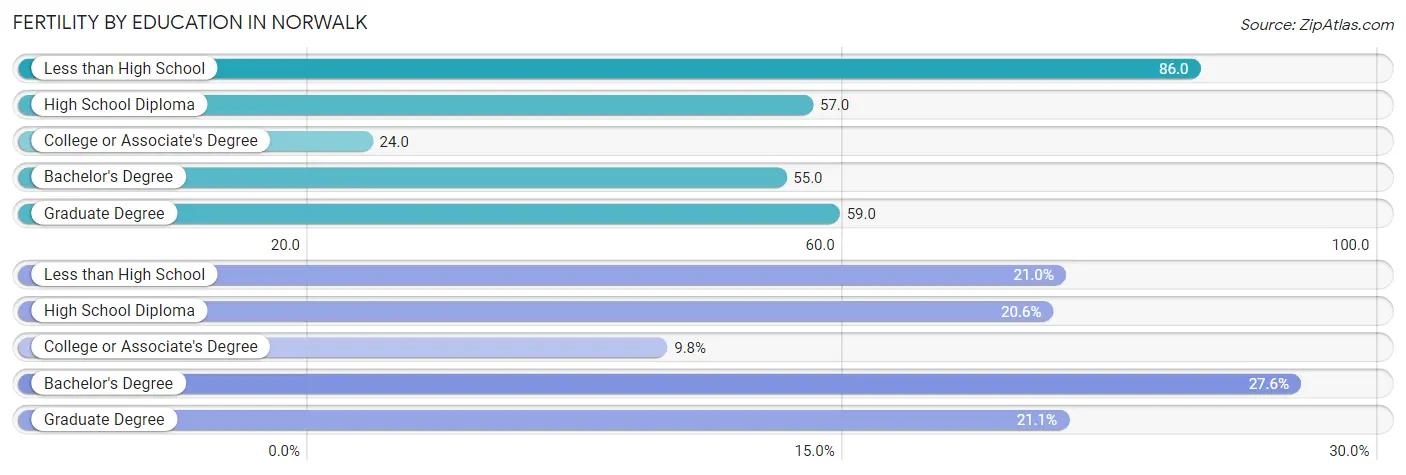
| Educational Attainment | Women with Births | Births / 1,000 Women |
| Less than High School | 238 (21.0%) | 86.0 |
| High School Diploma | 234 (20.6%) | 57.0 |
| College or Associate's Degree | 111 (9.8%) | 24.0 |
| Bachelor's Degree | 313 (27.6%) | 55.0 |
| Graduate Degree | 239 (21.1%) | 59.0 |
| Total | 1,135 (100.0%) | 53.0 |
Fertility by Education by Marriage Status in Norwalk
15.0% of women with births in Norwalk are unmarried. Women with the educational attainment of less than high school are most likely to be married with 91.2% of them married at childbirth, while women with the educational attainment of college or associate's degree are least likely to be married with 64.9% of them unmarried at childbirth.

| Educational Attainment | Married | Unmarried |
| Less than High School | 217 (91.2%) | 21 (8.8%) |
| High School Diploma | 210 (89.7%) | 24 (10.3%) |
| College or Associate's Degree | 39 (35.1%) | 72 (64.9%) |
| Bachelor's Degree | 285 (91.0%) | 28 (8.9%) |
| Graduate Degree | 214 (89.5%) | 25 (10.5%) |
| Total | 965 (85.0%) | 170 (15.0%) |
Employment Characteristics in Norwalk
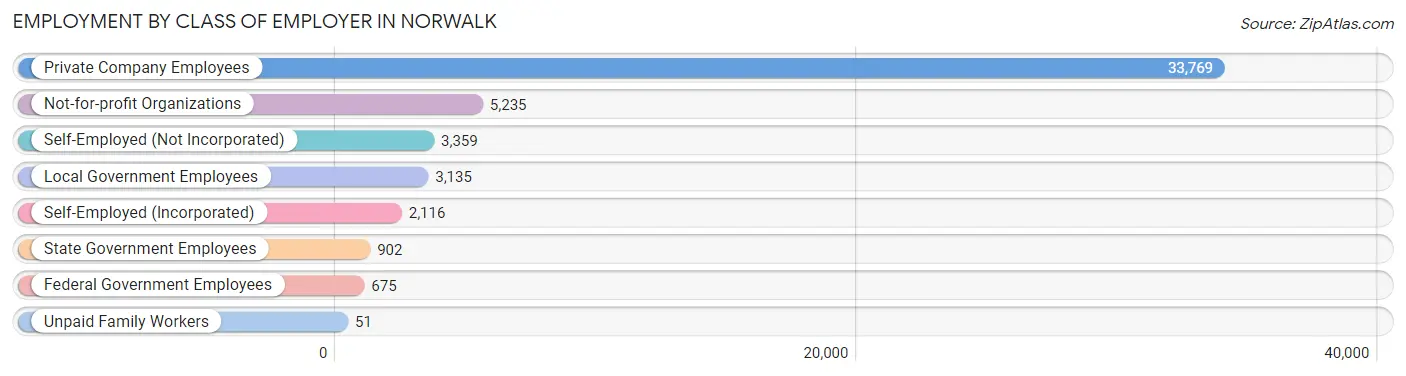
Employment by Class of Employer in Norwalk
Among the 49,242 employed individuals in Norwalk, private company employees (33,769 | 68.6%), not-for-profit organizations (5,235 | 10.6%), and self-employed (not incorporated) (3,359 | 6.8%) make up the most common classes of employment.
| Employer Class | # Employees | % Employees |
| Private Company Employees | 33,769 | 68.6% |
| Self-Employed (Incorporated) | 2,116 | 4.3% |
| Self-Employed (Not Incorporated) | 3,359 | 6.8% |
| Not-for-profit Organizations | 5,235 | 10.6% |
| Local Government Employees | 3,135 | 6.4% |
| State Government Employees | 902 | 1.8% |
| Federal Government Employees | 675 | 1.4% |
| Unpaid Family Workers | 51 | 0.1% |
| Total | 49,242 | 100.0% |
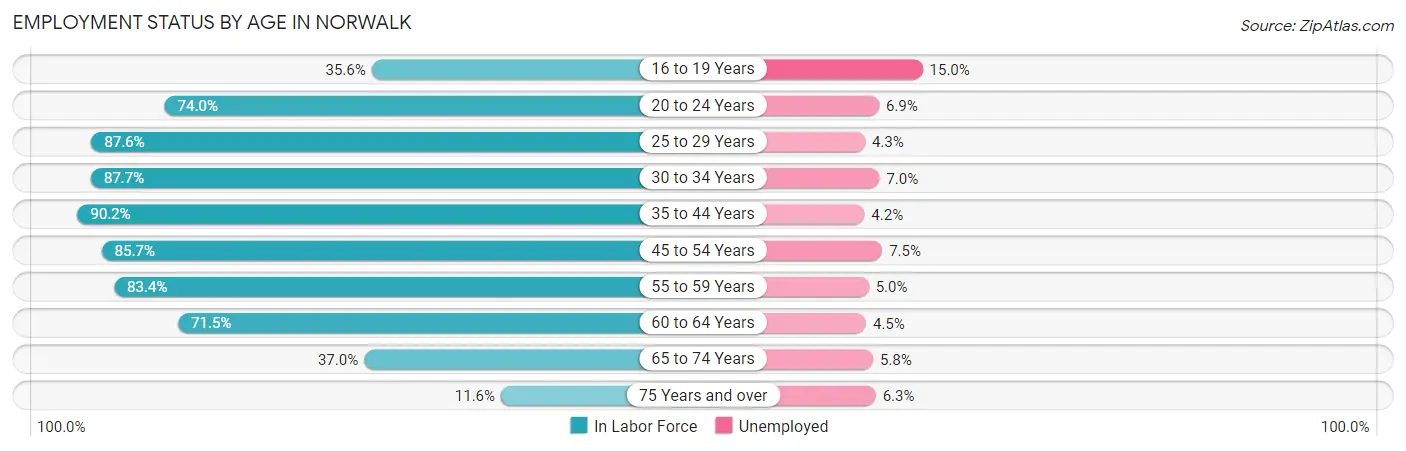
Employment Status by Age in Norwalk
According to the labor force statistics for Norwalk, out of the total population over 16 years of age (75,401), 70.7% or 53,309 individuals are in the labor force, with 5.9% or 3,145 of them unemployed. The age group with the highest labor force participation rate is 35 to 44 years, with 90.2% or 11,593 individuals in the labor force. Within the labor force, the 16 to 19 years age range has the highest percentage of unemployed individuals, with 15.0% or 208 of them being unemployed.
| Age Bracket | In Labor Force | Unemployed |
| 16 to 19 Years | 1,385 (35.6%) | 208 (15.0%) |
| 20 to 24 Years | 4,038 (74.0%) | 279 (6.9%) |
| 25 to 29 Years | 5,775 (87.6%) | 248 (4.3%) |
| 30 to 34 Years | 6,414 (87.7%) | 449 (7.0%) |
| 35 to 44 Years | 11,593 (90.2%) | 487 (4.2%) |
| 45 to 54 Years | 10,204 (85.7%) | 765 (7.5%) |
| 55 to 59 Years | 5,691 (83.4%) | 285 (5.0%) |
| 60 to 64 Years | 4,426 (71.5%) | 199 (4.5%) |
| 65 to 74 Years | 3,048 (37.0%) | 177 (5.8%) |
| 75 Years and over | 712 (11.6%) | 45 (6.3%) |
| Total | 53,309 (70.7%) | 3,145 (5.9%) |
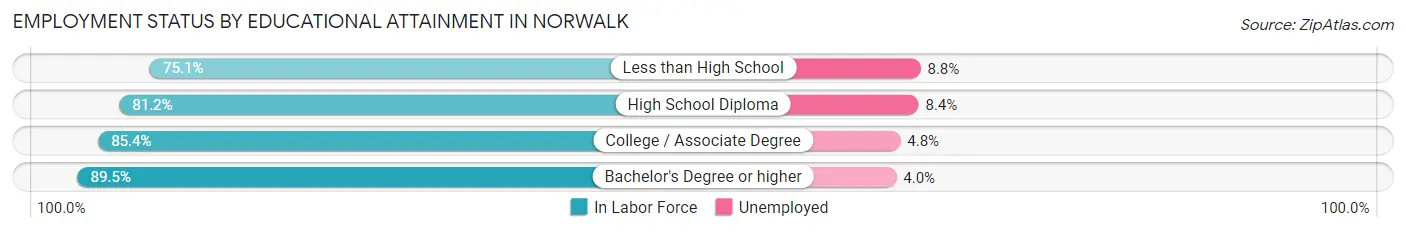
Employment Status by Educational Attainment in Norwalk
According to labor force statistics for Norwalk, 85.4% of individuals (44,135) out of the total population between 25 and 64 years of age (51,680) are in the labor force, with 5.5% or 2,427 of them being unemployed. The group with the highest labor force participation rate are those with the educational attainment of bachelor's degree or higher, with 89.5% or 21,000 individuals in the labor force. Within the labor force, individuals with less than high school education have the highest percentage of unemployment, with 8.8% or 328 of them being unemployed.
| Educational Attainment | In Labor Force | Unemployed |
| Less than High School | 3,726 (75.1%) | 437 (8.8%) |
| High School Diploma | 9,275 (81.2%) | 960 (8.4%) |
| College / Associate Degree | 10,105 (85.4%) | 568 (4.8%) |
| Bachelor's Degree or higher | 21,000 (89.5%) | 939 (4.0%) |
| Total | 44,135 (85.4%) | 2,842 (5.5%) |
Employment Occupations by Sex in Norwalk
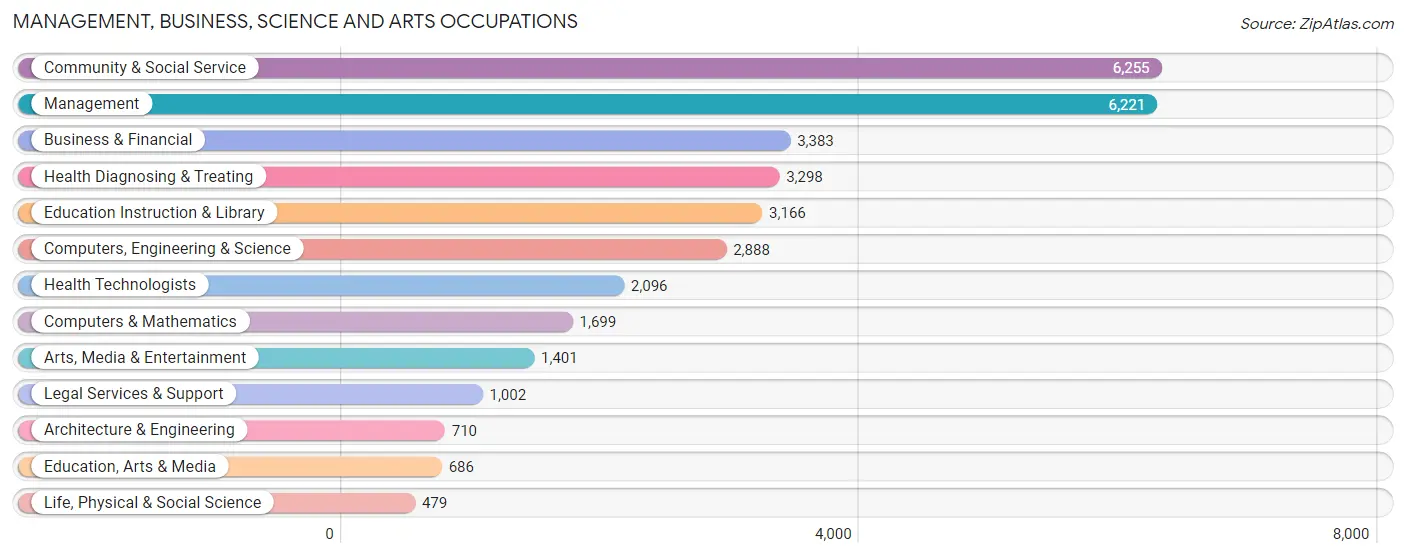
Management, Business, Science and Arts Occupations
The most common Management, Business, Science and Arts occupations in Norwalk are Community & Social Service (6,255 | 12.5%), Management (6,221 | 12.4%), Business & Financial (3,383 | 6.8%), Health Diagnosing & Treating (3,298 | 6.6%), and Education Instruction & Library (3,166 | 6.3%).
Management, Business, Science and Arts Occupations by Sex
Within the Management, Business, Science and Arts occupations in Norwalk, the most male-oriented occupations are Architecture & Engineering (92.7%), Computers & Mathematics (83.1%), and Computers, Engineering & Science (81.8%), while the most female-oriented occupations are Education, Arts & Media (82.9%), Education Instruction & Library (76.0%), and Health Technologists (75.2%).
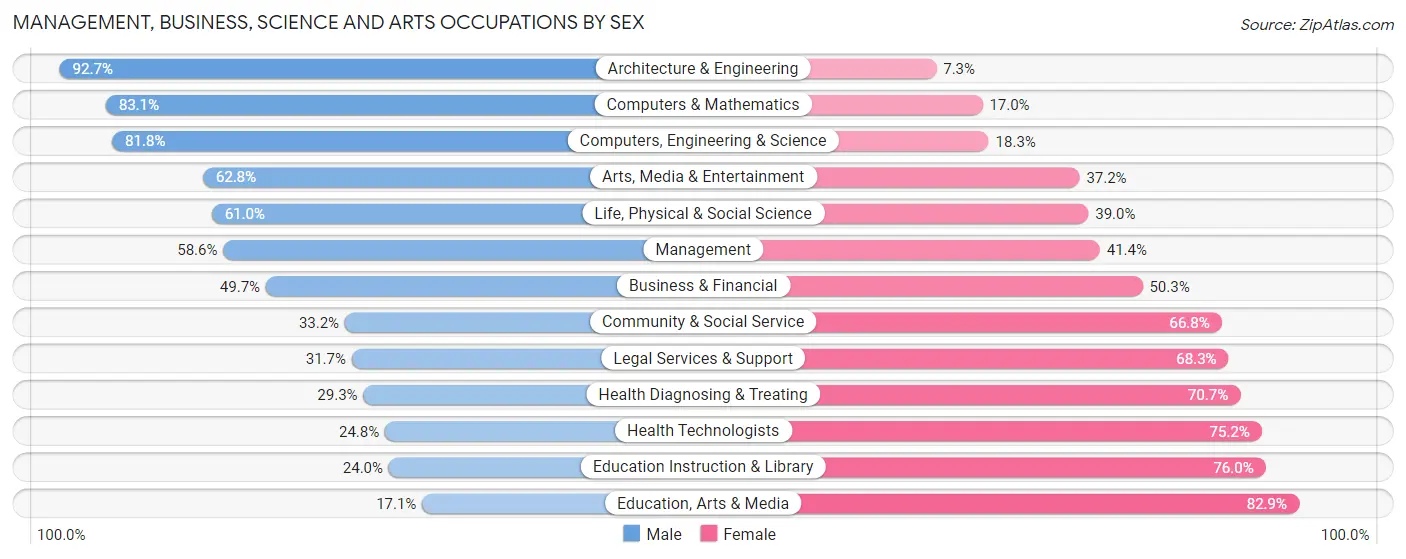
| Occupation | Male | Female |
| Management | 3,643 (58.6%) | 2,578 (41.4%) |
| Business & Financial | 1,680 (49.7%) | 1,703 (50.3%) |
| Computers, Engineering & Science | 2,361 (81.8%) | 527 (18.2%) |
| Computers & Mathematics | 1,411 (83.1%) | 288 (17.0%) |
| Architecture & Engineering | 658 (92.7%) | 52 (7.3%) |
| Life, Physical & Social Science | 292 (61.0%) | 187 (39.0%) |
| Community & Social Service | 2,075 (33.2%) | 4,180 (66.8%) |
| Education, Arts & Media | 117 (17.1%) | 569 (82.9%) |
| Legal Services & Support | 318 (31.7%) | 684 (68.3%) |
| Education Instruction & Library | 760 (24.0%) | 2,406 (76.0%) |
| Arts, Media & Entertainment | 880 (62.8%) | 521 (37.2%) |
| Health Diagnosing & Treating | 967 (29.3%) | 2,331 (70.7%) |
| Health Technologists | 520 (24.8%) | 1,576 (75.2%) |
| Total (Category) | 10,726 (48.7%) | 11,319 (51.3%) |
| Total (Overall) | 26,653 (53.1%) | 23,495 (46.9%) |
Services Occupations
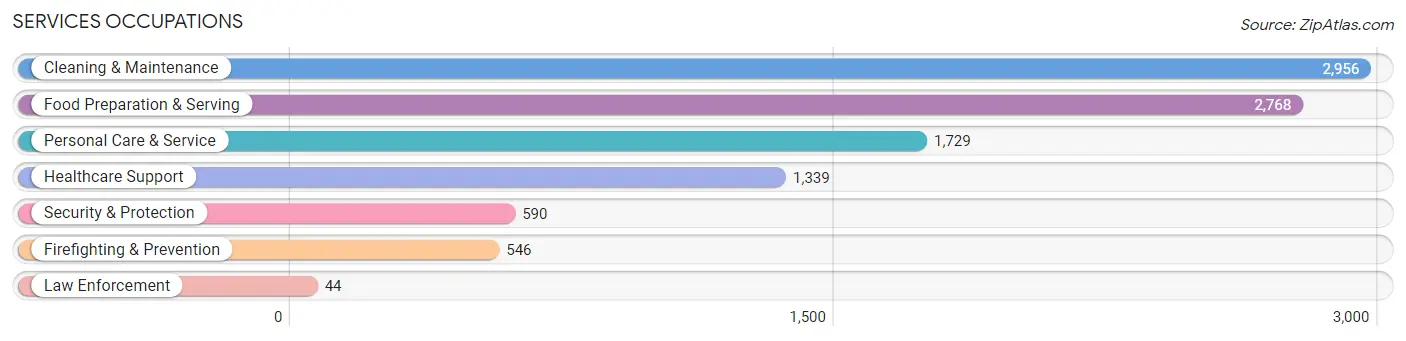
The most common Services occupations in Norwalk are Cleaning & Maintenance (2,956 | 5.9%), Food Preparation & Serving (2,768 | 5.5%), Personal Care & Service (1,729 | 3.5%), Healthcare Support (1,339 | 2.7%), and Security & Protection (590 | 1.2%).
Services Occupations by Sex
Within the Services occupations in Norwalk, the most male-oriented occupations are Law Enforcement (84.1%), Security & Protection (72.4%), and Firefighting & Prevention (71.4%), while the most female-oriented occupations are Healthcare Support (83.6%), Personal Care & Service (77.0%), and Cleaning & Maintenance (46.4%).
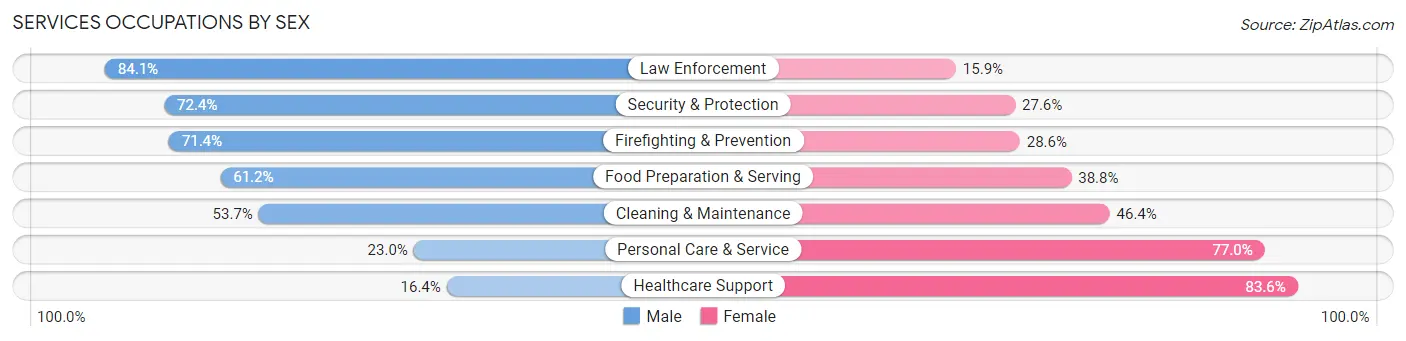
| Occupation | Male | Female |
| Healthcare Support | 220 (16.4%) | 1,119 (83.6%) |
| Security & Protection | 427 (72.4%) | 163 (27.6%) |
| Firefighting & Prevention | 390 (71.4%) | 156 (28.6%) |
| Law Enforcement | 37 (84.1%) | 7 (15.9%) |
| Food Preparation & Serving | 1,695 (61.2%) | 1,073 (38.8%) |
| Cleaning & Maintenance | 1,586 (53.6%) | 1,370 (46.4%) |
| Personal Care & Service | 397 (23.0%) | 1,332 (77.0%) |
| Total (Category) | 4,325 (46.1%) | 5,057 (53.9%) |
| Total (Overall) | 26,653 (53.1%) | 23,495 (46.9%) |
Sales and Office Occupations
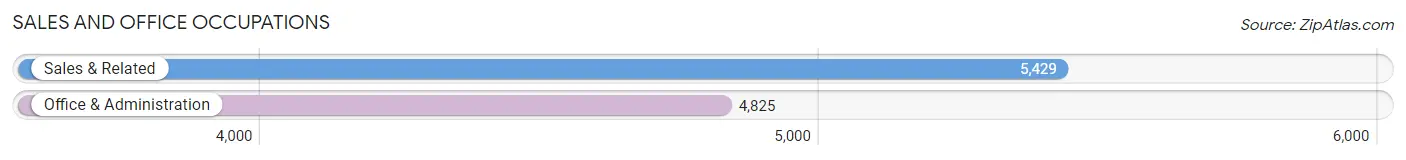
The most common Sales and Office occupations in Norwalk are Sales & Related (5,429 | 10.8%), and Office & Administration (4,825 | 9.6%).
Sales and Office Occupations by Sex
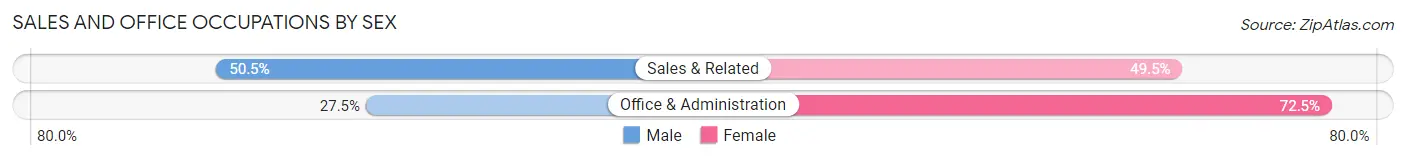
| Occupation | Male | Female |
| Sales & Related | 2,741 (50.5%) | 2,688 (49.5%) |
| Office & Administration | 1,327 (27.5%) | 3,498 (72.5%) |
| Total (Category) | 4,068 (39.7%) | 6,186 (60.3%) |
| Total (Overall) | 26,653 (53.1%) | 23,495 (46.9%) |
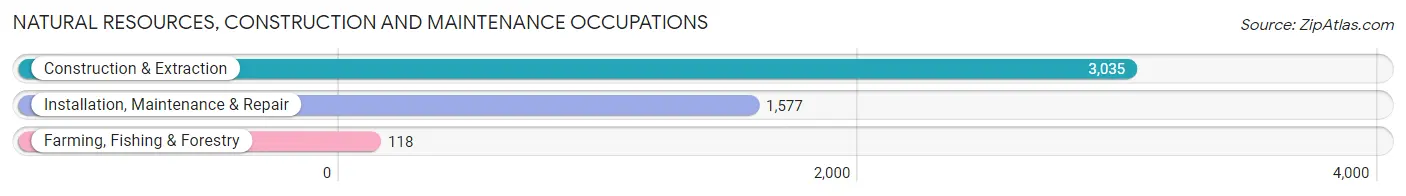
Natural Resources, Construction and Maintenance Occupations
The most common Natural Resources, Construction and Maintenance occupations in Norwalk are Construction & Extraction (3,035 | 6.0%), Installation, Maintenance & Repair (1,577 | 3.1%), and Farming, Fishing & Forestry (118 | 0.2%).
Natural Resources, Construction and Maintenance Occupations by Sex
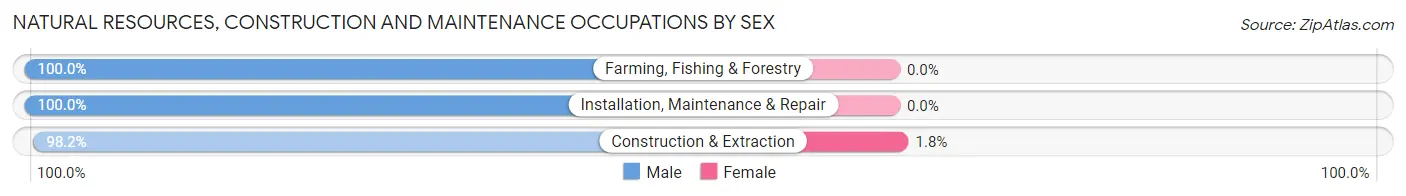
| Occupation | Male | Female |
| Farming, Fishing & Forestry | 118 (100.0%) | 0 (0.0%) |
| Construction & Extraction | 2,980 (98.2%) | 55 (1.8%) |
| Installation, Maintenance & Repair | 1,577 (100.0%) | 0 (0.0%) |
| Total (Category) | 4,675 (98.8%) | 55 (1.2%) |
| Total (Overall) | 26,653 (53.1%) | 23,495 (46.9%) |
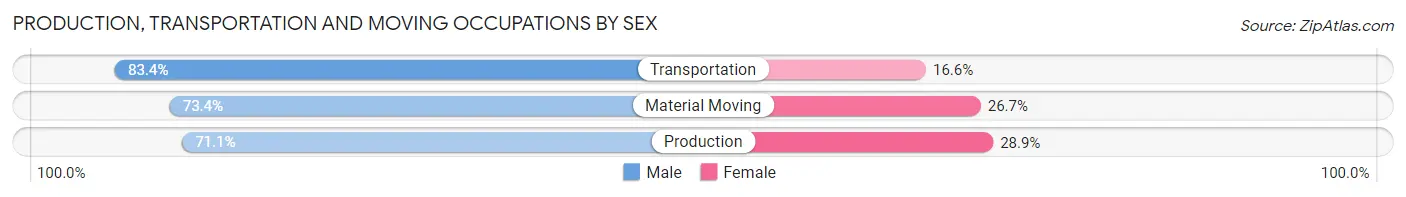
Production, Transportation and Moving Occupations
The most common Production, Transportation and Moving occupations in Norwalk are Transportation (1,470 | 2.9%), Production (1,310 | 2.6%), and Material Moving (957 | 1.9%).
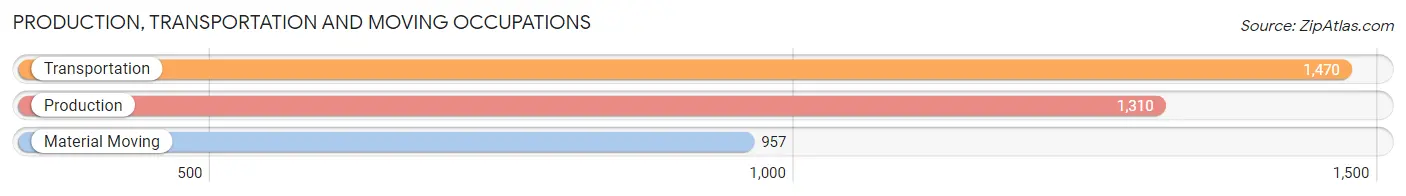
Production, Transportation and Moving Occupations by Sex
| Occupation | Male | Female |
| Production | 931 (71.1%) | 379 (28.9%) |
| Transportation | 1,226 (83.4%) | 244 (16.6%) |
| Material Moving | 702 (73.4%) | 255 (26.7%) |
| Total (Category) | 2,859 (76.5%) | 878 (23.5%) |
| Total (Overall) | 26,653 (53.1%) | 23,495 (46.9%) |
Employment Industries by Sex in Norwalk
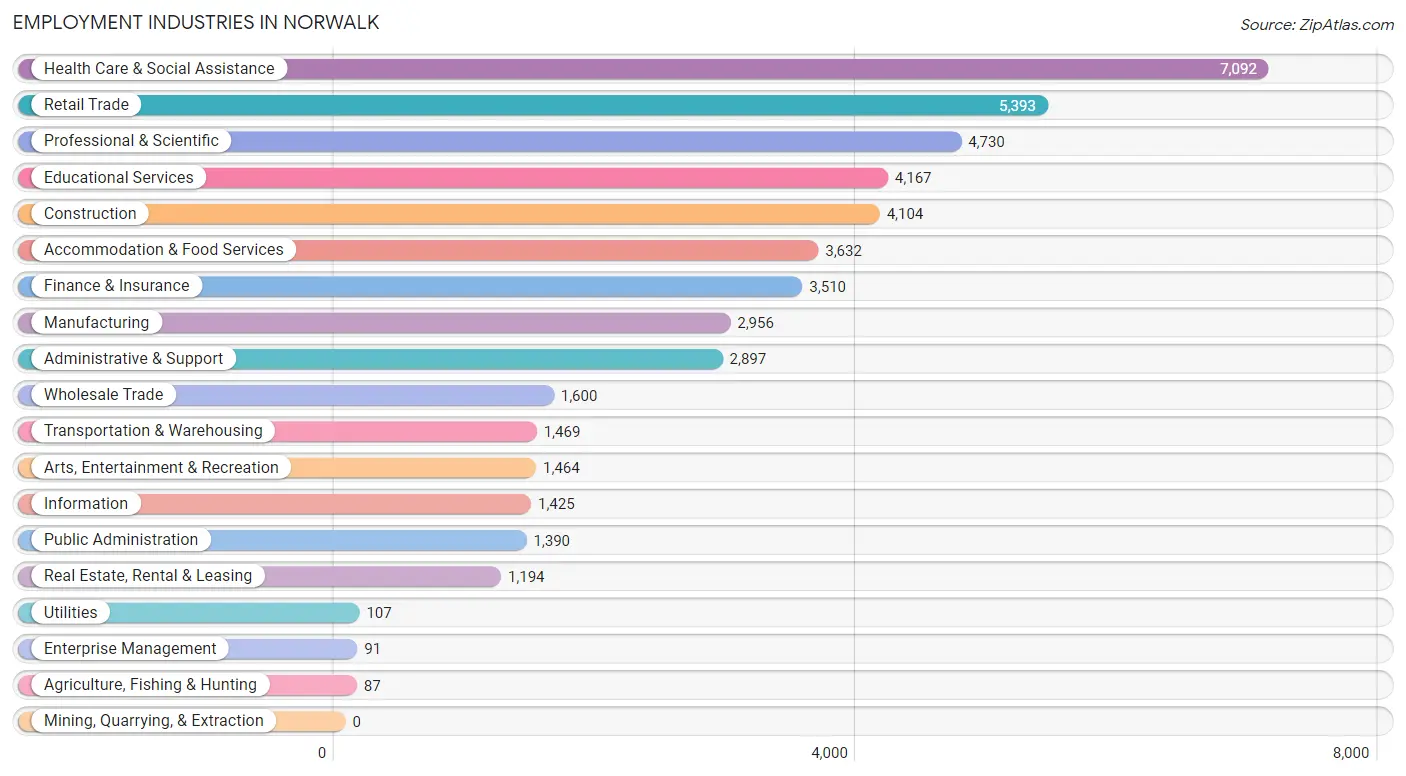
Employment Industries in Norwalk
The major employment industries in Norwalk include Health Care & Social Assistance (7,092 | 14.1%), Retail Trade (5,393 | 10.7%), Professional & Scientific (4,730 | 9.4%), Educational Services (4,167 | 8.3%), and Construction (4,104 | 8.2%).
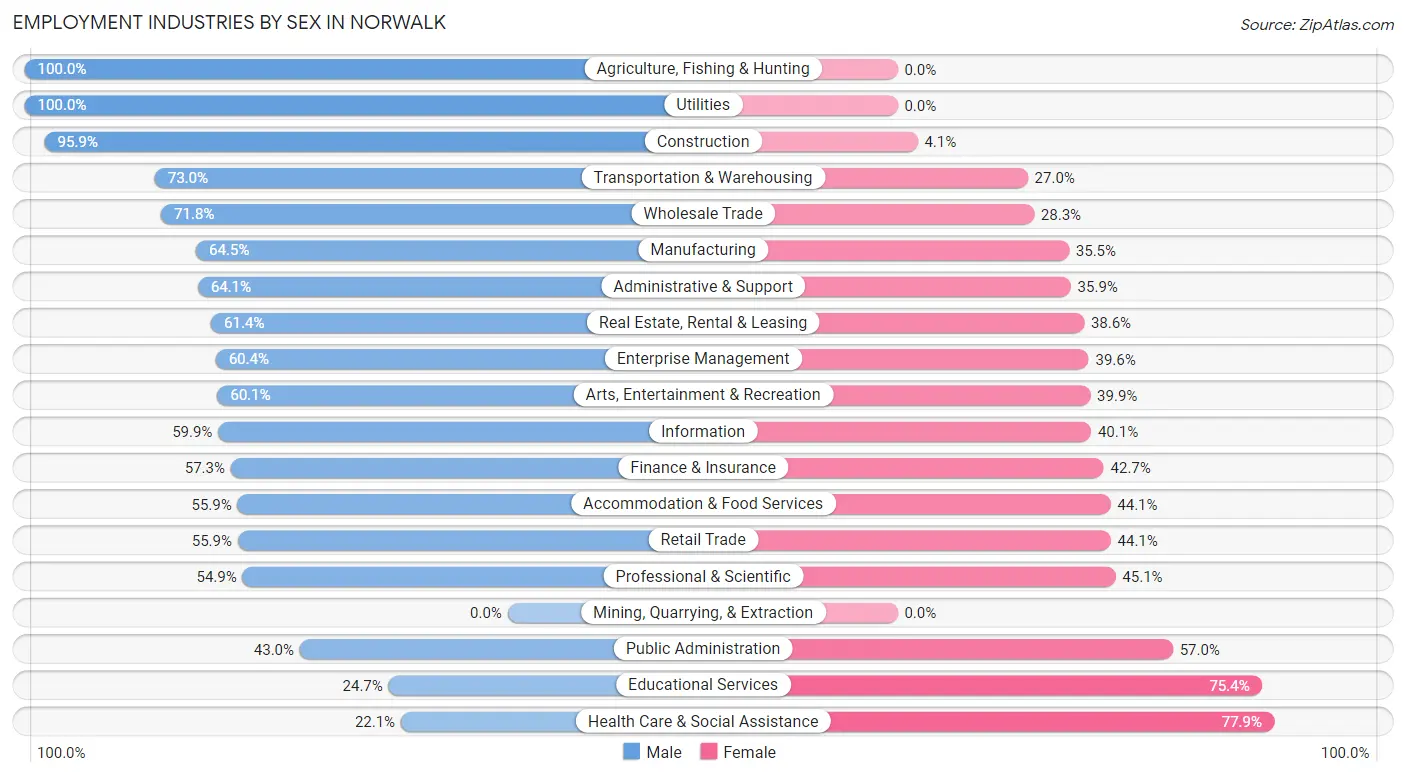
Employment Industries by Sex in Norwalk
The Norwalk industries that see more men than women are Agriculture, Fishing & Hunting (100.0%), Utilities (100.0%), and Construction (95.9%), whereas the industries that tend to have a higher number of women are Health Care & Social Assistance (77.9%), Educational Services (75.3%), and Public Administration (57.0%).
| Industry | Male | Female |
| Agriculture, Fishing & Hunting | 87 (100.0%) | 0 (0.0%) |
| Mining, Quarrying, & Extraction | 0 (0.0%) | 0 (0.0%) |
| Construction | 3,934 (95.9%) | 170 (4.1%) |
| Manufacturing | 1,907 (64.5%) | 1,049 (35.5%) |
| Wholesale Trade | 1,148 (71.8%) | 452 (28.2%) |
| Retail Trade | 3,013 (55.9%) | 2,380 (44.1%) |
| Transportation & Warehousing | 1,073 (73.0%) | 396 (27.0%) |
| Utilities | 107 (100.0%) | 0 (0.0%) |
| Information | 854 (59.9%) | 571 (40.1%) |
| Finance & Insurance | 2,012 (57.3%) | 1,498 (42.7%) |
| Real Estate, Rental & Leasing | 733 (61.4%) | 461 (38.6%) |
| Professional & Scientific | 2,596 (54.9%) | 2,134 (45.1%) |
| Enterprise Management | 55 (60.4%) | 36 (39.6%) |
| Administrative & Support | 1,858 (64.1%) | 1,039 (35.9%) |
| Educational Services | 1,027 (24.6%) | 3,140 (75.3%) |
| Health Care & Social Assistance | 1,567 (22.1%) | 5,525 (77.9%) |
| Arts, Entertainment & Recreation | 880 (60.1%) | 584 (39.9%) |
| Accommodation & Food Services | 2,031 (55.9%) | 1,601 (44.1%) |
| Public Administration | 598 (43.0%) | 792 (57.0%) |
| Total | 26,653 (53.1%) | 23,495 (46.9%) |
Education in Norwalk
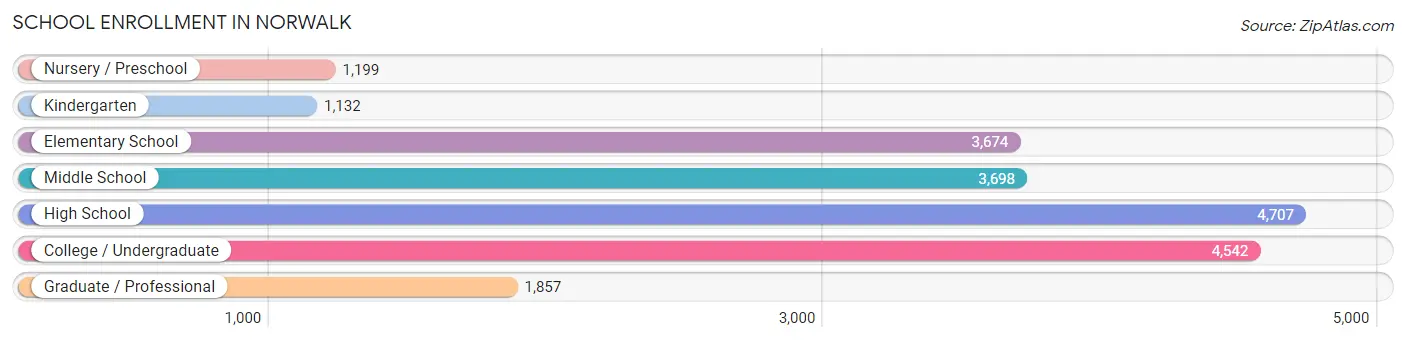
School Enrollment in Norwalk
The most common levels of schooling among the 20,809 students in Norwalk are high school (4,707 | 22.6%), college / undergraduate (4,542 | 21.8%), and middle school (3,698 | 17.8%).
| School Level | # Students | % Students |
| Nursery / Preschool | 1,199 | 5.8% |
| Kindergarten | 1,132 | 5.4% |
| Elementary School | 3,674 | 17.7% |
| Middle School | 3,698 | 17.8% |
| High School | 4,707 | 22.6% |
| College / Undergraduate | 4,542 | 21.8% |
| Graduate / Professional | 1,857 | 8.9% |
| Total | 20,809 | 100.0% |
School Enrollment by Age by Funding Source in Norwalk
Out of a total of 20,809 students who are enrolled in schools in Norwalk, 4,557 (21.9%) attend a private institution, while the remaining 16,252 (78.1%) are enrolled in public schools. The age group of 35 years and over has the highest likelihood of being enrolled in private schools, with 698 (43.5% in the age bracket) enrolled. Conversely, the age group of 5 to 9 year old has the lowest likelihood of being enrolled in a private school, with 4,011 (89.7% in the age bracket) attending a public institution.
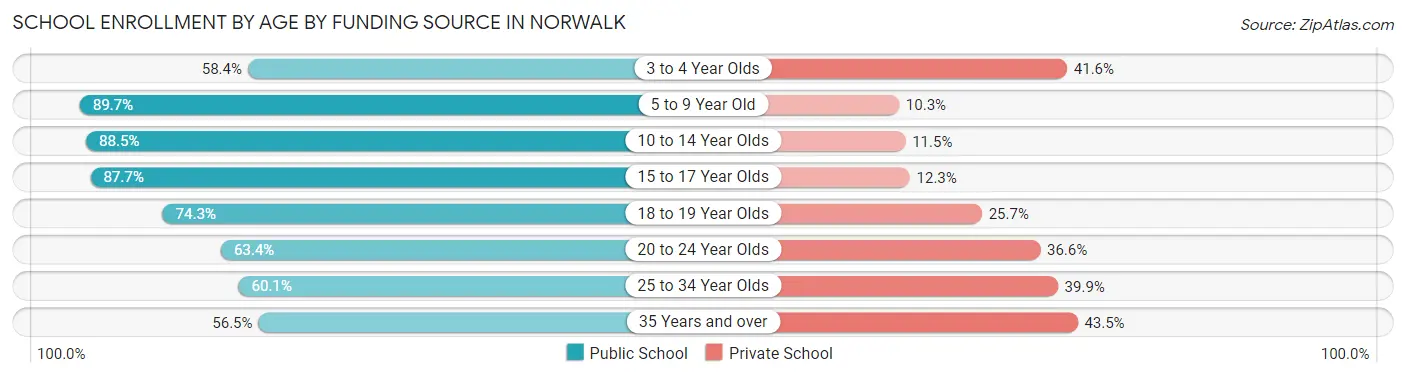
| Age Bracket | Public School | Private School |
| 3 to 4 Year Olds | 821 (58.4%) | 584 (41.6%) |
| 5 to 9 Year Old | 4,011 (89.7%) | 460 (10.3%) |
| 10 to 14 Year Olds | 3,976 (88.5%) | 515 (11.5%) |
| 15 to 17 Year Olds | 3,014 (87.7%) | 422 (12.3%) |
| 18 to 19 Year Olds | 1,089 (74.3%) | 377 (25.7%) |
| 20 to 24 Year Olds | 1,496 (63.4%) | 863 (36.6%) |
| 25 to 34 Year Olds | 949 (60.1%) | 629 (39.9%) |
| 35 Years and over | 905 (56.5%) | 698 (43.5%) |
| Total | 16,252 (78.1%) | 4,557 (21.9%) |
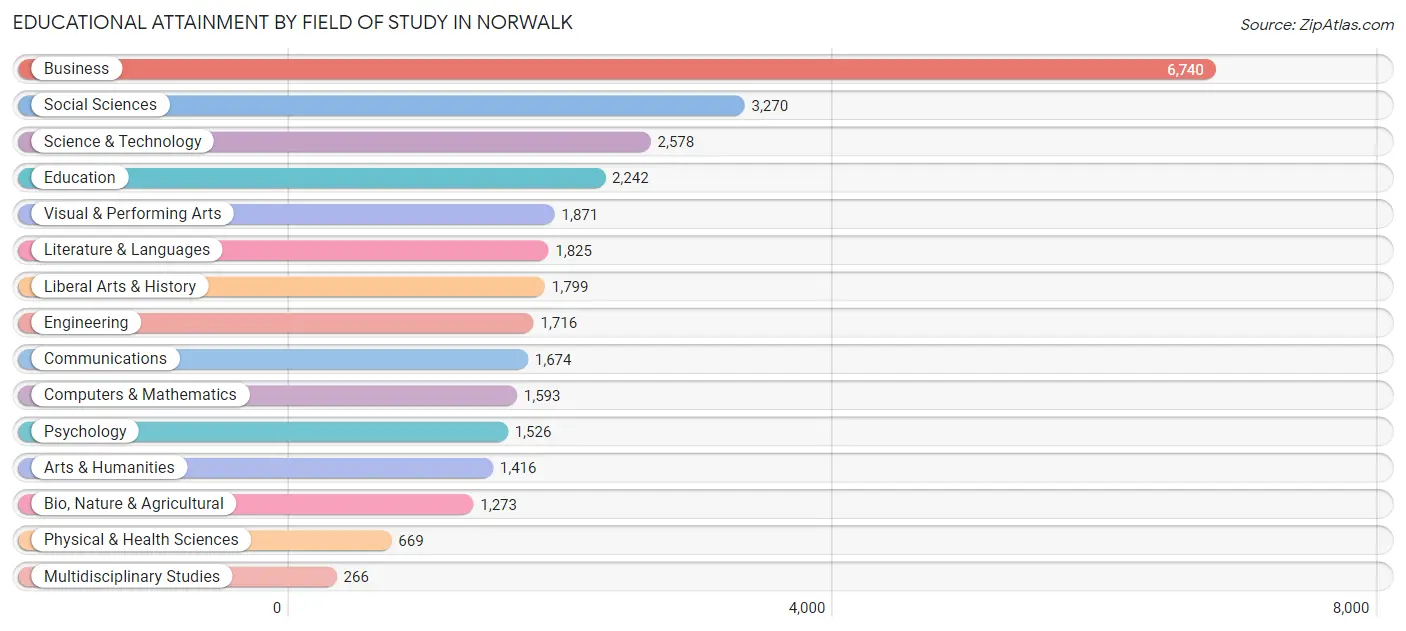
Educational Attainment by Field of Study in Norwalk
Business (6,740 | 22.1%), social sciences (3,270 | 10.7%), science & technology (2,578 | 8.5%), education (2,242 | 7.4%), and visual & performing arts (1,871 | 6.1%) are the most common fields of study among 30,458 individuals in Norwalk who have obtained a bachelor's degree or higher.
| Field of Study | # Graduates | % Graduates |
| Computers & Mathematics | 1,593 | 5.2% |
| Bio, Nature & Agricultural | 1,273 | 4.2% |
| Physical & Health Sciences | 669 | 2.2% |
| Psychology | 1,526 | 5.0% |
| Social Sciences | 3,270 | 10.7% |
| Engineering | 1,716 | 5.6% |
| Multidisciplinary Studies | 266 | 0.9% |
| Science & Technology | 2,578 | 8.5% |
| Business | 6,740 | 22.1% |
| Education | 2,242 | 7.4% |
| Literature & Languages | 1,825 | 6.0% |
| Liberal Arts & History | 1,799 | 5.9% |
| Visual & Performing Arts | 1,871 | 6.1% |
| Communications | 1,674 | 5.5% |
| Arts & Humanities | 1,416 | 4.6% |
| Total | 30,458 | 100.0% |
Transportation & Commute in Norwalk
Vehicle Availability by Sex in Norwalk
The most prevalent vehicle ownership categories in Norwalk are males with 2 vehicles (11,508, accounting for 43.6%) and females with 2 vehicles (9,286, making up 50.6%).
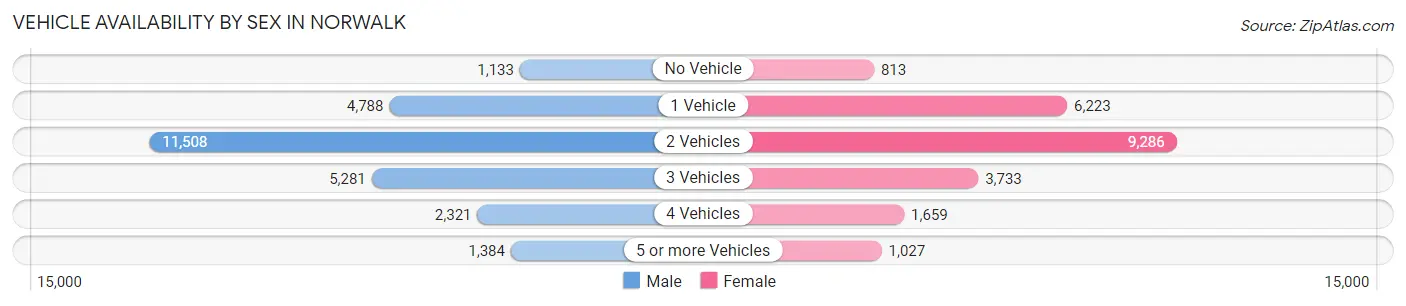
| Vehicles Available | Male | Female |
| No Vehicle | 1,133 (4.3%) | 813 (3.6%) |
| 1 Vehicle | 4,788 (18.1%) | 6,223 (27.4%) |
| 2 Vehicles | 11,508 (43.6%) | 9,286 (40.8%) |
| 3 Vehicles | 5,281 (20.0%) | 3,733 (16.4%) |
| 4 Vehicles | 2,321 (8.8%) | 1,659 (7.3%) |
| 5 or more Vehicles | 1,384 (5.2%) | 1,027 (4.5%) |
| Total | 26,415 (100.0%) | 22,741 (100.0%) |
Commute Time in Norwalk
The most frequently occuring commute durations in Norwalk are 10 to 14 minutes (7,985 commuters, 18.3%), 20 to 24 minutes (6,741 commuters, 15.5%), and 15 to 19 minutes (6,317 commuters, 14.5%).
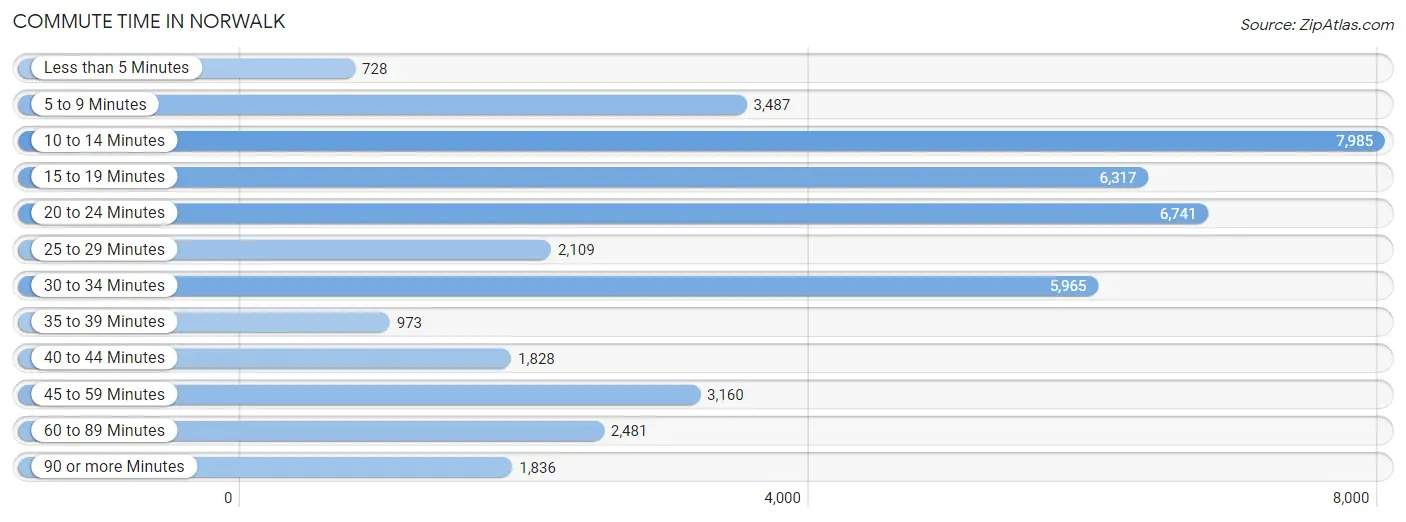
| Commute Time | # Commuters | % Commuters |
| Less than 5 Minutes | 728 | 1.7% |
| 5 to 9 Minutes | 3,487 | 8.0% |
| 10 to 14 Minutes | 7,985 | 18.3% |
| 15 to 19 Minutes | 6,317 | 14.5% |
| 20 to 24 Minutes | 6,741 | 15.5% |
| 25 to 29 Minutes | 2,109 | 4.8% |
| 30 to 34 Minutes | 5,965 | 13.7% |
| 35 to 39 Minutes | 973 | 2.2% |
| 40 to 44 Minutes | 1,828 | 4.2% |
| 45 to 59 Minutes | 3,160 | 7.2% |
| 60 to 89 Minutes | 2,481 | 5.7% |
| 90 or more Minutes | 1,836 | 4.2% |
Commute Time by Sex in Norwalk
The most common commute times in Norwalk are 10 to 14 minutes (4,275 commuters, 18.1%) for males and 10 to 14 minutes (3,710 commuters, 18.6%) for females.
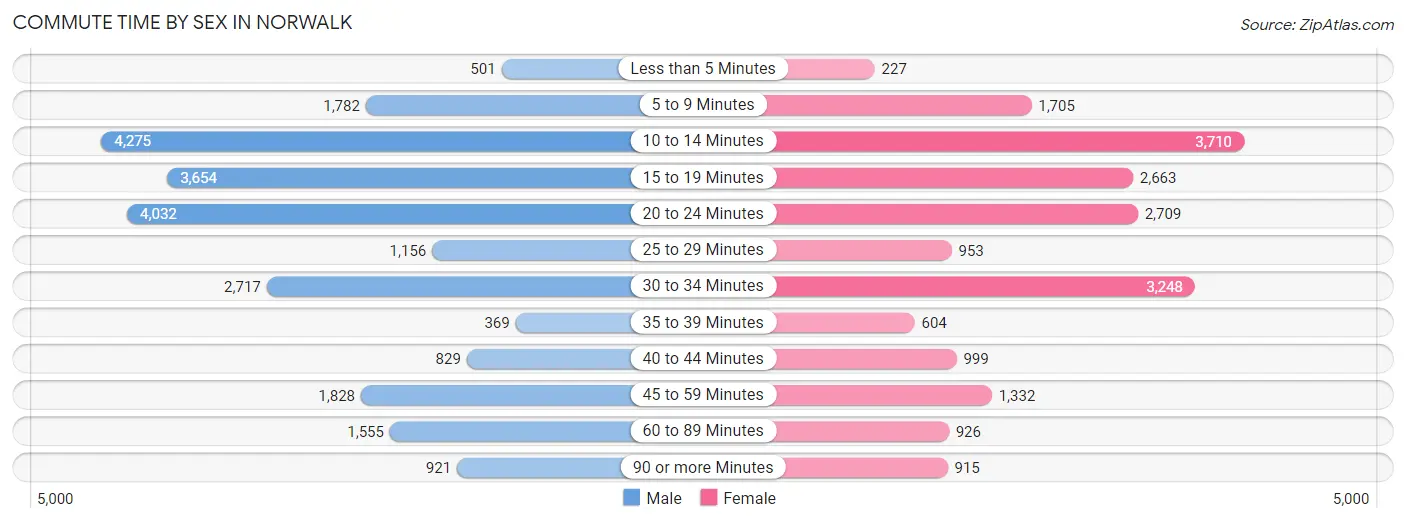
| Commute Time | Male | Female |
| Less than 5 Minutes | 501 (2.1%) | 227 (1.1%) |
| 5 to 9 Minutes | 1,782 (7.5%) | 1,705 (8.5%) |
| 10 to 14 Minutes | 4,275 (18.1%) | 3,710 (18.6%) |
| 15 to 19 Minutes | 3,654 (15.5%) | 2,663 (13.3%) |
| 20 to 24 Minutes | 4,032 (17.1%) | 2,709 (13.6%) |
| 25 to 29 Minutes | 1,156 (4.9%) | 953 (4.8%) |
| 30 to 34 Minutes | 2,717 (11.5%) | 3,248 (16.3%) |
| 35 to 39 Minutes | 369 (1.6%) | 604 (3.0%) |
| 40 to 44 Minutes | 829 (3.5%) | 999 (5.0%) |
| 45 to 59 Minutes | 1,828 (7.7%) | 1,332 (6.7%) |
| 60 to 89 Minutes | 1,555 (6.6%) | 926 (4.6%) |
| 90 or more Minutes | 921 (3.9%) | 915 (4.6%) |
Time of Departure to Work by Sex in Norwalk
The most frequent times of departure to work in Norwalk are 8:00 AM to 8:29 AM (3,776, 16.0%) for males and 8:00 AM to 8:29 AM (3,886, 19.4%) for females.
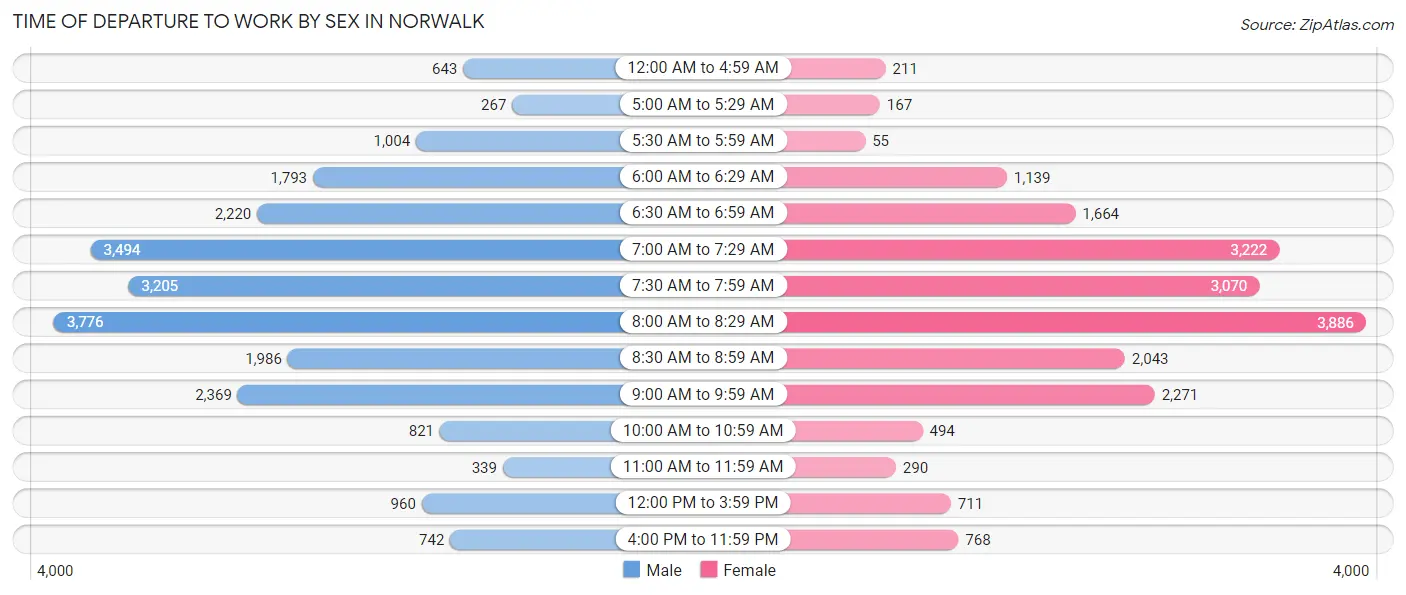
| Time of Departure | Male | Female |
| 12:00 AM to 4:59 AM | 643 (2.7%) | 211 (1.1%) |
| 5:00 AM to 5:29 AM | 267 (1.1%) | 167 (0.8%) |
| 5:30 AM to 5:59 AM | 1,004 (4.3%) | 55 (0.3%) |
| 6:00 AM to 6:29 AM | 1,793 (7.6%) | 1,139 (5.7%) |
| 6:30 AM to 6:59 AM | 2,220 (9.4%) | 1,664 (8.3%) |
| 7:00 AM to 7:29 AM | 3,494 (14.8%) | 3,222 (16.1%) |
| 7:30 AM to 7:59 AM | 3,205 (13.6%) | 3,070 (15.4%) |
| 8:00 AM to 8:29 AM | 3,776 (16.0%) | 3,886 (19.4%) |
| 8:30 AM to 8:59 AM | 1,986 (8.4%) | 2,043 (10.2%) |
| 9:00 AM to 9:59 AM | 2,369 (10.0%) | 2,271 (11.4%) |
| 10:00 AM to 10:59 AM | 821 (3.5%) | 494 (2.5%) |
| 11:00 AM to 11:59 AM | 339 (1.4%) | 290 (1.5%) |
| 12:00 PM to 3:59 PM | 960 (4.1%) | 711 (3.6%) |
| 4:00 PM to 11:59 PM | 742 (3.1%) | 768 (3.8%) |
| Total | 23,619 (100.0%) | 19,991 (100.0%) |
Housing Occupancy in Norwalk
Occupancy by Ownership in Norwalk
Of the total 35,272 dwellings in Norwalk, owner-occupied units account for 19,345 (54.8%), while renter-occupied units make up 15,927 (45.2%).
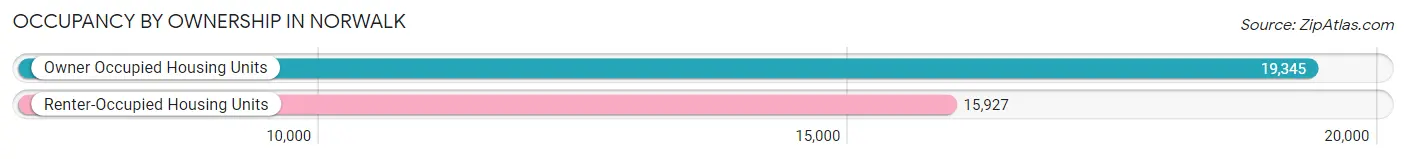
| Occupancy | # Housing Units | % Housing Units |
| Owner Occupied Housing Units | 19,345 | 54.8% |
| Renter-Occupied Housing Units | 15,927 | 45.2% |
| Total Occupied Housing Units | 35,272 | 100.0% |
Occupancy by Household Size in Norwalk
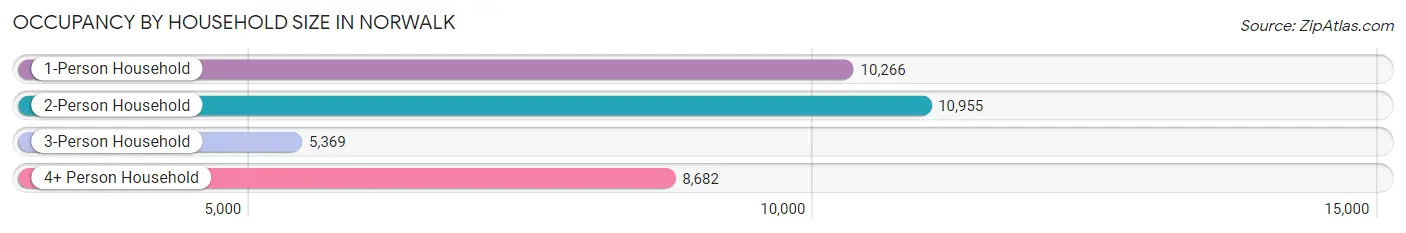
| Household Size | # Housing Units | % Housing Units |
| 1-Person Household | 10,266 | 29.1% |
| 2-Person Household | 10,955 | 31.1% |
| 3-Person Household | 5,369 | 15.2% |
| 4+ Person Household | 8,682 | 24.6% |
| Total Housing Units | 35,272 | 100.0% |
Occupancy by Ownership by Household Size in Norwalk
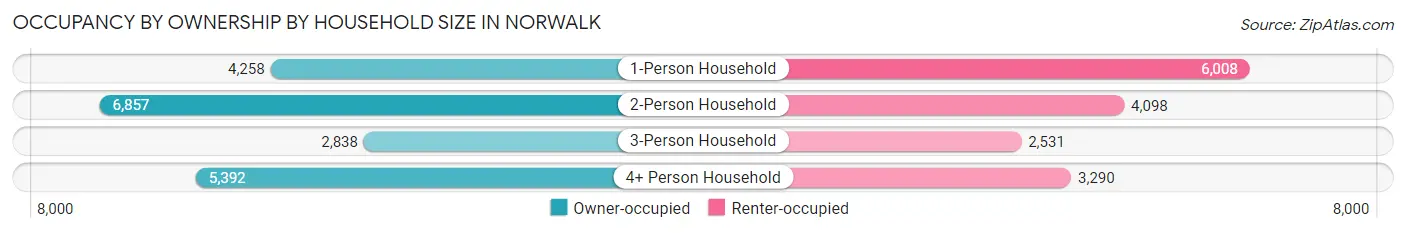
| Household Size | Owner-occupied | Renter-occupied |
| 1-Person Household | 4,258 (41.5%) | 6,008 (58.5%) |
| 2-Person Household | 6,857 (62.6%) | 4,098 (37.4%) |
| 3-Person Household | 2,838 (52.9%) | 2,531 (47.1%) |
| 4+ Person Household | 5,392 (62.1%) | 3,290 (37.9%) |
| Total Housing Units | 19,345 (54.8%) | 15,927 (45.2%) |
Occupancy by Educational Attainment in Norwalk
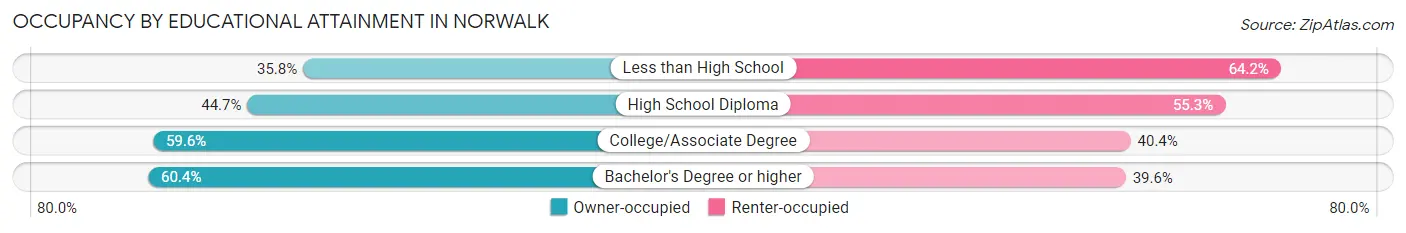
| Household Size | Owner-occupied | Renter-occupied |
| Less than High School | 1,228 (35.8%) | 2,198 (64.2%) |
| High School Diploma | 2,997 (44.7%) | 3,710 (55.3%) |
| College/Associate Degree | 5,323 (59.6%) | 3,602 (40.4%) |
| Bachelor's Degree or higher | 9,797 (60.4%) | 6,417 (39.6%) |
Occupancy by Age of Householder in Norwalk
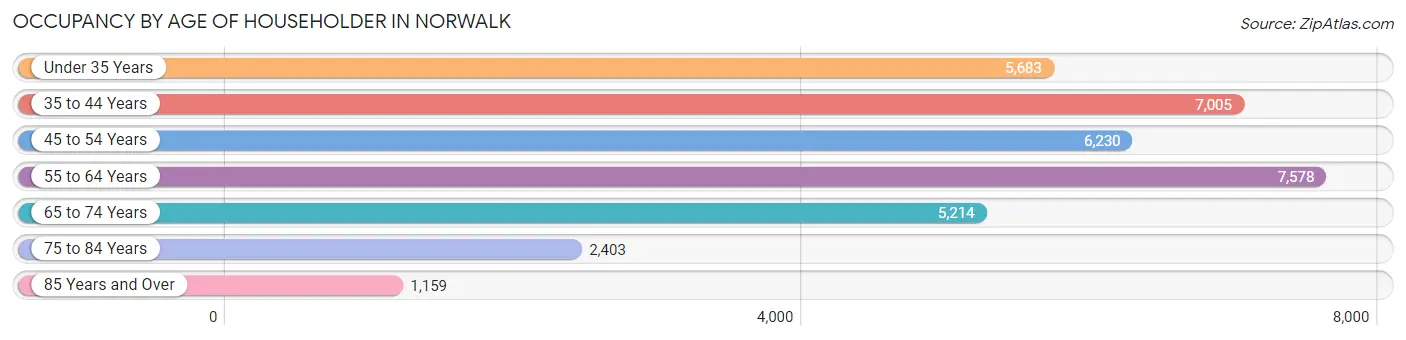
| Age Bracket | # Households | % Households |
| Under 35 Years | 5,683 | 16.1% |
| 35 to 44 Years | 7,005 | 19.9% |
| 45 to 54 Years | 6,230 | 17.7% |
| 55 to 64 Years | 7,578 | 21.5% |
| 65 to 74 Years | 5,214 | 14.8% |
| 75 to 84 Years | 2,403 | 6.8% |
| 85 Years and Over | 1,159 | 3.3% |
| Total | 35,272 | 100.0% |
Housing Finances in Norwalk
Median Income by Occupancy in Norwalk
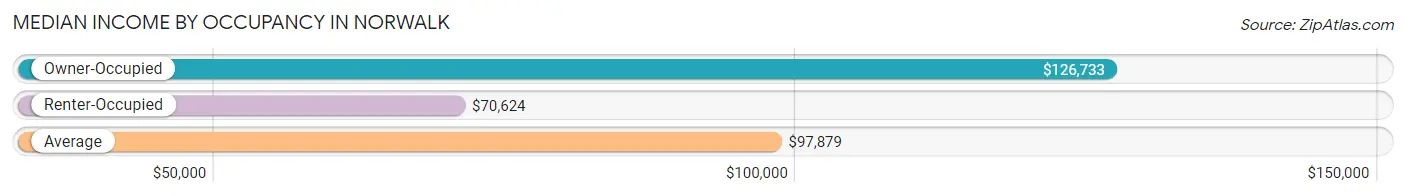
| Occupancy Type | # Households | Median Income |
| Owner-Occupied | 19,345 (54.8%) | $126,733 |
| Renter-Occupied | 15,927 (45.2%) | $70,624 |
| Average | 35,272 (100.0%) | $97,879 |
Occupancy by Householder Income Bracket in Norwalk
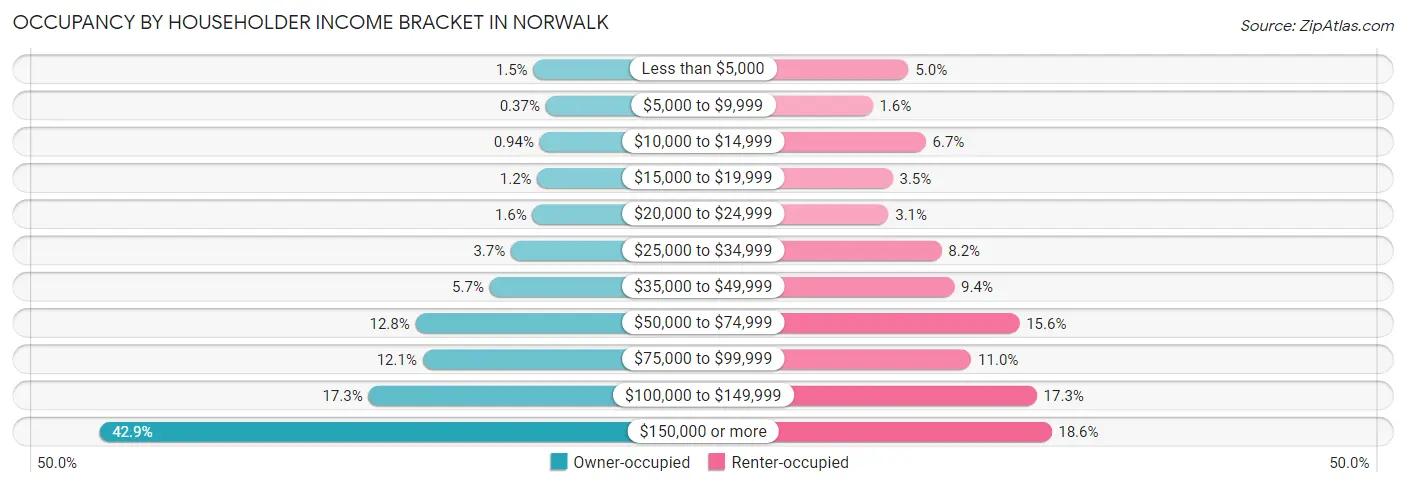
| Income Bracket | Owner-occupied | Renter-occupied |
| Less than $5,000 | 298 (1.5%) | 802 (5.0%) |
| $5,000 to $9,999 | 71 (0.4%) | 257 (1.6%) |
| $10,000 to $14,999 | 182 (0.9%) | 1,062 (6.7%) |
| $15,000 to $19,999 | 225 (1.2%) | 560 (3.5%) |
| $20,000 to $24,999 | 314 (1.6%) | 497 (3.1%) |
| $25,000 to $34,999 | 710 (3.7%) | 1,302 (8.2%) |
| $35,000 to $49,999 | 1,103 (5.7%) | 1,495 (9.4%) |
| $50,000 to $74,999 | 2,470 (12.8%) | 2,483 (15.6%) |
| $75,000 to $99,999 | 2,337 (12.1%) | 1,753 (11.0%) |
| $100,000 to $149,999 | 3,337 (17.2%) | 2,747 (17.2%) |
| $150,000 or more | 8,298 (42.9%) | 2,969 (18.6%) |
| Total | 19,345 (100.0%) | 15,927 (100.0%) |
Monthly Housing Cost Tiers in Norwalk
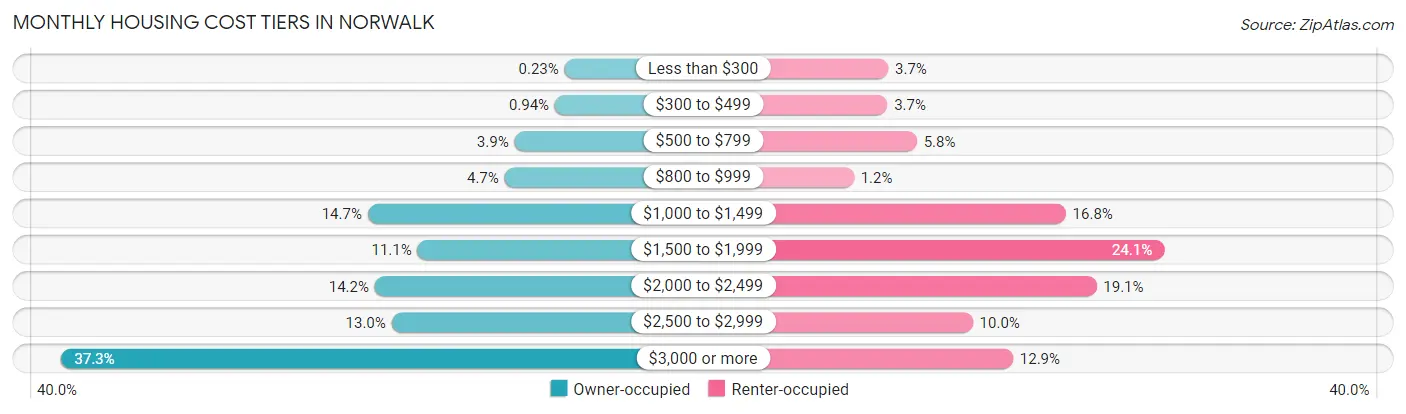
| Monthly Cost | Owner-occupied | Renter-occupied |
| Less than $300 | 45 (0.2%) | 594 (3.7%) |
| $300 to $499 | 181 (0.9%) | 585 (3.7%) |
| $500 to $799 | 759 (3.9%) | 930 (5.8%) |
| $800 to $999 | 900 (4.6%) | 191 (1.2%) |
| $1,000 to $1,499 | 2,850 (14.7%) | 2,678 (16.8%) |
| $1,500 to $1,999 | 2,140 (11.1%) | 3,830 (24.0%) |
| $2,000 to $2,499 | 2,748 (14.2%) | 3,038 (19.1%) |
| $2,500 to $2,999 | 2,509 (13.0%) | 1,586 (10.0%) |
| $3,000 or more | 7,213 (37.3%) | 2,057 (12.9%) |
| Total | 19,345 (100.0%) | 15,927 (100.0%) |
Physical Housing Characteristics in Norwalk
Housing Structures in Norwalk
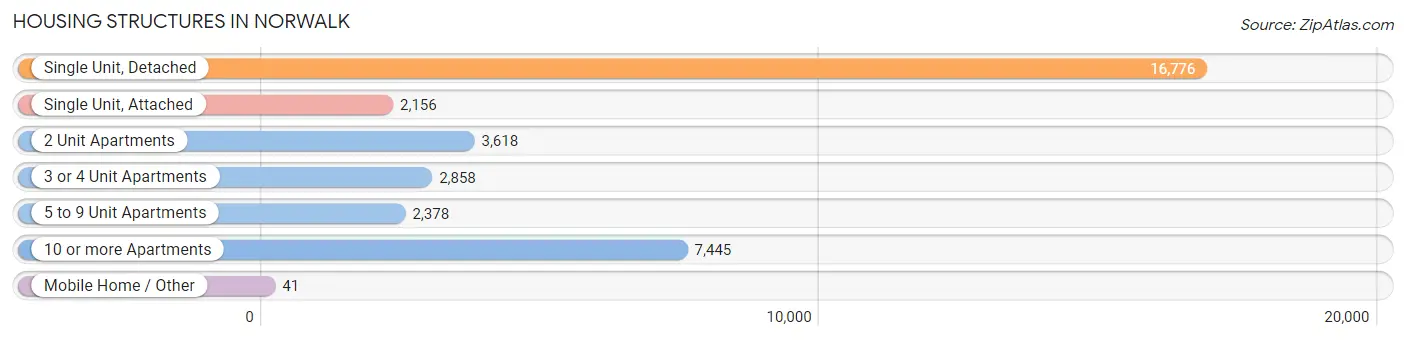
| Structure Type | # Housing Units | % Housing Units |
| Single Unit, Detached | 16,776 | 47.6% |
| Single Unit, Attached | 2,156 | 6.1% |
| 2 Unit Apartments | 3,618 | 10.3% |
| 3 or 4 Unit Apartments | 2,858 | 8.1% |
| 5 to 9 Unit Apartments | 2,378 | 6.7% |
| 10 or more Apartments | 7,445 | 21.1% |
| Mobile Home / Other | 41 | 0.1% |
| Total | 35,272 | 100.0% |
Housing Structures by Occupancy in Norwalk
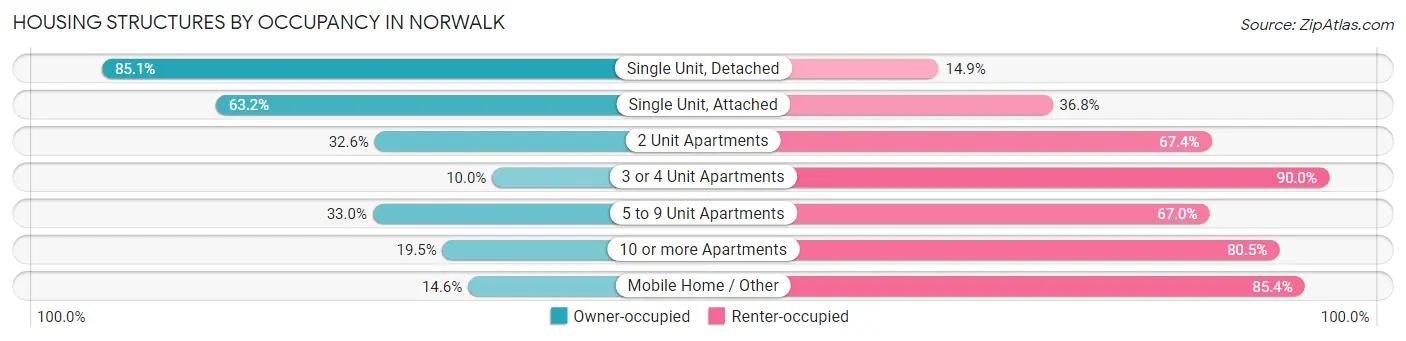
| Structure Type | Owner-occupied | Renter-occupied |
| Single Unit, Detached | 14,276 (85.1%) | 2,500 (14.9%) |
| Single Unit, Attached | 1,362 (63.2%) | 794 (36.8%) |
| 2 Unit Apartments | 1,179 (32.6%) | 2,439 (67.4%) |
| 3 or 4 Unit Apartments | 285 (10.0%) | 2,573 (90.0%) |
| 5 to 9 Unit Apartments | 784 (33.0%) | 1,594 (67.0%) |
| 10 or more Apartments | 1,453 (19.5%) | 5,992 (80.5%) |
| Mobile Home / Other | 6 (14.6%) | 35 (85.4%) |
| Total | 19,345 (54.8%) | 15,927 (45.2%) |
Housing Structures by Number of Rooms in Norwalk
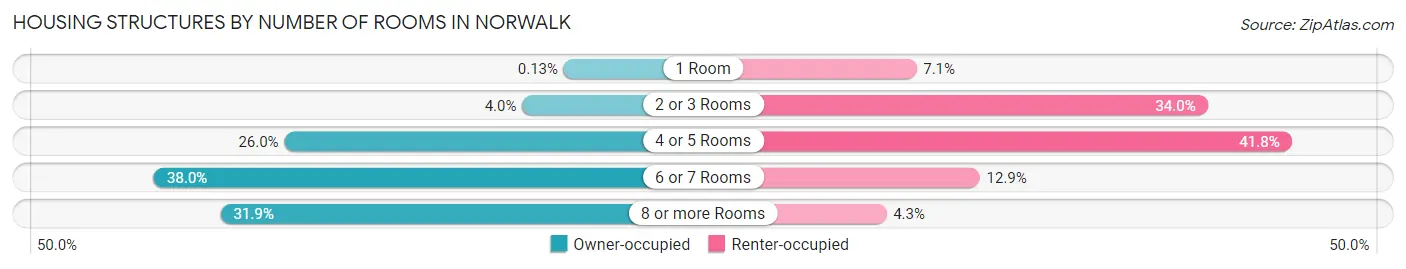
| Number of Rooms | Owner-occupied | Renter-occupied |
| 1 Room | 26 (0.1%) | 1,124 (7.1%) |
| 2 or 3 Rooms | 768 (4.0%) | 5,413 (34.0%) |
| 4 or 5 Rooms | 5,024 (26.0%) | 6,651 (41.8%) |
| 6 or 7 Rooms | 7,359 (38.0%) | 2,057 (12.9%) |
| 8 or more Rooms | 6,168 (31.9%) | 682 (4.3%) |
| Total | 19,345 (100.0%) | 15,927 (100.0%) |
Housing Structure by Heating Type in Norwalk
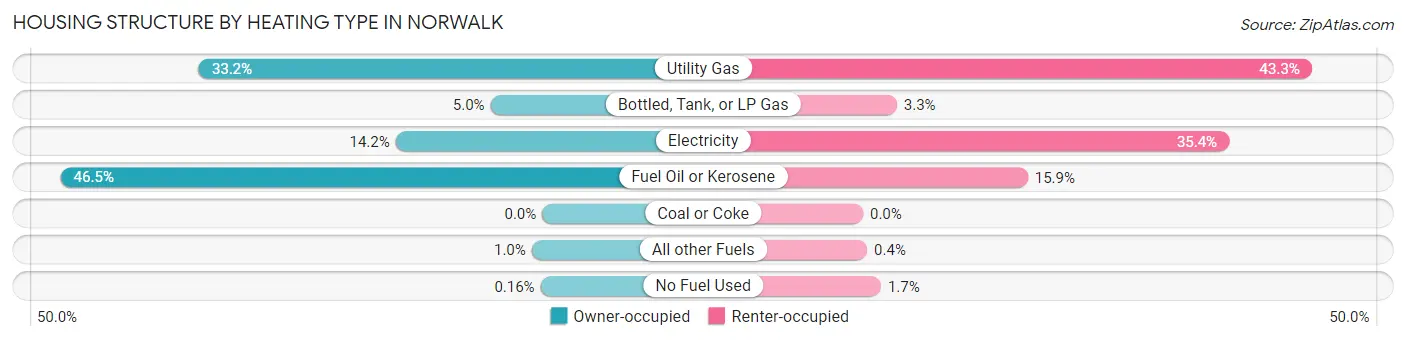
| Heating Type | Owner-occupied | Renter-occupied |
| Utility Gas | 6,414 (33.2%) | 6,903 (43.3%) |
| Bottled, Tank, or LP Gas | 966 (5.0%) | 521 (3.3%) |
| Electricity | 2,740 (14.2%) | 5,630 (35.3%) |
| Fuel Oil or Kerosene | 8,999 (46.5%) | 2,535 (15.9%) |
| Coal or Coke | 0 (0.0%) | 0 (0.0%) |
| All other Fuels | 195 (1.0%) | 63 (0.4%) |
| No Fuel Used | 31 (0.2%) | 275 (1.7%) |
| Total | 19,345 (100.0%) | 15,927 (100.0%) |
Household Vehicle Usage in Norwalk
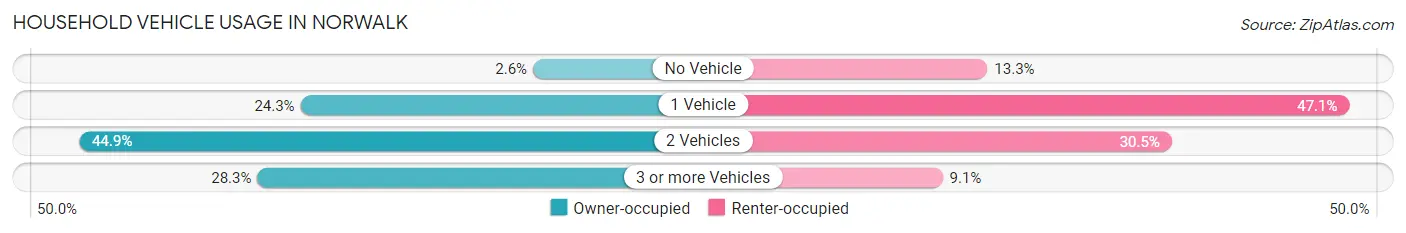
| Vehicles per Household | Owner-occupied | Renter-occupied |
| No Vehicle | 493 (2.5%) | 2,118 (13.3%) |
| 1 Vehicle | 4,692 (24.2%) | 7,498 (47.1%) |
| 2 Vehicles | 8,689 (44.9%) | 4,858 (30.5%) |
| 3 or more Vehicles | 5,471 (28.3%) | 1,453 (9.1%) |
| Total | 19,345 (100.0%) | 15,927 (100.0%) |
Real Estate & Mortgages in Norwalk
Real Estate and Mortgage Overview in Norwalk
| Characteristic | Without Mortgage | With Mortgage |
| Housing Units | 5,429 | 13,916 |
| Median Property Value | $460,700 | $516,400 |
| Median Household Income | $90,349 | $6,892 |
| Monthly Housing Costs | $1,196 | $7,113 |
| Real Estate Taxes | $7,567 | $144 |
Property Value by Mortgage Status in Norwalk
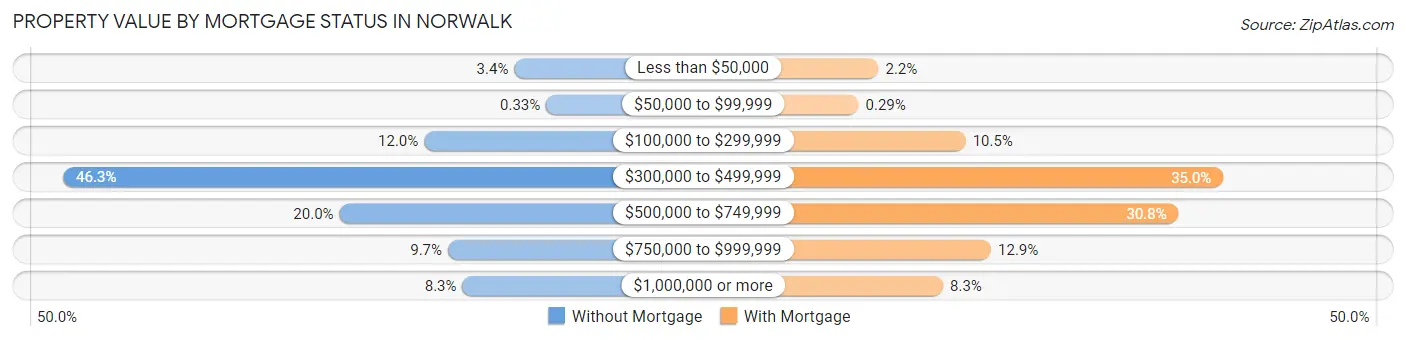
| Property Value | Without Mortgage | With Mortgage |
| Less than $50,000 | 183 (3.4%) | 305 (2.2%) |
| $50,000 to $99,999 | 18 (0.3%) | 41 (0.3%) |
| $100,000 to $299,999 | 649 (11.9%) | 1,460 (10.5%) |
| $300,000 to $499,999 | 2,515 (46.3%) | 4,872 (35.0%) |
| $500,000 to $749,999 | 1,087 (20.0%) | 4,281 (30.8%) |
| $750,000 to $999,999 | 526 (9.7%) | 1,797 (12.9%) |
| $1,000,000 or more | 451 (8.3%) | 1,160 (8.3%) |
| Total | 5,429 (100.0%) | 13,916 (100.0%) |
Household Income by Mortgage Status in Norwalk
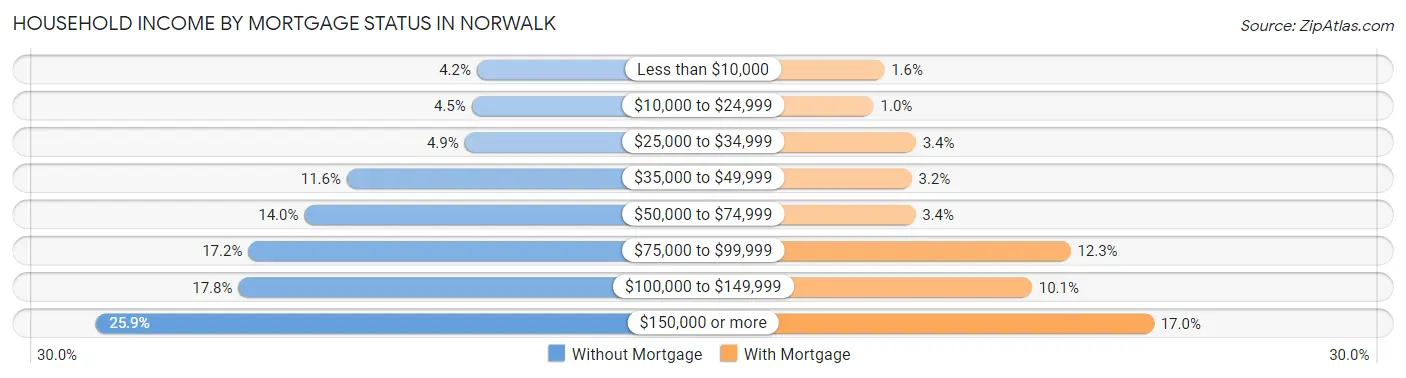
| Household Income | Without Mortgage | With Mortgage |
| Less than $10,000 | 226 (4.2%) | 228 (1.6%) |
| $10,000 to $24,999 | 242 (4.5%) | 143 (1.0%) |
| $25,000 to $34,999 | 264 (4.9%) | 479 (3.4%) |
| $35,000 to $49,999 | 629 (11.6%) | 446 (3.2%) |
| $50,000 to $74,999 | 761 (14.0%) | 474 (3.4%) |
| $75,000 to $99,999 | 935 (17.2%) | 1,709 (12.3%) |
| $100,000 to $149,999 | 966 (17.8%) | 1,402 (10.1%) |
| $150,000 or more | 1,406 (25.9%) | 2,371 (17.0%) |
| Total | 5,429 (100.0%) | 13,916 (100.0%) |
Property Value to Household Income Ratio in Norwalk
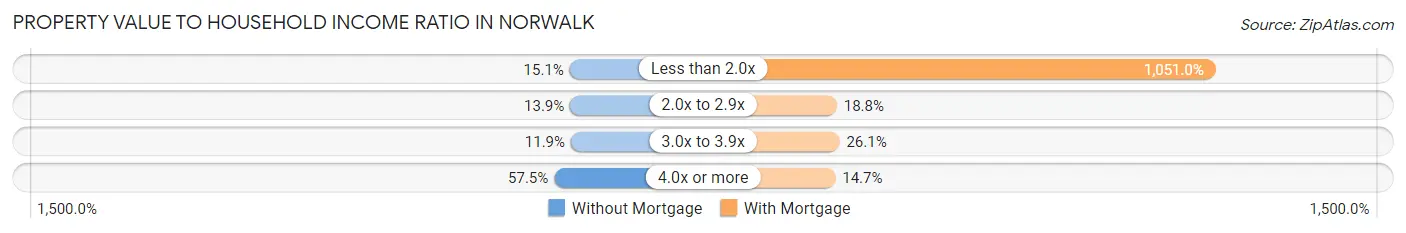
| Value-to-Income Ratio | Without Mortgage | With Mortgage |
| Less than 2.0x | 822 (15.1%) | 146,250 (1,050.9%) |
| 2.0x to 2.9x | 754 (13.9%) | 2,621 (18.8%) |
| 3.0x to 3.9x | 647 (11.9%) | 3,625 (26.1%) |
| 4.0x or more | 3,124 (57.5%) | 2,042 (14.7%) |
| Total | 5,429 (100.0%) | 13,916 (100.0%) |
Real Estate Taxes by Mortgage Status in Norwalk
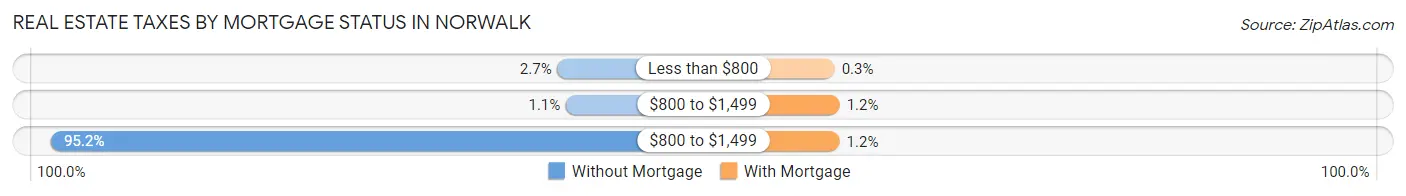
| Property Taxes | Without Mortgage | With Mortgage |
| Less than $800 | 145 (2.7%) | 42 (0.3%) |
| $800 to $1,499 | 59 (1.1%) | 170 (1.2%) |
| $800 to $1,499 | 5,167 (95.2%) | 169 (1.2%) |
| Total | 5,429 (100.0%) | 13,916 (100.0%) |
Health & Disability in Norwalk
Health Insurance Coverage by Age in Norwalk
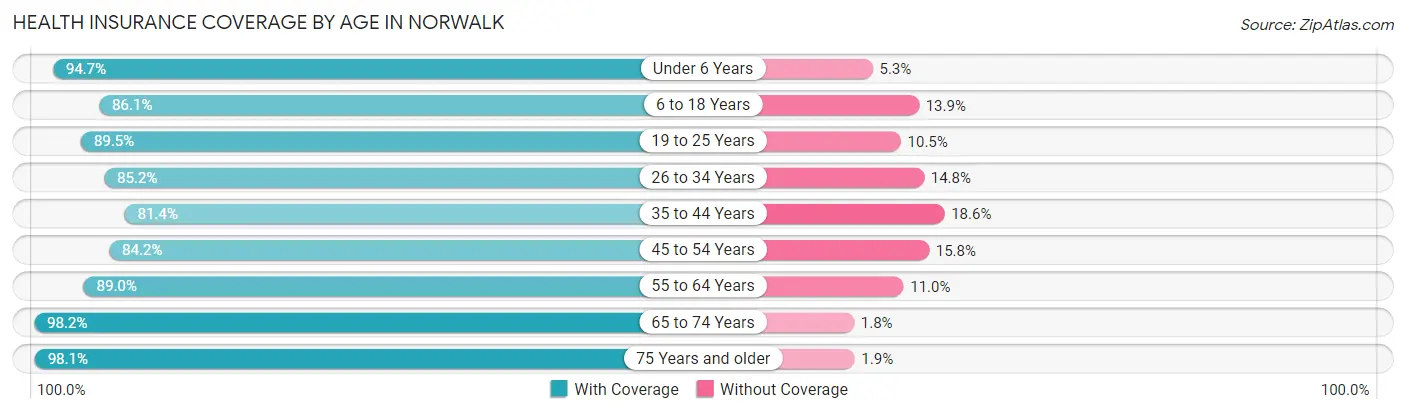
| Age Bracket | With Coverage | Without Coverage |
| Under 6 Years | 5,441 (94.7%) | 302 (5.3%) |
| 6 to 18 Years | 11,003 (86.1%) | 1,774 (13.9%) |
| 19 to 25 Years | 6,813 (89.5%) | 799 (10.5%) |
| 26 to 34 Years | 10,872 (85.2%) | 1,892 (14.8%) |
| 35 to 44 Years | 10,456 (81.4%) | 2,396 (18.6%) |
| 45 to 54 Years | 10,020 (84.2%) | 1,874 (15.8%) |
| 55 to 64 Years | 11,581 (89.0%) | 1,433 (11.0%) |
| 65 to 74 Years | 8,064 (98.2%) | 146 (1.8%) |
| 75 Years and older | 5,811 (98.1%) | 112 (1.9%) |
| Total | 80,061 (88.2%) | 10,728 (11.8%) |
Health Insurance Coverage by Citizenship Status in Norwalk
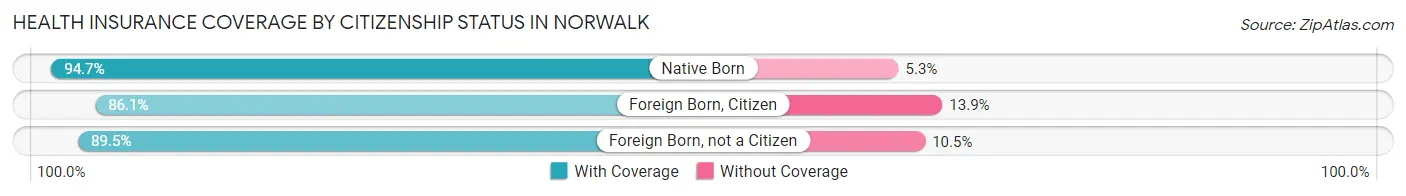
| Citizenship Status | With Coverage | Without Coverage |
| Native Born | 5,441 (94.7%) | 302 (5.3%) |
| Foreign Born, Citizen | 11,003 (86.1%) | 1,774 (13.9%) |
| Foreign Born, not a Citizen | 6,813 (89.5%) | 799 (10.5%) |
Health Insurance Coverage by Household Income in Norwalk
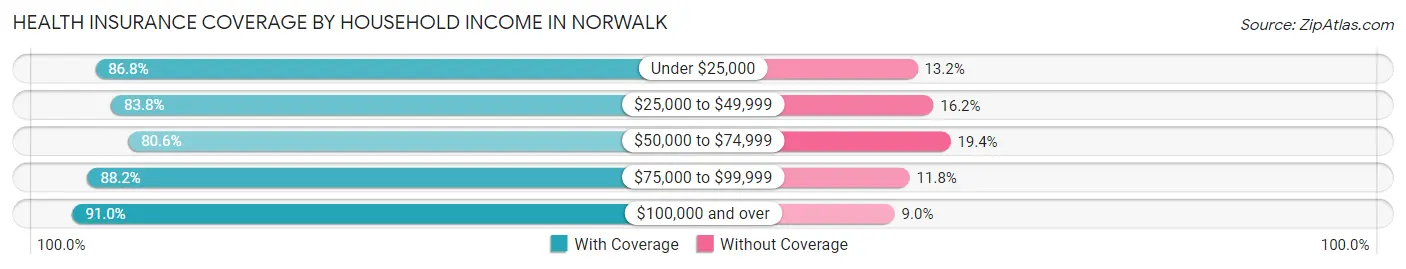
| Household Income | With Coverage | Without Coverage |
| Under $25,000 | 6,764 (86.8%) | 1,032 (13.2%) |
| $25,000 to $49,999 | 8,288 (83.8%) | 1,605 (16.2%) |
| $50,000 to $74,999 | 9,781 (80.6%) | 2,357 (19.4%) |
| $75,000 to $99,999 | 9,185 (88.2%) | 1,226 (11.8%) |
| $100,000 and over | 45,694 (91.0%) | 4,504 (9.0%) |
Public vs Private Health Insurance Coverage by Age in Norwalk
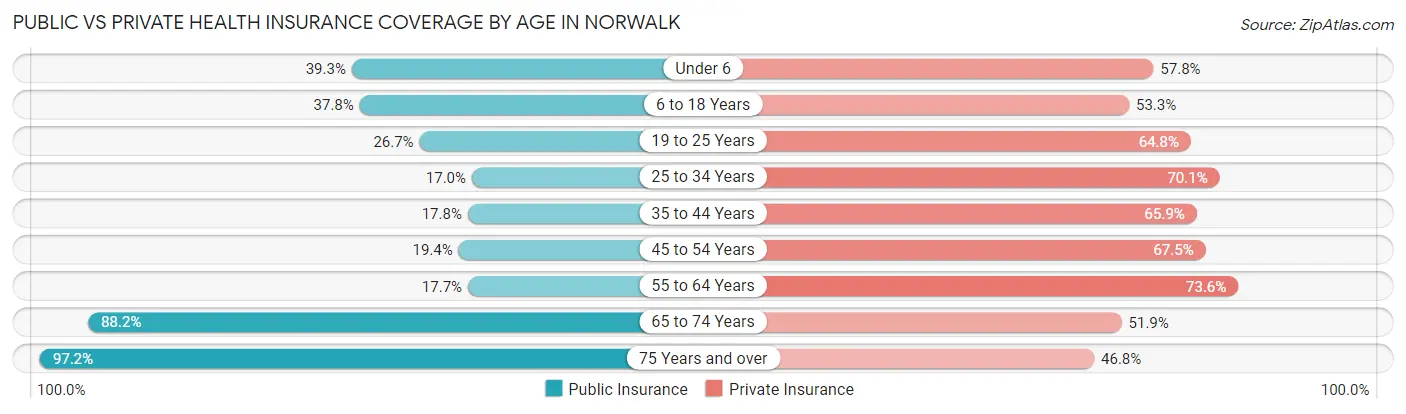
| Age Bracket | Public Insurance | Private Insurance |
| Under 6 | 2,256 (39.3%) | 3,322 (57.8%) |
| 6 to 18 Years | 4,832 (37.8%) | 6,812 (53.3%) |
| 19 to 25 Years | 2,033 (26.7%) | 4,931 (64.8%) |
| 25 to 34 Years | 2,167 (17.0%) | 8,948 (70.1%) |
| 35 to 44 Years | 2,281 (17.7%) | 8,464 (65.9%) |
| 45 to 54 Years | 2,312 (19.4%) | 8,029 (67.5%) |
| 55 to 64 Years | 2,306 (17.7%) | 9,572 (73.6%) |
| 65 to 74 Years | 7,244 (88.2%) | 4,264 (51.9%) |
| 75 Years and over | 5,755 (97.2%) | 2,774 (46.8%) |
| Total | 31,186 (34.4%) | 57,116 (62.9%) |
Disability Status by Sex by Age in Norwalk
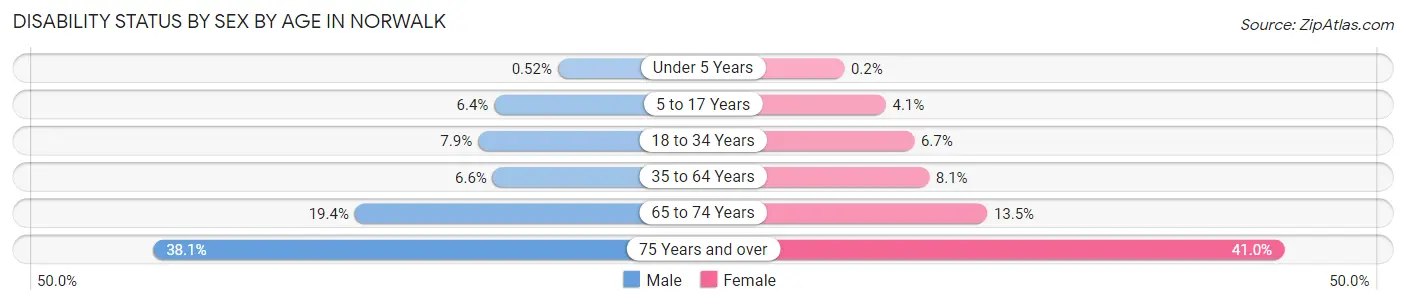
| Age Bracket | Male | Female |
| Under 5 Years | 13 (0.5%) | 5 (0.2%) |
| 5 to 17 Years | 456 (6.4%) | 224 (4.1%) |
| 18 to 34 Years | 896 (7.9%) | 665 (6.7%) |
| 35 to 64 Years | 1,215 (6.6%) | 1,554 (8.1%) |
| 65 to 74 Years | 721 (19.4%) | 604 (13.5%) |
| 75 Years and over | 928 (38.1%) | 1,430 (41.0%) |
Disability Class by Sex by Age in Norwalk
Disability Class: Hearing Difficulty
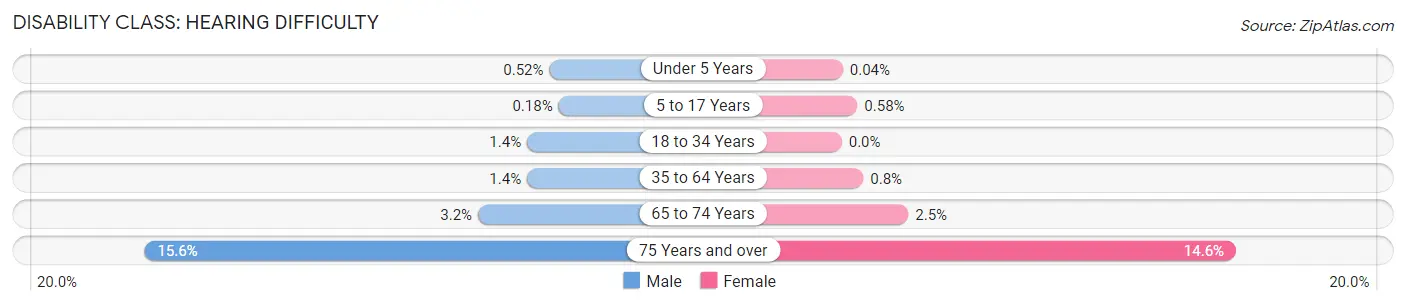
| Age Bracket | Male | Female |
| Under 5 Years | 13 (0.5%) | 1 (0.0%) |
| 5 to 17 Years | 13 (0.2%) | 32 (0.6%) |
| 18 to 34 Years | 153 (1.3%) | 0 (0.0%) |
| 35 to 64 Years | 250 (1.3%) | 153 (0.8%) |
| 65 to 74 Years | 118 (3.2%) | 111 (2.5%) |
| 75 Years and over | 379 (15.5%) | 510 (14.6%) |
Disability Class: Vision Difficulty
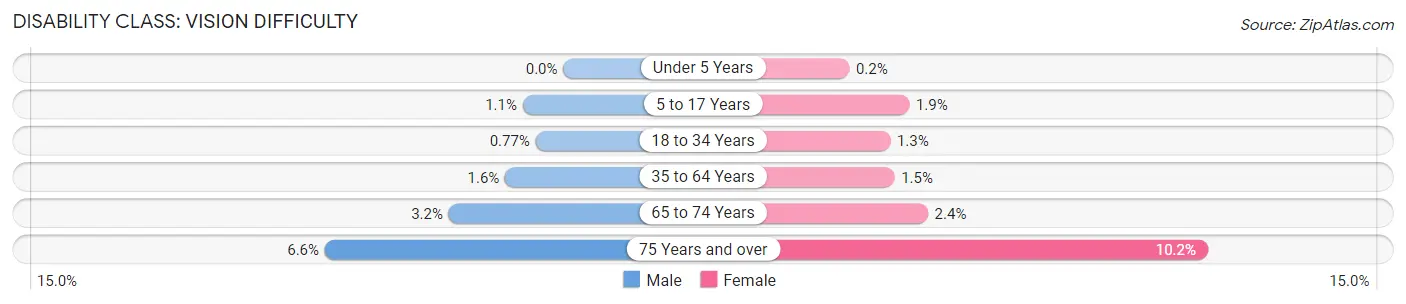
| Age Bracket | Male | Female |
| Under 5 Years | 0 (0.0%) | 5 (0.2%) |
| 5 to 17 Years | 80 (1.1%) | 103 (1.9%) |
| 18 to 34 Years | 87 (0.8%) | 133 (1.3%) |
| 35 to 64 Years | 300 (1.6%) | 280 (1.5%) |
| 65 to 74 Years | 119 (3.2%) | 107 (2.4%) |
| 75 Years and over | 162 (6.6%) | 355 (10.2%) |
Disability Class: Cognitive Difficulty
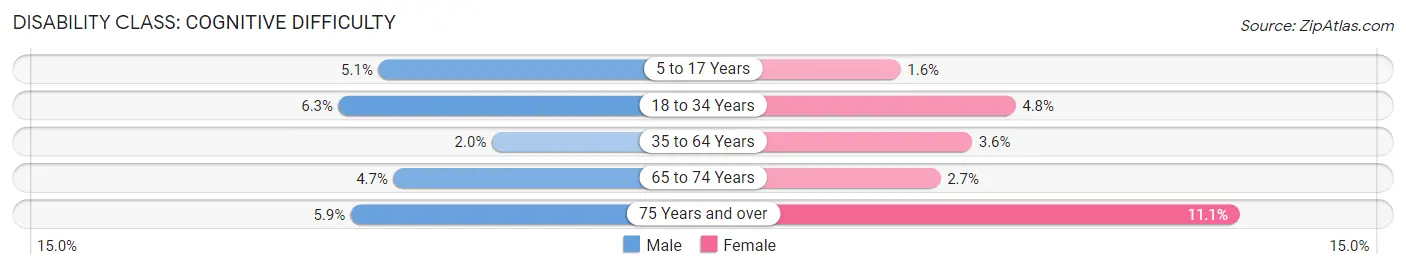
| Age Bracket | Male | Female |
| 5 to 17 Years | 365 (5.1%) | 90 (1.6%) |
| 18 to 34 Years | 707 (6.2%) | 479 (4.8%) |
| 35 to 64 Years | 366 (2.0%) | 696 (3.6%) |
| 65 to 74 Years | 176 (4.7%) | 123 (2.7%) |
| 75 Years and over | 144 (5.9%) | 386 (11.1%) |
Disability Class: Ambulatory Difficulty
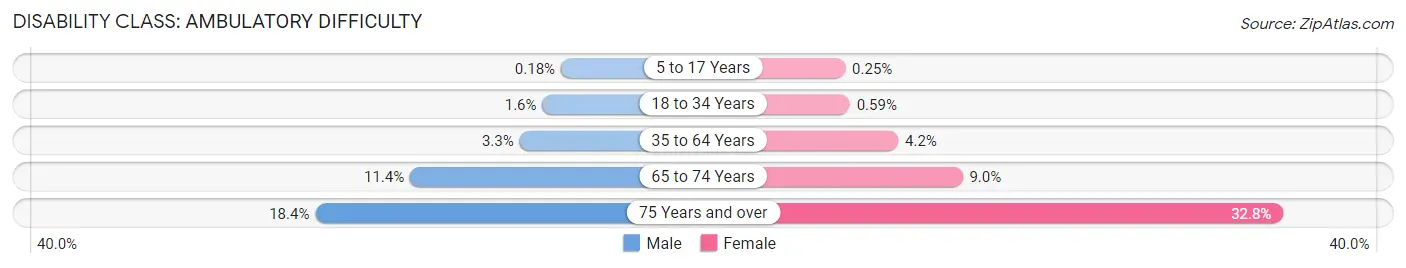
| Age Bracket | Male | Female |
| 5 to 17 Years | 13 (0.2%) | 14 (0.3%) |
| 18 to 34 Years | 177 (1.6%) | 59 (0.6%) |
| 35 to 64 Years | 602 (3.3%) | 804 (4.2%) |
| 65 to 74 Years | 424 (11.4%) | 402 (9.0%) |
| 75 Years and over | 449 (18.4%) | 1,142 (32.8%) |
Disability Class: Self-Care Difficulty
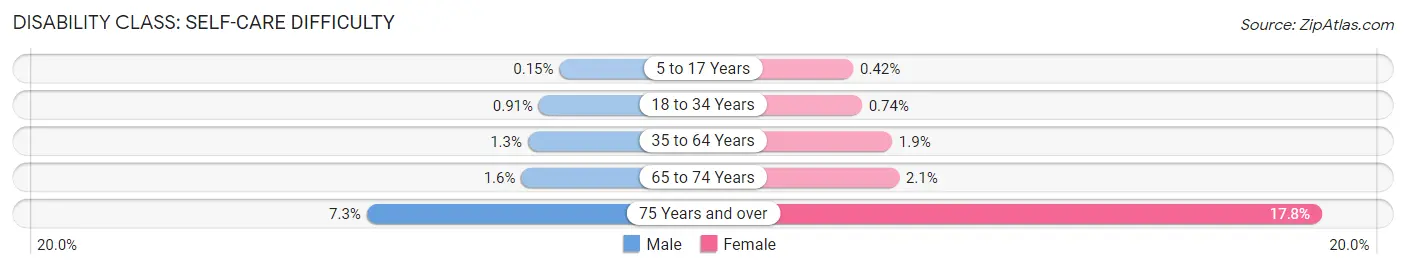
| Age Bracket | Male | Female |
| 5 to 17 Years | 11 (0.2%) | 23 (0.4%) |
| 18 to 34 Years | 103 (0.9%) | 73 (0.7%) |
| 35 to 64 Years | 244 (1.3%) | 357 (1.9%) |
| 65 to 74 Years | 58 (1.6%) | 95 (2.1%) |
| 75 Years and over | 178 (7.3%) | 621 (17.8%) |
Technology Access in Norwalk
Computing Device Access in Norwalk
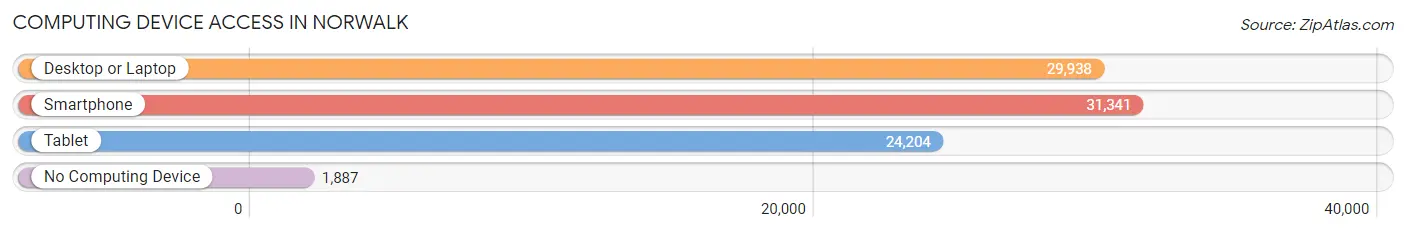
| Device Type | # Households | % Households |
| Desktop or Laptop | 29,938 | 84.9% |
| Smartphone | 31,341 | 88.9% |
| Tablet | 24,204 | 68.6% |
| No Computing Device | 1,887 | 5.3% |
| Total | 35,272 | 100.0% |
Internet Access in Norwalk
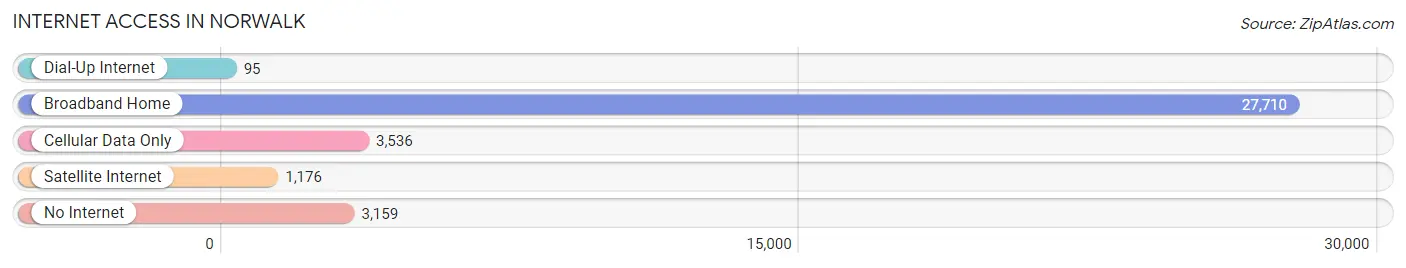
| Internet Type | # Households | % Households |
| Dial-Up Internet | 95 | 0.3% |
| Broadband Home | 27,710 | 78.6% |
| Cellular Data Only | 3,536 | 10.0% |
| Satellite Internet | 1,176 | 3.3% |
| No Internet | 3,159 | 9.0% |
| Total | 35,272 | 100.0% |
Norwalk Summary
Norwalk, Connecticut is a city located in Fairfield County, Connecticut, United States. It is situated along the Long Island Sound, approximately 40 miles northeast of New York City. As of the 2010 census, the population of Norwalk was 85,603, making it the sixth most populous city in Connecticut.
History
The area that is now Norwalk was originally inhabited by the Norwalk Indians, a Native American tribe of the Algonquian language family. The first European settlers arrived in the area in 1649, and the town was officially incorporated in 1651. The town was named after the Norwalk Indians, and the name Norwalk is derived from the Algonquian word “noyank”, which means “point of land”.
During the American Revolution, Norwalk was a major center of activity. The town was the site of several battles, and it was also the site of the first naval battle of the war. After the war, Norwalk experienced a period of growth and prosperity, and it became a major port and shipbuilding center.
In the 19th century, Norwalk was a major center of the whaling industry, and it was also a major center of the oyster industry. The town was also a major center of the textile industry, and it was home to several large factories.
Geography
Norwalk is located in Fairfield County, Connecticut, at the mouth of the Norwalk River. The city is situated along the Long Island Sound, approximately 40 miles northeast of New York City. The city has a total area of 36.2 square miles, of which 34.2 square miles is land and 2.0 square miles is water.
The city is bordered by the towns of Westport to the east, Wilton to the north, and New Canaan to the west. The city is also bordered by the Long Island Sound to the south.
Economy
Norwalk’s economy is largely based on the service industry, with many of the city’s residents employed in the retail, hospitality, and healthcare sectors. The city is also home to several large corporations, including Xerox, Priceline.com, and Diageo.
The city is also home to several large manufacturing companies, including Norwalk Furniture, Norwalk Metal Products, and Norwalk Plastics. The city is also home to several large financial institutions, including Webster Bank and People’s United Bank.
Demographics
As of the 2010 census, the population of Norwalk was 85,603, with a population density of 2,400 people per square mile. The racial makeup of the city was 79.2% White, 8.3% African American, 0.3% Native American, 5.2% Asian, 0.1% Pacific Islander, 4.2% from other races, and 2.7% from two or more races. Hispanic or Latino of any race were 16.3% of the population.
The median income for a household in the city was $68,845, and the median income for a family was $81,824. The per capita income for the city was $35,945. About 6.2% of families and 8.3% of the population were below the poverty line, including 10.2% of those under age 18 and 6.2% of those age 65 or over.
Common Questions
What is Per Capita Income in Norwalk?
Per Capita income in Norwalk is $57,389.
What is the Median Family Income in Norwalk?
Median Family Income in Norwalk is $115,631.
What is the Median Household income in Norwalk?
Median Household Income in Norwalk is $97,879.
What is Income or Wage Gap in Norwalk?
Income or Wage Gap in Norwalk is 16.2%.
Women in Norwalk earn 83.8 cents for every dollar earned by a man.
What is Family Income Deficit in Norwalk?
Family Income Deficit in Norwalk is $10,603.
Families that are below poverty line in Norwalk earn $10,603 less on average than the poverty threshold level.
What is Inequality or Gini Index in Norwalk?
Inequality or Gini Index in Norwalk is 0.50.
What is the Total Population of Norwalk?
Total Population of Norwalk is 91,050.
What is the Total Male Population of Norwalk?
Total Male Population of Norwalk is 45,680.
What is the Total Female Population of Norwalk?
Total Female Population of Norwalk is 45,370.
What is the Ratio of Males per 100 Females in Norwalk?
There are 100.68 Males per 100 Females in Norwalk.
What is the Ratio of Females per 100 Males in Norwalk?
There are 99.32 Females per 100 Males in Norwalk.
What is the Median Population Age in Norwalk?
Median Population Age in Norwalk is 40.0 Years.
What is the Average Family Size in Norwalk
Average Family Size in Norwalk is 3.2 People.
What is the Average Household Size in Norwalk
Average Household Size in Norwalk is 2.6 People.
How Large is the Labor Force in Norwalk?
There are 53,309 People in the Labor Forcein in Norwalk.
What is the Percentage of People in the Labor Force in Norwalk?
70.7% of People are in the Labor Force in Norwalk.
What is the Unemployment Rate in Norwalk?
Unemployment Rate in Norwalk is 5.9%.