Blue Hills, CT Map & Demographics
Blue Hills Map
Blue Hills Overview
$31,612
PER CAPITA INCOME
$80,227
AVG FAMILY INCOME
$63,844
AVG HOUSEHOLD INCOME
10.6%
WAGE / INCOME GAP [ % ]
89.4¢/ $1
WAGE / INCOME GAP [ $ ]
$7,810
FAMILY INCOME DEFICIT
0.36
INEQUALITY / GINI INDEX
2,224
TOTAL POPULATION
780
MALE POPULATION
1,444
FEMALE POPULATION
54.02
MALES / 100 FEMALES
185.13
FEMALES / 100 MALES
49.1
MEDIAN AGE
3.0
AVG FAMILY SIZE
2.4
AVG HOUSEHOLD SIZE
1,355
LABOR FORCE [ PEOPLE ]
72.0%
PERCENT IN LABOR FORCE
3.5%
UNEMPLOYMENT RATE
Income in Blue Hills
Income Overview in Blue Hills
Per Capita Income in Blue Hills is $31,612, while median incomes of families and households are $80,227 and $63,844 respectively.
| Characteristic | Number | Measure |
| Per Capita Income | 2,224 | $31,612 |
| Median Family Income | 594 | $80,227 |
| Mean Family Income | 594 | $89,270 |
| Median Household Income | 939 | $63,844 |
| Mean Household Income | 939 | $72,886 |
| Income Deficit | 594 | $7,810 |
| Wage / Income Gap (%) | 2,224 | 10.60% |
| Wage / Income Gap ($) | 2,224 | 89.40¢ per $1 |
| Gini / Inequality Index | 2,224 | 0.36 |
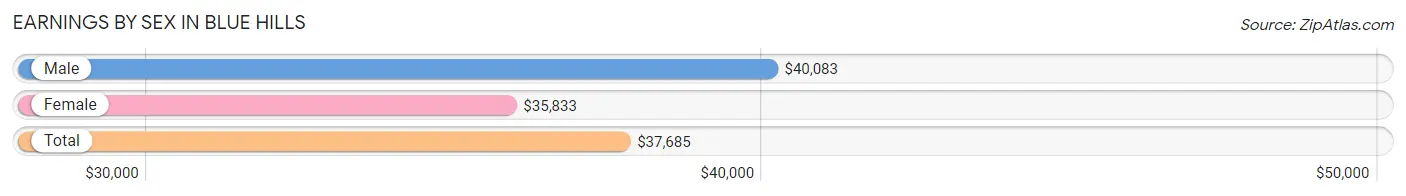
Earnings by Sex in Blue Hills
Average Earnings in Blue Hills are $37,685, $40,083 for men and $35,833 for women, a difference of 10.6%.
| Sex | Number | Average Earnings |
| Male | 468 (34.8%) | $40,083 |
| Female | 876 (65.2%) | $35,833 |
| Total | 1,344 (100.0%) | $37,685 |
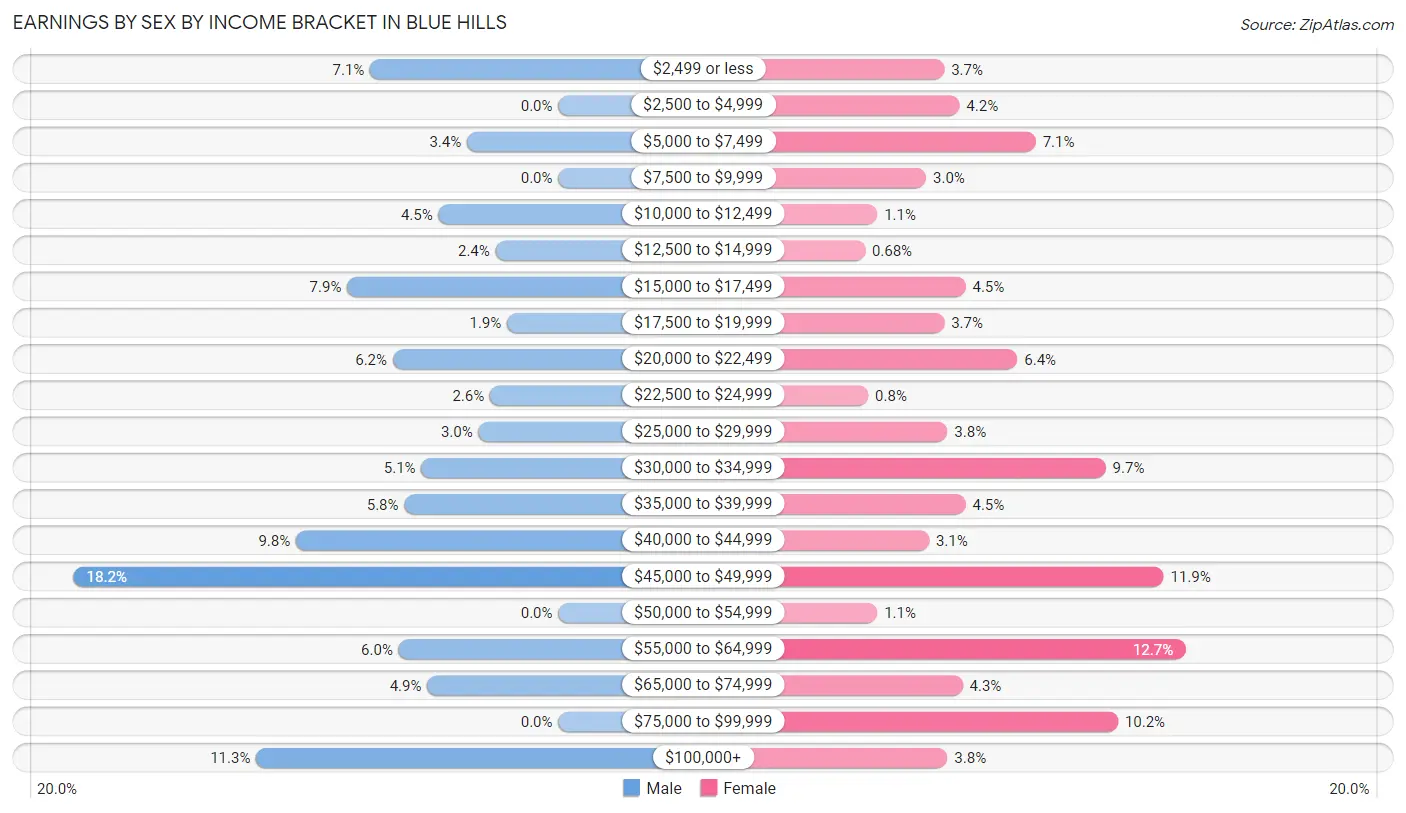
Earnings by Sex by Income Bracket in Blue Hills
The most common earnings brackets in Blue Hills are $45,000 to $49,999 for men (85 | 18.2%) and $55,000 to $64,999 for women (111 | 12.7%).
| Income | Male | Female |
| $2,499 or less | 33 (7.0%) | 32 (3.6%) |
| $2,500 to $4,999 | 0 (0.0%) | 37 (4.2%) |
| $5,000 to $7,499 | 16 (3.4%) | 62 (7.1%) |
| $7,500 to $9,999 | 0 (0.0%) | 26 (3.0%) |
| $10,000 to $12,499 | 21 (4.5%) | 10 (1.1%) |
| $12,500 to $14,999 | 11 (2.4%) | 6 (0.7%) |
| $15,000 to $17,499 | 37 (7.9%) | 39 (4.4%) |
| $17,500 to $19,999 | 9 (1.9%) | 32 (3.6%) |
| $20,000 to $22,499 | 29 (6.2%) | 56 (6.4%) |
| $22,500 to $24,999 | 12 (2.6%) | 7 (0.8%) |
| $25,000 to $29,999 | 14 (3.0%) | 33 (3.8%) |
| $30,000 to $34,999 | 24 (5.1%) | 85 (9.7%) |
| $35,000 to $39,999 | 27 (5.8%) | 39 (4.4%) |
| $40,000 to $44,999 | 46 (9.8%) | 27 (3.1%) |
| $45,000 to $49,999 | 85 (18.2%) | 104 (11.9%) |
| $50,000 to $54,999 | 0 (0.0%) | 10 (1.1%) |
| $55,000 to $64,999 | 28 (6.0%) | 111 (12.7%) |
| $65,000 to $74,999 | 23 (4.9%) | 38 (4.3%) |
| $75,000 to $99,999 | 0 (0.0%) | 89 (10.2%) |
| $100,000+ | 53 (11.3%) | 33 (3.8%) |
| Total | 468 (100.0%) | 876 (100.0%) |
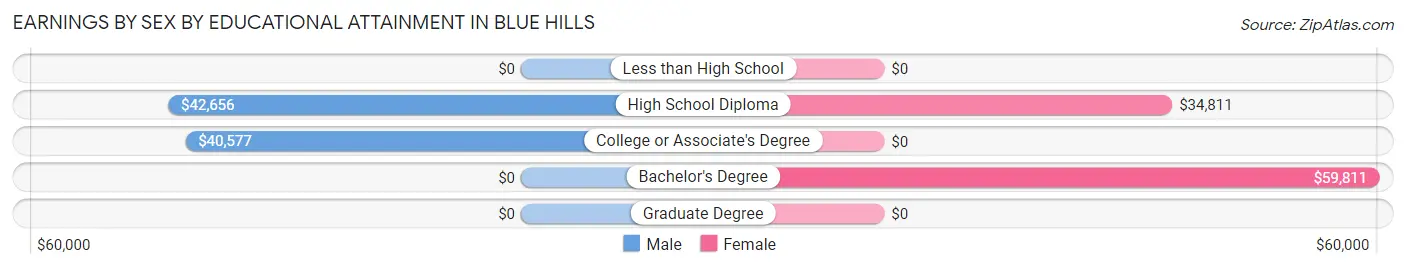
Earnings by Sex by Educational Attainment in Blue Hills
Average earnings in Blue Hills are $41,917 for men and $41,731 for women, a difference of 0.4%. Men with an educational attainment of high school diploma enjoy the highest average annual earnings of $42,656, while those with college or associate's degree education earn the least with $40,577. Women with an educational attainment of bachelor's degree earn the most with the average annual earnings of $59,811, while those with high school diploma education have the smallest earnings of $34,811.
| Educational Attainment | Male Income | Female Income |
| Less than High School | - | - |
| High School Diploma | $42,656 | $34,811 |
| College or Associate's Degree | $40,577 | $0 |
| Bachelor's Degree | - | - |
| Graduate Degree | - | - |
| Total | $41,917 | $41,731 |
Family Income in Blue Hills
Family Income Brackets in Blue Hills
According to the Blue Hills family income data, there are 145 families falling into the $35,000 to $49,999 income range, which is the most common income bracket and makes up 24.4% of all families.
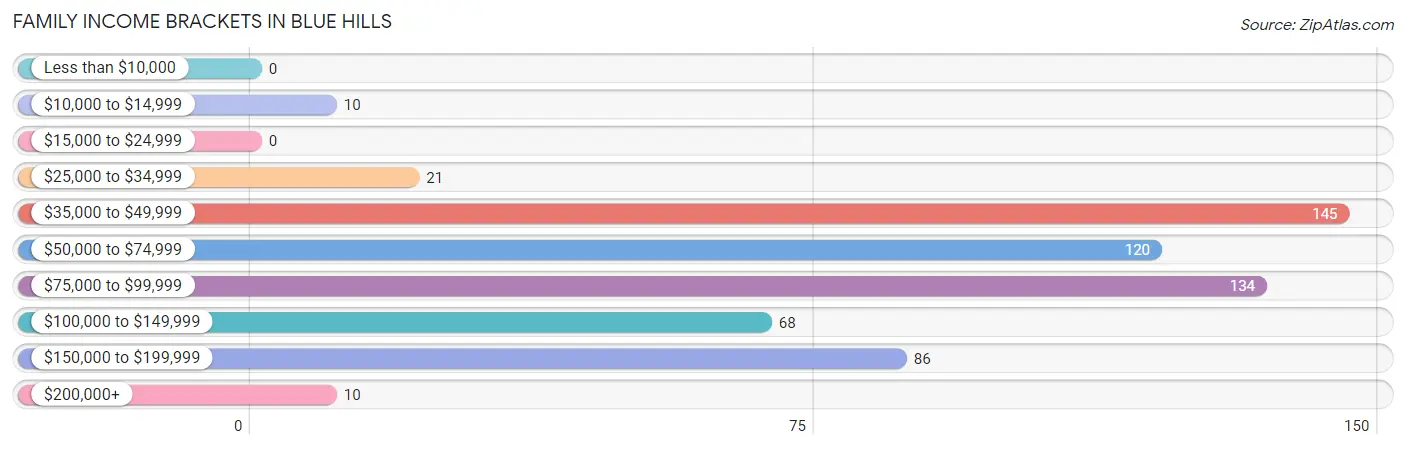
| Income Bracket | # Families | % Families |
| Less than $10,000 | 0 | 0.0% |
| $10,000 to $14,999 | 10 | 1.7% |
| $15,000 to $24,999 | 0 | 0.0% |
| $25,000 to $34,999 | 21 | 3.5% |
| $35,000 to $49,999 | 145 | 24.4% |
| $50,000 to $74,999 | 120 | 20.2% |
| $75,000 to $99,999 | 134 | 22.6% |
| $100,000 to $149,999 | 68 | 11.4% |
| $150,000 to $199,999 | 86 | 14.5% |
| $200,000+ | 10 | 1.7% |
Family Income by Famaliy Size in Blue Hills
4-person families (112 | 18.9%) account for the highest median family income in Blue Hills with $164,327 per family, while 4-person families (112 | 18.9%) have the highest median income of $41,082 per family member.
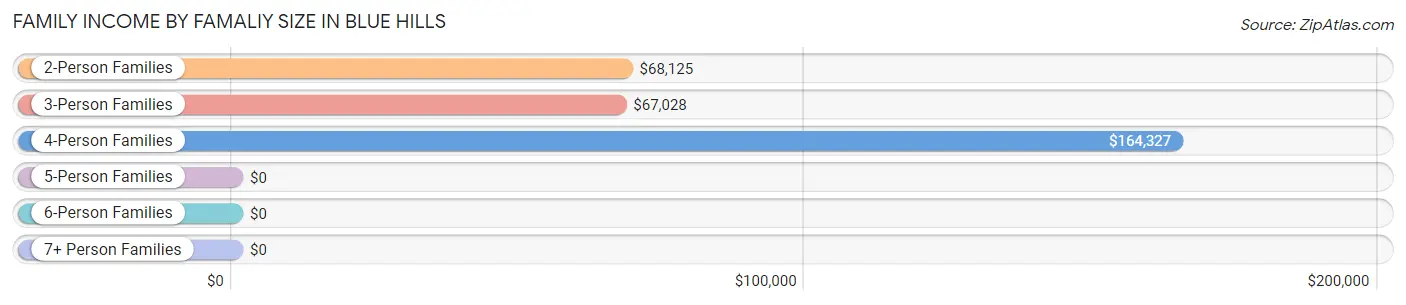
| Income Bracket | # Families | Median Income |
| 2-Person Families | 273 (46.0%) | $68,125 |
| 3-Person Families | 178 (30.0%) | $67,028 |
| 4-Person Families | 112 (18.9%) | $164,327 |
| 5-Person Families | 10 (1.7%) | $0 |
| 6-Person Families | 21 (3.5%) | $0 |
| 7+ Person Families | 0 (0.0%) | $0 |
| Total | 594 (100.0%) | $80,227 |
Family Income by Number of Earners in Blue Hills
The median family income in Blue Hills is $80,227, with families comprising 3+ earners (56) having the highest median family income of $190,250, while families with no earners (45) have the lowest median family income of $49,844, accounting for 9.4% and 7.6% of families, respectively.
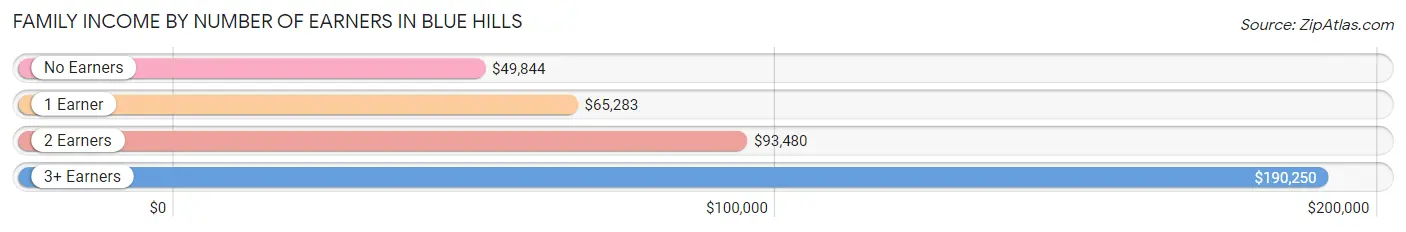
| Number of Earners | # Families | Median Income |
| No Earners | 45 (7.6%) | $49,844 |
| 1 Earner | 232 (39.1%) | $65,283 |
| 2 Earners | 261 (43.9%) | $93,480 |
| 3+ Earners | 56 (9.4%) | $190,250 |
| Total | 594 (100.0%) | $80,227 |
Household Income in Blue Hills
Household Income Brackets in Blue Hills
With 253 households falling in the category, the $35,000 to $49,999 income range is the most frequent in Blue Hills, accounting for 26.9% of all households. In contrast, only 9 households (1.0%) fall into the less than $10,000 income bracket, making it the least populous group.
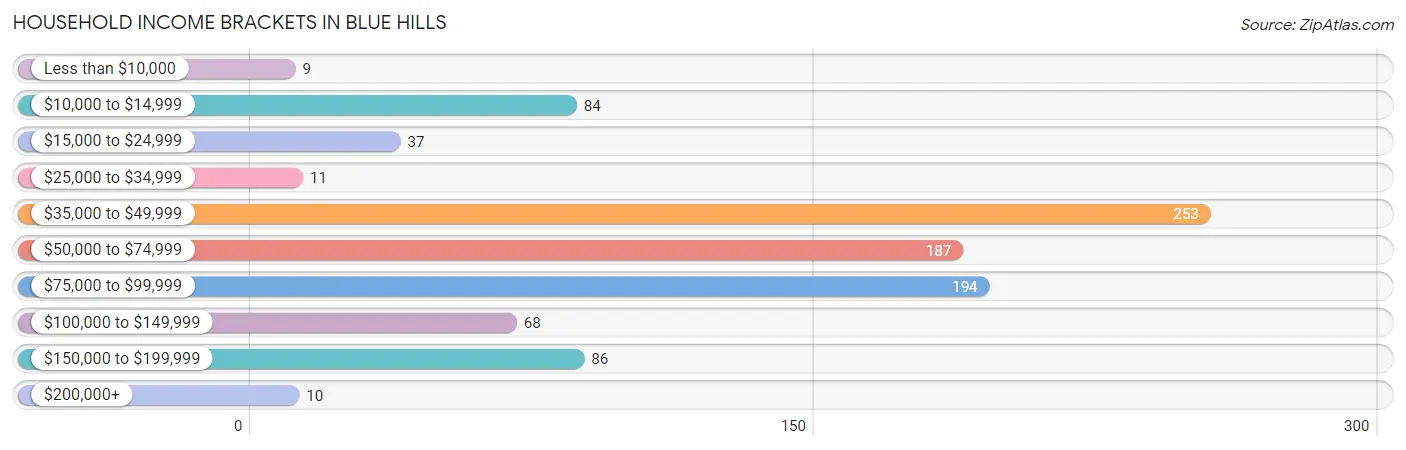
| Income Bracket | # Households | % Households |
| Less than $10,000 | 9 | 1.0% |
| $10,000 to $14,999 | 84 | 8.9% |
| $15,000 to $24,999 | 37 | 3.9% |
| $25,000 to $34,999 | 11 | 1.2% |
| $35,000 to $49,999 | 253 | 26.9% |
| $50,000 to $74,999 | 187 | 19.9% |
| $75,000 to $99,999 | 194 | 20.7% |
| $100,000 to $149,999 | 68 | 7.2% |
| $150,000 to $199,999 | 86 | 9.2% |
| $200,000+ | 10 | 1.1% |
Household Income by Householder Age in Blue Hills
The median household income in Blue Hills is $63,844, with the highest median household income of $67,311 found in the 25 to 44 years age bracket for the primary householder. A total of 174 households (18.5%) fall into this category.
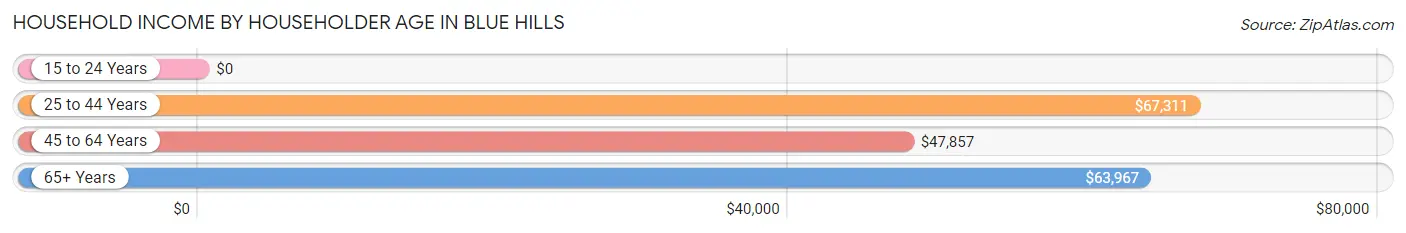
| Income Bracket | # Households | Median Income |
| 15 to 24 Years | 0 (0.0%) | $0 |
| 25 to 44 Years | 174 (18.5%) | $67,311 |
| 45 to 64 Years | 528 (56.2%) | $47,857 |
| 65+ Years | 237 (25.2%) | $63,967 |
| Total | 939 (100.0%) | $63,844 |
Poverty in Blue Hills
Income Below Poverty by Sex and Age in Blue Hills
With 12.0% poverty level for males and 18.8% for females among the residents of Blue Hills, 18 to 24 year old males and 5 year old females are the most vulnerable to poverty, with 33 males (52.4%) and 24 females (64.9%) in their respective age groups living below the poverty level.
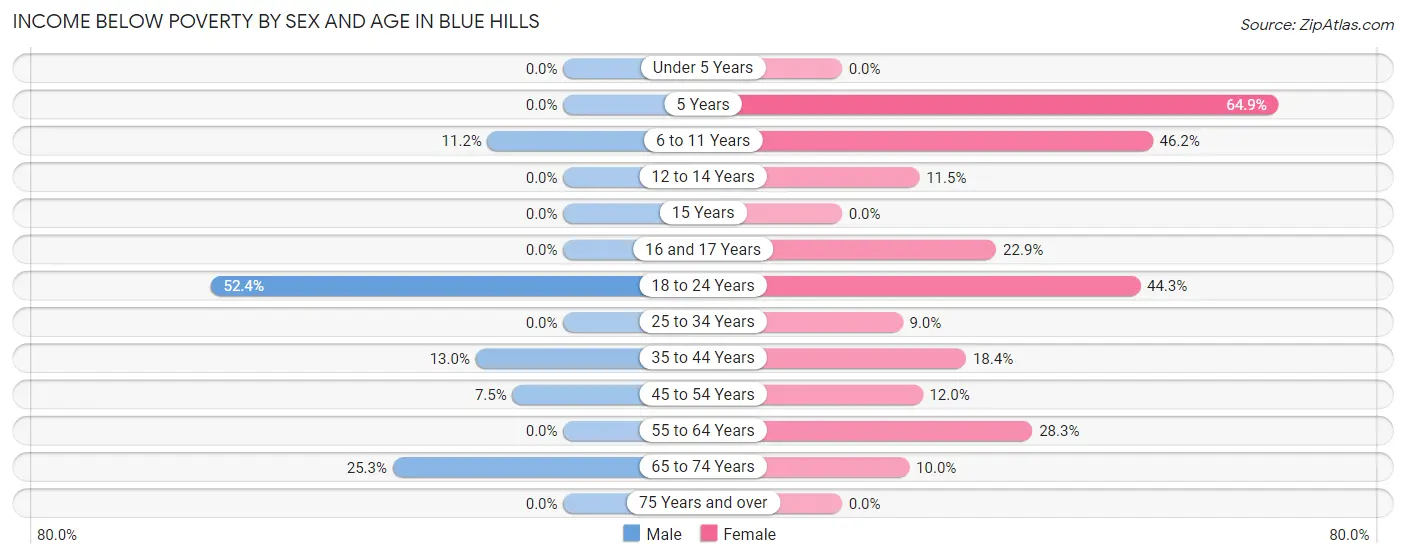
| Age Bracket | Male | Female |
| Under 5 Years | 0 (0.0%) | 0 (0.0%) |
| 5 Years | 0 (0.0%) | 24 (64.9%) |
| 6 to 11 Years | 10 (11.2%) | 12 (46.2%) |
| 12 to 14 Years | 0 (0.0%) | 13 (11.5%) |
| 15 Years | 0 (0.0%) | 0 (0.0%) |
| 16 and 17 Years | 0 (0.0%) | 11 (22.9%) |
| 18 to 24 Years | 33 (52.4%) | 31 (44.3%) |
| 25 to 34 Years | 0 (0.0%) | 11 (9.0%) |
| 35 to 44 Years | 16 (13.0%) | 26 (18.4%) |
| 45 to 54 Years | 15 (7.5%) | 23 (12.0%) |
| 55 to 64 Years | 0 (0.0%) | 110 (28.3%) |
| 65 to 74 Years | 20 (25.3%) | 10 (10.0%) |
| 75 Years and over | 0 (0.0%) | 0 (0.0%) |
| Total | 94 (12.0%) | 271 (18.8%) |
Income Above Poverty by Sex and Age in Blue Hills
According to the poverty statistics in Blue Hills, males aged under 5 years and females aged under 5 years are the age groups that are most secure financially, with 100.0% of males and 100.0% of females in these age groups living above the poverty line.
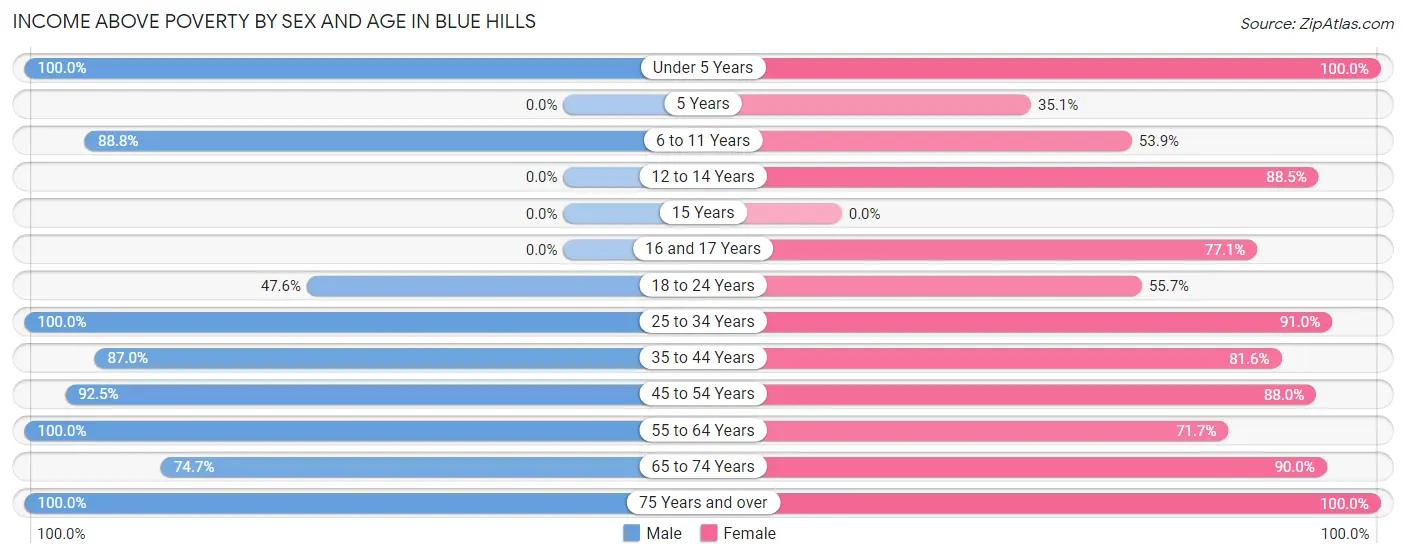
| Age Bracket | Male | Female |
| Under 5 Years | 30 (100.0%) | 47 (100.0%) |
| 5 Years | 0 (0.0%) | 13 (35.1%) |
| 6 to 11 Years | 79 (88.8%) | 14 (53.8%) |
| 12 to 14 Years | 0 (0.0%) | 100 (88.5%) |
| 15 Years | 0 (0.0%) | 0 (0.0%) |
| 16 and 17 Years | 0 (0.0%) | 37 (77.1%) |
| 18 to 24 Years | 30 (47.6%) | 39 (55.7%) |
| 25 to 34 Years | 69 (100.0%) | 111 (91.0%) |
| 35 to 44 Years | 107 (87.0%) | 115 (81.6%) |
| 45 to 54 Years | 184 (92.5%) | 169 (88.0%) |
| 55 to 64 Years | 104 (100.0%) | 279 (71.7%) |
| 65 to 74 Years | 59 (74.7%) | 90 (90.0%) |
| 75 Years and over | 24 (100.0%) | 159 (100.0%) |
| Total | 686 (87.9%) | 1,173 (81.2%) |
Income Below Poverty Among Married-Couple Families in Blue Hills
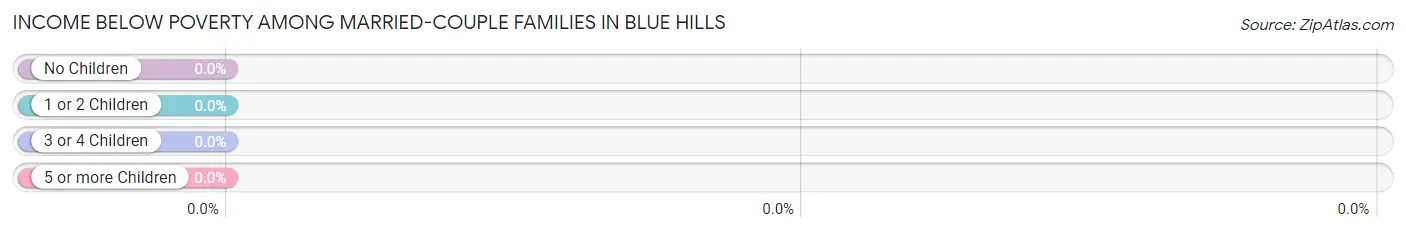
| Children | Above Poverty | Below Poverty |
| No Children | 160 (100.0%) | 0 (0.0%) |
| 1 or 2 Children | 124 (100.0%) | 0 (0.0%) |
| 3 or 4 Children | 0 (0.0%) | 0 (0.0%) |
| 5 or more Children | 0 (0.0%) | 0 (0.0%) |
| Total | 284 (100.0%) | 0 (0.0%) |
Income Below Poverty Among Single-Parent Households in Blue Hills
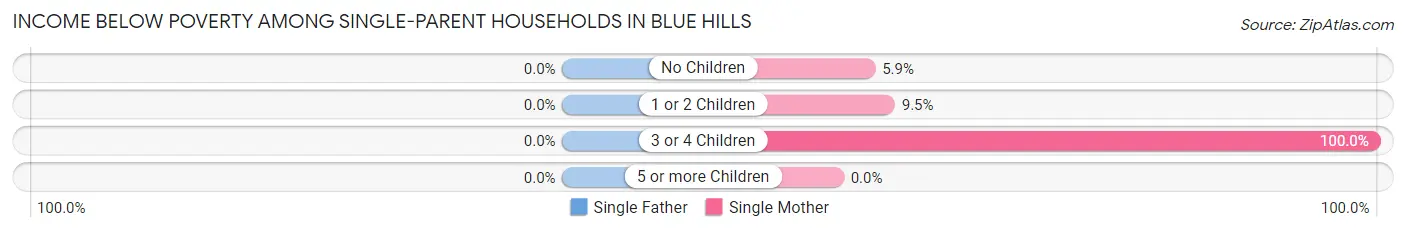
| Children | Single Father | Single Mother |
| No Children | 0 (0.0%) | 10 (5.9%) |
| 1 or 2 Children | 0 (0.0%) | 10 (9.5%) |
| 3 or 4 Children | 0 (0.0%) | 11 (100.0%) |
| 5 or more Children | 0 (0.0%) | 0 (0.0%) |
| Total | 0 (0.0%) | 31 (10.8%) |
Income Below Poverty Among Married-Couple vs Single-Parent Households in Blue Hills
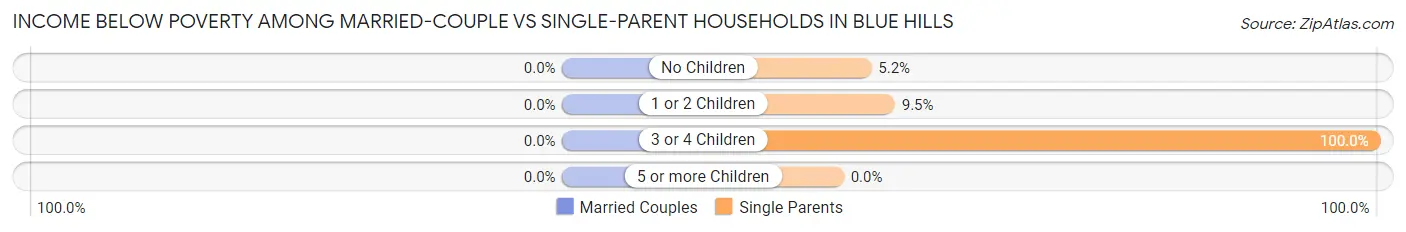
| Children | Married-Couple Families | Single-Parent Households |
| No Children | 0 (0.0%) | 10 (5.1%) |
| 1 or 2 Children | 0 (0.0%) | 10 (9.5%) |
| 3 or 4 Children | 0 (0.0%) | 11 (100.0%) |
| 5 or more Children | 0 (0.0%) | 0 (0.0%) |
| Total | 0 (0.0%) | 31 (10.0%) |
Race in Blue Hills
The most populous races in Blue Hills are Black / African American (1,784 | 80.2%), White / Caucasian (246 | 11.1%), and Hispanic or Latino (228 | 10.2%).
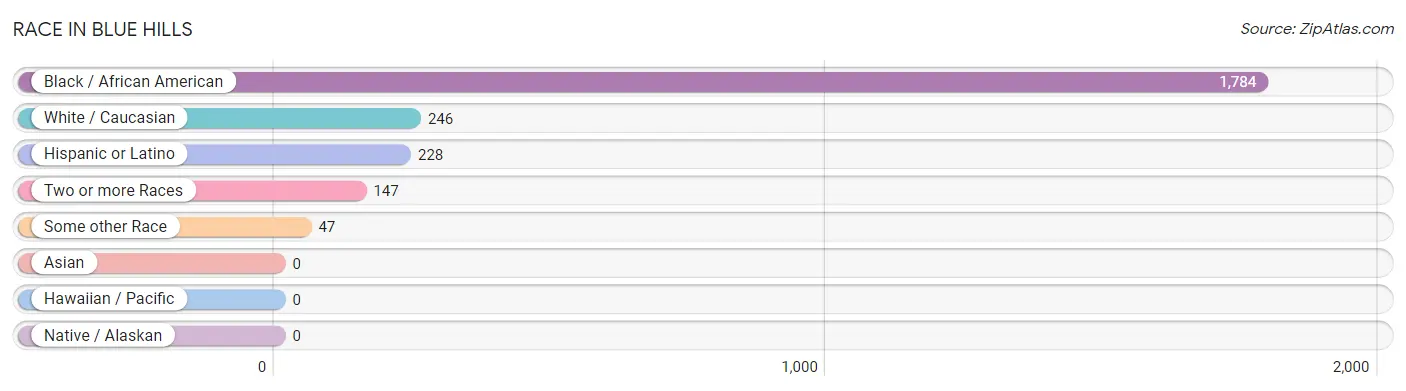
| Race | # Population | % Population |
| Asian | 0 | 0.0% |
| Black / African American | 1,784 | 80.2% |
| Hawaiian / Pacific | 0 | 0.0% |
| Hispanic or Latino | 228 | 10.2% |
| Native / Alaskan | 0 | 0.0% |
| White / Caucasian | 246 | 11.1% |
| Two or more Races | 147 | 6.6% |
| Some other Race | 47 | 2.1% |
| Total | 2,224 | 100.0% |
Ancestry in Blue Hills
The most populous ancestries reported in Blue Hills are Jamaican (790 | 35.5%), American (198 | 8.9%), Dominican (102 | 4.6%), Puerto Rican (101 | 4.5%), and Brazilian (90 | 4.1%), together accounting for 57.6% of all Blue Hills residents.
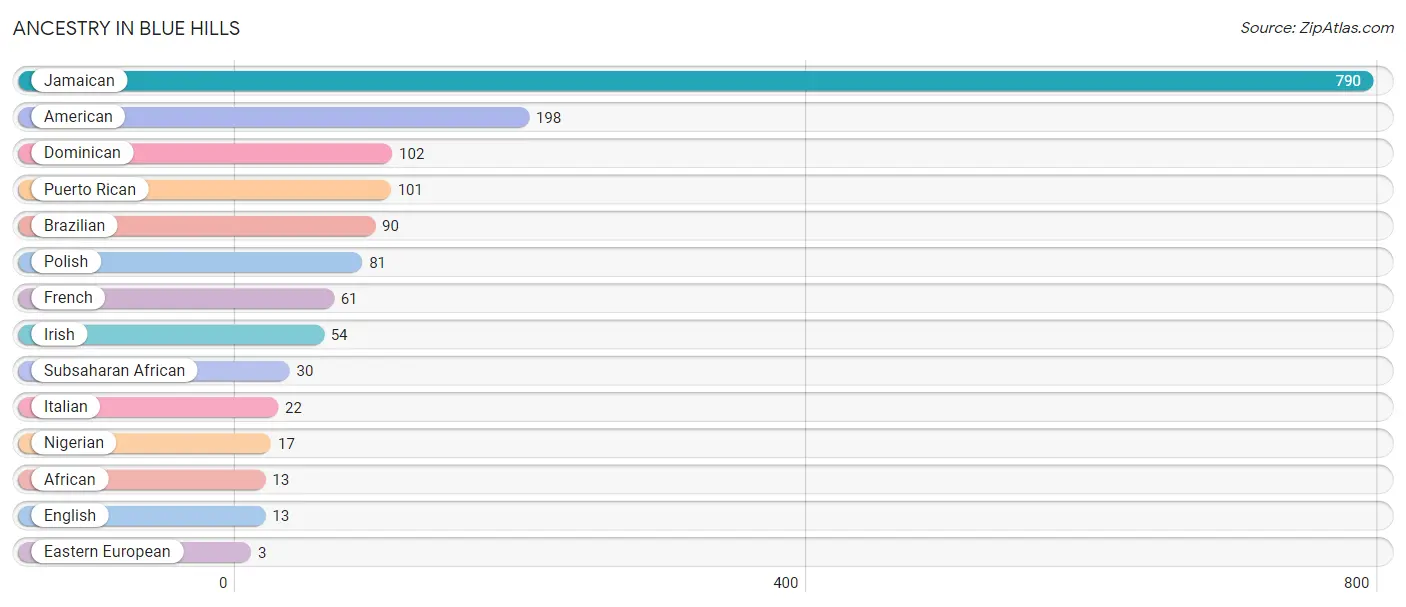
| Ancestry | # Population | % Population |
| African | 13 | 0.6% |
| American | 198 | 8.9% |
| Brazilian | 90 | 4.1% |
| Dominican | 102 | 4.6% |
| Eastern European | 3 | 0.1% |
| English | 13 | 0.6% |
| French | 61 | 2.7% |
| Irish | 54 | 2.4% |
| Italian | 22 | 1.0% |
| Jamaican | 790 | 35.5% |
| Nigerian | 17 | 0.8% |
| Polish | 81 | 3.6% |
| Puerto Rican | 101 | 4.5% |
| Subsaharan African | 30 | 1.3% | View All 14 Rows |
Immigrants in Blue Hills
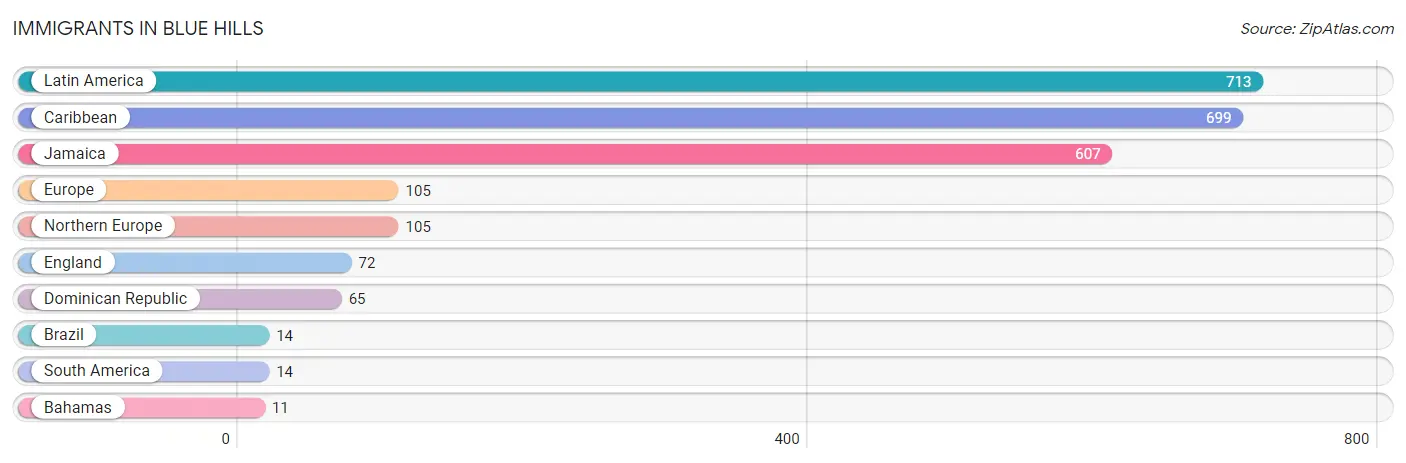
The most numerous immigrant groups reported in Blue Hills came from Latin America (713 | 32.1%), Caribbean (699 | 31.4%), Jamaica (607 | 27.3%), Europe (105 | 4.7%), and Northern Europe (105 | 4.7%), together accounting for 100.2% of all Blue Hills residents.
| Immigration Origin | # Population | % Population |
| Bahamas | 11 | 0.5% |
| Brazil | 14 | 0.6% |
| Caribbean | 699 | 31.4% |
| Dominican Republic | 65 | 2.9% |
| England | 72 | 3.2% |
| Europe | 105 | 4.7% |
| Jamaica | 607 | 27.3% |
| Latin America | 713 | 32.1% |
| Northern Europe | 105 | 4.7% |
| South America | 14 | 0.6% | View All 10 Rows |
Sex and Age in Blue Hills
Sex and Age in Blue Hills
The most populous age groups in Blue Hills are 50 to 54 Years (107 | 13.7%) for men and 55 to 59 Years (217 | 15.0%) for women.
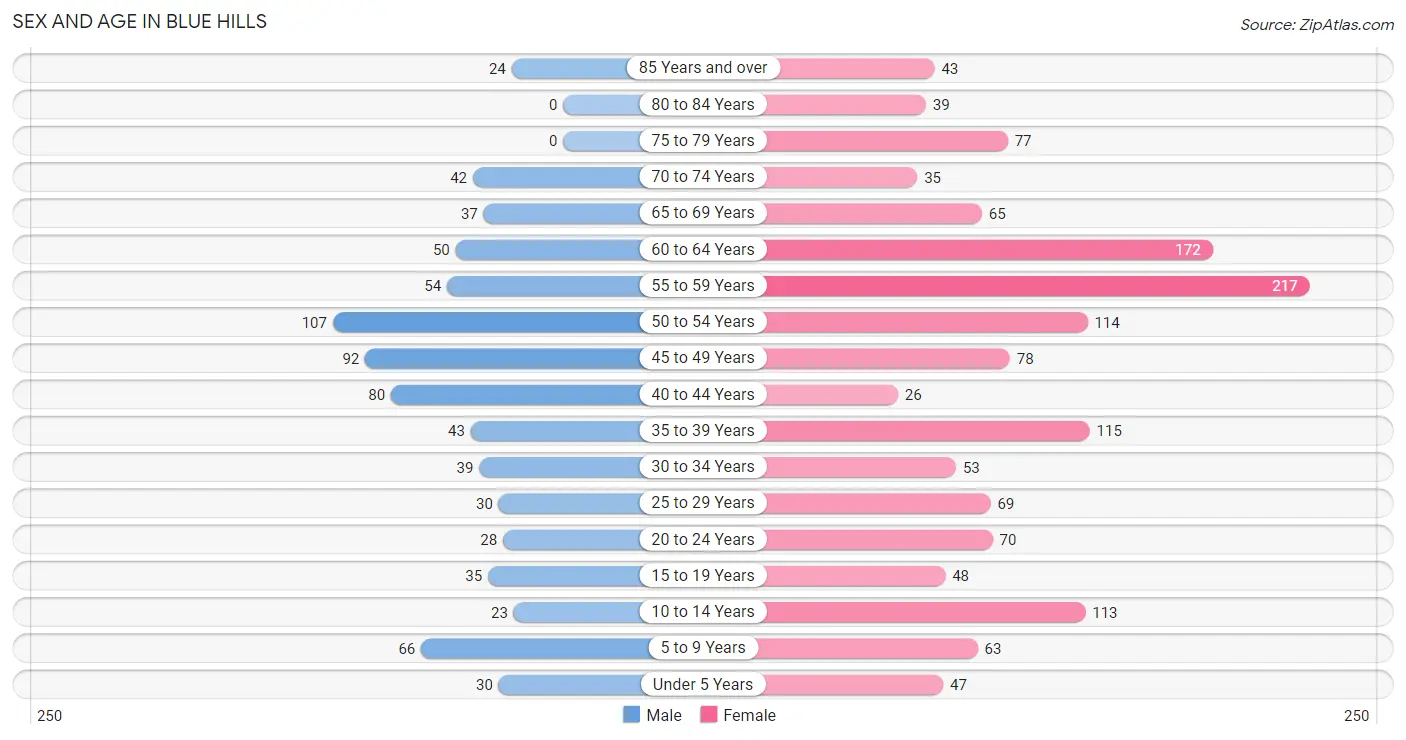
| Age Bracket | Male | Female |
| Under 5 Years | 30 (3.8%) | 47 (3.3%) |
| 5 to 9 Years | 66 (8.5%) | 63 (4.4%) |
| 10 to 14 Years | 23 (2.9%) | 113 (7.8%) |
| 15 to 19 Years | 35 (4.5%) | 48 (3.3%) |
| 20 to 24 Years | 28 (3.6%) | 70 (4.9%) |
| 25 to 29 Years | 30 (3.8%) | 69 (4.8%) |
| 30 to 34 Years | 39 (5.0%) | 53 (3.7%) |
| 35 to 39 Years | 43 (5.5%) | 115 (8.0%) |
| 40 to 44 Years | 80 (10.3%) | 26 (1.8%) |
| 45 to 49 Years | 92 (11.8%) | 78 (5.4%) |
| 50 to 54 Years | 107 (13.7%) | 114 (7.9%) |
| 55 to 59 Years | 54 (6.9%) | 217 (15.0%) |
| 60 to 64 Years | 50 (6.4%) | 172 (11.9%) |
| 65 to 69 Years | 37 (4.7%) | 65 (4.5%) |
| 70 to 74 Years | 42 (5.4%) | 35 (2.4%) |
| 75 to 79 Years | 0 (0.0%) | 77 (5.3%) |
| 80 to 84 Years | 0 (0.0%) | 39 (2.7%) |
| 85 Years and over | 24 (3.1%) | 43 (3.0%) |
| Total | 780 (100.0%) | 1,444 (100.0%) |
Families and Households in Blue Hills
Median Family Size in Blue Hills
The median family size in Blue Hills is 3.01 persons per family, with single male/father families (24 | 4.0%) accounting for the largest median family size of 3.63 persons per family. On the other hand, single female/mother families (286 | 48.1%) represent the smallest median family size with 2.93 persons per family.
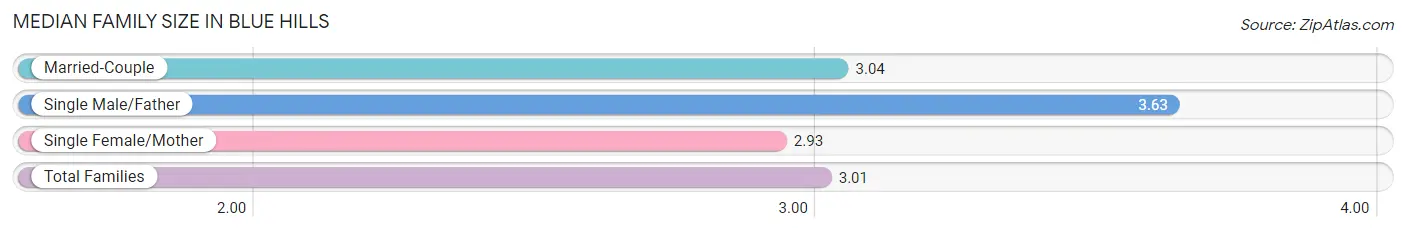
| Family Type | # Families | Family Size |
| Married-Couple | 284 (47.8%) | 3.04 |
| Single Male/Father | 24 (4.0%) | 3.63 |
| Single Female/Mother | 286 (48.1%) | 2.93 |
| Total Families | 594 (100.0%) | 3.01 |
Median Household Size in Blue Hills
The median household size in Blue Hills is 2.37 persons per household, with single male/father households (24 | 2.6%) accounting for the largest median household size of 4.17 persons per household. non-family households (345 | 36.7%) represent the smallest median household size with 1.04 persons per household.
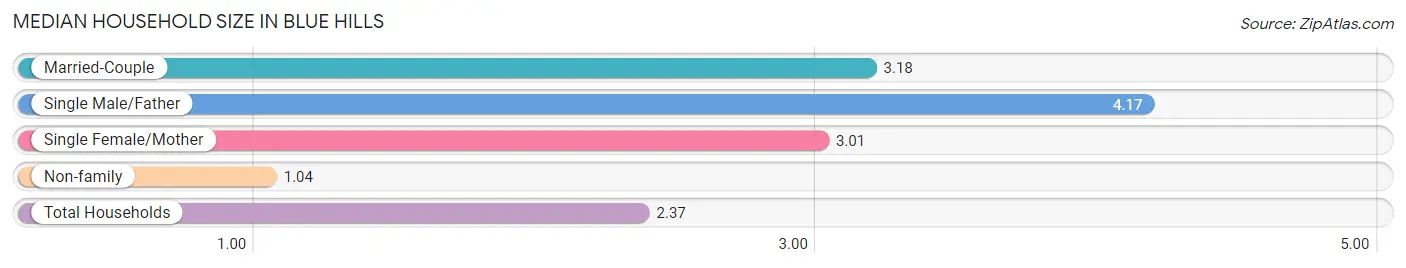
| Household Type | # Households | Household Size |
| Married-Couple | 284 (30.2%) | 3.18 |
| Single Male/Father | 24 (2.6%) | 4.17 |
| Single Female/Mother | 286 (30.5%) | 3.01 |
| Non-family | 345 (36.7%) | 1.04 |
| Total Households | 939 (100.0%) | 2.37 |
Household Size by Marriage Status in Blue Hills
Out of a total of 939 households in Blue Hills, 594 (63.3%) are family households, while 345 (36.7%) are nonfamily households. The most numerous type of family households are 2-person households, comprising 259, and the most common type of nonfamily households are 1-person households, comprising 332.
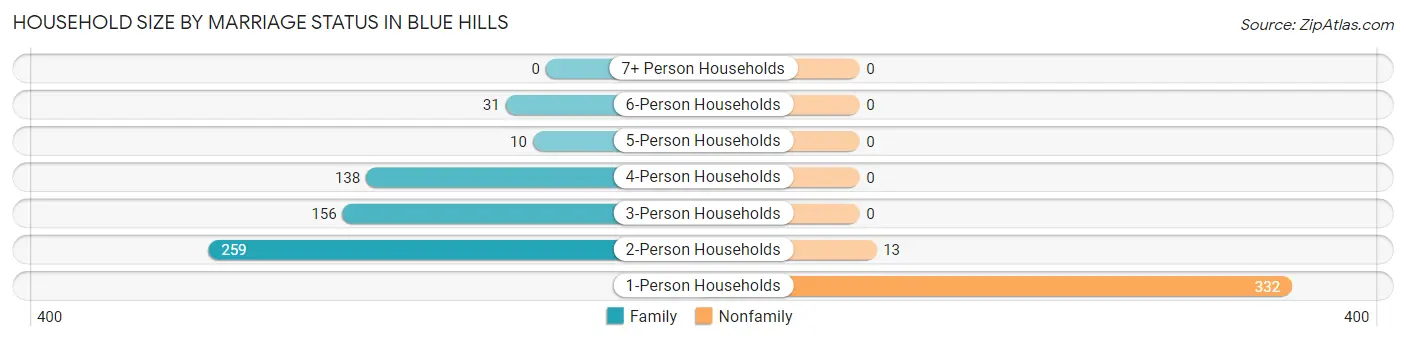
| Household Size | Family Households | Nonfamily Households |
| 1-Person Households | - | 332 (35.4%) |
| 2-Person Households | 259 (27.6%) | 13 (1.4%) |
| 3-Person Households | 156 (16.6%) | 0 (0.0%) |
| 4-Person Households | 138 (14.7%) | 0 (0.0%) |
| 5-Person Households | 10 (1.1%) | 0 (0.0%) |
| 6-Person Households | 31 (3.3%) | 0 (0.0%) |
| 7+ Person Households | 0 (0.0%) | 0 (0.0%) |
| Total | 594 (63.3%) | 345 (36.7%) |
Female Fertility in Blue Hills
Fertility by Age in Blue Hills
Average fertility rate in Blue Hills is 51.0 births per 1,000 women. Women in the age bracket of 20 to 34 years have the highest fertility rate with 135.0 births per 1,000 women. Women in the age bracket of 20 to 34 years acount for 100.0% of all women with births.
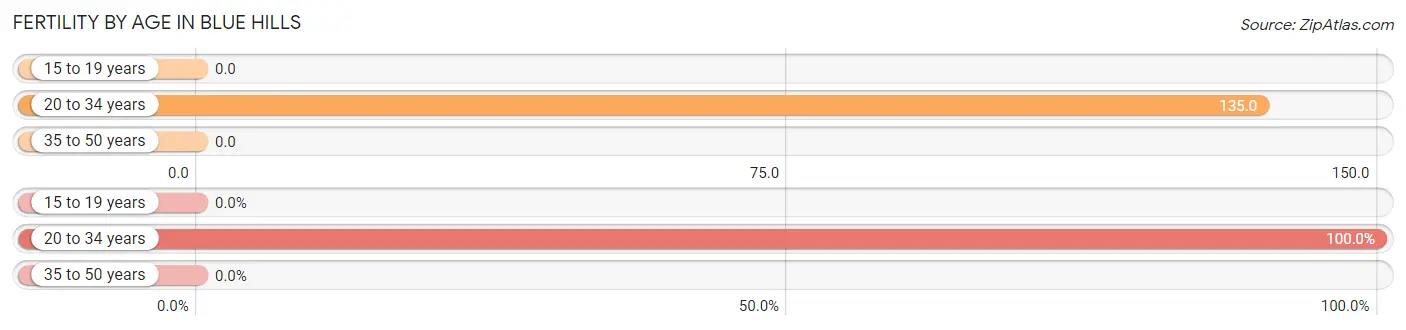
| Age Bracket | Women with Births | Births / 1,000 Women |
| 15 to 19 years | 0 (0.0%) | 0.0 |
| 20 to 34 years | 26 (100.0%) | 135.0 |
| 35 to 50 years | 0 (0.0%) | 0.0 |
| Total | 26 (100.0%) | 51.0 |
Fertility by Age by Marriage Status in Blue Hills
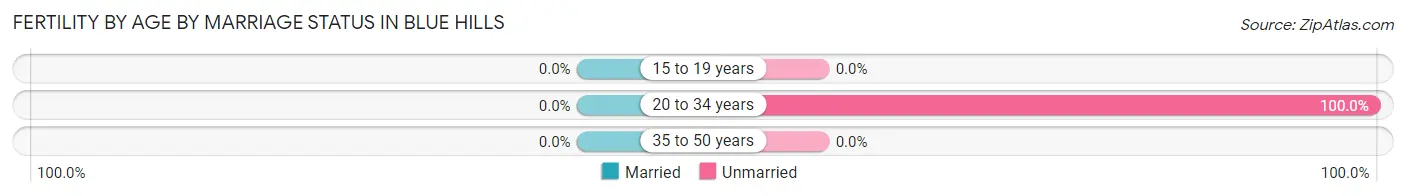
| Age Bracket | Married | Unmarried |
| 15 to 19 years | 0 (0.0%) | 0 (0.0%) |
| 20 to 34 years | 0 (0.0%) | 26 (100.0%) |
| 35 to 50 years | 0 (0.0%) | 0 (0.0%) |
| Total | 0 (0.0%) | 26 (100.0%) |
Fertility by Education in Blue Hills
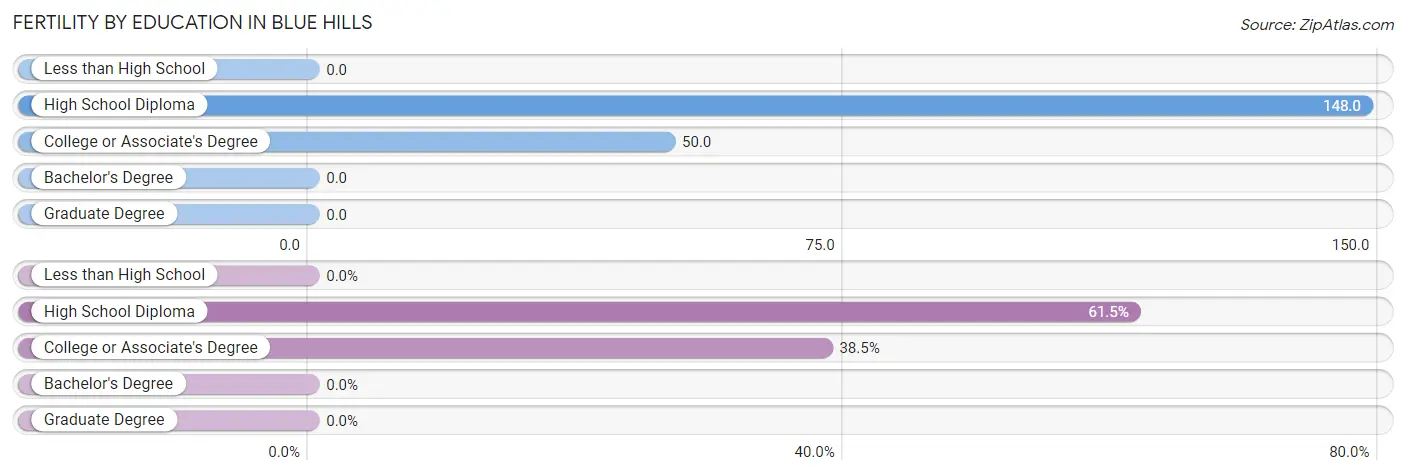
| Educational Attainment | Women with Births | Births / 1,000 Women |
| Less than High School | 0 (0.0%) | 0.0 |
| High School Diploma | 16 (61.5%) | 148.0 |
| College or Associate's Degree | 10 (38.5%) | 50.0 |
| Bachelor's Degree | 0 (0.0%) | 0.0 |
| Graduate Degree | 0 (0.0%) | 0.0 |
| Total | 26 (100.0%) | 51.0 |
Fertility by Education by Marriage Status in Blue Hills
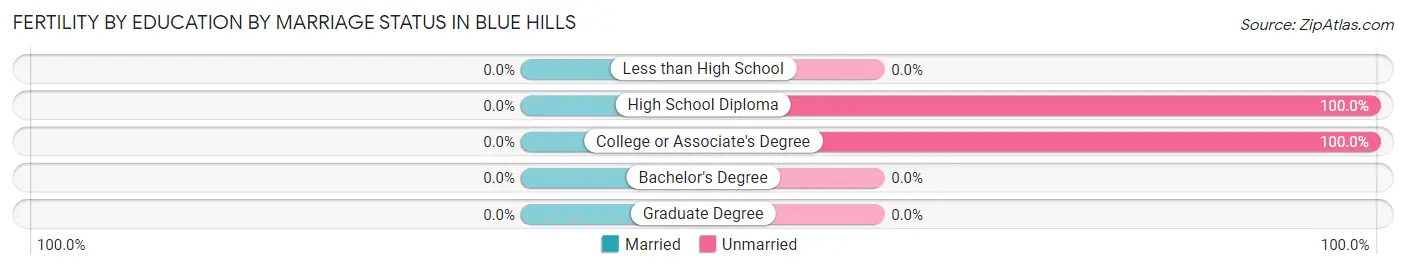
| Educational Attainment | Married | Unmarried |
| Less than High School | 0 (0.0%) | 0 (0.0%) |
| High School Diploma | 0 (0.0%) | 16 (100.0%) |
| College or Associate's Degree | 0 (0.0%) | 10 (100.0%) |
| Bachelor's Degree | 0 (0.0%) | 0 (0.0%) |
| Graduate Degree | 0 (0.0%) | 0 (0.0%) |
| Total | 0 (0.0%) | 26 (100.0%) |
Employment Characteristics in Blue Hills
Employment by Class of Employer in Blue Hills
Among the 1,266 employed individuals in Blue Hills, private company employees (767 | 60.6%), not-for-profit organizations (230 | 18.2%), and local government employees (108 | 8.5%) make up the most common classes of employment.
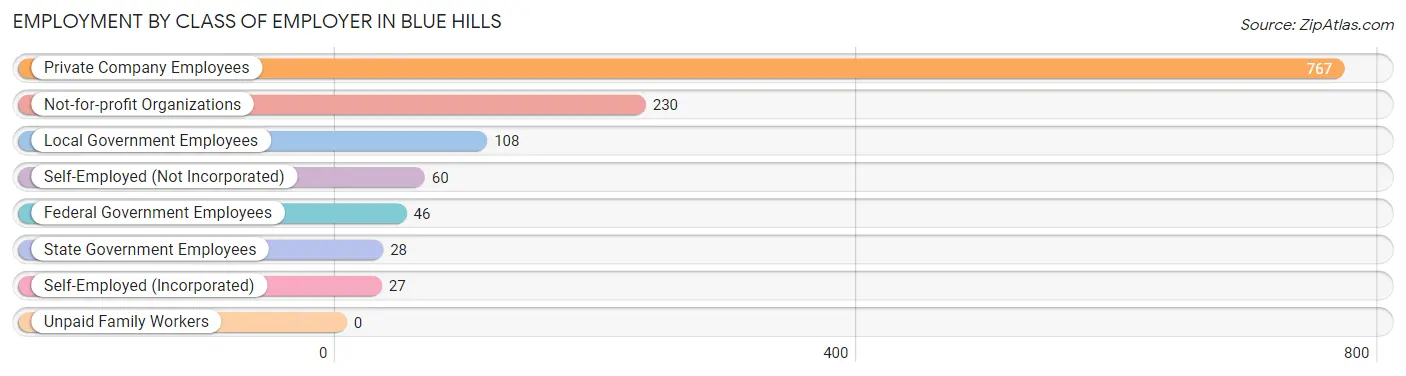
| Employer Class | # Employees | % Employees |
| Private Company Employees | 767 | 60.6% |
| Self-Employed (Incorporated) | 27 | 2.1% |
| Self-Employed (Not Incorporated) | 60 | 4.7% |
| Not-for-profit Organizations | 230 | 18.2% |
| Local Government Employees | 108 | 8.5% |
| State Government Employees | 28 | 2.2% |
| Federal Government Employees | 46 | 3.6% |
| Unpaid Family Workers | 0 | 0.0% |
| Total | 1,266 | 100.0% |
Employment Status by Age in Blue Hills
According to the labor force statistics for Blue Hills, out of the total population over 16 years of age (1,882), 72.0% or 1,355 individuals are in the labor force, with 3.5% or 47 of them unemployed. The age group with the highest labor force participation rate is 20 to 24 years, with 100.0% or 98 individuals in the labor force. Within the labor force, the 20 to 24 years age range has the highest percentage of unemployed individuals, with 17.3% or 17 of them being unemployed.
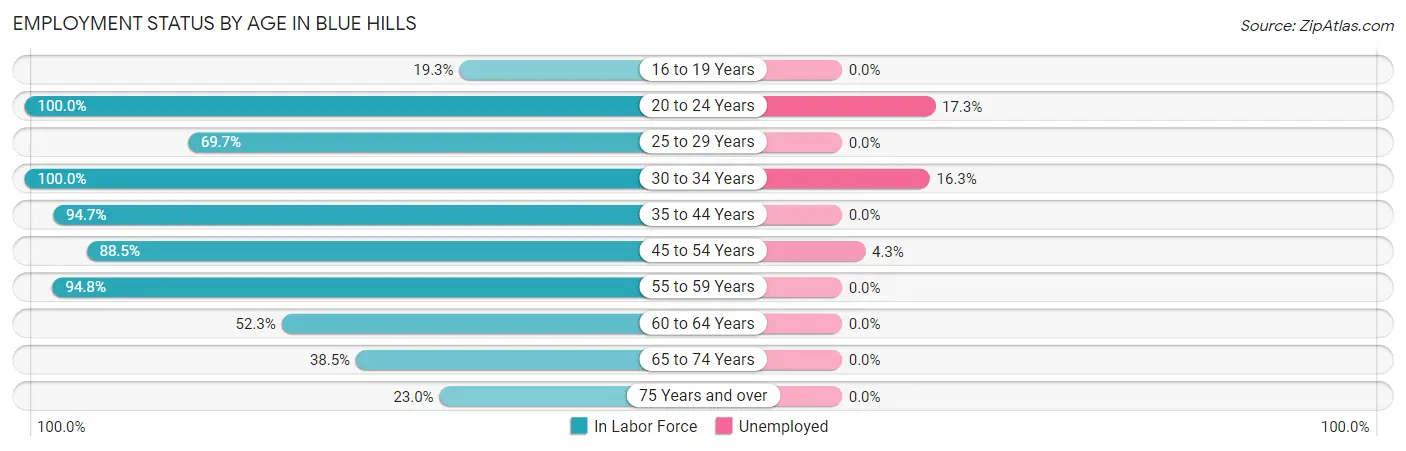
| Age Bracket | In Labor Force | Unemployed |
| 16 to 19 Years | 16 (19.3%) | 0 (0.0%) |
| 20 to 24 Years | 98 (100.0%) | 17 (17.3%) |
| 25 to 29 Years | 69 (69.7%) | 0 (0.0%) |
| 30 to 34 Years | 92 (100.0%) | 15 (16.3%) |
| 35 to 44 Years | 250 (94.7%) | 0 (0.0%) |
| 45 to 54 Years | 346 (88.5%) | 15 (4.3%) |
| 55 to 59 Years | 257 (94.8%) | 0 (0.0%) |
| 60 to 64 Years | 116 (52.3%) | 0 (0.0%) |
| 65 to 74 Years | 69 (38.5%) | 0 (0.0%) |
| 75 Years and over | 42 (23.0%) | 0 (0.0%) |
| Total | 1,355 (72.0%) | 47 (3.5%) |
Employment Status by Educational Attainment in Blue Hills
According to labor force statistics for Blue Hills, 84.4% of individuals (1,130) out of the total population between 25 and 64 years of age (1,339) are in the labor force, with 2.7% or 31 of them being unemployed. The group with the highest labor force participation rate are those with the educational attainment of high school diploma, with 90.9% or 472 individuals in the labor force. Within the labor force, individuals with bachelor's degree or higher education have the highest percentage of unemployment, with 6.7% or 15 of them being unemployed.
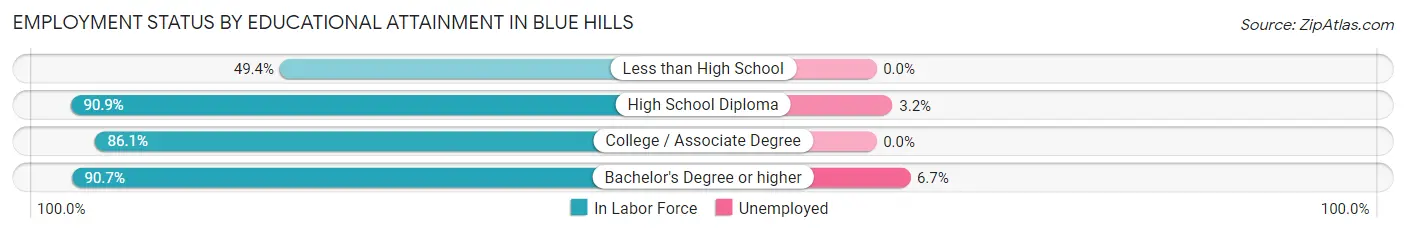
| Educational Attainment | In Labor Force | Unemployed |
| Less than High School | 80 (49.4%) | 0 (0.0%) |
| High School Diploma | 472 (90.9%) | 17 (3.2%) |
| College / Associate Degree | 354 (86.1%) | 0 (0.0%) |
| Bachelor's Degree or higher | 224 (90.7%) | 17 (6.7%) |
| Total | 1,130 (84.4%) | 36 (2.7%) |
Employment Occupations by Sex in Blue Hills
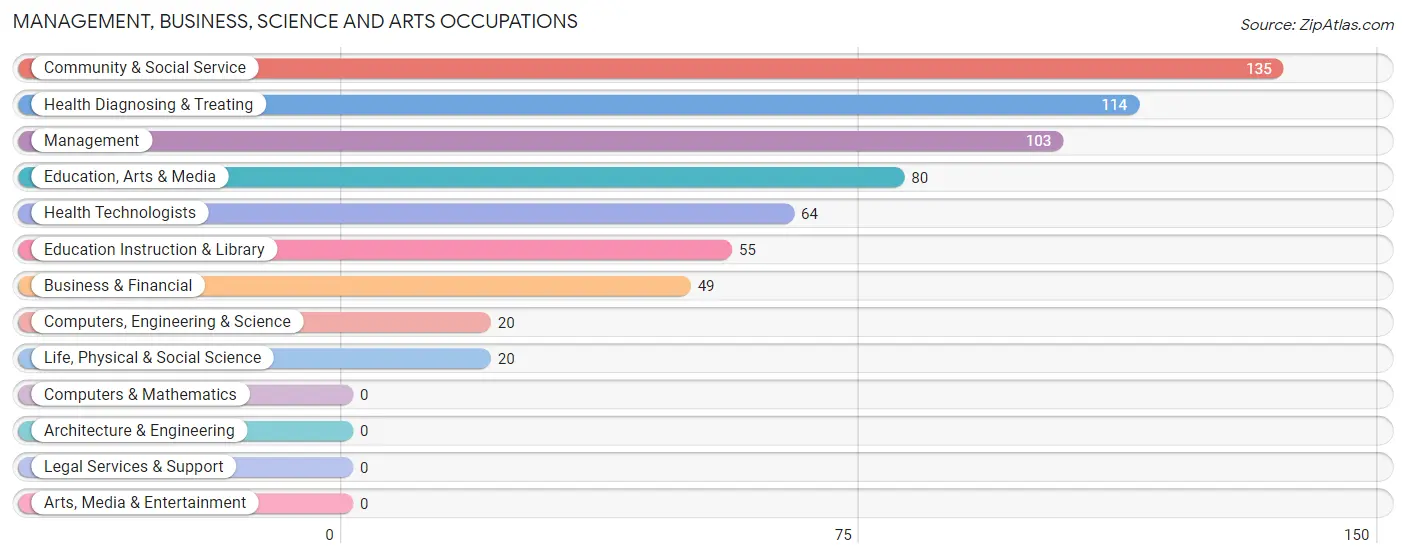
Management, Business, Science and Arts Occupations
The most common Management, Business, Science and Arts occupations in Blue Hills are Community & Social Service (135 | 10.3%), Health Diagnosing & Treating (114 | 8.7%), Management (103 | 7.9%), Education, Arts & Media (80 | 6.1%), and Health Technologists (64 | 4.9%).
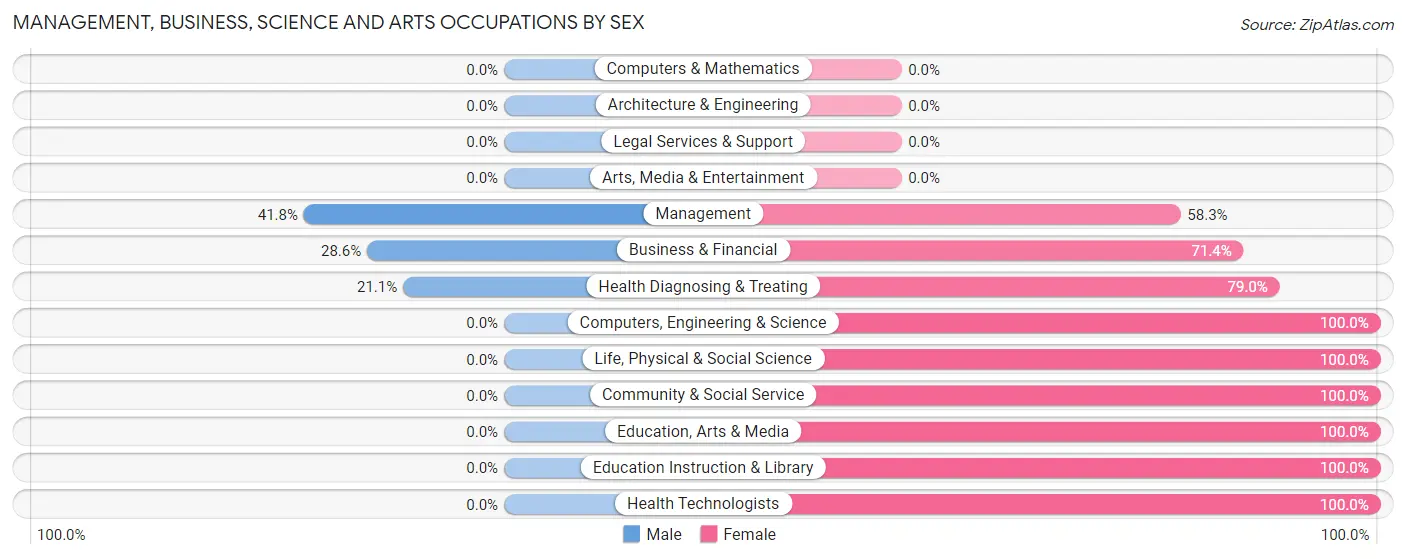
Management, Business, Science and Arts Occupations by Sex
Within the Management, Business, Science and Arts occupations in Blue Hills, the most male-oriented occupations are Management (41.7%), Business & Financial (28.6%), and Health Diagnosing & Treating (21.0%), while the most female-oriented occupations are Computers, Engineering & Science (100.0%), Life, Physical & Social Science (100.0%), and Community & Social Service (100.0%).
| Occupation | Male | Female |
| Management | 43 (41.7%) | 60 (58.3%) |
| Business & Financial | 14 (28.6%) | 35 (71.4%) |
| Computers, Engineering & Science | 0 (0.0%) | 20 (100.0%) |
| Computers & Mathematics | 0 (0.0%) | 0 (0.0%) |
| Architecture & Engineering | 0 (0.0%) | 0 (0.0%) |
| Life, Physical & Social Science | 0 (0.0%) | 20 (100.0%) |
| Community & Social Service | 0 (0.0%) | 135 (100.0%) |
| Education, Arts & Media | 0 (0.0%) | 80 (100.0%) |
| Legal Services & Support | 0 (0.0%) | 0 (0.0%) |
| Education Instruction & Library | 0 (0.0%) | 55 (100.0%) |
| Arts, Media & Entertainment | 0 (0.0%) | 0 (0.0%) |
| Health Diagnosing & Treating | 24 (21.0%) | 90 (78.9%) |
| Health Technologists | 0 (0.0%) | 64 (100.0%) |
| Total (Category) | 81 (19.2%) | 340 (80.8%) |
| Total (Overall) | 451 (34.5%) | 857 (65.5%) |
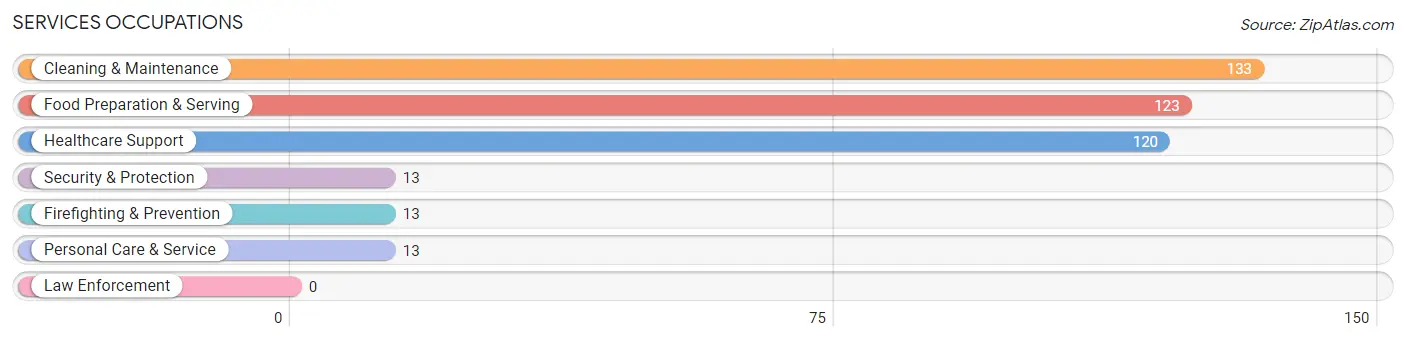
Services Occupations
The most common Services occupations in Blue Hills are Cleaning & Maintenance (133 | 10.2%), Food Preparation & Serving (123 | 9.4%), Healthcare Support (120 | 9.2%), Security & Protection (13 | 1.0%), and Firefighting & Prevention (13 | 1.0%).
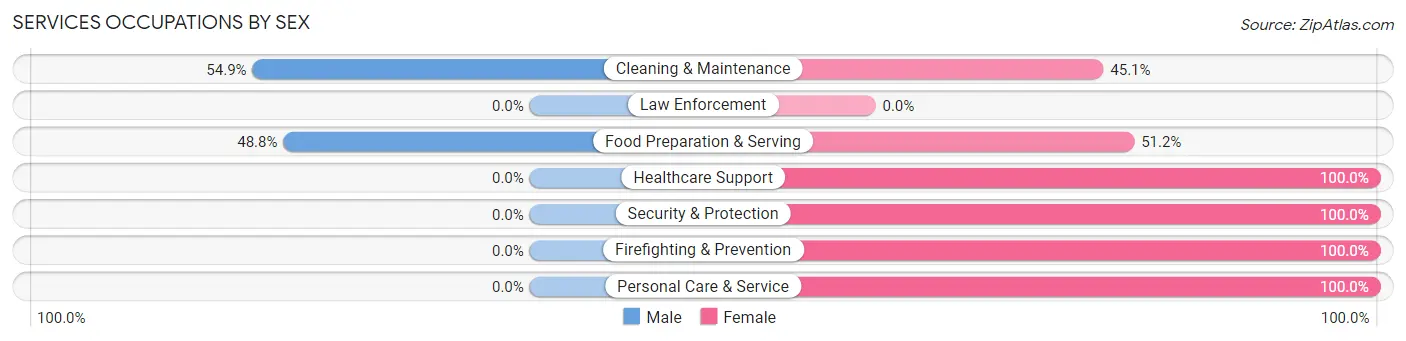
Services Occupations by Sex
Within the Services occupations in Blue Hills, the most male-oriented occupations are Cleaning & Maintenance (54.9%), and Food Preparation & Serving (48.8%), while the most female-oriented occupations are Healthcare Support (100.0%), Security & Protection (100.0%), and Firefighting & Prevention (100.0%).
| Occupation | Male | Female |
| Healthcare Support | 0 (0.0%) | 120 (100.0%) |
| Security & Protection | 0 (0.0%) | 13 (100.0%) |
| Firefighting & Prevention | 0 (0.0%) | 13 (100.0%) |
| Law Enforcement | 0 (0.0%) | 0 (0.0%) |
| Food Preparation & Serving | 60 (48.8%) | 63 (51.2%) |
| Cleaning & Maintenance | 73 (54.9%) | 60 (45.1%) |
| Personal Care & Service | 0 (0.0%) | 13 (100.0%) |
| Total (Category) | 133 (33.1%) | 269 (66.9%) |
| Total (Overall) | 451 (34.5%) | 857 (65.5%) |
Sales and Office Occupations
The most common Sales and Office occupations in Blue Hills are Office & Administration (164 | 12.5%), and Sales & Related (98 | 7.5%).
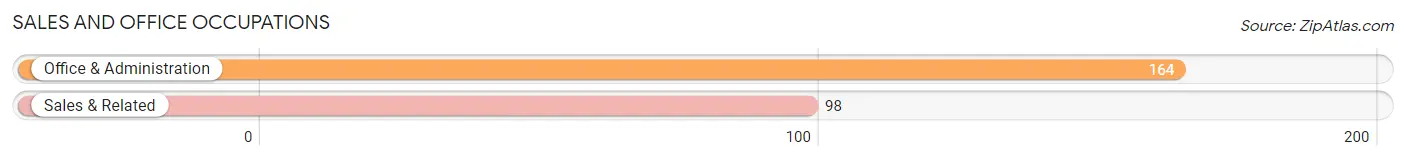
Sales and Office Occupations by Sex
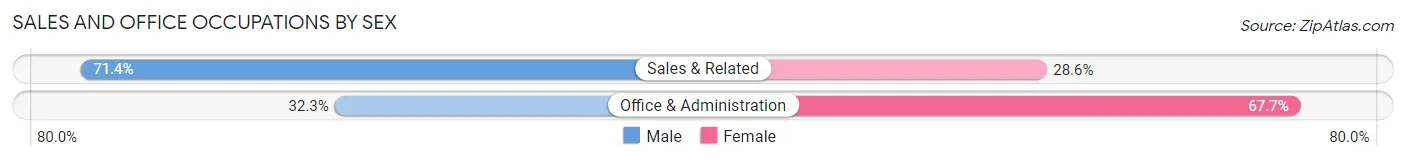
| Occupation | Male | Female |
| Sales & Related | 70 (71.4%) | 28 (28.6%) |
| Office & Administration | 53 (32.3%) | 111 (67.7%) |
| Total (Category) | 123 (46.9%) | 139 (53.0%) |
| Total (Overall) | 451 (34.5%) | 857 (65.5%) |
Natural Resources, Construction and Maintenance Occupations
The most common Natural Resources, Construction and Maintenance occupations in Blue Hills are Construction & Extraction (42 | 3.2%), and Installation, Maintenance & Repair (3 | 0.2%).
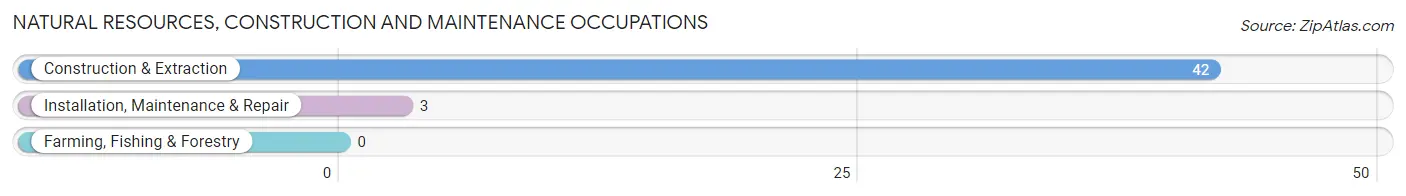
Natural Resources, Construction and Maintenance Occupations by Sex
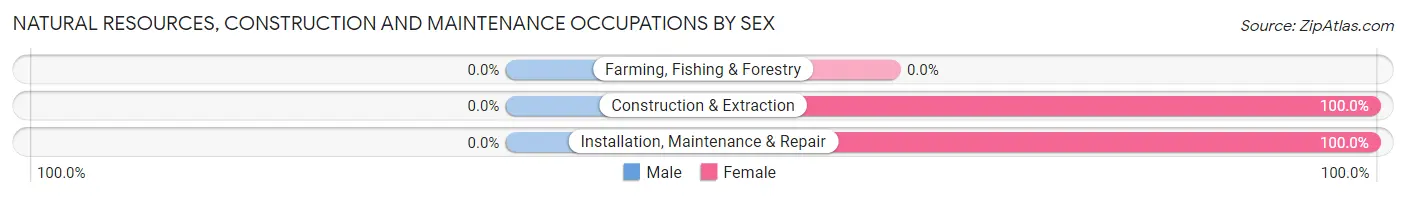
| Occupation | Male | Female |
| Farming, Fishing & Forestry | 0 (0.0%) | 0 (0.0%) |
| Construction & Extraction | 0 (0.0%) | 42 (100.0%) |
| Installation, Maintenance & Repair | 0 (0.0%) | 3 (100.0%) |
| Total (Category) | 0 (0.0%) | 45 (100.0%) |
| Total (Overall) | 451 (34.5%) | 857 (65.5%) |
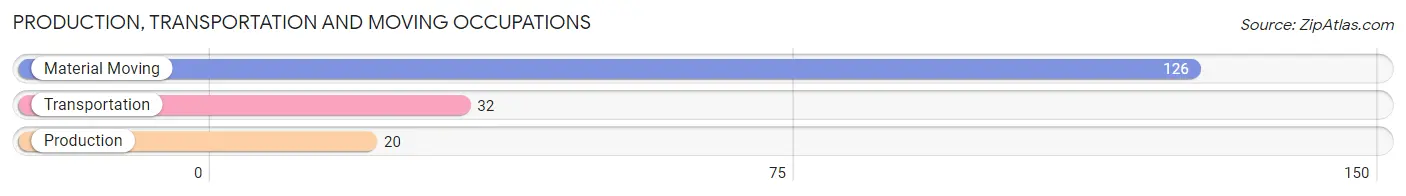
Production, Transportation and Moving Occupations
The most common Production, Transportation and Moving occupations in Blue Hills are Material Moving (126 | 9.6%), Transportation (32 | 2.5%), and Production (20 | 1.5%).
Production, Transportation and Moving Occupations by Sex
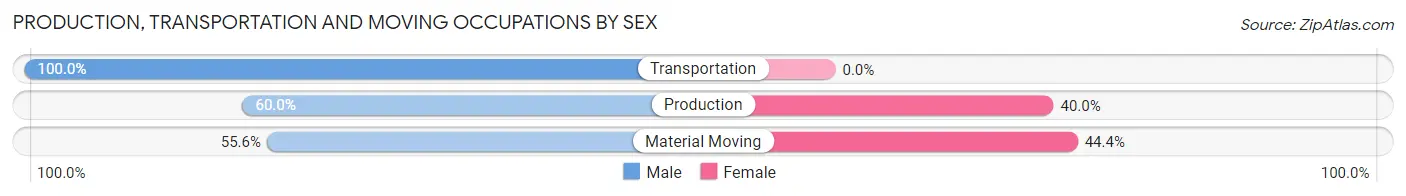
| Occupation | Male | Female |
| Production | 12 (60.0%) | 8 (40.0%) |
| Transportation | 32 (100.0%) | 0 (0.0%) |
| Material Moving | 70 (55.6%) | 56 (44.4%) |
| Total (Category) | 114 (64.0%) | 64 (36.0%) |
| Total (Overall) | 451 (34.5%) | 857 (65.5%) |
Employment Industries by Sex in Blue Hills
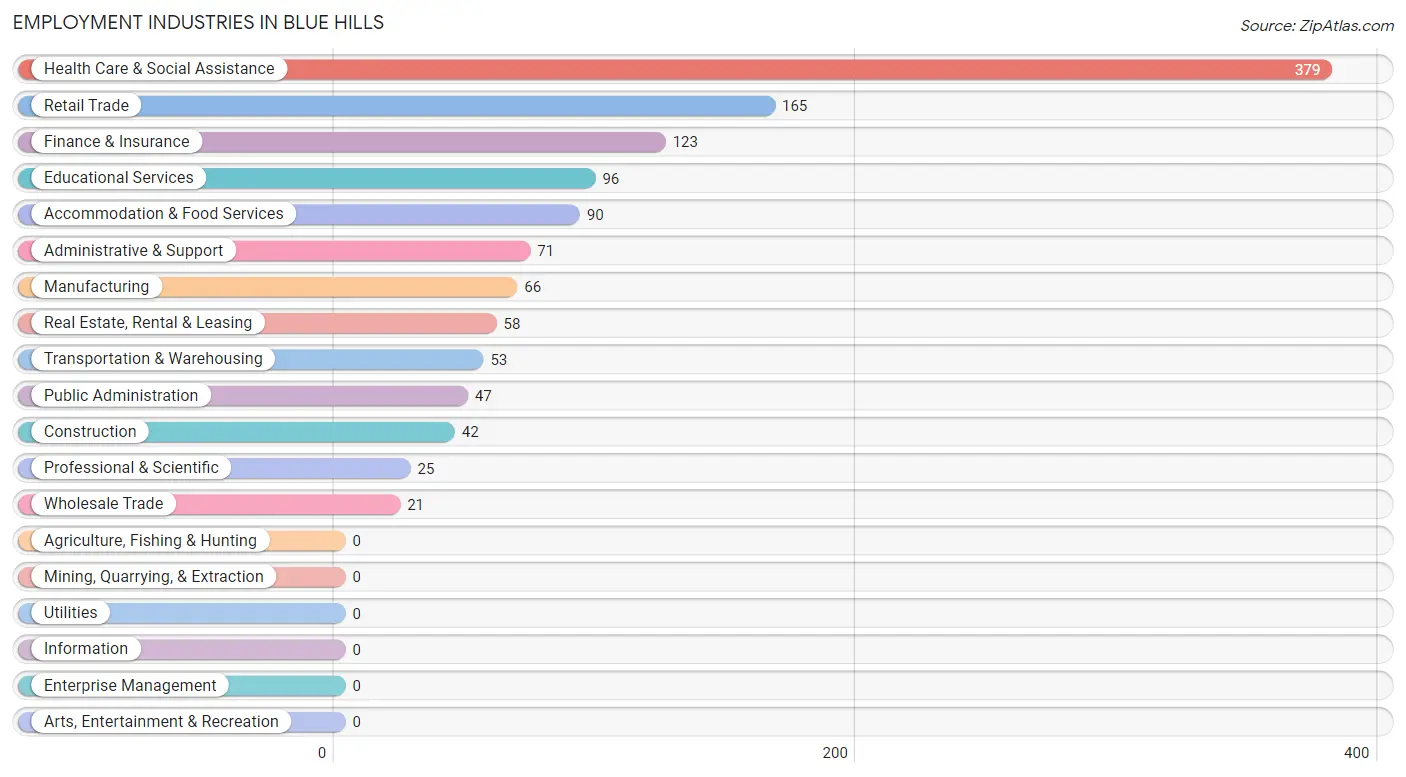
Employment Industries in Blue Hills
The major employment industries in Blue Hills include Health Care & Social Assistance (379 | 29.0%), Retail Trade (165 | 12.6%), Finance & Insurance (123 | 9.4%), Educational Services (96 | 7.3%), and Accommodation & Food Services (90 | 6.9%).
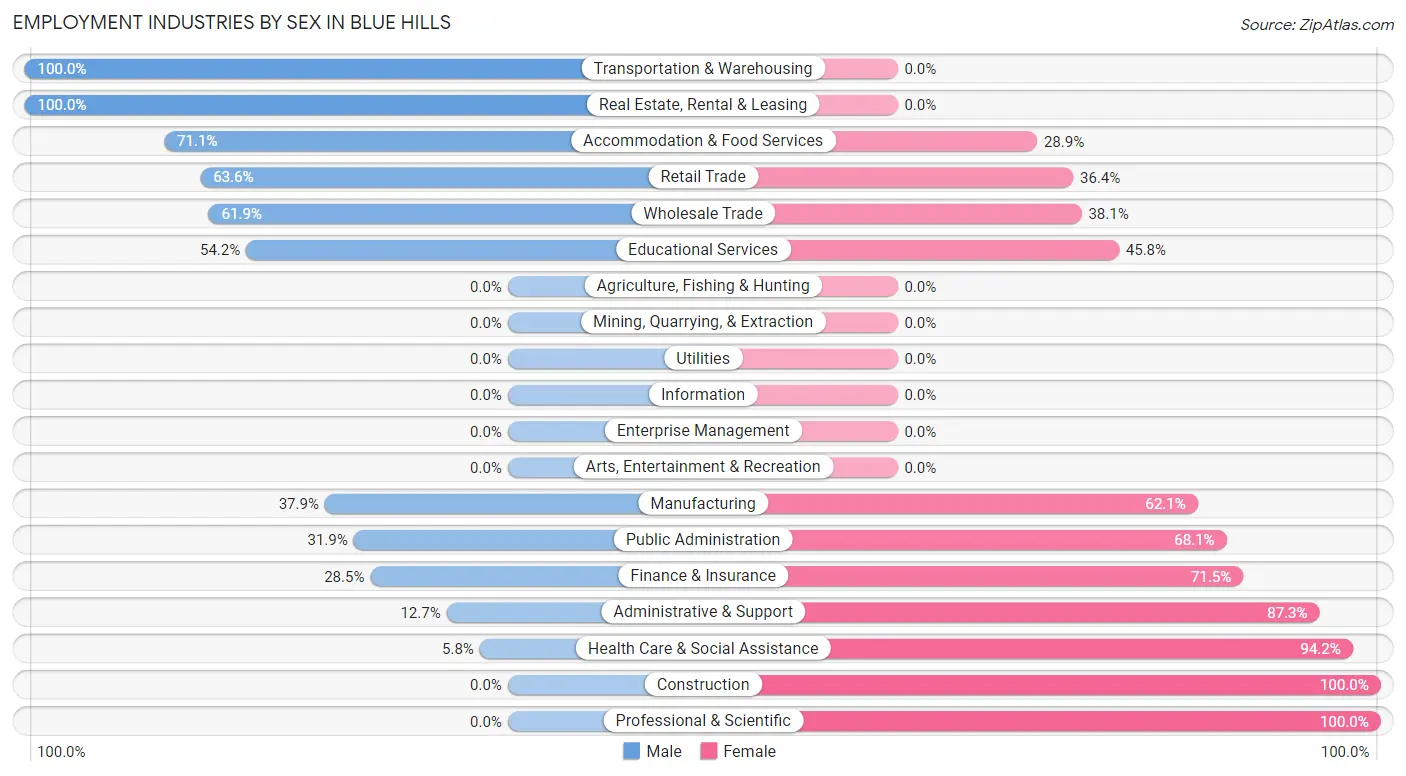
Employment Industries by Sex in Blue Hills
The Blue Hills industries that see more men than women are Transportation & Warehousing (100.0%), Real Estate, Rental & Leasing (100.0%), and Accommodation & Food Services (71.1%), whereas the industries that tend to have a higher number of women are Construction (100.0%), Professional & Scientific (100.0%), and Health Care & Social Assistance (94.2%).
| Industry | Male | Female |
| Agriculture, Fishing & Hunting | 0 (0.0%) | 0 (0.0%) |
| Mining, Quarrying, & Extraction | 0 (0.0%) | 0 (0.0%) |
| Construction | 0 (0.0%) | 42 (100.0%) |
| Manufacturing | 25 (37.9%) | 41 (62.1%) |
| Wholesale Trade | 13 (61.9%) | 8 (38.1%) |
| Retail Trade | 105 (63.6%) | 60 (36.4%) |
| Transportation & Warehousing | 53 (100.0%) | 0 (0.0%) |
| Utilities | 0 (0.0%) | 0 (0.0%) |
| Information | 0 (0.0%) | 0 (0.0%) |
| Finance & Insurance | 35 (28.5%) | 88 (71.5%) |
| Real Estate, Rental & Leasing | 58 (100.0%) | 0 (0.0%) |
| Professional & Scientific | 0 (0.0%) | 25 (100.0%) |
| Enterprise Management | 0 (0.0%) | 0 (0.0%) |
| Administrative & Support | 9 (12.7%) | 62 (87.3%) |
| Educational Services | 52 (54.2%) | 44 (45.8%) |
| Health Care & Social Assistance | 22 (5.8%) | 357 (94.2%) |
| Arts, Entertainment & Recreation | 0 (0.0%) | 0 (0.0%) |
| Accommodation & Food Services | 64 (71.1%) | 26 (28.9%) |
| Public Administration | 15 (31.9%) | 32 (68.1%) |
| Total | 451 (34.5%) | 857 (65.5%) |
Education in Blue Hills
School Enrollment in Blue Hills
The most common levels of schooling among the 447 students in Blue Hills are elementary school (92 | 20.6%), middle school (92 | 20.6%), and college / undergraduate (90 | 20.1%).
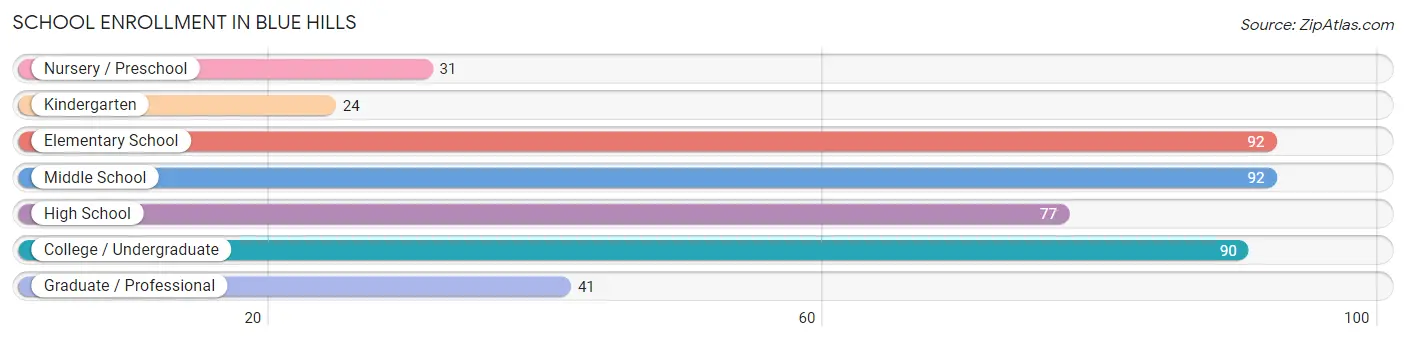
| School Level | # Students | % Students |
| Nursery / Preschool | 31 | 6.9% |
| Kindergarten | 24 | 5.4% |
| Elementary School | 92 | 20.6% |
| Middle School | 92 | 20.6% |
| High School | 77 | 17.2% |
| College / Undergraduate | 90 | 20.1% |
| Graduate / Professional | 41 | 9.2% |
| Total | 447 | 100.0% |
School Enrollment by Age by Funding Source in Blue Hills
Out of a total of 447 students who are enrolled in schools in Blue Hills, 95 (21.3%) attend a private institution, while the remaining 352 (78.7%) are enrolled in public schools. The age group of 25 to 34 year olds has the highest likelihood of being enrolled in private schools, with 56 (78.9% in the age bracket) enrolled. Conversely, the age group of 5 to 9 year old has the lowest likelihood of being enrolled in a private school, with 129 (100.0% in the age bracket) attending a public institution.
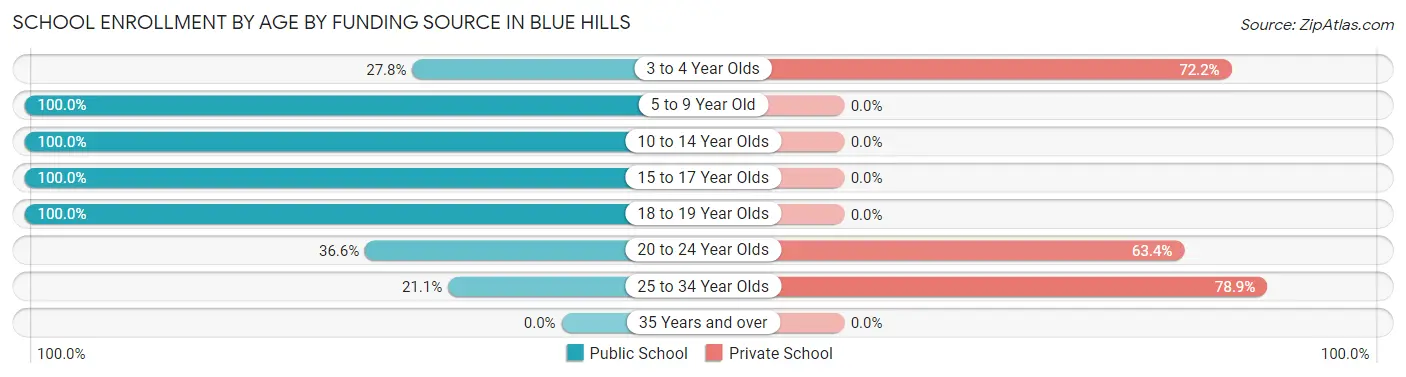
| Age Bracket | Public School | Private School |
| 3 to 4 Year Olds | 5 (27.8%) | 13 (72.2%) |
| 5 to 9 Year Old | 129 (100.0%) | 0 (0.0%) |
| 10 to 14 Year Olds | 105 (100.0%) | 0 (0.0%) |
| 15 to 17 Year Olds | 48 (100.0%) | 0 (0.0%) |
| 18 to 19 Year Olds | 35 (100.0%) | 0 (0.0%) |
| 20 to 24 Year Olds | 15 (36.6%) | 26 (63.4%) |
| 25 to 34 Year Olds | 15 (21.1%) | 56 (78.9%) |
| 35 Years and over | 0 (0.0%) | 0 (0.0%) |
| Total | 352 (78.7%) | 95 (21.3%) |
Educational Attainment by Field of Study in Blue Hills
Business (70 | 28.3%), science & technology (54 | 21.9%), arts & humanities (44 | 17.8%), psychology (32 | 13.0%), and social sciences (27 | 10.9%) are the most common fields of study among 247 individuals in Blue Hills who have obtained a bachelor's degree or higher.
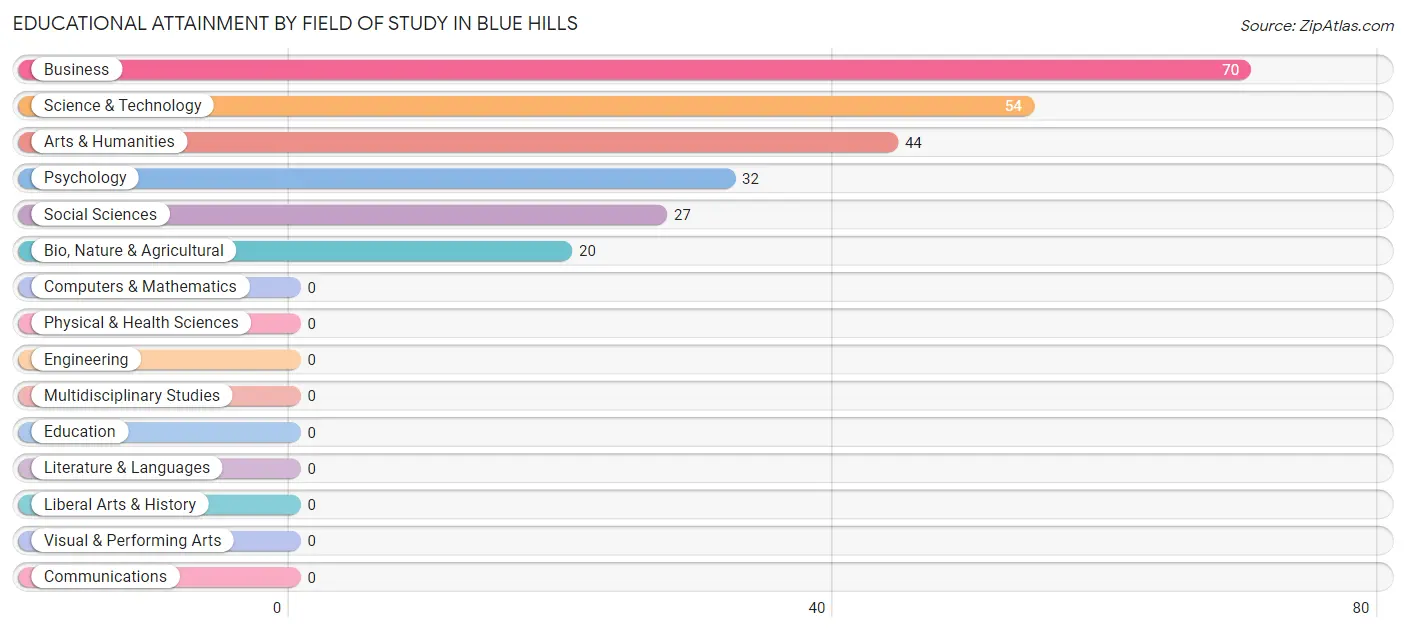
| Field of Study | # Graduates | % Graduates |
| Computers & Mathematics | 0 | 0.0% |
| Bio, Nature & Agricultural | 20 | 8.1% |
| Physical & Health Sciences | 0 | 0.0% |
| Psychology | 32 | 13.0% |
| Social Sciences | 27 | 10.9% |
| Engineering | 0 | 0.0% |
| Multidisciplinary Studies | 0 | 0.0% |
| Science & Technology | 54 | 21.9% |
| Business | 70 | 28.3% |
| Education | 0 | 0.0% |
| Literature & Languages | 0 | 0.0% |
| Liberal Arts & History | 0 | 0.0% |
| Visual & Performing Arts | 0 | 0.0% |
| Communications | 0 | 0.0% |
| Arts & Humanities | 44 | 17.8% |
| Total | 247 | 100.0% |
Transportation & Commute in Blue Hills
Vehicle Availability by Sex in Blue Hills
The most prevalent vehicle ownership categories in Blue Hills are males with 2 vehicles (232, accounting for 51.4%) and females with 2 vehicles (414, making up 28.5%).
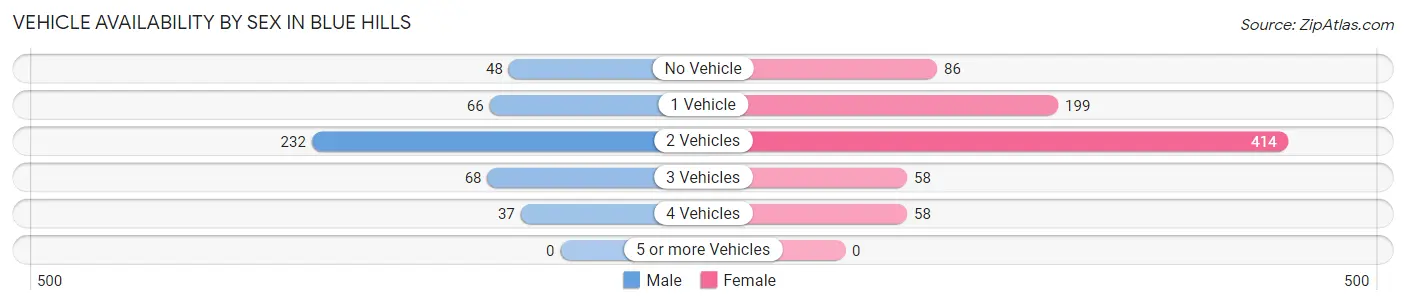
| Vehicles Available | Male | Female |
| No Vehicle | 48 (10.6%) | 86 (10.5%) |
| 1 Vehicle | 66 (14.6%) | 199 (24.4%) |
| 2 Vehicles | 232 (51.4%) | 414 (50.8%) |
| 3 Vehicles | 68 (15.1%) | 58 (7.1%) |
| 4 Vehicles | 37 (8.2%) | 58 (7.1%) |
| 5 or more Vehicles | 0 (0.0%) | 0 (0.0%) |
| Total | 451 (100.0%) | 815 (100.0%) |
Commute Time in Blue Hills
The most frequently occuring commute durations in Blue Hills are 20 to 24 minutes (265 commuters, 21.8%), 15 to 19 minutes (254 commuters, 20.9%), and 10 to 14 minutes (181 commuters, 14.9%).
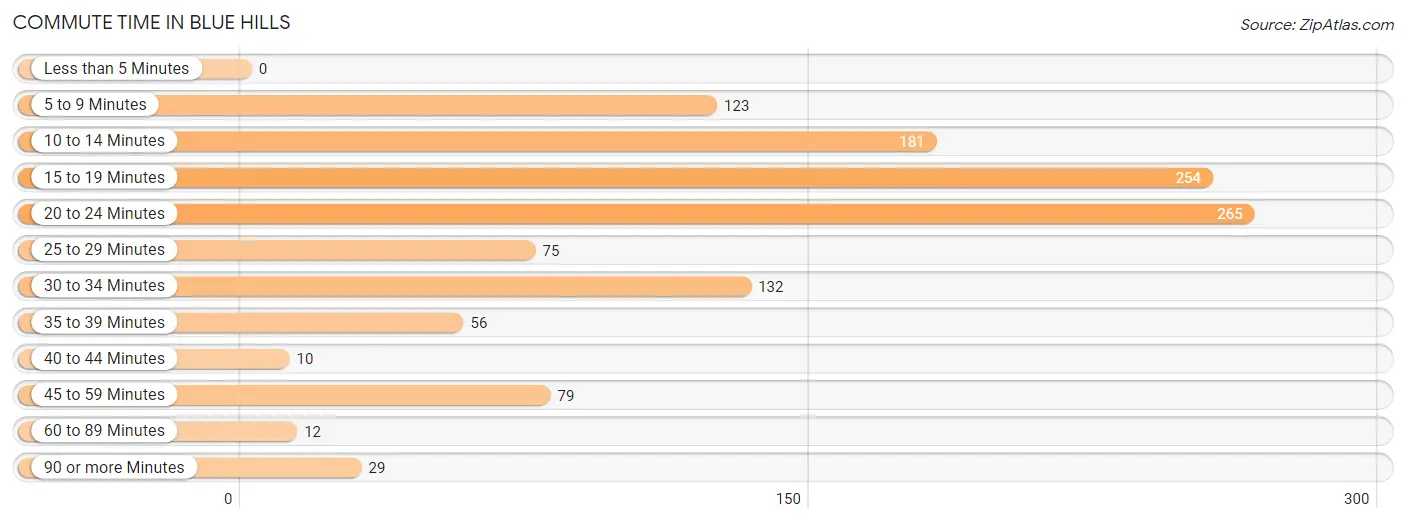
| Commute Time | # Commuters | % Commuters |
| Less than 5 Minutes | 0 | 0.0% |
| 5 to 9 Minutes | 123 | 10.1% |
| 10 to 14 Minutes | 181 | 14.9% |
| 15 to 19 Minutes | 254 | 20.9% |
| 20 to 24 Minutes | 265 | 21.8% |
| 25 to 29 Minutes | 75 | 6.2% |
| 30 to 34 Minutes | 132 | 10.9% |
| 35 to 39 Minutes | 56 | 4.6% |
| 40 to 44 Minutes | 10 | 0.8% |
| 45 to 59 Minutes | 79 | 6.5% |
| 60 to 89 Minutes | 12 | 1.0% |
| 90 or more Minutes | 29 | 2.4% |
Commute Time by Sex in Blue Hills
The most common commute times in Blue Hills are 10 to 14 minutes (153 commuters, 34.8%) for males and 20 to 24 minutes (244 commuters, 31.4%) for females.
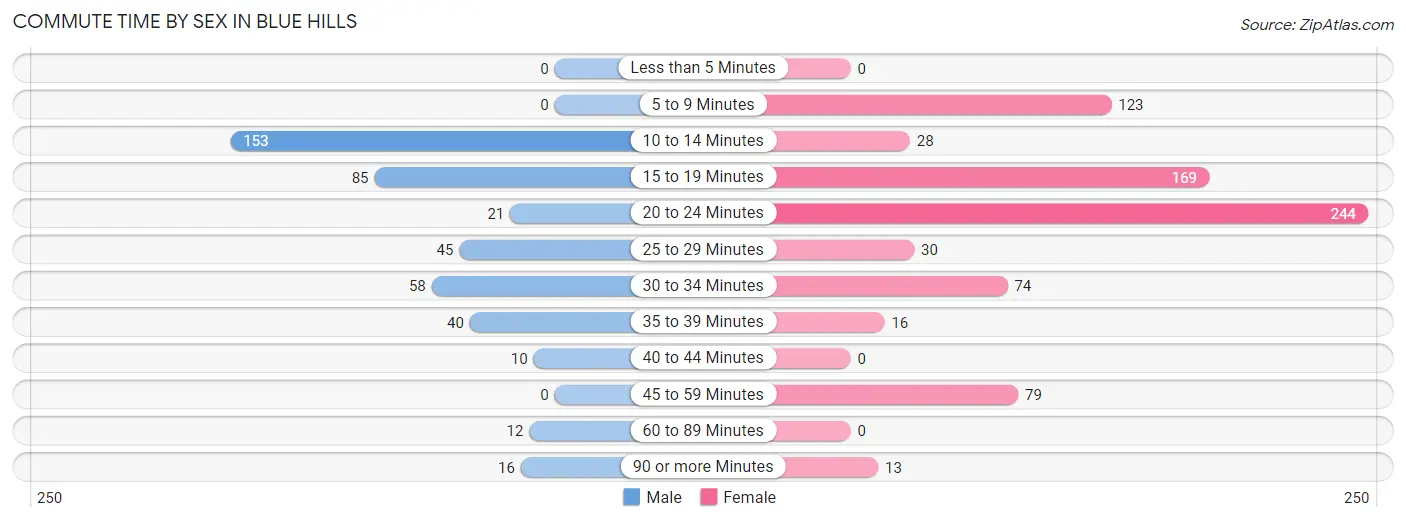
| Commute Time | Male | Female |
| Less than 5 Minutes | 0 (0.0%) | 0 (0.0%) |
| 5 to 9 Minutes | 0 (0.0%) | 123 (15.9%) |
| 10 to 14 Minutes | 153 (34.8%) | 28 (3.6%) |
| 15 to 19 Minutes | 85 (19.3%) | 169 (21.8%) |
| 20 to 24 Minutes | 21 (4.8%) | 244 (31.4%) |
| 25 to 29 Minutes | 45 (10.2%) | 30 (3.9%) |
| 30 to 34 Minutes | 58 (13.2%) | 74 (9.5%) |
| 35 to 39 Minutes | 40 (9.1%) | 16 (2.1%) |
| 40 to 44 Minutes | 10 (2.3%) | 0 (0.0%) |
| 45 to 59 Minutes | 0 (0.0%) | 79 (10.2%) |
| 60 to 89 Minutes | 12 (2.7%) | 0 (0.0%) |
| 90 or more Minutes | 16 (3.6%) | 13 (1.7%) |
Time of Departure to Work by Sex in Blue Hills
The most frequent times of departure to work in Blue Hills are 6:00 AM to 6:29 AM (113, 25.7%) for males and 8:30 AM to 8:59 AM (145, 18.7%) for females.
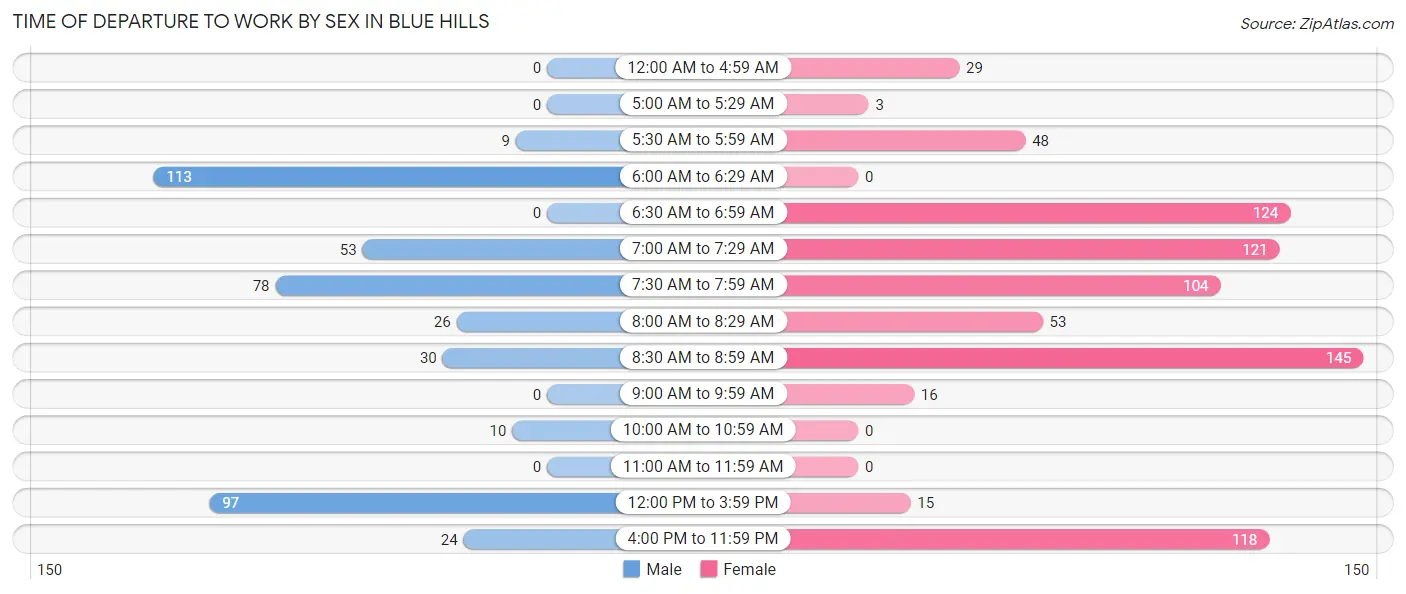
| Time of Departure | Male | Female |
| 12:00 AM to 4:59 AM | 0 (0.0%) | 29 (3.7%) |
| 5:00 AM to 5:29 AM | 0 (0.0%) | 3 (0.4%) |
| 5:30 AM to 5:59 AM | 9 (2.1%) | 48 (6.2%) |
| 6:00 AM to 6:29 AM | 113 (25.7%) | 0 (0.0%) |
| 6:30 AM to 6:59 AM | 0 (0.0%) | 124 (16.0%) |
| 7:00 AM to 7:29 AM | 53 (12.0%) | 121 (15.6%) |
| 7:30 AM to 7:59 AM | 78 (17.7%) | 104 (13.4%) |
| 8:00 AM to 8:29 AM | 26 (5.9%) | 53 (6.8%) |
| 8:30 AM to 8:59 AM | 30 (6.8%) | 145 (18.7%) |
| 9:00 AM to 9:59 AM | 0 (0.0%) | 16 (2.1%) |
| 10:00 AM to 10:59 AM | 10 (2.3%) | 0 (0.0%) |
| 11:00 AM to 11:59 AM | 0 (0.0%) | 0 (0.0%) |
| 12:00 PM to 3:59 PM | 97 (22.1%) | 15 (1.9%) |
| 4:00 PM to 11:59 PM | 24 (5.4%) | 118 (15.2%) |
| Total | 440 (100.0%) | 776 (100.0%) |
Housing Occupancy in Blue Hills
Occupancy by Ownership in Blue Hills
Of the total 939 dwellings in Blue Hills, owner-occupied units account for 596 (63.5%), while renter-occupied units make up 343 (36.5%).
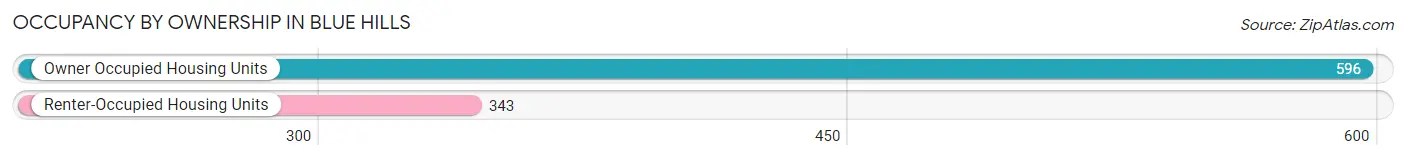
| Occupancy | # Housing Units | % Housing Units |
| Owner Occupied Housing Units | 596 | 63.5% |
| Renter-Occupied Housing Units | 343 | 36.5% |
| Total Occupied Housing Units | 939 | 100.0% |
Occupancy by Household Size in Blue Hills
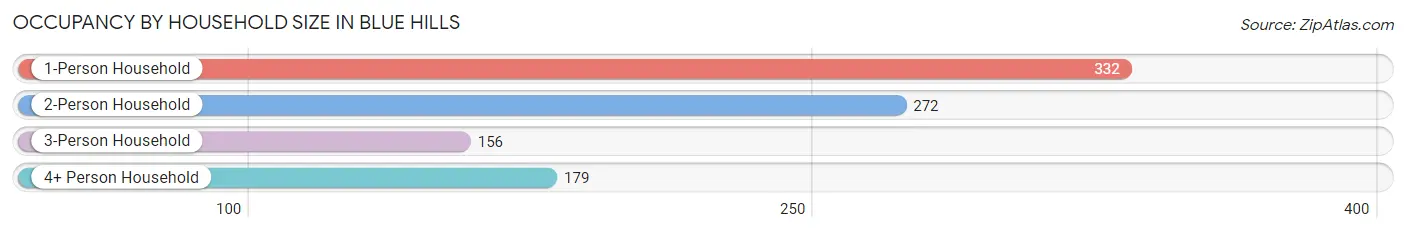
| Household Size | # Housing Units | % Housing Units |
| 1-Person Household | 332 | 35.4% |
| 2-Person Household | 272 | 29.0% |
| 3-Person Household | 156 | 16.6% |
| 4+ Person Household | 179 | 19.1% |
| Total Housing Units | 939 | 100.0% |
Occupancy by Ownership by Household Size in Blue Hills
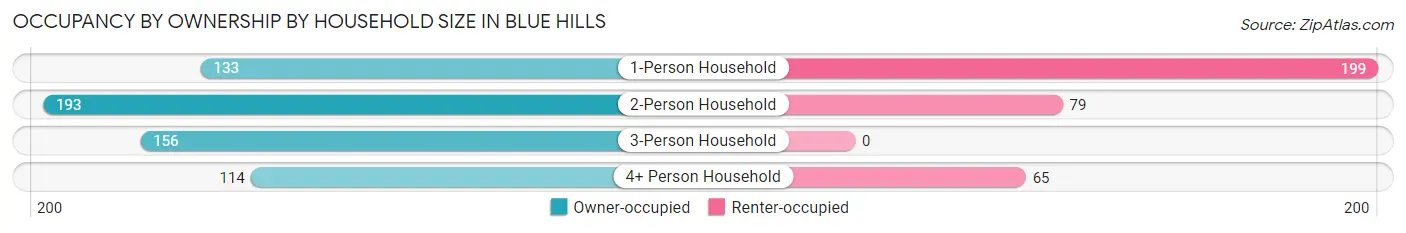
| Household Size | Owner-occupied | Renter-occupied |
| 1-Person Household | 133 (40.1%) | 199 (59.9%) |
| 2-Person Household | 193 (71.0%) | 79 (29.0%) |
| 3-Person Household | 156 (100.0%) | 0 (0.0%) |
| 4+ Person Household | 114 (63.7%) | 65 (36.3%) |
| Total Housing Units | 596 (63.5%) | 343 (36.5%) |
Occupancy by Educational Attainment in Blue Hills
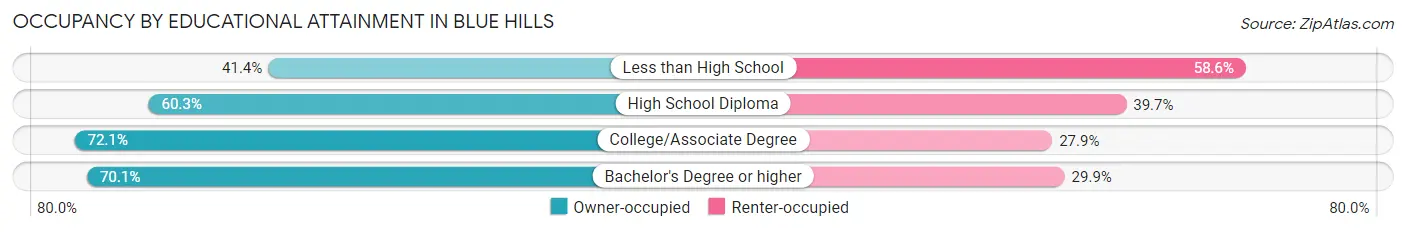
| Household Size | Owner-occupied | Renter-occupied |
| Less than High School | 48 (41.4%) | 68 (58.6%) |
| High School Diploma | 222 (60.3%) | 146 (39.7%) |
| College/Associate Degree | 258 (72.1%) | 100 (27.9%) |
| Bachelor's Degree or higher | 68 (70.1%) | 29 (29.9%) |
Occupancy by Age of Householder in Blue Hills
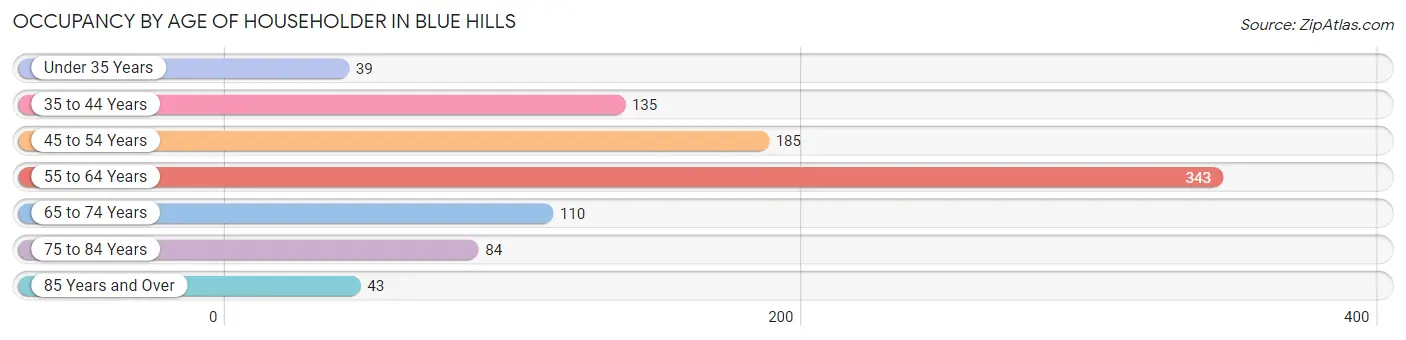
| Age Bracket | # Households | % Households |
| Under 35 Years | 39 | 4.2% |
| 35 to 44 Years | 135 | 14.4% |
| 45 to 54 Years | 185 | 19.7% |
| 55 to 64 Years | 343 | 36.5% |
| 65 to 74 Years | 110 | 11.7% |
| 75 to 84 Years | 84 | 8.9% |
| 85 Years and Over | 43 | 4.6% |
| Total | 939 | 100.0% |
Housing Finances in Blue Hills
Median Income by Occupancy in Blue Hills
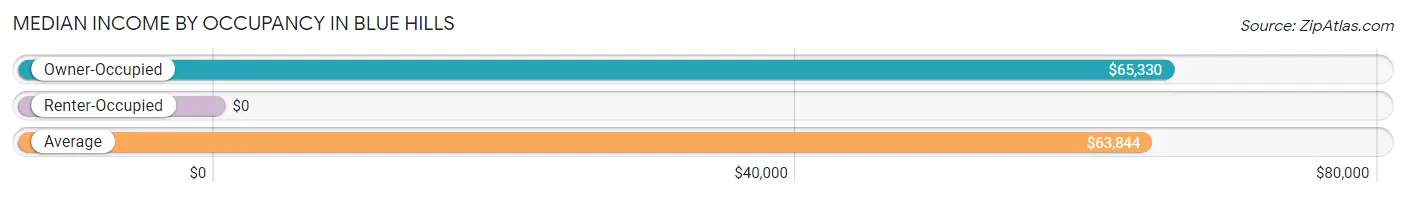
| Occupancy Type | # Households | Median Income |
| Owner-Occupied | 596 (63.5%) | $65,330 |
| Renter-Occupied | 343 (36.5%) | $0 |
| Average | 939 (100.0%) | $63,844 |
Occupancy by Householder Income Bracket in Blue Hills
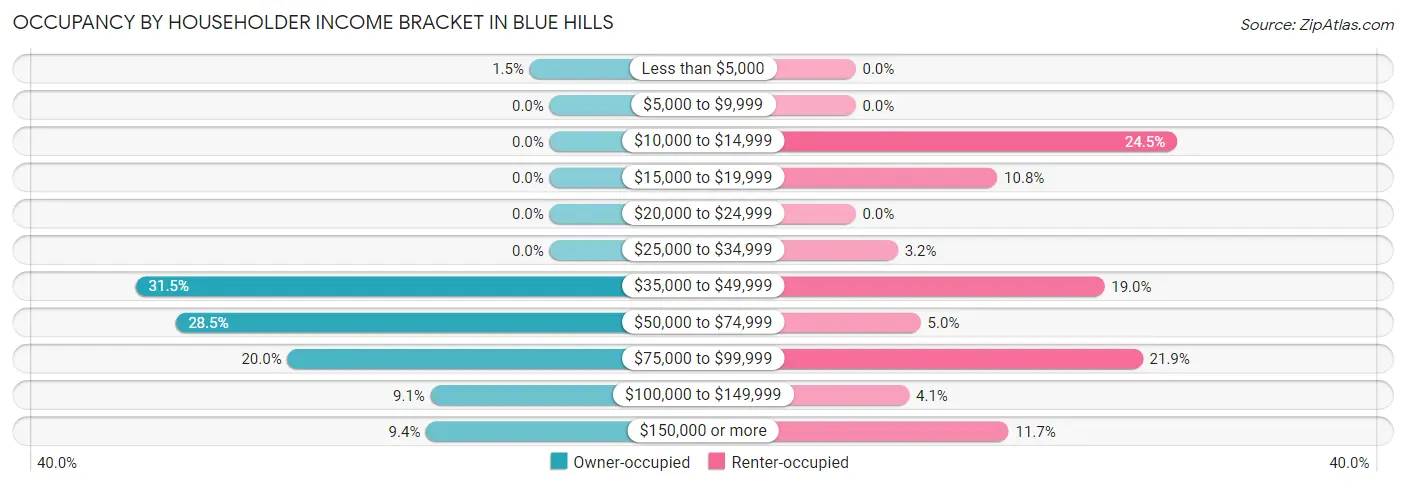
| Income Bracket | Owner-occupied | Renter-occupied |
| Less than $5,000 | 9 (1.5%) | 0 (0.0%) |
| $5,000 to $9,999 | 0 (0.0%) | 0 (0.0%) |
| $10,000 to $14,999 | 0 (0.0%) | 84 (24.5%) |
| $15,000 to $19,999 | 0 (0.0%) | 37 (10.8%) |
| $20,000 to $24,999 | 0 (0.0%) | 0 (0.0%) |
| $25,000 to $34,999 | 0 (0.0%) | 11 (3.2%) |
| $35,000 to $49,999 | 188 (31.5%) | 65 (19.0%) |
| $50,000 to $74,999 | 170 (28.5%) | 17 (5.0%) |
| $75,000 to $99,999 | 119 (20.0%) | 75 (21.9%) |
| $100,000 to $149,999 | 54 (9.1%) | 14 (4.1%) |
| $150,000 or more | 56 (9.4%) | 40 (11.7%) |
| Total | 596 (100.0%) | 343 (100.0%) |
Monthly Housing Cost Tiers in Blue Hills
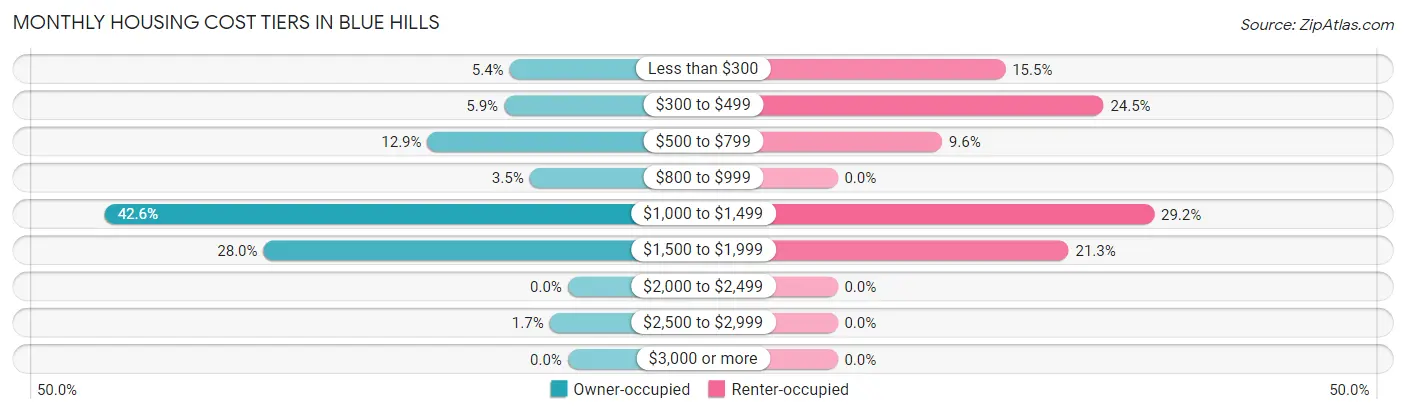
| Monthly Cost | Owner-occupied | Renter-occupied |
| Less than $300 | 32 (5.4%) | 53 (15.4%) |
| $300 to $499 | 35 (5.9%) | 84 (24.5%) |
| $500 to $799 | 77 (12.9%) | 33 (9.6%) |
| $800 to $999 | 21 (3.5%) | 0 (0.0%) |
| $1,000 to $1,499 | 254 (42.6%) | 100 (29.1%) |
| $1,500 to $1,999 | 167 (28.0%) | 73 (21.3%) |
| $2,000 to $2,499 | 0 (0.0%) | 0 (0.0%) |
| $2,500 to $2,999 | 10 (1.7%) | 0 (0.0%) |
| $3,000 or more | 0 (0.0%) | 0 (0.0%) |
| Total | 596 (100.0%) | 343 (100.0%) |
Physical Housing Characteristics in Blue Hills
Housing Structures in Blue Hills
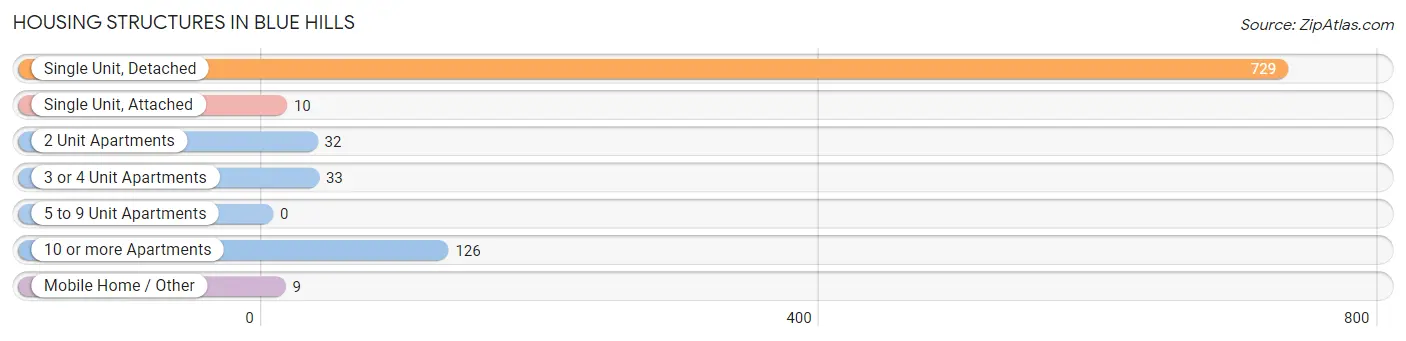
| Structure Type | # Housing Units | % Housing Units |
| Single Unit, Detached | 729 | 77.6% |
| Single Unit, Attached | 10 | 1.1% |
| 2 Unit Apartments | 32 | 3.4% |
| 3 or 4 Unit Apartments | 33 | 3.5% |
| 5 to 9 Unit Apartments | 0 | 0.0% |
| 10 or more Apartments | 126 | 13.4% |
| Mobile Home / Other | 9 | 1.0% |
| Total | 939 | 100.0% |
Housing Structures by Occupancy in Blue Hills
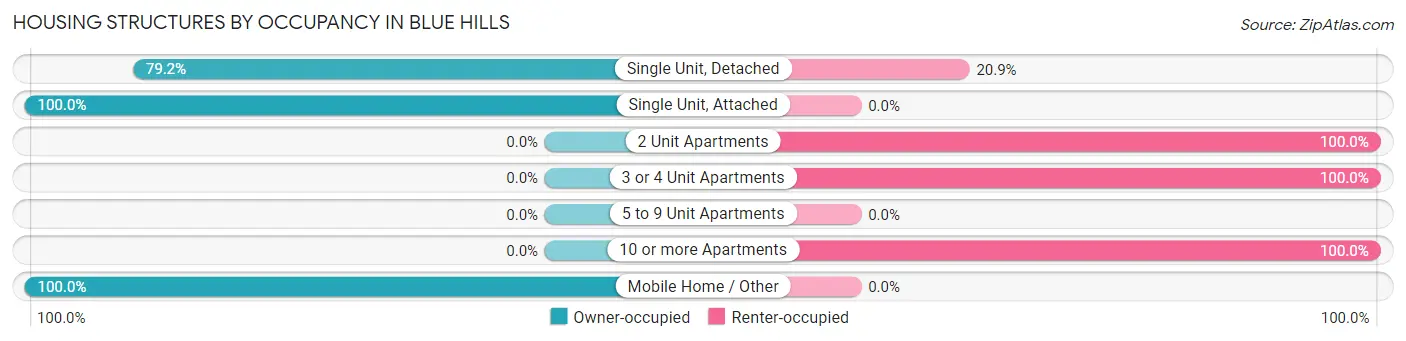
| Structure Type | Owner-occupied | Renter-occupied |
| Single Unit, Detached | 577 (79.1%) | 152 (20.8%) |
| Single Unit, Attached | 10 (100.0%) | 0 (0.0%) |
| 2 Unit Apartments | 0 (0.0%) | 32 (100.0%) |
| 3 or 4 Unit Apartments | 0 (0.0%) | 33 (100.0%) |
| 5 to 9 Unit Apartments | 0 (0.0%) | 0 (0.0%) |
| 10 or more Apartments | 0 (0.0%) | 126 (100.0%) |
| Mobile Home / Other | 9 (100.0%) | 0 (0.0%) |
| Total | 596 (63.5%) | 343 (36.5%) |
Housing Structures by Number of Rooms in Blue Hills
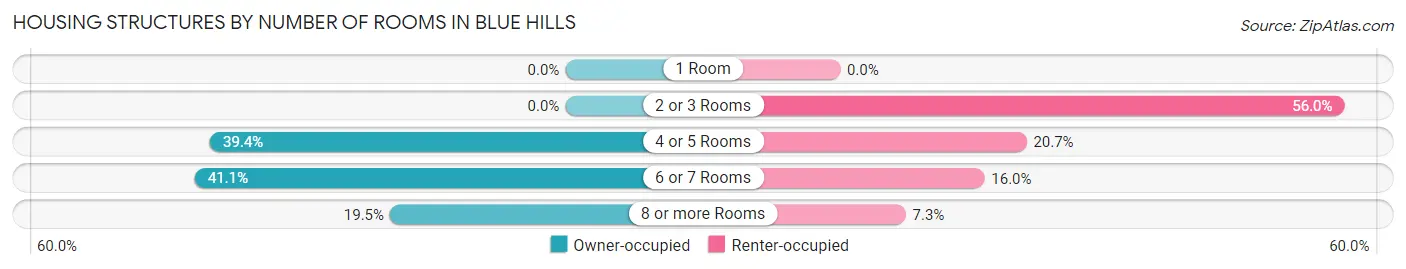
| Number of Rooms | Owner-occupied | Renter-occupied |
| 1 Room | 0 (0.0%) | 0 (0.0%) |
| 2 or 3 Rooms | 0 (0.0%) | 192 (56.0%) |
| 4 or 5 Rooms | 235 (39.4%) | 71 (20.7%) |
| 6 or 7 Rooms | 245 (41.1%) | 55 (16.0%) |
| 8 or more Rooms | 116 (19.5%) | 25 (7.3%) |
| Total | 596 (100.0%) | 343 (100.0%) |
Housing Structure by Heating Type in Blue Hills
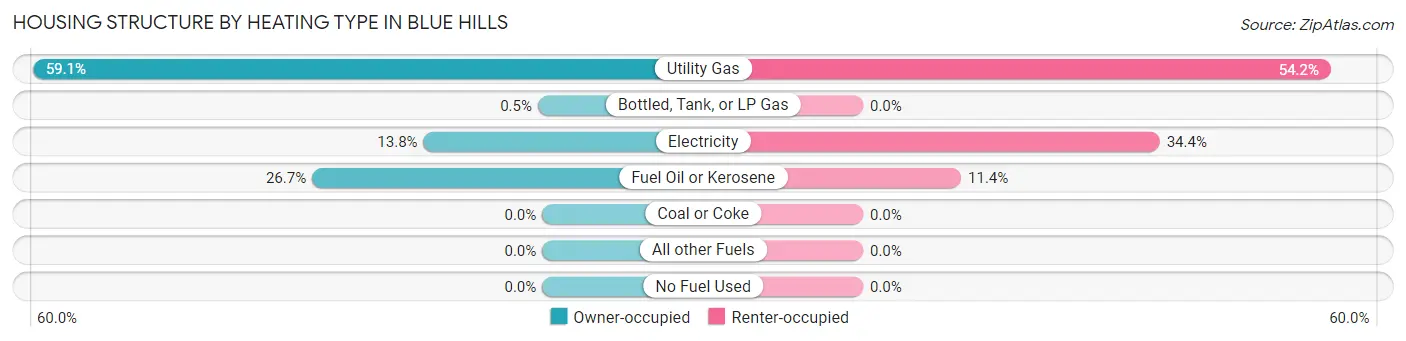
| Heating Type | Owner-occupied | Renter-occupied |
| Utility Gas | 352 (59.1%) | 186 (54.2%) |
| Bottled, Tank, or LP Gas | 3 (0.5%) | 0 (0.0%) |
| Electricity | 82 (13.8%) | 118 (34.4%) |
| Fuel Oil or Kerosene | 159 (26.7%) | 39 (11.4%) |
| Coal or Coke | 0 (0.0%) | 0 (0.0%) |
| All other Fuels | 0 (0.0%) | 0 (0.0%) |
| No Fuel Used | 0 (0.0%) | 0 (0.0%) |
| Total | 596 (100.0%) | 343 (100.0%) |
Household Vehicle Usage in Blue Hills
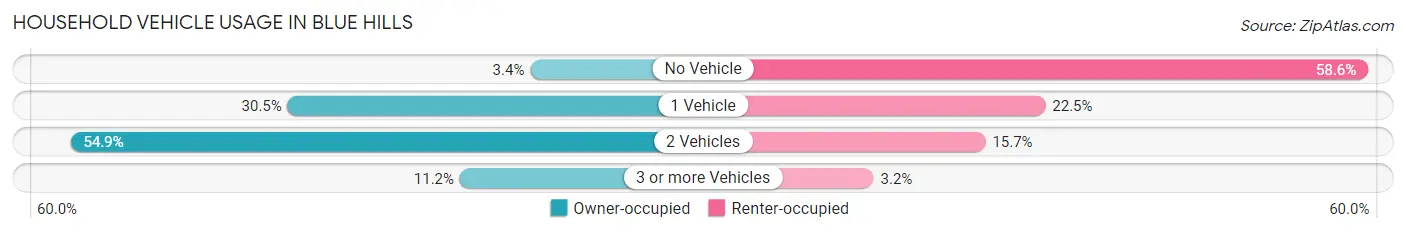
| Vehicles per Household | Owner-occupied | Renter-occupied |
| No Vehicle | 20 (3.4%) | 201 (58.6%) |
| 1 Vehicle | 182 (30.5%) | 77 (22.5%) |
| 2 Vehicles | 327 (54.9%) | 54 (15.7%) |
| 3 or more Vehicles | 67 (11.2%) | 11 (3.2%) |
| Total | 596 (100.0%) | 343 (100.0%) |
Real Estate & Mortgages in Blue Hills
Real Estate and Mortgage Overview in Blue Hills
| Characteristic | Without Mortgage | With Mortgage |
| Housing Units | 167 | 429 |
| Median Property Value | $163,500 | $188,200 |
| Median Household Income | $63,859 | $56 |
| Monthly Housing Costs | $662 | $0 |
| Real Estate Taxes | $3,337 | $0 |
Property Value by Mortgage Status in Blue Hills
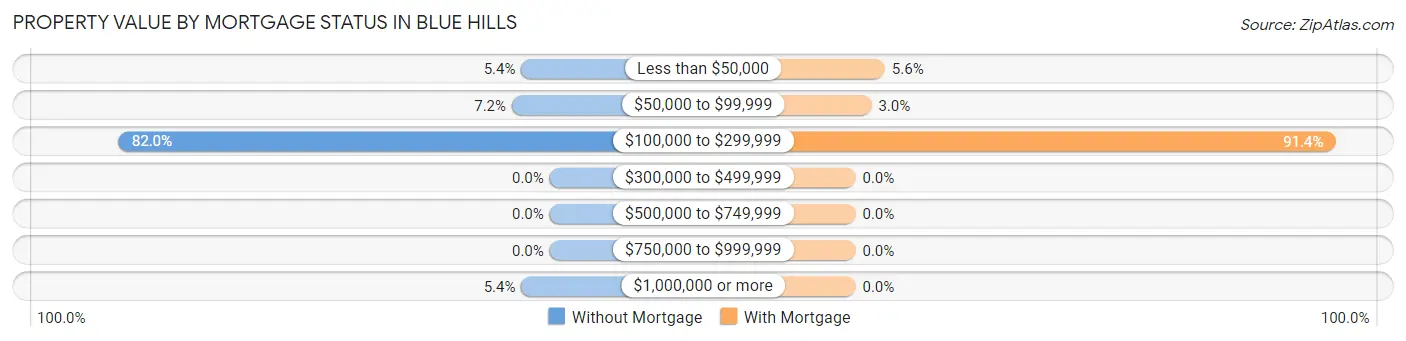
| Property Value | Without Mortgage | With Mortgage |
| Less than $50,000 | 9 (5.4%) | 24 (5.6%) |
| $50,000 to $99,999 | 12 (7.2%) | 13 (3.0%) |
| $100,000 to $299,999 | 137 (82.0%) | 392 (91.4%) |
| $300,000 to $499,999 | 0 (0.0%) | 0 (0.0%) |
| $500,000 to $749,999 | 0 (0.0%) | 0 (0.0%) |
| $750,000 to $999,999 | 0 (0.0%) | 0 (0.0%) |
| $1,000,000 or more | 9 (5.4%) | 0 (0.0%) |
| Total | 167 (100.0%) | 429 (100.0%) |
Household Income by Mortgage Status in Blue Hills
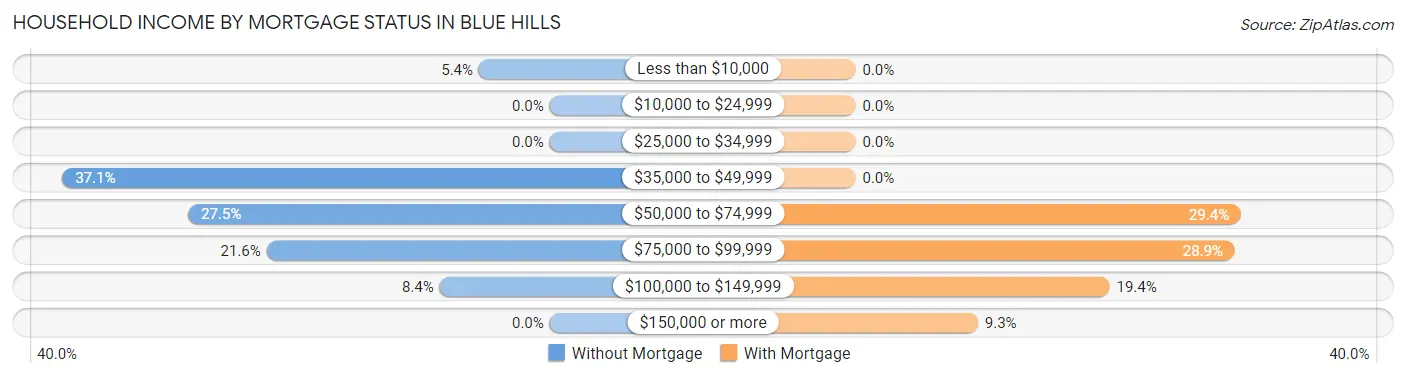
| Household Income | Without Mortgage | With Mortgage |
| Less than $10,000 | 9 (5.4%) | 0 (0.0%) |
| $10,000 to $24,999 | 0 (0.0%) | 0 (0.0%) |
| $25,000 to $34,999 | 0 (0.0%) | 0 (0.0%) |
| $35,000 to $49,999 | 62 (37.1%) | 0 (0.0%) |
| $50,000 to $74,999 | 46 (27.5%) | 126 (29.4%) |
| $75,000 to $99,999 | 36 (21.6%) | 124 (28.9%) |
| $100,000 to $149,999 | 14 (8.4%) | 83 (19.4%) |
| $150,000 or more | 0 (0.0%) | 40 (9.3%) |
| Total | 167 (100.0%) | 429 (100.0%) |
Property Value to Household Income Ratio in Blue Hills
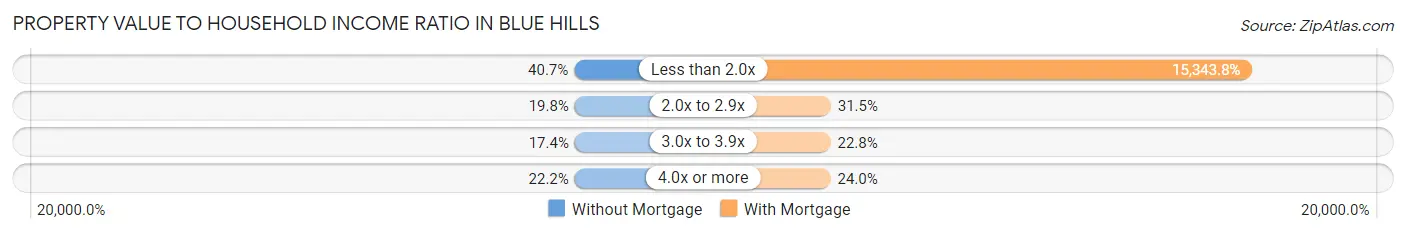
| Value-to-Income Ratio | Without Mortgage | With Mortgage |
| Less than 2.0x | 68 (40.7%) | 65,825 (15,343.8%) |
| 2.0x to 2.9x | 33 (19.8%) | 135 (31.5%) |
| 3.0x to 3.9x | 29 (17.4%) | 98 (22.8%) |
| 4.0x or more | 37 (22.2%) | 103 (24.0%) |
| Total | 167 (100.0%) | 429 (100.0%) |
Real Estate Taxes by Mortgage Status in Blue Hills
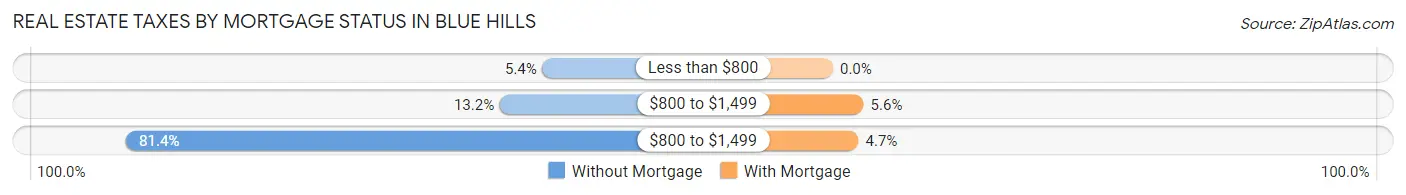
| Property Taxes | Without Mortgage | With Mortgage |
| Less than $800 | 9 (5.4%) | 0 (0.0%) |
| $800 to $1,499 | 22 (13.2%) | 24 (5.6%) |
| $800 to $1,499 | 136 (81.4%) | 20 (4.7%) |
| Total | 167 (100.0%) | 429 (100.0%) |
Health & Disability in Blue Hills
Health Insurance Coverage by Age in Blue Hills
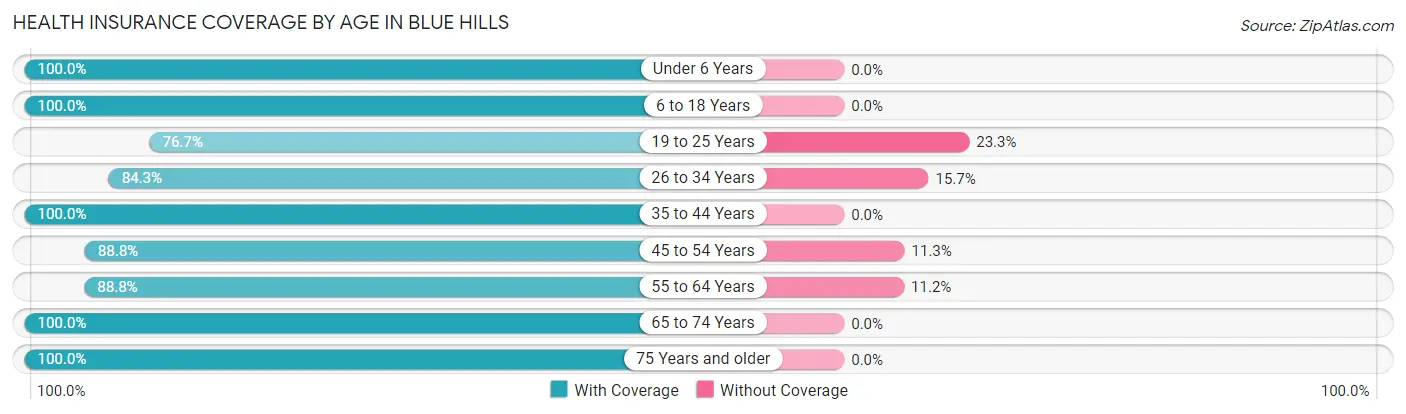
| Age Bracket | With Coverage | Without Coverage |
| Under 6 Years | 114 (100.0%) | 0 (0.0%) |
| 6 to 18 Years | 276 (100.0%) | 0 (0.0%) |
| 19 to 25 Years | 102 (76.7%) | 31 (23.3%) |
| 26 to 34 Years | 161 (84.3%) | 30 (15.7%) |
| 35 to 44 Years | 264 (100.0%) | 0 (0.0%) |
| 45 to 54 Years | 347 (88.7%) | 44 (11.3%) |
| 55 to 64 Years | 438 (88.8%) | 55 (11.2%) |
| 65 to 74 Years | 179 (100.0%) | 0 (0.0%) |
| 75 Years and older | 183 (100.0%) | 0 (0.0%) |
| Total | 2,064 (92.8%) | 160 (7.2%) |
Health Insurance Coverage by Citizenship Status in Blue Hills
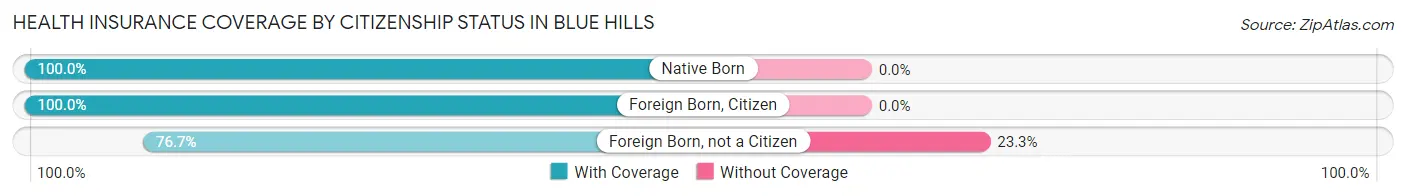
| Citizenship Status | With Coverage | Without Coverage |
| Native Born | 114 (100.0%) | 0 (0.0%) |
| Foreign Born, Citizen | 276 (100.0%) | 0 (0.0%) |
| Foreign Born, not a Citizen | 102 (76.7%) | 31 (23.3%) |
Health Insurance Coverage by Household Income in Blue Hills
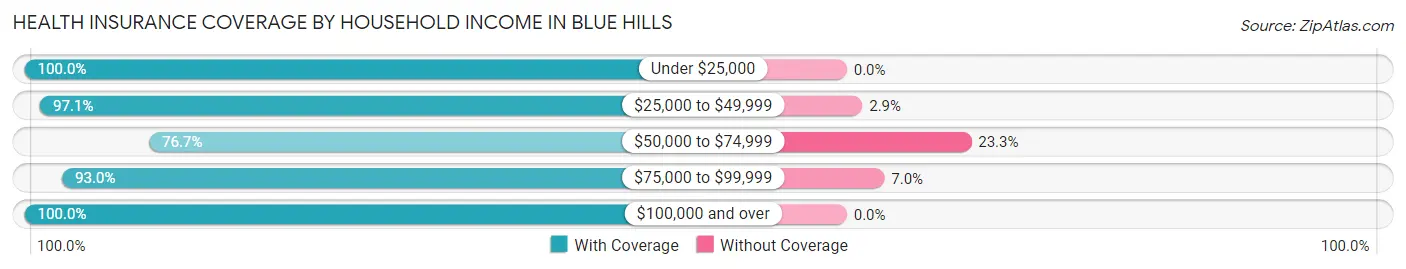
| Household Income | With Coverage | Without Coverage |
| Under $25,000 | 130 (100.0%) | 0 (0.0%) |
| $25,000 to $49,999 | 536 (97.1%) | 16 (2.9%) |
| $50,000 to $74,999 | 378 (76.7%) | 115 (23.3%) |
| $75,000 to $99,999 | 383 (93.0%) | 29 (7.0%) |
| $100,000 and over | 637 (100.0%) | 0 (0.0%) |
Public vs Private Health Insurance Coverage by Age in Blue Hills
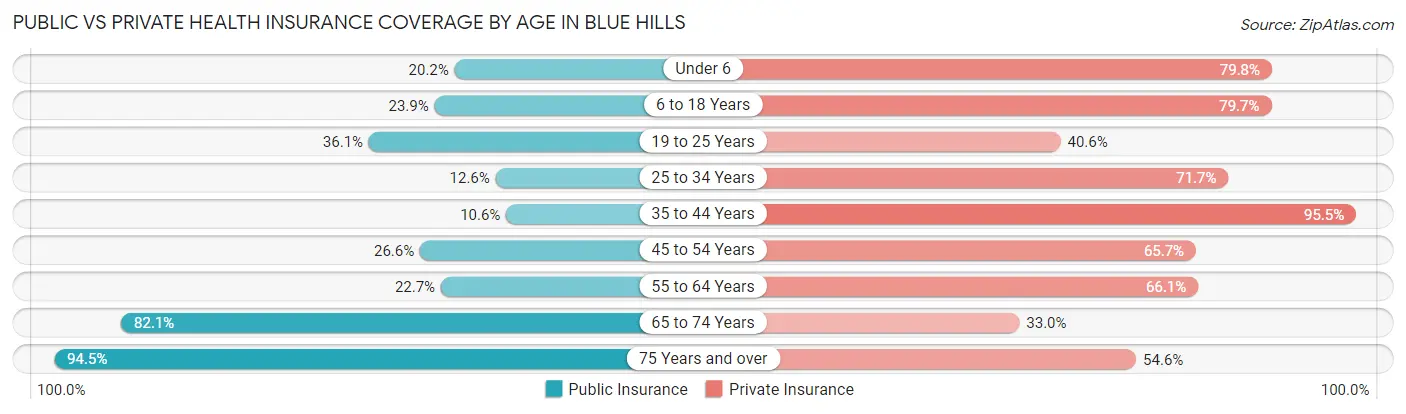
| Age Bracket | Public Insurance | Private Insurance |
| Under 6 | 23 (20.2%) | 91 (79.8%) |
| 6 to 18 Years | 66 (23.9%) | 220 (79.7%) |
| 19 to 25 Years | 48 (36.1%) | 54 (40.6%) |
| 25 to 34 Years | 24 (12.6%) | 137 (71.7%) |
| 35 to 44 Years | 28 (10.6%) | 252 (95.5%) |
| 45 to 54 Years | 104 (26.6%) | 257 (65.7%) |
| 55 to 64 Years | 112 (22.7%) | 326 (66.1%) |
| 65 to 74 Years | 147 (82.1%) | 59 (33.0%) |
| 75 Years and over | 173 (94.5%) | 100 (54.6%) |
| Total | 725 (32.6%) | 1,496 (67.3%) |
Disability Status by Sex by Age in Blue Hills
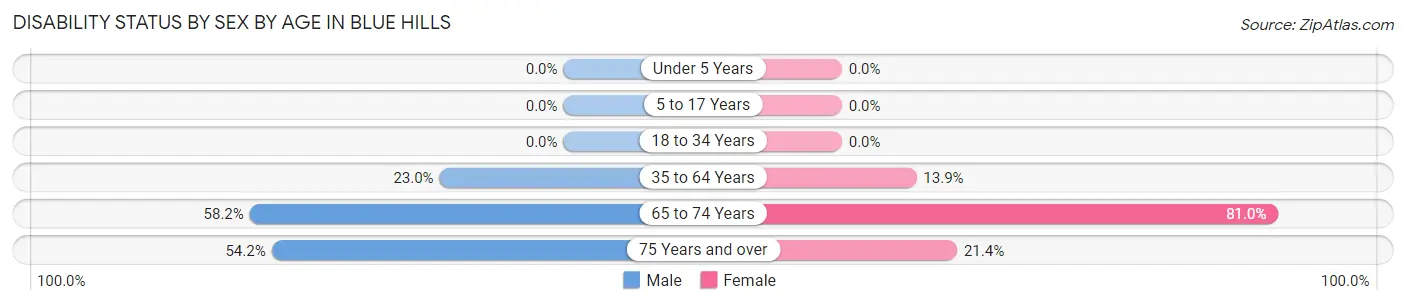
| Age Bracket | Male | Female |
| Under 5 Years | 0 (0.0%) | 0 (0.0%) |
| 5 to 17 Years | 0 (0.0%) | 0 (0.0%) |
| 18 to 34 Years | 0 (0.0%) | 0 (0.0%) |
| 35 to 64 Years | 98 (23.0%) | 100 (13.9%) |
| 65 to 74 Years | 46 (58.2%) | 81 (81.0%) |
| 75 Years and over | 13 (54.2%) | 34 (21.4%) |
Disability Class by Sex by Age in Blue Hills
Disability Class: Hearing Difficulty
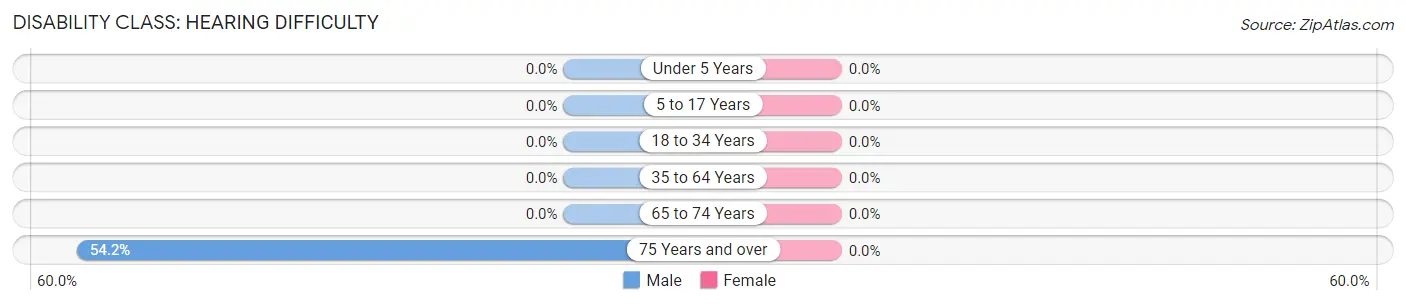
| Age Bracket | Male | Female |
| Under 5 Years | 0 (0.0%) | 0 (0.0%) |
| 5 to 17 Years | 0 (0.0%) | 0 (0.0%) |
| 18 to 34 Years | 0 (0.0%) | 0 (0.0%) |
| 35 to 64 Years | 0 (0.0%) | 0 (0.0%) |
| 65 to 74 Years | 0 (0.0%) | 0 (0.0%) |
| 75 Years and over | 13 (54.2%) | 0 (0.0%) |
Disability Class: Vision Difficulty
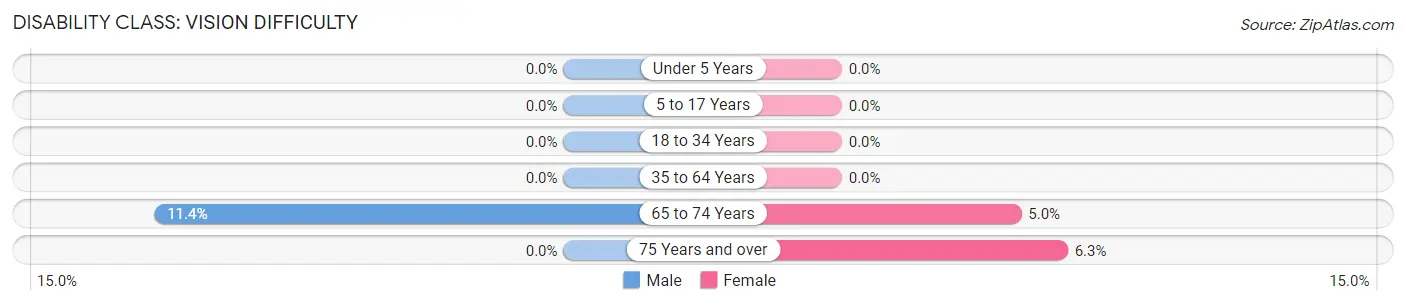
| Age Bracket | Male | Female |
| Under 5 Years | 0 (0.0%) | 0 (0.0%) |
| 5 to 17 Years | 0 (0.0%) | 0 (0.0%) |
| 18 to 34 Years | 0 (0.0%) | 0 (0.0%) |
| 35 to 64 Years | 0 (0.0%) | 0 (0.0%) |
| 65 to 74 Years | 9 (11.4%) | 5 (5.0%) |
| 75 Years and over | 0 (0.0%) | 10 (6.3%) |
Disability Class: Cognitive Difficulty
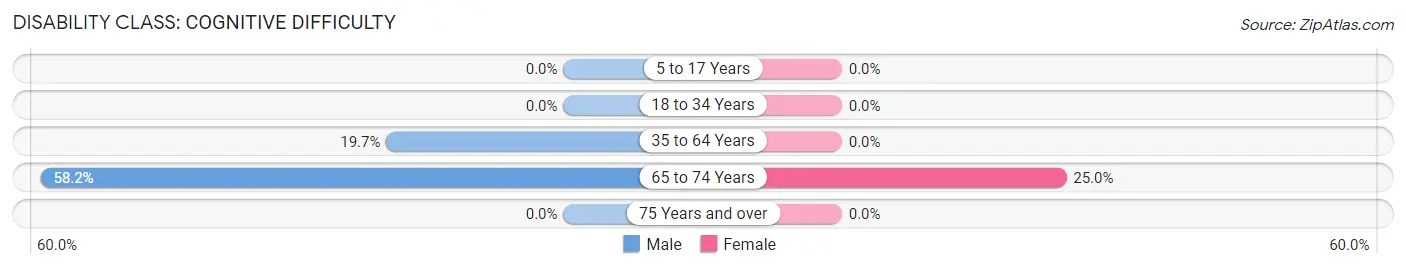
| Age Bracket | Male | Female |
| 5 to 17 Years | 0 (0.0%) | 0 (0.0%) |
| 18 to 34 Years | 0 (0.0%) | 0 (0.0%) |
| 35 to 64 Years | 84 (19.7%) | 0 (0.0%) |
| 65 to 74 Years | 46 (58.2%) | 25 (25.0%) |
| 75 Years and over | 0 (0.0%) | 0 (0.0%) |
Disability Class: Ambulatory Difficulty
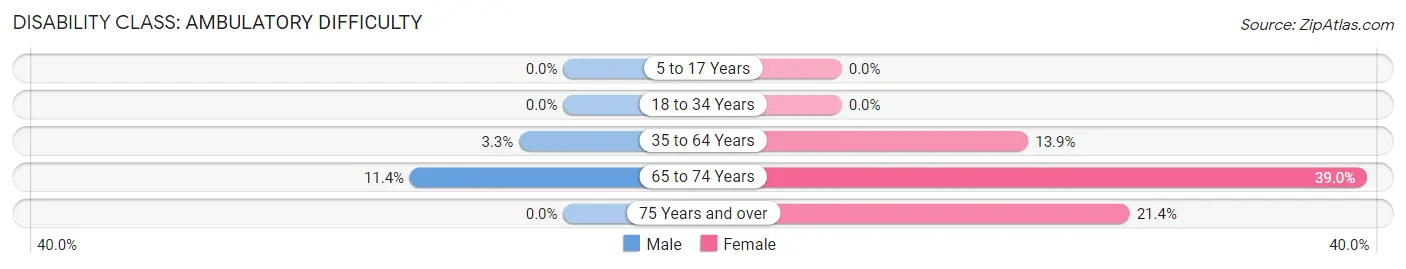
| Age Bracket | Male | Female |
| 5 to 17 Years | 0 (0.0%) | 0 (0.0%) |
| 18 to 34 Years | 0 (0.0%) | 0 (0.0%) |
| 35 to 64 Years | 14 (3.3%) | 100 (13.9%) |
| 65 to 74 Years | 9 (11.4%) | 39 (39.0%) |
| 75 Years and over | 0 (0.0%) | 34 (21.4%) |
Disability Class: Self-Care Difficulty
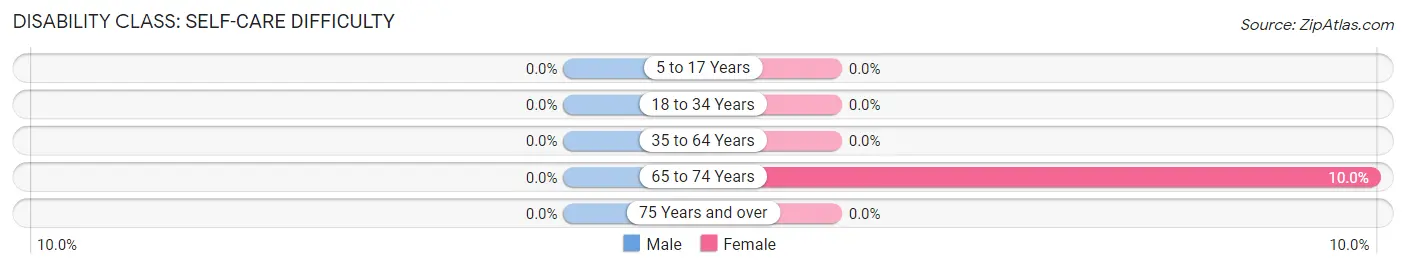
| Age Bracket | Male | Female |
| 5 to 17 Years | 0 (0.0%) | 0 (0.0%) |
| 18 to 34 Years | 0 (0.0%) | 0 (0.0%) |
| 35 to 64 Years | 0 (0.0%) | 0 (0.0%) |
| 65 to 74 Years | 0 (0.0%) | 10 (10.0%) |
| 75 Years and over | 0 (0.0%) | 0 (0.0%) |
Technology Access in Blue Hills
Computing Device Access in Blue Hills
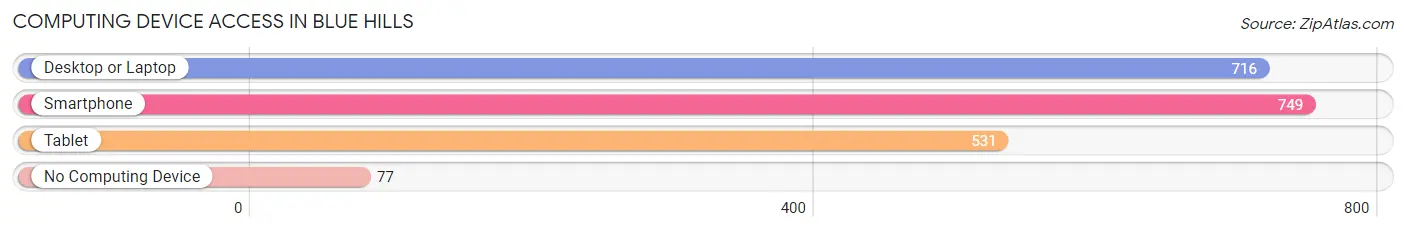
| Device Type | # Households | % Households |
| Desktop or Laptop | 716 | 76.2% |
| Smartphone | 749 | 79.8% |
| Tablet | 531 | 56.6% |
| No Computing Device | 77 | 8.2% |
| Total | 939 | 100.0% |
Internet Access in Blue Hills
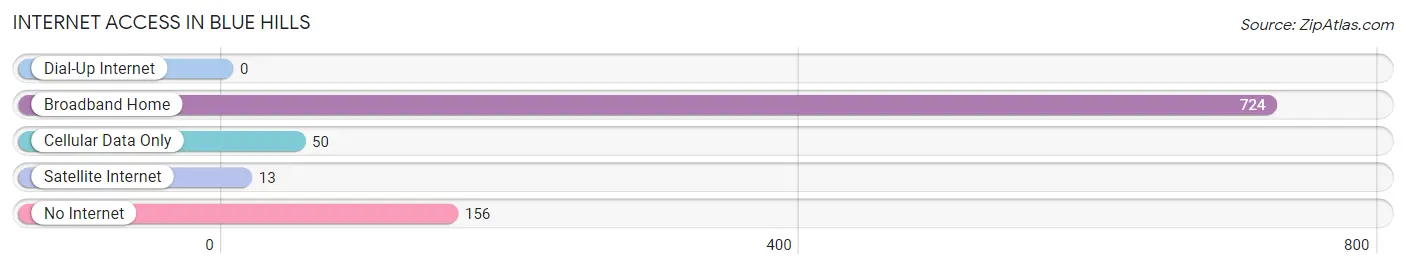
| Internet Type | # Households | % Households |
| Dial-Up Internet | 0 | 0.0% |
| Broadband Home | 724 | 77.1% |
| Cellular Data Only | 50 | 5.3% |
| Satellite Internet | 13 | 1.4% |
| No Internet | 156 | 16.6% |
| Total | 939 | 100.0% |
Blue Hills Summary
History
The town of Blue Hills, Connecticut is located in the southwestern corner of the state, in the Litchfield Hills region. It is bordered by the towns of Cornwall, Goshen, and Sharon. The town was originally part of the town of Cornwall, and was incorporated in 1739. The town was named for the blue hills that surround it, and the area was originally inhabited by the Mahican Native American tribe.
The town was primarily an agricultural community for much of its history, with dairy farming being the main industry. The town also had several mills, including a grist mill, a saw mill, and a woolen mill. The town also had a tannery, which was in operation until the early 1900s.
The town was also home to several small businesses, including a general store, a blacksmith shop, and a post office. The town also had a school, which was built in 1820.
Geography
Blue Hills is located in the Litchfield Hills region of Connecticut, in the southwestern corner of the state. It is bordered by the towns of Cornwall, Goshen, and Sharon. The town is located in the Housatonic River Valley, and is surrounded by hills and mountains. The highest point in the town is the summit of Blue Mountain, which is 1,722 feet above sea level.
The town has a total area of 24.2 square miles, of which 24.1 square miles is land and 0.1 square miles is water. The town is home to several lakes, including Lake Waramaug, Lake Wononscopomuc, and Lake Lillinonah.
Economy
The economy of Blue Hills is largely based on tourism and agriculture. The town is home to several farms, which produce dairy products, fruits, vegetables, and other agricultural products. The town also has several wineries, which produce wines from locally grown grapes.
The town is also home to several small businesses, including restaurants, retail stores, and art galleries. The town also has several bed and breakfasts, which attract visitors from all over the world.
Demographics
As of the 2010 census, the town of Blue Hills had a population of 1,845. The population density was 76.3 people per square mile. The racial makeup of the town was 97.2% White, 0.7% African American, 0.2% Native American, 0.4% Asian, 0.1% Pacific Islander, 0.4% from other races, and 1.0% from two or more races. Hispanic or Latino of any race were 1.7% of the population.
The median income for a household in the town was $68,750, and the median income for a family was $76,250. The per capita income for the town was $31,945. About 4.2% of families and 5.3% of the population were below the poverty line, including 6.2% of those under age 18 and 4.2% of those age 65 or over.
Common Questions
What is Per Capita Income in Blue Hills?
Per Capita income in Blue Hills is $31,612.
What is the Median Family Income in Blue Hills?
Median Family Income in Blue Hills is $80,227.
What is the Median Household income in Blue Hills?
Median Household Income in Blue Hills is $63,844.
What is Income or Wage Gap in Blue Hills?
Income or Wage Gap in Blue Hills is 10.6%.
Women in Blue Hills earn 89.4 cents for every dollar earned by a man.
What is Family Income Deficit in Blue Hills?
Family Income Deficit in Blue Hills is $7,810.
Families that are below poverty line in Blue Hills earn $7,810 less on average than the poverty threshold level.
What is Inequality or Gini Index in Blue Hills?
Inequality or Gini Index in Blue Hills is 0.36.
What is the Total Population of Blue Hills?
Total Population of Blue Hills is 2,224.
What is the Total Male Population of Blue Hills?
Total Male Population of Blue Hills is 780.
What is the Total Female Population of Blue Hills?
Total Female Population of Blue Hills is 1,444.
What is the Ratio of Males per 100 Females in Blue Hills?
There are 54.02 Males per 100 Females in Blue Hills.
What is the Ratio of Females per 100 Males in Blue Hills?
There are 185.13 Females per 100 Males in Blue Hills.
What is the Median Population Age in Blue Hills?
Median Population Age in Blue Hills is 49.1 Years.
What is the Average Family Size in Blue Hills
Average Family Size in Blue Hills is 3.0 People.
What is the Average Household Size in Blue Hills
Average Household Size in Blue Hills is 2.4 People.
How Large is the Labor Force in Blue Hills?
There are 1,355 People in the Labor Forcein in Blue Hills.
What is the Percentage of People in the Labor Force in Blue Hills?
72.0% of People are in the Labor Force in Blue Hills.
What is the Unemployment Rate in Blue Hills?
Unemployment Rate in Blue Hills is 3.5%.