Pawcatuck, CT Map & Demographics
Pawcatuck Map
Pawcatuck Overview
$39,655
PER CAPITA INCOME
$82,083
AVG FAMILY INCOME
$70,927
AVG HOUSEHOLD INCOME
56.0%
WAGE / INCOME GAP [ % ]
44.0¢/ $1
WAGE / INCOME GAP [ $ ]
0.45
INEQUALITY / GINI INDEX
5,570
TOTAL POPULATION
2,640
MALE POPULATION
2,930
FEMALE POPULATION
90.10
MALES / 100 FEMALES
110.98
FEMALES / 100 MALES
43.6
MEDIAN AGE
2.9
AVG FAMILY SIZE
2.2
AVG HOUSEHOLD SIZE
2,982
LABOR FORCE [ PEOPLE ]
67.8%
PERCENT IN LABOR FORCE
5.1%
UNEMPLOYMENT RATE
Pawcatuck Zip Codes
Pawcatuck Area Codes
Income in Pawcatuck
Income Overview in Pawcatuck
Per Capita Income in Pawcatuck is $39,655, while median incomes of families and households are $82,083 and $70,927 respectively.
| Characteristic | Number | Measure |
| Per Capita Income | 5,570 | $39,655 |
| Median Family Income | 1,448 | $82,083 |
| Mean Family Income | 1,448 | $108,533 |
| Median Household Income | 2,499 | $70,927 |
| Mean Household Income | 2,499 | $87,856 |
| Income Deficit | 1,448 | $0 |
| Wage / Income Gap (%) | 5,570 | 56.02% |
| Wage / Income Gap ($) | 5,570 | 43.98¢ per $1 |
| Gini / Inequality Index | 5,570 | 0.45 |
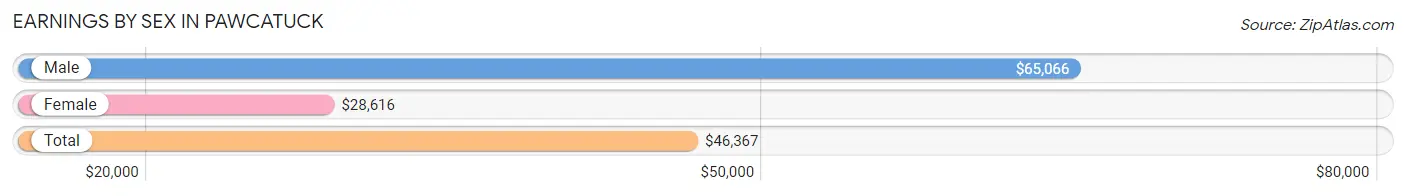
Earnings by Sex in Pawcatuck
Average Earnings in Pawcatuck are $46,367, $65,066 for men and $28,616 for women, a difference of 56.0%.
| Sex | Number | Average Earnings |
| Male | 1,610 (52.3%) | $65,066 |
| Female | 1,467 (47.7%) | $28,616 |
| Total | 3,077 (100.0%) | $46,367 |
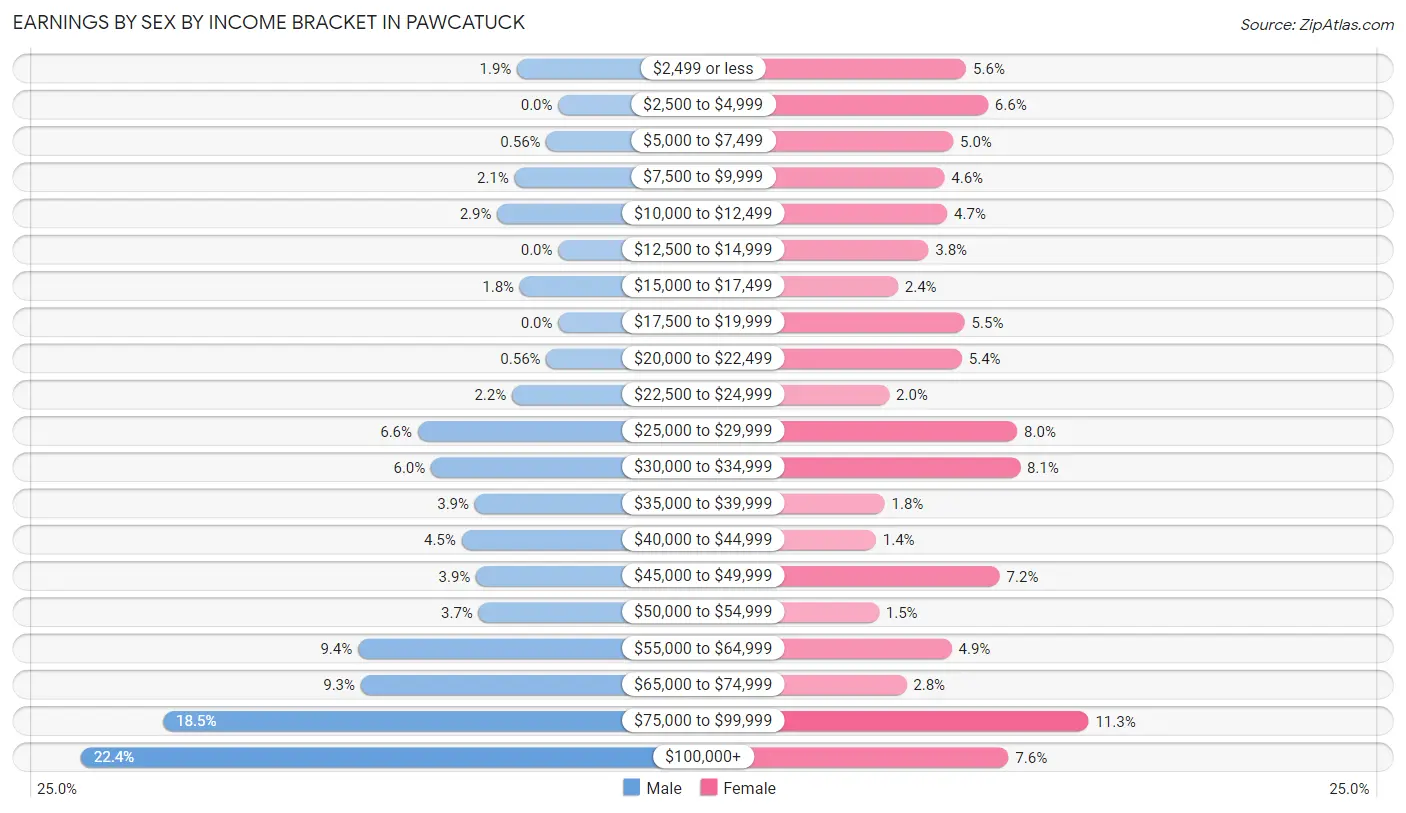
Earnings by Sex by Income Bracket in Pawcatuck
The most common earnings brackets in Pawcatuck are $100,000+ for men (360 | 22.4%) and $75,000 to $99,999 for women (166 | 11.3%).
| Income | Male | Female |
| $2,499 or less | 31 (1.9%) | 82 (5.6%) |
| $2,500 to $4,999 | 0 (0.0%) | 97 (6.6%) |
| $5,000 to $7,499 | 9 (0.6%) | 73 (5.0%) |
| $7,500 to $9,999 | 33 (2.1%) | 67 (4.6%) |
| $10,000 to $12,499 | 46 (2.9%) | 69 (4.7%) |
| $12,500 to $14,999 | 0 (0.0%) | 56 (3.8%) |
| $15,000 to $17,499 | 29 (1.8%) | 35 (2.4%) |
| $17,500 to $19,999 | 0 (0.0%) | 81 (5.5%) |
| $20,000 to $22,499 | 9 (0.6%) | 79 (5.4%) |
| $22,500 to $24,999 | 35 (2.2%) | 29 (2.0%) |
| $25,000 to $29,999 | 106 (6.6%) | 117 (8.0%) |
| $30,000 to $34,999 | 96 (6.0%) | 119 (8.1%) |
| $35,000 to $39,999 | 63 (3.9%) | 26 (1.8%) |
| $40,000 to $44,999 | 73 (4.5%) | 20 (1.4%) |
| $45,000 to $49,999 | 62 (3.8%) | 105 (7.2%) |
| $50,000 to $54,999 | 60 (3.7%) | 22 (1.5%) |
| $55,000 to $64,999 | 151 (9.4%) | 72 (4.9%) |
| $65,000 to $74,999 | 149 (9.2%) | 41 (2.8%) |
| $75,000 to $99,999 | 298 (18.5%) | 166 (11.3%) |
| $100,000+ | 360 (22.4%) | 111 (7.6%) |
| Total | 1,610 (100.0%) | 1,467 (100.0%) |
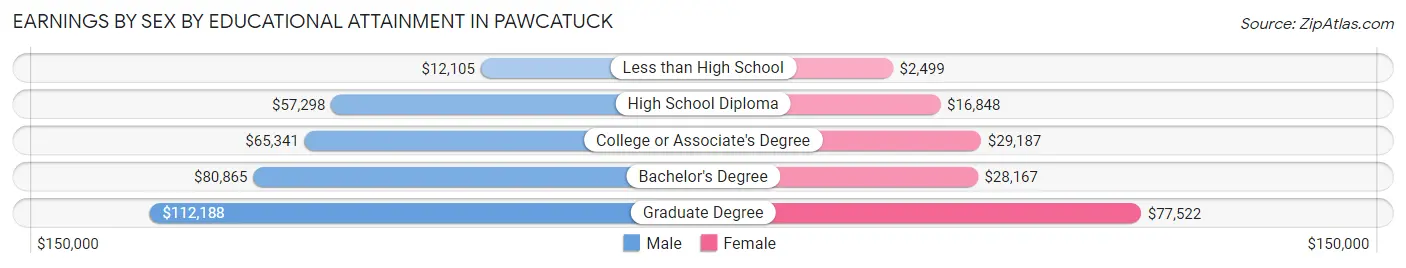
Earnings by Sex by Educational Attainment in Pawcatuck
Average earnings in Pawcatuck are $66,959 for men and $30,000 for women, a difference of 55.2%. Men with an educational attainment of graduate degree enjoy the highest average annual earnings of $112,188, while those with less than high school education earn the least with $12,105. Women with an educational attainment of graduate degree earn the most with the average annual earnings of $77,522, while those with less than high school education have the smallest earnings of $2,499.
| Educational Attainment | Male Income | Female Income |
| Less than High School | $12,105 | $2,499 |
| High School Diploma | $57,298 | $16,848 |
| College or Associate's Degree | $65,341 | $29,187 |
| Bachelor's Degree | $80,865 | $28,167 |
| Graduate Degree | $112,188 | $77,522 |
| Total | $66,959 | $30,000 |
Family Income in Pawcatuck
Family Income Brackets in Pawcatuck
According to the Pawcatuck family income data, there are 261 families falling into the $100,000 to $149,999 income range, which is the most common income bracket and makes up 18.0% of all families.
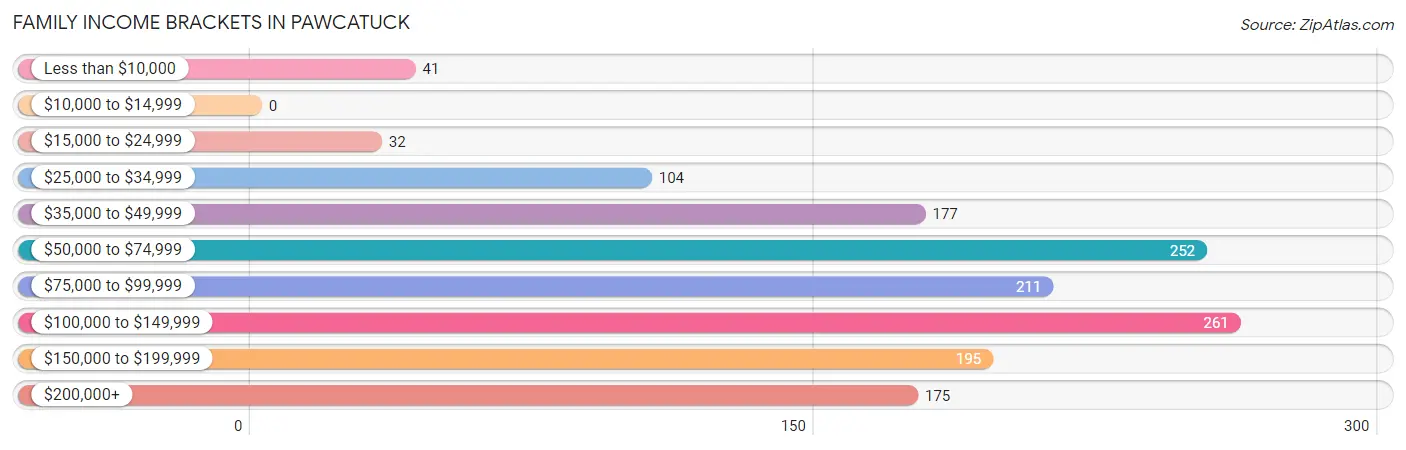
| Income Bracket | # Families | % Families |
| Less than $10,000 | 41 | 2.8% |
| $10,000 to $14,999 | 0 | 0.0% |
| $15,000 to $24,999 | 32 | 2.2% |
| $25,000 to $34,999 | 104 | 7.2% |
| $35,000 to $49,999 | 177 | 12.2% |
| $50,000 to $74,999 | 252 | 17.4% |
| $75,000 to $99,999 | 211 | 14.6% |
| $100,000 to $149,999 | 261 | 18.0% |
| $150,000 to $199,999 | 195 | 13.5% |
| $200,000+ | 175 | 12.1% |
Family Income by Famaliy Size in Pawcatuck
5-person families (41 | 2.8%) account for the highest median family income in Pawcatuck with $195,859 per family, while 3-person families (337 | 23.3%) have the highest median income of $39,183 per family member.
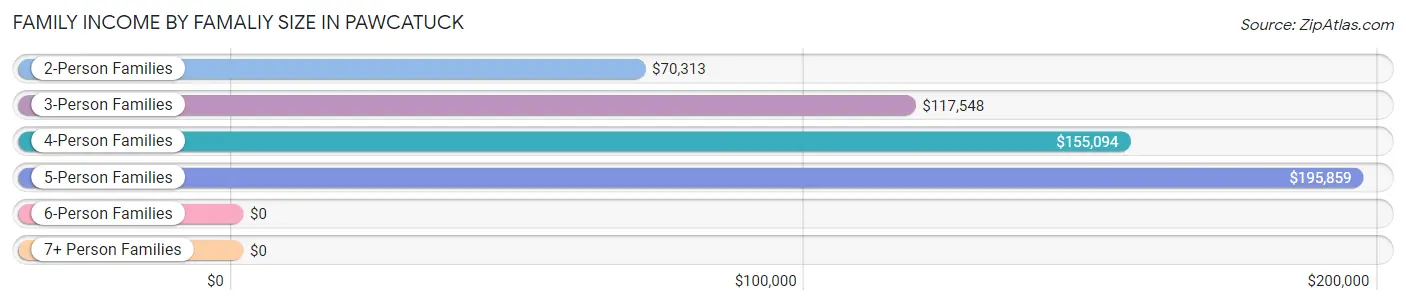
| Income Bracket | # Families | Median Income |
| 2-Person Families | 804 (55.5%) | $70,313 |
| 3-Person Families | 337 (23.3%) | $117,548 |
| 4-Person Families | 243 (16.8%) | $155,094 |
| 5-Person Families | 41 (2.8%) | $195,859 |
| 6-Person Families | 23 (1.6%) | $0 |
| 7+ Person Families | 0 (0.0%) | $0 |
| Total | 1,448 (100.0%) | $82,083 |
Family Income by Number of Earners in Pawcatuck
The median family income in Pawcatuck is $82,083, with families comprising 3+ earners (88) having the highest median family income of $140,556, while families with no earners (183) have the lowest median family income of $37,337, accounting for 6.1% and 12.6% of families, respectively.
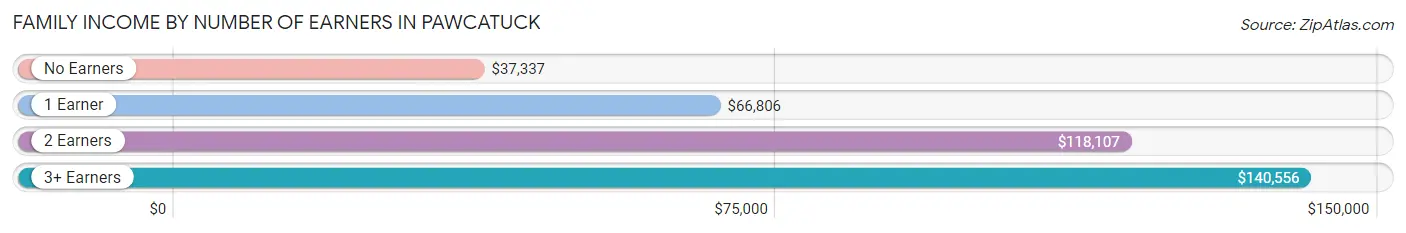
| Number of Earners | # Families | Median Income |
| No Earners | 183 (12.6%) | $37,337 |
| 1 Earner | 514 (35.5%) | $66,806 |
| 2 Earners | 663 (45.8%) | $118,107 |
| 3+ Earners | 88 (6.1%) | $140,556 |
| Total | 1,448 (100.0%) | $82,083 |
Household Income in Pawcatuck
Household Income Brackets in Pawcatuck
With 410 households falling in the category, the $100,000 to $149,999 income range is the most frequent in Pawcatuck, accounting for 16.4% of all households. In contrast, only 100 households (4.0%) fall into the $10,000 to $14,999 income bracket, making it the least populous group.
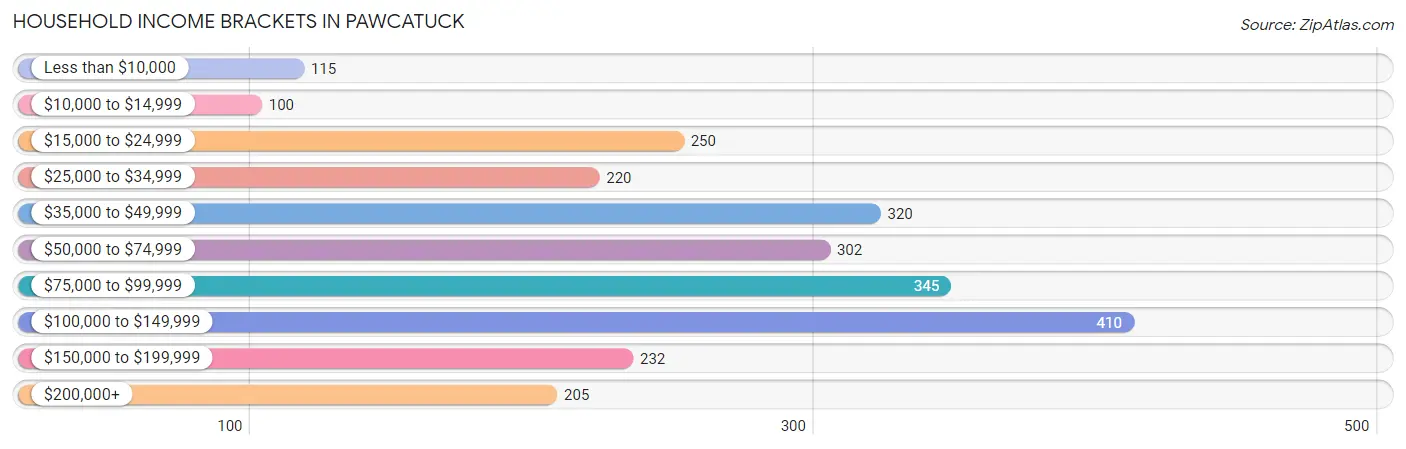
| Income Bracket | # Households | % Households |
| Less than $10,000 | 115 | 4.6% |
| $10,000 to $14,999 | 100 | 4.0% |
| $15,000 to $24,999 | 250 | 10.0% |
| $25,000 to $34,999 | 220 | 8.8% |
| $35,000 to $49,999 | 320 | 12.8% |
| $50,000 to $74,999 | 302 | 12.1% |
| $75,000 to $99,999 | 345 | 13.8% |
| $100,000 to $149,999 | 410 | 16.4% |
| $150,000 to $199,999 | 232 | 9.3% |
| $200,000+ | 205 | 8.2% |
Household Income by Householder Age in Pawcatuck
The median household income in Pawcatuck is $70,927, with the highest median household income of $98,472 found in the 25 to 44 years age bracket for the primary householder. A total of 838 households (33.5%) fall into this category. Meanwhile, the 15 to 24 years age bracket for the primary householder has the lowest median household income of $0, with 32 households (1.3%) in this group.
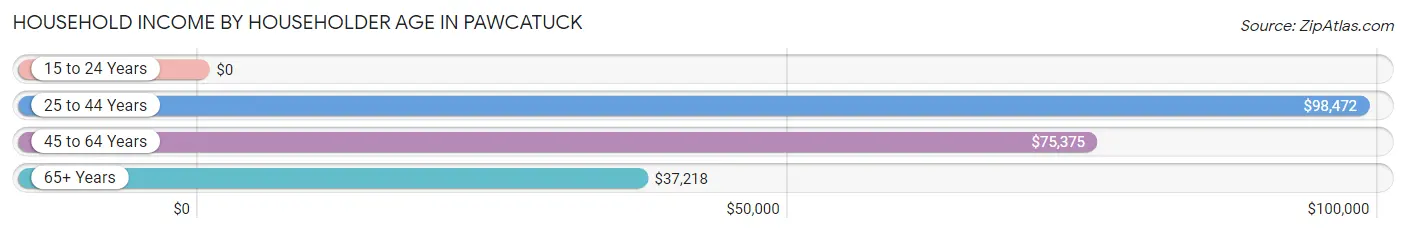
| Income Bracket | # Households | Median Income |
| 15 to 24 Years | 32 (1.3%) | $0 |
| 25 to 44 Years | 838 (33.5%) | $98,472 |
| 45 to 64 Years | 907 (36.3%) | $75,375 |
| 65+ Years | 722 (28.9%) | $37,218 |
| Total | 2,499 (100.0%) | $70,927 |
Poverty in Pawcatuck
Income Below Poverty by Sex and Age in Pawcatuck
With 6.6% poverty level for males and 14.0% for females among the residents of Pawcatuck, 6 to 11 year old males and 5 year old females are the most vulnerable to poverty, with 31 males (22.0%) and 38 females (51.3%) in their respective age groups living below the poverty level.
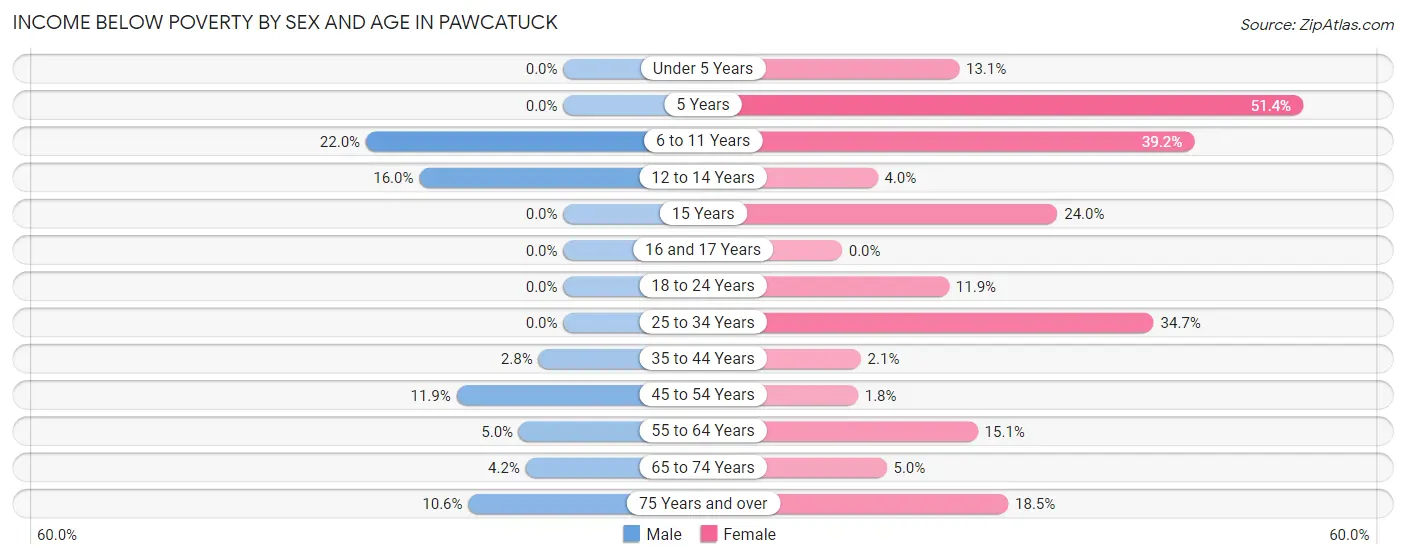
| Age Bracket | Male | Female |
| Under 5 Years | 0 (0.0%) | 35 (13.1%) |
| 5 Years | 0 (0.0%) | 38 (51.3%) |
| 6 to 11 Years | 31 (22.0%) | 82 (39.2%) |
| 12 to 14 Years | 30 (16.0%) | 6 (4.0%) |
| 15 Years | 0 (0.0%) | 6 (24.0%) |
| 16 and 17 Years | 0 (0.0%) | 0 (0.0%) |
| 18 to 24 Years | 0 (0.0%) | 13 (11.9%) |
| 25 to 34 Years | 0 (0.0%) | 91 (34.7%) |
| 35 to 44 Years | 9 (2.8%) | 7 (2.1%) |
| 45 to 54 Years | 54 (11.9%) | 7 (1.8%) |
| 55 to 64 Years | 19 (5.0%) | 64 (15.1%) |
| 65 to 74 Years | 11 (4.2%) | 20 (5.0%) |
| 75 Years and over | 20 (10.6%) | 40 (18.5%) |
| Total | 174 (6.6%) | 409 (14.0%) |
Income Above Poverty by Sex and Age in Pawcatuck
According to the poverty statistics in Pawcatuck, males aged under 5 years and females aged 16 and 17 years are the age groups that are most secure financially, with 100.0% of males and 100.0% of females in these age groups living above the poverty line.
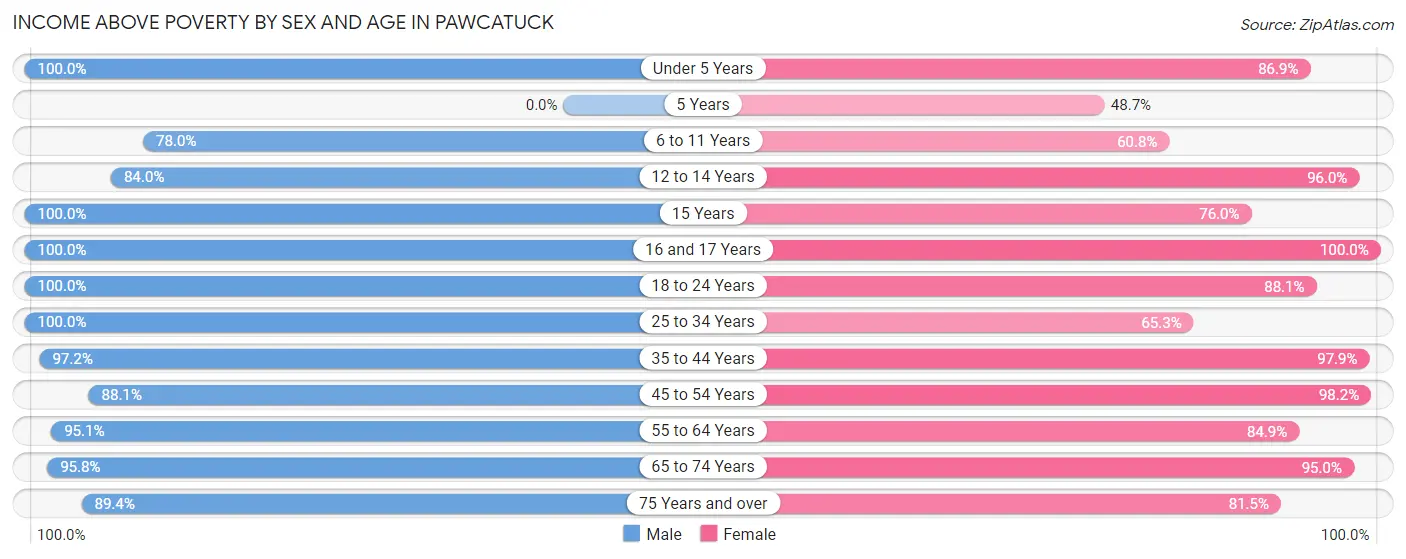
| Age Bracket | Male | Female |
| Under 5 Years | 105 (100.0%) | 233 (86.9%) |
| 5 Years | 0 (0.0%) | 36 (48.6%) |
| 6 to 11 Years | 110 (78.0%) | 127 (60.8%) |
| 12 to 14 Years | 157 (84.0%) | 145 (96.0%) |
| 15 Years | 12 (100.0%) | 19 (76.0%) |
| 16 and 17 Years | 70 (100.0%) | 64 (100.0%) |
| 18 to 24 Years | 127 (100.0%) | 96 (88.1%) |
| 25 to 34 Years | 384 (100.0%) | 171 (65.3%) |
| 35 to 44 Years | 316 (97.2%) | 326 (97.9%) |
| 45 to 54 Years | 400 (88.1%) | 387 (98.2%) |
| 55 to 64 Years | 365 (95.1%) | 359 (84.9%) |
| 65 to 74 Years | 251 (95.8%) | 382 (95.0%) |
| 75 Years and over | 169 (89.4%) | 176 (81.5%) |
| Total | 2,466 (93.4%) | 2,521 (86.0%) |
Income Below Poverty Among Married-Couple Families in Pawcatuck
The poverty statistics for married-couple families in Pawcatuck show that 1.5% or 15 of the total 971 families live below the poverty line. Families with 1 or 2 children have the highest poverty rate of 1.9%, comprising of 7 families. On the other hand, families with 3 or 4 children have the lowest poverty rate of 0.0%, which includes 0 families.
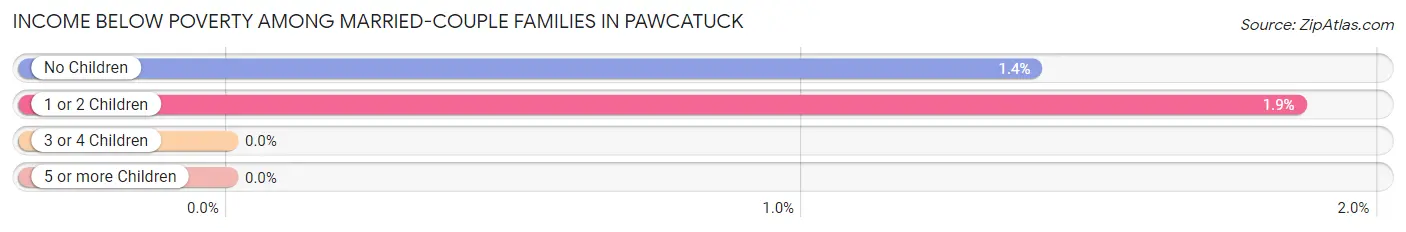
| Children | Above Poverty | Below Poverty |
| No Children | 565 (98.6%) | 8 (1.4%) |
| 1 or 2 Children | 369 (98.1%) | 7 (1.9%) |
| 3 or 4 Children | 22 (100.0%) | 0 (0.0%) |
| 5 or more Children | 0 (0.0%) | 0 (0.0%) |
| Total | 956 (98.5%) | 15 (1.5%) |
Income Below Poverty Among Single-Parent Households in Pawcatuck
According to the poverty data in Pawcatuck, 4.7% or 9 single-father households and 17.1% or 49 single-mother households are living below the poverty line. Among single-father households, those with no children have the highest poverty rate, with 9 households (10.6%) experiencing poverty. Likewise, among single-mother households, those with 3 or 4 children have the highest poverty rate, with 36 households (100.0%) falling below the poverty line.
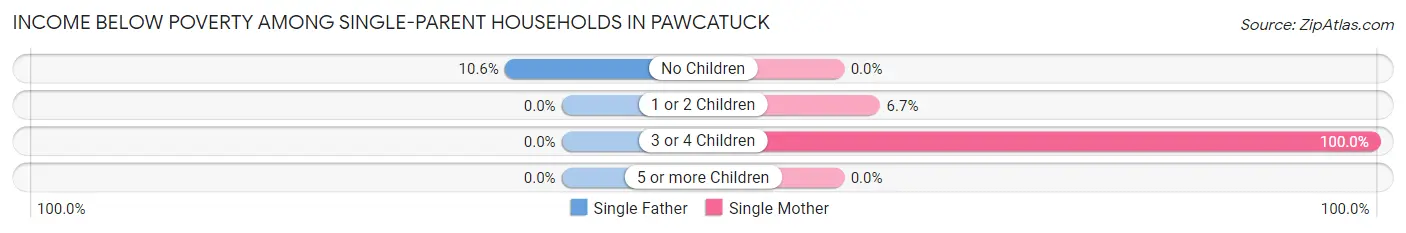
| Children | Single Father | Single Mother |
| No Children | 9 (10.6%) | 0 (0.0%) |
| 1 or 2 Children | 0 (0.0%) | 13 (6.7%) |
| 3 or 4 Children | 0 (0.0%) | 36 (100.0%) |
| 5 or more Children | 0 (0.0%) | 0 (0.0%) |
| Total | 9 (4.7%) | 49 (17.1%) |
Income Below Poverty Among Married-Couple vs Single-Parent Households in Pawcatuck
The poverty data for Pawcatuck shows that 15 of the married-couple family households (1.5%) and 58 of the single-parent households (12.2%) are living below the poverty level. Within the married-couple family households, those with 1 or 2 children have the highest poverty rate, with 7 households (1.9%) falling below the poverty line. Among the single-parent households, those with 3 or 4 children have the highest poverty rate, with 36 household (100.0%) living below poverty.
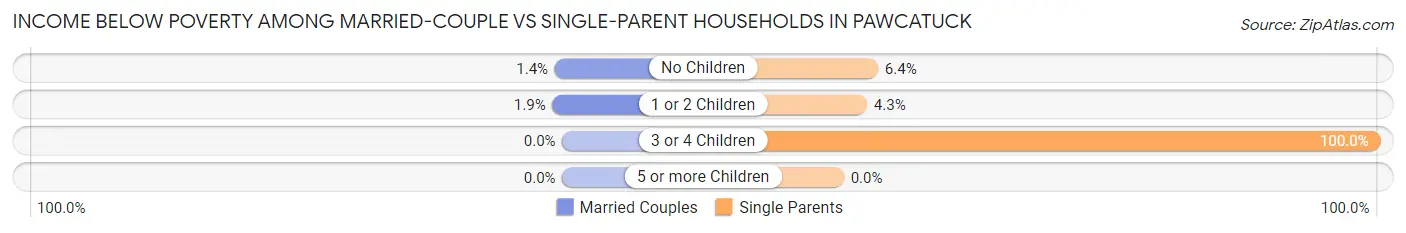
| Children | Married-Couple Families | Single-Parent Households |
| No Children | 8 (1.4%) | 9 (6.4%) |
| 1 or 2 Children | 7 (1.9%) | 13 (4.3%) |
| 3 or 4 Children | 0 (0.0%) | 36 (100.0%) |
| 5 or more Children | 0 (0.0%) | 0 (0.0%) |
| Total | 15 (1.5%) | 58 (12.2%) |
Race in Pawcatuck
The most populous races in Pawcatuck are White / Caucasian (4,602 | 82.6%), Two or more Races (458 | 8.2%), and Asian (253 | 4.5%).
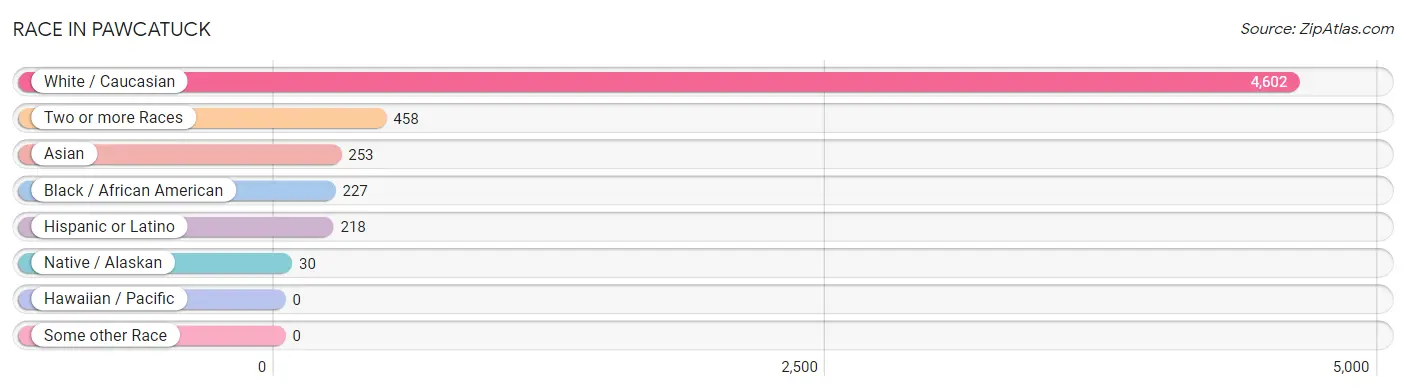
| Race | # Population | % Population |
| Asian | 253 | 4.5% |
| Black / African American | 227 | 4.1% |
| Hawaiian / Pacific | 0 | 0.0% |
| Hispanic or Latino | 218 | 3.9% |
| Native / Alaskan | 30 | 0.5% |
| White / Caucasian | 4,602 | 82.6% |
| Two or more Races | 458 | 8.2% |
| Some other Race | 0 | 0.0% |
| Total | 5,570 | 100.0% |
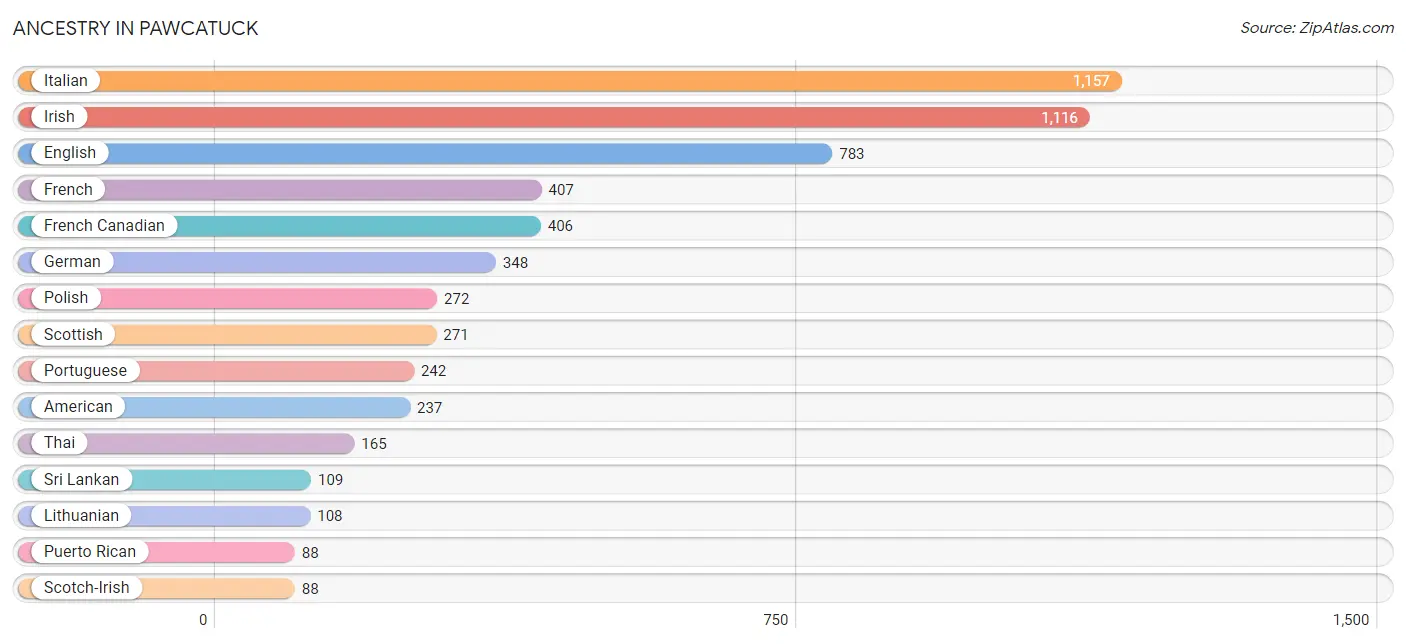
Ancestry in Pawcatuck
The most populous ancestries reported in Pawcatuck are Italian (1,157 | 20.8%), Irish (1,116 | 20.0%), English (783 | 14.1%), French (407 | 7.3%), and French Canadian (406 | 7.3%), together accounting for 69.5% of all Pawcatuck residents.
| Ancestry | # Population | % Population |
| African | 33 | 0.6% |
| American | 237 | 4.3% |
| Arab | 32 | 0.6% |
| Armenian | 10 | 0.2% |
| Austrian | 36 | 0.6% |
| Blackfeet | 38 | 0.7% |
| Canadian | 37 | 0.7% |
| Central American | 6 | 0.1% |
| Central American Indian | 20 | 0.4% |
| Croatian | 12 | 0.2% |
| Czechoslovakian | 10 | 0.2% |
| Danish | 1 | 0.0% |
| Dutch | 37 | 0.7% |
| Eastern European | 10 | 0.2% |
| Ecuadorian | 20 | 0.4% |
| English | 783 | 14.1% |
| European | 30 | 0.5% |
| French | 407 | 7.3% |
| French Canadian | 406 | 7.3% |
| German | 348 | 6.2% |
| Indian (Asian) | 44 | 0.8% |
| Irish | 1,116 | 20.0% |
| Italian | 1,157 | 20.8% |
| Jamaican | 20 | 0.4% |
| Korean | 60 | 1.1% |
| Lebanese | 32 | 0.6% |
| Lithuanian | 108 | 1.9% |
| Mexican | 30 | 0.5% |
| Norwegian | 73 | 1.3% |
| Polish | 272 | 4.9% |
| Portuguese | 242 | 4.3% |
| Puerto Rican | 88 | 1.6% |
| Russian | 19 | 0.3% |
| Salvadoran | 6 | 0.1% |
| Scotch-Irish | 88 | 1.6% |
| Scottish | 271 | 4.9% |
| Slavic | 7 | 0.1% |
| Slovak | 8 | 0.1% |
| South American | 20 | 0.4% |
| Spanish | 74 | 1.3% |
| Sri Lankan | 109 | 2.0% |
| Subsaharan African | 33 | 0.6% |
| Swedish | 38 | 0.7% |
| Swiss | 9 | 0.2% |
| Thai | 165 | 3.0% |
| Ukrainian | 12 | 0.2% |
| Welsh | 5 | 0.1% | View All 47 Rows |
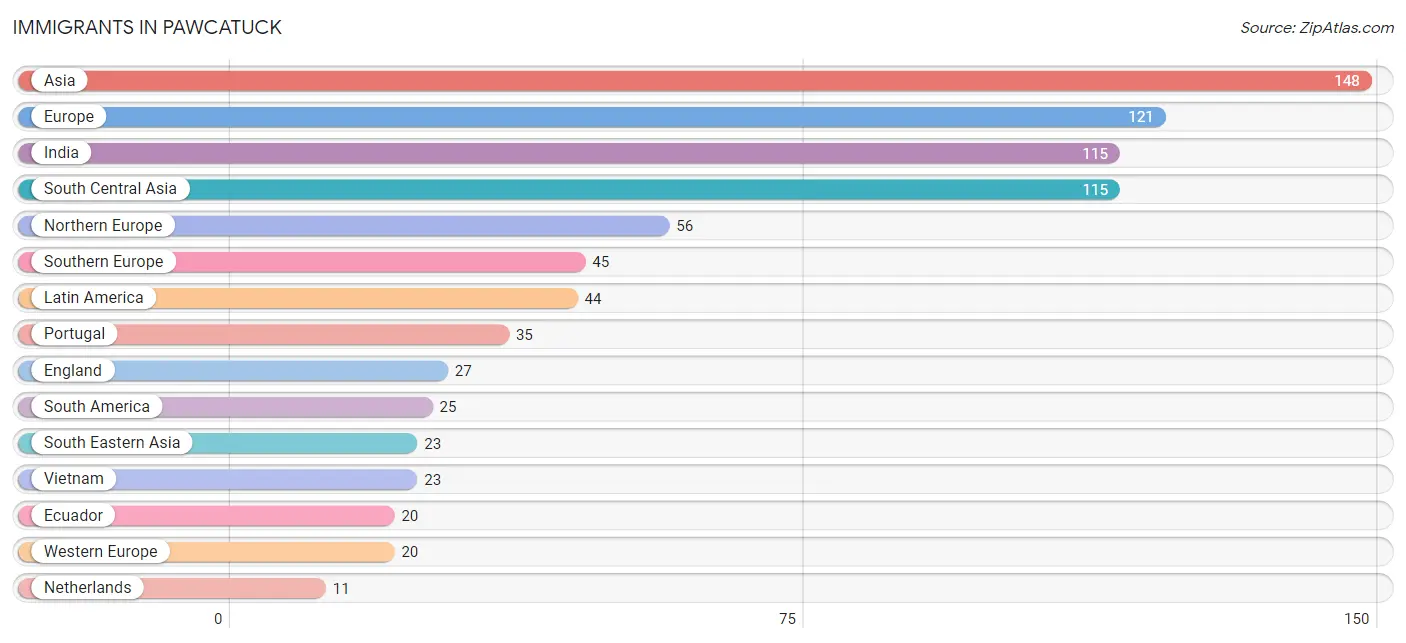
Immigrants in Pawcatuck
The most numerous immigrant groups reported in Pawcatuck came from Asia (148 | 2.7%), Europe (121 | 2.2%), India (115 | 2.1%), South Central Asia (115 | 2.1%), and Northern Europe (56 | 1.0%), together accounting for 10.0% of all Pawcatuck residents.
| Immigration Origin | # Population | % Population |
| Asia | 148 | 2.7% |
| Caribbean | 10 | 0.2% |
| Central America | 9 | 0.2% |
| China | 10 | 0.2% |
| Eastern Asia | 10 | 0.2% |
| Ecuador | 20 | 0.4% |
| England | 27 | 0.5% |
| Europe | 121 | 2.2% |
| Germany | 9 | 0.2% |
| Guatemala | 9 | 0.2% |
| India | 115 | 2.1% |
| Ireland | 10 | 0.2% |
| Italy | 10 | 0.2% |
| Jamaica | 10 | 0.2% |
| Latin America | 44 | 0.8% |
| Netherlands | 11 | 0.2% |
| Northern Europe | 56 | 1.0% |
| Peru | 5 | 0.1% |
| Portugal | 35 | 0.6% |
| Scotland | 8 | 0.1% |
| South America | 25 | 0.4% |
| South Central Asia | 115 | 2.1% |
| South Eastern Asia | 23 | 0.4% |
| Southern Europe | 45 | 0.8% |
| Vietnam | 23 | 0.4% |
| Western Europe | 20 | 0.4% | View All 26 Rows |
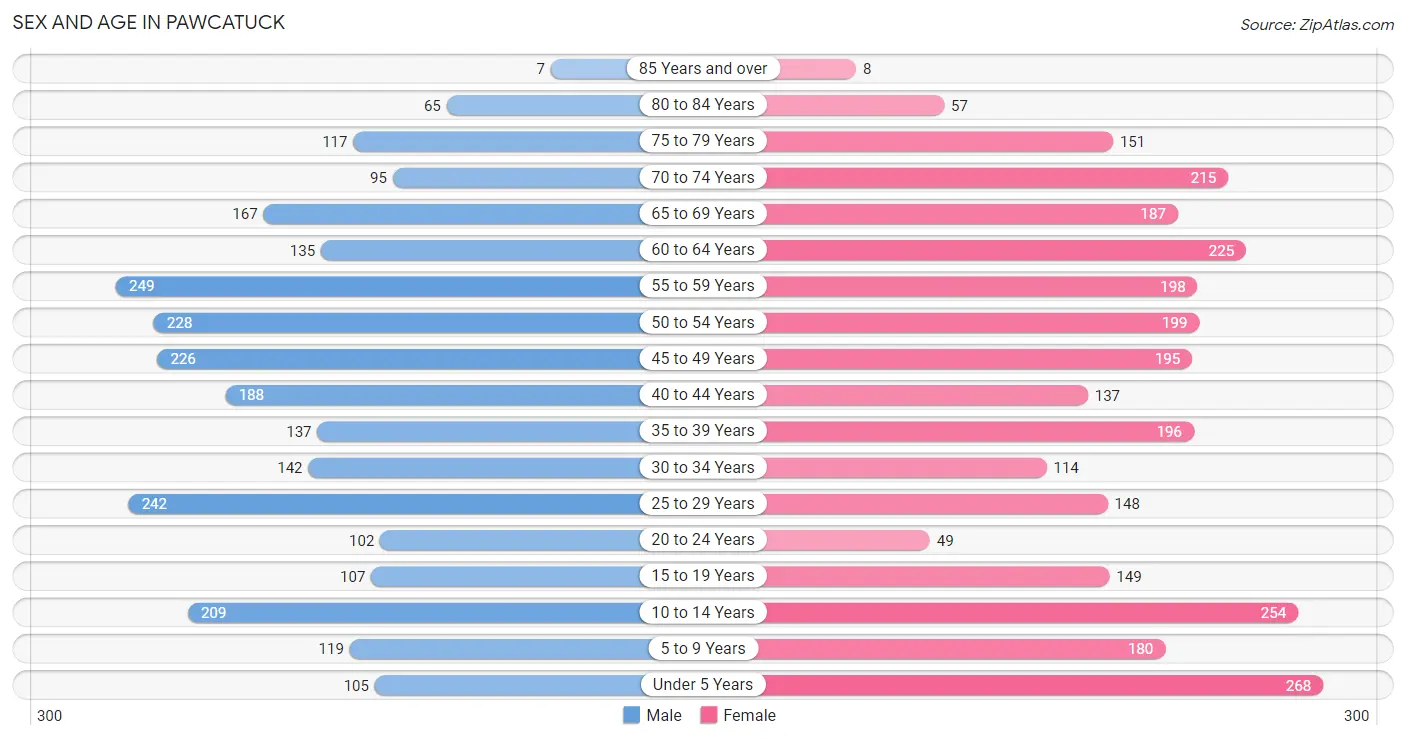
Sex and Age in Pawcatuck
Sex and Age in Pawcatuck
The most populous age groups in Pawcatuck are 55 to 59 Years (249 | 9.4%) for men and Under 5 Years (268 | 9.1%) for women.
| Age Bracket | Male | Female |
| Under 5 Years | 105 (4.0%) | 268 (9.1%) |
| 5 to 9 Years | 119 (4.5%) | 180 (6.1%) |
| 10 to 14 Years | 209 (7.9%) | 254 (8.7%) |
| 15 to 19 Years | 107 (4.1%) | 149 (5.1%) |
| 20 to 24 Years | 102 (3.9%) | 49 (1.7%) |
| 25 to 29 Years | 242 (9.2%) | 148 (5.1%) |
| 30 to 34 Years | 142 (5.4%) | 114 (3.9%) |
| 35 to 39 Years | 137 (5.2%) | 196 (6.7%) |
| 40 to 44 Years | 188 (7.1%) | 137 (4.7%) |
| 45 to 49 Years | 226 (8.6%) | 195 (6.7%) |
| 50 to 54 Years | 228 (8.6%) | 199 (6.8%) |
| 55 to 59 Years | 249 (9.4%) | 198 (6.8%) |
| 60 to 64 Years | 135 (5.1%) | 225 (7.7%) |
| 65 to 69 Years | 167 (6.3%) | 187 (6.4%) |
| 70 to 74 Years | 95 (3.6%) | 215 (7.3%) |
| 75 to 79 Years | 117 (4.4%) | 151 (5.1%) |
| 80 to 84 Years | 65 (2.5%) | 57 (1.9%) |
| 85 Years and over | 7 (0.3%) | 8 (0.3%) |
| Total | 2,640 (100.0%) | 2,930 (100.0%) |
Families and Households in Pawcatuck
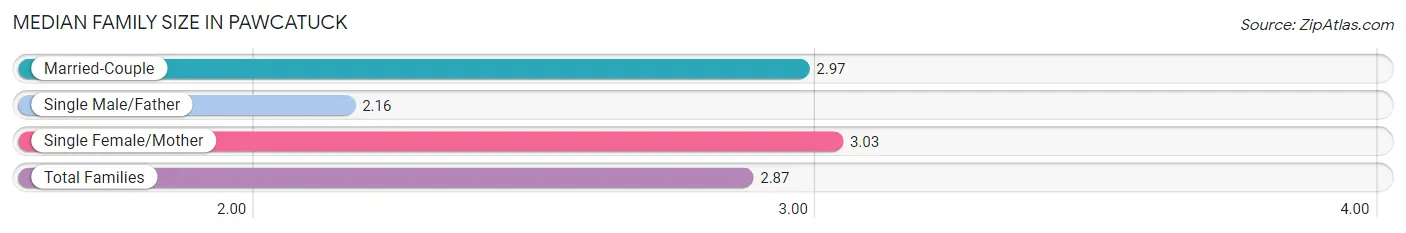
Median Family Size in Pawcatuck
The median family size in Pawcatuck is 2.87 persons per family, with single female/mother families (286 | 19.8%) accounting for the largest median family size of 3.03 persons per family. On the other hand, single male/father families (191 | 13.2%) represent the smallest median family size with 2.16 persons per family.
| Family Type | # Families | Family Size |
| Married-Couple | 971 (67.1%) | 2.97 |
| Single Male/Father | 191 (13.2%) | 2.16 |
| Single Female/Mother | 286 (19.8%) | 3.03 |
| Total Families | 1,448 (100.0%) | 2.87 |
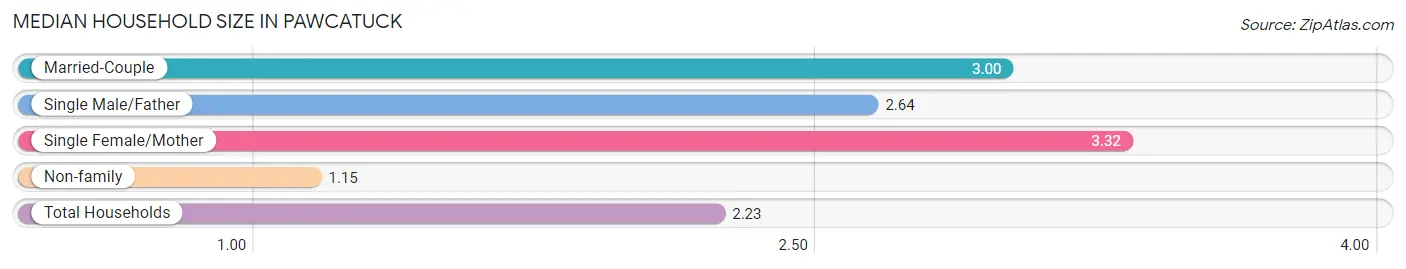
Median Household Size in Pawcatuck
The median household size in Pawcatuck is 2.23 persons per household, with single female/mother households (286 | 11.4%) accounting for the largest median household size of 3.32 persons per household. non-family households (1,051 | 42.1%) represent the smallest median household size with 1.15 persons per household.
| Household Type | # Households | Household Size |
| Married-Couple | 971 (38.9%) | 3.00 |
| Single Male/Father | 191 (7.6%) | 2.64 |
| Single Female/Mother | 286 (11.4%) | 3.32 |
| Non-family | 1,051 (42.1%) | 1.15 |
| Total Households | 2,499 (100.0%) | 2.23 |
Household Size by Marriage Status in Pawcatuck
Out of a total of 2,499 households in Pawcatuck, 1,448 (57.9%) are family households, while 1,051 (42.1%) are nonfamily households. The most numerous type of family households are 2-person households, comprising 663, and the most common type of nonfamily households are 1-person households, comprising 920.
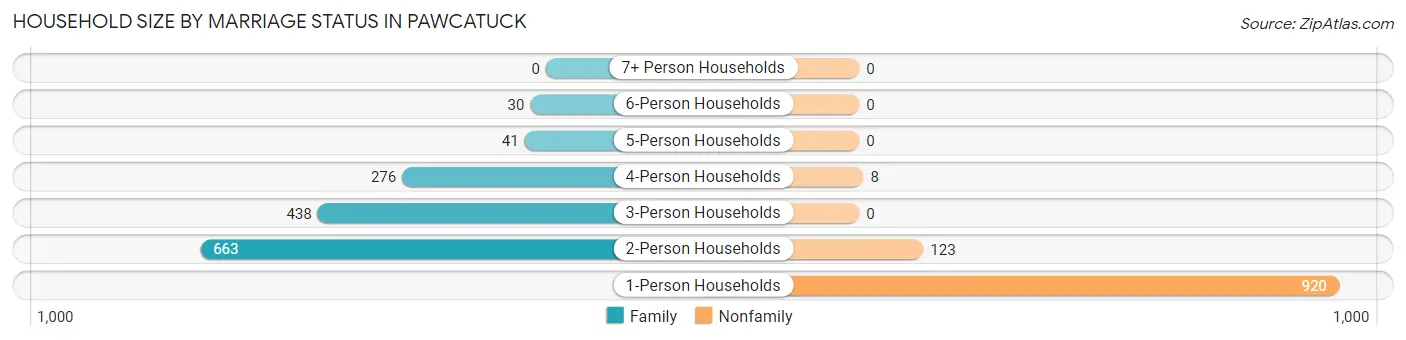
| Household Size | Family Households | Nonfamily Households |
| 1-Person Households | - | 920 (36.8%) |
| 2-Person Households | 663 (26.5%) | 123 (4.9%) |
| 3-Person Households | 438 (17.5%) | 0 (0.0%) |
| 4-Person Households | 276 (11.0%) | 8 (0.3%) |
| 5-Person Households | 41 (1.6%) | 0 (0.0%) |
| 6-Person Households | 30 (1.2%) | 0 (0.0%) |
| 7+ Person Households | 0 (0.0%) | 0 (0.0%) |
| Total | 1,448 (57.9%) | 1,051 (42.1%) |
Female Fertility in Pawcatuck
Fertility by Age in Pawcatuck
Average fertility rate in Pawcatuck is 29.0 births per 1,000 women. Women in the age bracket of 20 to 34 years have the highest fertility rate with 61.0 births per 1,000 women. Women in the age bracket of 20 to 34 years acount for 65.5% of all women with births.
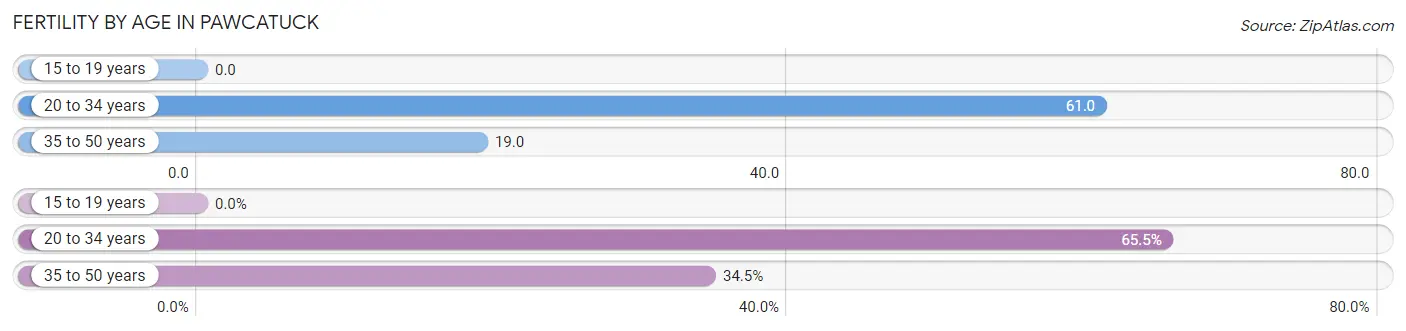
| Age Bracket | Women with Births | Births / 1,000 Women |
| 15 to 19 years | 0 (0.0%) | 0.0 |
| 20 to 34 years | 19 (65.5%) | 61.0 |
| 35 to 50 years | 10 (34.5%) | 19.0 |
| Total | 29 (100.0%) | 29.0 |
Fertility by Age by Marriage Status in Pawcatuck
86.2% of women with births (29) in Pawcatuck are married. The highest percentage of unmarried women with births falls into 20 to 34 years age bracket with 21.0% of them unmarried at the time of birth, while the lowest percentage of unmarried women with births belong to 35 to 50 years age bracket with 0.0% of them unmarried.
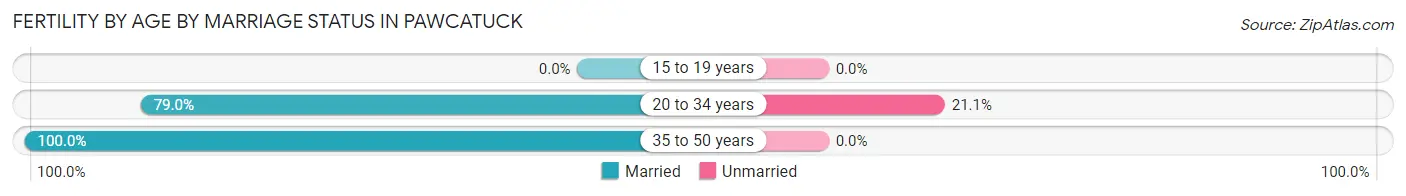
| Age Bracket | Married | Unmarried |
| 15 to 19 years | 0 (0.0%) | 0 (0.0%) |
| 20 to 34 years | 15 (78.9%) | 4 (21.0%) |
| 35 to 50 years | 10 (100.0%) | 0 (0.0%) |
| Total | 25 (86.2%) | 4 (13.8%) |
Fertility by Education in Pawcatuck
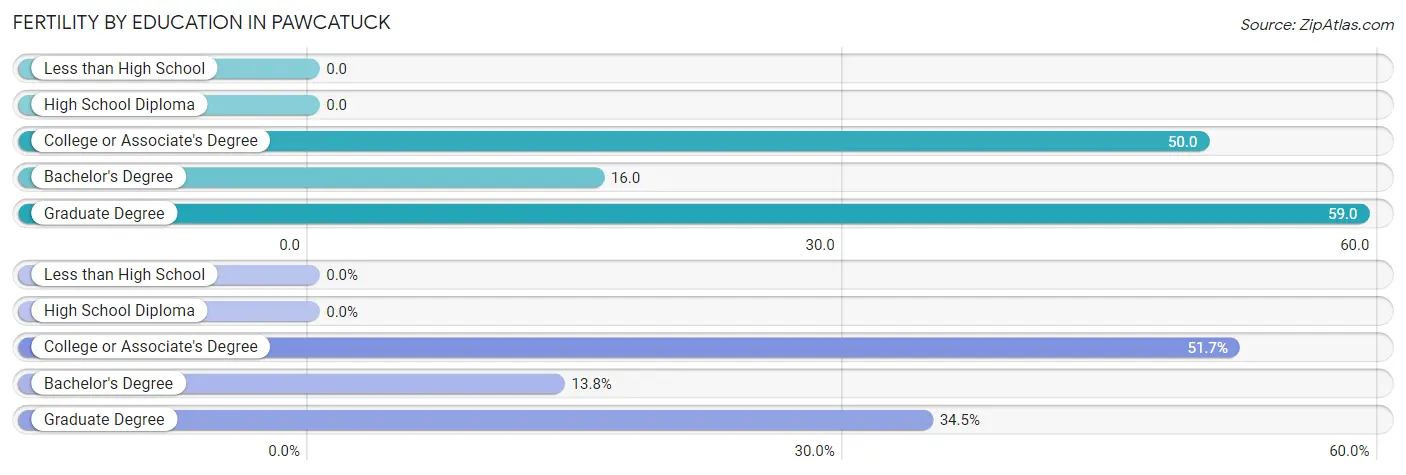
| Educational Attainment | Women with Births | Births / 1,000 Women |
| Less than High School | 0 (0.0%) | 0.0 |
| High School Diploma | 0 (0.0%) | 0.0 |
| College or Associate's Degree | 15 (51.7%) | 50.0 |
| Bachelor's Degree | 4 (13.8%) | 16.0 |
| Graduate Degree | 10 (34.5%) | 59.0 |
| Total | 29 (100.0%) | 29.0 |
Fertility by Education by Marriage Status in Pawcatuck
13.8% of women with births in Pawcatuck are unmarried. Women with the educational attainment of college or associate's degree are most likely to be married with 100.0% of them married at childbirth, while women with the educational attainment of bachelor's degree are least likely to be married with 100.0% of them unmarried at childbirth.
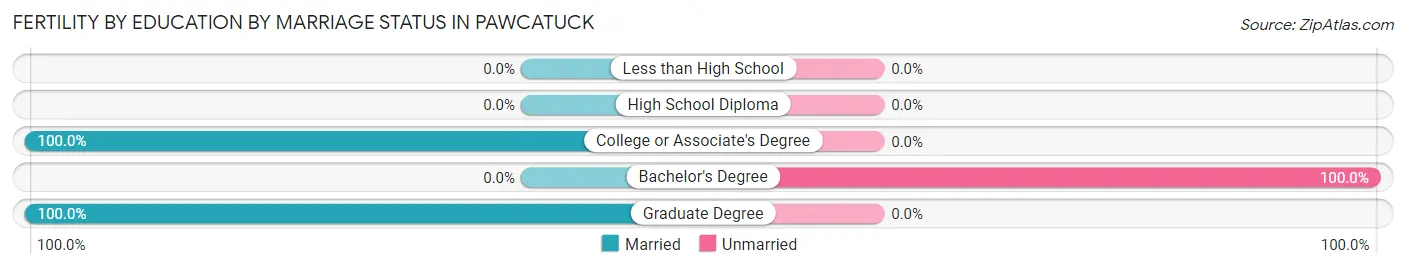
| Educational Attainment | Married | Unmarried |
| Less than High School | 0 (0.0%) | 0 (0.0%) |
| High School Diploma | 0 (0.0%) | 0 (0.0%) |
| College or Associate's Degree | 15 (100.0%) | 0 (0.0%) |
| Bachelor's Degree | 0 (0.0%) | 4 (100.0%) |
| Graduate Degree | 10 (100.0%) | 0 (0.0%) |
| Total | 25 (86.2%) | 4 (13.8%) |
Employment Characteristics in Pawcatuck
Employment by Class of Employer in Pawcatuck
Among the 2,747 employed individuals in Pawcatuck, private company employees (1,890 | 68.8%), not-for-profit organizations (250 | 9.1%), and local government employees (233 | 8.5%) make up the most common classes of employment.
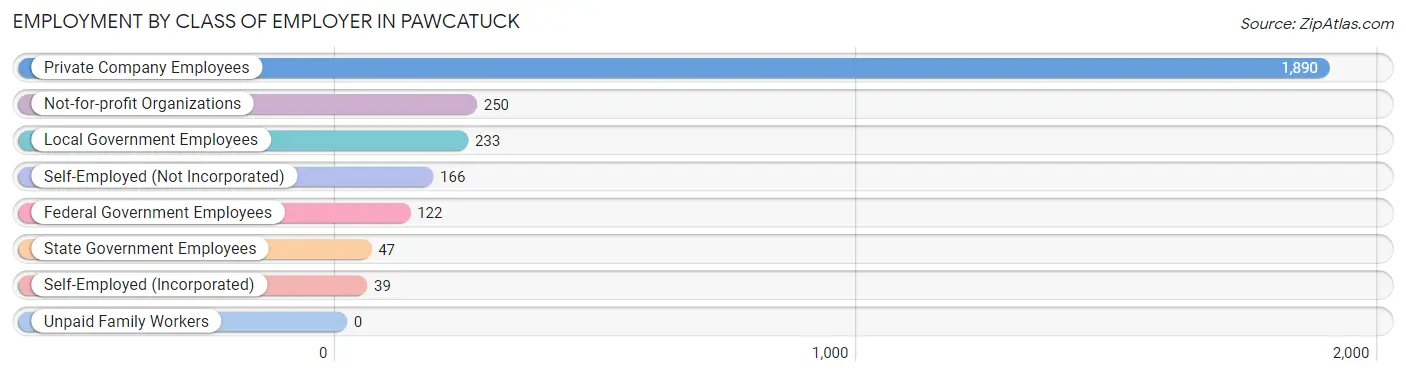
| Employer Class | # Employees | % Employees |
| Private Company Employees | 1,890 | 68.8% |
| Self-Employed (Incorporated) | 39 | 1.4% |
| Self-Employed (Not Incorporated) | 166 | 6.0% |
| Not-for-profit Organizations | 250 | 9.1% |
| Local Government Employees | 233 | 8.5% |
| State Government Employees | 47 | 1.7% |
| Federal Government Employees | 122 | 4.4% |
| Unpaid Family Workers | 0 | 0.0% |
| Total | 2,747 | 100.0% |
Employment Status by Age in Pawcatuck
According to the labor force statistics for Pawcatuck, out of the total population over 16 years of age (4,398), 67.8% or 2,982 individuals are in the labor force, with 5.1% or 152 of them unemployed. The age group with the highest labor force participation rate is 20 to 24 years, with 100.0% or 151 individuals in the labor force. Within the labor force, the 25 to 29 years age range has the highest percentage of unemployed individuals, with 12.7% or 44 of them being unemployed.
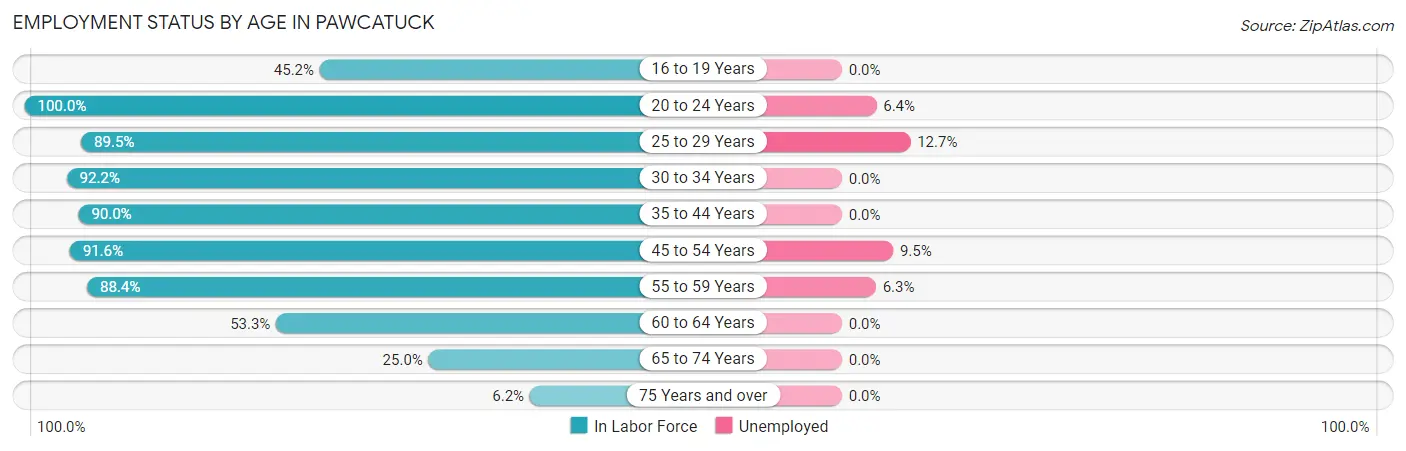
| Age Bracket | In Labor Force | Unemployed |
| 16 to 19 Years | 99 (45.2%) | 0 (0.0%) |
| 20 to 24 Years | 151 (100.0%) | 10 (6.4%) |
| 25 to 29 Years | 349 (89.5%) | 44 (12.7%) |
| 30 to 34 Years | 236 (92.2%) | 0 (0.0%) |
| 35 to 44 Years | 592 (90.0%) | 0 (0.0%) |
| 45 to 54 Years | 777 (91.6%) | 74 (9.5%) |
| 55 to 59 Years | 395 (88.4%) | 25 (6.3%) |
| 60 to 64 Years | 192 (53.3%) | 0 (0.0%) |
| 65 to 74 Years | 166 (25.0%) | 0 (0.0%) |
| 75 Years and over | 25 (6.2%) | 0 (0.0%) |
| Total | 2,982 (67.8%) | 152 (5.1%) |
Employment Status by Educational Attainment in Pawcatuck
According to labor force statistics for Pawcatuck, 85.9% of individuals (2,542) out of the total population between 25 and 64 years of age (2,959) are in the labor force, with 5.6% or 142 of them being unemployed. The group with the highest labor force participation rate are those with the educational attainment of bachelor's degree or higher, with 89.7% or 1,067 individuals in the labor force. Within the labor force, individuals with less than high school education have the highest percentage of unemployment, with 21.3% or 10 of them being unemployed.
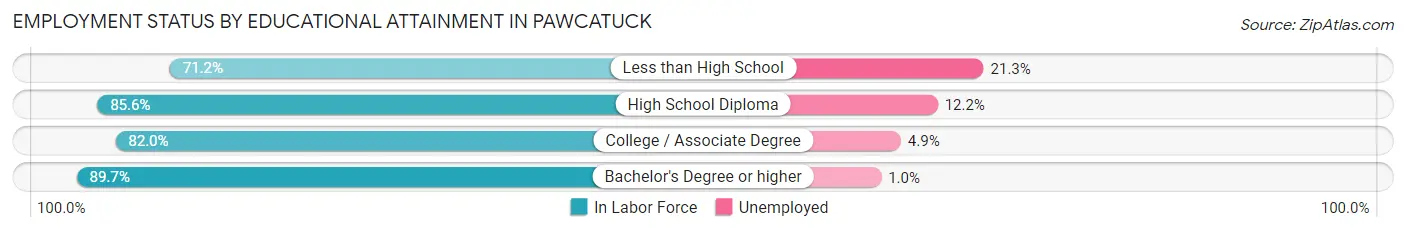
| Educational Attainment | In Labor Force | Unemployed |
| Less than High School | 47 (71.2%) | 14 (21.3%) |
| High School Diploma | 711 (85.6%) | 101 (12.2%) |
| College / Associate Degree | 715 (82.0%) | 43 (4.9%) |
| Bachelor's Degree or higher | 1,067 (89.7%) | 12 (1.0%) |
| Total | 2,542 (85.9%) | 166 (5.6%) |
Employment Occupations by Sex in Pawcatuck
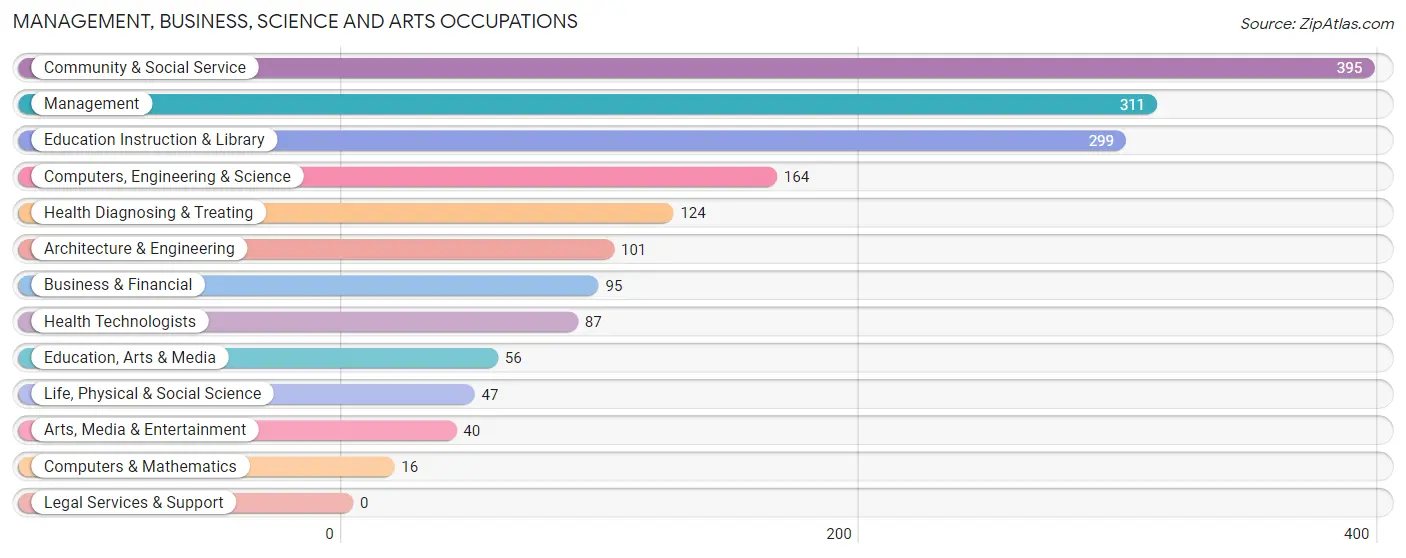
Management, Business, Science and Arts Occupations
The most common Management, Business, Science and Arts occupations in Pawcatuck are Community & Social Service (395 | 14.1%), Management (311 | 11.1%), Education Instruction & Library (299 | 10.7%), Computers, Engineering & Science (164 | 5.9%), and Health Diagnosing & Treating (124 | 4.4%).
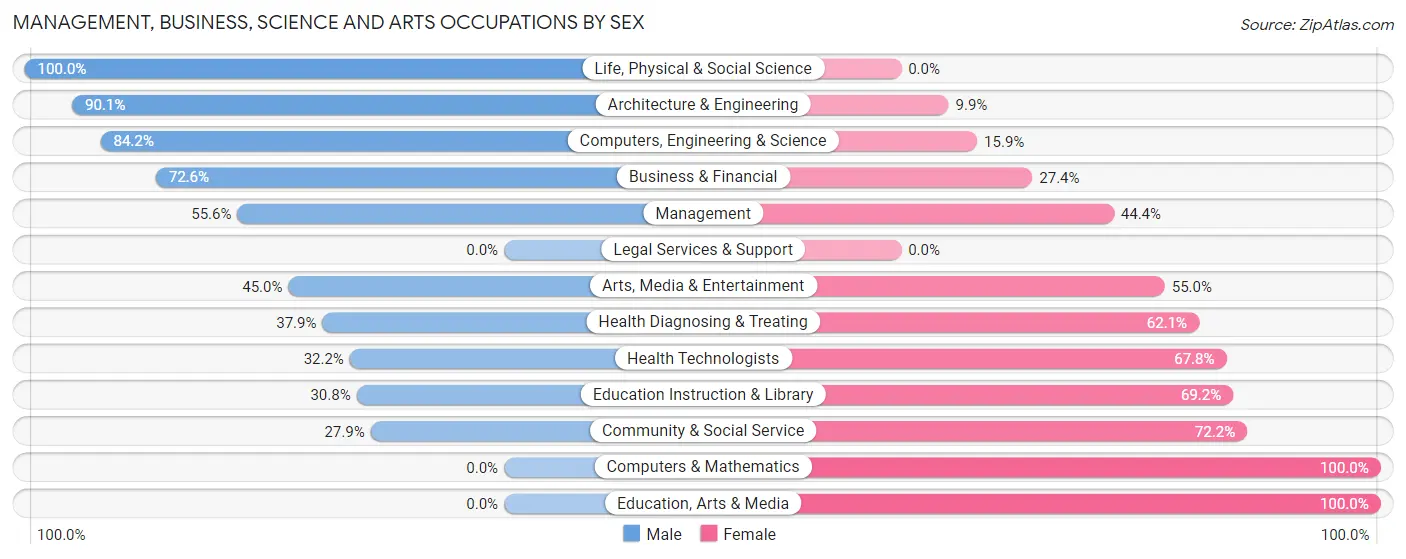
Management, Business, Science and Arts Occupations by Sex
Within the Management, Business, Science and Arts occupations in Pawcatuck, the most male-oriented occupations are Life, Physical & Social Science (100.0%), Architecture & Engineering (90.1%), and Computers, Engineering & Science (84.2%), while the most female-oriented occupations are Computers & Mathematics (100.0%), Education, Arts & Media (100.0%), and Community & Social Service (72.2%).
| Occupation | Male | Female |
| Management | 173 (55.6%) | 138 (44.4%) |
| Business & Financial | 69 (72.6%) | 26 (27.4%) |
| Computers, Engineering & Science | 138 (84.2%) | 26 (15.9%) |
| Computers & Mathematics | 0 (0.0%) | 16 (100.0%) |
| Architecture & Engineering | 91 (90.1%) | 10 (9.9%) |
| Life, Physical & Social Science | 47 (100.0%) | 0 (0.0%) |
| Community & Social Service | 110 (27.9%) | 285 (72.2%) |
| Education, Arts & Media | 0 (0.0%) | 56 (100.0%) |
| Legal Services & Support | 0 (0.0%) | 0 (0.0%) |
| Education Instruction & Library | 92 (30.8%) | 207 (69.2%) |
| Arts, Media & Entertainment | 18 (45.0%) | 22 (55.0%) |
| Health Diagnosing & Treating | 47 (37.9%) | 77 (62.1%) |
| Health Technologists | 28 (32.2%) | 59 (67.8%) |
| Total (Category) | 537 (49.3%) | 552 (50.7%) |
| Total (Overall) | 1,494 (53.5%) | 1,297 (46.5%) |
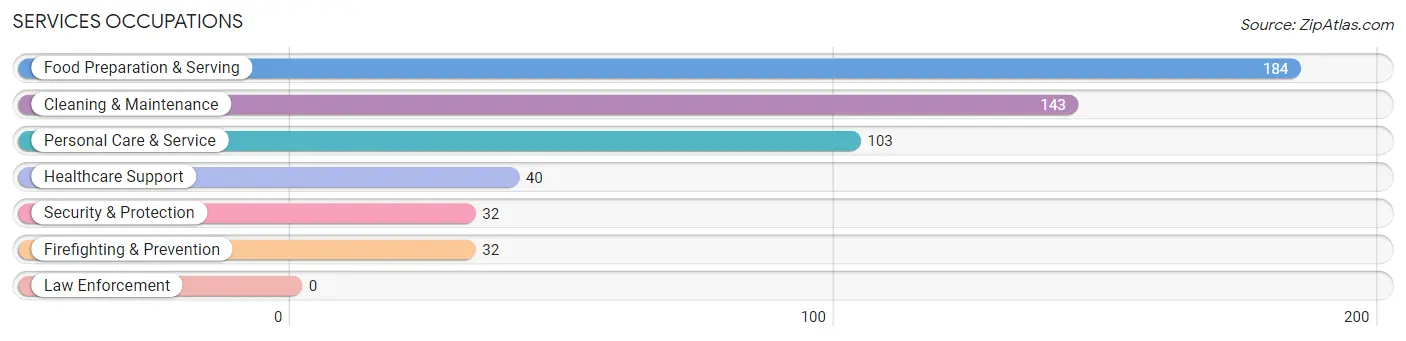
Services Occupations
The most common Services occupations in Pawcatuck are Food Preparation & Serving (184 | 6.6%), Cleaning & Maintenance (143 | 5.1%), Personal Care & Service (103 | 3.7%), Healthcare Support (40 | 1.4%), and Security & Protection (32 | 1.1%).
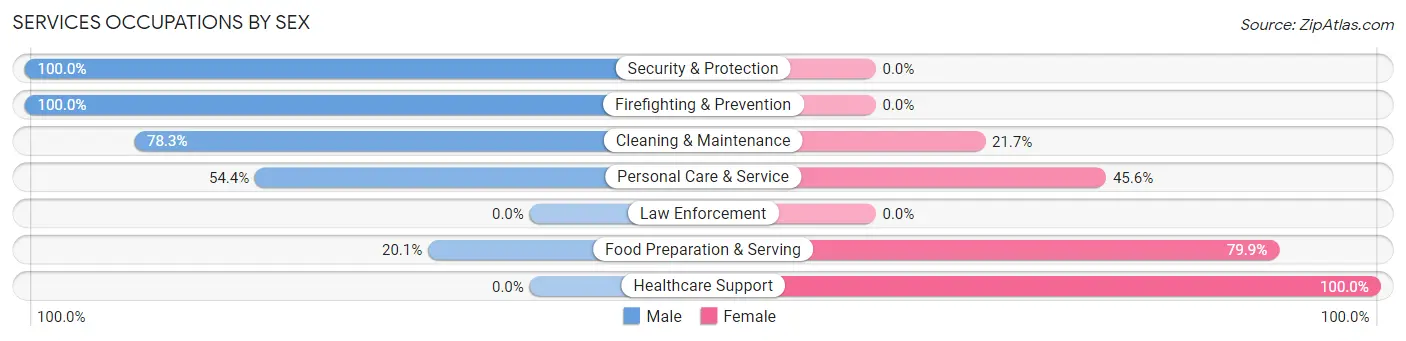
Services Occupations by Sex
Within the Services occupations in Pawcatuck, the most male-oriented occupations are Security & Protection (100.0%), Firefighting & Prevention (100.0%), and Cleaning & Maintenance (78.3%), while the most female-oriented occupations are Healthcare Support (100.0%), Food Preparation & Serving (79.9%), and Personal Care & Service (45.6%).
| Occupation | Male | Female |
| Healthcare Support | 0 (0.0%) | 40 (100.0%) |
| Security & Protection | 32 (100.0%) | 0 (0.0%) |
| Firefighting & Prevention | 32 (100.0%) | 0 (0.0%) |
| Law Enforcement | 0 (0.0%) | 0 (0.0%) |
| Food Preparation & Serving | 37 (20.1%) | 147 (79.9%) |
| Cleaning & Maintenance | 112 (78.3%) | 31 (21.7%) |
| Personal Care & Service | 56 (54.4%) | 47 (45.6%) |
| Total (Category) | 237 (47.2%) | 265 (52.8%) |
| Total (Overall) | 1,494 (53.5%) | 1,297 (46.5%) |
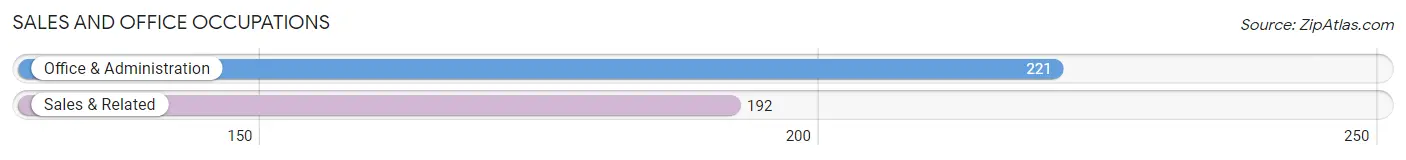
Sales and Office Occupations
The most common Sales and Office occupations in Pawcatuck are Office & Administration (221 | 7.9%), and Sales & Related (192 | 6.9%).
Sales and Office Occupations by Sex
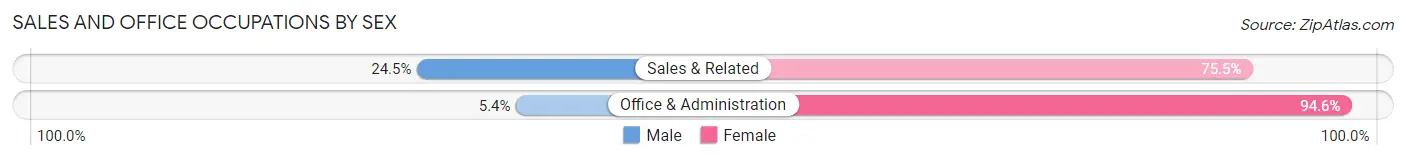
| Occupation | Male | Female |
| Sales & Related | 47 (24.5%) | 145 (75.5%) |
| Office & Administration | 12 (5.4%) | 209 (94.6%) |
| Total (Category) | 59 (14.3%) | 354 (85.7%) |
| Total (Overall) | 1,494 (53.5%) | 1,297 (46.5%) |
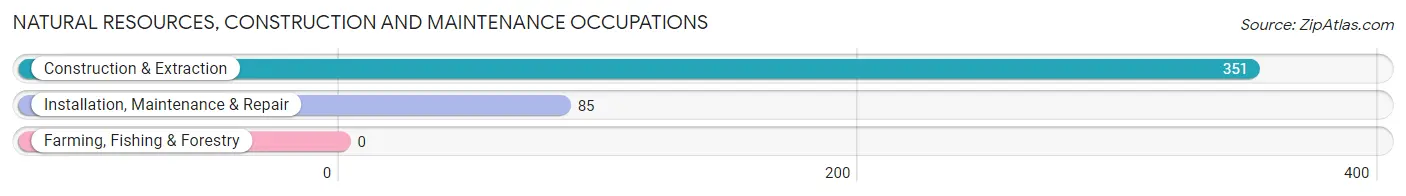
Natural Resources, Construction and Maintenance Occupations
The most common Natural Resources, Construction and Maintenance occupations in Pawcatuck are Construction & Extraction (351 | 12.6%), and Installation, Maintenance & Repair (85 | 3.0%).
Natural Resources, Construction and Maintenance Occupations by Sex
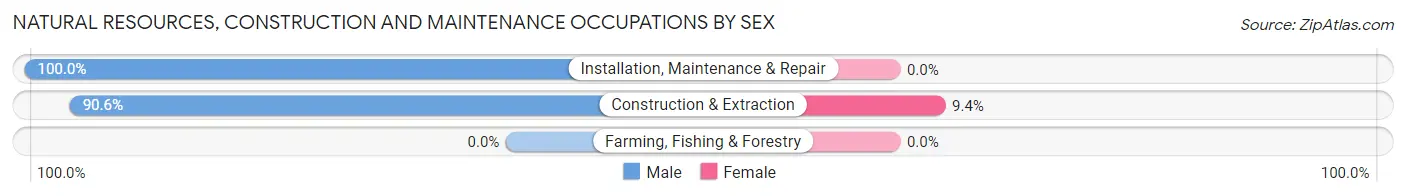
| Occupation | Male | Female |
| Farming, Fishing & Forestry | 0 (0.0%) | 0 (0.0%) |
| Construction & Extraction | 318 (90.6%) | 33 (9.4%) |
| Installation, Maintenance & Repair | 85 (100.0%) | 0 (0.0%) |
| Total (Category) | 403 (92.4%) | 33 (7.6%) |
| Total (Overall) | 1,494 (53.5%) | 1,297 (46.5%) |
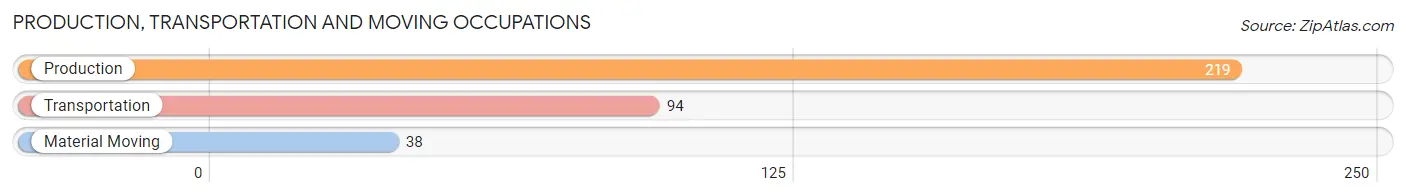
Production, Transportation and Moving Occupations
The most common Production, Transportation and Moving occupations in Pawcatuck are Production (219 | 7.9%), Transportation (94 | 3.4%), and Material Moving (38 | 1.4%).
Production, Transportation and Moving Occupations by Sex
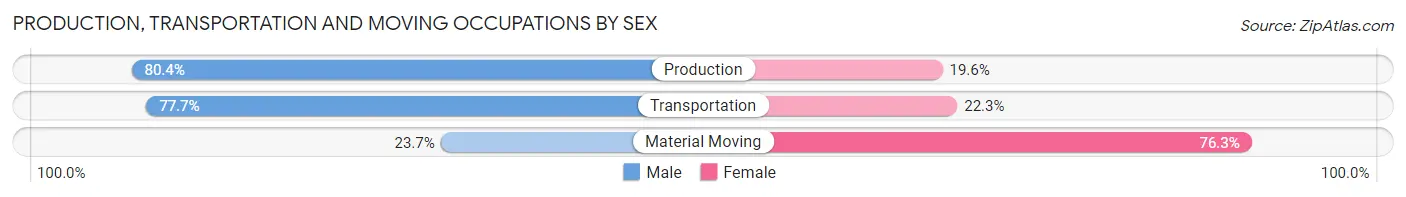
| Occupation | Male | Female |
| Production | 176 (80.4%) | 43 (19.6%) |
| Transportation | 73 (77.7%) | 21 (22.3%) |
| Material Moving | 9 (23.7%) | 29 (76.3%) |
| Total (Category) | 258 (73.5%) | 93 (26.5%) |
| Total (Overall) | 1,494 (53.5%) | 1,297 (46.5%) |
Employment Industries by Sex in Pawcatuck
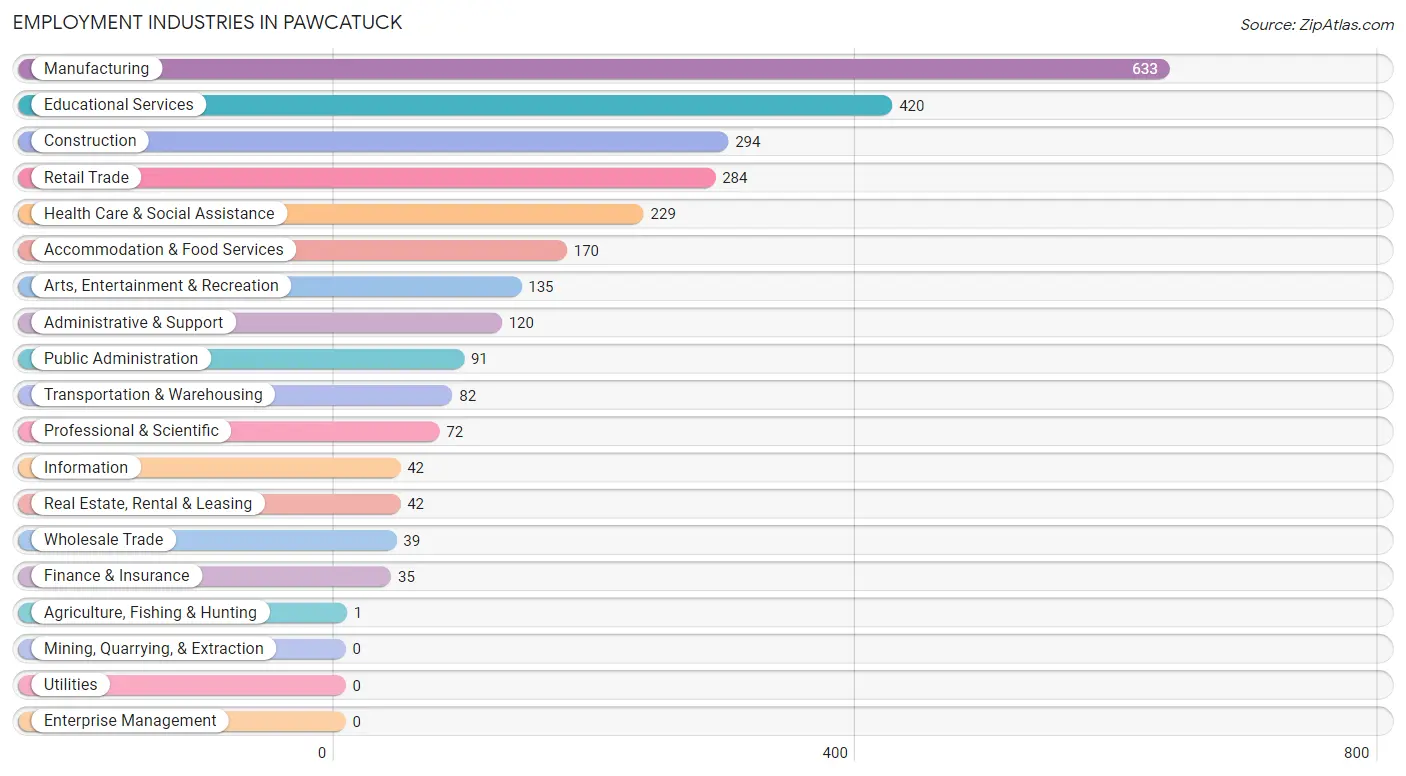
Employment Industries in Pawcatuck
The major employment industries in Pawcatuck include Manufacturing (633 | 22.7%), Educational Services (420 | 15.0%), Construction (294 | 10.5%), Retail Trade (284 | 10.2%), and Health Care & Social Assistance (229 | 8.2%).
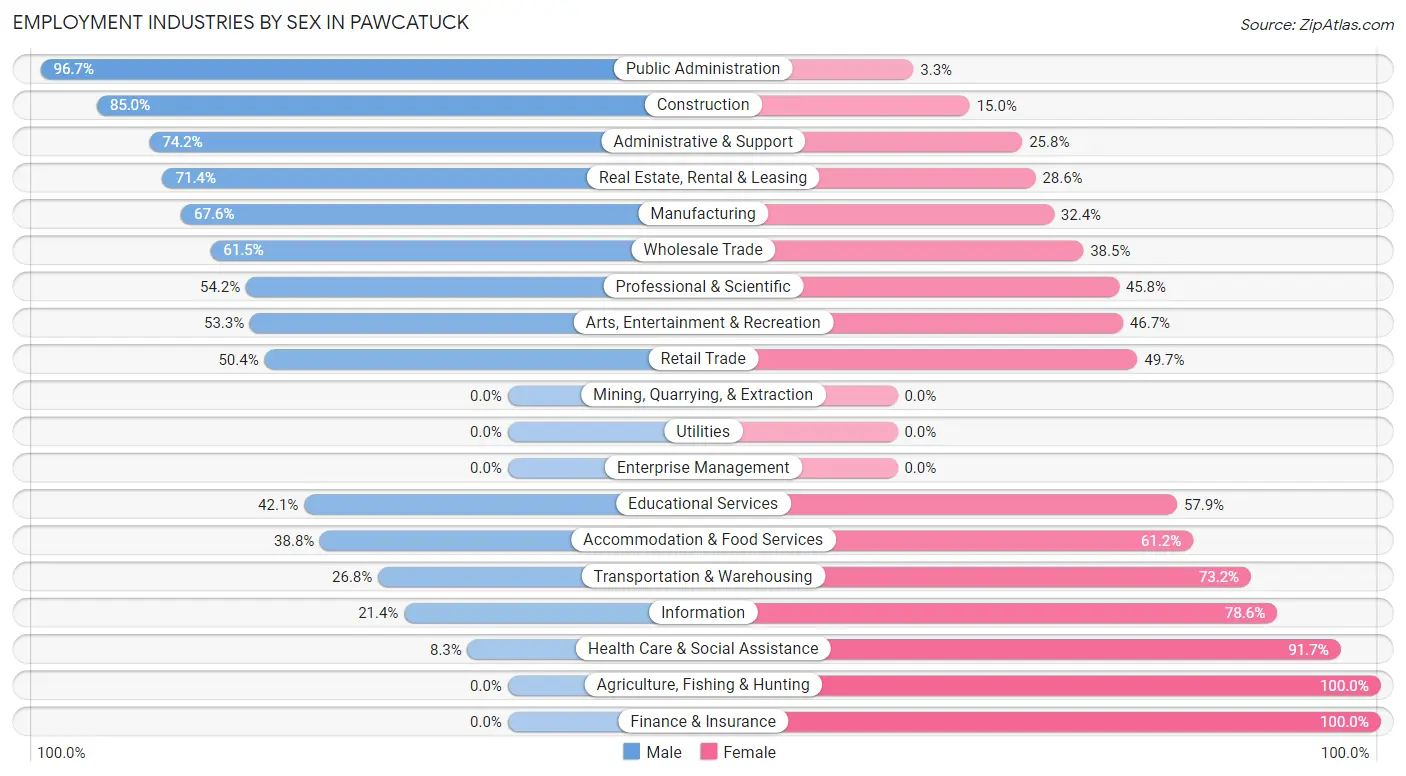
Employment Industries by Sex in Pawcatuck
The Pawcatuck industries that see more men than women are Public Administration (96.7%), Construction (85.0%), and Administrative & Support (74.2%), whereas the industries that tend to have a higher number of women are Agriculture, Fishing & Hunting (100.0%), Finance & Insurance (100.0%), and Health Care & Social Assistance (91.7%).
| Industry | Male | Female |
| Agriculture, Fishing & Hunting | 0 (0.0%) | 1 (100.0%) |
| Mining, Quarrying, & Extraction | 0 (0.0%) | 0 (0.0%) |
| Construction | 250 (85.0%) | 44 (15.0%) |
| Manufacturing | 428 (67.6%) | 205 (32.4%) |
| Wholesale Trade | 24 (61.5%) | 15 (38.5%) |
| Retail Trade | 143 (50.3%) | 141 (49.6%) |
| Transportation & Warehousing | 22 (26.8%) | 60 (73.2%) |
| Utilities | 0 (0.0%) | 0 (0.0%) |
| Information | 9 (21.4%) | 33 (78.6%) |
| Finance & Insurance | 0 (0.0%) | 35 (100.0%) |
| Real Estate, Rental & Leasing | 30 (71.4%) | 12 (28.6%) |
| Professional & Scientific | 39 (54.2%) | 33 (45.8%) |
| Enterprise Management | 0 (0.0%) | 0 (0.0%) |
| Administrative & Support | 89 (74.2%) | 31 (25.8%) |
| Educational Services | 177 (42.1%) | 243 (57.9%) |
| Health Care & Social Assistance | 19 (8.3%) | 210 (91.7%) |
| Arts, Entertainment & Recreation | 72 (53.3%) | 63 (46.7%) |
| Accommodation & Food Services | 66 (38.8%) | 104 (61.2%) |
| Public Administration | 88 (96.7%) | 3 (3.3%) |
| Total | 1,494 (53.5%) | 1,297 (46.5%) |
Education in Pawcatuck
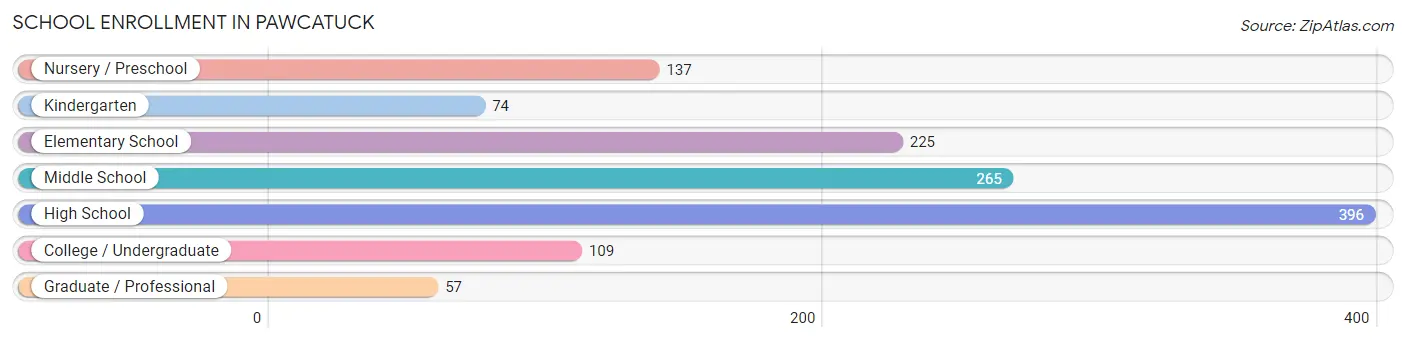
School Enrollment in Pawcatuck
The most common levels of schooling among the 1,263 students in Pawcatuck are high school (396 | 31.4%), middle school (265 | 21.0%), and elementary school (225 | 17.8%).
| School Level | # Students | % Students |
| Nursery / Preschool | 137 | 10.8% |
| Kindergarten | 74 | 5.9% |
| Elementary School | 225 | 17.8% |
| Middle School | 265 | 21.0% |
| High School | 396 | 31.4% |
| College / Undergraduate | 109 | 8.6% |
| Graduate / Professional | 57 | 4.5% |
| Total | 1,263 | 100.0% |
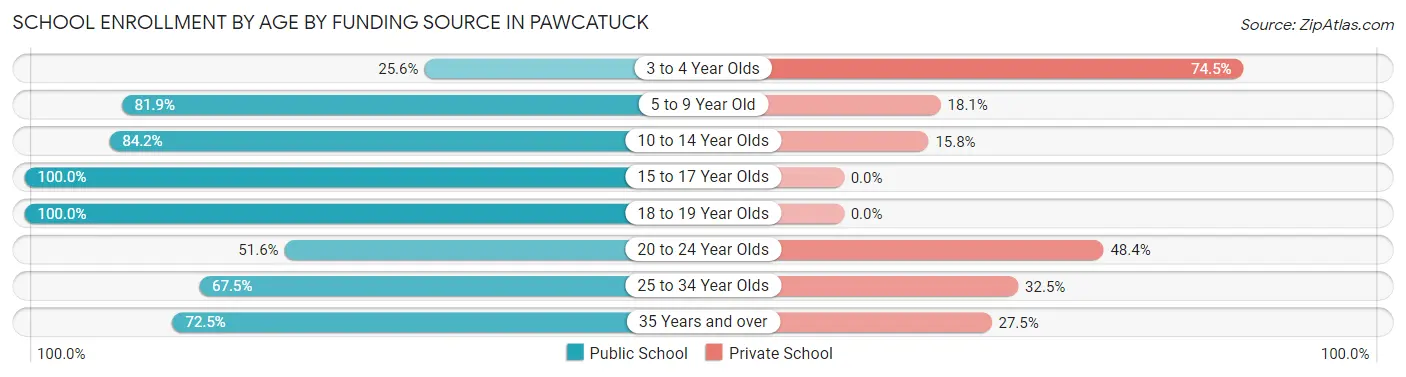
School Enrollment by Age by Funding Source in Pawcatuck
Out of a total of 1,263 students who are enrolled in schools in Pawcatuck, 275 (21.8%) attend a private institution, while the remaining 988 (78.2%) are enrolled in public schools. The age group of 3 to 4 year olds has the highest likelihood of being enrolled in private schools, with 102 (74.5% in the age bracket) enrolled. Conversely, the age group of 15 to 17 year olds has the lowest likelihood of being enrolled in a private school, with 165 (100.0% in the age bracket) attending a public institution.
| Age Bracket | Public School | Private School |
| 3 to 4 Year Olds | 35 (25.6%) | 102 (74.5%) |
| 5 to 9 Year Old | 245 (81.9%) | 54 (18.1%) |
| 10 to 14 Year Olds | 384 (84.2%) | 72 (15.8%) |
| 15 to 17 Year Olds | 165 (100.0%) | 0 (0.0%) |
| 18 to 19 Year Olds | 66 (100.0%) | 0 (0.0%) |
| 20 to 24 Year Olds | 16 (51.6%) | 15 (48.4%) |
| 25 to 34 Year Olds | 27 (67.5%) | 13 (32.5%) |
| 35 Years and over | 50 (72.5%) | 19 (27.5%) |
| Total | 988 (78.2%) | 275 (21.8%) |
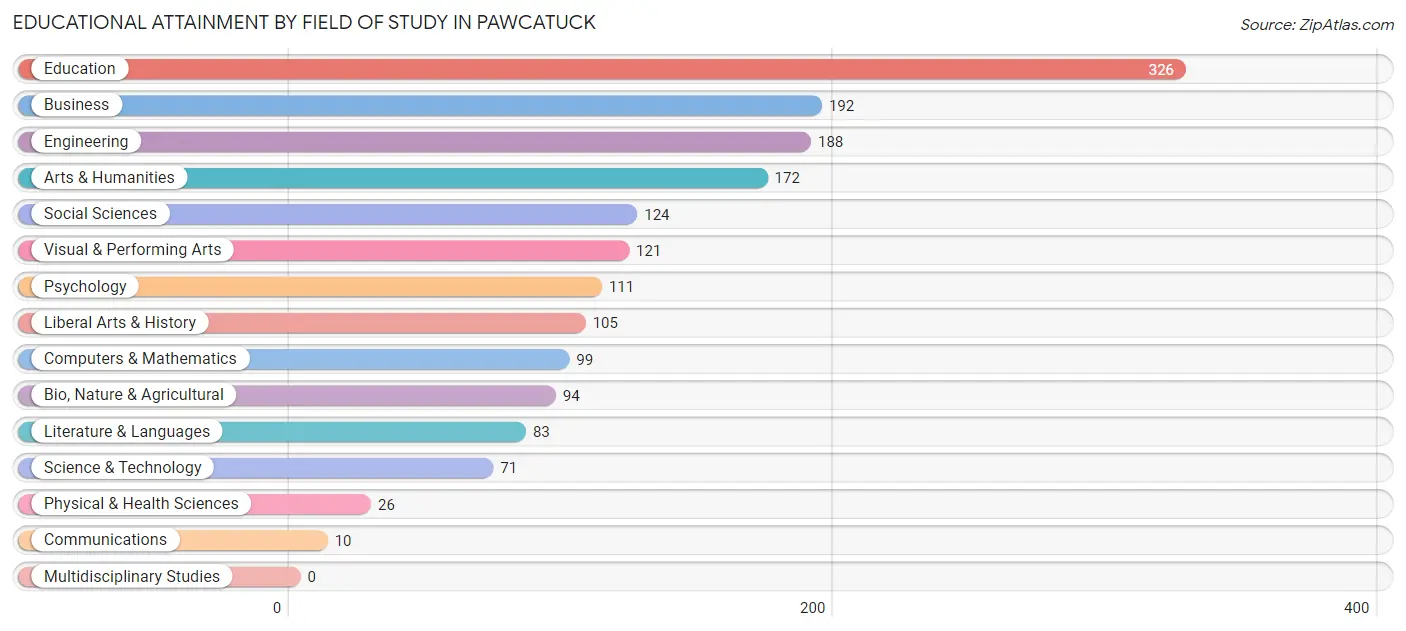
Educational Attainment by Field of Study in Pawcatuck
Education (326 | 18.9%), business (192 | 11.2%), engineering (188 | 10.9%), arts & humanities (172 | 10.0%), and social sciences (124 | 7.2%) are the most common fields of study among 1,722 individuals in Pawcatuck who have obtained a bachelor's degree or higher.
| Field of Study | # Graduates | % Graduates |
| Computers & Mathematics | 99 | 5.8% |
| Bio, Nature & Agricultural | 94 | 5.5% |
| Physical & Health Sciences | 26 | 1.5% |
| Psychology | 111 | 6.5% |
| Social Sciences | 124 | 7.2% |
| Engineering | 188 | 10.9% |
| Multidisciplinary Studies | 0 | 0.0% |
| Science & Technology | 71 | 4.1% |
| Business | 192 | 11.2% |
| Education | 326 | 18.9% |
| Literature & Languages | 83 | 4.8% |
| Liberal Arts & History | 105 | 6.1% |
| Visual & Performing Arts | 121 | 7.0% |
| Communications | 10 | 0.6% |
| Arts & Humanities | 172 | 10.0% |
| Total | 1,722 | 100.0% |
Transportation & Commute in Pawcatuck
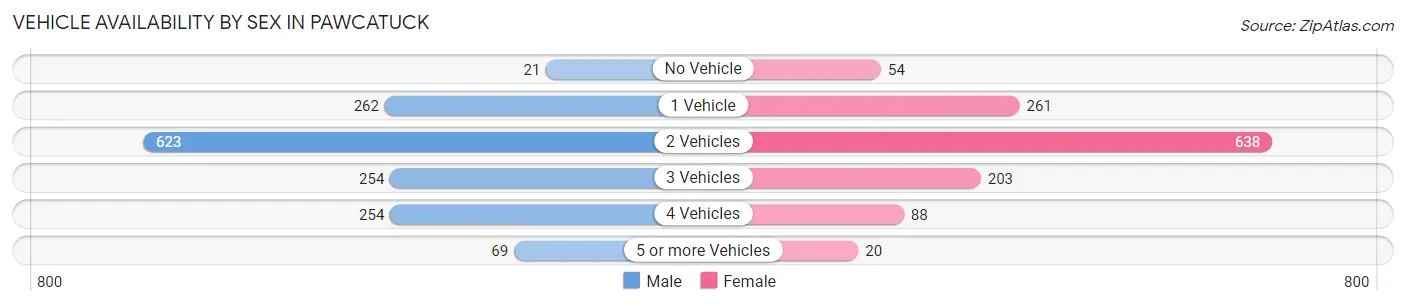
Vehicle Availability by Sex in Pawcatuck
The most prevalent vehicle ownership categories in Pawcatuck are males with 2 vehicles (623, accounting for 42.0%) and females with 2 vehicles (638, making up 49.3%).
| Vehicles Available | Male | Female |
| No Vehicle | 21 (1.4%) | 54 (4.3%) |
| 1 Vehicle | 262 (17.7%) | 261 (20.6%) |
| 2 Vehicles | 623 (42.0%) | 638 (50.5%) |
| 3 Vehicles | 254 (17.1%) | 203 (16.1%) |
| 4 Vehicles | 254 (17.1%) | 88 (7.0%) |
| 5 or more Vehicles | 69 (4.6%) | 20 (1.6%) |
| Total | 1,483 (100.0%) | 1,264 (100.0%) |
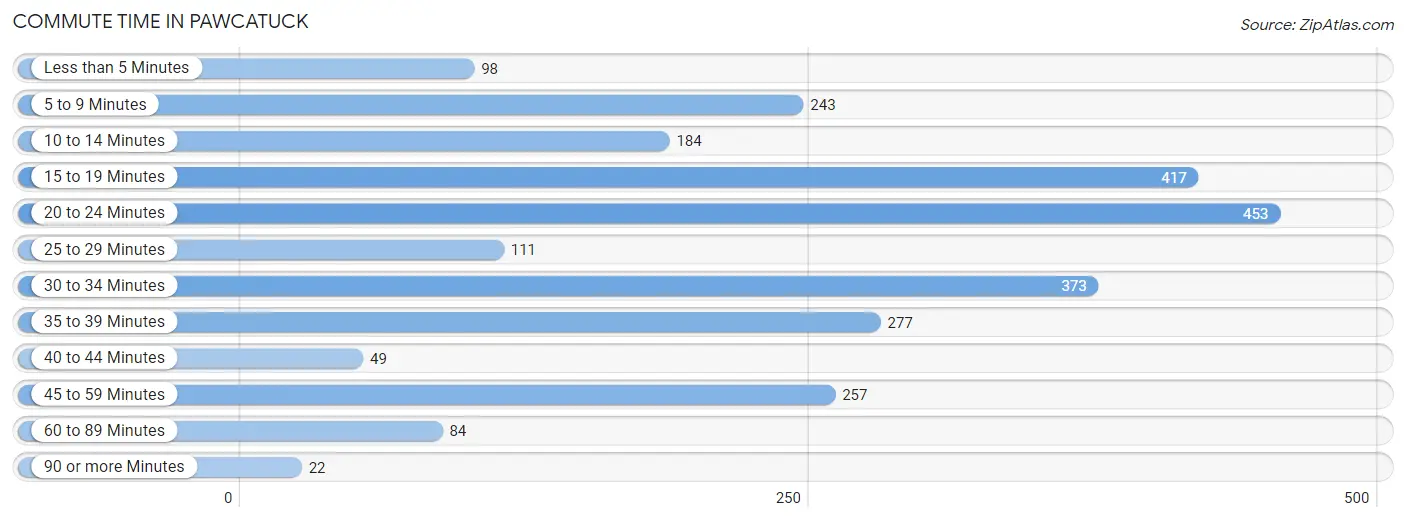
Commute Time in Pawcatuck
The most frequently occuring commute durations in Pawcatuck are 20 to 24 minutes (453 commuters, 17.6%), 15 to 19 minutes (417 commuters, 16.2%), and 30 to 34 minutes (373 commuters, 14.5%).
| Commute Time | # Commuters | % Commuters |
| Less than 5 Minutes | 98 | 3.8% |
| 5 to 9 Minutes | 243 | 9.5% |
| 10 to 14 Minutes | 184 | 7.2% |
| 15 to 19 Minutes | 417 | 16.2% |
| 20 to 24 Minutes | 453 | 17.6% |
| 25 to 29 Minutes | 111 | 4.3% |
| 30 to 34 Minutes | 373 | 14.5% |
| 35 to 39 Minutes | 277 | 10.8% |
| 40 to 44 Minutes | 49 | 1.9% |
| 45 to 59 Minutes | 257 | 10.0% |
| 60 to 89 Minutes | 84 | 3.3% |
| 90 or more Minutes | 22 | 0.9% |
Commute Time by Sex in Pawcatuck
The most common commute times in Pawcatuck are 20 to 24 minutes (346 commuters, 24.4%) for males and 15 to 19 minutes (227 commuters, 19.7%) for females.
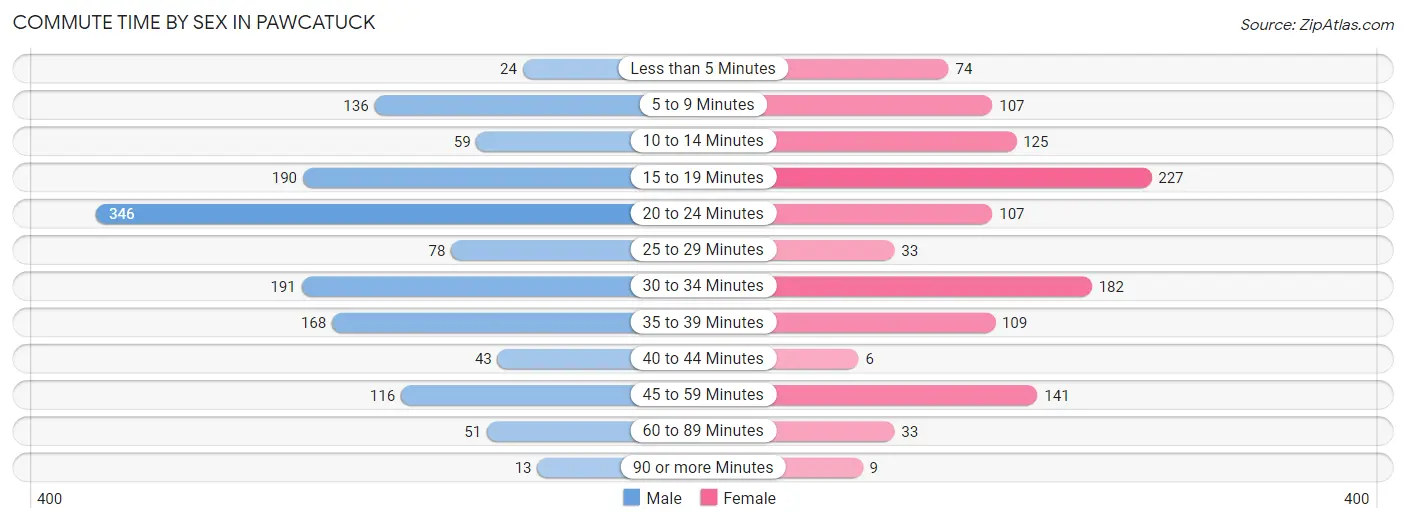
| Commute Time | Male | Female |
| Less than 5 Minutes | 24 (1.7%) | 74 (6.4%) |
| 5 to 9 Minutes | 136 (9.6%) | 107 (9.3%) |
| 10 to 14 Minutes | 59 (4.2%) | 125 (10.8%) |
| 15 to 19 Minutes | 190 (13.4%) | 227 (19.7%) |
| 20 to 24 Minutes | 346 (24.4%) | 107 (9.3%) |
| 25 to 29 Minutes | 78 (5.5%) | 33 (2.9%) |
| 30 to 34 Minutes | 191 (13.5%) | 182 (15.8%) |
| 35 to 39 Minutes | 168 (11.9%) | 109 (9.5%) |
| 40 to 44 Minutes | 43 (3.0%) | 6 (0.5%) |
| 45 to 59 Minutes | 116 (8.2%) | 141 (12.2%) |
| 60 to 89 Minutes | 51 (3.6%) | 33 (2.9%) |
| 90 or more Minutes | 13 (0.9%) | 9 (0.8%) |
Time of Departure to Work by Sex in Pawcatuck
The most frequent times of departure to work in Pawcatuck are 7:00 AM to 7:29 AM (260, 18.4%) for males and 6:00 AM to 6:29 AM (167, 14.5%) for females.
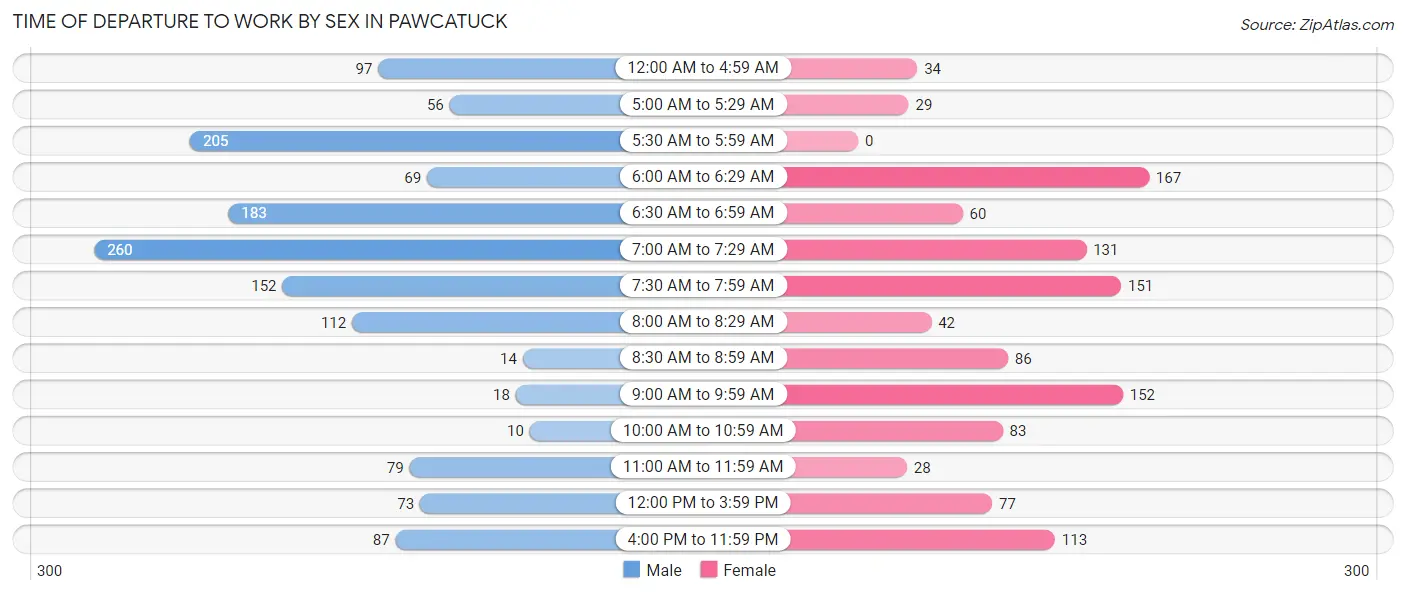
| Time of Departure | Male | Female |
| 12:00 AM to 4:59 AM | 97 (6.9%) | 34 (2.9%) |
| 5:00 AM to 5:29 AM | 56 (4.0%) | 29 (2.5%) |
| 5:30 AM to 5:59 AM | 205 (14.5%) | 0 (0.0%) |
| 6:00 AM to 6:29 AM | 69 (4.9%) | 167 (14.5%) |
| 6:30 AM to 6:59 AM | 183 (12.9%) | 60 (5.2%) |
| 7:00 AM to 7:29 AM | 260 (18.4%) | 131 (11.4%) |
| 7:30 AM to 7:59 AM | 152 (10.7%) | 151 (13.1%) |
| 8:00 AM to 8:29 AM | 112 (7.9%) | 42 (3.6%) |
| 8:30 AM to 8:59 AM | 14 (1.0%) | 86 (7.5%) |
| 9:00 AM to 9:59 AM | 18 (1.3%) | 152 (13.2%) |
| 10:00 AM to 10:59 AM | 10 (0.7%) | 83 (7.2%) |
| 11:00 AM to 11:59 AM | 79 (5.6%) | 28 (2.4%) |
| 12:00 PM to 3:59 PM | 73 (5.2%) | 77 (6.7%) |
| 4:00 PM to 11:59 PM | 87 (6.1%) | 113 (9.8%) |
| Total | 1,415 (100.0%) | 1,153 (100.0%) |
Housing Occupancy in Pawcatuck
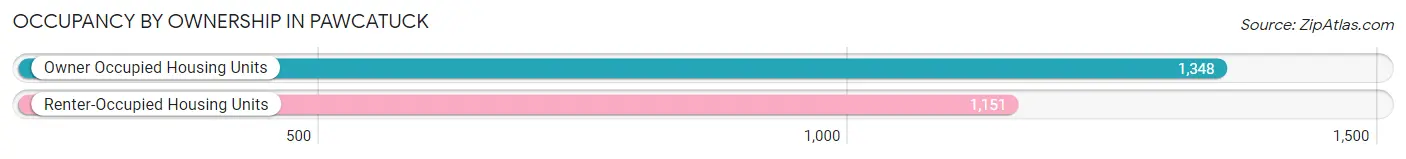
Occupancy by Ownership in Pawcatuck
Of the total 2,499 dwellings in Pawcatuck, owner-occupied units account for 1,348 (53.9%), while renter-occupied units make up 1,151 (46.1%).
| Occupancy | # Housing Units | % Housing Units |
| Owner Occupied Housing Units | 1,348 | 53.9% |
| Renter-Occupied Housing Units | 1,151 | 46.1% |
| Total Occupied Housing Units | 2,499 | 100.0% |
Occupancy by Household Size in Pawcatuck
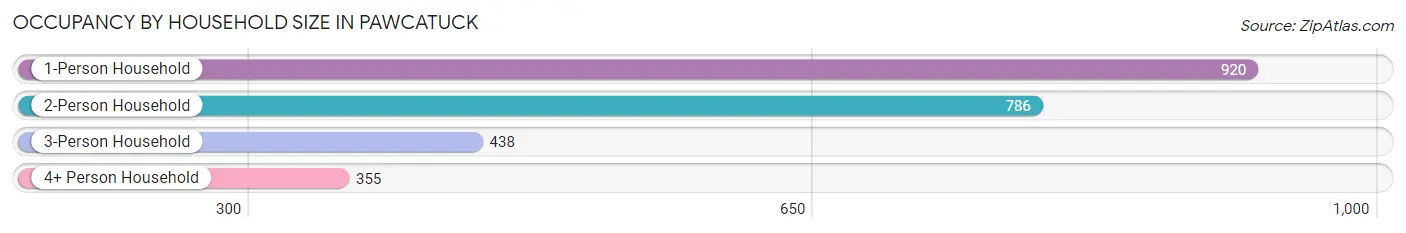
| Household Size | # Housing Units | % Housing Units |
| 1-Person Household | 920 | 36.8% |
| 2-Person Household | 786 | 31.5% |
| 3-Person Household | 438 | 17.5% |
| 4+ Person Household | 355 | 14.2% |
| Total Housing Units | 2,499 | 100.0% |
Occupancy by Ownership by Household Size in Pawcatuck
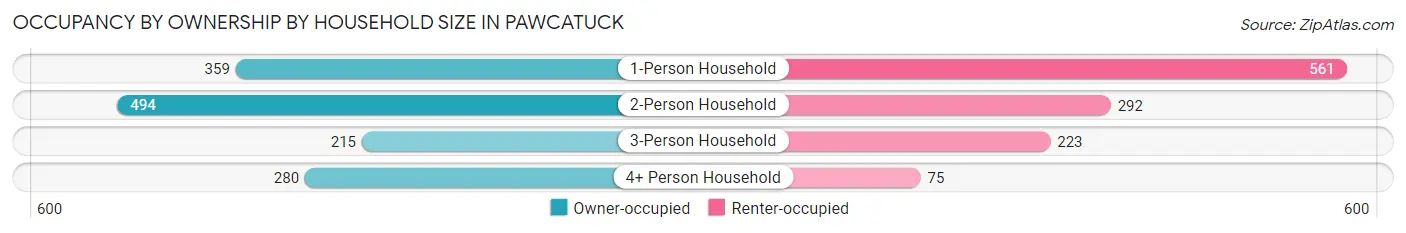
| Household Size | Owner-occupied | Renter-occupied |
| 1-Person Household | 359 (39.0%) | 561 (61.0%) |
| 2-Person Household | 494 (62.8%) | 292 (37.1%) |
| 3-Person Household | 215 (49.1%) | 223 (50.9%) |
| 4+ Person Household | 280 (78.9%) | 75 (21.1%) |
| Total Housing Units | 1,348 (53.9%) | 1,151 (46.1%) |
Occupancy by Educational Attainment in Pawcatuck
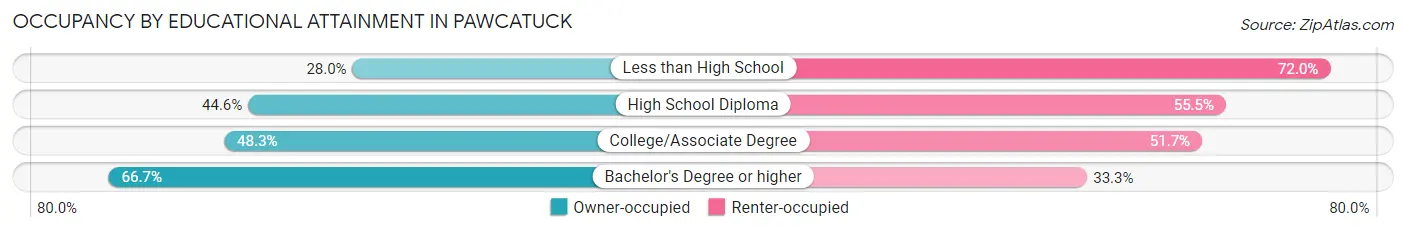
| Household Size | Owner-occupied | Renter-occupied |
| Less than High School | 21 (28.0%) | 54 (72.0%) |
| High School Diploma | 315 (44.6%) | 392 (55.4%) |
| College/Associate Degree | 350 (48.3%) | 374 (51.7%) |
| Bachelor's Degree or higher | 662 (66.7%) | 331 (33.3%) |
Occupancy by Age of Householder in Pawcatuck
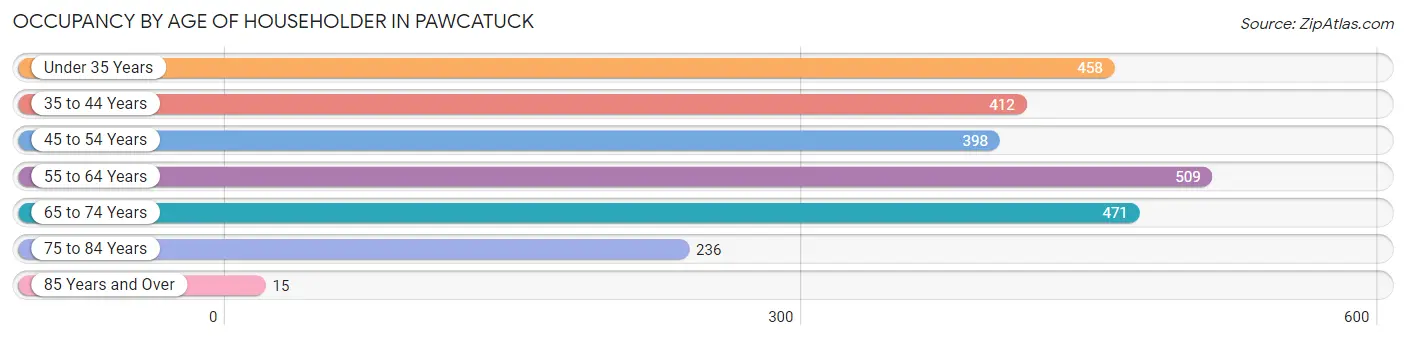
| Age Bracket | # Households | % Households |
| Under 35 Years | 458 | 18.3% |
| 35 to 44 Years | 412 | 16.5% |
| 45 to 54 Years | 398 | 15.9% |
| 55 to 64 Years | 509 | 20.4% |
| 65 to 74 Years | 471 | 18.9% |
| 75 to 84 Years | 236 | 9.4% |
| 85 Years and Over | 15 | 0.6% |
| Total | 2,499 | 100.0% |
Housing Finances in Pawcatuck
Median Income by Occupancy in Pawcatuck
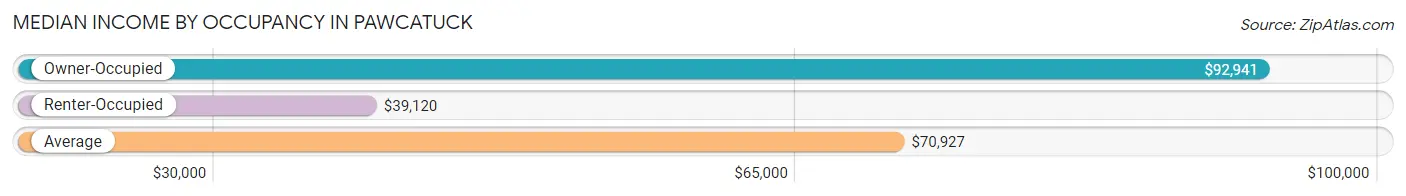
| Occupancy Type | # Households | Median Income |
| Owner-Occupied | 1,348 (53.9%) | $92,941 |
| Renter-Occupied | 1,151 (46.1%) | $39,120 |
| Average | 2,499 (100.0%) | $70,927 |
Occupancy by Householder Income Bracket in Pawcatuck
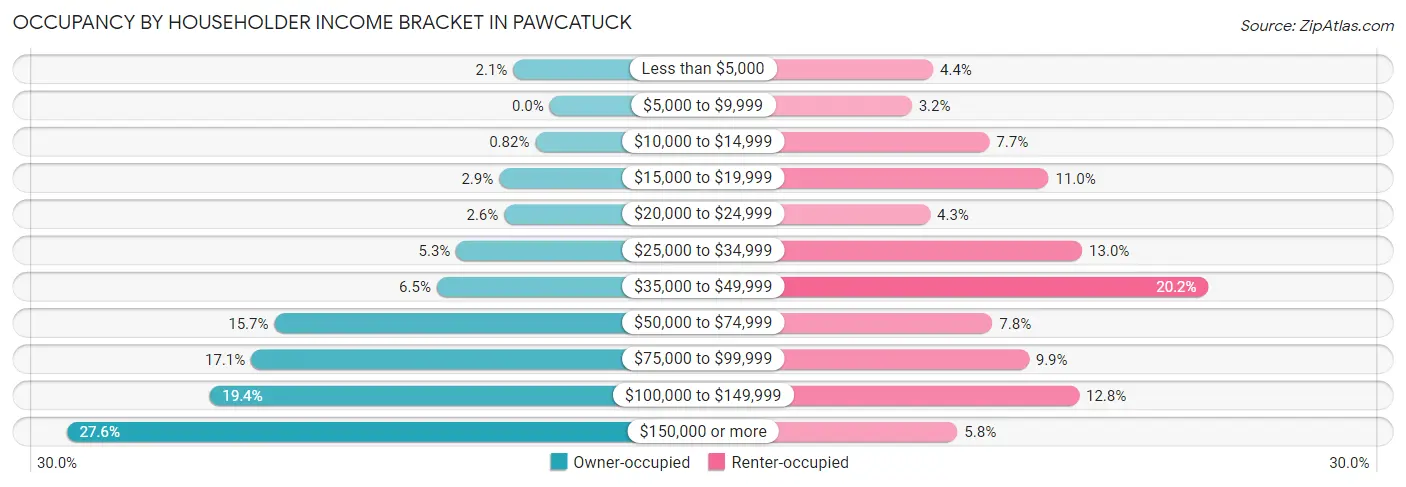
| Income Bracket | Owner-occupied | Renter-occupied |
| Less than $5,000 | 28 (2.1%) | 51 (4.4%) |
| $5,000 to $9,999 | 0 (0.0%) | 37 (3.2%) |
| $10,000 to $14,999 | 11 (0.8%) | 88 (7.6%) |
| $15,000 to $19,999 | 39 (2.9%) | 127 (11.0%) |
| $20,000 to $24,999 | 35 (2.6%) | 49 (4.3%) |
| $25,000 to $34,999 | 72 (5.3%) | 149 (13.0%) |
| $35,000 to $49,999 | 87 (6.5%) | 232 (20.2%) |
| $50,000 to $74,999 | 212 (15.7%) | 90 (7.8%) |
| $75,000 to $99,999 | 230 (17.1%) | 114 (9.9%) |
| $100,000 to $149,999 | 262 (19.4%) | 147 (12.8%) |
| $150,000 or more | 372 (27.6%) | 67 (5.8%) |
| Total | 1,348 (100.0%) | 1,151 (100.0%) |
Monthly Housing Cost Tiers in Pawcatuck
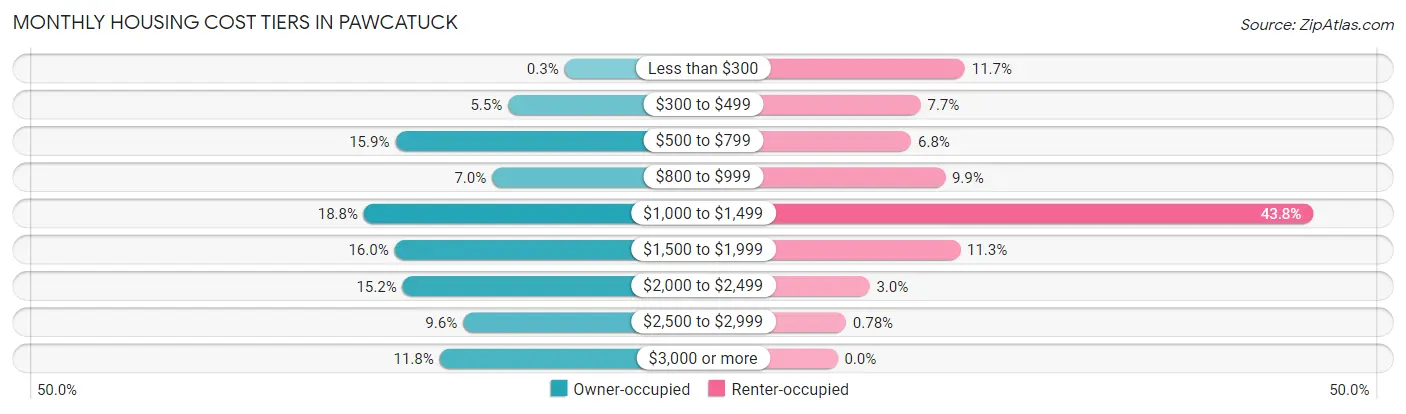
| Monthly Cost | Owner-occupied | Renter-occupied |
| Less than $300 | 4 (0.3%) | 135 (11.7%) |
| $300 to $499 | 74 (5.5%) | 88 (7.6%) |
| $500 to $799 | 214 (15.9%) | 78 (6.8%) |
| $800 to $999 | 94 (7.0%) | 114 (9.9%) |
| $1,000 to $1,499 | 253 (18.8%) | 504 (43.8%) |
| $1,500 to $1,999 | 215 (16.0%) | 130 (11.3%) |
| $2,000 to $2,499 | 205 (15.2%) | 34 (2.9%) |
| $2,500 to $2,999 | 130 (9.6%) | 9 (0.8%) |
| $3,000 or more | 159 (11.8%) | 0 (0.0%) |
| Total | 1,348 (100.0%) | 1,151 (100.0%) |
Physical Housing Characteristics in Pawcatuck
Housing Structures in Pawcatuck
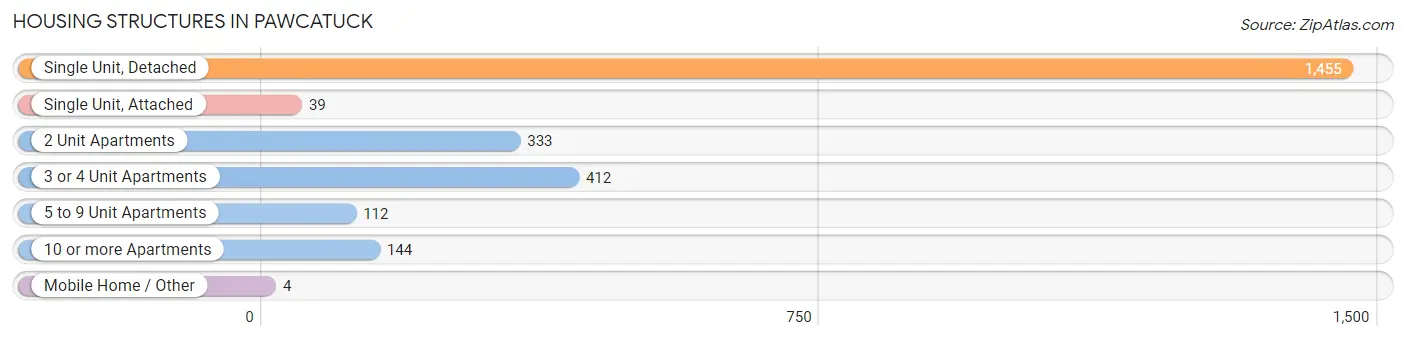
| Structure Type | # Housing Units | % Housing Units |
| Single Unit, Detached | 1,455 | 58.2% |
| Single Unit, Attached | 39 | 1.6% |
| 2 Unit Apartments | 333 | 13.3% |
| 3 or 4 Unit Apartments | 412 | 16.5% |
| 5 to 9 Unit Apartments | 112 | 4.5% |
| 10 or more Apartments | 144 | 5.8% |
| Mobile Home / Other | 4 | 0.2% |
| Total | 2,499 | 100.0% |
Housing Structures by Occupancy in Pawcatuck
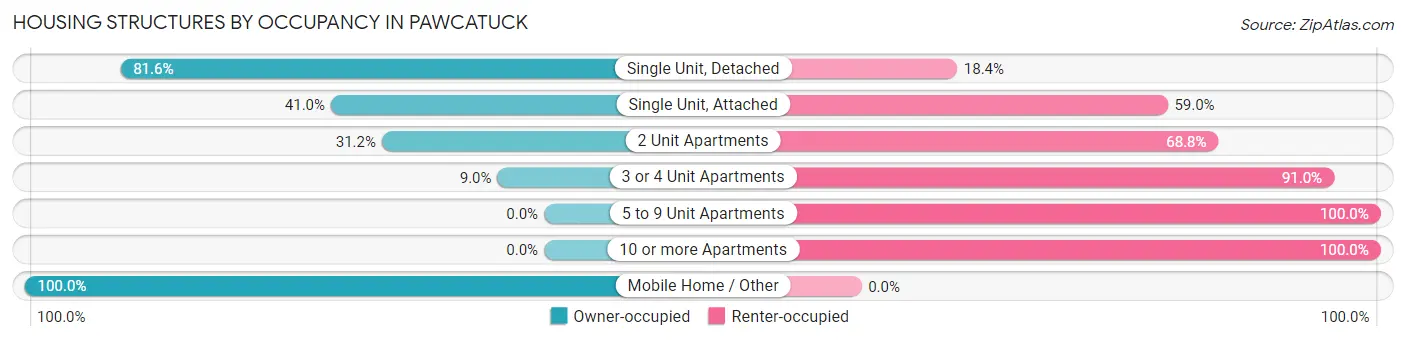
| Structure Type | Owner-occupied | Renter-occupied |
| Single Unit, Detached | 1,187 (81.6%) | 268 (18.4%) |
| Single Unit, Attached | 16 (41.0%) | 23 (59.0%) |
| 2 Unit Apartments | 104 (31.2%) | 229 (68.8%) |
| 3 or 4 Unit Apartments | 37 (9.0%) | 375 (91.0%) |
| 5 to 9 Unit Apartments | 0 (0.0%) | 112 (100.0%) |
| 10 or more Apartments | 0 (0.0%) | 144 (100.0%) |
| Mobile Home / Other | 4 (100.0%) | 0 (0.0%) |
| Total | 1,348 (53.9%) | 1,151 (46.1%) |
Housing Structures by Number of Rooms in Pawcatuck
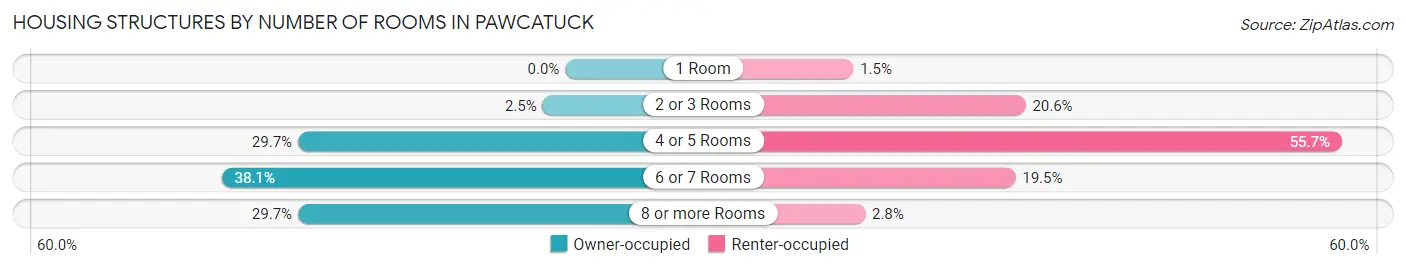
| Number of Rooms | Owner-occupied | Renter-occupied |
| 1 Room | 0 (0.0%) | 17 (1.5%) |
| 2 or 3 Rooms | 34 (2.5%) | 237 (20.6%) |
| 4 or 5 Rooms | 400 (29.7%) | 641 (55.7%) |
| 6 or 7 Rooms | 514 (38.1%) | 224 (19.5%) |
| 8 or more Rooms | 400 (29.7%) | 32 (2.8%) |
| Total | 1,348 (100.0%) | 1,151 (100.0%) |
Housing Structure by Heating Type in Pawcatuck
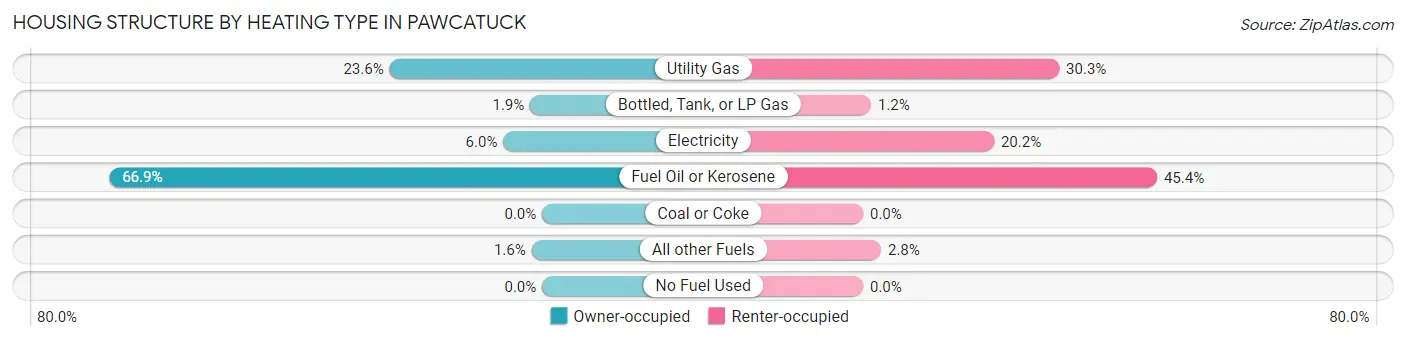
| Heating Type | Owner-occupied | Renter-occupied |
| Utility Gas | 318 (23.6%) | 349 (30.3%) |
| Bottled, Tank, or LP Gas | 25 (1.8%) | 14 (1.2%) |
| Electricity | 81 (6.0%) | 233 (20.2%) |
| Fuel Oil or Kerosene | 902 (66.9%) | 523 (45.4%) |
| Coal or Coke | 0 (0.0%) | 0 (0.0%) |
| All other Fuels | 22 (1.6%) | 32 (2.8%) |
| No Fuel Used | 0 (0.0%) | 0 (0.0%) |
| Total | 1,348 (100.0%) | 1,151 (100.0%) |
Household Vehicle Usage in Pawcatuck
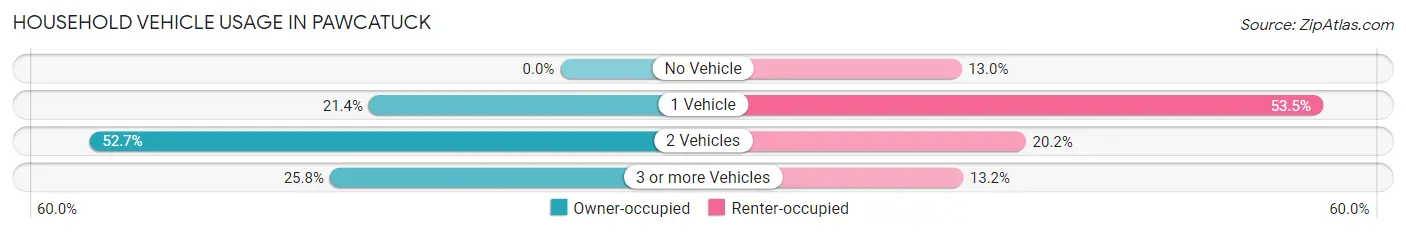
| Vehicles per Household | Owner-occupied | Renter-occupied |
| No Vehicle | 0 (0.0%) | 150 (13.0%) |
| 1 Vehicle | 289 (21.4%) | 616 (53.5%) |
| 2 Vehicles | 711 (52.7%) | 233 (20.2%) |
| 3 or more Vehicles | 348 (25.8%) | 152 (13.2%) |
| Total | 1,348 (100.0%) | 1,151 (100.0%) |
Real Estate & Mortgages in Pawcatuck
Real Estate and Mortgage Overview in Pawcatuck
| Characteristic | Without Mortgage | With Mortgage |
| Housing Units | 453 | 895 |
| Median Property Value | $289,500 | $326,100 |
| Median Household Income | $71,492 | $325 |
| Monthly Housing Costs | $762 | $124 |
| Real Estate Taxes | $3,702 | $24 |
Property Value by Mortgage Status in Pawcatuck
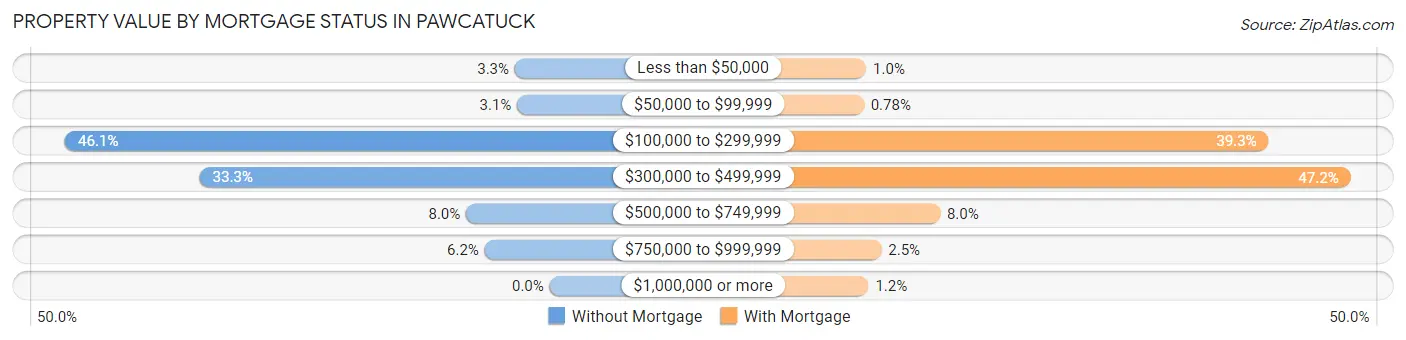
| Property Value | Without Mortgage | With Mortgage |
| Less than $50,000 | 15 (3.3%) | 9 (1.0%) |
| $50,000 to $99,999 | 14 (3.1%) | 7 (0.8%) |
| $100,000 to $299,999 | 209 (46.1%) | 352 (39.3%) |
| $300,000 to $499,999 | 151 (33.3%) | 422 (47.1%) |
| $500,000 to $749,999 | 36 (8.0%) | 72 (8.0%) |
| $750,000 to $999,999 | 28 (6.2%) | 22 (2.5%) |
| $1,000,000 or more | 0 (0.0%) | 11 (1.2%) |
| Total | 453 (100.0%) | 895 (100.0%) |
Household Income by Mortgage Status in Pawcatuck
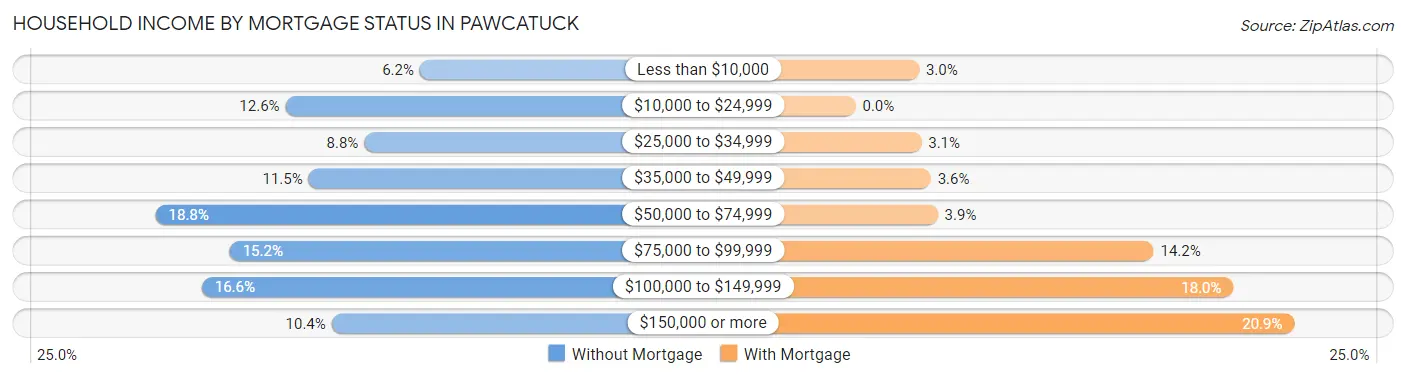
| Household Income | Without Mortgage | With Mortgage |
| Less than $10,000 | 28 (6.2%) | 27 (3.0%) |
| $10,000 to $24,999 | 57 (12.6%) | 0 (0.0%) |
| $25,000 to $34,999 | 40 (8.8%) | 28 (3.1%) |
| $35,000 to $49,999 | 52 (11.5%) | 32 (3.6%) |
| $50,000 to $74,999 | 85 (18.8%) | 35 (3.9%) |
| $75,000 to $99,999 | 69 (15.2%) | 127 (14.2%) |
| $100,000 to $149,999 | 75 (16.6%) | 161 (18.0%) |
| $150,000 or more | 47 (10.4%) | 187 (20.9%) |
| Total | 453 (100.0%) | 895 (100.0%) |
Property Value to Household Income Ratio in Pawcatuck
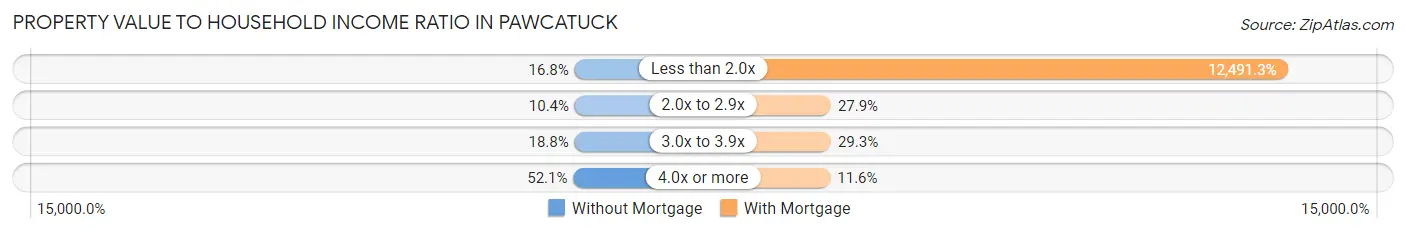
| Value-to-Income Ratio | Without Mortgage | With Mortgage |
| Less than 2.0x | 76 (16.8%) | 111,797 (12,491.3%) |
| 2.0x to 2.9x | 47 (10.4%) | 250 (27.9%) |
| 3.0x to 3.9x | 85 (18.8%) | 262 (29.3%) |
| 4.0x or more | 236 (52.1%) | 104 (11.6%) |
| Total | 453 (100.0%) | 895 (100.0%) |
Real Estate Taxes by Mortgage Status in Pawcatuck
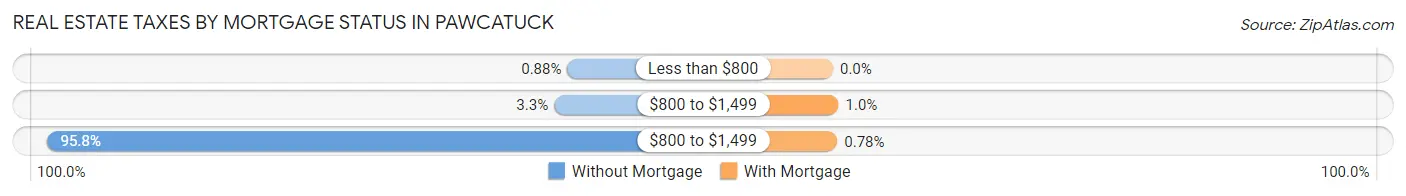
| Property Taxes | Without Mortgage | With Mortgage |
| Less than $800 | 4 (0.9%) | 0 (0.0%) |
| $800 to $1,499 | 15 (3.3%) | 9 (1.0%) |
| $800 to $1,499 | 434 (95.8%) | 7 (0.8%) |
| Total | 453 (100.0%) | 895 (100.0%) |
Health & Disability in Pawcatuck
Health Insurance Coverage by Age in Pawcatuck
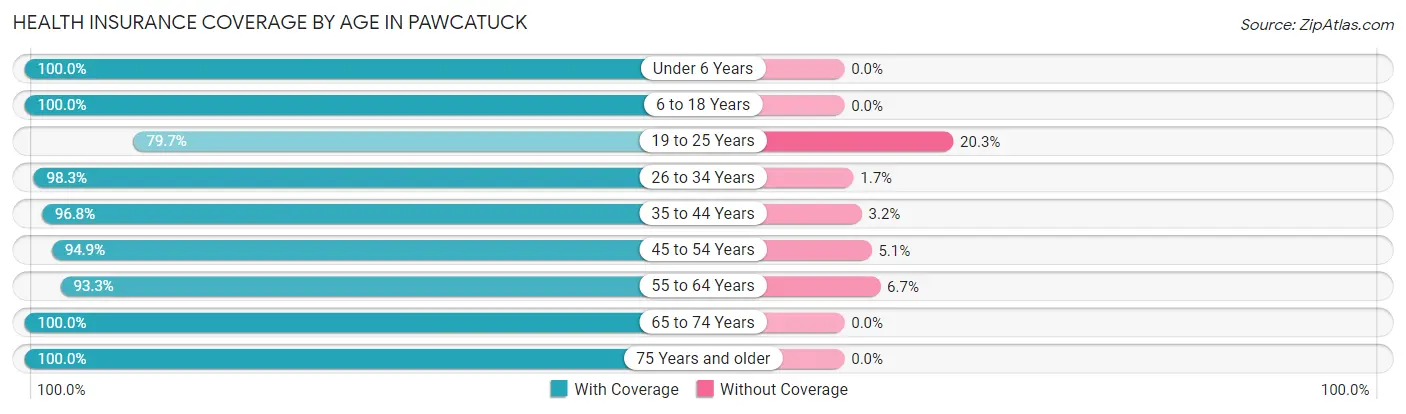
| Age Bracket | With Coverage | Without Coverage |
| Under 6 Years | 447 (100.0%) | 0 (0.0%) |
| 6 to 18 Years | 916 (100.0%) | 0 (0.0%) |
| 19 to 25 Years | 161 (79.7%) | 41 (20.3%) |
| 26 to 34 Years | 580 (98.3%) | 10 (1.7%) |
| 35 to 44 Years | 629 (96.8%) | 21 (3.2%) |
| 45 to 54 Years | 805 (94.9%) | 43 (5.1%) |
| 55 to 64 Years | 753 (93.3%) | 54 (6.7%) |
| 65 to 74 Years | 664 (100.0%) | 0 (0.0%) |
| 75 Years and older | 405 (100.0%) | 0 (0.0%) |
| Total | 5,360 (96.9%) | 169 (3.1%) |
Health Insurance Coverage by Citizenship Status in Pawcatuck
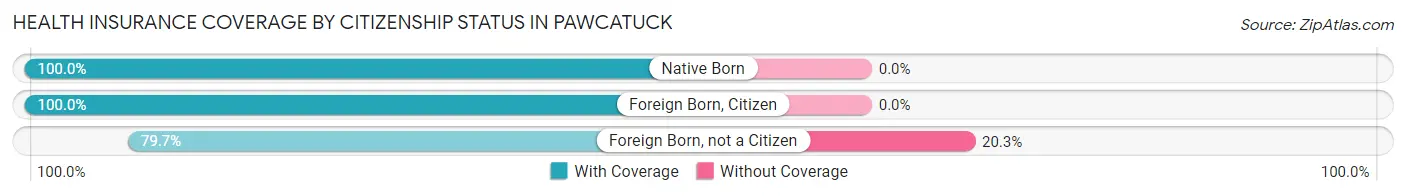
| Citizenship Status | With Coverage | Without Coverage |
| Native Born | 447 (100.0%) | 0 (0.0%) |
| Foreign Born, Citizen | 916 (100.0%) | 0 (0.0%) |
| Foreign Born, not a Citizen | 161 (79.7%) | 41 (20.3%) |
Health Insurance Coverage by Household Income in Pawcatuck
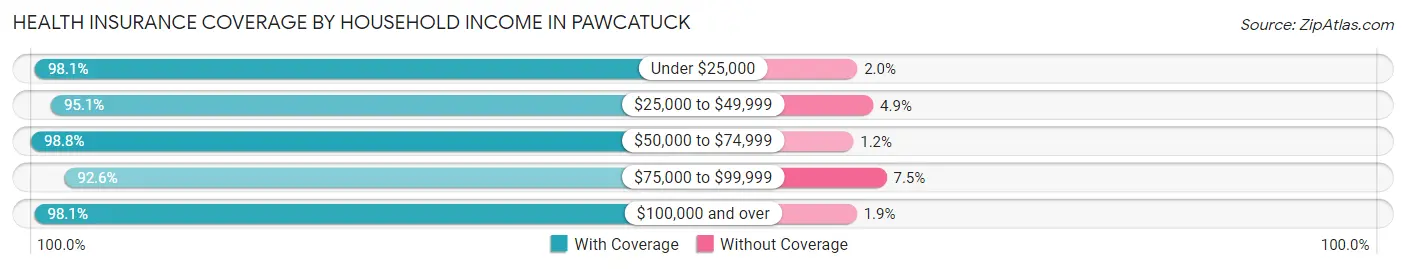
| Household Income | With Coverage | Without Coverage |
| Under $25,000 | 703 (98.1%) | 14 (1.9%) |
| $25,000 to $49,999 | 827 (95.1%) | 43 (4.9%) |
| $50,000 to $74,999 | 648 (98.8%) | 8 (1.2%) |
| $75,000 to $99,999 | 708 (92.5%) | 57 (7.4%) |
| $100,000 and over | 2,474 (98.1%) | 47 (1.9%) |
Public vs Private Health Insurance Coverage by Age in Pawcatuck
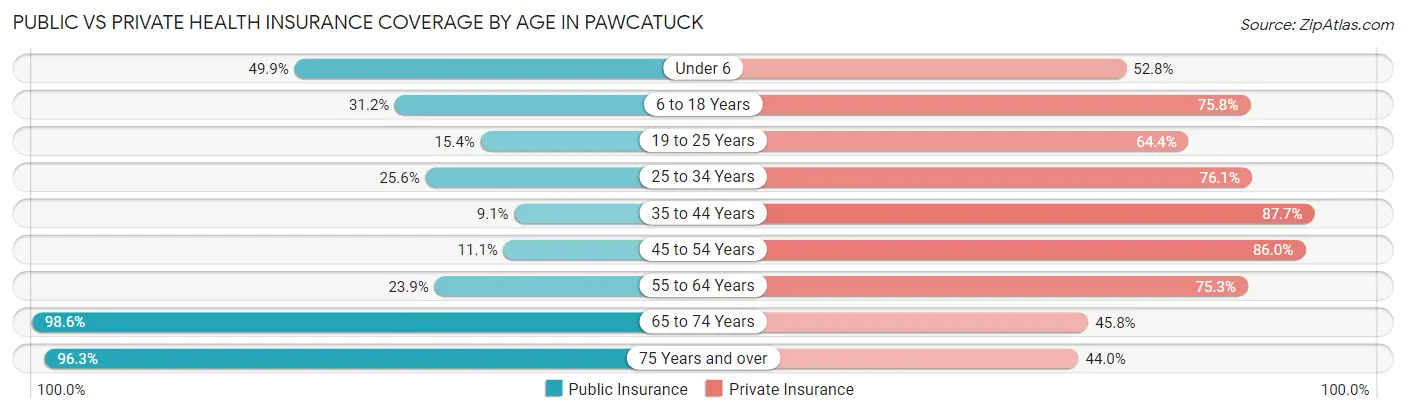
| Age Bracket | Public Insurance | Private Insurance |
| Under 6 | 223 (49.9%) | 236 (52.8%) |
| 6 to 18 Years | 286 (31.2%) | 694 (75.8%) |
| 19 to 25 Years | 31 (15.3%) | 130 (64.4%) |
| 25 to 34 Years | 151 (25.6%) | 449 (76.1%) |
| 35 to 44 Years | 59 (9.1%) | 570 (87.7%) |
| 45 to 54 Years | 94 (11.1%) | 729 (86.0%) |
| 55 to 64 Years | 193 (23.9%) | 608 (75.3%) |
| 65 to 74 Years | 655 (98.6%) | 304 (45.8%) |
| 75 Years and over | 390 (96.3%) | 178 (44.0%) |
| Total | 2,082 (37.7%) | 3,898 (70.5%) |
Disability Status by Sex by Age in Pawcatuck
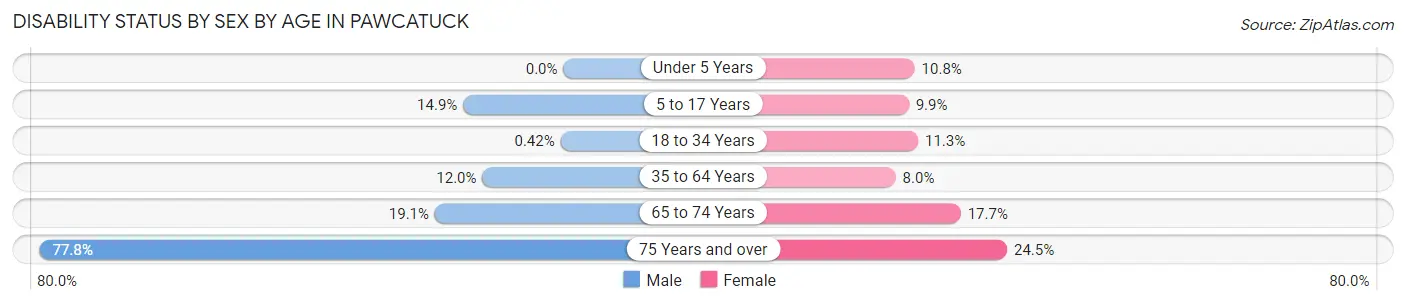
| Age Bracket | Male | Female |
| Under 5 Years | 0 (0.0%) | 29 (10.8%) |
| 5 to 17 Years | 61 (14.9%) | 52 (9.9%) |
| 18 to 34 Years | 2 (0.4%) | 42 (11.3%) |
| 35 to 64 Years | 139 (12.0%) | 92 (8.0%) |
| 65 to 74 Years | 50 (19.1%) | 71 (17.7%) |
| 75 Years and over | 147 (77.8%) | 53 (24.5%) |
Disability Class by Sex by Age in Pawcatuck
Disability Class: Hearing Difficulty
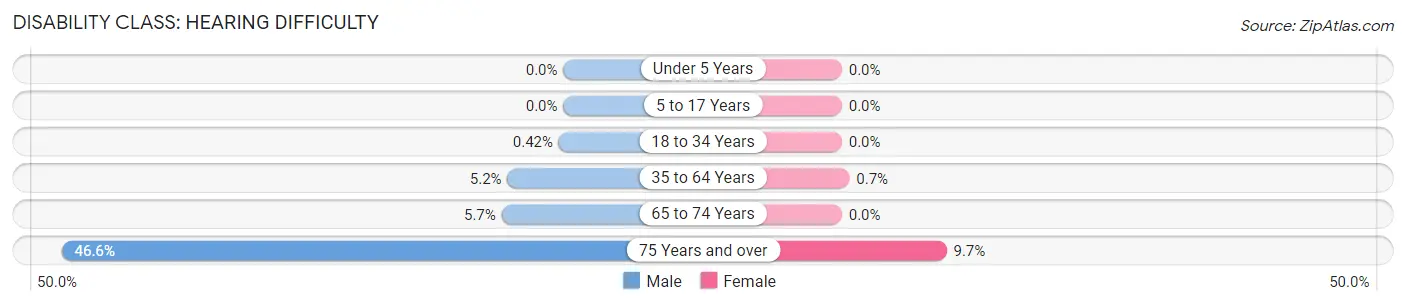
| Age Bracket | Male | Female |
| Under 5 Years | 0 (0.0%) | 0 (0.0%) |
| 5 to 17 Years | 0 (0.0%) | 0 (0.0%) |
| 18 to 34 Years | 2 (0.4%) | 0 (0.0%) |
| 35 to 64 Years | 60 (5.2%) | 8 (0.7%) |
| 65 to 74 Years | 15 (5.7%) | 0 (0.0%) |
| 75 Years and over | 88 (46.6%) | 21 (9.7%) |
Disability Class: Vision Difficulty
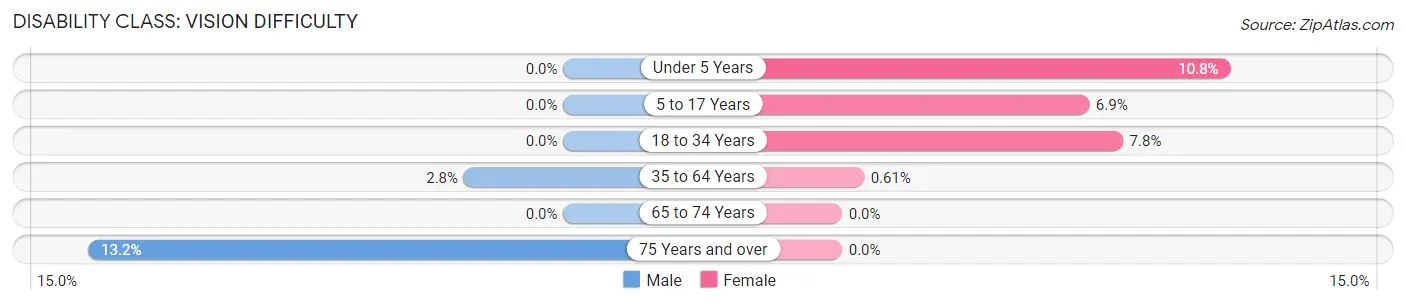
| Age Bracket | Male | Female |
| Under 5 Years | 0 (0.0%) | 29 (10.8%) |
| 5 to 17 Years | 0 (0.0%) | 36 (6.9%) |
| 18 to 34 Years | 0 (0.0%) | 29 (7.8%) |
| 35 to 64 Years | 32 (2.8%) | 7 (0.6%) |
| 65 to 74 Years | 0 (0.0%) | 0 (0.0%) |
| 75 Years and over | 25 (13.2%) | 0 (0.0%) |
Disability Class: Cognitive Difficulty
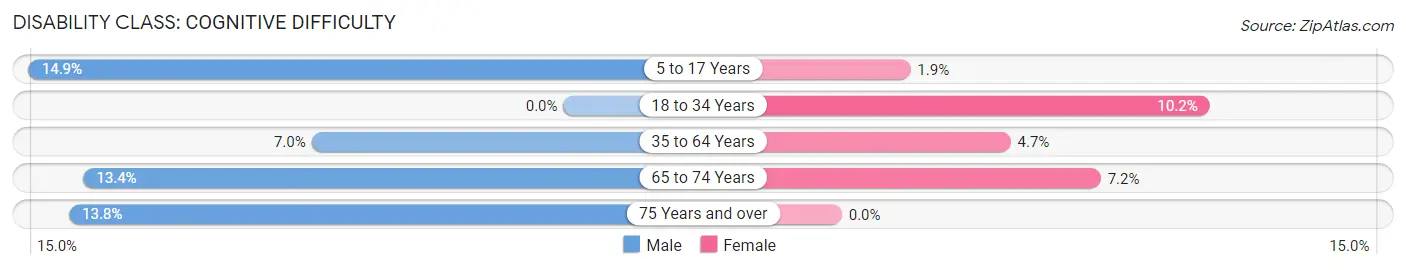
| Age Bracket | Male | Female |
| 5 to 17 Years | 61 (14.9%) | 10 (1.9%) |
| 18 to 34 Years | 0 (0.0%) | 38 (10.2%) |
| 35 to 64 Years | 81 (7.0%) | 54 (4.7%) |
| 65 to 74 Years | 35 (13.4%) | 29 (7.2%) |
| 75 Years and over | 26 (13.8%) | 0 (0.0%) |
Disability Class: Ambulatory Difficulty
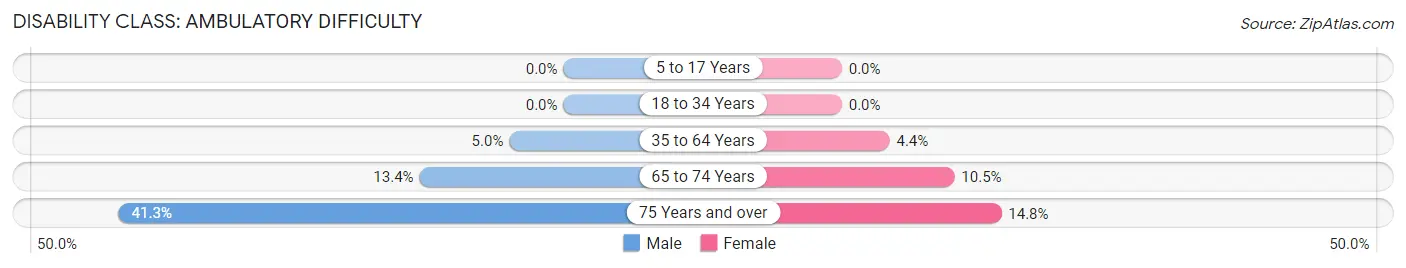
| Age Bracket | Male | Female |
| 5 to 17 Years | 0 (0.0%) | 0 (0.0%) |
| 18 to 34 Years | 0 (0.0%) | 0 (0.0%) |
| 35 to 64 Years | 58 (5.0%) | 51 (4.4%) |
| 65 to 74 Years | 35 (13.4%) | 42 (10.4%) |
| 75 Years and over | 78 (41.3%) | 32 (14.8%) |
Disability Class: Self-Care Difficulty
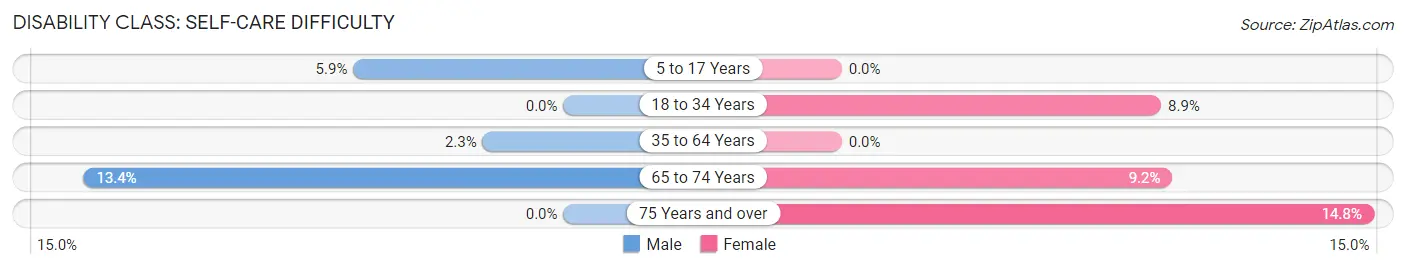
| Age Bracket | Male | Female |
| 5 to 17 Years | 24 (5.9%) | 0 (0.0%) |
| 18 to 34 Years | 0 (0.0%) | 33 (8.9%) |
| 35 to 64 Years | 26 (2.2%) | 0 (0.0%) |
| 65 to 74 Years | 35 (13.4%) | 37 (9.2%) |
| 75 Years and over | 0 (0.0%) | 32 (14.8%) |
Technology Access in Pawcatuck
Computing Device Access in Pawcatuck
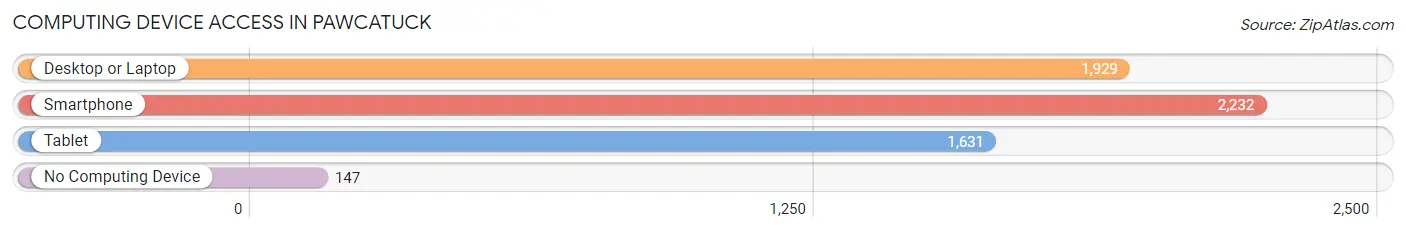
| Device Type | # Households | % Households |
| Desktop or Laptop | 1,929 | 77.2% |
| Smartphone | 2,232 | 89.3% |
| Tablet | 1,631 | 65.3% |
| No Computing Device | 147 | 5.9% |
| Total | 2,499 | 100.0% |
Internet Access in Pawcatuck
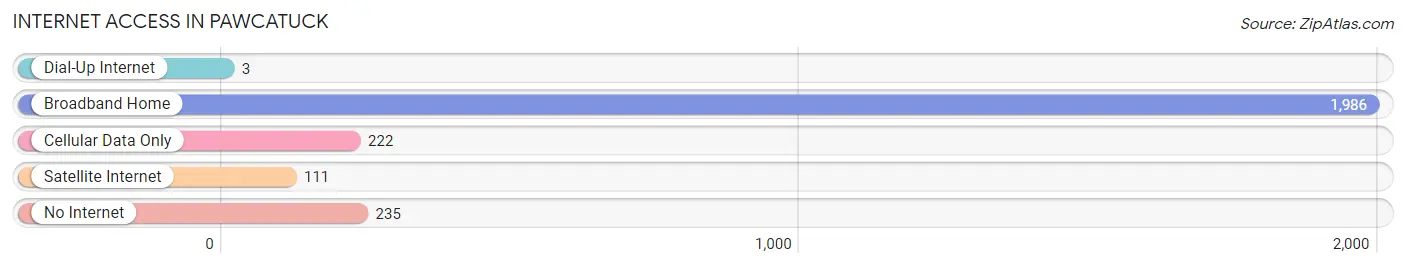
| Internet Type | # Households | % Households |
| Dial-Up Internet | 3 | 0.1% |
| Broadband Home | 1,986 | 79.5% |
| Cellular Data Only | 222 | 8.9% |
| Satellite Internet | 111 | 4.4% |
| No Internet | 235 | 9.4% |
| Total | 2,499 | 100.0% |
Pawcatuck Summary
Pawcatuck is a small town located in the southeastern corner of Connecticut, in the town of Stonington. It is bordered by Westerly, Rhode Island to the east, and the Mystic River to the south. The town has a population of approximately 4,000 people, and is part of the larger New London-Norwich-Westerly metropolitan area.
History
The area that is now Pawcatuck was originally inhabited by the Pequot and Mohegan Native American tribes. The first European settlers arrived in the area in the 1630s, and the town was officially incorporated in 1703. The town was named after the Pawcatuck River, which was named after the Pawcatuck Indians, a branch of the Pequot tribe.
In the late 1700s, the town became a center of shipbuilding and maritime trade. The town was also home to several mills, which produced textiles, paper, and other goods. The town was also home to a number of whaling ships, which sailed out of the Mystic River.
In the late 1800s, the town began to experience a decline in its maritime industry, as the whaling industry declined and the shipbuilding industry moved elsewhere. The town also experienced a decline in its textile industry, as the mills began to close.
Geography
Pawcatuck is located in the southeastern corner of Connecticut, in the town of Stonington. It is bordered by Westerly, Rhode Island to the east, and the Mystic River to the south. The town is located on the Pawcatuck River, which flows into the Mystic River. The town is located in a rural area, and is surrounded by forests and wetlands.
The town has a total area of 4.2 square miles, of which 4.1 square miles is land and 0.1 square miles is water. The town is located in a humid continental climate zone, with hot, humid summers and cold, snowy winters.
Economy
The economy of Pawcatuck is largely based on tourism and retail. The town is home to several small businesses, including restaurants, shops, and galleries. The town is also home to a number of marinas, which provide services to boaters.
The town is also home to a number of manufacturing companies, including a paper mill, a plastics factory, and a metal fabrication plant. The town is also home to a number of small farms, which produce fruits and vegetables.
Demographics
As of the 2010 census, the population of Pawcatuck was 4,068. The racial makeup of the town was 94.3% White, 1.3% African American, 0.4% Native American, 1.2% Asian, 0.1% Pacific Islander, 1.2% from other races, and 1.5% from two or more races. Hispanic or Latino of any race were 3.2% of the population.
The median household income in Pawcatuck was $60,938, and the median family income was $68,958. The per capita income for the town was $27,945. About 5.3% of families and 7.2% of the population were below the poverty line, including 8.3% of those under age 18 and 5.2% of those age 65 or over.
Common Questions
What is Per Capita Income in Pawcatuck?
Per Capita income in Pawcatuck is $39,655.
What is the Median Family Income in Pawcatuck?
Median Family Income in Pawcatuck is $82,083.
What is the Median Household income in Pawcatuck?
Median Household Income in Pawcatuck is $70,927.
What is Income or Wage Gap in Pawcatuck?
Income or Wage Gap in Pawcatuck is 56.0%.
Women in Pawcatuck earn 44.0 cents for every dollar earned by a man.
What is Inequality or Gini Index in Pawcatuck?
Inequality or Gini Index in Pawcatuck is 0.45.
What is the Total Population of Pawcatuck?
Total Population of Pawcatuck is 5,570.
What is the Total Male Population of Pawcatuck?
Total Male Population of Pawcatuck is 2,640.
What is the Total Female Population of Pawcatuck?
Total Female Population of Pawcatuck is 2,930.
What is the Ratio of Males per 100 Females in Pawcatuck?
There are 90.10 Males per 100 Females in Pawcatuck.
What is the Ratio of Females per 100 Males in Pawcatuck?
There are 110.98 Females per 100 Males in Pawcatuck.
What is the Median Population Age in Pawcatuck?
Median Population Age in Pawcatuck is 43.6 Years.
What is the Average Family Size in Pawcatuck
Average Family Size in Pawcatuck is 2.9 People.
What is the Average Household Size in Pawcatuck
Average Household Size in Pawcatuck is 2.2 People.
How Large is the Labor Force in Pawcatuck?
There are 2,982 People in the Labor Forcein in Pawcatuck.
What is the Percentage of People in the Labor Force in Pawcatuck?
67.8% of People are in the Labor Force in Pawcatuck.
What is the Unemployment Rate in Pawcatuck?
Unemployment Rate in Pawcatuck is 5.1%.