Cities with the Highest Percentage of Russian Population in Connecticut
RELATED REPORTS & OPTIONS
Russian
Connecticut
Compare Cities
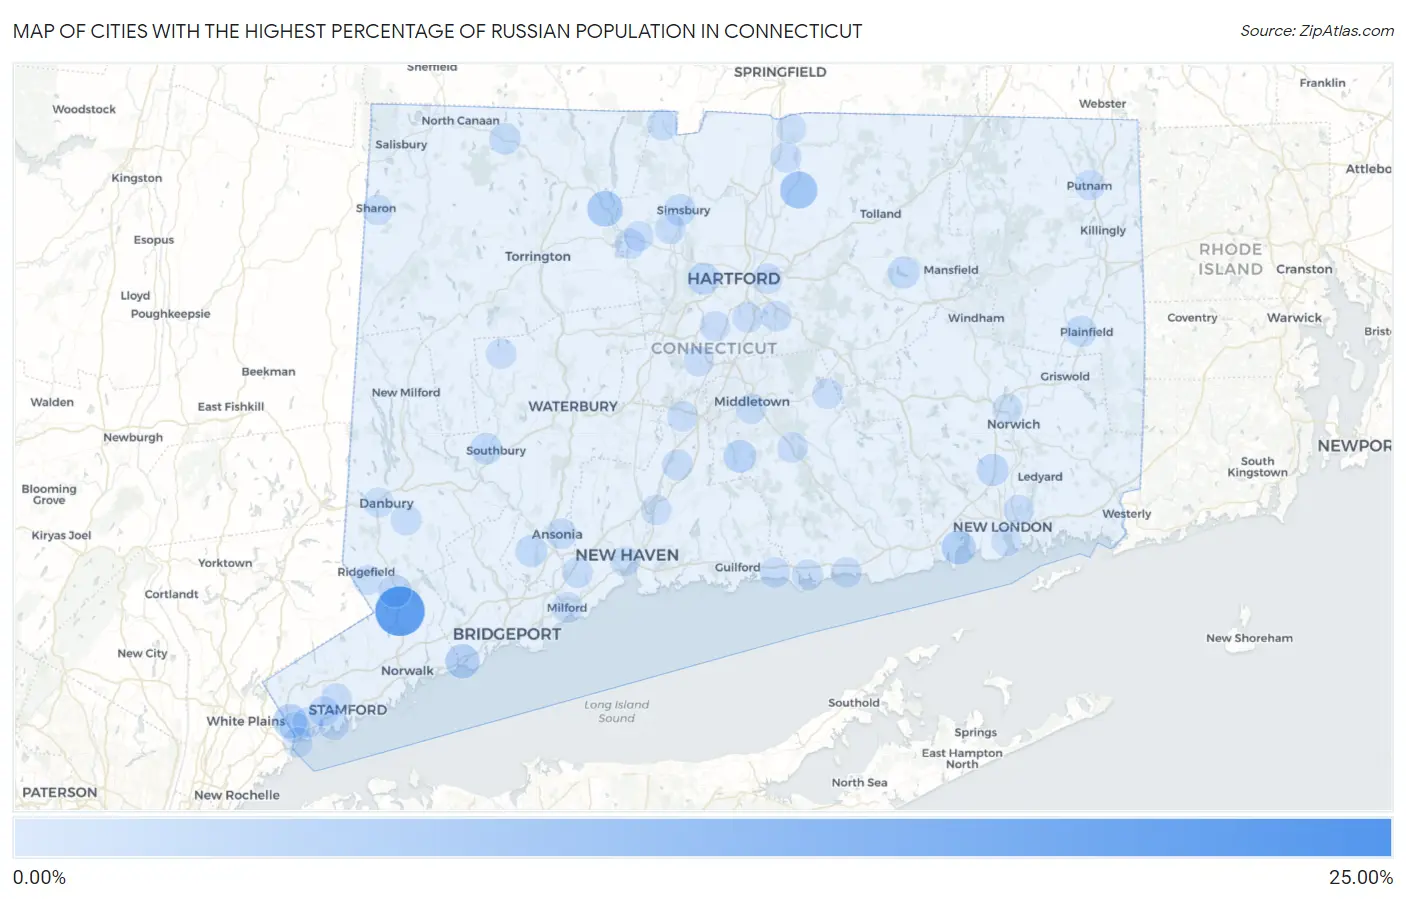
Map of Cities with the Highest Percentage of Russian Population in Connecticut
0.00%
25.00%
Cities with the Highest Percentage of Russian Population in Connecticut
| City | Russian | vs State | vs National | |
| 1. | Topstone | 24.16% | 1.32%(+22.8)#1 | 0.72%(+23.4)#34 |
| 2. | Cannondale | 20.30% | 1.32%(+19.0)#2 | 0.72%(+19.6)#46 |
| 3. | Indian Field | 12.20% | 1.32%(+10.9)#3 | 0.72%(+11.5)#104 |
| 4. | Weston | 9.66% | 1.32%(+8.34)#4 | 0.72%(+8.94)#176 |
| 5. | Staples | 9.06% | 1.32%(+7.73)#5 | 0.72%(+8.33)#202 |
| 6. | Greens Farms | 8.03% | 1.32%(+6.71)#6 | 0.72%(+7.31)#258 |
| 7. | Broad Brook | 7.76% | 1.32%(+6.44)#7 | 0.72%(+7.04)#277 |
| 8. | Poplar Plains | 7.69% | 1.32%(+6.36)#8 | 0.72%(+6.97)#281 |
| 9. | Murray | 7.64% | 1.32%(+6.32)#9 | 0.72%(+6.92)#285 |
| 10. | Mill Plain | 7.60% | 1.32%(+6.28)#10 | 0.72%(+6.88)#288 |
| 11. | Cornwall | 7.23% | 1.32%(+5.91)#11 | 0.72%(+6.51)#326 |
| 12. | New Hartford Center | 6.23% | 1.32%(+4.91)#12 | 0.72%(+5.51)#418 |
| 13. | Oronoque | 5.66% | 1.32%(+4.34)#13 | 0.72%(+4.94)#482 |
| 14. | Redding Center | 5.43% | 1.32%(+4.10)#14 | 0.72%(+4.71)#521 |
| 15. | Rock Ridge | 5.02% | 1.32%(+3.70)#15 | 0.72%(+4.30)#593 |
| 16. | Southport | 5.02% | 1.32%(+3.69)#16 | 0.72%(+4.30)#594 |
| 17. | Glenville | 4.85% | 1.32%(+3.53)#17 | 0.72%(+4.13)#624 |
| 18. | Niantic | 4.80% | 1.32%(+3.48)#18 | 0.72%(+4.08)#632 |
| 19. | Westport | 4.80% | 1.32%(+3.48)#19 | 0.72%(+4.08)#634 |
| 20. | Coleytown | 4.13% | 1.32%(+2.81)#20 | 0.72%(+3.41)#802 |
| 21. | Compo | 4.10% | 1.32%(+2.77)#21 | 0.72%(+3.37)#821 |
| 22. | Litchfield Borough | 4.06% | 1.32%(+2.74)#22 | 0.72%(+3.34)#830 |
| 23. | East | 3.96% | 1.32%(+2.64)#23 | 0.72%(+3.24)#868 |
| 24. | Old Hill | 3.89% | 1.32%(+2.56)#24 | 0.72%(+3.17)#891 |
| 25. | Georgetown | 3.74% | 1.32%(+2.42)#25 | 0.72%(+3.02)#957 |
| 26. | Durham | 3.60% | 1.32%(+2.28)#26 | 0.72%(+2.88)#1,014 |
| 27. | Woodmont Borough | 3.40% | 1.32%(+2.07)#27 | 0.72%(+2.68)#1,114 |
| 28. | West Hartford | 3.04% | 1.32%(+1.72)#28 | 0.72%(+2.32)#1,289 |
| 29. | Oxoboxo River | 2.84% | 1.32%(+1.52)#29 | 0.72%(+2.12)#1,403 |
| 30. | Northford | 2.78% | 1.32%(+1.46)#30 | 0.72%(+2.06)#1,443 |
| 31. | Mamanasco Lake | 2.77% | 1.32%(+1.44)#31 | 0.72%(+2.04)#1,454 |
| 32. | Stonington Borough | 2.76% | 1.32%(+1.44)#32 | 0.72%(+2.04)#1,459 |
| 33. | South Coventry | 2.66% | 1.32%(+1.33)#33 | 0.72%(+1.94)#1,533 |
| 34. | Shelton | 2.57% | 1.32%(+1.25)#34 | 0.72%(+1.85)#1,595 |
| 35. | South Wilton | 2.52% | 1.32%(+1.20)#35 | 0.72%(+1.80)#1,638 |
| 36. | Groton Long Point Borough | 2.51% | 1.32%(+1.19)#36 | 0.72%(+1.79)#1,643 |
| 37. | Simsbury Center | 2.49% | 1.32%(+1.17)#37 | 0.72%(+1.77)#1,669 |
| 38. | Heritage Village | 2.43% | 1.32%(+1.10)#38 | 0.72%(+1.70)#1,723 |
| 39. | Darien Downtown | 2.38% | 1.32%(+1.06)#39 | 0.72%(+1.66)#1,773 |
| 40. | Norfolk | 2.30% | 1.32%(+0.978)#40 | 0.72%(+1.58)#1,858 |
| 41. | Quinnipiac University | 2.27% | 1.32%(+0.951)#41 | 0.72%(+1.55)#1,885 |
| 42. | Lakeside Woods | 2.24% | 1.32%(+0.916)#42 | 0.72%(+1.52)#1,920 |
| 43. | Plainfield Village | 2.16% | 1.32%(+0.841)#43 | 0.72%(+1.44)#2,003 |
| 44. | Daniels Farm | 2.08% | 1.32%(+0.754)#44 | 0.72%(+1.36)#2,120 |
| 45. | Candlewood Shores | 2.02% | 1.32%(+0.698)#45 | 0.72%(+1.30)#2,201 |
| 46. | North Granby | 1.86% | 1.32%(+0.541)#46 | 0.72%(+1.14)#2,425 |
| 47. | Clinton | 1.83% | 1.32%(+0.509)#47 | 0.72%(+1.11)#2,478 |
| 48. | Bethel | 1.79% | 1.32%(+0.470)#48 | 0.72%(+1.07)#2,534 |
| 49. | Wallingford Center | 1.75% | 1.32%(+0.423)#49 | 0.72%(+1.02)#2,606 |
| 50. | Pemberwick | 1.74% | 1.32%(+0.421)#50 | 0.72%(+1.02)#2,610 |
| 51. | Stamford | 1.74% | 1.32%(+0.414)#51 | 0.72%(+1.02)#2,622 |
| 52. | Trumbull Center | 1.72% | 1.32%(+0.400)#52 | 0.72%(+1.00)#2,640 |
| 53. | Milford City Balance | 1.69% | 1.32%(+0.369)#53 | 0.72%(+0.970)#2,700 |
| 54. | Orange | 1.65% | 1.32%(+0.329)#54 | 0.72%(+0.930)#2,783 |
| 55. | Fairfield University | 1.64% | 1.32%(+0.319)#55 | 0.72%(+0.920)#2,810 |
| 56. | Sandy Hook | 1.63% | 1.32%(+0.312)#56 | 0.72%(+0.914)#2,823 |
| 57. | Tokeneke | 1.63% | 1.32%(+0.309)#57 | 0.72%(+0.910)#2,829 |
| 58. | Ansonia | 1.59% | 1.32%(+0.271)#58 | 0.72%(+0.872)#2,894 |
| 59. | Westbrook Center | 1.55% | 1.32%(+0.231)#59 | 0.72%(+0.833)#2,970 |
| 60. | Southwood Acres | 1.55% | 1.32%(+0.229)#60 | 0.72%(+0.830)#2,975 |
| 61. | Meriden | 1.55% | 1.32%(+0.225)#61 | 0.72%(+0.826)#2,983 |
| 62. | Lakes East | 1.51% | 1.32%(+0.188)#62 | 0.72%(+0.789)#3,065 |
| 63. | Weatogue | 1.50% | 1.32%(+0.175)#63 | 0.72%(+0.776)#3,100 |
| 64. | Higganum | 1.48% | 1.32%(+0.154)#64 | 0.72%(+0.756)#3,156 |
| 65. | Bantam Borough | 1.43% | 1.32%(+0.112)#65 | 0.72%(+0.714)#3,261 |
| 66. | Glastonbury Center | 1.43% | 1.32%(+0.110)#66 | 0.72%(+0.711)#3,268 |
| 67. | Jewett City Borough | 1.41% | 1.32%(+0.083)#67 | 0.72%(+0.684)#3,330 |
| 68. | Greenwich | 1.39% | 1.32%(+0.073)#68 | 0.72%(+0.674)#3,365 |
| 69. | East Hampton | 1.39% | 1.32%(+0.070)#69 | 0.72%(+0.672)#3,368 |
| 70. | Old Greenwich | 1.39% | 1.32%(+0.066)#70 | 0.72%(+0.667)#3,386 |
| 71. | Route 7 Gateway | 1.39% | 1.32%(+0.065)#71 | 0.72%(+0.666)#3,387 |
| 72. | Inglenook | 1.39% | 1.32%(+0.064)#72 | 0.72%(+0.665)#3,393 |
| 73. | Tashua | 1.35% | 1.32%(+0.029)#73 | 0.72%(+0.630)#3,473 |
| 74. | Putnam | 1.35% | 1.32%(+0.024)#74 | 0.72%(+0.625)#3,486 |
| 75. | Ball Pond | 1.34% | 1.32%(+0.021)#75 | 0.72%(+0.622)#3,490 |
| 76. | Sacred Heart University | 1.34% | 1.32%(+0.017)#76 | 0.72%(+0.619)#3,501 |
| 77. | Cornwall Bridge | 1.31% | 1.32%(-0.012)#77 | 0.72%(+0.589)#3,582 |
| 78. | Madison Center | 1.30% | 1.32%(-0.020)#78 | 0.72%(+0.581)#3,601 |
| 79. | Conning Towers Nautilus Park | 1.30% | 1.32%(-0.026)#79 | 0.72%(+0.575)#3,610 |
| 80. | Kensington | 1.28% | 1.32%(-0.038)#80 | 0.72%(+0.563)#3,657 |
| 81. | Bethlehem Village | 1.28% | 1.32%(-0.038)#81 | 0.72%(+0.563)#3,658 |
| 82. | Cos Cob | 1.27% | 1.32%(-0.052)#82 | 0.72%(+0.549)#3,696 |
| 83. | Noroton Heights | 1.26% | 1.32%(-0.058)#83 | 0.72%(+0.543)#3,715 |
| 84. | North Haven | 1.26% | 1.32%(-0.065)#84 | 0.72%(+0.536)#3,737 |
| 85. | Wethersfield | 1.25% | 1.32%(-0.068)#85 | 0.72%(+0.533)#3,744 |
| 86. | Middletown | 1.25% | 1.32%(-0.074)#86 | 0.72%(+0.527)#3,754 |
| 87. | Sharon | 1.24% | 1.32%(-0.082)#87 | 0.72%(+0.520)#3,776 |
| 88. | East Hartford | 1.23% | 1.32%(-0.094)#88 | 0.72%(+0.508)#3,823 |
| 89. | Newington | 1.23% | 1.32%(-0.094)#89 | 0.72%(+0.507)#3,828 |
| 90. | Collinsville | 1.23% | 1.32%(-0.096)#90 | 0.72%(+0.506)#3,833 |
| 91. | Byram | 1.17% | 1.32%(-0.149)#91 | 0.72%(+0.452)#4,012 |
| 92. | New London | 1.16% | 1.32%(-0.159)#92 | 0.72%(+0.442)#4,041 |
| 93. | New Haven | 1.15% | 1.32%(-0.170)#93 | 0.72%(+0.431)#4,072 |
| 94. | Danbury | 1.14% | 1.32%(-0.181)#94 | 0.72%(+0.421)#4,102 |
| 95. | Plattsville | 1.14% | 1.32%(-0.181)#95 | 0.72%(+0.420)#4,103 |
| 96. | Sherwood Manor | 1.08% | 1.32%(-0.241)#96 | 0.72%(+0.361)#4,282 |
| 97. | Candlewood Isle | 1.07% | 1.32%(-0.252)#97 | 0.72%(+0.350)#4,328 |
| 98. | Norwich | 1.02% | 1.32%(-0.299)#98 | 0.72%(+0.303)#4,502 |
| 99. | Canton Valley | 1.01% | 1.32%(-0.312)#99 | 0.72%(+0.290)#4,554 |
| 100. | Ridgefield | 0.99% | 1.32%(-0.330)#100 | 0.72%(+0.272)#4,637 |
Common Questions
What are the Top 10 Cities with the Highest Percentage of Russian Population in Connecticut?
Top 10 Cities with the Highest Percentage of Russian Population in Connecticut are:
#1
20.30%
#2
7.76%
#3
6.23%
#4
5.02%
#5
4.85%
#6
4.80%
#7
3.74%
#8
3.60%
#9
3.04%
#10
2.84%
What city has the Highest Percentage of Russian Population in Connecticut?
Cannondale has the Highest Percentage of Russian Population in Connecticut with 20.30%.
What is the Percentage of Russian Population in the State of Connecticut?
Percentage of Russian Population in Connecticut is 1.32%.
What is the Percentage of Russian Population in the United States?
Percentage of Russian Population in the United States is 0.72%.