Kensington, CT Map & Demographics
Kensington Map
Kensington Overview
$49,440
PER CAPITA INCOME
$116,061
AVG FAMILY INCOME
$99,423
AVG HOUSEHOLD INCOME
23.3%
WAGE / INCOME GAP [ % ]
76.7¢/ $1
WAGE / INCOME GAP [ $ ]
0.37
INEQUALITY / GINI INDEX
9,580
TOTAL POPULATION
4,944
MALE POPULATION
4,636
FEMALE POPULATION
106.64
MALES / 100 FEMALES
93.77
FEMALES / 100 MALES
48.8
MEDIAN AGE
2.7
AVG FAMILY SIZE
2.3
AVG HOUSEHOLD SIZE
5,656
LABOR FORCE [ PEOPLE ]
69.6%
PERCENT IN LABOR FORCE
2.2%
UNEMPLOYMENT RATE
Kensington Area Codes
Income in Kensington
Income Overview in Kensington
Per Capita Income in Kensington is $49,440, while median incomes of families and households are $116,061 and $99,423 respectively.
| Characteristic | Number | Measure |
| Per Capita Income | 9,580 | $49,440 |
| Median Family Income | 2,979 | $116,061 |
| Mean Family Income | 2,979 | $131,117 |
| Median Household Income | 4,184 | $99,423 |
| Mean Household Income | 4,184 | $114,914 |
| Income Deficit | 2,979 | $0 |
| Wage / Income Gap (%) | 9,580 | 23.31% |
| Wage / Income Gap ($) | 9,580 | 76.69¢ per $1 |
| Gini / Inequality Index | 9,580 | 0.37 |
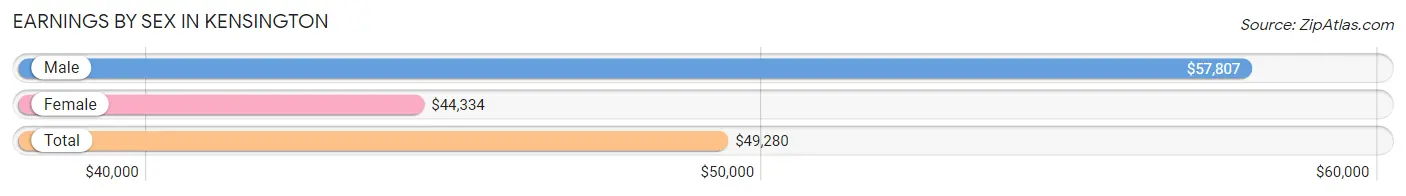
Earnings by Sex in Kensington
Average Earnings in Kensington are $49,280, $57,807 for men and $44,334 for women, a difference of 23.3%.
| Sex | Number | Average Earnings |
| Male | 3,127 (52.4%) | $57,807 |
| Female | 2,835 (47.5%) | $44,334 |
| Total | 5,962 (100.0%) | $49,280 |
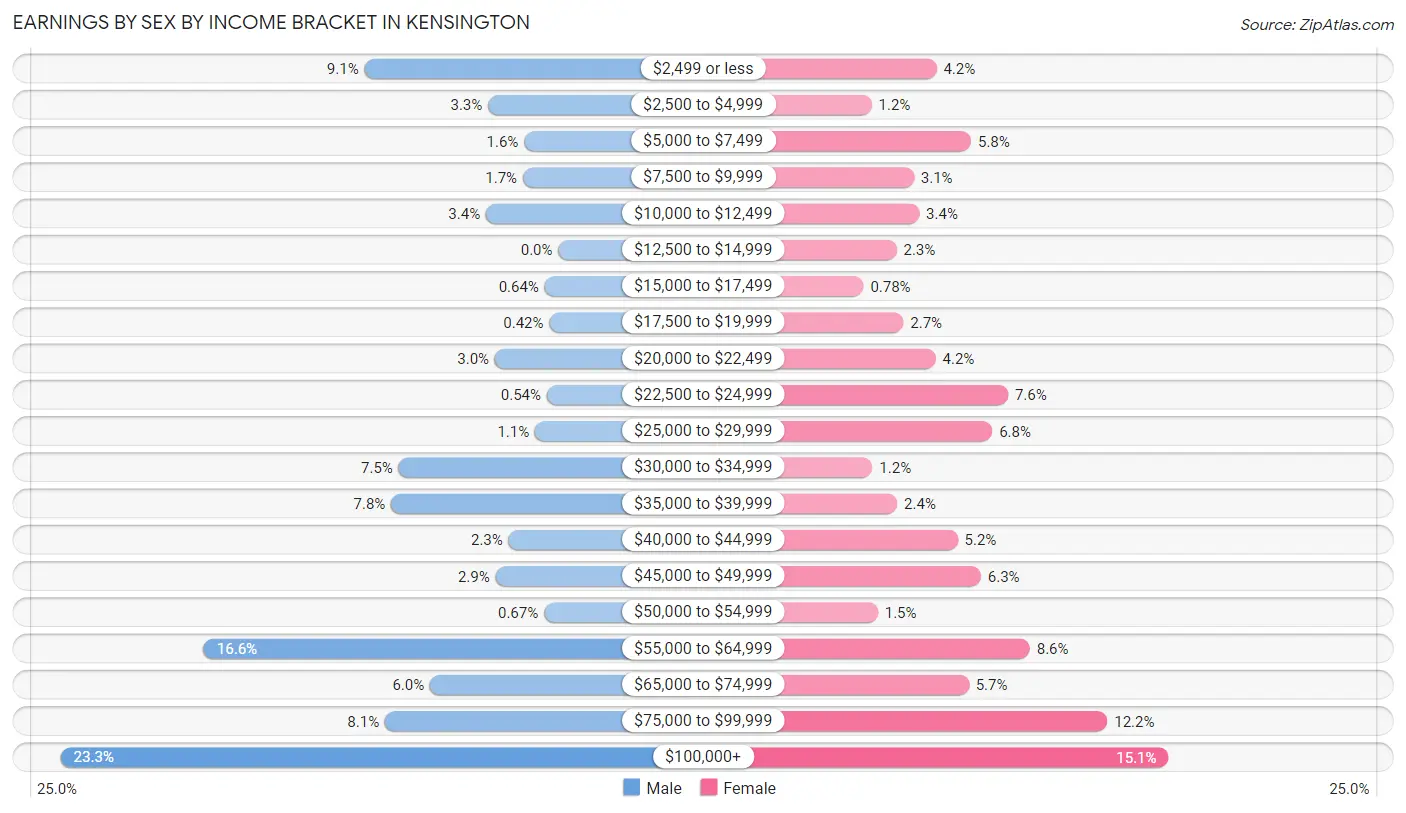
Earnings by Sex by Income Bracket in Kensington
The most common earnings brackets in Kensington are $100,000+ for men (729 | 23.3%) and $100,000+ for women (427 | 15.1%).
| Income | Male | Female |
| $2,499 or less | 284 (9.1%) | 119 (4.2%) |
| $2,500 to $4,999 | 103 (3.3%) | 33 (1.2%) |
| $5,000 to $7,499 | 50 (1.6%) | 165 (5.8%) |
| $7,500 to $9,999 | 52 (1.7%) | 89 (3.1%) |
| $10,000 to $12,499 | 106 (3.4%) | 96 (3.4%) |
| $12,500 to $14,999 | 0 (0.0%) | 66 (2.3%) |
| $15,000 to $17,499 | 20 (0.6%) | 22 (0.8%) |
| $17,500 to $19,999 | 13 (0.4%) | 75 (2.6%) |
| $20,000 to $22,499 | 93 (3.0%) | 118 (4.2%) |
| $22,500 to $24,999 | 17 (0.5%) | 214 (7.5%) |
| $25,000 to $29,999 | 34 (1.1%) | 193 (6.8%) |
| $30,000 to $34,999 | 234 (7.5%) | 34 (1.2%) |
| $35,000 to $39,999 | 245 (7.8%) | 67 (2.4%) |
| $40,000 to $44,999 | 73 (2.3%) | 147 (5.2%) |
| $45,000 to $49,999 | 92 (2.9%) | 178 (6.3%) |
| $50,000 to $54,999 | 21 (0.7%) | 41 (1.5%) |
| $55,000 to $64,999 | 519 (16.6%) | 243 (8.6%) |
| $65,000 to $74,999 | 188 (6.0%) | 162 (5.7%) |
| $75,000 to $99,999 | 254 (8.1%) | 346 (12.2%) |
| $100,000+ | 729 (23.3%) | 427 (15.1%) |
| Total | 3,127 (100.0%) | 2,835 (100.0%) |
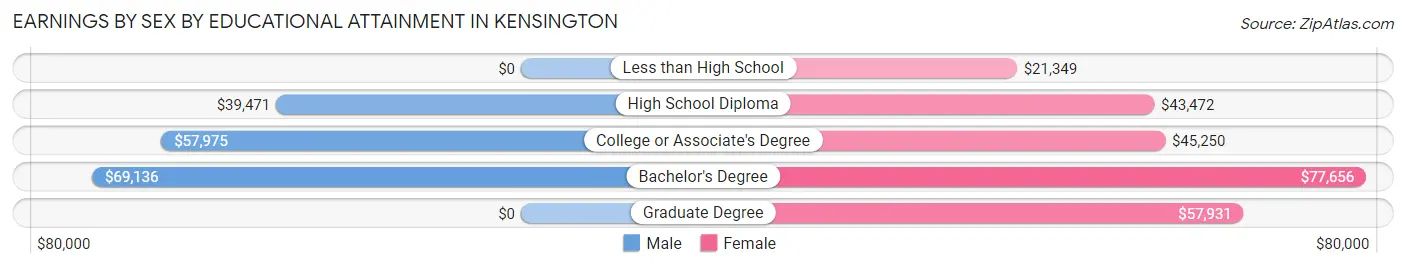
Earnings by Sex by Educational Attainment in Kensington
Average earnings in Kensington are $58,933 for men and $47,821 for women, a difference of 18.9%. Men with an educational attainment of bachelor's degree enjoy the highest average annual earnings of $69,136, while those with high school diploma education earn the least with $39,471. Women with an educational attainment of bachelor's degree earn the most with the average annual earnings of $77,656, while those with less than high school education have the smallest earnings of $21,349.
| Educational Attainment | Male Income | Female Income |
| Less than High School | - | - |
| High School Diploma | $39,471 | $43,472 |
| College or Associate's Degree | $57,975 | $45,250 |
| Bachelor's Degree | $69,136 | $77,656 |
| Graduate Degree | - | - |
| Total | $58,933 | $47,821 |
Family Income in Kensington
Family Income Brackets in Kensington
According to the Kensington family income data, there are 807 families falling into the $100,000 to $149,999 income range, which is the most common income bracket and makes up 27.1% of all families. Conversely, the less than $10,000 income bracket is the least frequent group with only 9 families (0.3%) belonging to this category.
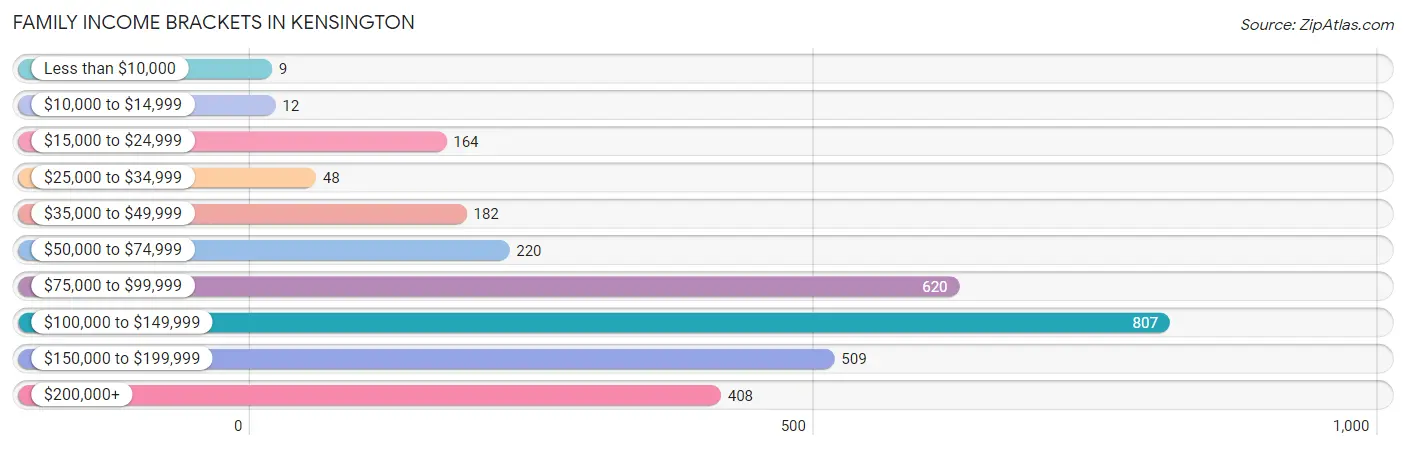
| Income Bracket | # Families | % Families |
| Less than $10,000 | 9 | 0.3% |
| $10,000 to $14,999 | 12 | 0.4% |
| $15,000 to $24,999 | 164 | 5.5% |
| $25,000 to $34,999 | 48 | 1.6% |
| $35,000 to $49,999 | 182 | 6.1% |
| $50,000 to $74,999 | 220 | 7.4% |
| $75,000 to $99,999 | 620 | 20.8% |
| $100,000 to $149,999 | 807 | 27.1% |
| $150,000 to $199,999 | 509 | 17.1% |
| $200,000+ | 408 | 13.7% |
Family Income by Famaliy Size in Kensington
4-person families (514 | 17.2%) account for the highest median family income in Kensington with $123,571 per family, while 2-person families (1,511 | 50.7%) have the highest median income of $49,394 per family member.
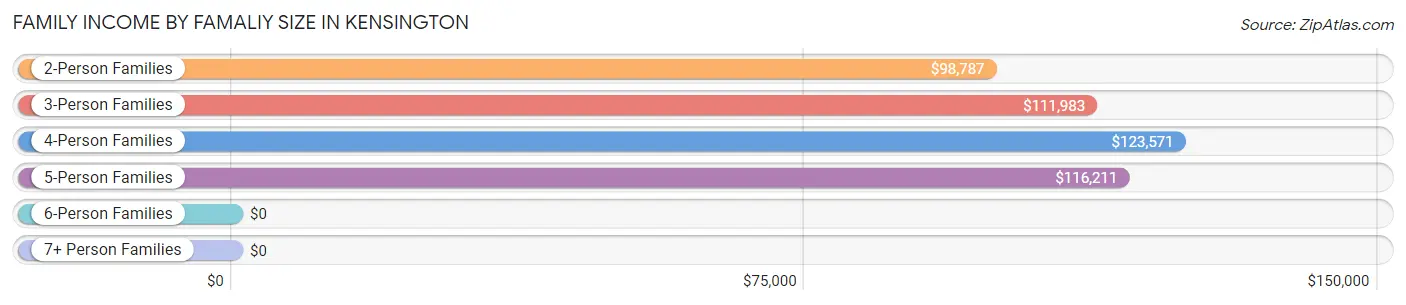
| Income Bracket | # Families | Median Income |
| 2-Person Families | 1,511 (50.7%) | $98,787 |
| 3-Person Families | 744 (25.0%) | $111,983 |
| 4-Person Families | 514 (17.2%) | $123,571 |
| 5-Person Families | 180 (6.0%) | $116,211 |
| 6-Person Families | 30 (1.0%) | $0 |
| 7+ Person Families | 0 (0.0%) | $0 |
| Total | 2,979 (100.0%) | $116,061 |
Family Income by Number of Earners in Kensington
The median family income in Kensington is $116,061, with families comprising 3+ earners (470) having the highest median family income of $123,571, while families with 1 earner (539) have the lowest median family income of $79,205, accounting for 15.8% and 18.1% of families, respectively.
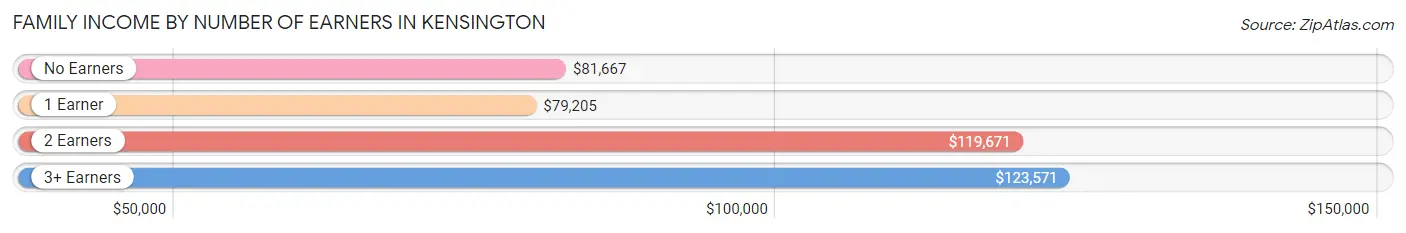
| Number of Earners | # Families | Median Income |
| No Earners | 324 (10.9%) | $81,667 |
| 1 Earner | 539 (18.1%) | $79,205 |
| 2 Earners | 1,646 (55.2%) | $119,671 |
| 3+ Earners | 470 (15.8%) | $123,571 |
| Total | 2,979 (100.0%) | $116,061 |
Household Income in Kensington
Household Income Brackets in Kensington
With 1,004 households falling in the category, the $100,000 to $149,999 income range is the most frequent in Kensington, accounting for 24.0% of all households. In contrast, only 29 households (0.7%) fall into the $10,000 to $14,999 income bracket, making it the least populous group.
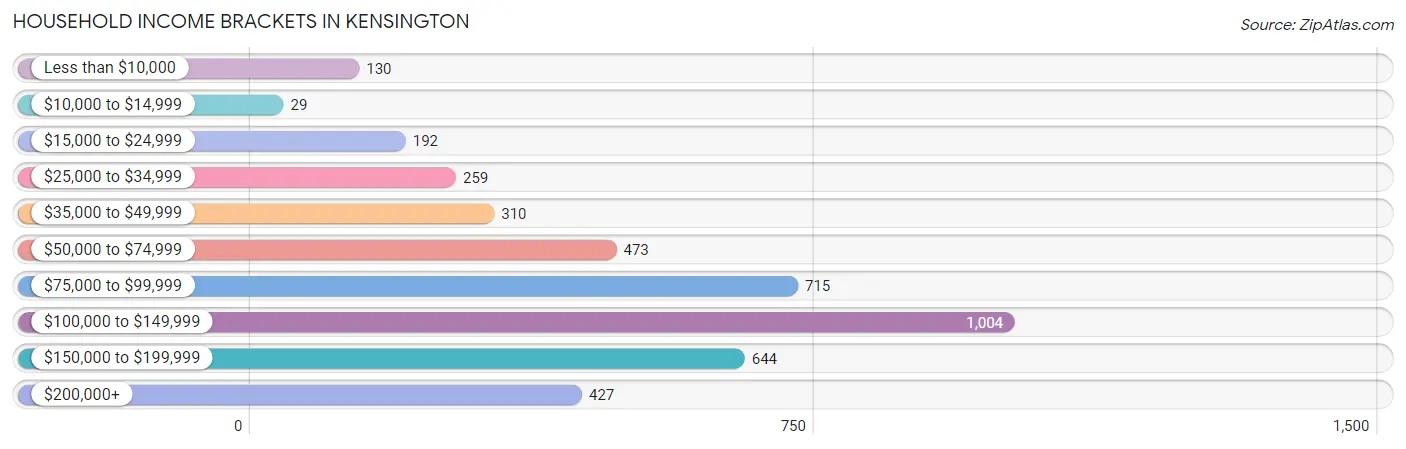
| Income Bracket | # Households | % Households |
| Less than $10,000 | 130 | 3.1% |
| $10,000 to $14,999 | 29 | 0.7% |
| $15,000 to $24,999 | 192 | 4.6% |
| $25,000 to $34,999 | 259 | 6.2% |
| $35,000 to $49,999 | 310 | 7.4% |
| $50,000 to $74,999 | 473 | 11.3% |
| $75,000 to $99,999 | 715 | 17.1% |
| $100,000 to $149,999 | 1,004 | 24.0% |
| $150,000 to $199,999 | 644 | 15.4% |
| $200,000+ | 427 | 10.2% |
Household Income by Householder Age in Kensington
The median household income in Kensington is $99,423, with the highest median household income of $116,016 found in the 25 to 44 years age bracket for the primary householder. A total of 994 households (23.8%) fall into this category.
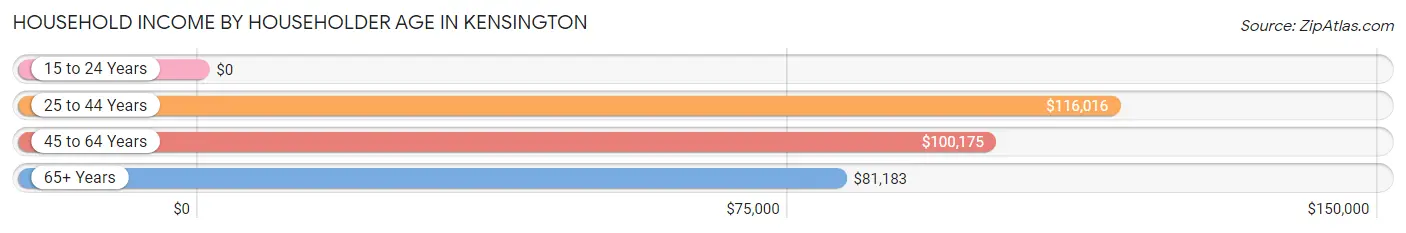
| Income Bracket | # Households | Median Income |
| 15 to 24 Years | 0 (0.0%) | $0 |
| 25 to 44 Years | 994 (23.8%) | $116,016 |
| 45 to 64 Years | 1,739 (41.6%) | $100,175 |
| 65+ Years | 1,451 (34.7%) | $81,183 |
| Total | 4,184 (100.0%) | $99,423 |
Poverty in Kensington
Income Below Poverty by Sex and Age in Kensington
With 5.6% poverty level for males and 8.5% for females among the residents of Kensington, 5 year old males and 5 year old females are the most vulnerable to poverty, with 59 males (71.1%) and 11 females (100.0%) in their respective age groups living below the poverty level.
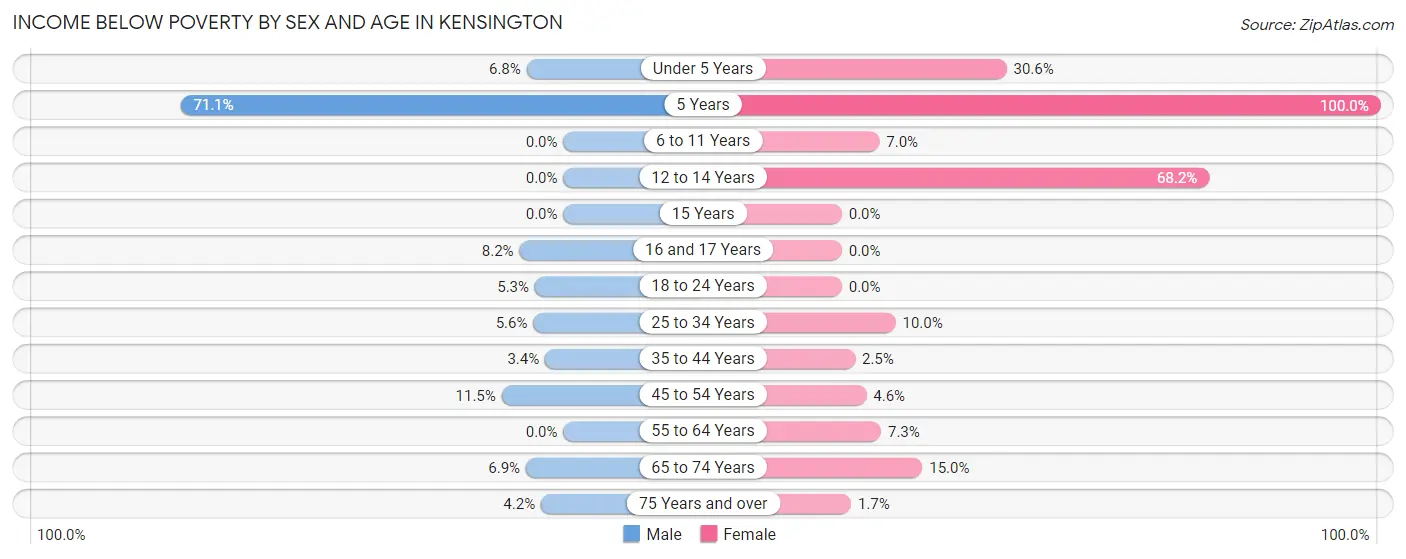
| Age Bracket | Male | Female |
| Under 5 Years | 15 (6.8%) | 89 (30.6%) |
| 5 Years | 59 (71.1%) | 11 (100.0%) |
| 6 to 11 Years | 0 (0.0%) | 14 (7.0%) |
| 12 to 14 Years | 0 (0.0%) | 15 (68.2%) |
| 15 Years | 0 (0.0%) | 0 (0.0%) |
| 16 and 17 Years | 26 (8.2%) | 0 (0.0%) |
| 18 to 24 Years | 11 (5.3%) | 0 (0.0%) |
| 25 to 34 Years | 29 (5.6%) | 54 (10.0%) |
| 35 to 44 Years | 18 (3.4%) | 12 (2.5%) |
| 45 to 54 Years | 59 (11.5%) | 32 (4.6%) |
| 55 to 64 Years | 0 (0.0%) | 43 (7.3%) |
| 65 to 74 Years | 46 (6.9%) | 113 (14.9%) |
| 75 Years and over | 14 (4.2%) | 11 (1.7%) |
| Total | 277 (5.6%) | 394 (8.5%) |
Income Above Poverty by Sex and Age in Kensington
According to the poverty statistics in Kensington, males aged 6 to 11 years and females aged 15 years are the age groups that are most secure financially, with 100.0% of males and 100.0% of females in these age groups living above the poverty line.
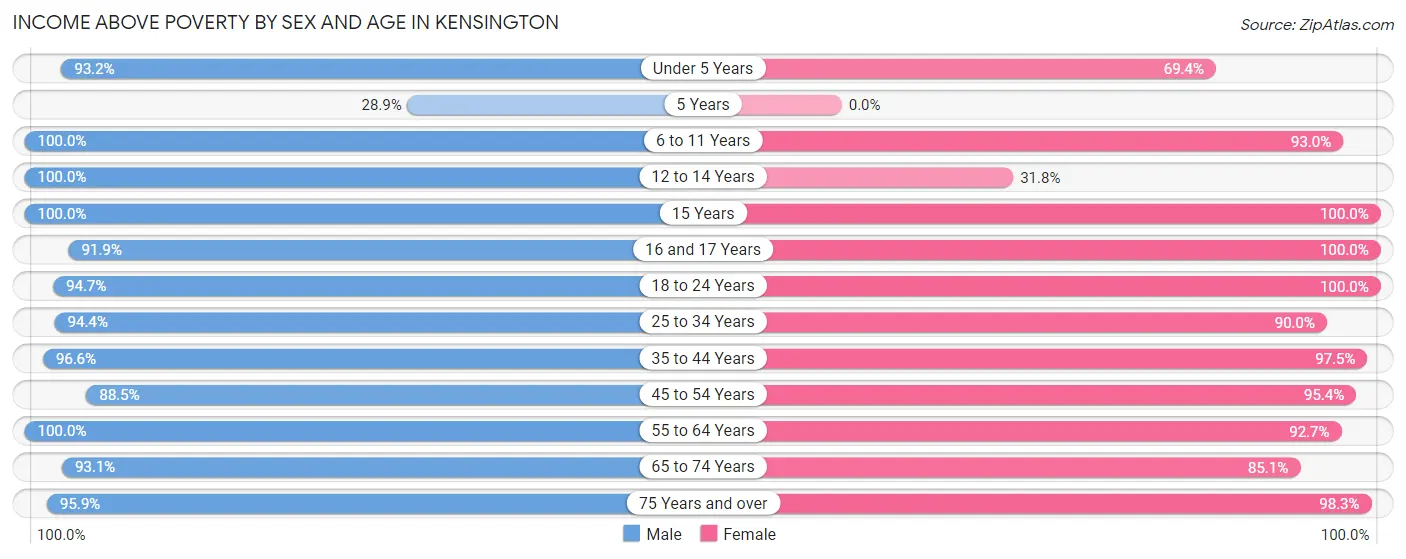
| Age Bracket | Male | Female |
| Under 5 Years | 205 (93.2%) | 202 (69.4%) |
| 5 Years | 24 (28.9%) | 0 (0.0%) |
| 6 to 11 Years | 306 (100.0%) | 187 (93.0%) |
| 12 to 14 Years | 252 (100.0%) | 7 (31.8%) |
| 15 Years | 50 (100.0%) | 18 (100.0%) |
| 16 and 17 Years | 293 (91.8%) | 147 (100.0%) |
| 18 to 24 Years | 197 (94.7%) | 214 (100.0%) |
| 25 to 34 Years | 491 (94.4%) | 487 (90.0%) |
| 35 to 44 Years | 512 (96.6%) | 476 (97.5%) |
| 45 to 54 Years | 456 (88.5%) | 670 (95.4%) |
| 55 to 64 Years | 941 (100.0%) | 548 (92.7%) |
| 65 to 74 Years | 617 (93.1%) | 643 (85.1%) |
| 75 Years and over | 323 (95.9%) | 632 (98.3%) |
| Total | 4,667 (94.4%) | 4,231 (91.5%) |
Income Below Poverty Among Married-Couple Families in Kensington
The poverty statistics for married-couple families in Kensington show that 1.7% or 38 of the total 2,304 families live below the poverty line. Families with 1 or 2 children have the highest poverty rate of 1.8%, comprising of 13 families. On the other hand, families with 3 or 4 children have the lowest poverty rate of 0.0%, which includes 0 families.
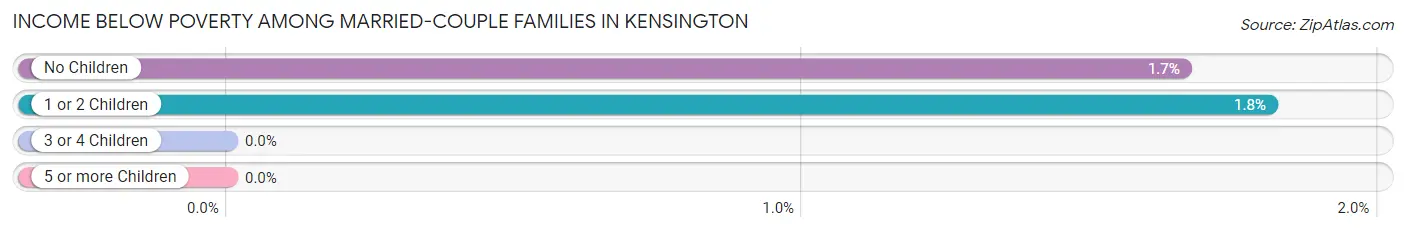
| Children | Above Poverty | Below Poverty |
| No Children | 1,484 (98.3%) | 25 (1.7%) |
| 1 or 2 Children | 706 (98.2%) | 13 (1.8%) |
| 3 or 4 Children | 76 (100.0%) | 0 (0.0%) |
| 5 or more Children | 0 (0.0%) | 0 (0.0%) |
| Total | 2,266 (98.4%) | 38 (1.7%) |
Income Below Poverty Among Single-Parent Households in Kensington
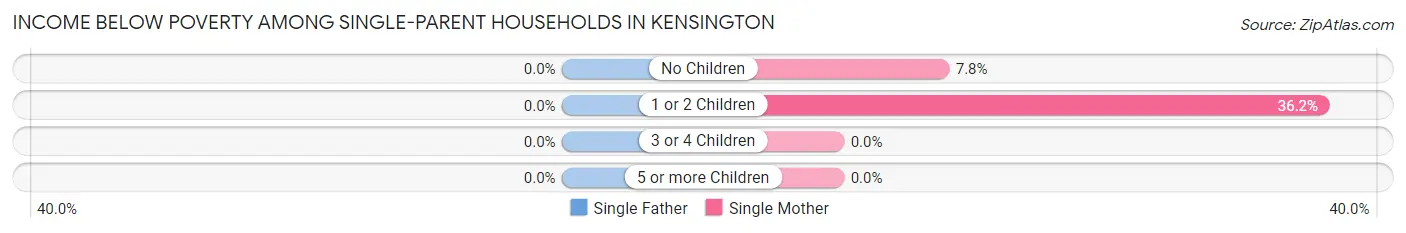
| Children | Single Father | Single Mother |
| No Children | 0 (0.0%) | 9 (7.8%) |
| 1 or 2 Children | 0 (0.0%) | 113 (36.2%) |
| 3 or 4 Children | 0 (0.0%) | 0 (0.0%) |
| 5 or more Children | 0 (0.0%) | 0 (0.0%) |
| Total | 0 (0.0%) | 122 (28.6%) |
Income Below Poverty Among Married-Couple vs Single-Parent Households in Kensington
The poverty data for Kensington shows that 38 of the married-couple family households (1.7%) and 122 of the single-parent households (18.1%) are living below the poverty level. Within the married-couple family households, those with 1 or 2 children have the highest poverty rate, with 13 households (1.8%) falling below the poverty line. Among the single-parent households, those with 1 or 2 children have the highest poverty rate, with 113 household (24.1%) living below poverty.
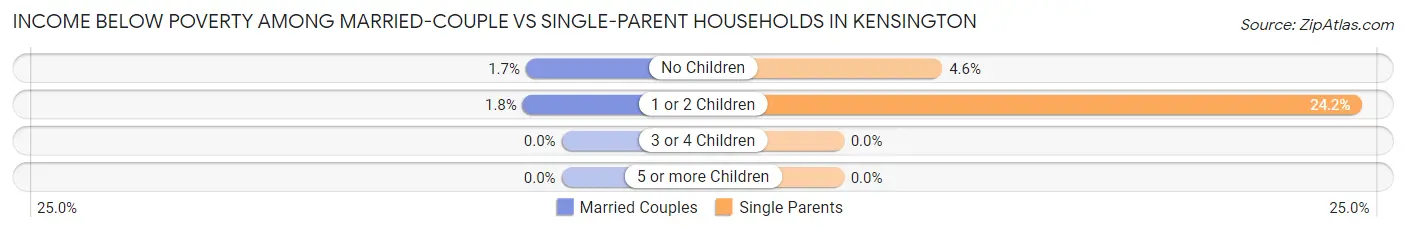
| Children | Married-Couple Families | Single-Parent Households |
| No Children | 25 (1.7%) | 9 (4.6%) |
| 1 or 2 Children | 13 (1.8%) | 113 (24.1%) |
| 3 or 4 Children | 0 (0.0%) | 0 (0.0%) |
| 5 or more Children | 0 (0.0%) | 0 (0.0%) |
| Total | 38 (1.7%) | 122 (18.1%) |
Race in Kensington
The most populous races in Kensington are White / Caucasian (8,341 | 87.1%), Hispanic or Latino (791 | 8.3%), and Two or more Races (585 | 6.1%).
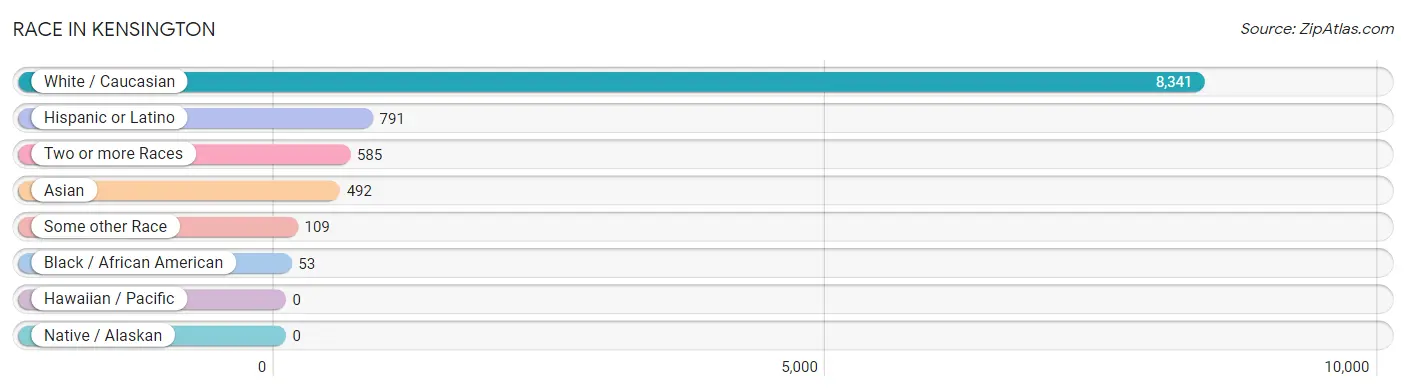
| Race | # Population | % Population |
| Asian | 492 | 5.1% |
| Black / African American | 53 | 0.5% |
| Hawaiian / Pacific | 0 | 0.0% |
| Hispanic or Latino | 791 | 8.3% |
| Native / Alaskan | 0 | 0.0% |
| White / Caucasian | 8,341 | 87.1% |
| Two or more Races | 585 | 6.1% |
| Some other Race | 109 | 1.1% |
| Total | 9,580 | 100.0% |
Ancestry in Kensington
The most populous ancestries reported in Kensington are Polish (2,342 | 24.4%), Italian (2,004 | 20.9%), Irish (1,100 | 11.5%), German (851 | 8.9%), and English (826 | 8.6%), together accounting for 74.4% of all Kensington residents.
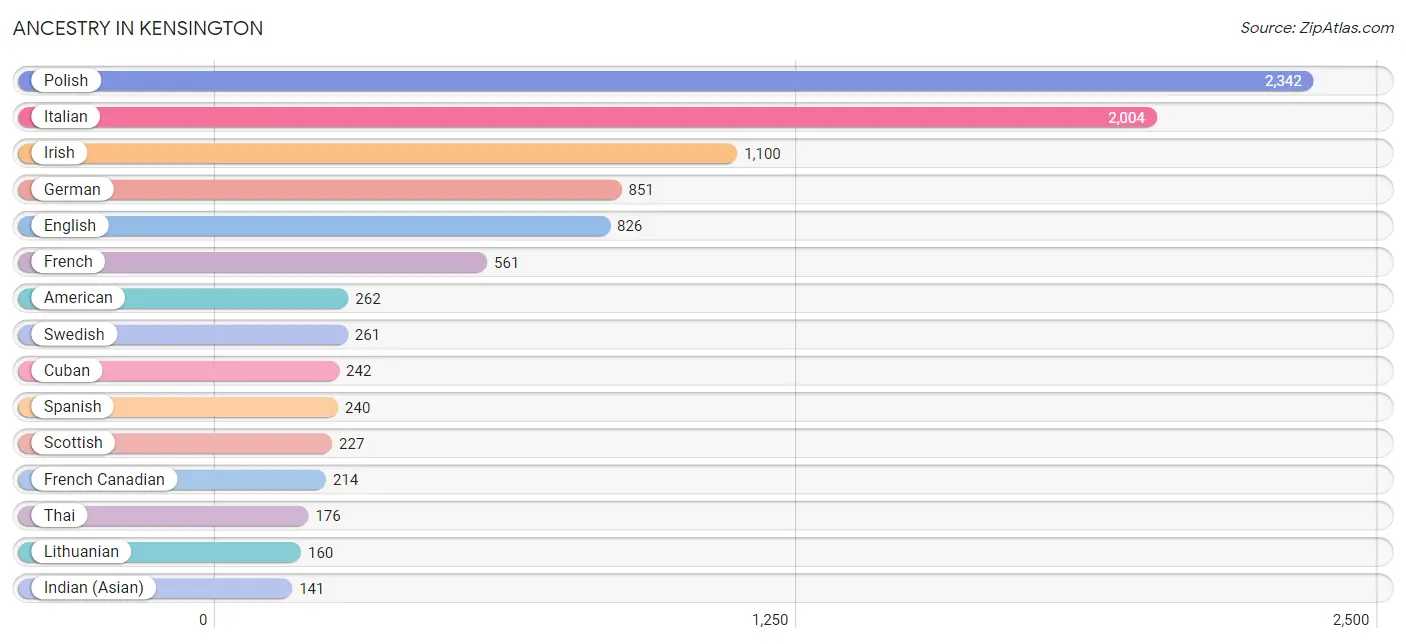
| Ancestry | # Population | % Population |
| American | 262 | 2.7% |
| Arab | 25 | 0.3% |
| Argentinean | 60 | 0.6% |
| Armenian | 27 | 0.3% |
| Assyrian / Chaldean / Syriac | 13 | 0.1% |
| Austrian | 8 | 0.1% |
| Bhutanese | 40 | 0.4% |
| Brazilian | 18 | 0.2% |
| British | 18 | 0.2% |
| Canadian | 76 | 0.8% |
| Central American Indian | 49 | 0.5% |
| Cuban | 242 | 2.5% |
| Czech | 51 | 0.5% |
| Danish | 38 | 0.4% |
| Eastern European | 49 | 0.5% |
| English | 826 | 8.6% |
| European | 67 | 0.7% |
| Filipino | 7 | 0.1% |
| Finnish | 58 | 0.6% |
| French | 561 | 5.9% |
| French Canadian | 214 | 2.2% |
| German | 851 | 8.9% |
| Hungarian | 29 | 0.3% |
| Indian (Asian) | 141 | 1.5% |
| Irish | 1,100 | 11.5% |
| Italian | 2,004 | 20.9% |
| Korean | 92 | 1.0% |
| Lebanese | 25 | 0.3% |
| Lithuanian | 160 | 1.7% |
| Mexican | 41 | 0.4% |
| Northern European | 9 | 0.1% |
| Pakistani | 56 | 0.6% |
| Polish | 2,342 | 24.4% |
| Portuguese | 98 | 1.0% |
| Puerto Rican | 80 | 0.8% |
| Romanian | 18 | 0.2% |
| Russian | 123 | 1.3% |
| Scotch-Irish | 36 | 0.4% |
| Scottish | 227 | 2.4% |
| Slavic | 10 | 0.1% |
| Slovak | 78 | 0.8% |
| Slovene | 75 | 0.8% |
| South American | 60 | 0.6% |
| Spaniard | 128 | 1.3% |
| Spanish | 240 | 2.5% |
| Swedish | 261 | 2.7% |
| Thai | 176 | 1.8% |
| Ukrainian | 113 | 1.2% | View All 48 Rows |
Immigrants in Kensington
The most numerous immigrant groups reported in Kensington came from Europe (413 | 4.3%), Asia (354 | 3.7%), Eastern Europe (314 | 3.3%), Poland (289 | 3.0%), and South Eastern Asia (148 | 1.5%), together accounting for 15.9% of all Kensington residents.
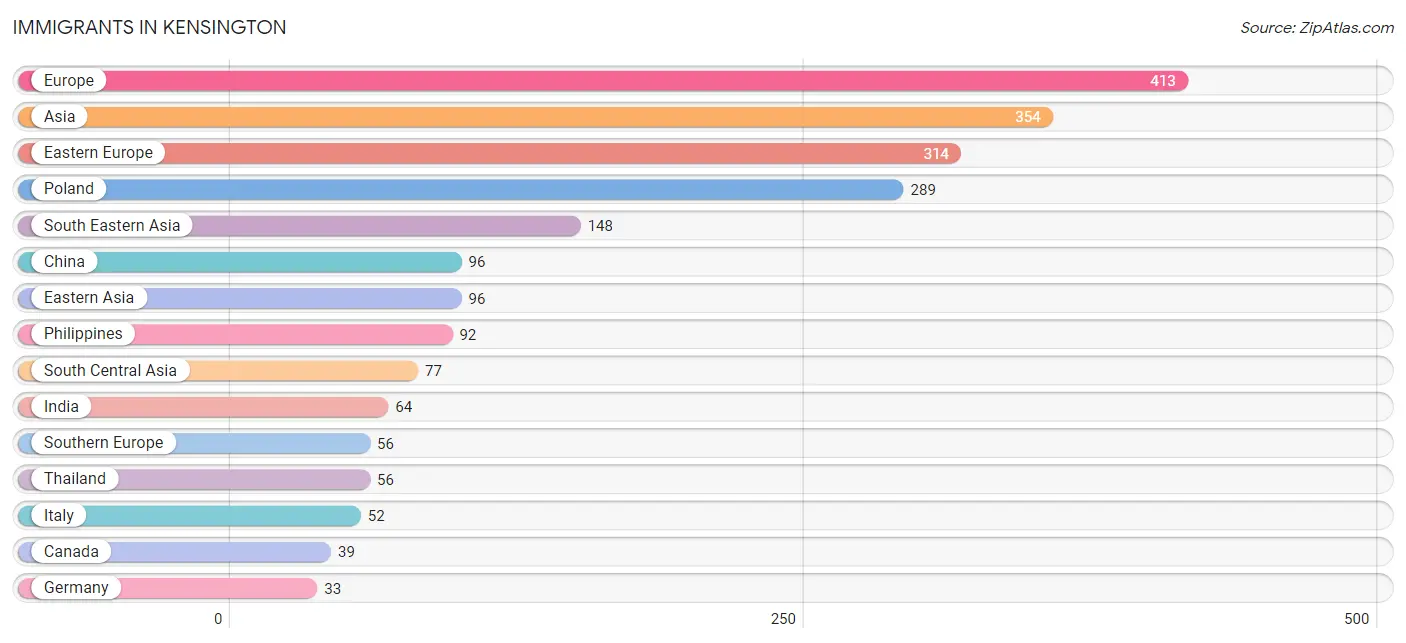
| Immigration Origin | # Population | % Population |
| Asia | 354 | 3.7% |
| Brazil | 18 | 0.2% |
| Canada | 39 | 0.4% |
| Caribbean | 14 | 0.2% |
| China | 96 | 1.0% |
| Cuba | 14 | 0.2% |
| Eastern Asia | 96 | 1.0% |
| Eastern Europe | 314 | 3.3% |
| Europe | 413 | 4.3% |
| Germany | 33 | 0.3% |
| Hungary | 5 | 0.1% |
| India | 64 | 0.7% |
| Iran | 13 | 0.1% |
| Italy | 52 | 0.5% |
| Latin America | 32 | 0.3% |
| Northern Europe | 10 | 0.1% |
| Philippines | 92 | 1.0% |
| Poland | 289 | 3.0% |
| Russia | 20 | 0.2% |
| Scotland | 10 | 0.1% |
| South America | 18 | 0.2% |
| South Central Asia | 77 | 0.8% |
| South Eastern Asia | 148 | 1.5% |
| Southern Europe | 56 | 0.6% |
| Spain | 4 | 0.0% |
| Taiwan | 7 | 0.1% |
| Thailand | 56 | 0.6% |
| Western Asia | 33 | 0.3% |
| Western Europe | 33 | 0.3% | View All 29 Rows |
Sex and Age in Kensington
Sex and Age in Kensington
The most populous age groups in Kensington are 55 to 59 Years (626 | 12.7%) for men and 65 to 69 Years (482 | 10.4%) for women.
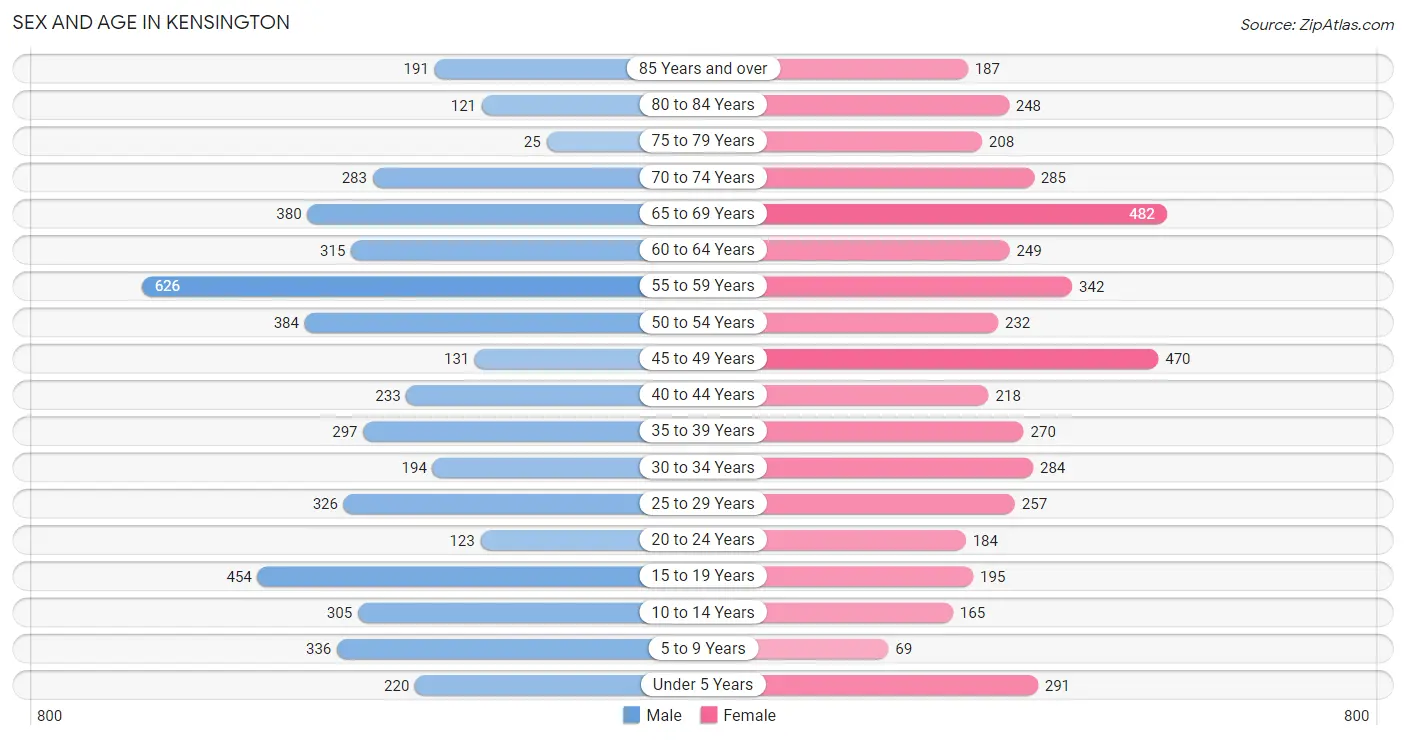
| Age Bracket | Male | Female |
| Under 5 Years | 220 (4.4%) | 291 (6.3%) |
| 5 to 9 Years | 336 (6.8%) | 69 (1.5%) |
| 10 to 14 Years | 305 (6.2%) | 165 (3.6%) |
| 15 to 19 Years | 454 (9.2%) | 195 (4.2%) |
| 20 to 24 Years | 123 (2.5%) | 184 (4.0%) |
| 25 to 29 Years | 326 (6.6%) | 257 (5.5%) |
| 30 to 34 Years | 194 (3.9%) | 284 (6.1%) |
| 35 to 39 Years | 297 (6.0%) | 270 (5.8%) |
| 40 to 44 Years | 233 (4.7%) | 218 (4.7%) |
| 45 to 49 Years | 131 (2.6%) | 470 (10.1%) |
| 50 to 54 Years | 384 (7.8%) | 232 (5.0%) |
| 55 to 59 Years | 626 (12.7%) | 342 (7.4%) |
| 60 to 64 Years | 315 (6.4%) | 249 (5.4%) |
| 65 to 69 Years | 380 (7.7%) | 482 (10.4%) |
| 70 to 74 Years | 283 (5.7%) | 285 (6.1%) |
| 75 to 79 Years | 25 (0.5%) | 208 (4.5%) |
| 80 to 84 Years | 121 (2.5%) | 248 (5.3%) |
| 85 Years and over | 191 (3.9%) | 187 (4.0%) |
| Total | 4,944 (100.0%) | 4,636 (100.0%) |
Families and Households in Kensington
Median Family Size in Kensington
The median family size in Kensington is 2.71 persons per family, with married-couple families (2,304 | 77.3%) accounting for the largest median family size of 2.8 persons per family. On the other hand, single male/father families (248 | 8.3%) represent the smallest median family size with 2.21 persons per family.
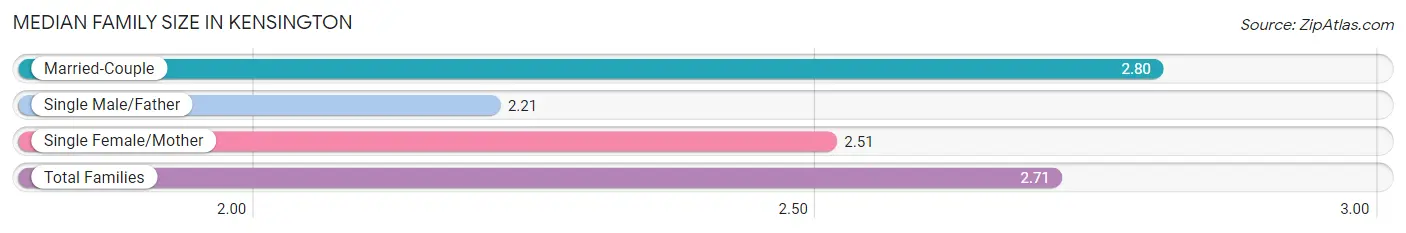
| Family Type | # Families | Family Size |
| Married-Couple | 2,304 (77.3%) | 2.80 |
| Single Male/Father | 248 (8.3%) | 2.21 |
| Single Female/Mother | 427 (14.3%) | 2.51 |
| Total Families | 2,979 (100.0%) | 2.71 |
Median Household Size in Kensington
The median household size in Kensington is 2.27 persons per household, with married-couple households (2,304 | 55.1%) accounting for the largest median household size of 2.83 persons per household. non-family households (1,205 | 28.8%) represent the smallest median household size with 1.06 persons per household.
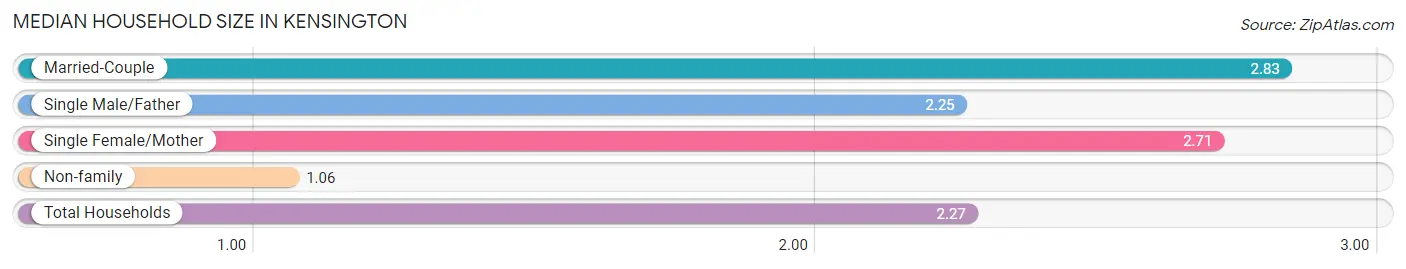
| Household Type | # Households | Household Size |
| Married-Couple | 2,304 (55.1%) | 2.83 |
| Single Male/Father | 248 (5.9%) | 2.25 |
| Single Female/Mother | 427 (10.2%) | 2.71 |
| Non-family | 1,205 (28.8%) | 1.06 |
| Total Households | 4,184 (100.0%) | 2.27 |
Household Size by Marriage Status in Kensington
Out of a total of 4,184 households in Kensington, 2,979 (71.2%) are family households, while 1,205 (28.8%) are nonfamily households. The most numerous type of family households are 2-person households, comprising 1,384, and the most common type of nonfamily households are 1-person households, comprising 1,140.
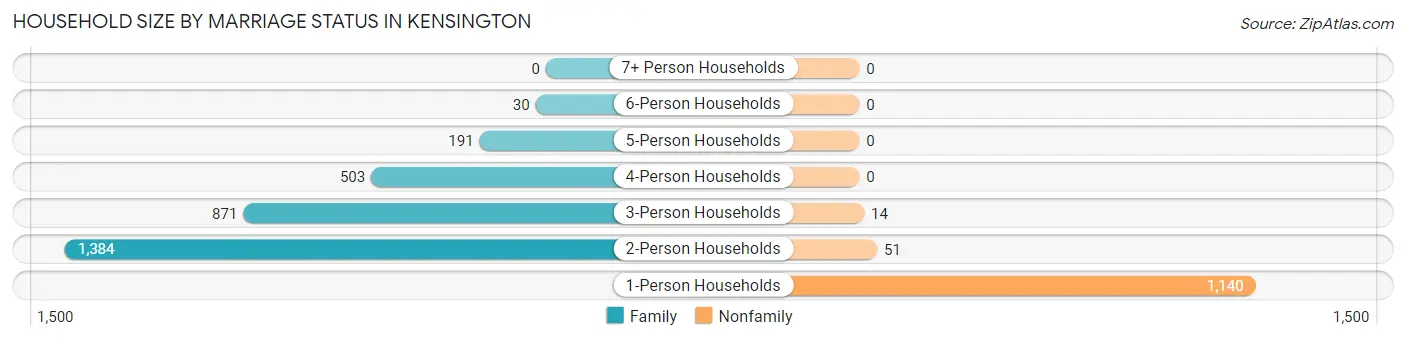
| Household Size | Family Households | Nonfamily Households |
| 1-Person Households | - | 1,140 (27.3%) |
| 2-Person Households | 1,384 (33.1%) | 51 (1.2%) |
| 3-Person Households | 871 (20.8%) | 14 (0.3%) |
| 4-Person Households | 503 (12.0%) | 0 (0.0%) |
| 5-Person Households | 191 (4.6%) | 0 (0.0%) |
| 6-Person Households | 30 (0.7%) | 0 (0.0%) |
| 7+ Person Households | 0 (0.0%) | 0 (0.0%) |
| Total | 2,979 (71.2%) | 1,205 (28.8%) |
Female Fertility in Kensington
Fertility by Age in Kensington
Average fertility rate in Kensington is 40.0 births per 1,000 women. Women in the age bracket of 20 to 34 years have the highest fertility rate with 105.0 births per 1,000 women. Women in the age bracket of 20 to 34 years acount for 100.0% of all women with births.
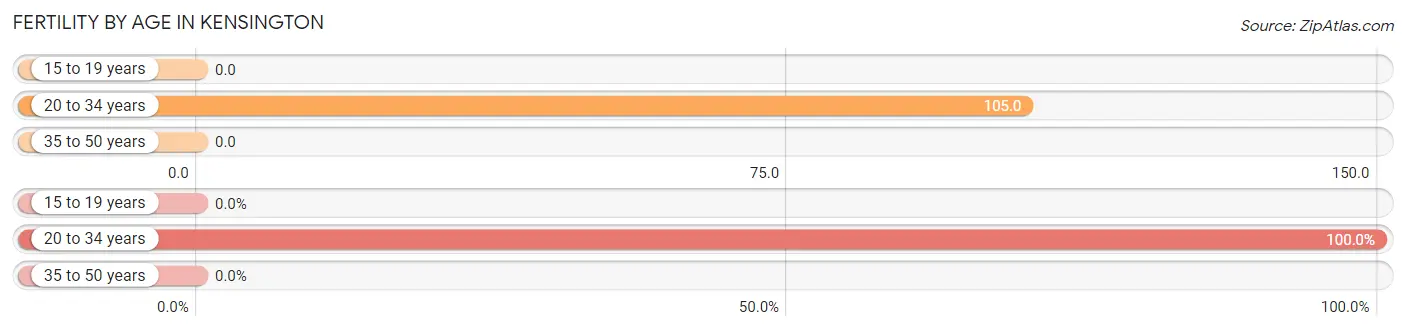
| Age Bracket | Women with Births | Births / 1,000 Women |
| 15 to 19 years | 0 (0.0%) | 0.0 |
| 20 to 34 years | 76 (100.0%) | 105.0 |
| 35 to 50 years | 0 (0.0%) | 0.0 |
| Total | 76 (100.0%) | 40.0 |
Fertility by Age by Marriage Status in Kensington
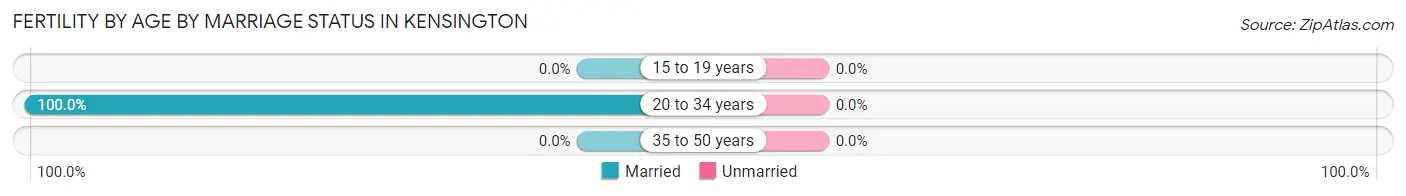
| Age Bracket | Married | Unmarried |
| 15 to 19 years | 0 (0.0%) | 0 (0.0%) |
| 20 to 34 years | 76 (100.0%) | 0 (0.0%) |
| 35 to 50 years | 0 (0.0%) | 0 (0.0%) |
| Total | 76 (100.0%) | 0 (0.0%) |
Fertility by Education in Kensington
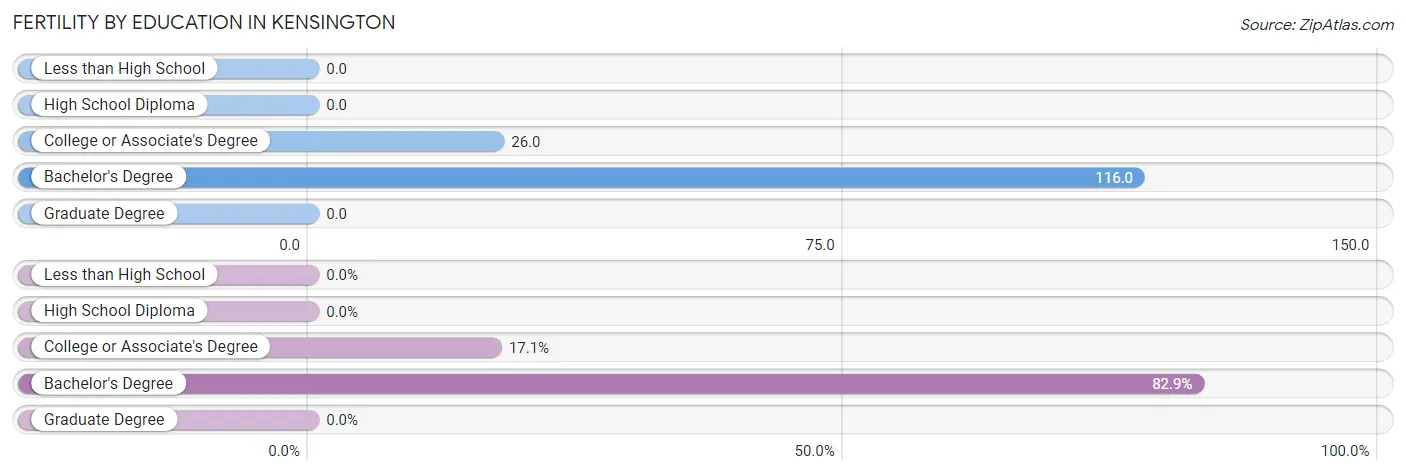
| Educational Attainment | Women with Births | Births / 1,000 Women |
| Less than High School | 0 (0.0%) | 0.0 |
| High School Diploma | 0 (0.0%) | 0.0 |
| College or Associate's Degree | 13 (17.1%) | 26.0 |
| Bachelor's Degree | 63 (82.9%) | 116.0 |
| Graduate Degree | 0 (0.0%) | 0.0 |
| Total | 76 (100.0%) | 40.0 |
Fertility by Education by Marriage Status in Kensington
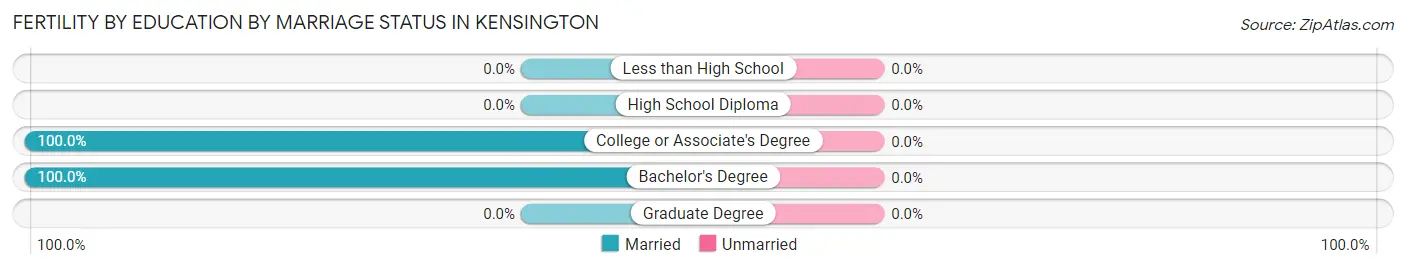
| Educational Attainment | Married | Unmarried |
| Less than High School | 0 (0.0%) | 0 (0.0%) |
| High School Diploma | 0 (0.0%) | 0 (0.0%) |
| College or Associate's Degree | 13 (100.0%) | 0 (0.0%) |
| Bachelor's Degree | 63 (100.0%) | 0 (0.0%) |
| Graduate Degree | 0 (0.0%) | 0 (0.0%) |
| Total | 76 (100.0%) | 0 (0.0%) |
Employment Characteristics in Kensington
Employment by Class of Employer in Kensington
Among the 5,468 employed individuals in Kensington, private company employees (3,453 | 63.1%), not-for-profit organizations (648 | 11.8%), and local government employees (474 | 8.7%) make up the most common classes of employment.
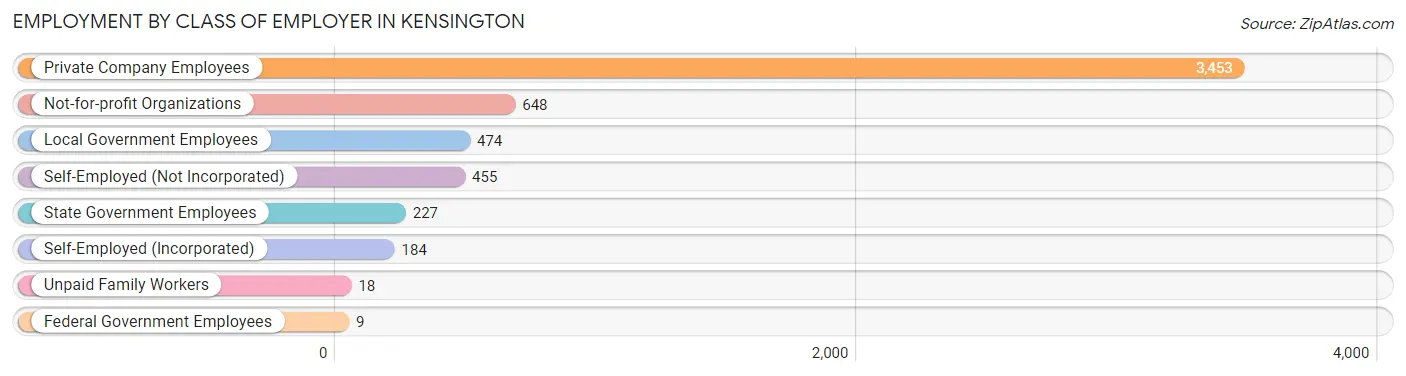
| Employer Class | # Employees | % Employees |
| Private Company Employees | 3,453 | 63.1% |
| Self-Employed (Incorporated) | 184 | 3.4% |
| Self-Employed (Not Incorporated) | 455 | 8.3% |
| Not-for-profit Organizations | 648 | 11.8% |
| Local Government Employees | 474 | 8.7% |
| State Government Employees | 227 | 4.2% |
| Federal Government Employees | 9 | 0.2% |
| Unpaid Family Workers | 18 | 0.3% |
| Total | 5,468 | 100.0% |
Employment Status by Age in Kensington
According to the labor force statistics for Kensington, out of the total population over 16 years of age (8,126), 69.6% or 5,656 individuals are in the labor force, with 2.2% or 124 of them unemployed. The age group with the highest labor force participation rate is 55 to 59 years, with 93.7% or 907 individuals in the labor force. Within the labor force, the 45 to 54 years age range has the highest percentage of unemployed individuals, with 6.4% or 70 of them being unemployed.
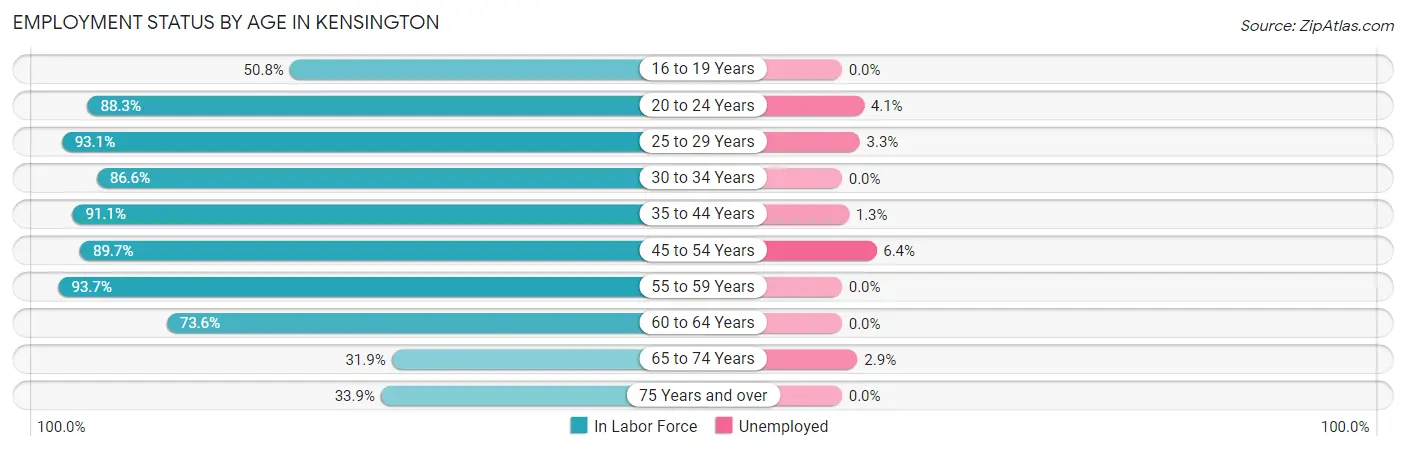
| Age Bracket | In Labor Force | Unemployed |
| 16 to 19 Years | 295 (50.8%) | 0 (0.0%) |
| 20 to 24 Years | 271 (88.3%) | 11 (4.1%) |
| 25 to 29 Years | 543 (93.1%) | 18 (3.3%) |
| 30 to 34 Years | 414 (86.6%) | 0 (0.0%) |
| 35 to 44 Years | 927 (91.1%) | 12 (1.3%) |
| 45 to 54 Years | 1,092 (89.7%) | 70 (6.4%) |
| 55 to 59 Years | 907 (93.7%) | 0 (0.0%) |
| 60 to 64 Years | 415 (73.6%) | 0 (0.0%) |
| 65 to 74 Years | 456 (31.9%) | 13 (2.9%) |
| 75 Years and over | 332 (33.9%) | 0 (0.0%) |
| Total | 5,656 (69.6%) | 124 (2.2%) |
Employment Status by Educational Attainment in Kensington
According to labor force statistics for Kensington, 89.0% of individuals (4,297) out of the total population between 25 and 64 years of age (4,828) are in the labor force, with 2.3% or 99 of them being unemployed. The group with the highest labor force participation rate are those with the educational attainment of less than high school, with 100.0% or 156 individuals in the labor force. Within the labor force, individuals with bachelor's degree or higher education have the highest percentage of unemployment, with 3.1% or 68 of them being unemployed.
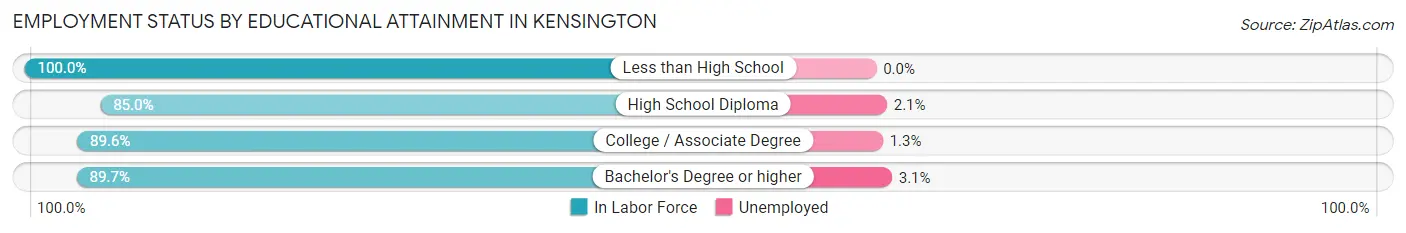
| Educational Attainment | In Labor Force | Unemployed |
| Less than High School | 156 (100.0%) | 0 (0.0%) |
| High School Diploma | 850 (85.0%) | 21 (2.1%) |
| College / Associate Degree | 1,111 (89.6%) | 16 (1.3%) |
| Bachelor's Degree or higher | 2,182 (89.7%) | 75 (3.1%) |
| Total | 4,297 (89.0%) | 111 (2.3%) |
Employment Occupations by Sex in Kensington
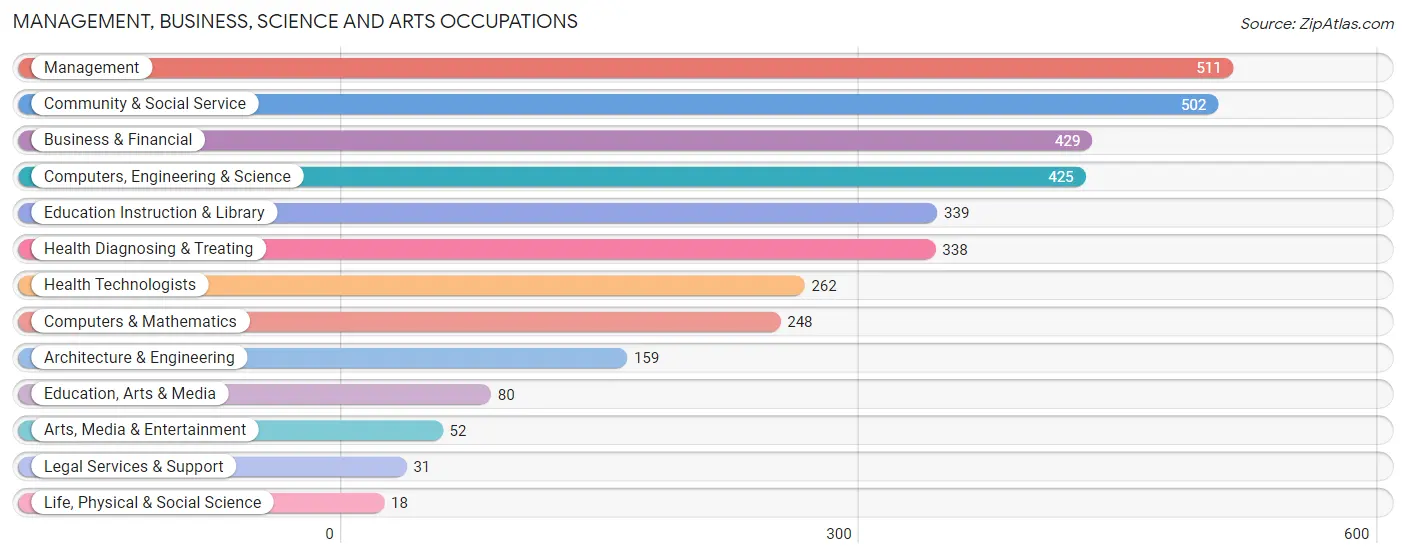
Management, Business, Science and Arts Occupations
The most common Management, Business, Science and Arts occupations in Kensington are Management (511 | 9.2%), Community & Social Service (502 | 9.1%), Business & Financial (429 | 7.8%), Computers, Engineering & Science (425 | 7.7%), and Education Instruction & Library (339 | 6.1%).
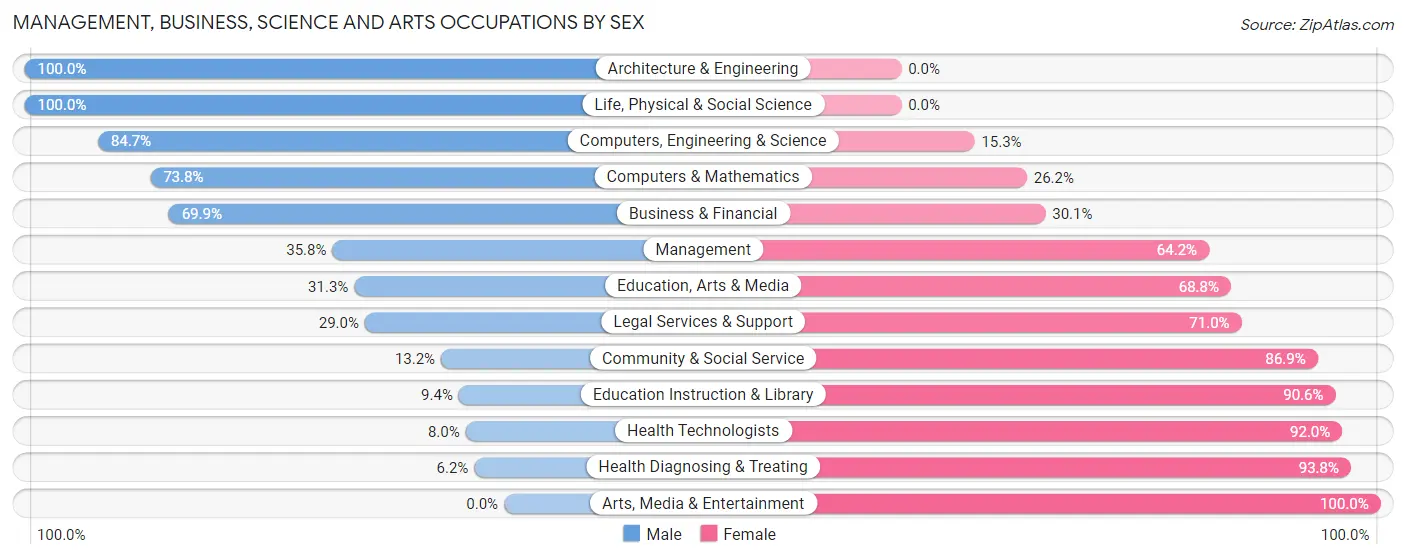
Management, Business, Science and Arts Occupations by Sex
Within the Management, Business, Science and Arts occupations in Kensington, the most male-oriented occupations are Architecture & Engineering (100.0%), Life, Physical & Social Science (100.0%), and Computers, Engineering & Science (84.7%), while the most female-oriented occupations are Arts, Media & Entertainment (100.0%), Health Diagnosing & Treating (93.8%), and Health Technologists (92.0%).
| Occupation | Male | Female |
| Management | 183 (35.8%) | 328 (64.2%) |
| Business & Financial | 300 (69.9%) | 129 (30.1%) |
| Computers, Engineering & Science | 360 (84.7%) | 65 (15.3%) |
| Computers & Mathematics | 183 (73.8%) | 65 (26.2%) |
| Architecture & Engineering | 159 (100.0%) | 0 (0.0%) |
| Life, Physical & Social Science | 18 (100.0%) | 0 (0.0%) |
| Community & Social Service | 66 (13.2%) | 436 (86.9%) |
| Education, Arts & Media | 25 (31.2%) | 55 (68.8%) |
| Legal Services & Support | 9 (29.0%) | 22 (71.0%) |
| Education Instruction & Library | 32 (9.4%) | 307 (90.6%) |
| Arts, Media & Entertainment | 0 (0.0%) | 52 (100.0%) |
| Health Diagnosing & Treating | 21 (6.2%) | 317 (93.8%) |
| Health Technologists | 21 (8.0%) | 241 (92.0%) |
| Total (Category) | 930 (42.2%) | 1,275 (57.8%) |
| Total (Overall) | 2,943 (53.2%) | 2,585 (46.8%) |
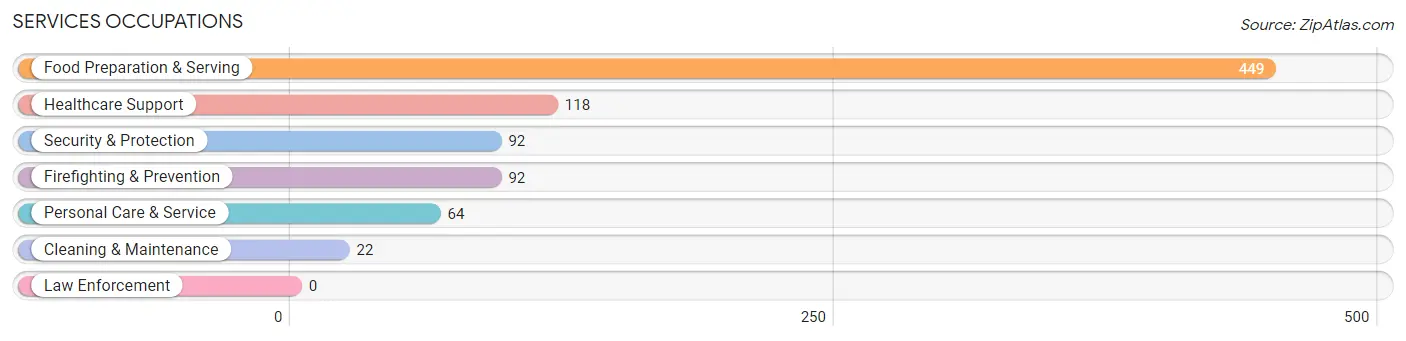
Services Occupations
The most common Services occupations in Kensington are Food Preparation & Serving (449 | 8.1%), Healthcare Support (118 | 2.1%), Security & Protection (92 | 1.7%), Firefighting & Prevention (92 | 1.7%), and Personal Care & Service (64 | 1.2%).
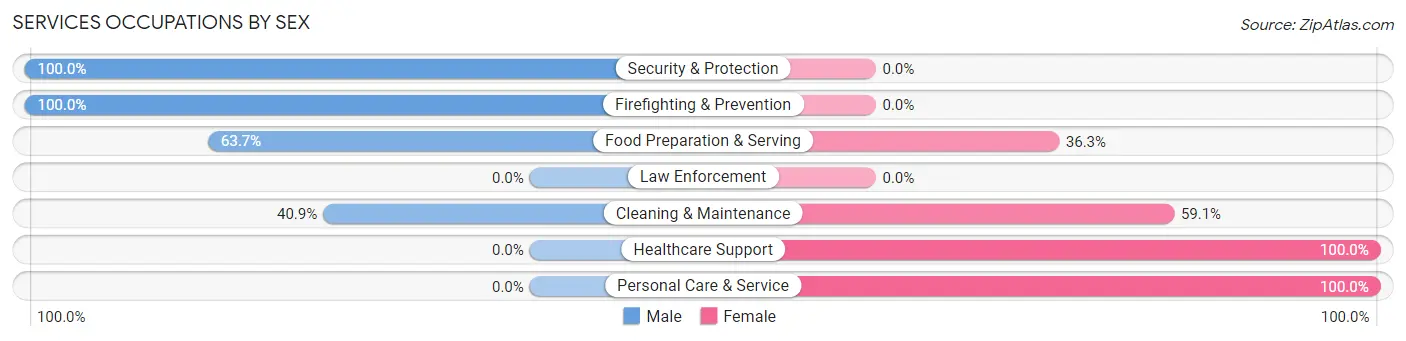
Services Occupations by Sex
Within the Services occupations in Kensington, the most male-oriented occupations are Security & Protection (100.0%), Firefighting & Prevention (100.0%), and Food Preparation & Serving (63.7%), while the most female-oriented occupations are Healthcare Support (100.0%), Personal Care & Service (100.0%), and Cleaning & Maintenance (59.1%).
| Occupation | Male | Female |
| Healthcare Support | 0 (0.0%) | 118 (100.0%) |
| Security & Protection | 92 (100.0%) | 0 (0.0%) |
| Firefighting & Prevention | 92 (100.0%) | 0 (0.0%) |
| Law Enforcement | 0 (0.0%) | 0 (0.0%) |
| Food Preparation & Serving | 286 (63.7%) | 163 (36.3%) |
| Cleaning & Maintenance | 9 (40.9%) | 13 (59.1%) |
| Personal Care & Service | 0 (0.0%) | 64 (100.0%) |
| Total (Category) | 387 (51.9%) | 358 (48.0%) |
| Total (Overall) | 2,943 (53.2%) | 2,585 (46.8%) |
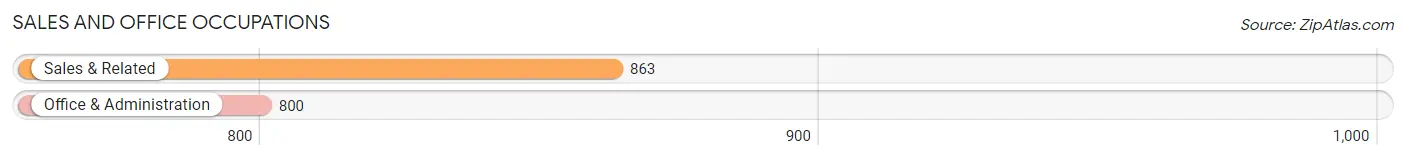
Sales and Office Occupations
The most common Sales and Office occupations in Kensington are Sales & Related (863 | 15.6%), and Office & Administration (800 | 14.5%).
Sales and Office Occupations by Sex
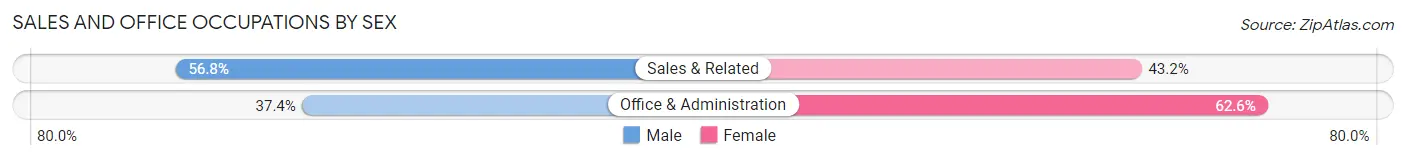
| Occupation | Male | Female |
| Sales & Related | 490 (56.8%) | 373 (43.2%) |
| Office & Administration | 299 (37.4%) | 501 (62.6%) |
| Total (Category) | 789 (47.4%) | 874 (52.6%) |
| Total (Overall) | 2,943 (53.2%) | 2,585 (46.8%) |
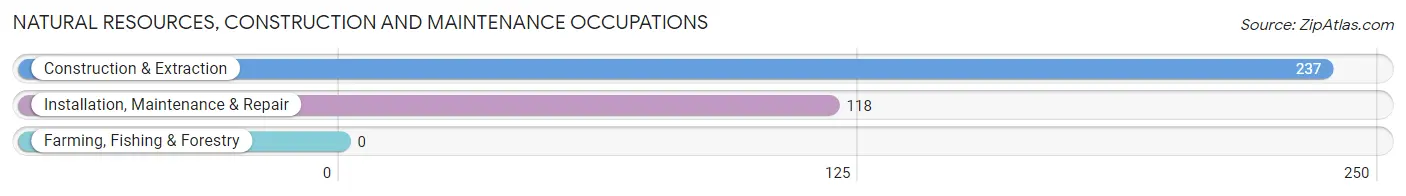
Natural Resources, Construction and Maintenance Occupations
The most common Natural Resources, Construction and Maintenance occupations in Kensington are Construction & Extraction (237 | 4.3%), and Installation, Maintenance & Repair (118 | 2.1%).
Natural Resources, Construction and Maintenance Occupations by Sex
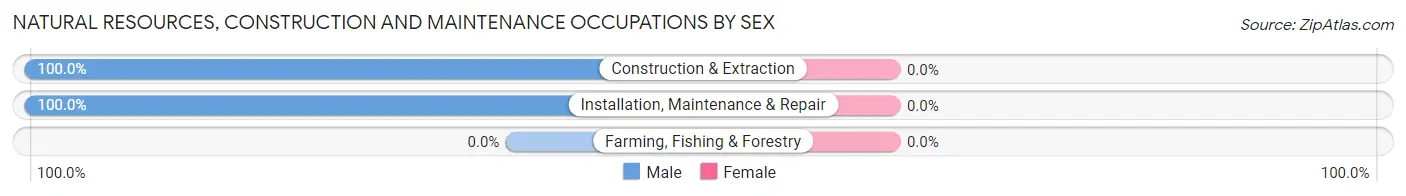
| Occupation | Male | Female |
| Farming, Fishing & Forestry | 0 (0.0%) | 0 (0.0%) |
| Construction & Extraction | 237 (100.0%) | 0 (0.0%) |
| Installation, Maintenance & Repair | 118 (100.0%) | 0 (0.0%) |
| Total (Category) | 355 (100.0%) | 0 (0.0%) |
| Total (Overall) | 2,943 (53.2%) | 2,585 (46.8%) |
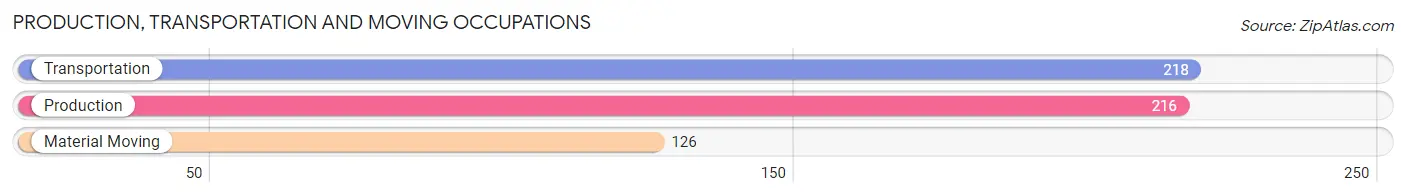
Production, Transportation and Moving Occupations
The most common Production, Transportation and Moving occupations in Kensington are Transportation (218 | 3.9%), Production (216 | 3.9%), and Material Moving (126 | 2.3%).
Production, Transportation and Moving Occupations by Sex
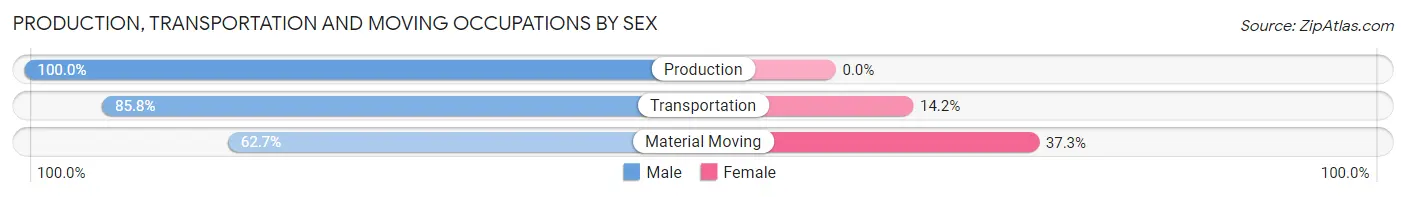
| Occupation | Male | Female |
| Production | 216 (100.0%) | 0 (0.0%) |
| Transportation | 187 (85.8%) | 31 (14.2%) |
| Material Moving | 79 (62.7%) | 47 (37.3%) |
| Total (Category) | 482 (86.1%) | 78 (13.9%) |
| Total (Overall) | 2,943 (53.2%) | 2,585 (46.8%) |
Employment Industries by Sex in Kensington
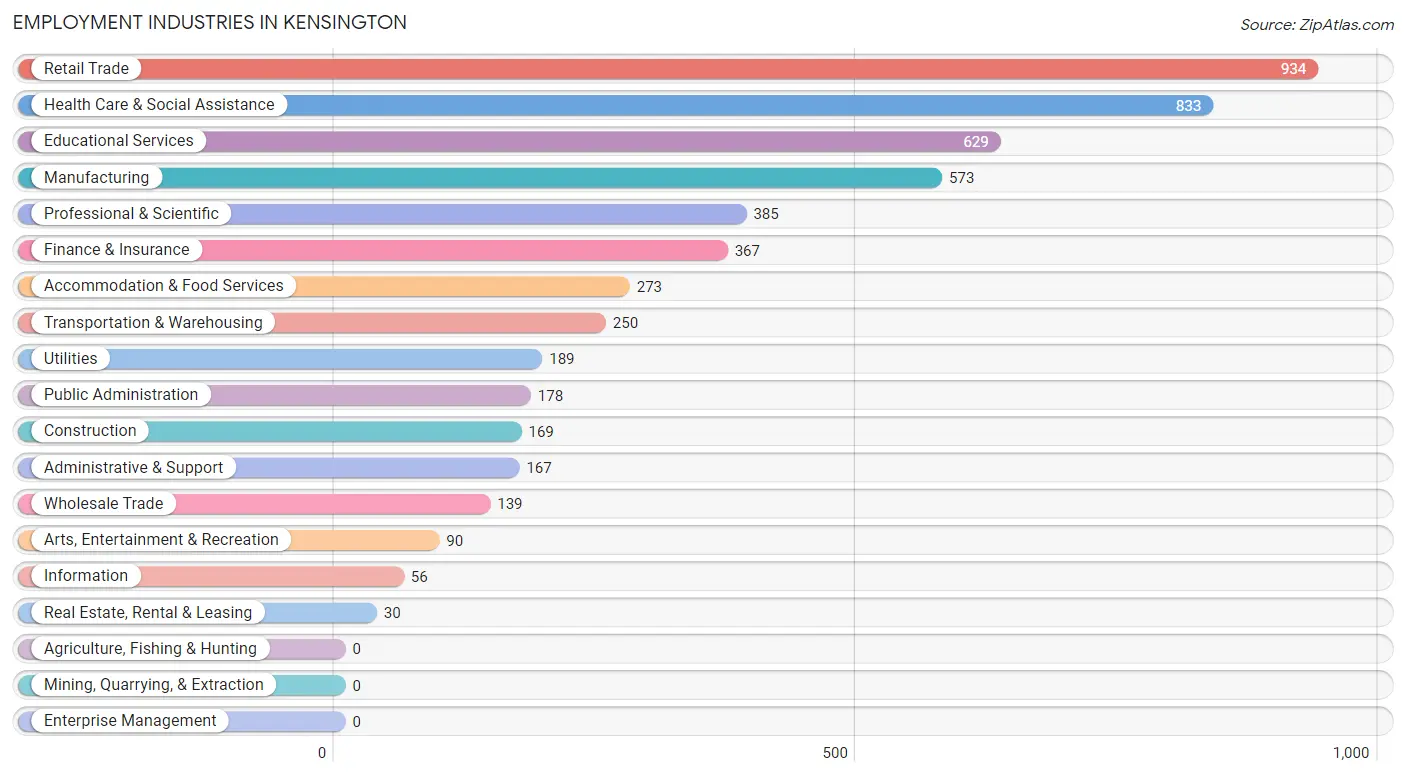
Employment Industries in Kensington
The major employment industries in Kensington include Retail Trade (934 | 16.9%), Health Care & Social Assistance (833 | 15.1%), Educational Services (629 | 11.4%), Manufacturing (573 | 10.4%), and Professional & Scientific (385 | 7.0%).
Employment Industries by Sex in Kensington
The Kensington industries that see more men than women are Construction (100.0%), Real Estate, Rental & Leasing (100.0%), and Manufacturing (94.1%), whereas the industries that tend to have a higher number of women are Arts, Entertainment & Recreation (78.9%), Educational Services (77.9%), and Health Care & Social Assistance (74.3%).
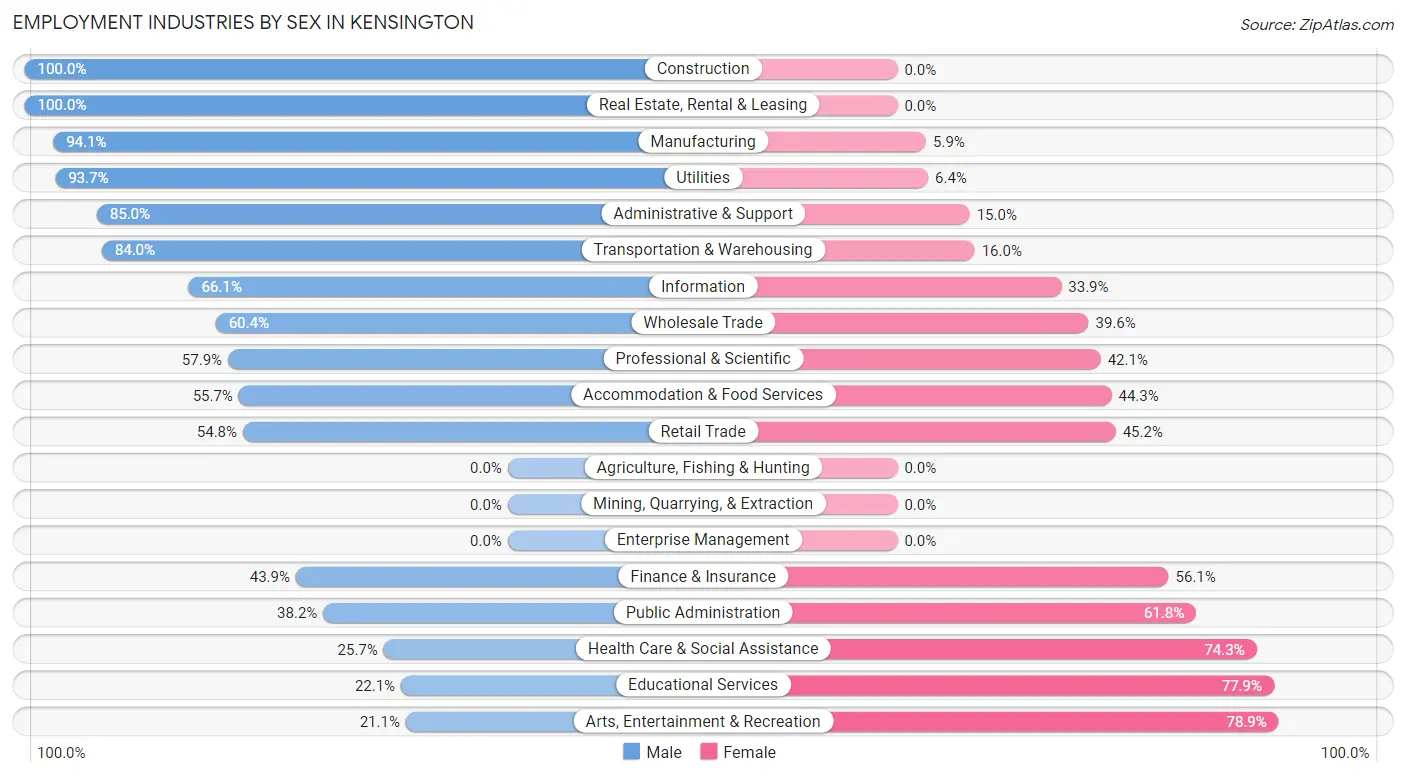
| Industry | Male | Female |
| Agriculture, Fishing & Hunting | 0 (0.0%) | 0 (0.0%) |
| Mining, Quarrying, & Extraction | 0 (0.0%) | 0 (0.0%) |
| Construction | 169 (100.0%) | 0 (0.0%) |
| Manufacturing | 539 (94.1%) | 34 (5.9%) |
| Wholesale Trade | 84 (60.4%) | 55 (39.6%) |
| Retail Trade | 512 (54.8%) | 422 (45.2%) |
| Transportation & Warehousing | 210 (84.0%) | 40 (16.0%) |
| Utilities | 177 (93.6%) | 12 (6.4%) |
| Information | 37 (66.1%) | 19 (33.9%) |
| Finance & Insurance | 161 (43.9%) | 206 (56.1%) |
| Real Estate, Rental & Leasing | 30 (100.0%) | 0 (0.0%) |
| Professional & Scientific | 223 (57.9%) | 162 (42.1%) |
| Enterprise Management | 0 (0.0%) | 0 (0.0%) |
| Administrative & Support | 142 (85.0%) | 25 (15.0%) |
| Educational Services | 139 (22.1%) | 490 (77.9%) |
| Health Care & Social Assistance | 214 (25.7%) | 619 (74.3%) |
| Arts, Entertainment & Recreation | 19 (21.1%) | 71 (78.9%) |
| Accommodation & Food Services | 152 (55.7%) | 121 (44.3%) |
| Public Administration | 68 (38.2%) | 110 (61.8%) |
| Total | 2,943 (53.2%) | 2,585 (46.8%) |
Education in Kensington
School Enrollment in Kensington
The most common levels of schooling among the 2,036 students in Kensington are high school (638 | 31.3%), middle school (354 | 17.4%), and elementary school (345 | 16.9%).
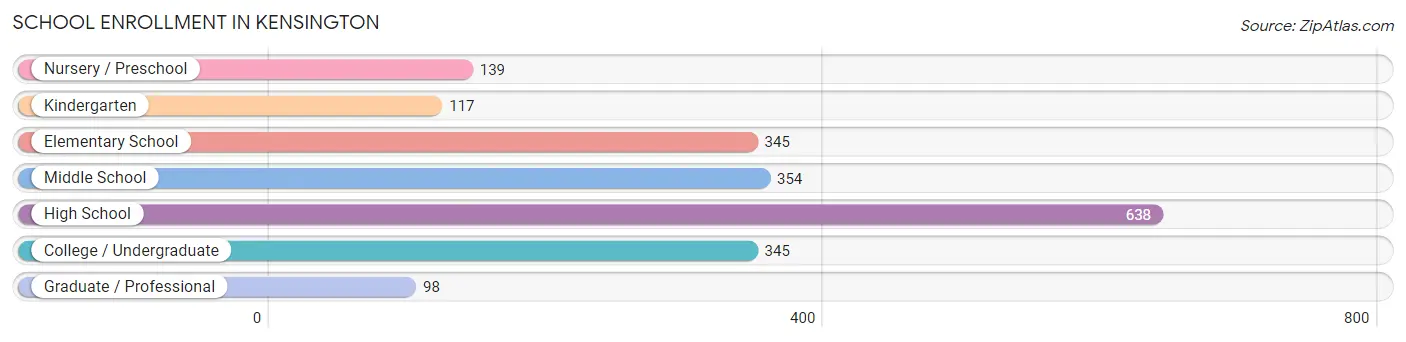
| School Level | # Students | % Students |
| Nursery / Preschool | 139 | 6.8% |
| Kindergarten | 117 | 5.8% |
| Elementary School | 345 | 16.9% |
| Middle School | 354 | 17.4% |
| High School | 638 | 31.3% |
| College / Undergraduate | 345 | 16.9% |
| Graduate / Professional | 98 | 4.8% |
| Total | 2,036 | 100.0% |
School Enrollment by Age by Funding Source in Kensington
Out of a total of 2,036 students who are enrolled in schools in Kensington, 275 (13.5%) attend a private institution, while the remaining 1,761 (86.5%) are enrolled in public schools. The age group of 25 to 34 year olds has the highest likelihood of being enrolled in private schools, with 89 (75.4% in the age bracket) enrolled. Conversely, the age group of 5 to 9 year old has the lowest likelihood of being enrolled in a private school, with 377 (100.0% in the age bracket) attending a public institution.
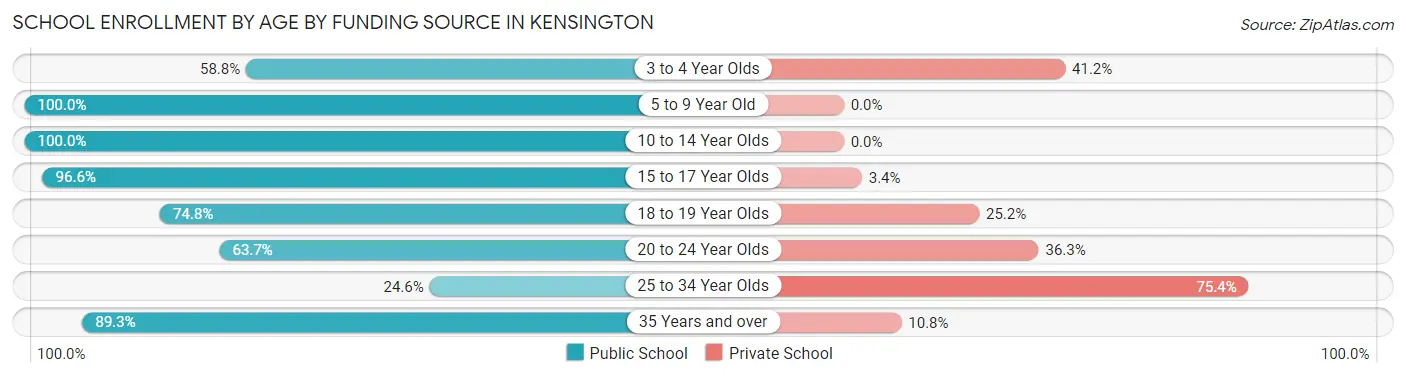
| Age Bracket | Public School | Private School |
| 3 to 4 Year Olds | 114 (58.8%) | 80 (41.2%) |
| 5 to 9 Year Old | 377 (100.0%) | 0 (0.0%) |
| 10 to 14 Year Olds | 470 (100.0%) | 0 (0.0%) |
| 15 to 17 Year Olds | 516 (96.6%) | 18 (3.4%) |
| 18 to 19 Year Olds | 86 (74.8%) | 29 (25.2%) |
| 20 to 24 Year Olds | 86 (63.7%) | 49 (36.3%) |
| 25 to 34 Year Olds | 29 (24.6%) | 89 (75.4%) |
| 35 Years and over | 83 (89.2%) | 10 (10.7%) |
| Total | 1,761 (86.5%) | 275 (13.5%) |
Educational Attainment by Field of Study in Kensington
Business (892 | 26.4%), social sciences (429 | 12.7%), engineering (318 | 9.4%), education (284 | 8.4%), and psychology (246 | 7.3%) are the most common fields of study among 3,383 individuals in Kensington who have obtained a bachelor's degree or higher.
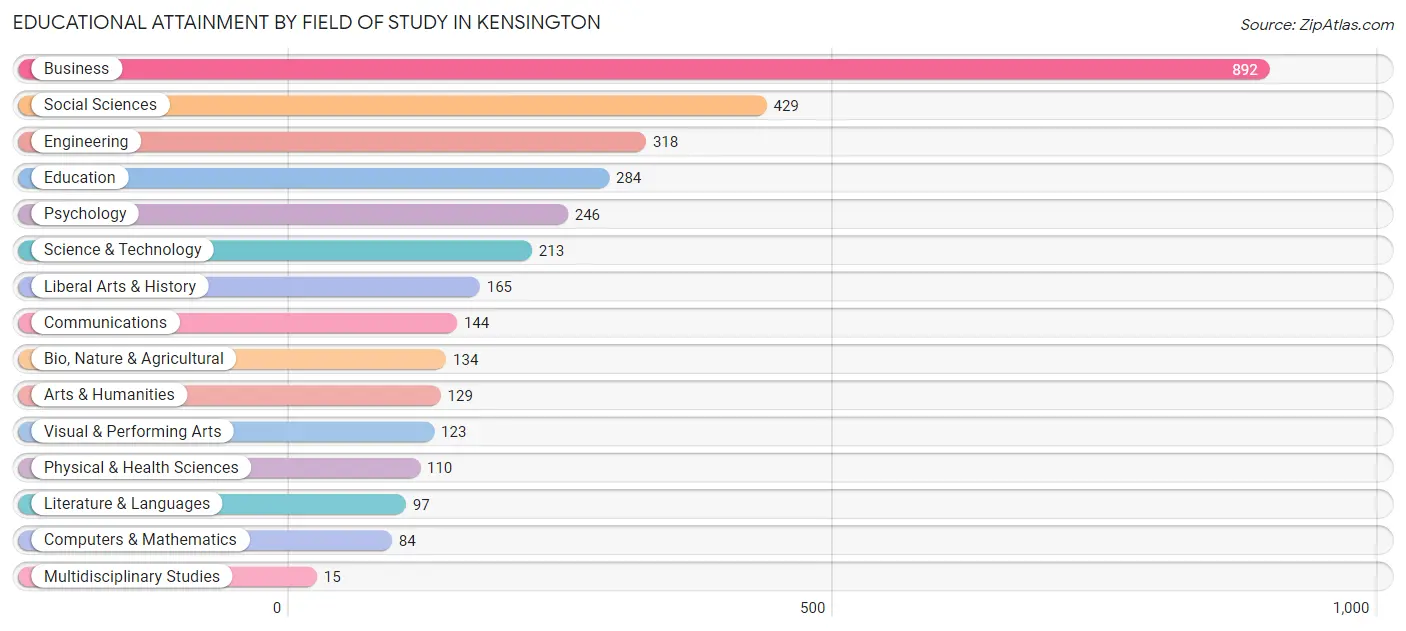
| Field of Study | # Graduates | % Graduates |
| Computers & Mathematics | 84 | 2.5% |
| Bio, Nature & Agricultural | 134 | 4.0% |
| Physical & Health Sciences | 110 | 3.3% |
| Psychology | 246 | 7.3% |
| Social Sciences | 429 | 12.7% |
| Engineering | 318 | 9.4% |
| Multidisciplinary Studies | 15 | 0.4% |
| Science & Technology | 213 | 6.3% |
| Business | 892 | 26.4% |
| Education | 284 | 8.4% |
| Literature & Languages | 97 | 2.9% |
| Liberal Arts & History | 165 | 4.9% |
| Visual & Performing Arts | 123 | 3.6% |
| Communications | 144 | 4.3% |
| Arts & Humanities | 129 | 3.8% |
| Total | 3,383 | 100.0% |
Transportation & Commute in Kensington
Vehicle Availability by Sex in Kensington
The most prevalent vehicle ownership categories in Kensington are males with 2 vehicles (1,575, accounting for 53.7%) and females with 2 vehicles (1,044, making up 62.1%).
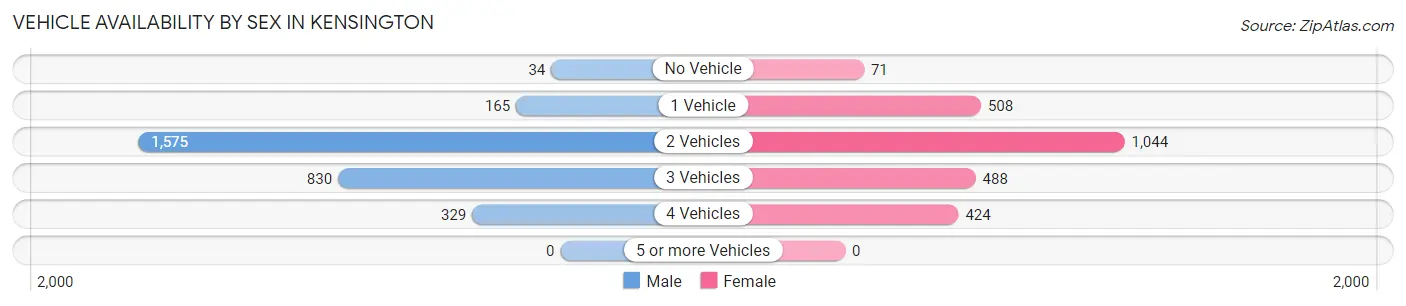
| Vehicles Available | Male | Female |
| No Vehicle | 34 (1.2%) | 71 (2.8%) |
| 1 Vehicle | 165 (5.6%) | 508 (20.0%) |
| 2 Vehicles | 1,575 (53.7%) | 1,044 (41.2%) |
| 3 Vehicles | 830 (28.3%) | 488 (19.3%) |
| 4 Vehicles | 329 (11.2%) | 424 (16.7%) |
| 5 or more Vehicles | 0 (0.0%) | 0 (0.0%) |
| Total | 2,933 (100.0%) | 2,535 (100.0%) |
Commute Time in Kensington
The most frequently occuring commute durations in Kensington are 20 to 24 minutes (939 commuters, 20.0%), 5 to 9 minutes (916 commuters, 19.5%), and 15 to 19 minutes (652 commuters, 13.9%).
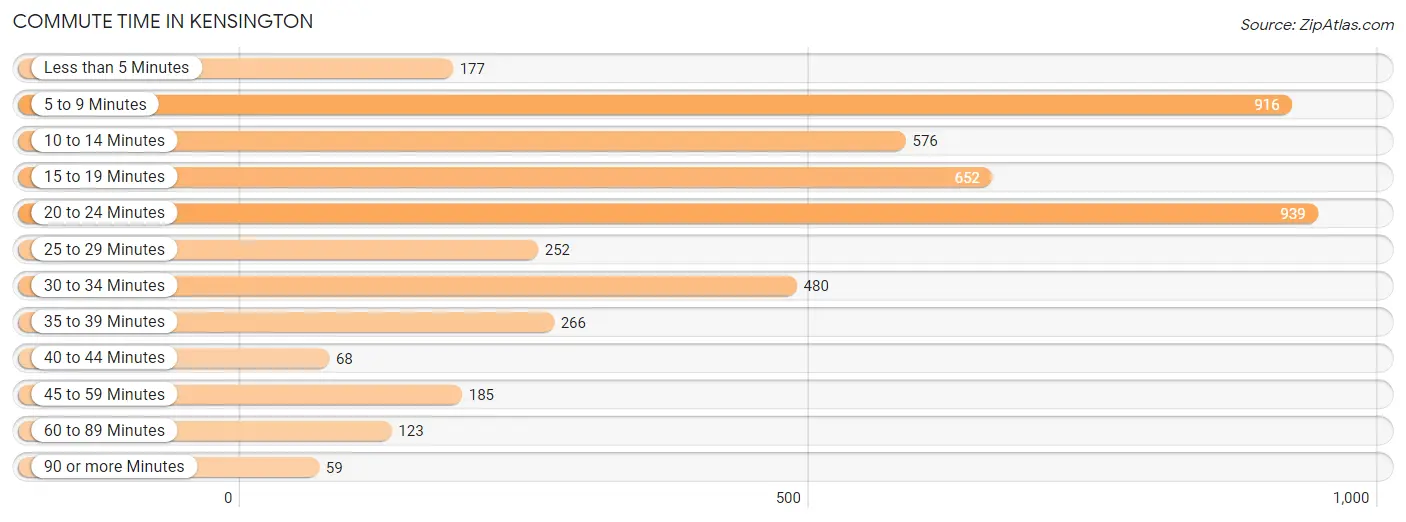
| Commute Time | # Commuters | % Commuters |
| Less than 5 Minutes | 177 | 3.8% |
| 5 to 9 Minutes | 916 | 19.5% |
| 10 to 14 Minutes | 576 | 12.3% |
| 15 to 19 Minutes | 652 | 13.9% |
| 20 to 24 Minutes | 939 | 20.0% |
| 25 to 29 Minutes | 252 | 5.4% |
| 30 to 34 Minutes | 480 | 10.2% |
| 35 to 39 Minutes | 266 | 5.7% |
| 40 to 44 Minutes | 68 | 1.5% |
| 45 to 59 Minutes | 185 | 3.9% |
| 60 to 89 Minutes | 123 | 2.6% |
| 90 or more Minutes | 59 | 1.3% |
Commute Time by Sex in Kensington
The most common commute times in Kensington are 5 to 9 minutes (513 commuters, 20.6%) for males and 20 to 24 minutes (536 commuters, 24.4%) for females.
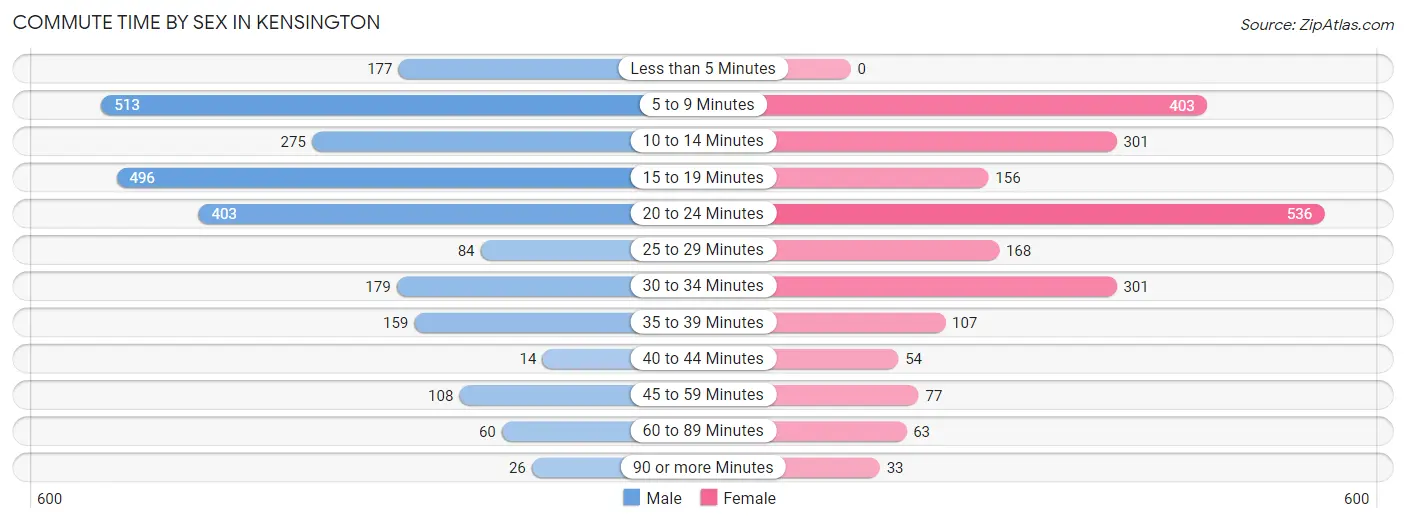
| Commute Time | Male | Female |
| Less than 5 Minutes | 177 (7.1%) | 0 (0.0%) |
| 5 to 9 Minutes | 513 (20.6%) | 403 (18.3%) |
| 10 to 14 Minutes | 275 (11.0%) | 301 (13.7%) |
| 15 to 19 Minutes | 496 (19.9%) | 156 (7.1%) |
| 20 to 24 Minutes | 403 (16.2%) | 536 (24.4%) |
| 25 to 29 Minutes | 84 (3.4%) | 168 (7.6%) |
| 30 to 34 Minutes | 179 (7.2%) | 301 (13.7%) |
| 35 to 39 Minutes | 159 (6.4%) | 107 (4.9%) |
| 40 to 44 Minutes | 14 (0.6%) | 54 (2.5%) |
| 45 to 59 Minutes | 108 (4.3%) | 77 (3.5%) |
| 60 to 89 Minutes | 60 (2.4%) | 63 (2.9%) |
| 90 or more Minutes | 26 (1.0%) | 33 (1.5%) |
Time of Departure to Work by Sex in Kensington
The most frequent times of departure to work in Kensington are 7:00 AM to 7:29 AM (402, 16.1%) for males and 7:00 AM to 7:29 AM (508, 23.1%) for females.
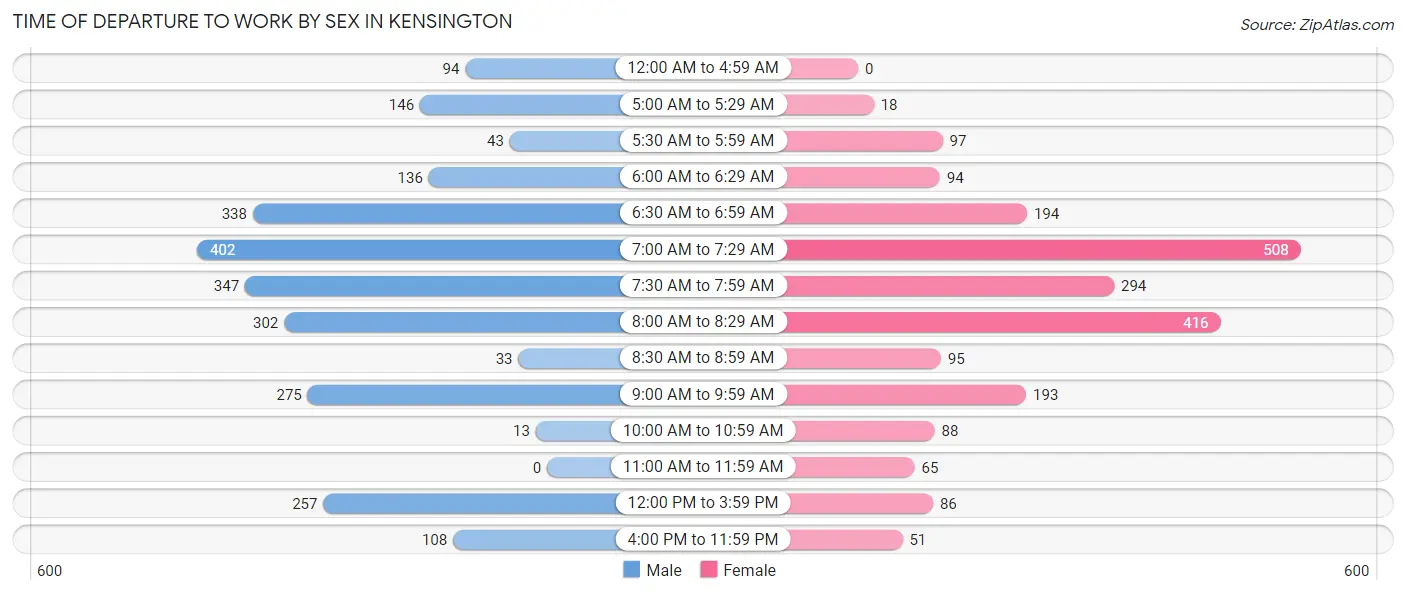
| Time of Departure | Male | Female |
| 12:00 AM to 4:59 AM | 94 (3.8%) | 0 (0.0%) |
| 5:00 AM to 5:29 AM | 146 (5.9%) | 18 (0.8%) |
| 5:30 AM to 5:59 AM | 43 (1.7%) | 97 (4.4%) |
| 6:00 AM to 6:29 AM | 136 (5.4%) | 94 (4.3%) |
| 6:30 AM to 6:59 AM | 338 (13.6%) | 194 (8.8%) |
| 7:00 AM to 7:29 AM | 402 (16.1%) | 508 (23.1%) |
| 7:30 AM to 7:59 AM | 347 (13.9%) | 294 (13.4%) |
| 8:00 AM to 8:29 AM | 302 (12.1%) | 416 (18.9%) |
| 8:30 AM to 8:59 AM | 33 (1.3%) | 95 (4.3%) |
| 9:00 AM to 9:59 AM | 275 (11.0%) | 193 (8.8%) |
| 10:00 AM to 10:59 AM | 13 (0.5%) | 88 (4.0%) |
| 11:00 AM to 11:59 AM | 0 (0.0%) | 65 (3.0%) |
| 12:00 PM to 3:59 PM | 257 (10.3%) | 86 (3.9%) |
| 4:00 PM to 11:59 PM | 108 (4.3%) | 51 (2.3%) |
| Total | 2,494 (100.0%) | 2,199 (100.0%) |
Housing Occupancy in Kensington
Occupancy by Ownership in Kensington
Of the total 4,184 dwellings in Kensington, owner-occupied units account for 3,455 (82.6%), while renter-occupied units make up 729 (17.4%).
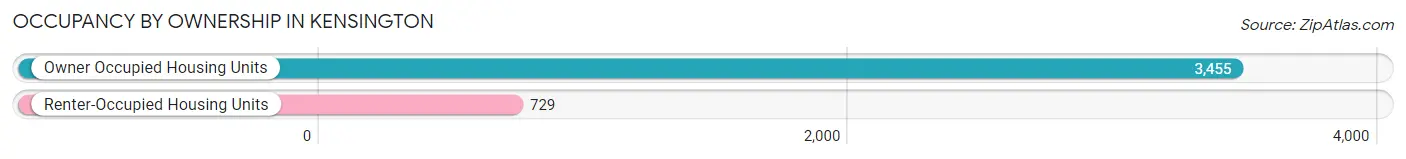
| Occupancy | # Housing Units | % Housing Units |
| Owner Occupied Housing Units | 3,455 | 82.6% |
| Renter-Occupied Housing Units | 729 | 17.4% |
| Total Occupied Housing Units | 4,184 | 100.0% |
Occupancy by Household Size in Kensington
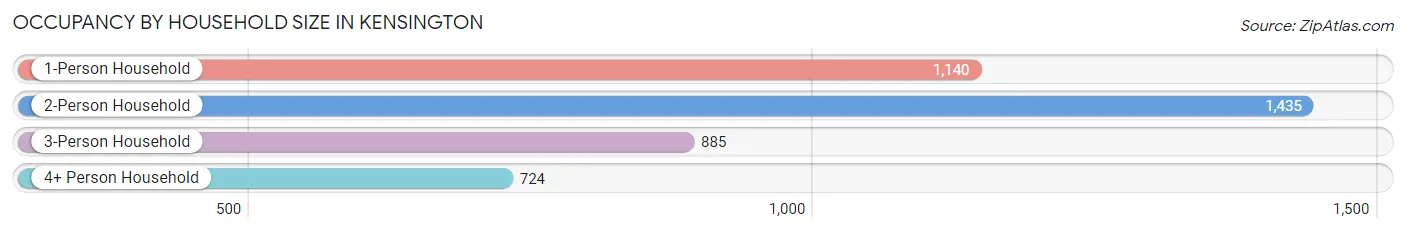
| Household Size | # Housing Units | % Housing Units |
| 1-Person Household | 1,140 | 27.3% |
| 2-Person Household | 1,435 | 34.3% |
| 3-Person Household | 885 | 21.1% |
| 4+ Person Household | 724 | 17.3% |
| Total Housing Units | 4,184 | 100.0% |
Occupancy by Ownership by Household Size in Kensington
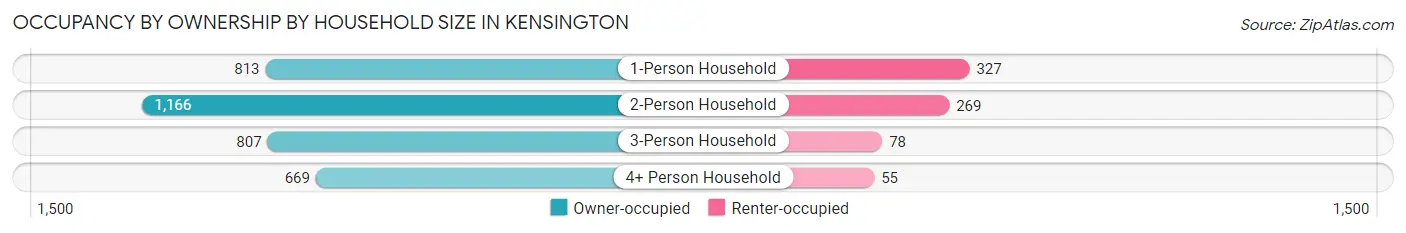
| Household Size | Owner-occupied | Renter-occupied |
| 1-Person Household | 813 (71.3%) | 327 (28.7%) |
| 2-Person Household | 1,166 (81.2%) | 269 (18.8%) |
| 3-Person Household | 807 (91.2%) | 78 (8.8%) |
| 4+ Person Household | 669 (92.4%) | 55 (7.6%) |
| Total Housing Units | 3,455 (82.6%) | 729 (17.4%) |
Occupancy by Educational Attainment in Kensington
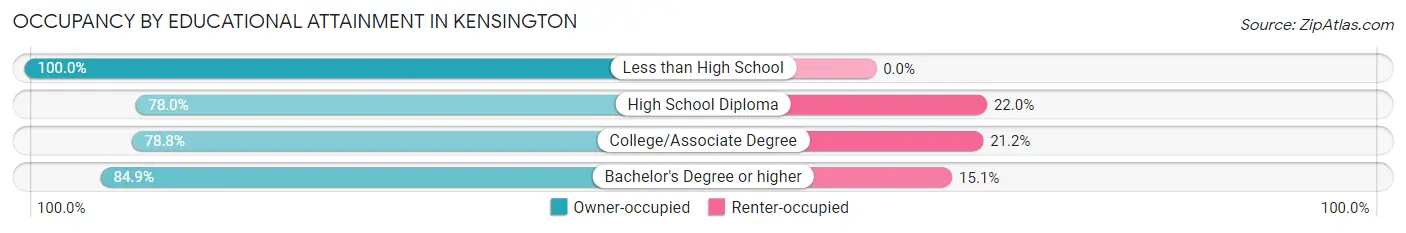
| Household Size | Owner-occupied | Renter-occupied |
| Less than High School | 237 (100.0%) | 0 (0.0%) |
| High School Diploma | 778 (78.0%) | 219 (22.0%) |
| College/Associate Degree | 839 (78.8%) | 226 (21.2%) |
| Bachelor's Degree or higher | 1,601 (84.9%) | 284 (15.1%) |
Occupancy by Age of Householder in Kensington
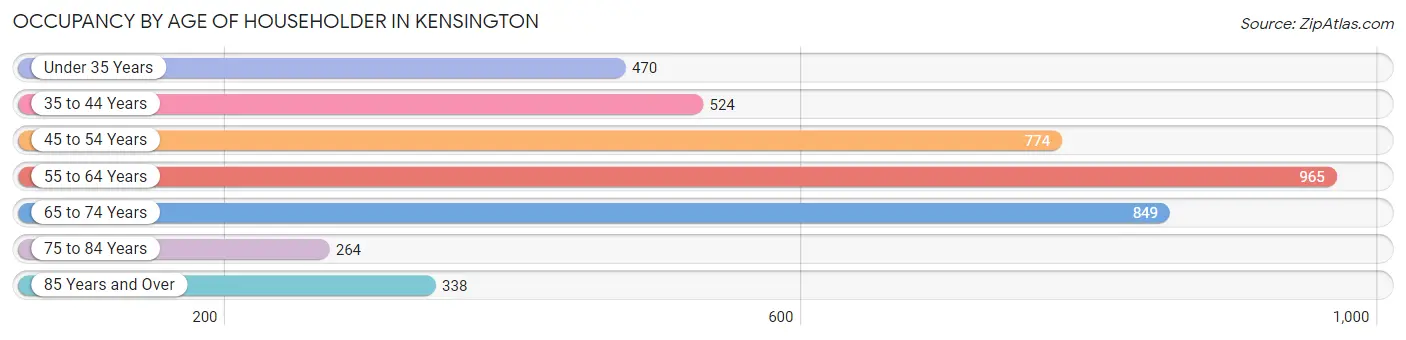
| Age Bracket | # Households | % Households |
| Under 35 Years | 470 | 11.2% |
| 35 to 44 Years | 524 | 12.5% |
| 45 to 54 Years | 774 | 18.5% |
| 55 to 64 Years | 965 | 23.1% |
| 65 to 74 Years | 849 | 20.3% |
| 75 to 84 Years | 264 | 6.3% |
| 85 Years and Over | 338 | 8.1% |
| Total | 4,184 | 100.0% |
Housing Finances in Kensington
Median Income by Occupancy in Kensington
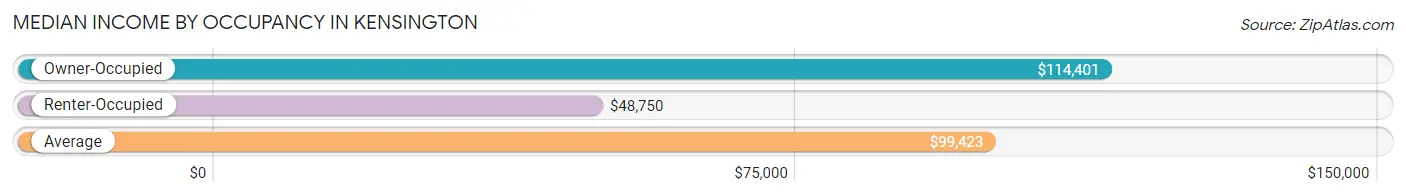
| Occupancy Type | # Households | Median Income |
| Owner-Occupied | 3,455 (82.6%) | $114,401 |
| Renter-Occupied | 729 (17.4%) | $48,750 |
| Average | 4,184 (100.0%) | $99,423 |
Occupancy by Householder Income Bracket in Kensington
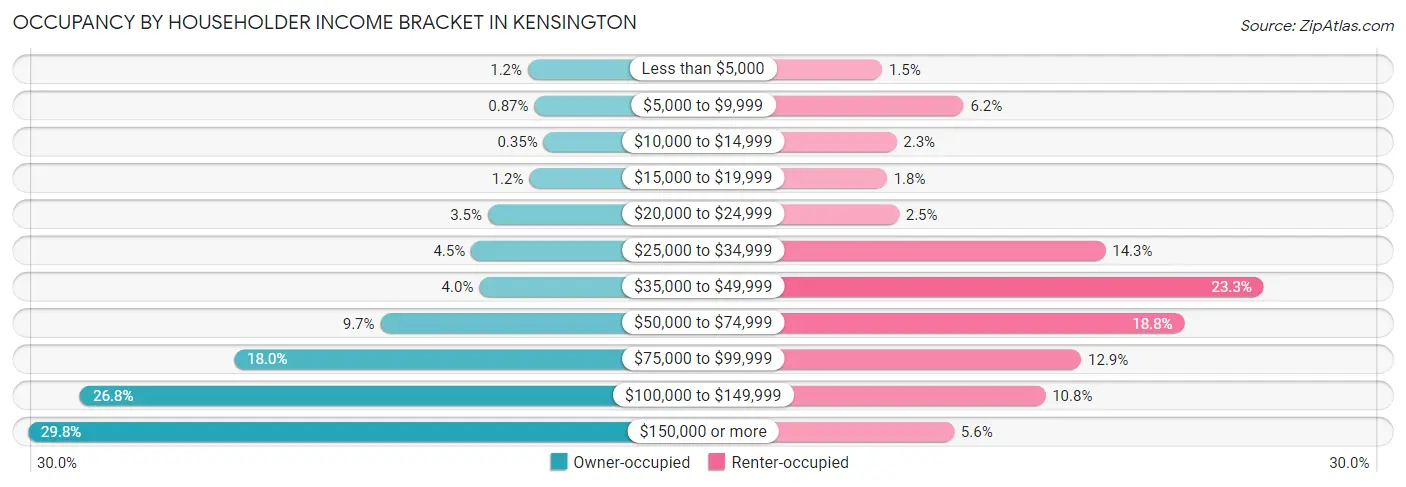
| Income Bracket | Owner-occupied | Renter-occupied |
| Less than $5,000 | 43 (1.2%) | 11 (1.5%) |
| $5,000 to $9,999 | 30 (0.9%) | 45 (6.2%) |
| $10,000 to $14,999 | 12 (0.4%) | 17 (2.3%) |
| $15,000 to $19,999 | 40 (1.2%) | 13 (1.8%) |
| $20,000 to $24,999 | 122 (3.5%) | 18 (2.5%) |
| $25,000 to $34,999 | 155 (4.5%) | 104 (14.3%) |
| $35,000 to $49,999 | 139 (4.0%) | 170 (23.3%) |
| $50,000 to $74,999 | 334 (9.7%) | 137 (18.8%) |
| $75,000 to $99,999 | 623 (18.0%) | 94 (12.9%) |
| $100,000 to $149,999 | 927 (26.8%) | 79 (10.8%) |
| $150,000 or more | 1,030 (29.8%) | 41 (5.6%) |
| Total | 3,455 (100.0%) | 729 (100.0%) |
Monthly Housing Cost Tiers in Kensington
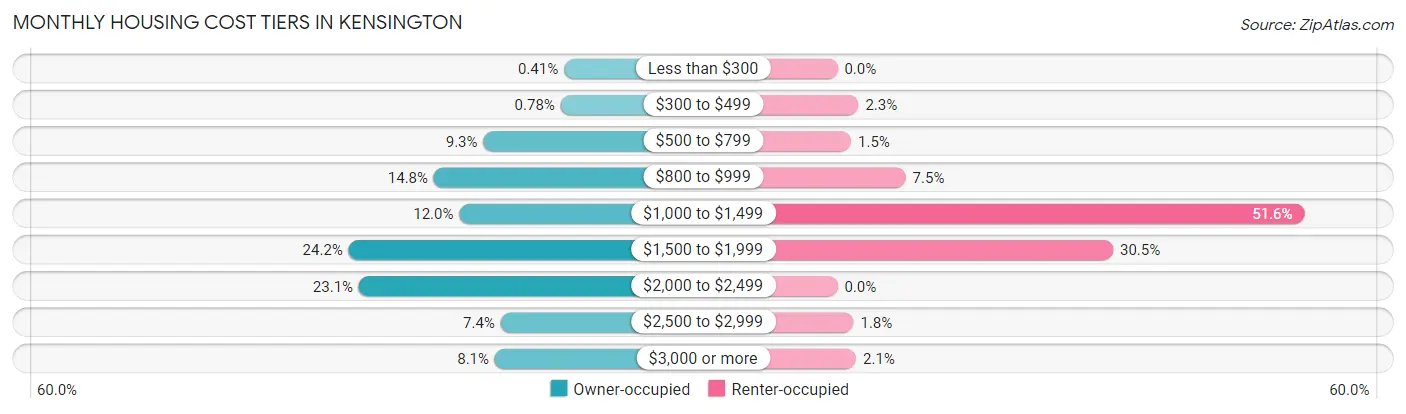
| Monthly Cost | Owner-occupied | Renter-occupied |
| Less than $300 | 14 (0.4%) | 0 (0.0%) |
| $300 to $499 | 27 (0.8%) | 17 (2.3%) |
| $500 to $799 | 322 (9.3%) | 11 (1.5%) |
| $800 to $999 | 511 (14.8%) | 55 (7.5%) |
| $1,000 to $1,499 | 414 (12.0%) | 376 (51.6%) |
| $1,500 to $1,999 | 836 (24.2%) | 222 (30.4%) |
| $2,000 to $2,499 | 797 (23.1%) | 0 (0.0%) |
| $2,500 to $2,999 | 256 (7.4%) | 13 (1.8%) |
| $3,000 or more | 278 (8.1%) | 15 (2.1%) |
| Total | 3,455 (100.0%) | 729 (100.0%) |
Physical Housing Characteristics in Kensington
Housing Structures in Kensington
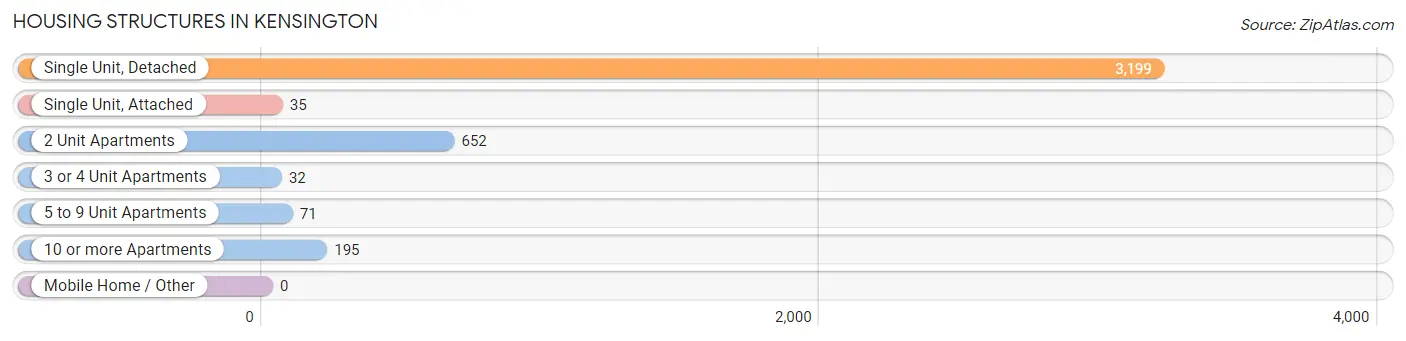
| Structure Type | # Housing Units | % Housing Units |
| Single Unit, Detached | 3,199 | 76.5% |
| Single Unit, Attached | 35 | 0.8% |
| 2 Unit Apartments | 652 | 15.6% |
| 3 or 4 Unit Apartments | 32 | 0.8% |
| 5 to 9 Unit Apartments | 71 | 1.7% |
| 10 or more Apartments | 195 | 4.7% |
| Mobile Home / Other | 0 | 0.0% |
| Total | 4,184 | 100.0% |
Housing Structures by Occupancy in Kensington
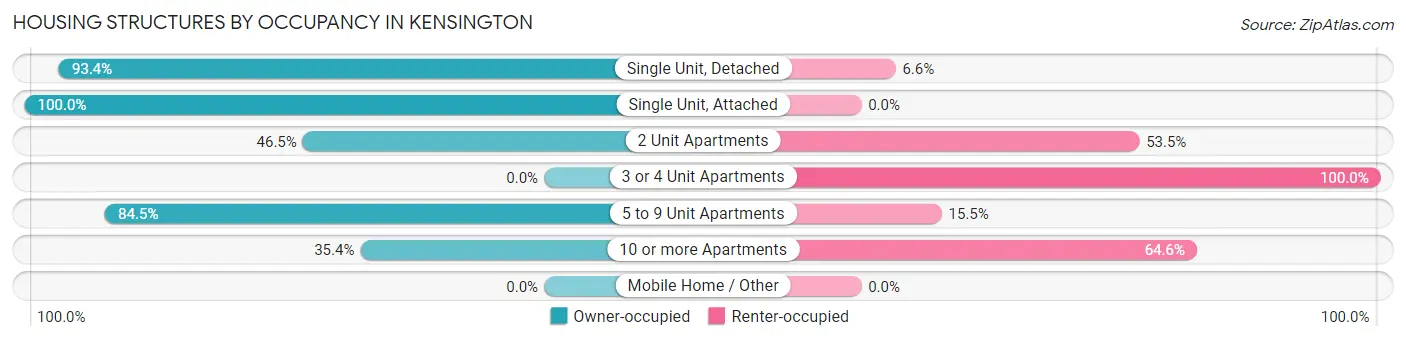
| Structure Type | Owner-occupied | Renter-occupied |
| Single Unit, Detached | 2,988 (93.4%) | 211 (6.6%) |
| Single Unit, Attached | 35 (100.0%) | 0 (0.0%) |
| 2 Unit Apartments | 303 (46.5%) | 349 (53.5%) |
| 3 or 4 Unit Apartments | 0 (0.0%) | 32 (100.0%) |
| 5 to 9 Unit Apartments | 60 (84.5%) | 11 (15.5%) |
| 10 or more Apartments | 69 (35.4%) | 126 (64.6%) |
| Mobile Home / Other | 0 (0.0%) | 0 (0.0%) |
| Total | 3,455 (82.6%) | 729 (17.4%) |
Housing Structures by Number of Rooms in Kensington
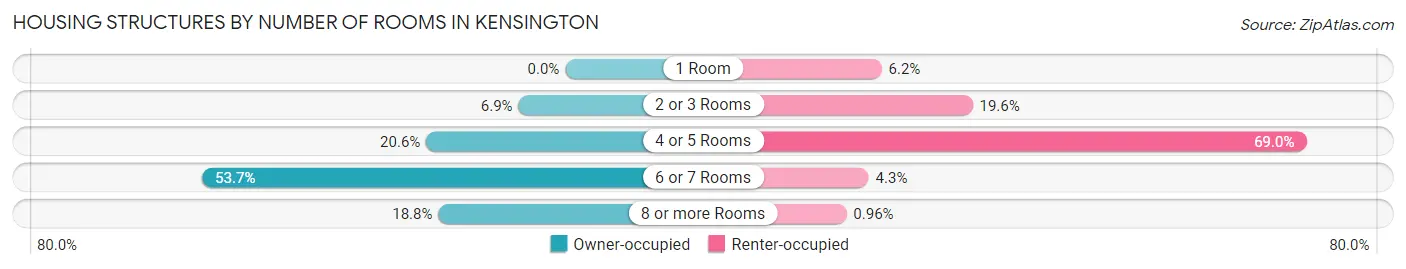
| Number of Rooms | Owner-occupied | Renter-occupied |
| 1 Room | 0 (0.0%) | 45 (6.2%) |
| 2 or 3 Rooms | 239 (6.9%) | 143 (19.6%) |
| 4 or 5 Rooms | 711 (20.6%) | 503 (69.0%) |
| 6 or 7 Rooms | 1,856 (53.7%) | 31 (4.3%) |
| 8 or more Rooms | 649 (18.8%) | 7 (1.0%) |
| Total | 3,455 (100.0%) | 729 (100.0%) |
Housing Structure by Heating Type in Kensington
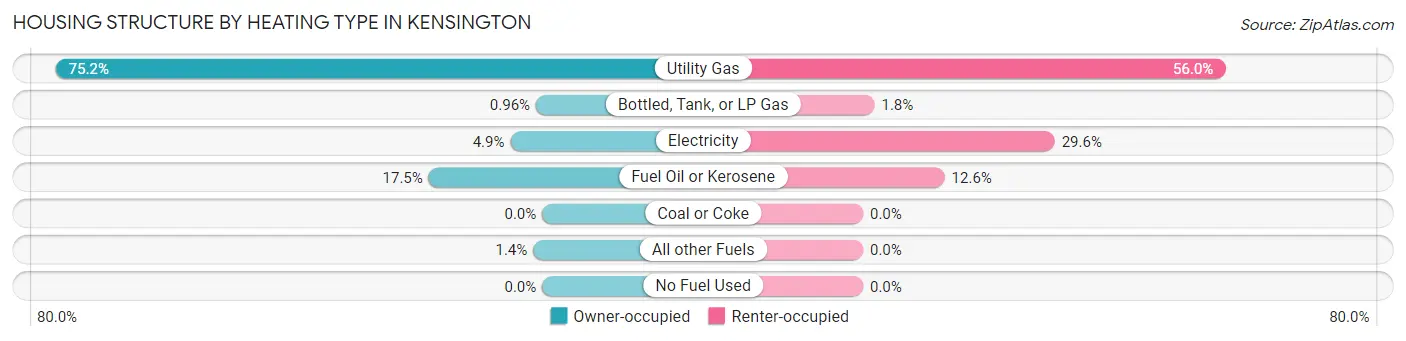
| Heating Type | Owner-occupied | Renter-occupied |
| Utility Gas | 2,598 (75.2%) | 408 (56.0%) |
| Bottled, Tank, or LP Gas | 33 (1.0%) | 13 (1.8%) |
| Electricity | 170 (4.9%) | 216 (29.6%) |
| Fuel Oil or Kerosene | 606 (17.5%) | 92 (12.6%) |
| Coal or Coke | 0 (0.0%) | 0 (0.0%) |
| All other Fuels | 48 (1.4%) | 0 (0.0%) |
| No Fuel Used | 0 (0.0%) | 0 (0.0%) |
| Total | 3,455 (100.0%) | 729 (100.0%) |
Household Vehicle Usage in Kensington
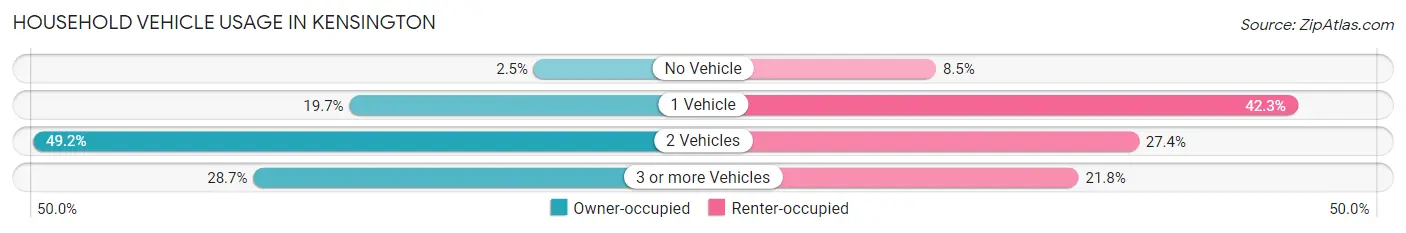
| Vehicles per Household | Owner-occupied | Renter-occupied |
| No Vehicle | 85 (2.5%) | 62 (8.5%) |
| 1 Vehicle | 680 (19.7%) | 308 (42.2%) |
| 2 Vehicles | 1,700 (49.2%) | 200 (27.4%) |
| 3 or more Vehicles | 990 (28.6%) | 159 (21.8%) |
| Total | 3,455 (100.0%) | 729 (100.0%) |
Real Estate & Mortgages in Kensington
Real Estate and Mortgage Overview in Kensington
| Characteristic | Without Mortgage | With Mortgage |
| Housing Units | 1,332 | 2,123 |
| Median Property Value | $306,900 | $282,900 |
| Median Household Income | $86,346 | $676 |
| Monthly Housing Costs | $950 | $278 |
| Real Estate Taxes | $6,111 | $0 |
Property Value by Mortgage Status in Kensington
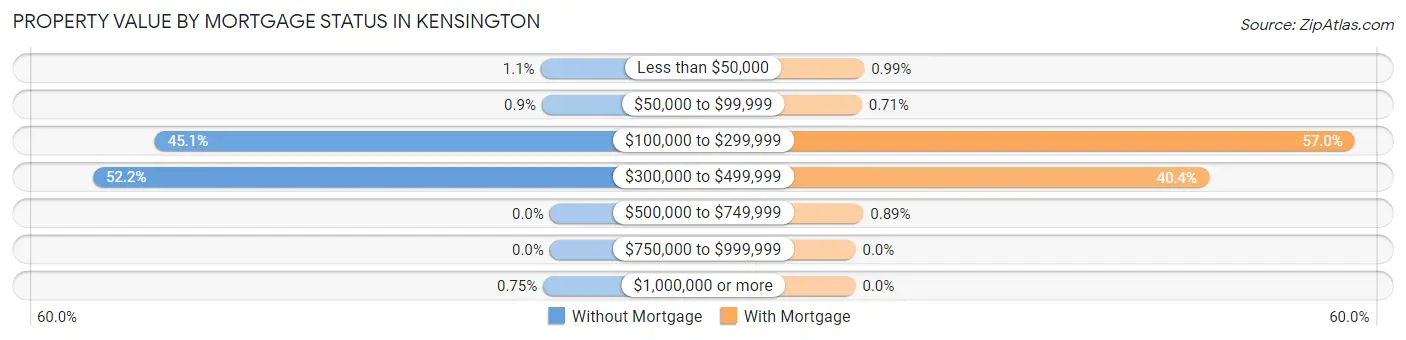
| Property Value | Without Mortgage | With Mortgage |
| Less than $50,000 | 14 (1.1%) | 21 (1.0%) |
| $50,000 to $99,999 | 12 (0.9%) | 15 (0.7%) |
| $100,000 to $299,999 | 601 (45.1%) | 1,211 (57.0%) |
| $300,000 to $499,999 | 695 (52.2%) | 857 (40.4%) |
| $500,000 to $749,999 | 0 (0.0%) | 19 (0.9%) |
| $750,000 to $999,999 | 0 (0.0%) | 0 (0.0%) |
| $1,000,000 or more | 10 (0.7%) | 0 (0.0%) |
| Total | 1,332 (100.0%) | 2,123 (100.0%) |
Household Income by Mortgage Status in Kensington
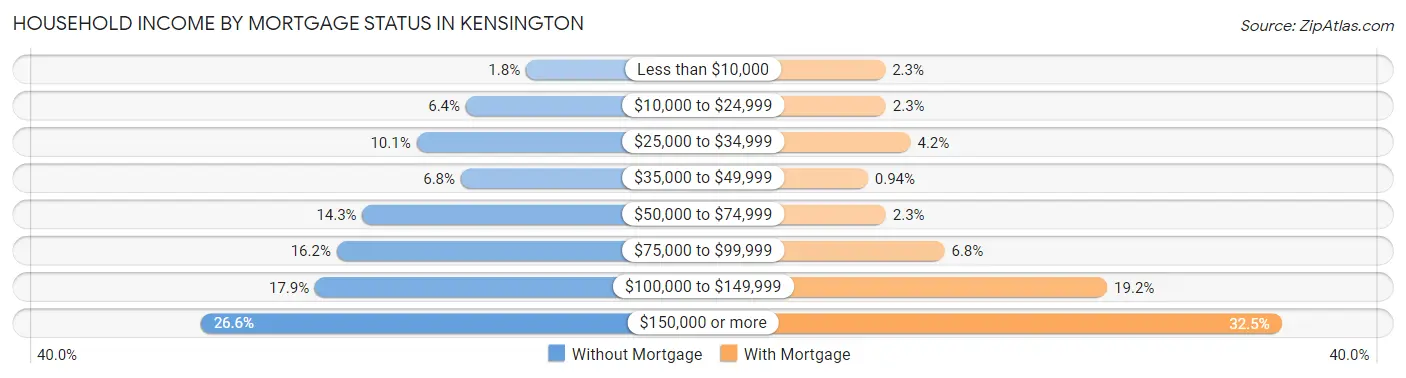
| Household Income | Without Mortgage | With Mortgage |
| Less than $10,000 | 24 (1.8%) | 48 (2.3%) |
| $10,000 to $24,999 | 85 (6.4%) | 49 (2.3%) |
| $25,000 to $34,999 | 135 (10.1%) | 89 (4.2%) |
| $35,000 to $49,999 | 90 (6.8%) | 20 (0.9%) |
| $50,000 to $74,999 | 190 (14.3%) | 49 (2.3%) |
| $75,000 to $99,999 | 216 (16.2%) | 144 (6.8%) |
| $100,000 to $149,999 | 238 (17.9%) | 407 (19.2%) |
| $150,000 or more | 354 (26.6%) | 689 (32.5%) |
| Total | 1,332 (100.0%) | 2,123 (100.0%) |
Property Value to Household Income Ratio in Kensington
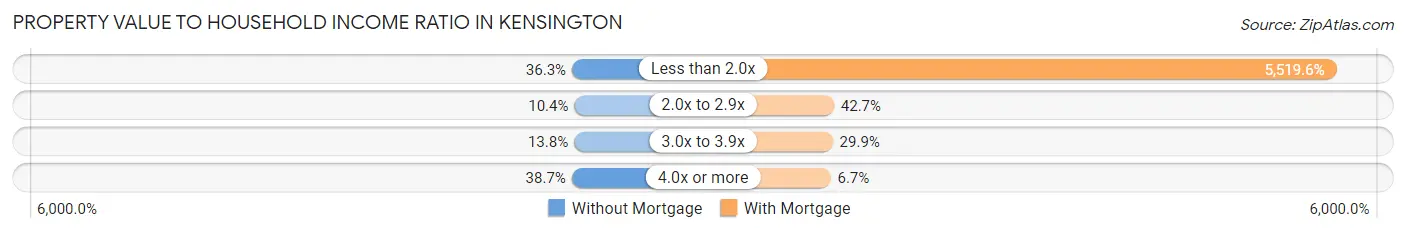
| Value-to-Income Ratio | Without Mortgage | With Mortgage |
| Less than 2.0x | 484 (36.3%) | 117,182 (5,519.6%) |
| 2.0x to 2.9x | 138 (10.4%) | 907 (42.7%) |
| 3.0x to 3.9x | 184 (13.8%) | 634 (29.9%) |
| 4.0x or more | 516 (38.7%) | 143 (6.7%) |
| Total | 1,332 (100.0%) | 2,123 (100.0%) |
Real Estate Taxes by Mortgage Status in Kensington
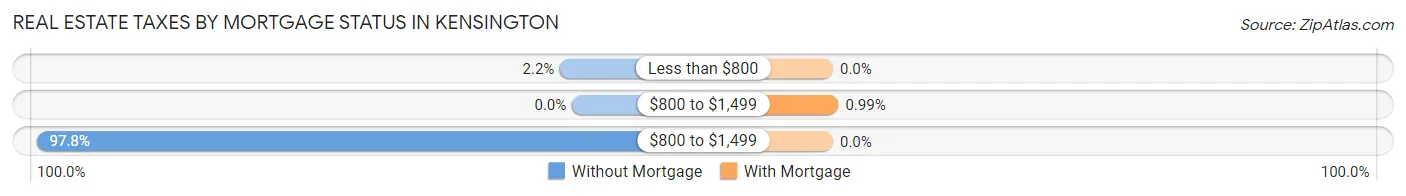
| Property Taxes | Without Mortgage | With Mortgage |
| Less than $800 | 29 (2.2%) | 0 (0.0%) |
| $800 to $1,499 | 0 (0.0%) | 21 (1.0%) |
| $800 to $1,499 | 1,303 (97.8%) | 0 (0.0%) |
| Total | 1,332 (100.0%) | 2,123 (100.0%) |
Health & Disability in Kensington
Health Insurance Coverage by Age in Kensington
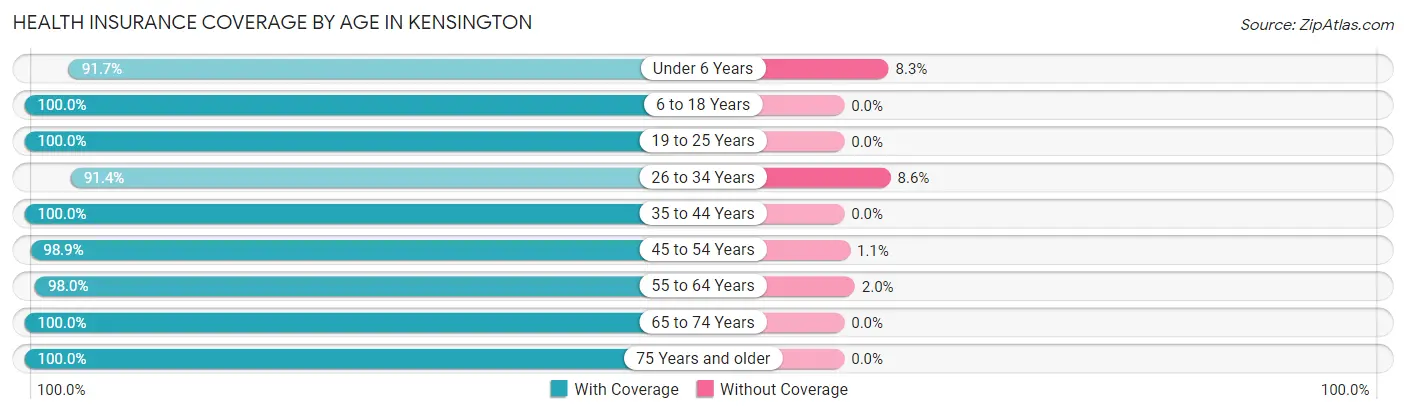
| Age Bracket | With Coverage | Without Coverage |
| Under 6 Years | 555 (91.7%) | 50 (8.3%) |
| 6 to 18 Years | 1,394 (100.0%) | 0 (0.0%) |
| 19 to 25 Years | 594 (100.0%) | 0 (0.0%) |
| 26 to 34 Years | 740 (91.4%) | 70 (8.6%) |
| 35 to 44 Years | 1,018 (100.0%) | 0 (0.0%) |
| 45 to 54 Years | 1,204 (98.9%) | 13 (1.1%) |
| 55 to 64 Years | 1,502 (98.0%) | 30 (2.0%) |
| 65 to 74 Years | 1,419 (100.0%) | 0 (0.0%) |
| 75 Years and older | 980 (100.0%) | 0 (0.0%) |
| Total | 9,406 (98.3%) | 163 (1.7%) |
Health Insurance Coverage by Citizenship Status in Kensington

| Citizenship Status | With Coverage | Without Coverage |
| Native Born | 555 (91.7%) | 50 (8.3%) |
| Foreign Born, Citizen | 1,394 (100.0%) | 0 (0.0%) |
| Foreign Born, not a Citizen | 594 (100.0%) | 0 (0.0%) |
Health Insurance Coverage by Household Income in Kensington
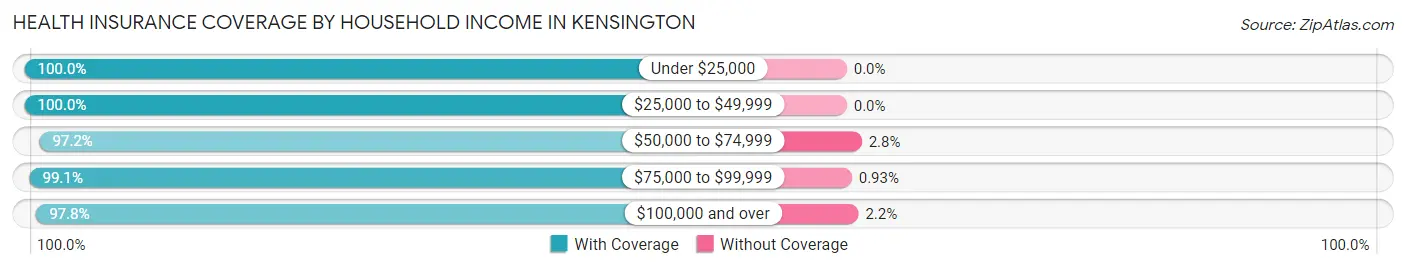
| Household Income | With Coverage | Without Coverage |
| Under $25,000 | 593 (100.0%) | 0 (0.0%) |
| $25,000 to $49,999 | 793 (100.0%) | 0 (0.0%) |
| $50,000 to $74,999 | 872 (97.2%) | 25 (2.8%) |
| $75,000 to $99,999 | 1,594 (99.1%) | 15 (0.9%) |
| $100,000 and over | 5,500 (97.8%) | 123 (2.2%) |
Public vs Private Health Insurance Coverage by Age in Kensington
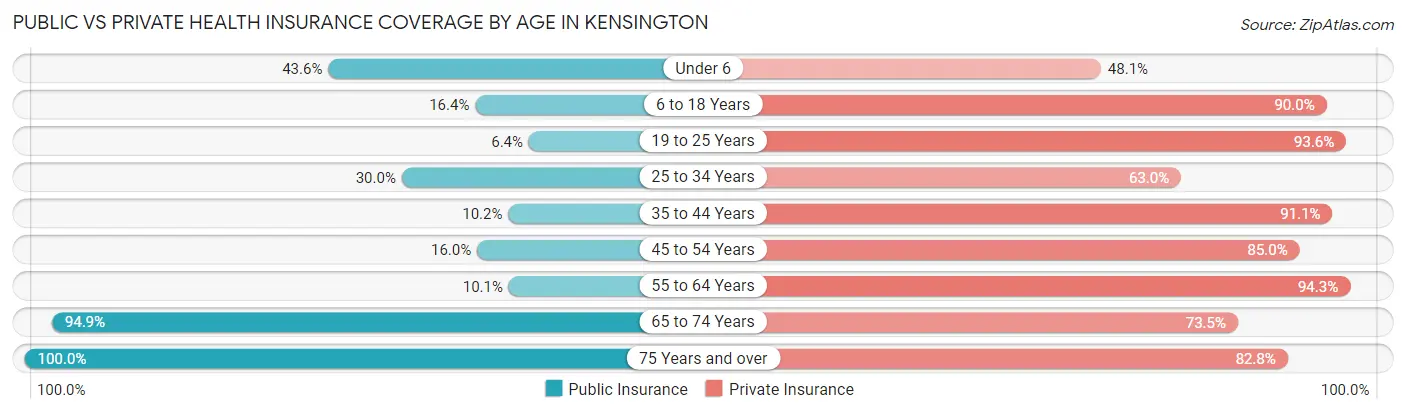
| Age Bracket | Public Insurance | Private Insurance |
| Under 6 | 264 (43.6%) | 291 (48.1%) |
| 6 to 18 Years | 228 (16.4%) | 1,254 (90.0%) |
| 19 to 25 Years | 38 (6.4%) | 556 (93.6%) |
| 25 to 34 Years | 243 (30.0%) | 510 (63.0%) |
| 35 to 44 Years | 104 (10.2%) | 927 (91.1%) |
| 45 to 54 Years | 195 (16.0%) | 1,034 (85.0%) |
| 55 to 64 Years | 155 (10.1%) | 1,445 (94.3%) |
| 65 to 74 Years | 1,347 (94.9%) | 1,043 (73.5%) |
| 75 Years and over | 980 (100.0%) | 811 (82.8%) |
| Total | 3,554 (37.1%) | 7,871 (82.3%) |
Disability Status by Sex by Age in Kensington
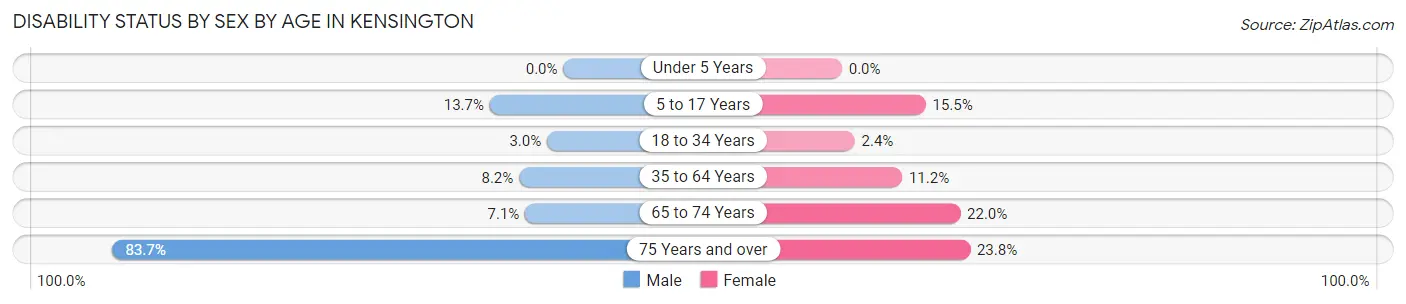
| Age Bracket | Male | Female |
| Under 5 Years | 0 (0.0%) | 0 (0.0%) |
| 5 to 17 Years | 138 (13.7%) | 62 (15.5%) |
| 18 to 34 Years | 22 (3.0%) | 18 (2.4%) |
| 35 to 64 Years | 163 (8.2%) | 199 (11.2%) |
| 65 to 74 Years | 47 (7.1%) | 166 (22.0%) |
| 75 Years and over | 282 (83.7%) | 153 (23.8%) |
Disability Class by Sex by Age in Kensington
Disability Class: Hearing Difficulty
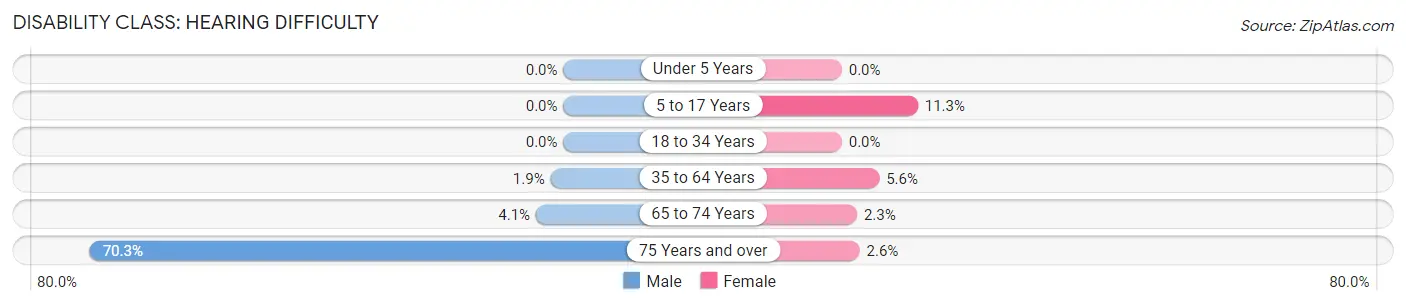
| Age Bracket | Male | Female |
| Under 5 Years | 0 (0.0%) | 0 (0.0%) |
| 5 to 17 Years | 0 (0.0%) | 45 (11.3%) |
| 18 to 34 Years | 0 (0.0%) | 0 (0.0%) |
| 35 to 64 Years | 38 (1.9%) | 99 (5.6%) |
| 65 to 74 Years | 27 (4.1%) | 17 (2.2%) |
| 75 Years and over | 237 (70.3%) | 17 (2.6%) |
Disability Class: Vision Difficulty
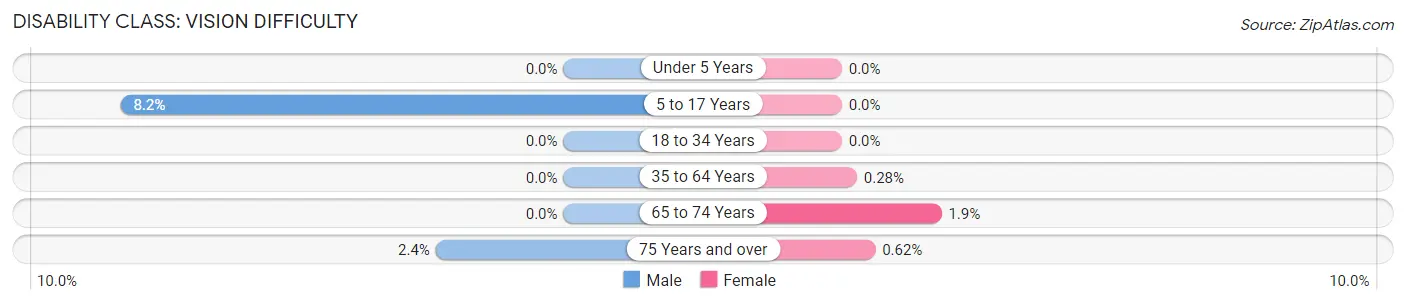
| Age Bracket | Male | Female |
| Under 5 Years | 0 (0.0%) | 0 (0.0%) |
| 5 to 17 Years | 83 (8.2%) | 0 (0.0%) |
| 18 to 34 Years | 0 (0.0%) | 0 (0.0%) |
| 35 to 64 Years | 0 (0.0%) | 5 (0.3%) |
| 65 to 74 Years | 0 (0.0%) | 14 (1.8%) |
| 75 Years and over | 8 (2.4%) | 4 (0.6%) |
Disability Class: Cognitive Difficulty
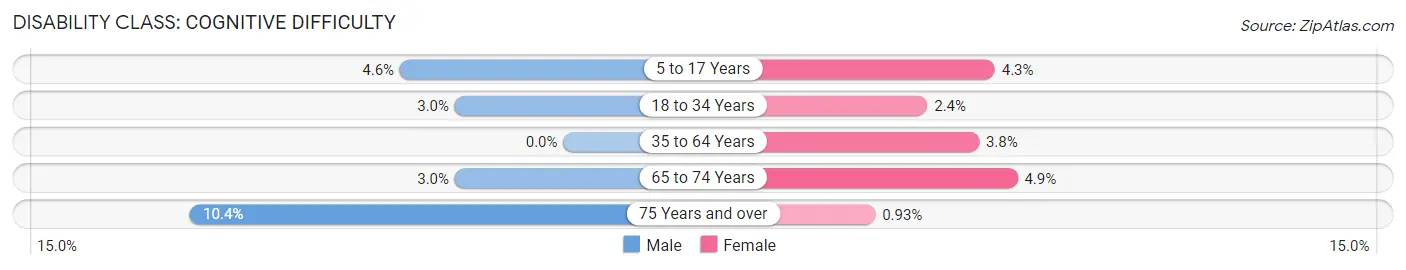
| Age Bracket | Male | Female |
| 5 to 17 Years | 46 (4.5%) | 17 (4.3%) |
| 18 to 34 Years | 22 (3.0%) | 18 (2.4%) |
| 35 to 64 Years | 0 (0.0%) | 68 (3.8%) |
| 65 to 74 Years | 20 (3.0%) | 37 (4.9%) |
| 75 Years and over | 35 (10.4%) | 6 (0.9%) |
Disability Class: Ambulatory Difficulty
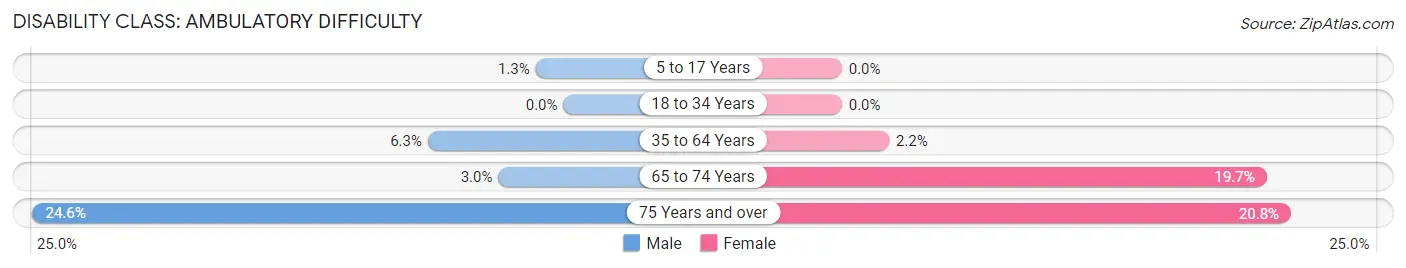
| Age Bracket | Male | Female |
| 5 to 17 Years | 13 (1.3%) | 0 (0.0%) |
| 18 to 34 Years | 0 (0.0%) | 0 (0.0%) |
| 35 to 64 Years | 125 (6.3%) | 39 (2.2%) |
| 65 to 74 Years | 20 (3.0%) | 149 (19.7%) |
| 75 Years and over | 83 (24.6%) | 134 (20.8%) |
Disability Class: Self-Care Difficulty
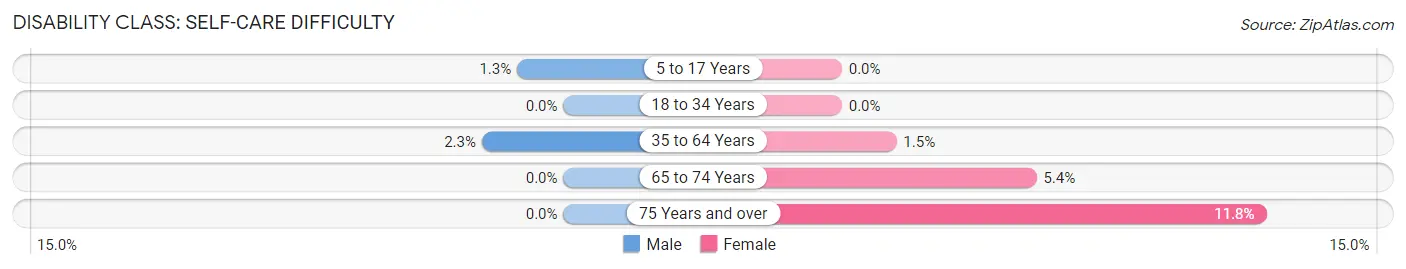
| Age Bracket | Male | Female |
| 5 to 17 Years | 13 (1.3%) | 0 (0.0%) |
| 18 to 34 Years | 0 (0.0%) | 0 (0.0%) |
| 35 to 64 Years | 45 (2.3%) | 27 (1.5%) |
| 65 to 74 Years | 0 (0.0%) | 41 (5.4%) |
| 75 Years and over | 0 (0.0%) | 76 (11.8%) |
Technology Access in Kensington
Computing Device Access in Kensington
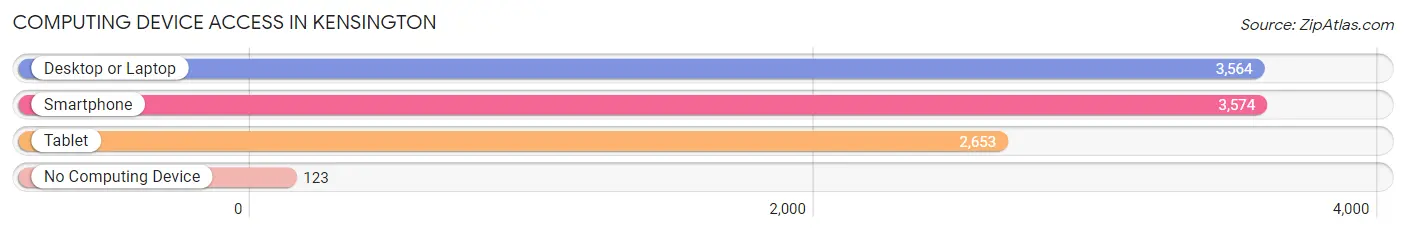
| Device Type | # Households | % Households |
| Desktop or Laptop | 3,564 | 85.2% |
| Smartphone | 3,574 | 85.4% |
| Tablet | 2,653 | 63.4% |
| No Computing Device | 123 | 2.9% |
| Total | 4,184 | 100.0% |
Internet Access in Kensington
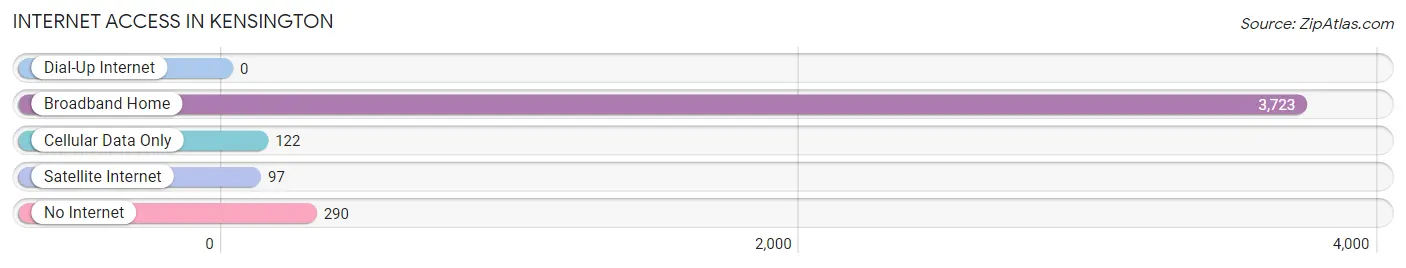
| Internet Type | # Households | % Households |
| Dial-Up Internet | 0 | 0.0% |
| Broadband Home | 3,723 | 89.0% |
| Cellular Data Only | 122 | 2.9% |
| Satellite Internet | 97 | 2.3% |
| No Internet | 290 | 6.9% |
| Total | 4,184 | 100.0% |
Kensington Summary
Kensington, Connecticut is a small town located in the northeast corner of the state, in the town of Berlin. It is bordered by Berlin to the north, New Britain to the east, and Southington to the south and west. The town has a population of approximately 5,000 people, and is part of the greater Hartford metropolitan area.
History
Kensington was first settled in 1720 by a group of settlers from Farmington, Connecticut. The town was originally known as Kensington Parish, and was part of the town of Farmington until 1822, when it was incorporated as its own town. The town was named after the English town of Kensington, which was the birthplace of one of the original settlers.
The town was primarily an agricultural community until the mid-19th century, when the town began to industrialize. The first industry in the town was a cotton mill, which was built in 1845. This was followed by a paper mill in 1848, and a woolen mill in 1851. These industries helped to spur the growth of the town, and by the late 19th century, Kensington had become a thriving industrial center.
Geography
Kensington is located in the northeast corner of Connecticut, in the town of Berlin. It is bordered by Berlin to the north, New Britain to the east, and Southington to the south and west. The town has a total area of 4.2 square miles, all of which is land.
The terrain of Kensington is mostly flat, with some rolling hills in the northern part of town. The town is located in the Connecticut River Valley, and is part of the larger Hartford metropolitan area.
Economy
Kensington’s economy is primarily based on manufacturing and services. The town is home to several large manufacturing companies, including Stanley Black & Decker, which produces power tools and hardware, and Pratt & Whitney, which produces aircraft engines.
The town also has a number of small businesses, including restaurants, retail stores, and professional services. The town is also home to several educational institutions, including Central Connecticut State University and the University of Connecticut.
Demographics
As of the 2010 census, Kensington had a population of 5,073 people. The racial makeup of the town was 94.3% White, 1.7% African American, 0.3% Native American, 1.2% Asian, 0.1% Pacific Islander, 1.2% from other races, and 1.4% from two or more races. Hispanic or Latino of any race were 4.2% of the population.
The median household income in Kensington was $68,958, and the median family income was $77,917. The per capita income for the town was $30,945. About 4.3% of families and 5.7% of the population were below the poverty line, including 6.3% of those under age 18 and 4.2% of those age 65 or over.
Common Questions
What is Per Capita Income in Kensington?
Per Capita income in Kensington is $49,440.
What is the Median Family Income in Kensington?
Median Family Income in Kensington is $116,061.
What is the Median Household income in Kensington?
Median Household Income in Kensington is $99,423.
What is Income or Wage Gap in Kensington?
Income or Wage Gap in Kensington is 23.3%.
Women in Kensington earn 76.7 cents for every dollar earned by a man.
What is Inequality or Gini Index in Kensington?
Inequality or Gini Index in Kensington is 0.37.
What is the Total Population of Kensington?
Total Population of Kensington is 9,580.
What is the Total Male Population of Kensington?
Total Male Population of Kensington is 4,944.
What is the Total Female Population of Kensington?
Total Female Population of Kensington is 4,636.
What is the Ratio of Males per 100 Females in Kensington?
There are 106.64 Males per 100 Females in Kensington.
What is the Ratio of Females per 100 Males in Kensington?
There are 93.77 Females per 100 Males in Kensington.
What is the Median Population Age in Kensington?
Median Population Age in Kensington is 48.8 Years.
What is the Average Family Size in Kensington
Average Family Size in Kensington is 2.7 People.
What is the Average Household Size in Kensington
Average Household Size in Kensington is 2.3 People.
How Large is the Labor Force in Kensington?
There are 5,656 People in the Labor Forcein in Kensington.
What is the Percentage of People in the Labor Force in Kensington?
69.6% of People are in the Labor Force in Kensington.
What is the Unemployment Rate in Kensington?
Unemployment Rate in Kensington is 2.2%.