Cities with the Highest Percentage of Population with a Degree in Multidisciplinary Studies in Connecticut
RELATED REPORTS & OPTIONS
Multidisciplinary Studies
Connecticut
Compare Cities
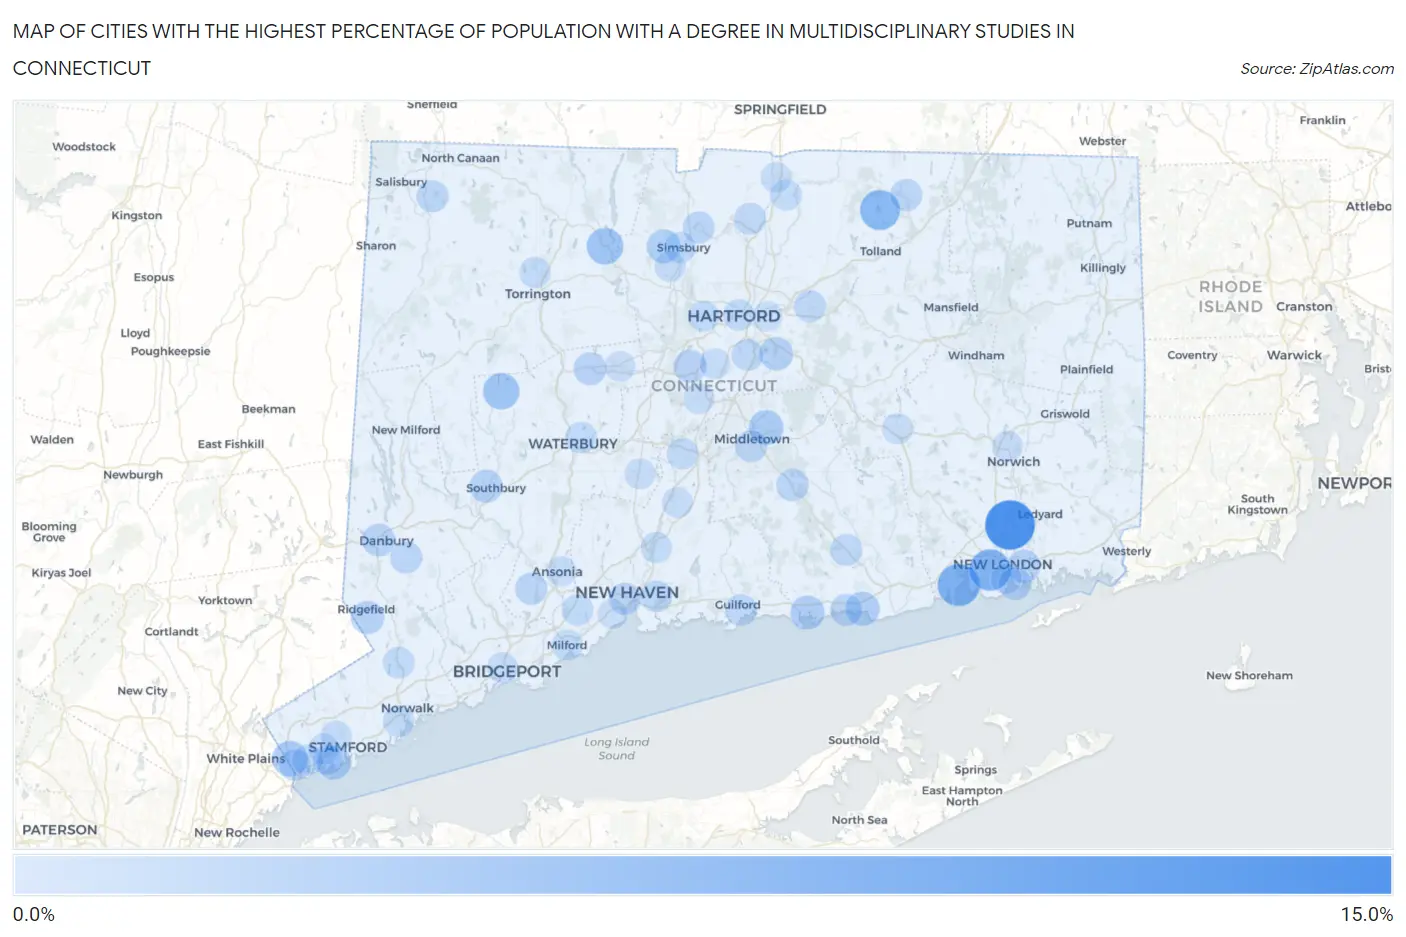
Map of Cities with the Highest Percentage of Population with a Degree in Multidisciplinary Studies in Connecticut
0.0%
15.0%
Cities with the Highest Percentage of Population with a Degree in Multidisciplinary Studies in Connecticut
| City | % Graduates | vs State | vs National | |
| 1. | Gales Ferry | 11.1% | 0.71%(+10.4)#1 | 0.88%(+10.3)#288 |
| 2. | Niantic | 6.8% | 0.71%(+6.08)#2 | 0.88%(+5.92)#582 |
| 3. | Waterford | 6.4% | 0.71%(+5.70)#3 | 0.88%(+5.54)#626 |
| 4. | Stratford Downtown | 5.7% | 0.71%(+4.98)#4 | 0.88%(+4.81)#743 |
| 5. | Crystal Lake | 5.5% | 0.71%(+4.81)#5 | 0.88%(+4.64)#787 |
| 6. | Westport | 3.7% | 0.71%(+3.02)#6 | 0.88%(+2.85)#1,233 |
| 7. | New Hartford Center | 3.6% | 0.71%(+2.88)#7 | 0.88%(+2.72)#1,301 |
| 8. | Bethlehem Village | 3.5% | 0.71%(+2.81)#8 | 0.88%(+2.64)#1,340 |
| 9. | Glenville | 3.1% | 0.71%(+2.37)#9 | 0.88%(+2.20)#1,558 |
| 10. | Portland | 2.6% | 0.71%(+1.85)#10 | 0.88%(+1.68)#1,881 |
| 11. | South Wilton | 2.5% | 0.71%(+1.78)#11 | 0.88%(+1.61)#1,948 |
| 12. | Clinton | 2.3% | 0.71%(+1.55)#12 | 0.88%(+1.39)#2,143 |
| 13. | Saybrook Manor | 2.2% | 0.71%(+1.50)#13 | 0.88%(+1.34)#2,202 |
| 14. | Old Greenwich | 2.2% | 0.71%(+1.49)#14 | 0.88%(+1.33)#2,210 |
| 15. | West Simsbury | 2.1% | 0.71%(+1.42)#15 | 0.88%(+1.25)#2,297 |
| 16. | Glastonbury Center | 2.0% | 0.71%(+1.25)#16 | 0.88%(+1.09)#2,508 |
| 17. | Ridgefield | 1.7% | 0.71%(+1.02)#17 | 0.88%(+0.853)#2,841 |
| 18. | Long Hill | 1.7% | 0.71%(+1.01)#18 | 0.88%(+0.843)#2,858 |
| 19. | Oronoque | 1.7% | 0.71%(+0.983)#19 | 0.88%(+0.818)#2,893 |
| 20. | Heritage Village | 1.7% | 0.71%(+0.958)#20 | 0.88%(+0.793)#2,931 |
| 21. | Newtown Borough | 1.7% | 0.71%(+0.958)#21 | 0.88%(+0.793)#2,932 |
| 22. | Danbury | 1.6% | 0.71%(+0.886)#22 | 0.88%(+0.721)#3,081 |
| 23. | Terryville | 1.6% | 0.71%(+0.856)#23 | 0.88%(+0.691)#3,150 |
| 24. | New Britain | 1.5% | 0.71%(+0.832)#24 | 0.88%(+0.667)#3,198 |
| 25. | Groton | 1.5% | 0.71%(+0.804)#25 | 0.88%(+0.639)#3,262 |
| 26. | Higganum | 1.3% | 0.71%(+0.599)#26 | 0.88%(+0.433)#3,725 |
| 27. | Lakes East | 1.3% | 0.71%(+0.586)#27 | 0.88%(+0.421)#3,763 |
| 28. | Woodmont Borough | 1.3% | 0.71%(+0.573)#28 | 0.88%(+0.407)#3,815 |
| 29. | Westbrook Center | 1.2% | 0.71%(+0.497)#29 | 0.88%(+0.332)#4,051 |
| 30. | Stafford Springs | 1.2% | 0.71%(+0.458)#30 | 0.88%(+0.293)#4,168 |
| 31. | Shelton | 1.1% | 0.71%(+0.428)#31 | 0.88%(+0.263)#4,256 |
| 32. | New Haven | 1.1% | 0.71%(+0.421)#32 | 0.88%(+0.256)#4,278 |
| 33. | Bethel | 1.1% | 0.71%(+0.417)#33 | 0.88%(+0.252)#4,289 |
| 34. | Tariffville | 1.1% | 0.71%(+0.399)#34 | 0.88%(+0.234)#4,355 |
| 35. | Middletown | 1.1% | 0.71%(+0.373)#35 | 0.88%(+0.207)#4,445 |
| 36. | Falls Village | 1.1% | 0.71%(+0.367)#36 | 0.88%(+0.202)#4,462 |
| 37. | Noroton Heights | 1.1% | 0.71%(+0.353)#37 | 0.88%(+0.188)#4,509 |
| 38. | Deep River Center | 1.1% | 0.71%(+0.340)#38 | 0.88%(+0.175)#4,554 |
| 39. | Manchester | 1.0% | 0.71%(+0.335)#39 | 0.88%(+0.170)#4,585 |
| 40. | Pemberwick | 1.0% | 0.71%(+0.333)#40 | 0.88%(+0.168)#4,590 |
| 41. | Plattsville | 1.0% | 0.71%(+0.330)#41 | 0.88%(+0.165)#4,604 |
| 42. | Guilford Center | 1.0% | 0.71%(+0.294)#42 | 0.88%(+0.128)#4,731 |
| 43. | Wethersfield | 0.95% | 0.71%(+0.235)#43 | 0.88%(+0.070)#4,930 |
| 44. | Windsor Locks | 0.93% | 0.71%(+0.219)#44 | 0.88%(+0.054)#4,993 |
| 45. | East Haven | 0.90% | 0.71%(+0.182)#45 | 0.88%(+0.017)#5,138 |
| 46. | Norwalk | 0.87% | 0.71%(+0.159)#46 | 0.88%(-0.006)#5,229 |
| 47. | Waterbury | 0.85% | 0.71%(+0.135)#47 | 0.88%(-0.030)#5,326 |
| 48. | Meriden | 0.83% | 0.71%(+0.117)#48 | 0.88%(-0.048)#5,414 |
| 49. | Wilton Center | 0.82% | 0.71%(+0.110)#49 | 0.88%(-0.055)#5,446 |
| 50. | Simsbury Center | 0.79% | 0.71%(+0.075)#50 | 0.88%(-0.090)#5,573 |
| 51. | Northford | 0.76% | 0.71%(+0.050)#51 | 0.88%(-0.115)#5,696 |
| 52. | Orange | 0.74% | 0.71%(+0.029)#52 | 0.88%(-0.137)#5,796 |
| 53. | Staples | 0.73% | 0.71%(+0.016)#53 | 0.88%(-0.149)#5,847 |
| 54. | Hartford | 0.71% | 0.71%(-0.006)#54 | 0.88%(-0.171)#5,950 |
| 55. | Lakes West | 0.70% | 0.71%(-0.018)#55 | 0.88%(-0.183)#5,994 |
| 56. | Torrington | 0.67% | 0.71%(-0.040)#56 | 0.88%(-0.205)#6,097 |
| 57. | North Haven | 0.63% | 0.71%(-0.087)#57 | 0.88%(-0.252)#6,278 |
| 58. | Naugatuck Borough | 0.62% | 0.71%(-0.095)#58 | 0.88%(-0.260)#6,312 |
| 59. | Southwood Acres | 0.59% | 0.71%(-0.126)#59 | 0.88%(-0.291)#6,472 |
| 60. | Stamford | 0.59% | 0.71%(-0.129)#60 | 0.88%(-0.294)#6,486 |
| 61. | Trumbull Center | 0.58% | 0.71%(-0.137)#61 | 0.88%(-0.303)#6,530 |
| 62. | Sandy Hook | 0.55% | 0.71%(-0.162)#62 | 0.88%(-0.327)#6,621 |
| 63. | West Hartford | 0.55% | 0.71%(-0.163)#63 | 0.88%(-0.328)#6,624 |
| 64. | Groton Long Point Borough | 0.54% | 0.71%(-0.178)#64 | 0.88%(-0.343)#6,683 |
| 65. | Milford City Balance | 0.52% | 0.71%(-0.190)#65 | 0.88%(-0.355)#6,736 |
| 66. | Cos Cob | 0.51% | 0.71%(-0.203)#66 | 0.88%(-0.368)#6,792 |
| 67. | Colchester | 0.49% | 0.71%(-0.225)#67 | 0.88%(-0.390)#6,909 |
| 68. | Weatogue | 0.49% | 0.71%(-0.227)#68 | 0.88%(-0.392)#6,917 |
| 69. | Bridgeport | 0.48% | 0.71%(-0.232)#69 | 0.88%(-0.398)#6,945 |
| 70. | Greenwich | 0.46% | 0.71%(-0.257)#70 | 0.88%(-0.422)#7,041 |
| 71. | Saugatuck | 0.46% | 0.71%(-0.258)#71 | 0.88%(-0.423)#7,051 |
| 72. | Kensington | 0.44% | 0.71%(-0.271)#72 | 0.88%(-0.436)#7,092 |
| 73. | Litchfield Borough | 0.42% | 0.71%(-0.291)#73 | 0.88%(-0.456)#7,166 |
| 74. | Tashua | 0.40% | 0.71%(-0.313)#74 | 0.88%(-0.478)#7,268 |
| 75. | Newington | 0.39% | 0.71%(-0.323)#75 | 0.88%(-0.488)#7,313 |
| 76. | New London | 0.37% | 0.71%(-0.348)#76 | 0.88%(-0.513)#7,404 |
| 77. | Cheshire Village | 0.36% | 0.71%(-0.349)#77 | 0.88%(-0.515)#7,409 |
| 78. | Wallingford Center | 0.35% | 0.71%(-0.363)#78 | 0.88%(-0.528)#7,460 |
| 79. | Thompsonville | 0.35% | 0.71%(-0.368)#79 | 0.88%(-0.533)#7,486 |
| 80. | Norwich | 0.33% | 0.71%(-0.388)#80 | 0.88%(-0.553)#7,567 |
| 81. | Bristol | 0.31% | 0.71%(-0.406)#81 | 0.88%(-0.572)#7,631 |
| 82. | Ansonia | 0.26% | 0.71%(-0.459)#82 | 0.88%(-0.624)#7,817 |
| 83. | Riverside | 0.16% | 0.71%(-0.551)#83 | 0.88%(-0.716)#8,055 |
| 84. | West Haven | 0.14% | 0.71%(-0.577)#84 | 0.88%(-0.742)#8,105 |
| 85. | East Hartford | 0.12% | 0.71%(-0.596)#85 | 0.88%(-0.761)#8,140 |
| 86. | Compo | 0.049% | 0.71%(-0.665)#86 | 0.88%(-0.830)#8,202 |
Common Questions
What are the Top 10 Cities with the Highest Percentage of Population with a Degree in Multidisciplinary Studies in Connecticut?
Top 10 Cities with the Highest Percentage of Population with a Degree in Multidisciplinary Studies in Connecticut are:
#1
11.1%
#2
6.8%
#3
6.4%
#4
5.5%
#5
3.6%
#6
3.5%
#7
3.1%
#8
2.6%
#9
2.3%
#10
2.2%
What city has the Highest Percentage of Population with a Degree in Multidisciplinary Studies in Connecticut?
Gales Ferry has the Highest Percentage of Population with a Degree in Multidisciplinary Studies in Connecticut with 11.1%.
What is the Percentage of Population with a Degree in Multidisciplinary Studies in the State of Connecticut?
Percentage of Population with a Degree in Multidisciplinary Studies in Connecticut is 0.71%.
What is the Percentage of Population with a Degree in Multidisciplinary Studies in the United States?
Percentage of Population with a Degree in Multidisciplinary Studies in the United States is 0.88%.