Watertown, CT Map & Demographics
Watertown Map
Watertown Overview
$37,847
PER CAPITA INCOME
$80,417
AVG FAMILY INCOME
$67,252
AVG HOUSEHOLD INCOME
20.4%
WAGE / INCOME GAP [ % ]
79.6¢/ $1
WAGE / INCOME GAP [ $ ]
0.42
INEQUALITY / GINI INDEX
3,765
TOTAL POPULATION
1,860
MALE POPULATION
1,905
FEMALE POPULATION
97.64
MALES / 100 FEMALES
102.42
FEMALES / 100 MALES
43.6
MEDIAN AGE
3.0
AVG FAMILY SIZE
2.4
AVG HOUSEHOLD SIZE
2,002
LABOR FORCE [ PEOPLE ]
67.4%
PERCENT IN LABOR FORCE
4.1%
UNEMPLOYMENT RATE
Watertown Zip Codes
Watertown Area Codes
Income in Watertown
Income Overview in Watertown
Per Capita Income in Watertown is $37,847, while median incomes of families and households are $80,417 and $67,252 respectively.
| Characteristic | Number | Measure |
| Per Capita Income | 3,765 | $37,847 |
| Median Family Income | 990 | $80,417 |
| Mean Family Income | 990 | $100,488 |
| Median Household Income | 1,556 | $67,252 |
| Mean Household Income | 1,556 | $85,795 |
| Income Deficit | 990 | $0 |
| Wage / Income Gap (%) | 3,765 | 20.44% |
| Wage / Income Gap ($) | 3,765 | 79.56¢ per $1 |
| Gini / Inequality Index | 3,765 | 0.42 |
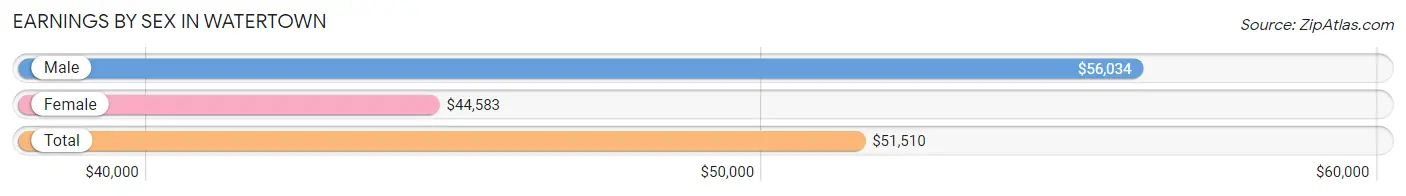
Earnings by Sex in Watertown
Average Earnings in Watertown are $51,510, $56,034 for men and $44,583 for women, a difference of 20.4%.
| Sex | Number | Average Earnings |
| Male | 1,058 (52.4%) | $56,034 |
| Female | 959 (47.5%) | $44,583 |
| Total | 2,017 (100.0%) | $51,510 |
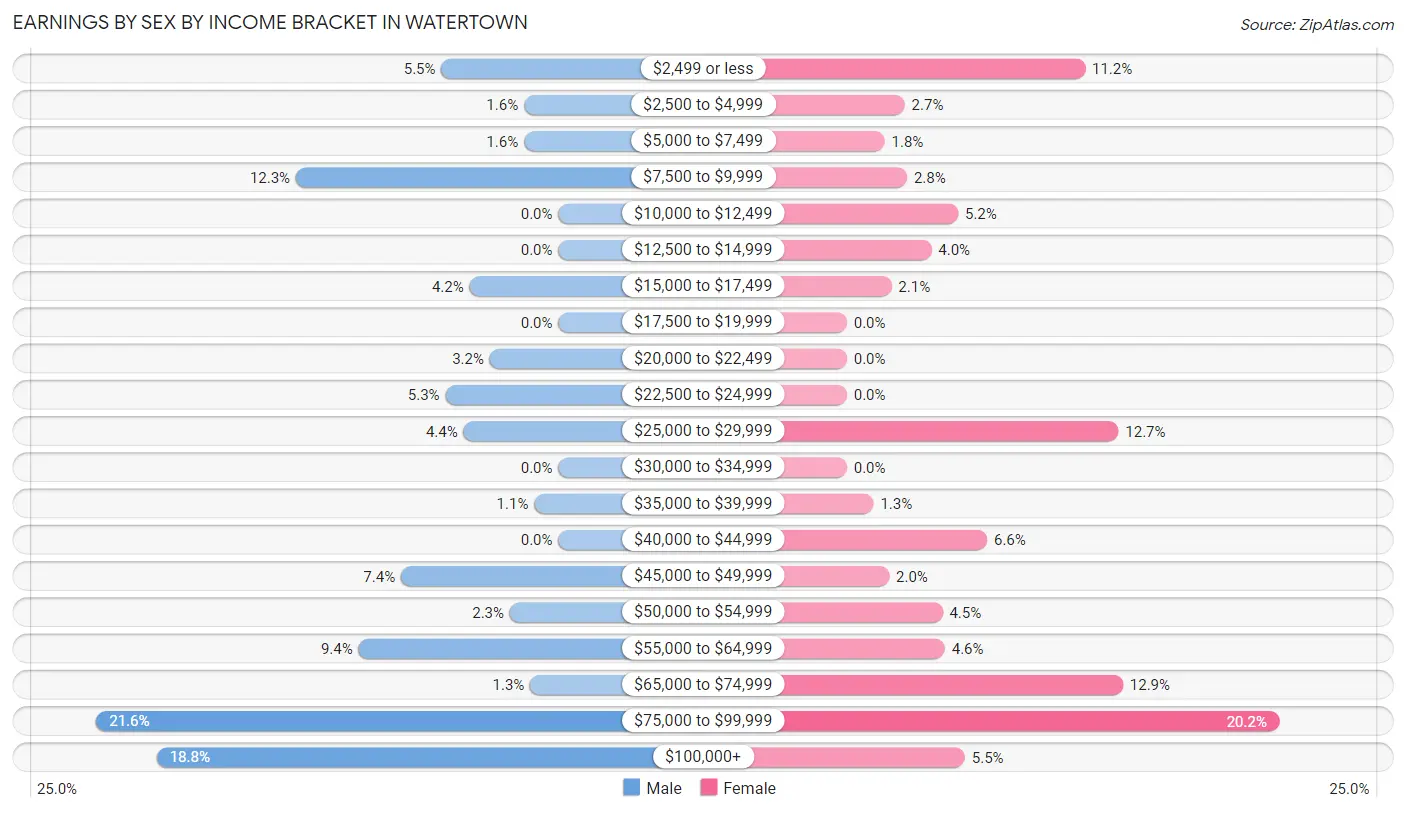
Earnings by Sex by Income Bracket in Watertown
The most common earnings brackets in Watertown are $75,000 to $99,999 for men (229 | 21.6%) and $75,000 to $99,999 for women (194 | 20.2%).
| Income | Male | Female |
| $2,499 or less | 58 (5.5%) | 107 (11.2%) |
| $2,500 to $4,999 | 17 (1.6%) | 26 (2.7%) |
| $5,000 to $7,499 | 17 (1.6%) | 17 (1.8%) |
| $7,500 to $9,999 | 130 (12.3%) | 27 (2.8%) |
| $10,000 to $12,499 | 0 (0.0%) | 50 (5.2%) |
| $12,500 to $14,999 | 0 (0.0%) | 38 (4.0%) |
| $15,000 to $17,499 | 44 (4.2%) | 20 (2.1%) |
| $17,500 to $19,999 | 0 (0.0%) | 0 (0.0%) |
| $20,000 to $22,499 | 34 (3.2%) | 0 (0.0%) |
| $22,500 to $24,999 | 56 (5.3%) | 0 (0.0%) |
| $25,000 to $29,999 | 47 (4.4%) | 122 (12.7%) |
| $30,000 to $34,999 | 0 (0.0%) | 0 (0.0%) |
| $35,000 to $39,999 | 12 (1.1%) | 12 (1.3%) |
| $40,000 to $44,999 | 0 (0.0%) | 63 (6.6%) |
| $45,000 to $49,999 | 78 (7.4%) | 19 (2.0%) |
| $50,000 to $54,999 | 24 (2.3%) | 43 (4.5%) |
| $55,000 to $64,999 | 99 (9.4%) | 44 (4.6%) |
| $65,000 to $74,999 | 14 (1.3%) | 124 (12.9%) |
| $75,000 to $99,999 | 229 (21.6%) | 194 (20.2%) |
| $100,000+ | 199 (18.8%) | 53 (5.5%) |
| Total | 1,058 (100.0%) | 959 (100.0%) |
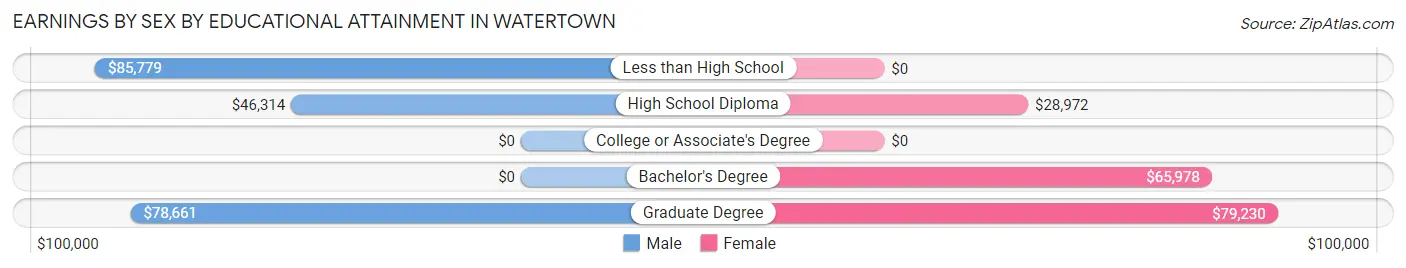
Earnings by Sex by Educational Attainment in Watertown
Average earnings in Watertown are $57,457 for men and $59,519 for women, a difference of 3.5%. Men with an educational attainment of less than high school enjoy the highest average annual earnings of $85,779, while those with high school diploma education earn the least with $46,314. Women with an educational attainment of graduate degree earn the most with the average annual earnings of $79,230, while those with high school diploma education have the smallest earnings of $28,972.
| Educational Attainment | Male Income | Female Income |
| Less than High School | $85,779 | $0 |
| High School Diploma | $46,314 | $28,972 |
| College or Associate's Degree | - | - |
| Bachelor's Degree | - | - |
| Graduate Degree | $78,661 | $79,230 |
| Total | $57,457 | $59,519 |
Family Income in Watertown
Family Income Brackets in Watertown
According to the Watertown family income data, there are 193 families falling into the $150,000 to $199,999 income range, which is the most common income bracket and makes up 19.5% of all families.
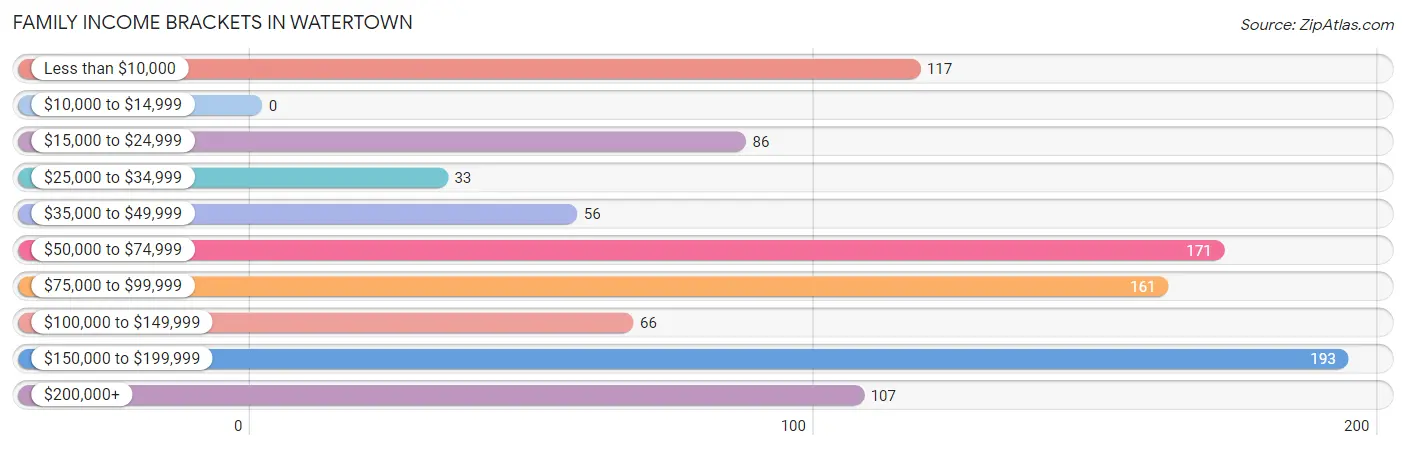
| Income Bracket | # Families | % Families |
| Less than $10,000 | 117 | 11.8% |
| $10,000 to $14,999 | 0 | 0.0% |
| $15,000 to $24,999 | 86 | 8.7% |
| $25,000 to $34,999 | 33 | 3.3% |
| $35,000 to $49,999 | 56 | 5.7% |
| $50,000 to $74,999 | 171 | 17.3% |
| $75,000 to $99,999 | 161 | 16.3% |
| $100,000 to $149,999 | 66 | 6.7% |
| $150,000 to $199,999 | 193 | 19.5% |
| $200,000+ | 107 | 10.8% |
Family Income by Famaliy Size in Watertown
4-person families (168 | 17.0%) account for the highest median family income in Watertown with $158,911 per family, while 4-person families (168 | 17.0%) have the highest median income of $39,728 per family member.
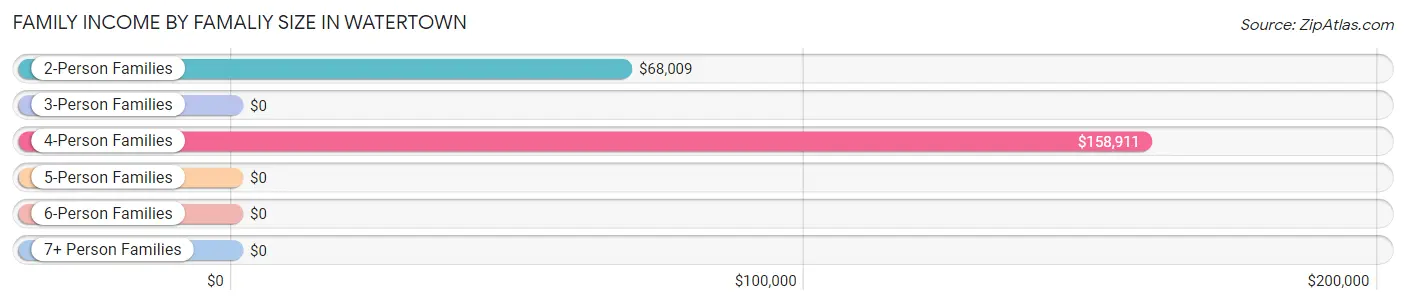
| Income Bracket | # Families | Median Income |
| 2-Person Families | 467 (47.2%) | $68,009 |
| 3-Person Families | 199 (20.1%) | $0 |
| 4-Person Families | 168 (17.0%) | $158,911 |
| 5-Person Families | 117 (11.8%) | $0 |
| 6-Person Families | 39 (3.9%) | $0 |
| 7+ Person Families | 0 (0.0%) | $0 |
| Total | 990 (100.0%) | $80,417 |
Family Income by Number of Earners in Watertown

| Number of Earners | # Families | Median Income |
| No Earners | 201 (20.3%) | $0 |
| 1 Earner | 337 (34.0%) | $64,125 |
| 2 Earners | 350 (35.3%) | $165,515 |
| 3+ Earners | 102 (10.3%) | $158,629 |
| Total | 990 (100.0%) | $80,417 |
Household Income in Watertown
Household Income Brackets in Watertown
With 406 households falling in the category, the $50,000 to $74,999 income range is the most frequent in Watertown, accounting for 26.1% of all households.
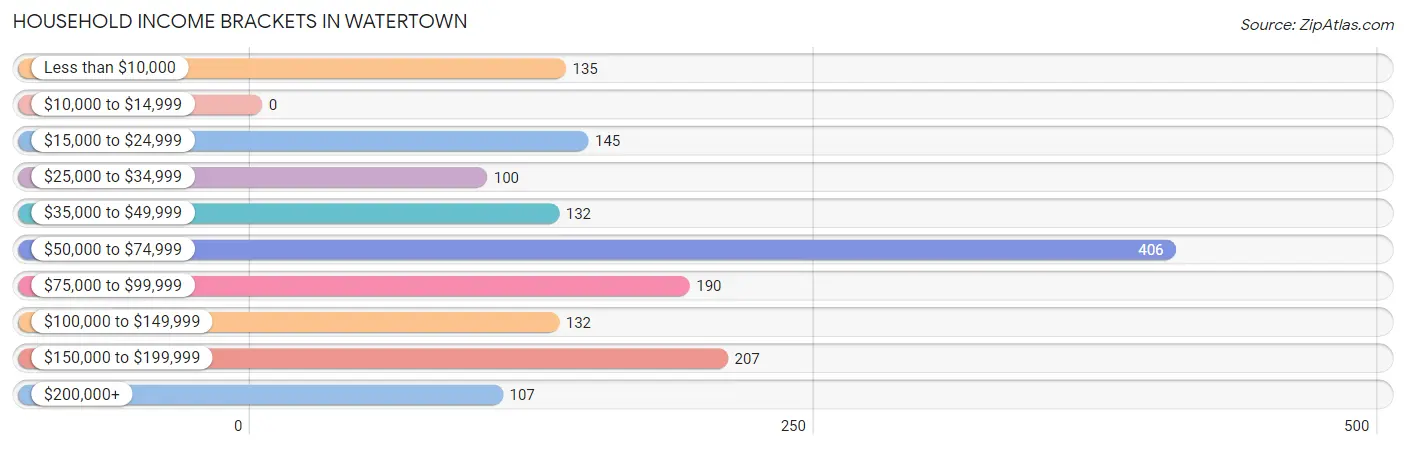
| Income Bracket | # Households | % Households |
| Less than $10,000 | 135 | 8.7% |
| $10,000 to $14,999 | 0 | 0.0% |
| $15,000 to $24,999 | 145 | 9.3% |
| $25,000 to $34,999 | 100 | 6.4% |
| $35,000 to $49,999 | 132 | 8.5% |
| $50,000 to $74,999 | 406 | 26.1% |
| $75,000 to $99,999 | 190 | 12.2% |
| $100,000 to $149,999 | 132 | 8.5% |
| $150,000 to $199,999 | 207 | 13.3% |
| $200,000+ | 107 | 6.9% |
Household Income by Householder Age in Watertown
The median household income in Watertown is $67,252, with the highest median household income of $69,058 found in the 45 to 64 years age bracket for the primary householder. A total of 649 households (41.7%) fall into this category. Meanwhile, the 15 to 24 years age bracket for the primary householder has the lowest median household income of $0, with 87 households (5.6%) in this group.
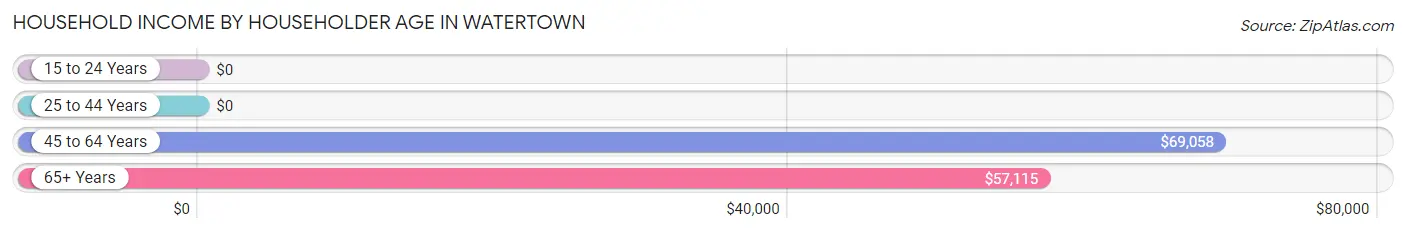
| Income Bracket | # Households | Median Income |
| 15 to 24 Years | 87 (5.6%) | $0 |
| 25 to 44 Years | 322 (20.7%) | $0 |
| 45 to 64 Years | 649 (41.7%) | $69,058 |
| 65+ Years | 498 (32.0%) | $57,115 |
| Total | 1,556 (100.0%) | $67,252 |
Poverty in Watertown
Income Below Poverty by Sex and Age in Watertown
With 17.0% poverty level for males and 22.9% for females among the residents of Watertown, 5 year old males and 12 to 14 year old females are the most vulnerable to poverty, with 106 males (90.6%) and 78 females (54.9%) in their respective age groups living below the poverty level.
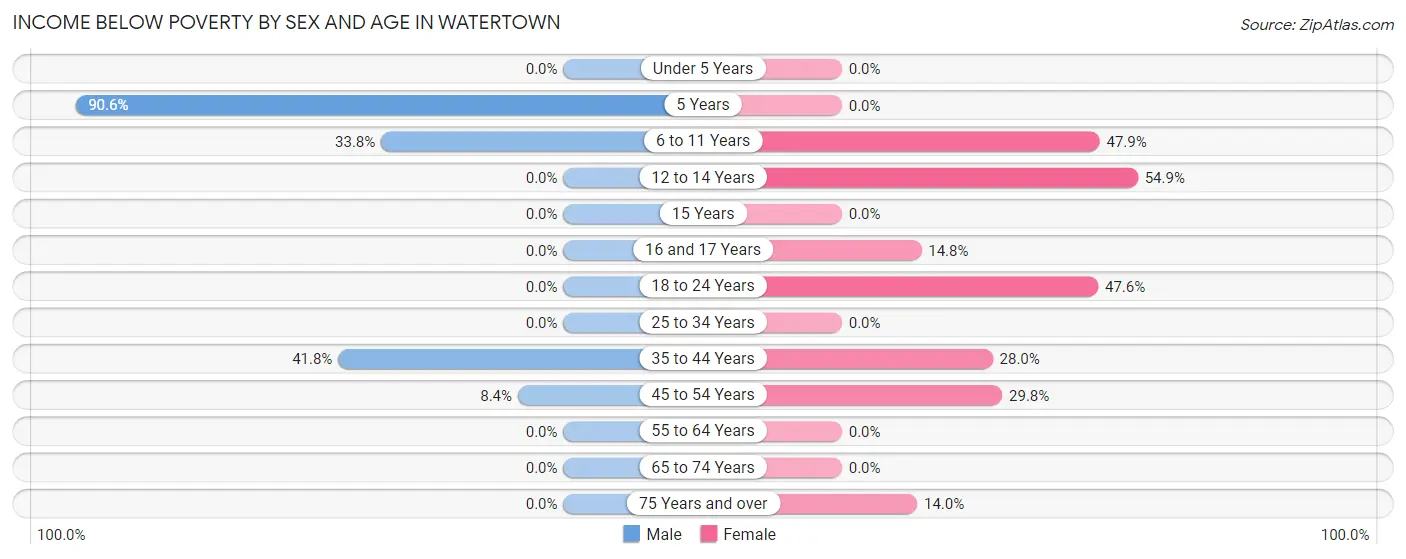
| Age Bracket | Male | Female |
| Under 5 Years | 0 (0.0%) | 0 (0.0%) |
| 5 Years | 106 (90.6%) | 0 (0.0%) |
| 6 to 11 Years | 68 (33.8%) | 78 (47.8%) |
| 12 to 14 Years | 0 (0.0%) | 78 (54.9%) |
| 15 Years | 0 (0.0%) | 0 (0.0%) |
| 16 and 17 Years | 0 (0.0%) | 9 (14.7%) |
| 18 to 24 Years | 0 (0.0%) | 78 (47.6%) |
| 25 to 34 Years | 0 (0.0%) | 0 (0.0%) |
| 35 to 44 Years | 117 (41.8%) | 89 (28.0%) |
| 45 to 54 Years | 26 (8.4%) | 86 (29.8%) |
| 55 to 64 Years | 0 (0.0%) | 0 (0.0%) |
| 65 to 74 Years | 0 (0.0%) | 0 (0.0%) |
| 75 Years and over | 0 (0.0%) | 19 (14.0%) |
| Total | 317 (17.0%) | 437 (22.9%) |
Income Above Poverty by Sex and Age in Watertown
According to the poverty statistics in Watertown, males aged 12 to 14 years and females aged under 5 years are the age groups that are most secure financially, with 100.0% of males and 100.0% of females in these age groups living above the poverty line.
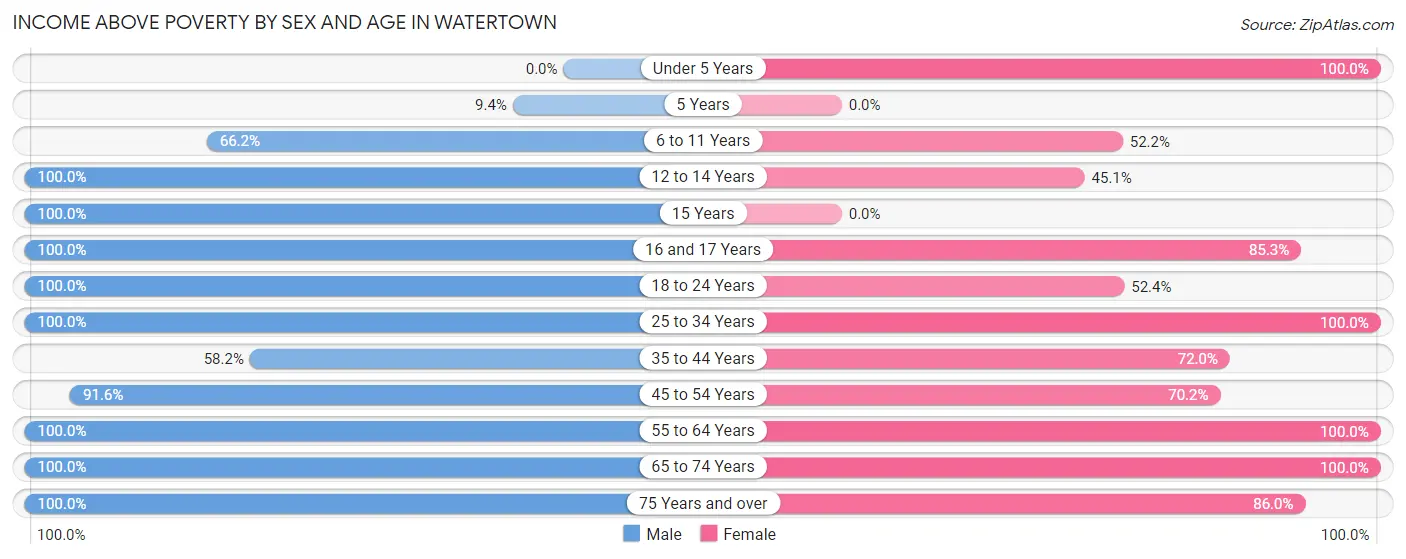
| Age Bracket | Male | Female |
| Under 5 Years | 0 (0.0%) | 90 (100.0%) |
| 5 Years | 11 (9.4%) | 0 (0.0%) |
| 6 to 11 Years | 133 (66.2%) | 85 (52.1%) |
| 12 to 14 Years | 73 (100.0%) | 64 (45.1%) |
| 15 Years | 8 (100.0%) | 0 (0.0%) |
| 16 and 17 Years | 19 (100.0%) | 52 (85.3%) |
| 18 to 24 Years | 66 (100.0%) | 86 (52.4%) |
| 25 to 34 Years | 193 (100.0%) | 42 (100.0%) |
| 35 to 44 Years | 163 (58.2%) | 229 (72.0%) |
| 45 to 54 Years | 282 (91.6%) | 203 (70.2%) |
| 55 to 64 Years | 201 (100.0%) | 337 (100.0%) |
| 65 to 74 Years | 188 (100.0%) | 163 (100.0%) |
| 75 Years and over | 206 (100.0%) | 117 (86.0%) |
| Total | 1,543 (83.0%) | 1,468 (77.1%) |
Income Below Poverty Among Married-Couple Families in Watertown
The poverty statistics for married-couple families in Watertown show that 16.4% or 117 of the total 714 families live below the poverty line. Families with 3 or 4 children have the highest poverty rate of 75.0%, comprising of 117 families. On the other hand, families with no children have the lowest poverty rate of 0.0%, which includes 0 families.
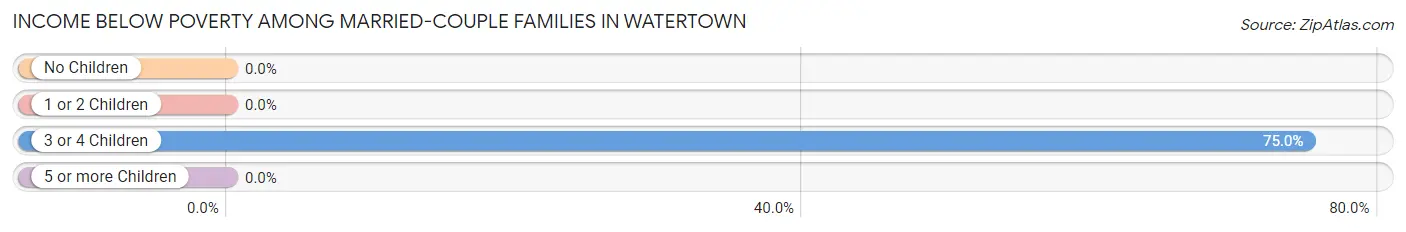
| Children | Above Poverty | Below Poverty |
| No Children | 312 (100.0%) | 0 (0.0%) |
| 1 or 2 Children | 246 (100.0%) | 0 (0.0%) |
| 3 or 4 Children | 39 (25.0%) | 117 (75.0%) |
| 5 or more Children | 0 (0.0%) | 0 (0.0%) |
| Total | 597 (83.6%) | 117 (16.4%) |
Income Below Poverty Among Single-Parent Households in Watertown
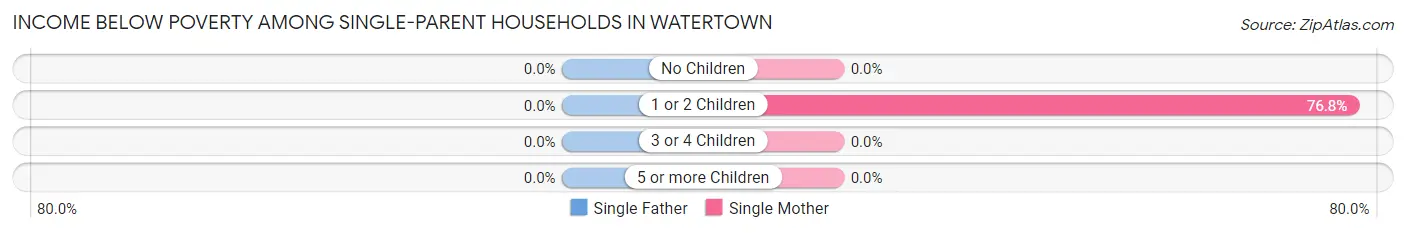
| Children | Single Father | Single Mother |
| No Children | 0 (0.0%) | 0 (0.0%) |
| 1 or 2 Children | 0 (0.0%) | 86 (76.8%) |
| 3 or 4 Children | 0 (0.0%) | 0 (0.0%) |
| 5 or more Children | 0 (0.0%) | 0 (0.0%) |
| Total | 0 (0.0%) | 86 (55.1%) |
Income Below Poverty Among Married-Couple vs Single-Parent Households in Watertown
The poverty data for Watertown shows that 117 of the married-couple family households (16.4%) and 86 of the single-parent households (31.2%) are living below the poverty level. Within the married-couple family households, those with 3 or 4 children have the highest poverty rate, with 117 households (75.0%) falling below the poverty line. Among the single-parent households, those with 1 or 2 children have the highest poverty rate, with 86 household (58.5%) living below poverty.
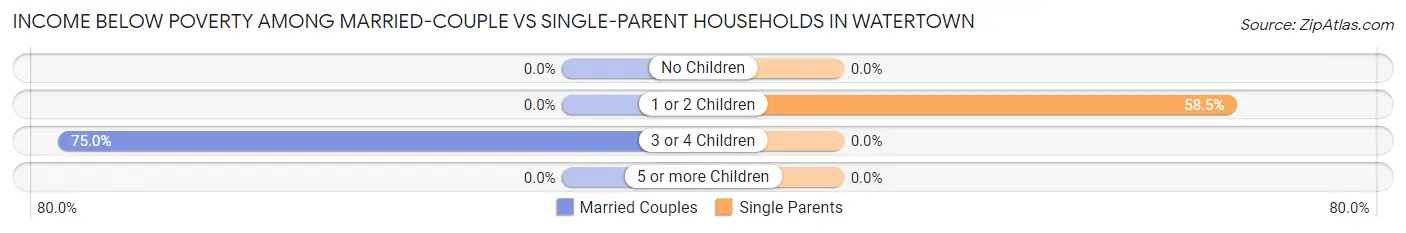
| Children | Married-Couple Families | Single-Parent Households |
| No Children | 0 (0.0%) | 0 (0.0%) |
| 1 or 2 Children | 0 (0.0%) | 86 (58.5%) |
| 3 or 4 Children | 117 (75.0%) | 0 (0.0%) |
| 5 or more Children | 0 (0.0%) | 0 (0.0%) |
| Total | 117 (16.4%) | 86 (31.2%) |
Race in Watertown
The most populous races in Watertown are White / Caucasian (2,808 | 74.6%), Asian (524 | 13.9%), and Hispanic or Latino (285 | 7.6%).
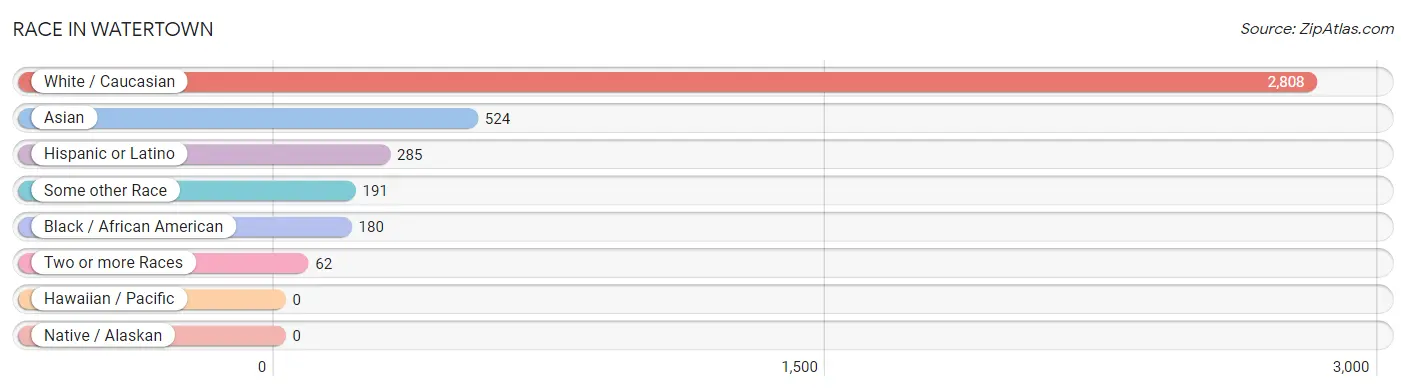
| Race | # Population | % Population |
| Asian | 524 | 13.9% |
| Black / African American | 180 | 4.8% |
| Hawaiian / Pacific | 0 | 0.0% |
| Hispanic or Latino | 285 | 7.6% |
| Native / Alaskan | 0 | 0.0% |
| White / Caucasian | 2,808 | 74.6% |
| Two or more Races | 62 | 1.7% |
| Some other Race | 191 | 5.1% |
| Total | 3,765 | 100.0% |
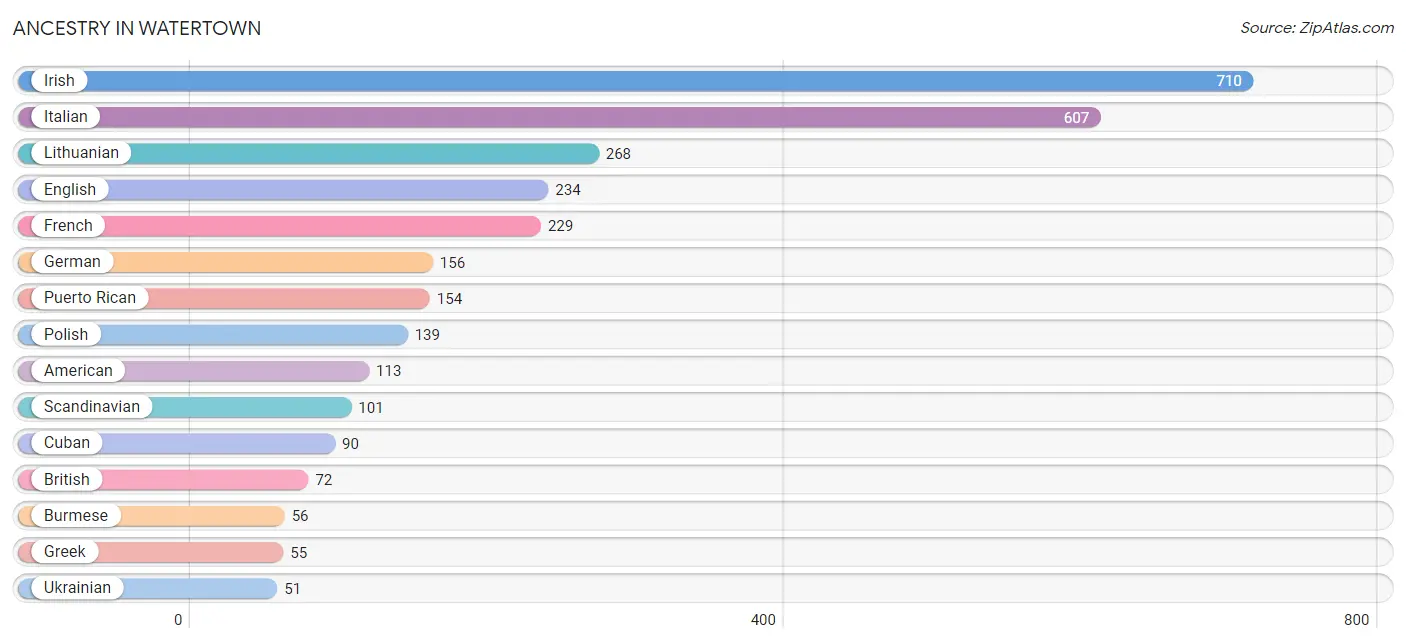
Ancestry in Watertown
The most populous ancestries reported in Watertown are Irish (710 | 18.9%), Italian (607 | 16.1%), Lithuanian (268 | 7.1%), English (234 | 6.2%), and French (229 | 6.1%), together accounting for 54.4% of all Watertown residents.
| Ancestry | # Population | % Population |
| American | 113 | 3.0% |
| Arab | 48 | 1.3% |
| Austrian | 30 | 0.8% |
| British | 72 | 1.9% |
| Burmese | 56 | 1.5% |
| Cuban | 90 | 2.4% |
| Dutch | 13 | 0.4% |
| Eastern European | 20 | 0.5% |
| English | 234 | 6.2% |
| European | 9 | 0.2% |
| Finnish | 8 | 0.2% |
| French | 229 | 6.1% |
| French Canadian | 15 | 0.4% |
| German | 156 | 4.1% |
| Greek | 55 | 1.5% |
| Haitian | 33 | 0.9% |
| Hungarian | 33 | 0.9% |
| Irish | 710 | 18.9% |
| Italian | 607 | 16.1% |
| Laotian | 38 | 1.0% |
| Lebanese | 25 | 0.7% |
| Lithuanian | 268 | 7.1% |
| Mexican | 15 | 0.4% |
| Moroccan | 23 | 0.6% |
| Northern European | 41 | 1.1% |
| Norwegian | 38 | 1.0% |
| Polish | 139 | 3.7% |
| Puerto Rican | 154 | 4.1% |
| Russian | 15 | 0.4% |
| Scandinavian | 101 | 2.7% |
| Scottish | 5 | 0.1% |
| Spaniard | 26 | 0.7% |
| Turkish | 14 | 0.4% |
| Ukrainian | 51 | 1.3% | View All 34 Rows |
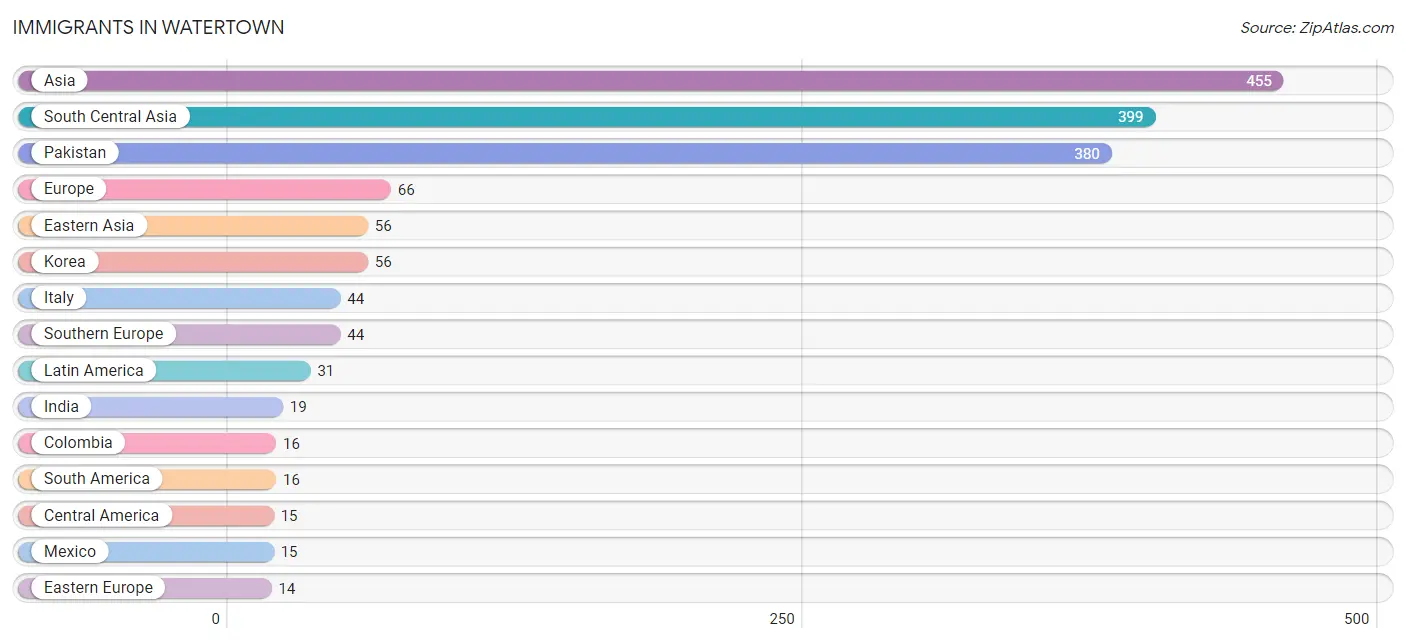
Immigrants in Watertown
The most numerous immigrant groups reported in Watertown came from Asia (455 | 12.1%), South Central Asia (399 | 10.6%), Pakistan (380 | 10.1%), Europe (66 | 1.8%), and Eastern Asia (56 | 1.5%), together accounting for 36.0% of all Watertown residents.
| Immigration Origin | # Population | % Population |
| Asia | 455 | 12.1% |
| Central America | 15 | 0.4% |
| Colombia | 16 | 0.4% |
| Eastern Asia | 56 | 1.5% |
| Eastern Europe | 14 | 0.4% |
| Europe | 66 | 1.8% |
| India | 19 | 0.5% |
| Italy | 44 | 1.2% |
| Korea | 56 | 1.5% |
| Latin America | 31 | 0.8% |
| Mexico | 15 | 0.4% |
| North Macedonia | 14 | 0.4% |
| Northern Europe | 8 | 0.2% |
| Pakistan | 380 | 10.1% |
| South America | 16 | 0.4% |
| South Central Asia | 399 | 10.6% |
| Southern Europe | 44 | 1.2% | View All 17 Rows |
Sex and Age in Watertown
Sex and Age in Watertown
The most populous age groups in Watertown are 10 to 14 Years (239 | 12.9%) for men and 55 to 59 Years (237 | 12.4%) for women.
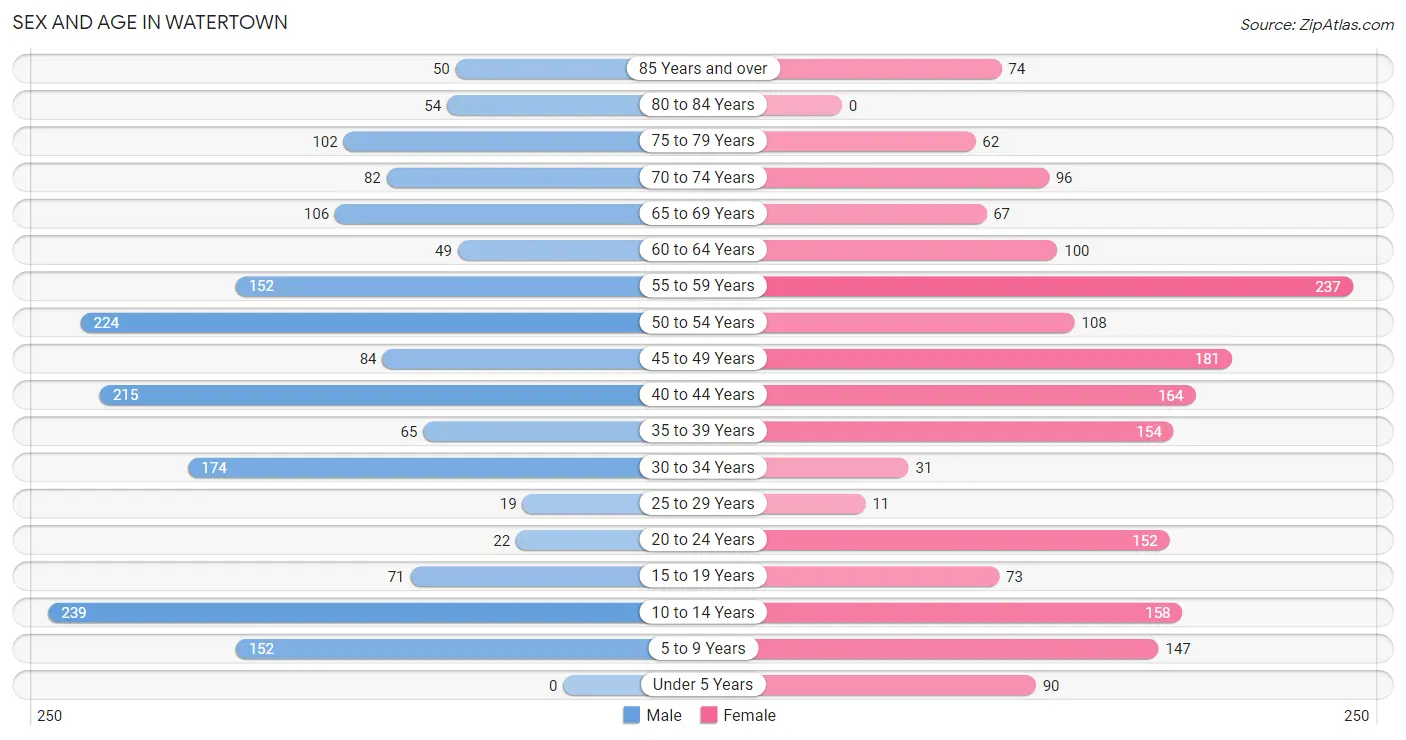
| Age Bracket | Male | Female |
| Under 5 Years | 0 (0.0%) | 90 (4.7%) |
| 5 to 9 Years | 152 (8.2%) | 147 (7.7%) |
| 10 to 14 Years | 239 (12.9%) | 158 (8.3%) |
| 15 to 19 Years | 71 (3.8%) | 73 (3.8%) |
| 20 to 24 Years | 22 (1.2%) | 152 (8.0%) |
| 25 to 29 Years | 19 (1.0%) | 11 (0.6%) |
| 30 to 34 Years | 174 (9.3%) | 31 (1.6%) |
| 35 to 39 Years | 65 (3.5%) | 154 (8.1%) |
| 40 to 44 Years | 215 (11.6%) | 164 (8.6%) |
| 45 to 49 Years | 84 (4.5%) | 181 (9.5%) |
| 50 to 54 Years | 224 (12.0%) | 108 (5.7%) |
| 55 to 59 Years | 152 (8.2%) | 237 (12.4%) |
| 60 to 64 Years | 49 (2.6%) | 100 (5.2%) |
| 65 to 69 Years | 106 (5.7%) | 67 (3.5%) |
| 70 to 74 Years | 82 (4.4%) | 96 (5.0%) |
| 75 to 79 Years | 102 (5.5%) | 62 (3.3%) |
| 80 to 84 Years | 54 (2.9%) | 0 (0.0%) |
| 85 Years and over | 50 (2.7%) | 74 (3.9%) |
| Total | 1,860 (100.0%) | 1,905 (100.0%) |
Families and Households in Watertown
Median Family Size in Watertown
The median family size in Watertown is 2.99 persons per family, with married-couple families (714 | 72.1%) accounting for the largest median family size of 3.21 persons per family. On the other hand, single female/mother families (156 | 15.8%) represent the smallest median family size with 2.03 persons per family.
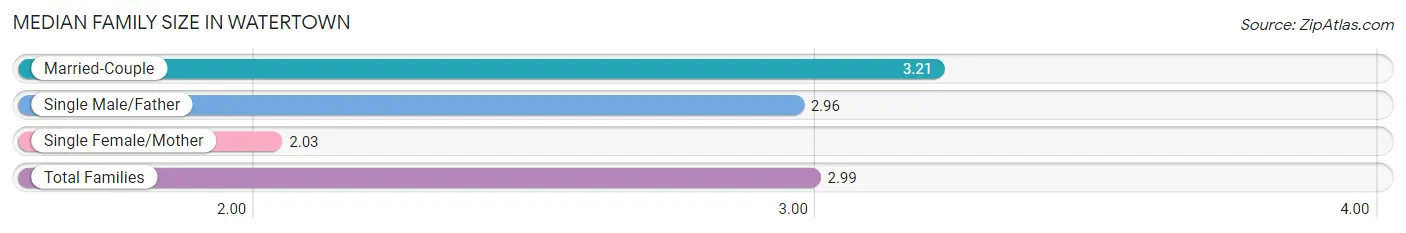
| Family Type | # Families | Family Size |
| Married-Couple | 714 (72.1%) | 3.21 |
| Single Male/Father | 120 (12.1%) | 2.96 |
| Single Female/Mother | 156 (15.8%) | 2.03 |
| Total Families | 990 (100.0%) | 2.99 |
Median Household Size in Watertown
The median household size in Watertown is 2.36 persons per household, with married-couple households (714 | 45.9%) accounting for the largest median household size of 3.21 persons per household. non-family households (566 | 36.4%) represent the smallest median household size with 1.12 persons per household.
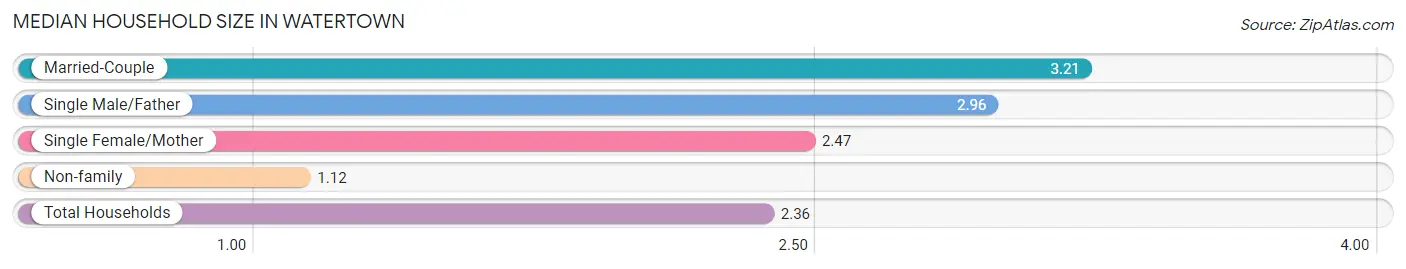
| Household Type | # Households | Household Size |
| Married-Couple | 714 (45.9%) | 3.21 |
| Single Male/Father | 120 (7.7%) | 2.96 |
| Single Female/Mother | 156 (10.0%) | 2.47 |
| Non-family | 566 (36.4%) | 1.12 |
| Total Households | 1,556 (100.0%) | 2.36 |
Household Size by Marriage Status in Watertown
Out of a total of 1,556 households in Watertown, 990 (63.6%) are family households, while 566 (36.4%) are nonfamily households. The most numerous type of family households are 2-person households, comprising 452, and the most common type of nonfamily households are 1-person households, comprising 510.
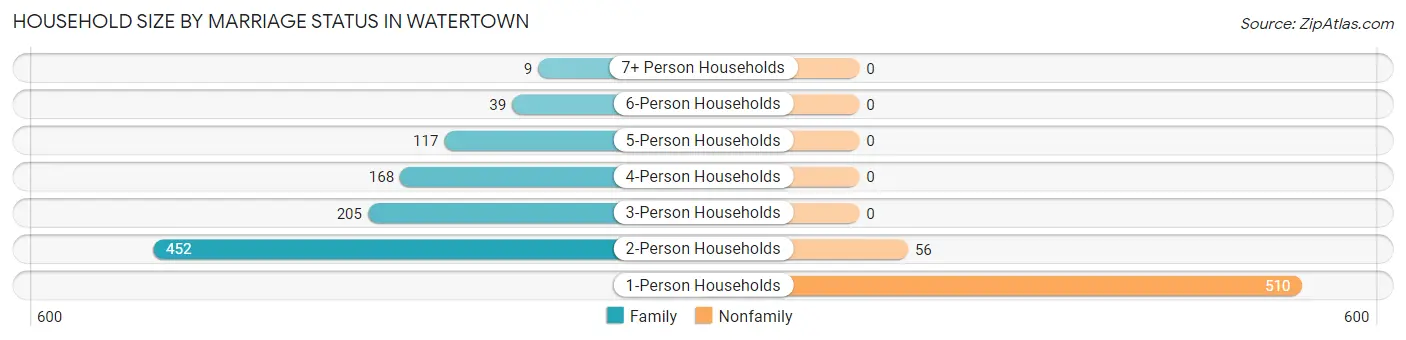
| Household Size | Family Households | Nonfamily Households |
| 1-Person Households | - | 510 (32.8%) |
| 2-Person Households | 452 (29.0%) | 56 (3.6%) |
| 3-Person Households | 205 (13.2%) | 0 (0.0%) |
| 4-Person Households | 168 (10.8%) | 0 (0.0%) |
| 5-Person Households | 117 (7.5%) | 0 (0.0%) |
| 6-Person Households | 39 (2.5%) | 0 (0.0%) |
| 7+ Person Households | 9 (0.6%) | 0 (0.0%) |
| Total | 990 (63.6%) | 566 (36.4%) |
Female Fertility in Watertown
Fertility by Age in Watertown
| Age Bracket | Women with Births | Births / 1,000 Women |
| 15 to 19 years | 0 (0.0%) | 0.0 |
| 20 to 34 years | 0 (0.0%) | 0.0 |
| 35 to 50 years | 0 (0.0%) | 0.0 |
| Total | 0 (0.0%) | 0.0 |
Fertility by Age by Marriage Status in Watertown
| Age Bracket | Married | Unmarried |
| 15 to 19 years | 0 (0.0%) | 0 (0.0%) |
| 20 to 34 years | 0 (0.0%) | 0 (0.0%) |
| 35 to 50 years | 0 (0.0%) | 0 (0.0%) |
| Total | 0 (0.0%) | 0 (0.0%) |
Fertility by Education in Watertown
| Educational Attainment | Women with Births | Births / 1,000 Women |
| Less than High School | 0 (0.0%) | 0.0 |
| High School Diploma | 0 (0.0%) | 0.0 |
| College or Associate's Degree | 0 (0.0%) | 0.0 |
| Bachelor's Degree | 0 (0.0%) | 0.0 |
| Graduate Degree | 0 (0.0%) | 0.0 |
| Total | 0 (0.0%) | 0.0 |
Fertility by Education by Marriage Status in Watertown
| Educational Attainment | Married | Unmarried |
| Less than High School | 0 (0.0%) | 0 (0.0%) |
| High School Diploma | 0 (0.0%) | 0 (0.0%) |
| College or Associate's Degree | 0 (0.0%) | 0 (0.0%) |
| Bachelor's Degree | 0 (0.0%) | 0 (0.0%) |
| Graduate Degree | 0 (0.0%) | 0 (0.0%) |
| Total | 0 (0.0%) | 0 (0.0%) |
Employment Characteristics in Watertown
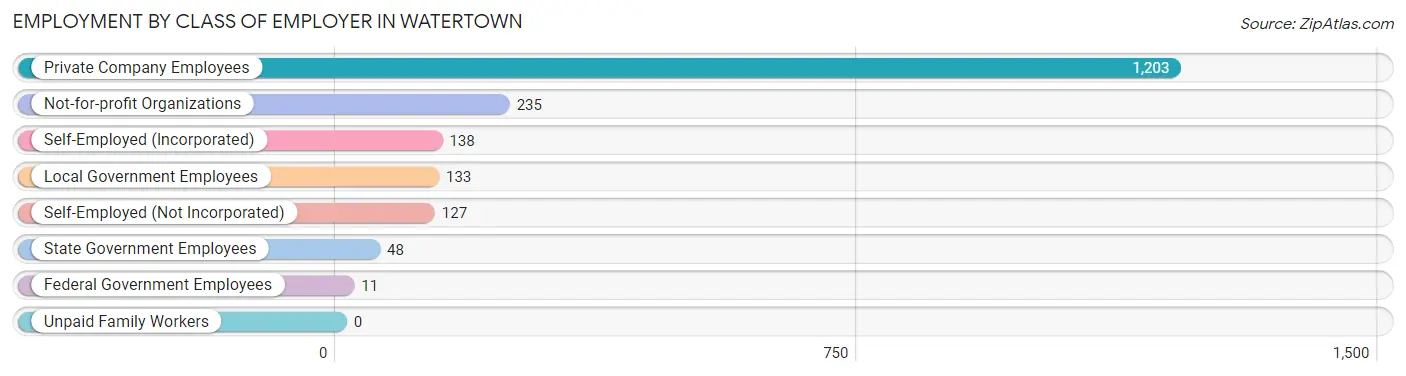
Employment by Class of Employer in Watertown
Among the 1,895 employed individuals in Watertown, private company employees (1,203 | 63.5%), not-for-profit organizations (235 | 12.4%), and self-employed (incorporated) (138 | 7.3%) make up the most common classes of employment.
| Employer Class | # Employees | % Employees |
| Private Company Employees | 1,203 | 63.5% |
| Self-Employed (Incorporated) | 138 | 7.3% |
| Self-Employed (Not Incorporated) | 127 | 6.7% |
| Not-for-profit Organizations | 235 | 12.4% |
| Local Government Employees | 133 | 7.0% |
| State Government Employees | 48 | 2.5% |
| Federal Government Employees | 11 | 0.6% |
| Unpaid Family Workers | 0 | 0.0% |
| Total | 1,895 | 100.0% |
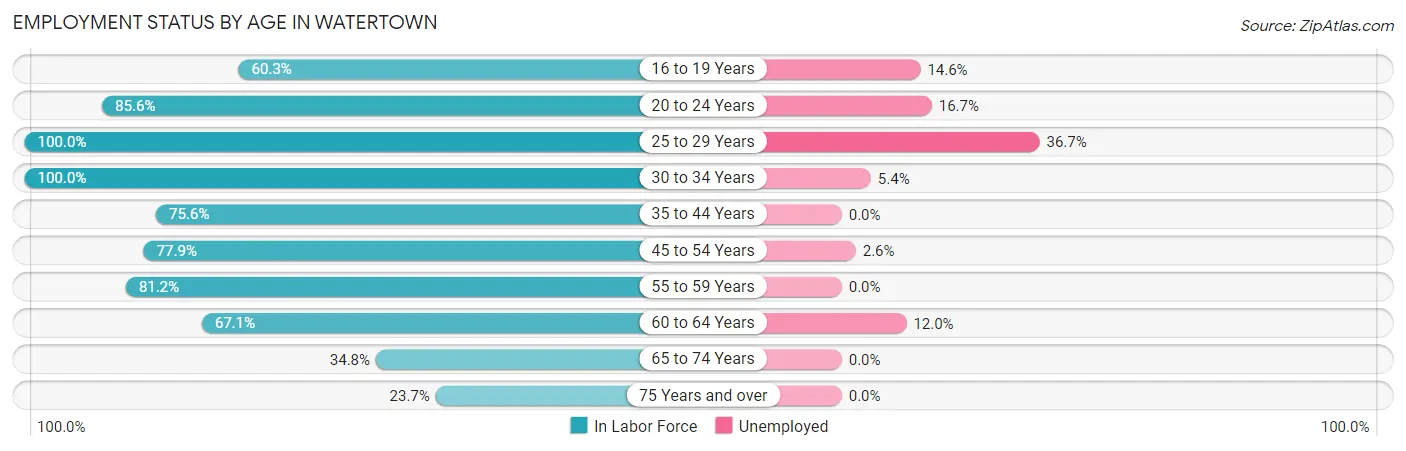
Employment Status by Age in Watertown
According to the labor force statistics for Watertown, out of the total population over 16 years of age (2,971), 67.4% or 2,002 individuals are in the labor force, with 4.1% or 82 of them unemployed. The age group with the highest labor force participation rate is 25 to 29 years, with 100.0% or 30 individuals in the labor force. Within the labor force, the 25 to 29 years age range has the highest percentage of unemployed individuals, with 36.7% or 11 of them being unemployed.
| Age Bracket | In Labor Force | Unemployed |
| 16 to 19 Years | 82 (60.3%) | 12 (14.6%) |
| 20 to 24 Years | 149 (85.6%) | 25 (16.7%) |
| 25 to 29 Years | 30 (100.0%) | 11 (36.7%) |
| 30 to 34 Years | 205 (100.0%) | 11 (5.4%) |
| 35 to 44 Years | 452 (75.6%) | 0 (0.0%) |
| 45 to 54 Years | 465 (77.9%) | 12 (2.6%) |
| 55 to 59 Years | 316 (81.2%) | 0 (0.0%) |
| 60 to 64 Years | 100 (67.1%) | 12 (12.0%) |
| 65 to 74 Years | 122 (34.8%) | 0 (0.0%) |
| 75 Years and over | 81 (23.7%) | 0 (0.0%) |
| Total | 2,002 (67.4%) | 82 (4.1%) |
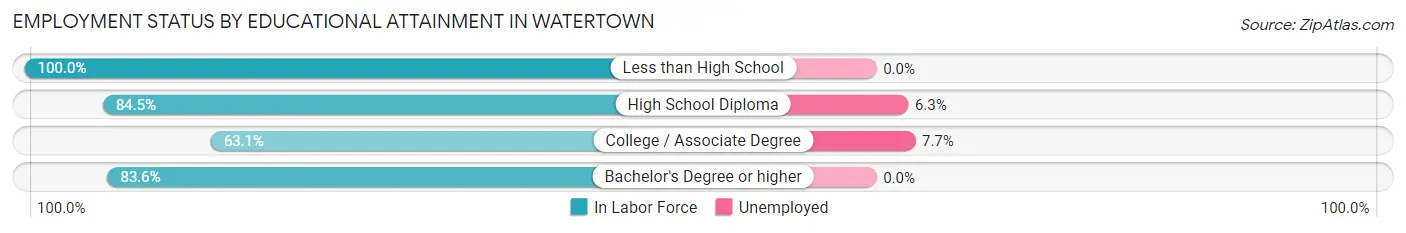
Employment Status by Educational Attainment in Watertown
According to labor force statistics for Watertown, 79.7% of individuals (1,568) out of the total population between 25 and 64 years of age (1,968) are in the labor force, with 2.9% or 45 of them being unemployed. The group with the highest labor force participation rate are those with the educational attainment of less than high school, with 100.0% or 95 individuals in the labor force. Within the labor force, individuals with college / associate degree education have the highest percentage of unemployment, with 7.7% or 23 of them being unemployed.
| Educational Attainment | In Labor Force | Unemployed |
| Less than High School | 95 (100.0%) | 0 (0.0%) |
| High School Diploma | 364 (84.5%) | 27 (6.3%) |
| College / Associate Degree | 298 (63.1%) | 36 (7.7%) |
| Bachelor's Degree or higher | 811 (83.6%) | 0 (0.0%) |
| Total | 1,568 (79.7%) | 57 (2.9%) |
Employment Occupations by Sex in Watertown
Management, Business, Science and Arts Occupations
The most common Management, Business, Science and Arts occupations in Watertown are Community & Social Service (391 | 20.5%), Management (291 | 15.2%), Education, Arts & Media (177 | 9.3%), Education Instruction & Library (142 | 7.4%), and Computers, Engineering & Science (120 | 6.3%).
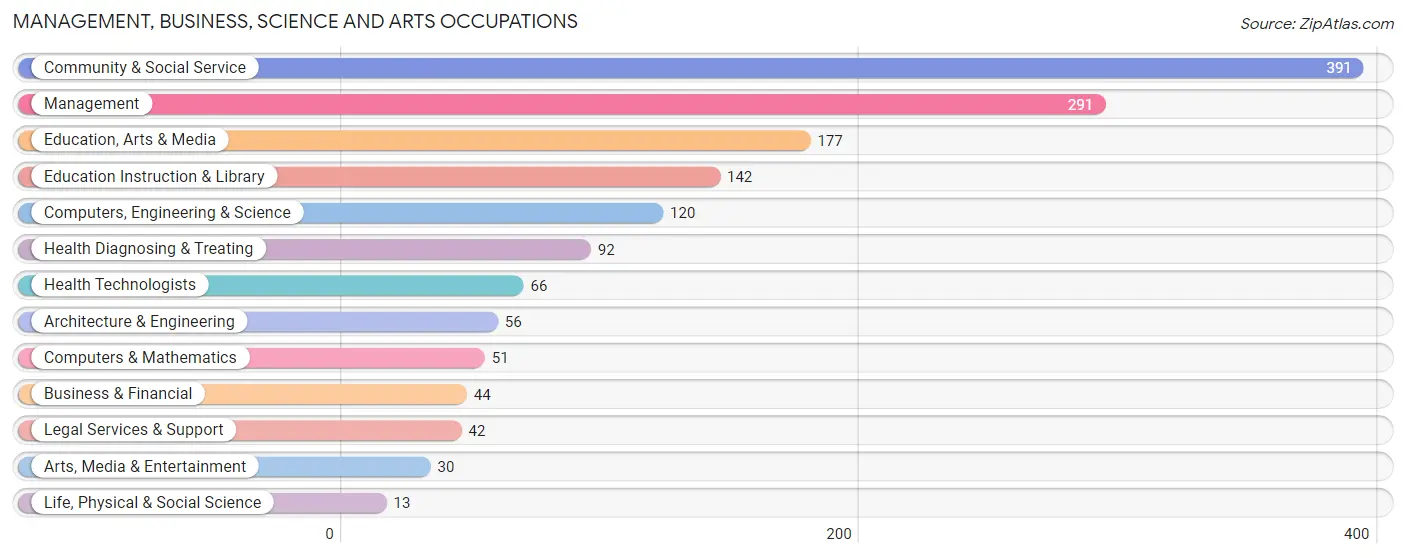
Management, Business, Science and Arts Occupations by Sex
Within the Management, Business, Science and Arts occupations in Watertown, the most male-oriented occupations are Architecture & Engineering (100.0%), Legal Services & Support (100.0%), and Arts, Media & Entertainment (100.0%), while the most female-oriented occupations are Life, Physical & Social Science (100.0%), Health Diagnosing & Treating (100.0%), and Health Technologists (100.0%).
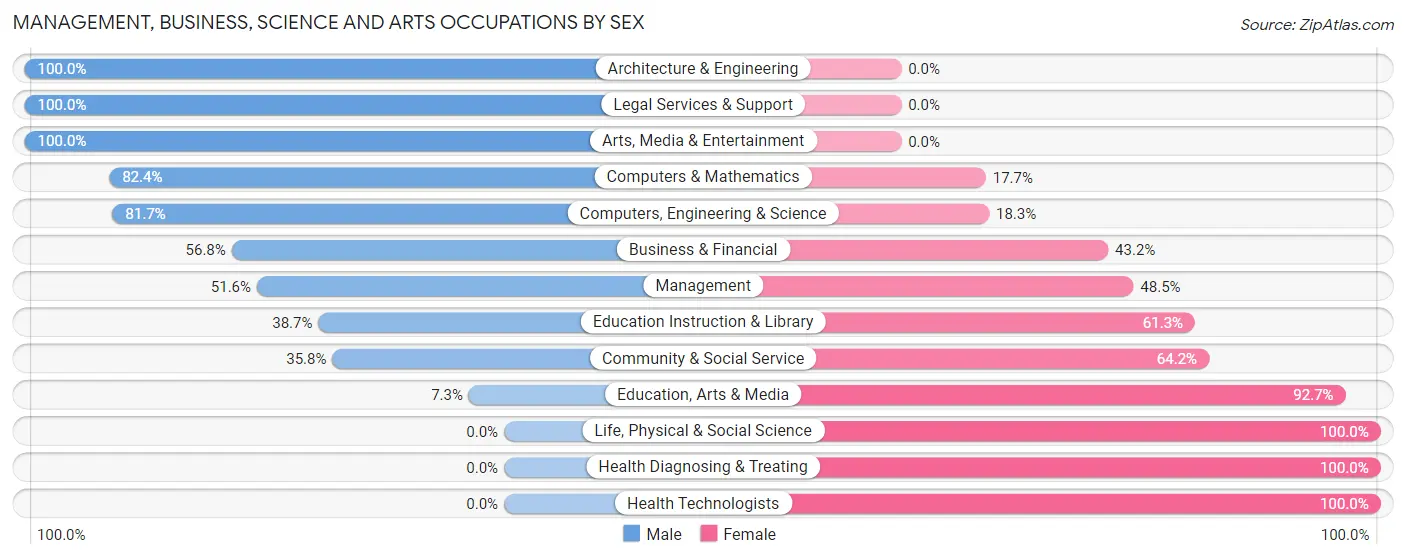
| Occupation | Male | Female |
| Management | 150 (51.5%) | 141 (48.4%) |
| Business & Financial | 25 (56.8%) | 19 (43.2%) |
| Computers, Engineering & Science | 98 (81.7%) | 22 (18.3%) |
| Computers & Mathematics | 42 (82.4%) | 9 (17.6%) |
| Architecture & Engineering | 56 (100.0%) | 0 (0.0%) |
| Life, Physical & Social Science | 0 (0.0%) | 13 (100.0%) |
| Community & Social Service | 140 (35.8%) | 251 (64.2%) |
| Education, Arts & Media | 13 (7.3%) | 164 (92.7%) |
| Legal Services & Support | 42 (100.0%) | 0 (0.0%) |
| Education Instruction & Library | 55 (38.7%) | 87 (61.3%) |
| Arts, Media & Entertainment | 30 (100.0%) | 0 (0.0%) |
| Health Diagnosing & Treating | 0 (0.0%) | 92 (100.0%) |
| Health Technologists | 0 (0.0%) | 66 (100.0%) |
| Total (Category) | 413 (44.0%) | 525 (56.0%) |
| Total (Overall) | 999 (52.3%) | 911 (47.7%) |
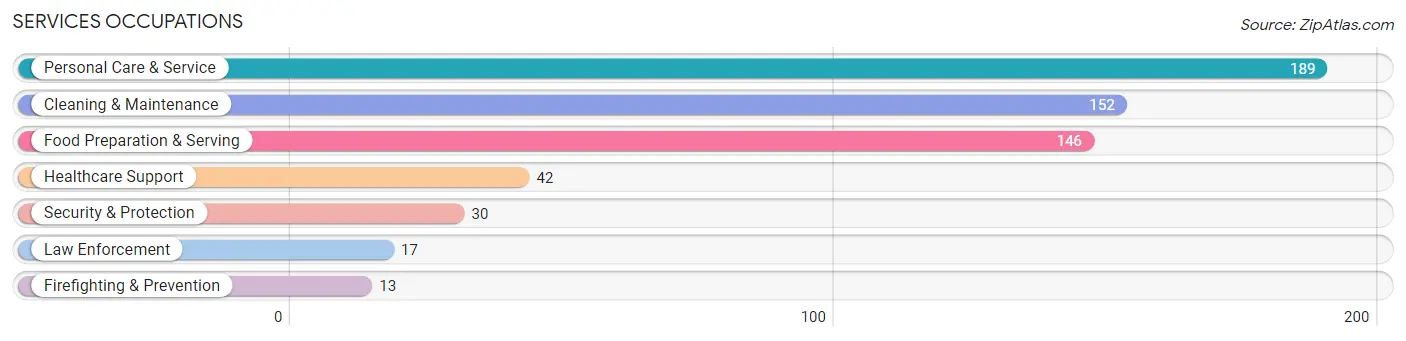
Services Occupations
The most common Services occupations in Watertown are Personal Care & Service (189 | 9.9%), Cleaning & Maintenance (152 | 8.0%), Food Preparation & Serving (146 | 7.6%), Healthcare Support (42 | 2.2%), and Security & Protection (30 | 1.6%).
Services Occupations by Sex
Within the Services occupations in Watertown, the most male-oriented occupations are Security & Protection (100.0%), Firefighting & Prevention (100.0%), and Law Enforcement (100.0%), while the most female-oriented occupations are Healthcare Support (100.0%), Cleaning & Maintenance (39.5%), and Food Preparation & Serving (31.5%).
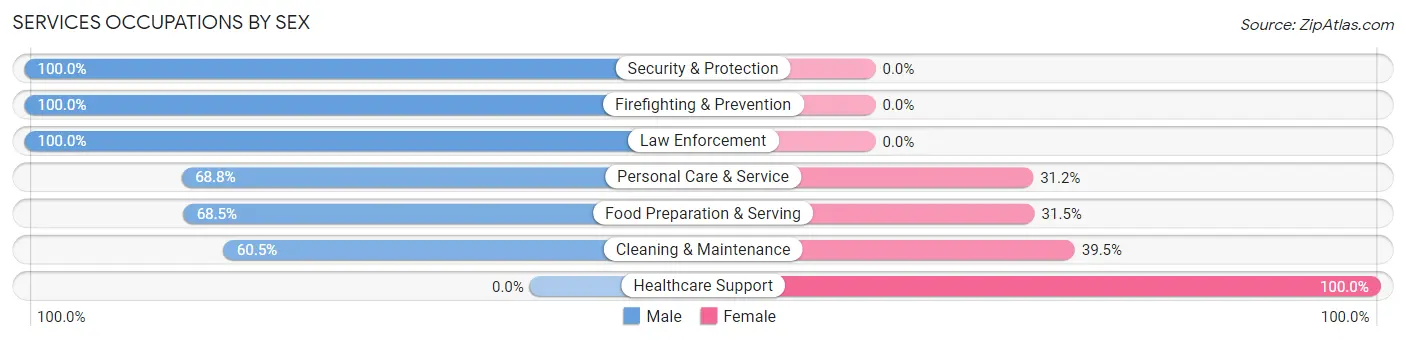
| Occupation | Male | Female |
| Healthcare Support | 0 (0.0%) | 42 (100.0%) |
| Security & Protection | 30 (100.0%) | 0 (0.0%) |
| Firefighting & Prevention | 13 (100.0%) | 0 (0.0%) |
| Law Enforcement | 17 (100.0%) | 0 (0.0%) |
| Food Preparation & Serving | 100 (68.5%) | 46 (31.5%) |
| Cleaning & Maintenance | 92 (60.5%) | 60 (39.5%) |
| Personal Care & Service | 130 (68.8%) | 59 (31.2%) |
| Total (Category) | 352 (63.0%) | 207 (37.0%) |
| Total (Overall) | 999 (52.3%) | 911 (47.7%) |
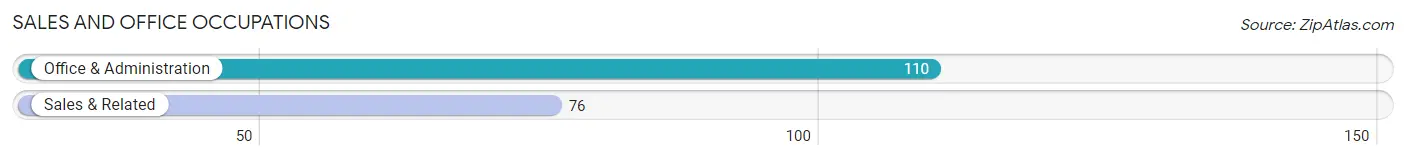
Sales and Office Occupations
The most common Sales and Office occupations in Watertown are Office & Administration (110 | 5.8%), and Sales & Related (76 | 4.0%).
Sales and Office Occupations by Sex
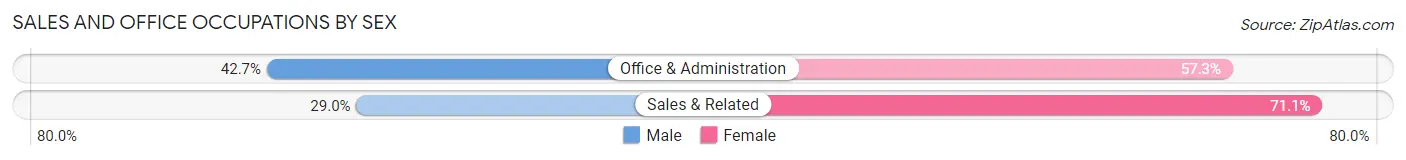
| Occupation | Male | Female |
| Sales & Related | 22 (28.9%) | 54 (71.1%) |
| Office & Administration | 47 (42.7%) | 63 (57.3%) |
| Total (Category) | 69 (37.1%) | 117 (62.9%) |
| Total (Overall) | 999 (52.3%) | 911 (47.7%) |
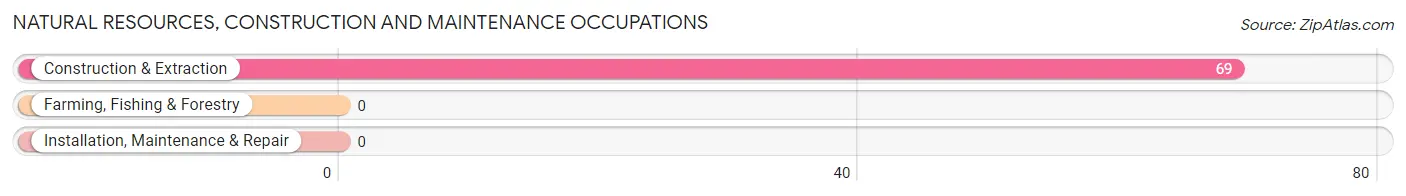
Natural Resources, Construction and Maintenance Occupations
The most common Natural Resources, Construction and Maintenance occupations in Watertown are , and Construction & Extraction (69 | 3.6%).
Natural Resources, Construction and Maintenance Occupations by Sex
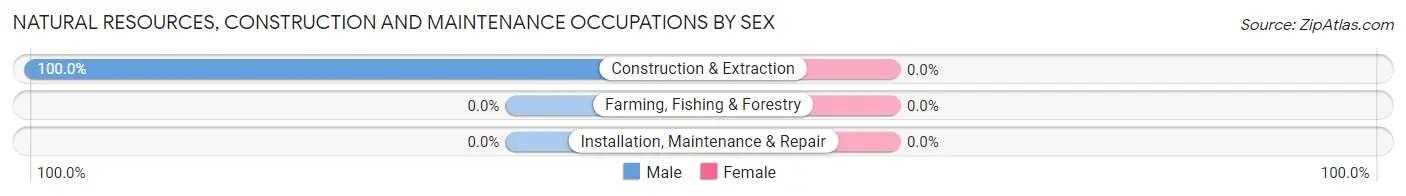
| Occupation | Male | Female |
| Farming, Fishing & Forestry | 0 (0.0%) | 0 (0.0%) |
| Construction & Extraction | 69 (100.0%) | 0 (0.0%) |
| Installation, Maintenance & Repair | 0 (0.0%) | 0 (0.0%) |
| Total (Category) | 69 (100.0%) | 0 (0.0%) |
| Total (Overall) | 999 (52.3%) | 911 (47.7%) |
Production, Transportation and Moving Occupations
The most common Production, Transportation and Moving occupations in Watertown are Material Moving (76 | 4.0%), Transportation (52 | 2.7%), and Production (30 | 1.6%).
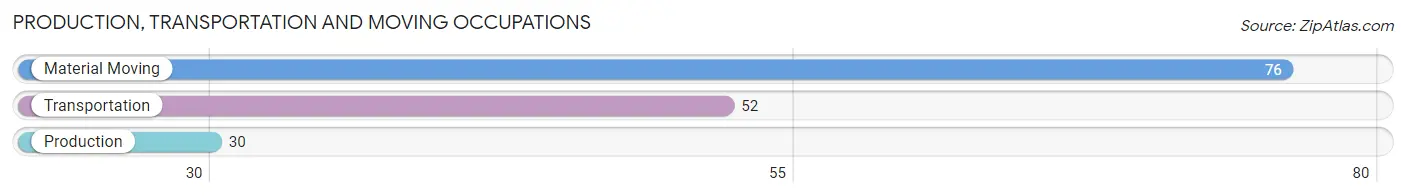
Production, Transportation and Moving Occupations by Sex
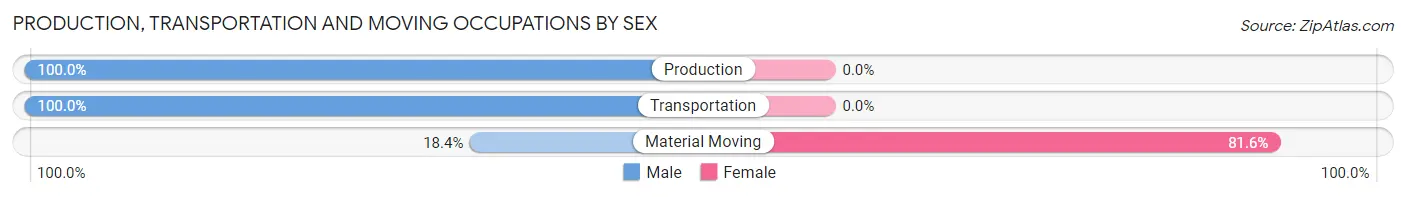
| Occupation | Male | Female |
| Production | 30 (100.0%) | 0 (0.0%) |
| Transportation | 52 (100.0%) | 0 (0.0%) |
| Material Moving | 14 (18.4%) | 62 (81.6%) |
| Total (Category) | 96 (60.8%) | 62 (39.2%) |
| Total (Overall) | 999 (52.3%) | 911 (47.7%) |
Employment Industries by Sex in Watertown
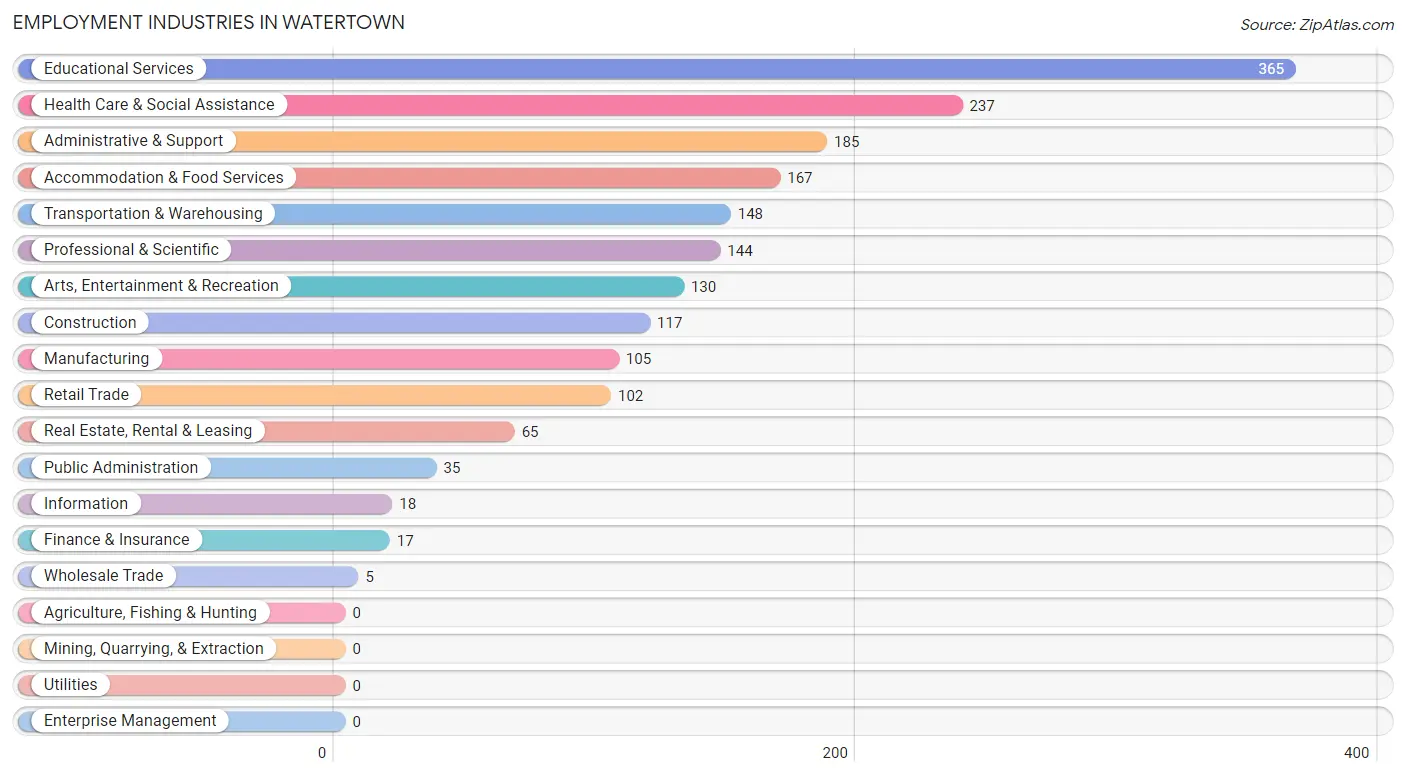
Employment Industries in Watertown
The major employment industries in Watertown include Educational Services (365 | 19.1%), Health Care & Social Assistance (237 | 12.4%), Administrative & Support (185 | 9.7%), Accommodation & Food Services (167 | 8.7%), and Transportation & Warehousing (148 | 7.7%).
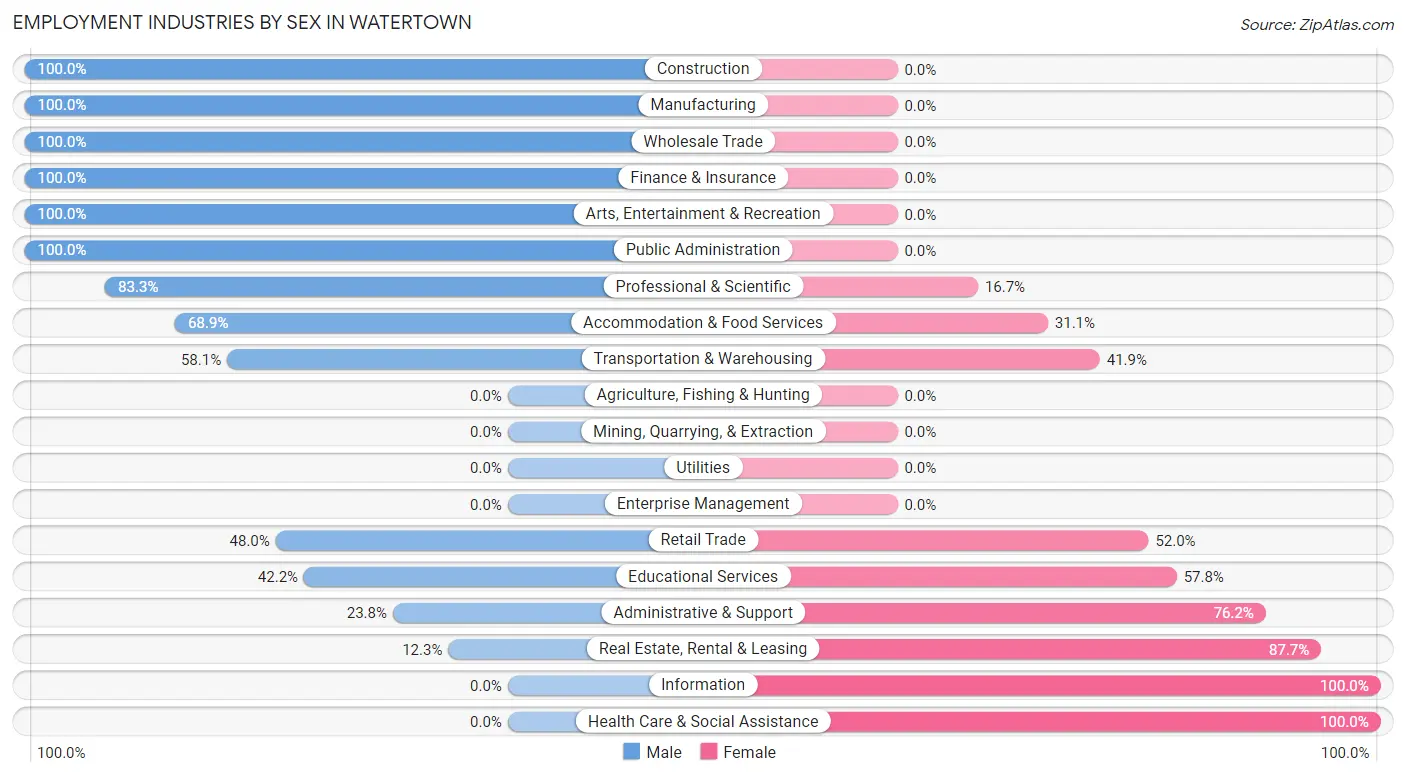
Employment Industries by Sex in Watertown
The Watertown industries that see more men than women are Construction (100.0%), Manufacturing (100.0%), and Wholesale Trade (100.0%), whereas the industries that tend to have a higher number of women are Information (100.0%), Health Care & Social Assistance (100.0%), and Real Estate, Rental & Leasing (87.7%).
| Industry | Male | Female |
| Agriculture, Fishing & Hunting | 0 (0.0%) | 0 (0.0%) |
| Mining, Quarrying, & Extraction | 0 (0.0%) | 0 (0.0%) |
| Construction | 117 (100.0%) | 0 (0.0%) |
| Manufacturing | 105 (100.0%) | 0 (0.0%) |
| Wholesale Trade | 5 (100.0%) | 0 (0.0%) |
| Retail Trade | 49 (48.0%) | 53 (52.0%) |
| Transportation & Warehousing | 86 (58.1%) | 62 (41.9%) |
| Utilities | 0 (0.0%) | 0 (0.0%) |
| Information | 0 (0.0%) | 18 (100.0%) |
| Finance & Insurance | 17 (100.0%) | 0 (0.0%) |
| Real Estate, Rental & Leasing | 8 (12.3%) | 57 (87.7%) |
| Professional & Scientific | 120 (83.3%) | 24 (16.7%) |
| Enterprise Management | 0 (0.0%) | 0 (0.0%) |
| Administrative & Support | 44 (23.8%) | 141 (76.2%) |
| Educational Services | 154 (42.2%) | 211 (57.8%) |
| Health Care & Social Assistance | 0 (0.0%) | 237 (100.0%) |
| Arts, Entertainment & Recreation | 130 (100.0%) | 0 (0.0%) |
| Accommodation & Food Services | 115 (68.9%) | 52 (31.1%) |
| Public Administration | 35 (100.0%) | 0 (0.0%) |
| Total | 999 (52.3%) | 911 (47.7%) |
Education in Watertown
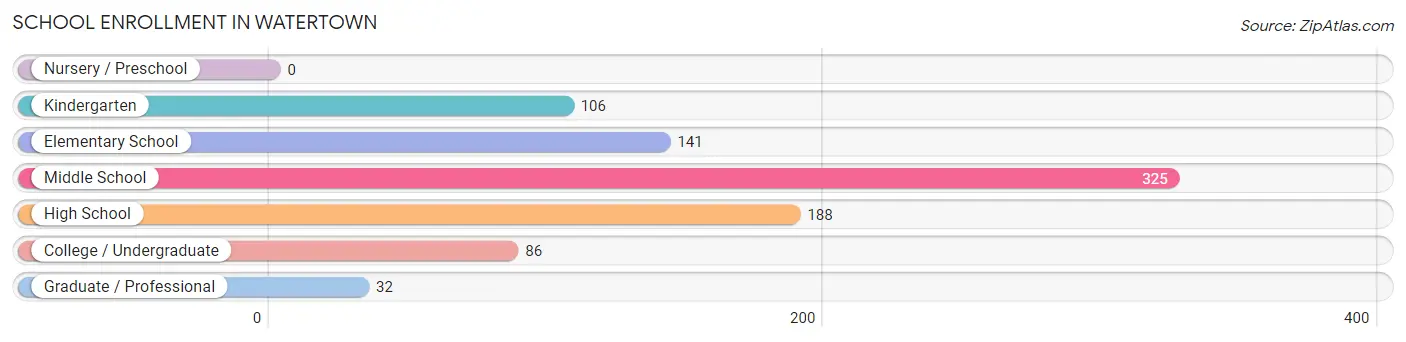
School Enrollment in Watertown
The most common levels of schooling among the 878 students in Watertown are middle school (325 | 37.0%), high school (188 | 21.4%), and elementary school (141 | 16.1%).
| School Level | # Students | % Students |
| Nursery / Preschool | 0 | 0.0% |
| Kindergarten | 106 | 12.1% |
| Elementary School | 141 | 16.1% |
| Middle School | 325 | 37.0% |
| High School | 188 | 21.4% |
| College / Undergraduate | 86 | 9.8% |
| Graduate / Professional | 32 | 3.6% |
| Total | 878 | 100.0% |
School Enrollment by Age by Funding Source in Watertown
Out of a total of 878 students who are enrolled in schools in Watertown, 107 (12.2%) attend a private institution, while the remaining 771 (87.8%) are enrolled in public schools. The age group of 35 years and over has the highest likelihood of being enrolled in private schools, with 25 (52.1% in the age bracket) enrolled. Conversely, the age group of 5 to 9 year old has the lowest likelihood of being enrolled in a private school, with 264 (100.0% in the age bracket) attending a public institution.
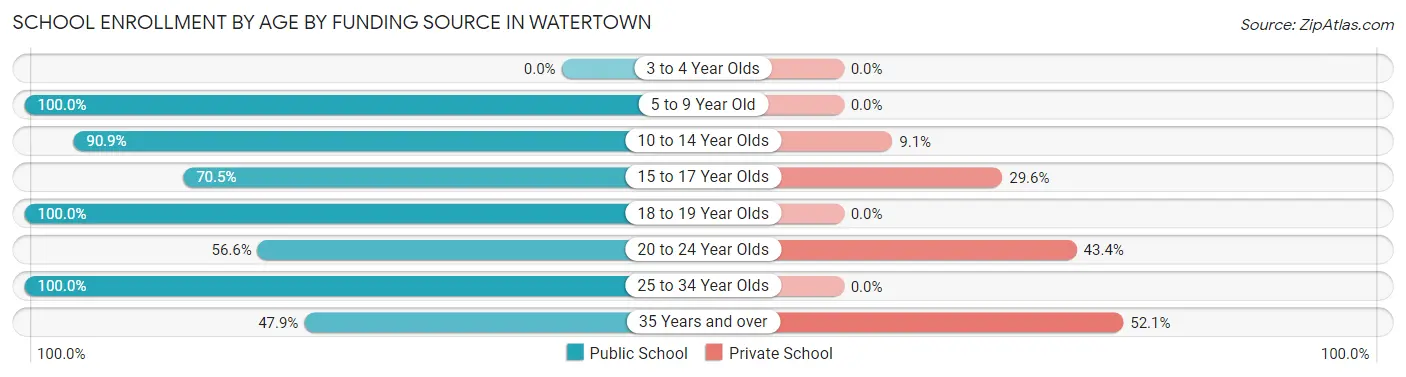
| Age Bracket | Public School | Private School |
| 3 to 4 Year Olds | 0 (0.0%) | 0 (0.0%) |
| 5 to 9 Year Old | 264 (100.0%) | 0 (0.0%) |
| 10 to 14 Year Olds | 331 (90.9%) | 33 (9.1%) |
| 15 to 17 Year Olds | 62 (70.5%) | 26 (29.5%) |
| 18 to 19 Year Olds | 44 (100.0%) | 0 (0.0%) |
| 20 to 24 Year Olds | 30 (56.6%) | 23 (43.4%) |
| 25 to 34 Year Olds | 17 (100.0%) | 0 (0.0%) |
| 35 Years and over | 23 (47.9%) | 25 (52.1%) |
| Total | 771 (87.8%) | 107 (12.2%) |
Educational Attainment by Field of Study in Watertown
Social sciences (214 | 16.2%), business (183 | 13.9%), liberal arts & history (177 | 13.4%), engineering (153 | 11.6%), and education (139 | 10.5%) are the most common fields of study among 1,320 individuals in Watertown who have obtained a bachelor's degree or higher.
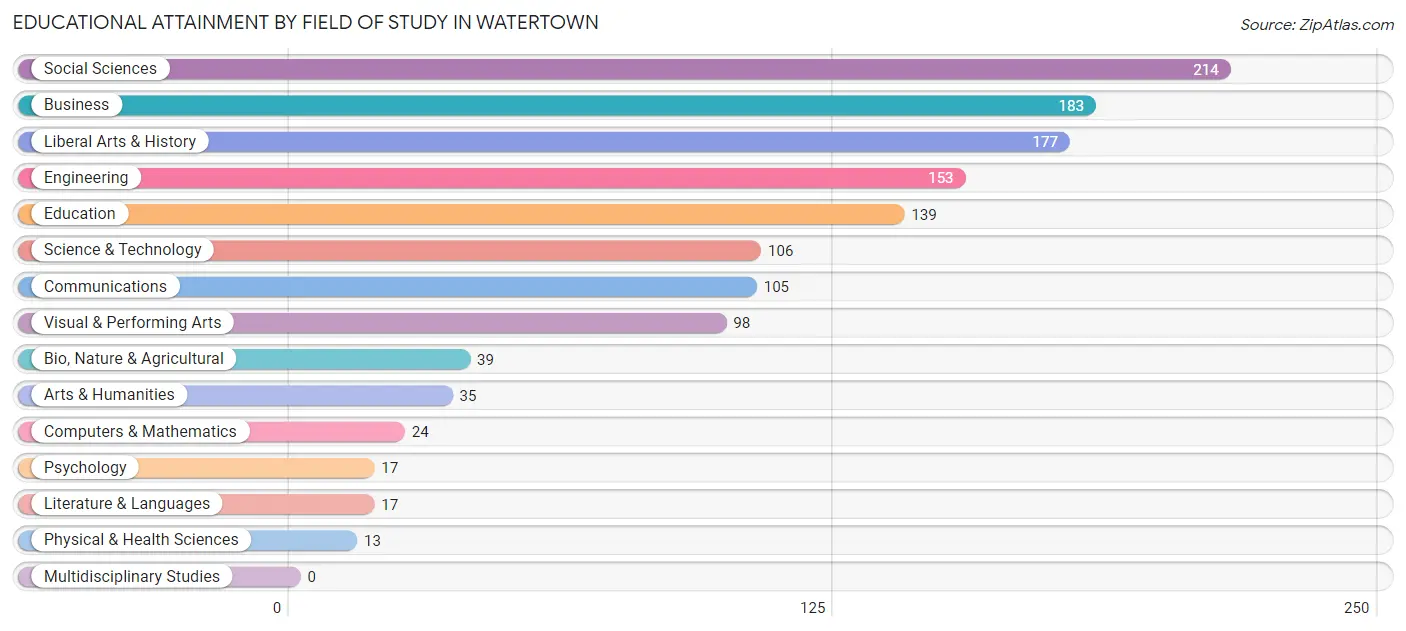
| Field of Study | # Graduates | % Graduates |
| Computers & Mathematics | 24 | 1.8% |
| Bio, Nature & Agricultural | 39 | 2.9% |
| Physical & Health Sciences | 13 | 1.0% |
| Psychology | 17 | 1.3% |
| Social Sciences | 214 | 16.2% |
| Engineering | 153 | 11.6% |
| Multidisciplinary Studies | 0 | 0.0% |
| Science & Technology | 106 | 8.0% |
| Business | 183 | 13.9% |
| Education | 139 | 10.5% |
| Literature & Languages | 17 | 1.3% |
| Liberal Arts & History | 177 | 13.4% |
| Visual & Performing Arts | 98 | 7.4% |
| Communications | 105 | 8.0% |
| Arts & Humanities | 35 | 2.6% |
| Total | 1,320 | 100.0% |
Transportation & Commute in Watertown
Vehicle Availability by Sex in Watertown
The most prevalent vehicle ownership categories in Watertown are males with 2 vehicles (631, accounting for 62.5%) and females with 2 vehicles (353, making up 79.4%).
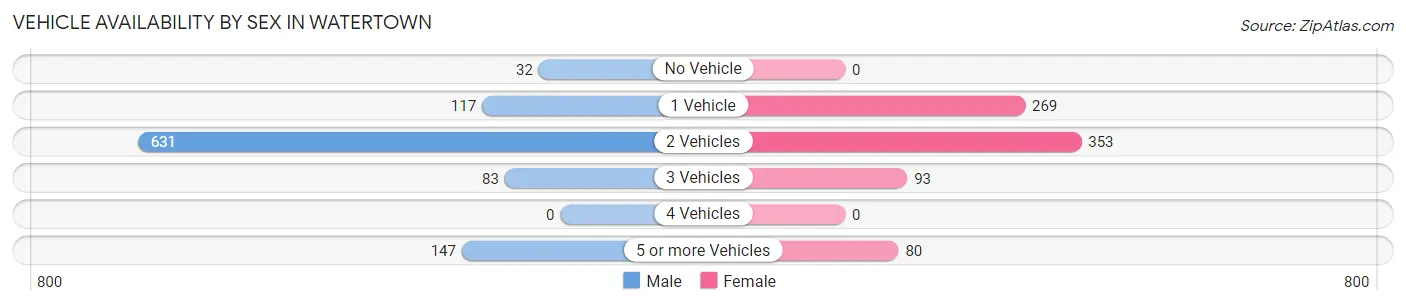
| Vehicles Available | Male | Female |
| No Vehicle | 32 (3.2%) | 0 (0.0%) |
| 1 Vehicle | 117 (11.6%) | 269 (33.8%) |
| 2 Vehicles | 631 (62.5%) | 353 (44.4%) |
| 3 Vehicles | 83 (8.2%) | 93 (11.7%) |
| 4 Vehicles | 0 (0.0%) | 0 (0.0%) |
| 5 or more Vehicles | 147 (14.5%) | 80 (10.1%) |
| Total | 1,010 (100.0%) | 795 (100.0%) |
Commute Time in Watertown
The most frequently occuring commute durations in Watertown are 5 to 9 minutes (389 commuters, 22.7%), 10 to 14 minutes (306 commuters, 17.8%), and 30 to 34 minutes (200 commuters, 11.7%).
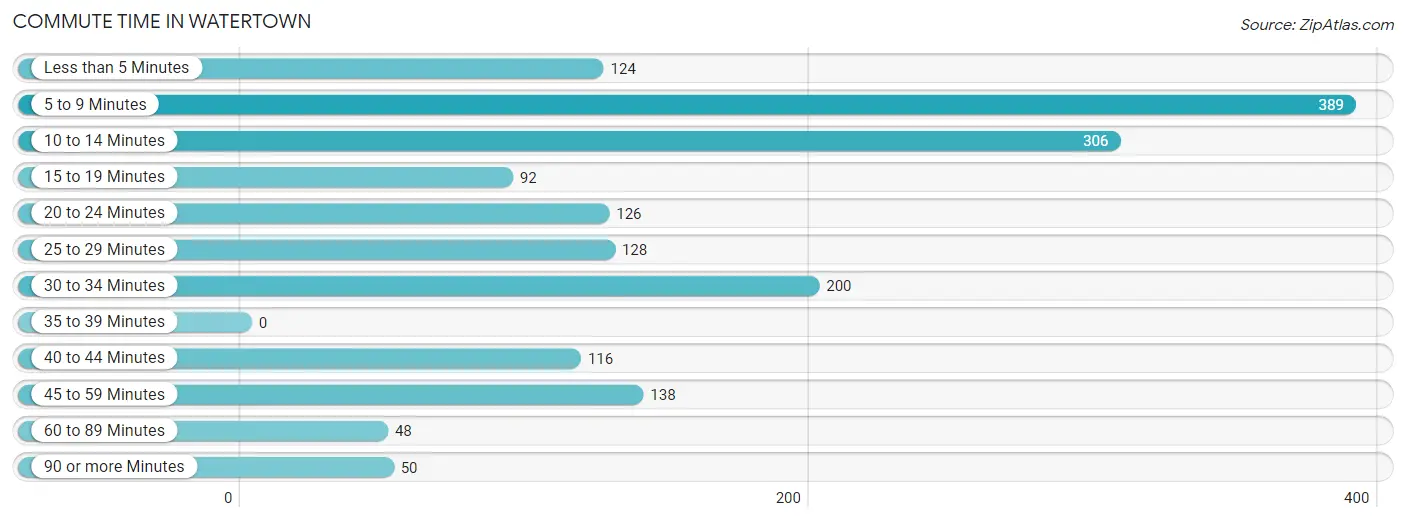
| Commute Time | # Commuters | % Commuters |
| Less than 5 Minutes | 124 | 7.2% |
| 5 to 9 Minutes | 389 | 22.7% |
| 10 to 14 Minutes | 306 | 17.8% |
| 15 to 19 Minutes | 92 | 5.4% |
| 20 to 24 Minutes | 126 | 7.3% |
| 25 to 29 Minutes | 128 | 7.4% |
| 30 to 34 Minutes | 200 | 11.7% |
| 35 to 39 Minutes | 0 | 0.0% |
| 40 to 44 Minutes | 116 | 6.8% |
| 45 to 59 Minutes | 138 | 8.0% |
| 60 to 89 Minutes | 48 | 2.8% |
| 90 or more Minutes | 50 | 2.9% |
Commute Time by Sex in Watertown
The most common commute times in Watertown are 5 to 9 minutes (235 commuters, 26.3%) for males and 10 to 14 minutes (158 commuters, 19.2%) for females.
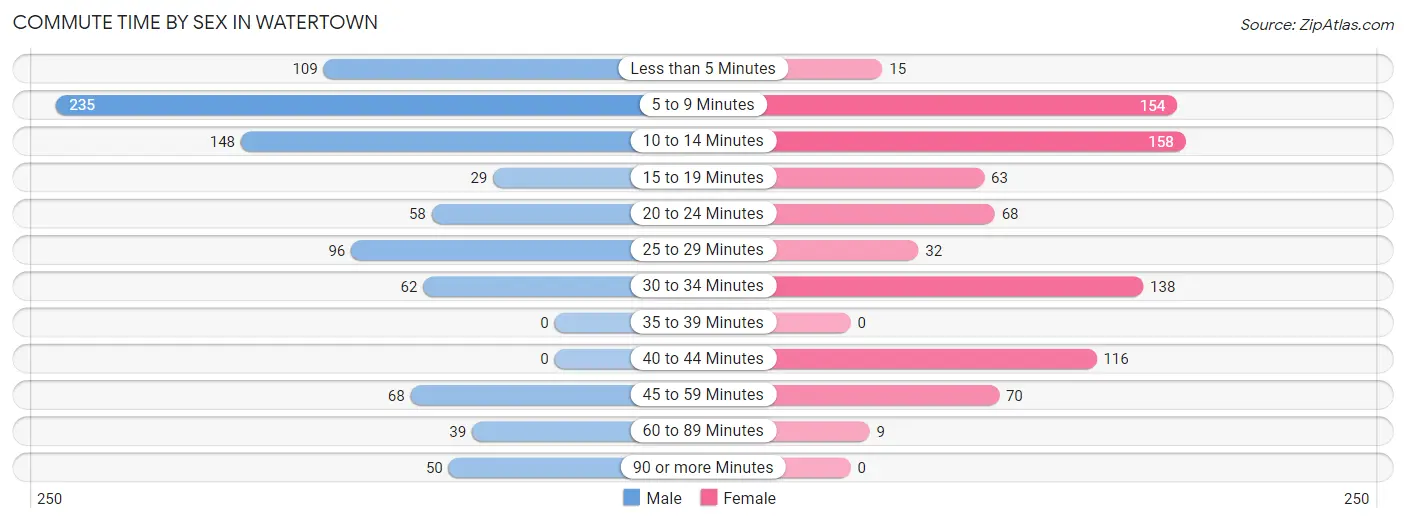
| Commute Time | Male | Female |
| Less than 5 Minutes | 109 (12.2%) | 15 (1.8%) |
| 5 to 9 Minutes | 235 (26.3%) | 154 (18.7%) |
| 10 to 14 Minutes | 148 (16.6%) | 158 (19.2%) |
| 15 to 19 Minutes | 29 (3.2%) | 63 (7.6%) |
| 20 to 24 Minutes | 58 (6.5%) | 68 (8.3%) |
| 25 to 29 Minutes | 96 (10.7%) | 32 (3.9%) |
| 30 to 34 Minutes | 62 (6.9%) | 138 (16.8%) |
| 35 to 39 Minutes | 0 (0.0%) | 0 (0.0%) |
| 40 to 44 Minutes | 0 (0.0%) | 116 (14.1%) |
| 45 to 59 Minutes | 68 (7.6%) | 70 (8.5%) |
| 60 to 89 Minutes | 39 (4.4%) | 9 (1.1%) |
| 90 or more Minutes | 50 (5.6%) | 0 (0.0%) |
Time of Departure to Work by Sex in Watertown
The most frequent times of departure to work in Watertown are 8:00 AM to 8:29 AM (198, 22.2%) for males and 7:30 AM to 7:59 AM (343, 41.7%) for females.
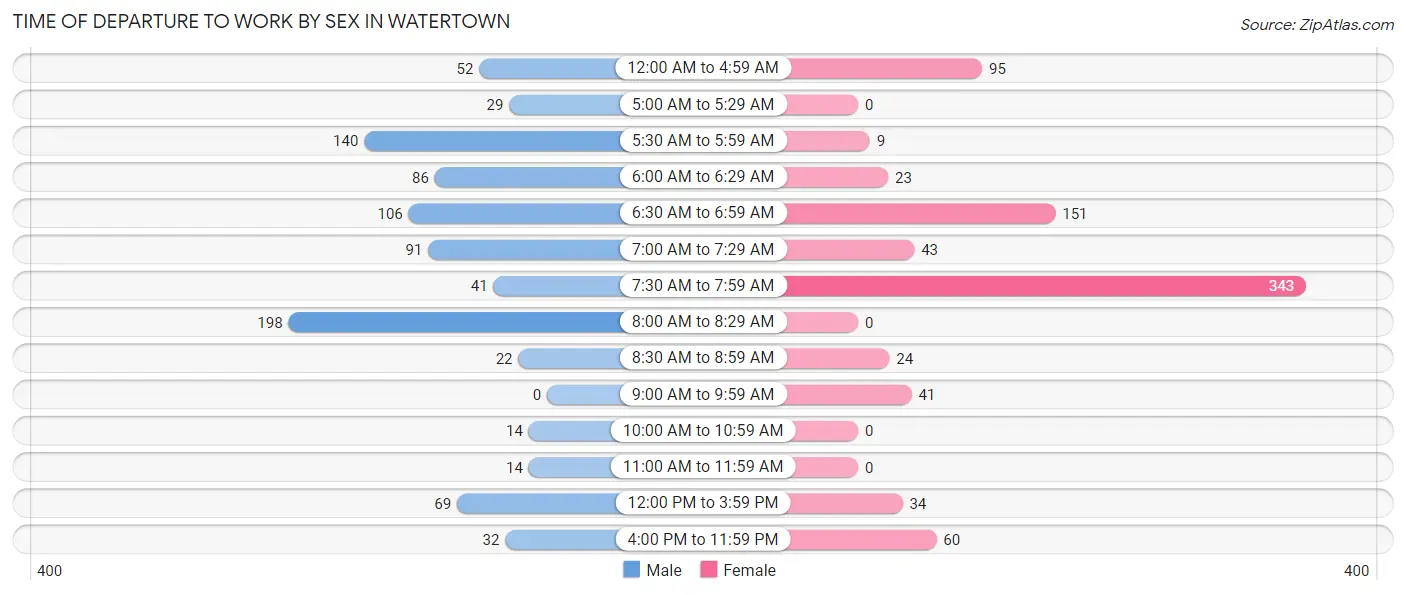
| Time of Departure | Male | Female |
| 12:00 AM to 4:59 AM | 52 (5.8%) | 95 (11.5%) |
| 5:00 AM to 5:29 AM | 29 (3.2%) | 0 (0.0%) |
| 5:30 AM to 5:59 AM | 140 (15.7%) | 9 (1.1%) |
| 6:00 AM to 6:29 AM | 86 (9.6%) | 23 (2.8%) |
| 6:30 AM to 6:59 AM | 106 (11.9%) | 151 (18.3%) |
| 7:00 AM to 7:29 AM | 91 (10.2%) | 43 (5.2%) |
| 7:30 AM to 7:59 AM | 41 (4.6%) | 343 (41.7%) |
| 8:00 AM to 8:29 AM | 198 (22.2%) | 0 (0.0%) |
| 8:30 AM to 8:59 AM | 22 (2.5%) | 24 (2.9%) |
| 9:00 AM to 9:59 AM | 0 (0.0%) | 41 (5.0%) |
| 10:00 AM to 10:59 AM | 14 (1.6%) | 0 (0.0%) |
| 11:00 AM to 11:59 AM | 14 (1.6%) | 0 (0.0%) |
| 12:00 PM to 3:59 PM | 69 (7.7%) | 34 (4.1%) |
| 4:00 PM to 11:59 PM | 32 (3.6%) | 60 (7.3%) |
| Total | 894 (100.0%) | 823 (100.0%) |
Housing Occupancy in Watertown
Occupancy by Ownership in Watertown
Of the total 1,556 dwellings in Watertown, owner-occupied units account for 989 (63.6%), while renter-occupied units make up 567 (36.4%).
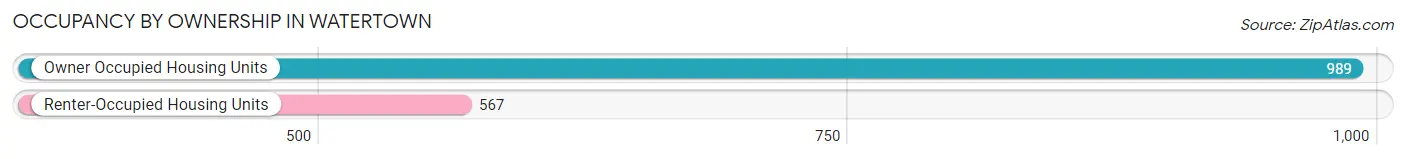
| Occupancy | # Housing Units | % Housing Units |
| Owner Occupied Housing Units | 989 | 63.6% |
| Renter-Occupied Housing Units | 567 | 36.4% |
| Total Occupied Housing Units | 1,556 | 100.0% |
Occupancy by Household Size in Watertown
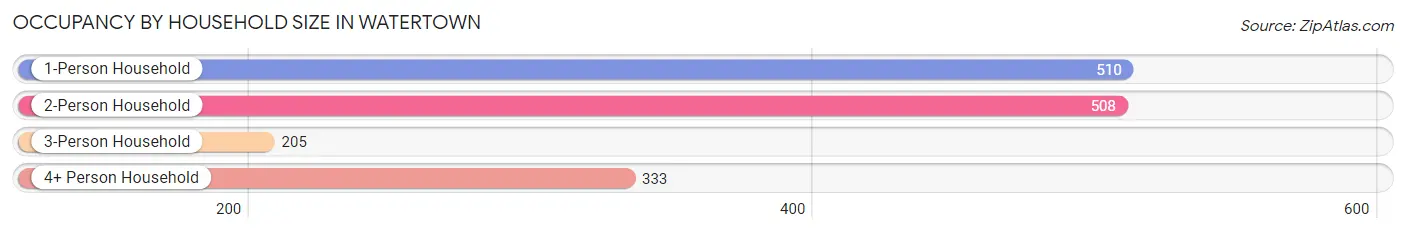
| Household Size | # Housing Units | % Housing Units |
| 1-Person Household | 510 | 32.8% |
| 2-Person Household | 508 | 32.7% |
| 3-Person Household | 205 | 13.2% |
| 4+ Person Household | 333 | 21.4% |
| Total Housing Units | 1,556 | 100.0% |
Occupancy by Ownership by Household Size in Watertown
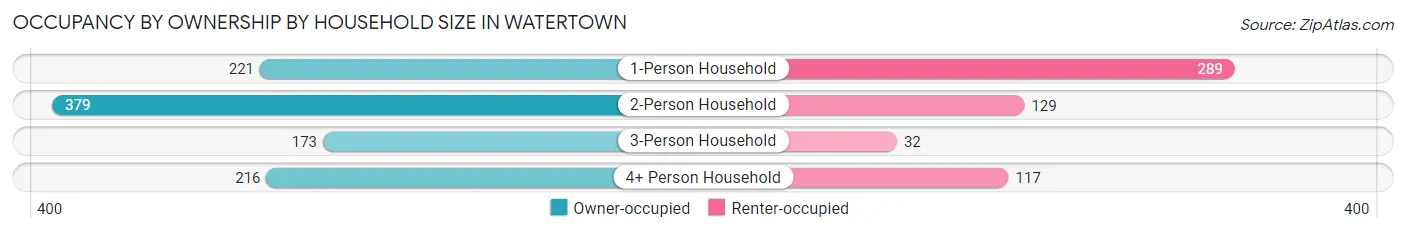
| Household Size | Owner-occupied | Renter-occupied |
| 1-Person Household | 221 (43.3%) | 289 (56.7%) |
| 2-Person Household | 379 (74.6%) | 129 (25.4%) |
| 3-Person Household | 173 (84.4%) | 32 (15.6%) |
| 4+ Person Household | 216 (64.9%) | 117 (35.1%) |
| Total Housing Units | 989 (63.6%) | 567 (36.4%) |
Occupancy by Educational Attainment in Watertown
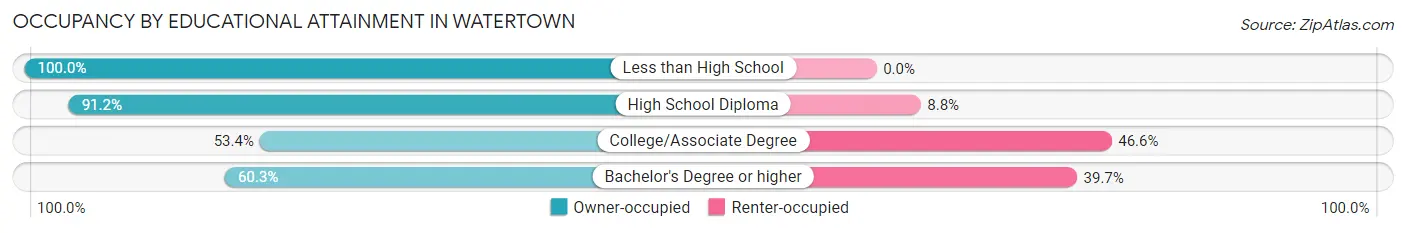
| Household Size | Owner-occupied | Renter-occupied |
| Less than High School | 37 (100.0%) | 0 (0.0%) |
| High School Diploma | 198 (91.2%) | 19 (8.8%) |
| College/Associate Degree | 237 (53.4%) | 207 (46.6%) |
| Bachelor's Degree or higher | 517 (60.3%) | 341 (39.7%) |
Occupancy by Age of Householder in Watertown
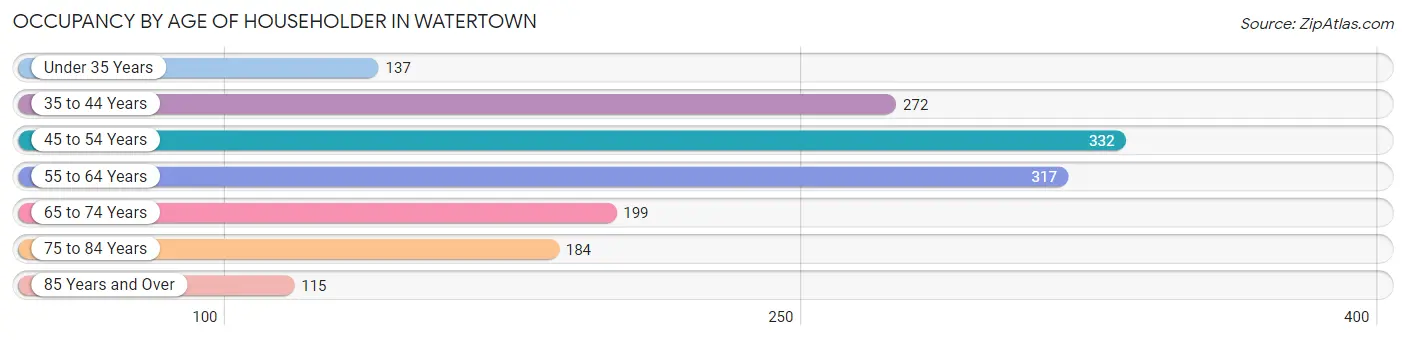
| Age Bracket | # Households | % Households |
| Under 35 Years | 137 | 8.8% |
| 35 to 44 Years | 272 | 17.5% |
| 45 to 54 Years | 332 | 21.3% |
| 55 to 64 Years | 317 | 20.4% |
| 65 to 74 Years | 199 | 12.8% |
| 75 to 84 Years | 184 | 11.8% |
| 85 Years and Over | 115 | 7.4% |
| Total | 1,556 | 100.0% |
Housing Finances in Watertown
Median Income by Occupancy in Watertown
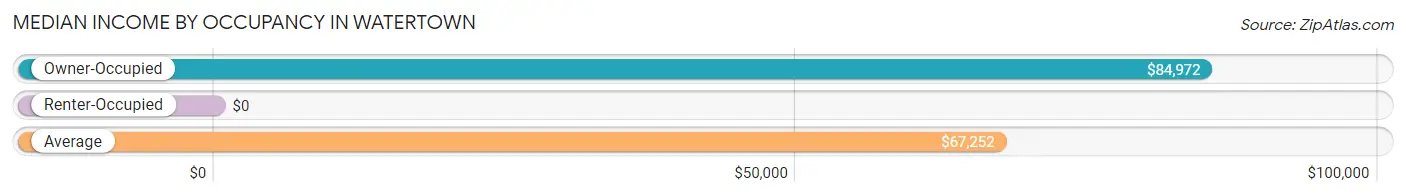
| Occupancy Type | # Households | Median Income |
| Owner-Occupied | 989 (63.6%) | $84,972 |
| Renter-Occupied | 567 (36.4%) | $0 |
| Average | 1,556 (100.0%) | $67,252 |
Occupancy by Householder Income Bracket in Watertown
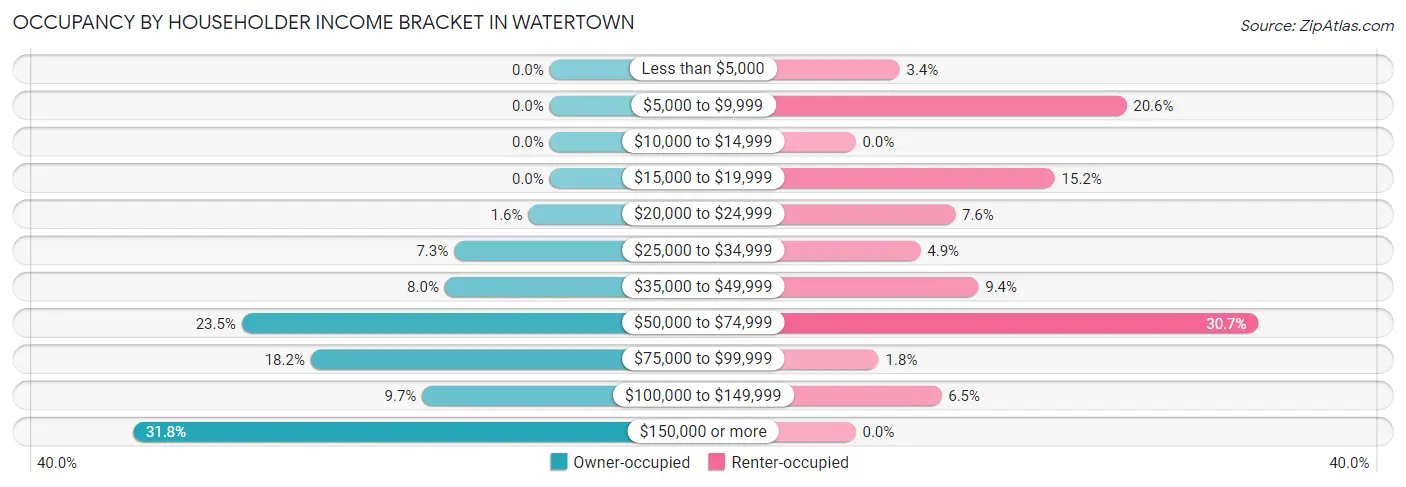
| Income Bracket | Owner-occupied | Renter-occupied |
| Less than $5,000 | 0 (0.0%) | 19 (3.4%) |
| $5,000 to $9,999 | 0 (0.0%) | 117 (20.6%) |
| $10,000 to $14,999 | 0 (0.0%) | 0 (0.0%) |
| $15,000 to $19,999 | 0 (0.0%) | 86 (15.2%) |
| $20,000 to $24,999 | 16 (1.6%) | 43 (7.6%) |
| $25,000 to $34,999 | 72 (7.3%) | 28 (4.9%) |
| $35,000 to $49,999 | 79 (8.0%) | 53 (9.3%) |
| $50,000 to $74,999 | 232 (23.5%) | 174 (30.7%) |
| $75,000 to $99,999 | 180 (18.2%) | 10 (1.8%) |
| $100,000 to $149,999 | 96 (9.7%) | 37 (6.5%) |
| $150,000 or more | 314 (31.8%) | 0 (0.0%) |
| Total | 989 (100.0%) | 567 (100.0%) |
Monthly Housing Cost Tiers in Watertown
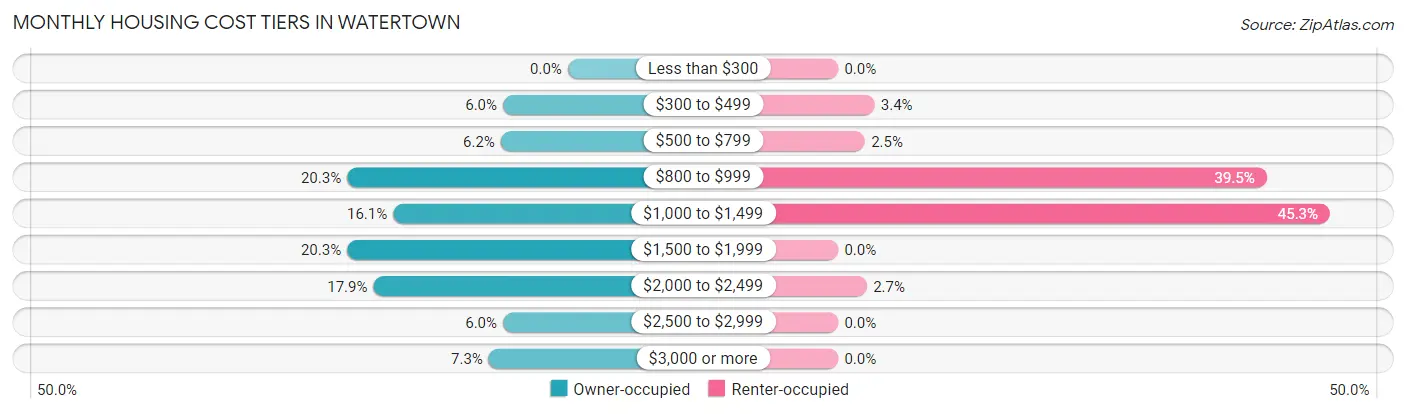
| Monthly Cost | Owner-occupied | Renter-occupied |
| Less than $300 | 0 (0.0%) | 0 (0.0%) |
| $300 to $499 | 59 (6.0%) | 19 (3.4%) |
| $500 to $799 | 61 (6.2%) | 14 (2.5%) |
| $800 to $999 | 201 (20.3%) | 224 (39.5%) |
| $1,000 to $1,499 | 159 (16.1%) | 257 (45.3%) |
| $1,500 to $1,999 | 201 (20.3%) | 0 (0.0%) |
| $2,000 to $2,499 | 177 (17.9%) | 15 (2.6%) |
| $2,500 to $2,999 | 59 (6.0%) | 0 (0.0%) |
| $3,000 or more | 72 (7.3%) | 0 (0.0%) |
| Total | 989 (100.0%) | 567 (100.0%) |
Physical Housing Characteristics in Watertown
Housing Structures in Watertown
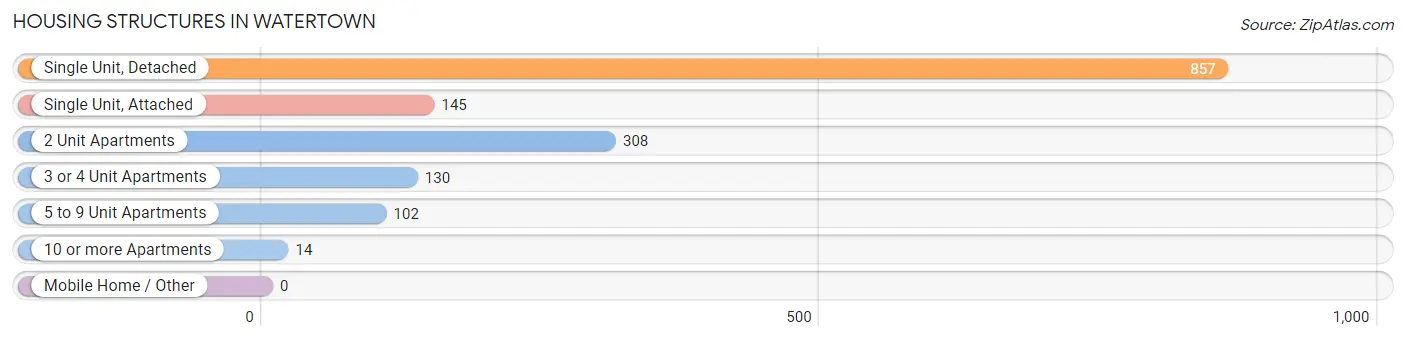
| Structure Type | # Housing Units | % Housing Units |
| Single Unit, Detached | 857 | 55.1% |
| Single Unit, Attached | 145 | 9.3% |
| 2 Unit Apartments | 308 | 19.8% |
| 3 or 4 Unit Apartments | 130 | 8.4% |
| 5 to 9 Unit Apartments | 102 | 6.6% |
| 10 or more Apartments | 14 | 0.9% |
| Mobile Home / Other | 0 | 0.0% |
| Total | 1,556 | 100.0% |
Housing Structures by Occupancy in Watertown
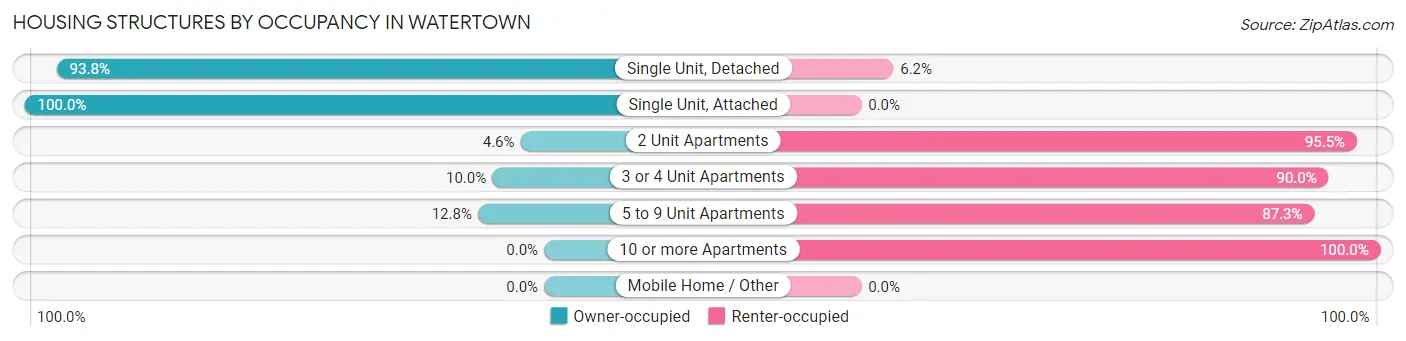
| Structure Type | Owner-occupied | Renter-occupied |
| Single Unit, Detached | 804 (93.8%) | 53 (6.2%) |
| Single Unit, Attached | 145 (100.0%) | 0 (0.0%) |
| 2 Unit Apartments | 14 (4.5%) | 294 (95.5%) |
| 3 or 4 Unit Apartments | 13 (10.0%) | 117 (90.0%) |
| 5 to 9 Unit Apartments | 13 (12.8%) | 89 (87.3%) |
| 10 or more Apartments | 0 (0.0%) | 14 (100.0%) |
| Mobile Home / Other | 0 (0.0%) | 0 (0.0%) |
| Total | 989 (63.6%) | 567 (36.4%) |
Housing Structures by Number of Rooms in Watertown
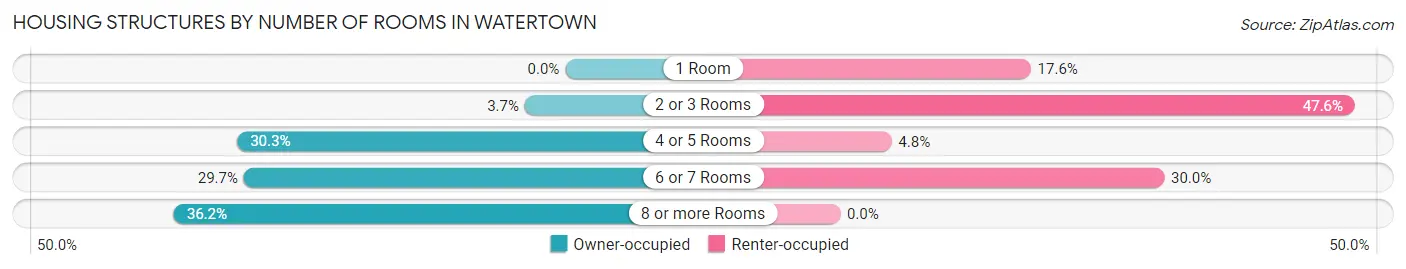
| Number of Rooms | Owner-occupied | Renter-occupied |
| 1 Room | 0 (0.0%) | 100 (17.6%) |
| 2 or 3 Rooms | 37 (3.7%) | 270 (47.6%) |
| 4 or 5 Rooms | 300 (30.3%) | 27 (4.8%) |
| 6 or 7 Rooms | 294 (29.7%) | 170 (30.0%) |
| 8 or more Rooms | 358 (36.2%) | 0 (0.0%) |
| Total | 989 (100.0%) | 567 (100.0%) |
Housing Structure by Heating Type in Watertown
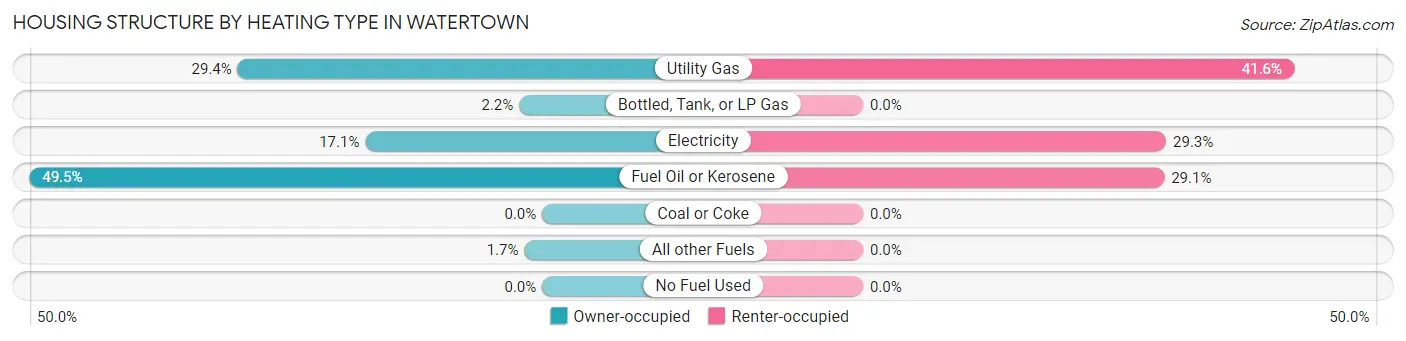
| Heating Type | Owner-occupied | Renter-occupied |
| Utility Gas | 291 (29.4%) | 236 (41.6%) |
| Bottled, Tank, or LP Gas | 22 (2.2%) | 0 (0.0%) |
| Electricity | 169 (17.1%) | 166 (29.3%) |
| Fuel Oil or Kerosene | 490 (49.5%) | 165 (29.1%) |
| Coal or Coke | 0 (0.0%) | 0 (0.0%) |
| All other Fuels | 17 (1.7%) | 0 (0.0%) |
| No Fuel Used | 0 (0.0%) | 0 (0.0%) |
| Total | 989 (100.0%) | 567 (100.0%) |
Household Vehicle Usage in Watertown
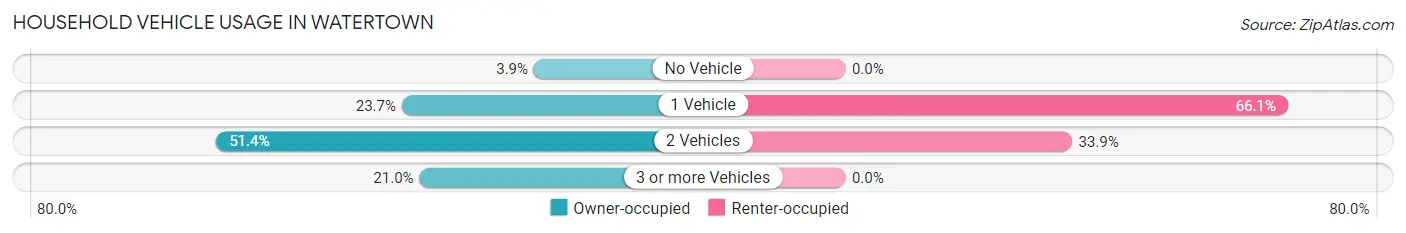
| Vehicles per Household | Owner-occupied | Renter-occupied |
| No Vehicle | 39 (3.9%) | 0 (0.0%) |
| 1 Vehicle | 234 (23.7%) | 375 (66.1%) |
| 2 Vehicles | 508 (51.4%) | 192 (33.9%) |
| 3 or more Vehicles | 208 (21.0%) | 0 (0.0%) |
| Total | 989 (100.0%) | 567 (100.0%) |
Real Estate & Mortgages in Watertown
Real Estate and Mortgage Overview in Watertown
| Characteristic | Without Mortgage | With Mortgage |
| Housing Units | 428 | 561 |
| Median Property Value | $227,400 | $281,800 |
| Median Household Income | $68,833 | $228 |
| Monthly Housing Costs | $881 | $72 |
| Real Estate Taxes | $4,475 | $0 |
Property Value by Mortgage Status in Watertown
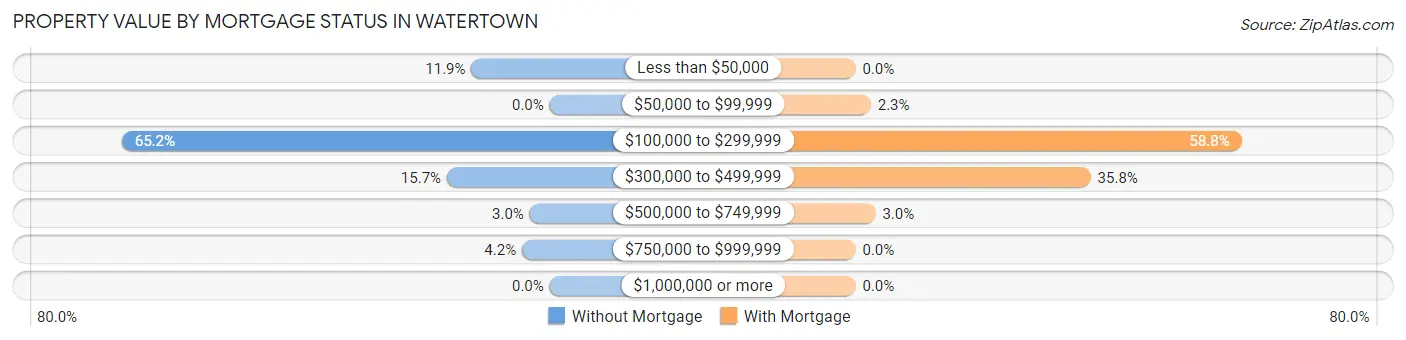
| Property Value | Without Mortgage | With Mortgage |
| Less than $50,000 | 51 (11.9%) | 0 (0.0%) |
| $50,000 to $99,999 | 0 (0.0%) | 13 (2.3%) |
| $100,000 to $299,999 | 279 (65.2%) | 330 (58.8%) |
| $300,000 to $499,999 | 67 (15.7%) | 201 (35.8%) |
| $500,000 to $749,999 | 13 (3.0%) | 17 (3.0%) |
| $750,000 to $999,999 | 18 (4.2%) | 0 (0.0%) |
| $1,000,000 or more | 0 (0.0%) | 0 (0.0%) |
| Total | 428 (100.0%) | 561 (100.0%) |
Household Income by Mortgage Status in Watertown
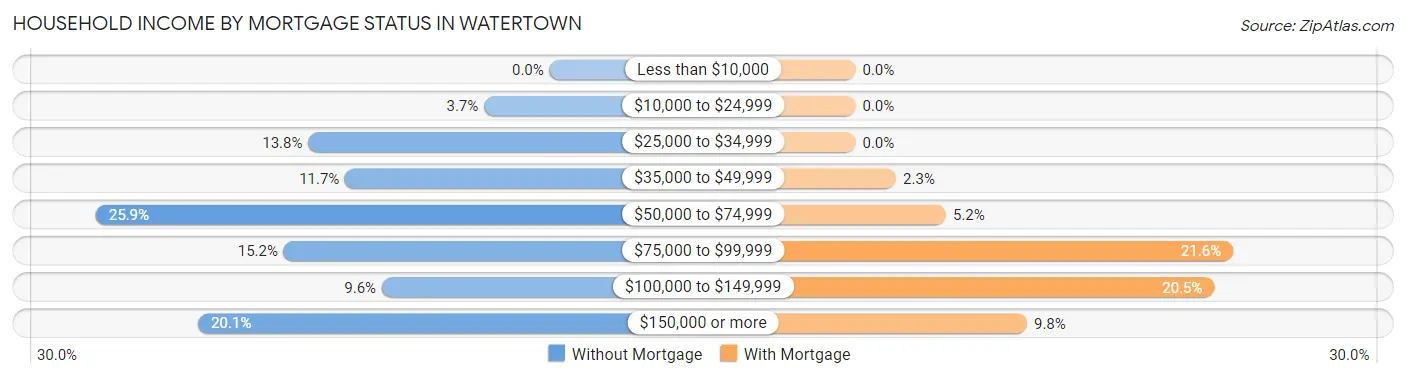
| Household Income | Without Mortgage | With Mortgage |
| Less than $10,000 | 0 (0.0%) | 0 (0.0%) |
| $10,000 to $24,999 | 16 (3.7%) | 0 (0.0%) |
| $25,000 to $34,999 | 59 (13.8%) | 0 (0.0%) |
| $35,000 to $49,999 | 50 (11.7%) | 13 (2.3%) |
| $50,000 to $74,999 | 111 (25.9%) | 29 (5.2%) |
| $75,000 to $99,999 | 65 (15.2%) | 121 (21.6%) |
| $100,000 to $149,999 | 41 (9.6%) | 115 (20.5%) |
| $150,000 or more | 86 (20.1%) | 55 (9.8%) |
| Total | 428 (100.0%) | 561 (100.0%) |
Property Value to Household Income Ratio in Watertown
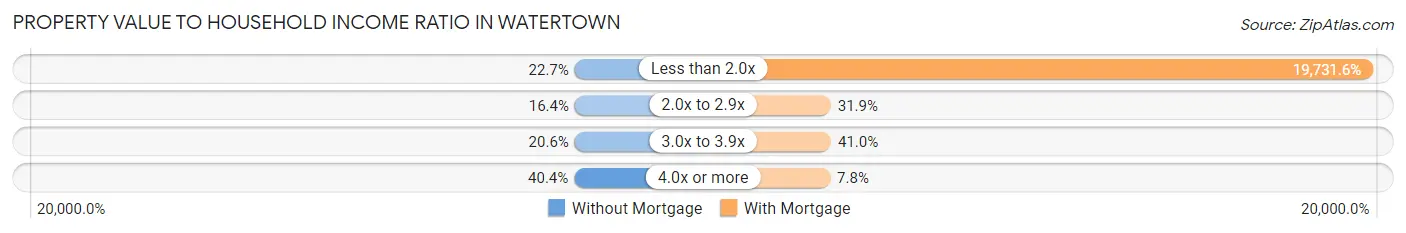
| Value-to-Income Ratio | Without Mortgage | With Mortgage |
| Less than 2.0x | 97 (22.7%) | 110,694 (19,731.5%) |
| 2.0x to 2.9x | 70 (16.4%) | 179 (31.9%) |
| 3.0x to 3.9x | 88 (20.6%) | 230 (41.0%) |
| 4.0x or more | 173 (40.4%) | 44 (7.8%) |
| Total | 428 (100.0%) | 561 (100.0%) |
Real Estate Taxes by Mortgage Status in Watertown
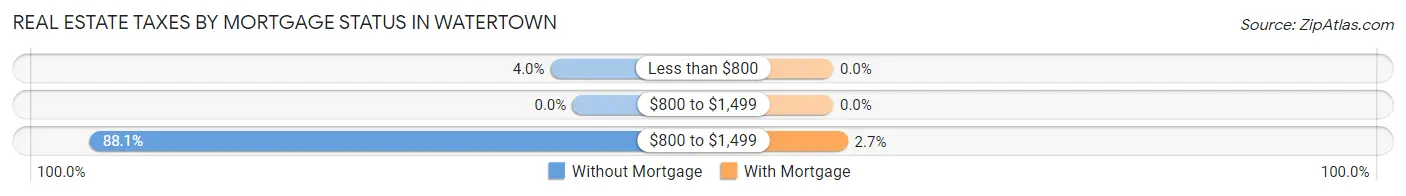
| Property Taxes | Without Mortgage | With Mortgage |
| Less than $800 | 17 (4.0%) | 0 (0.0%) |
| $800 to $1,499 | 0 (0.0%) | 0 (0.0%) |
| $800 to $1,499 | 377 (88.1%) | 15 (2.7%) |
| Total | 428 (100.0%) | 561 (100.0%) |
Health & Disability in Watertown
Health Insurance Coverage by Age in Watertown
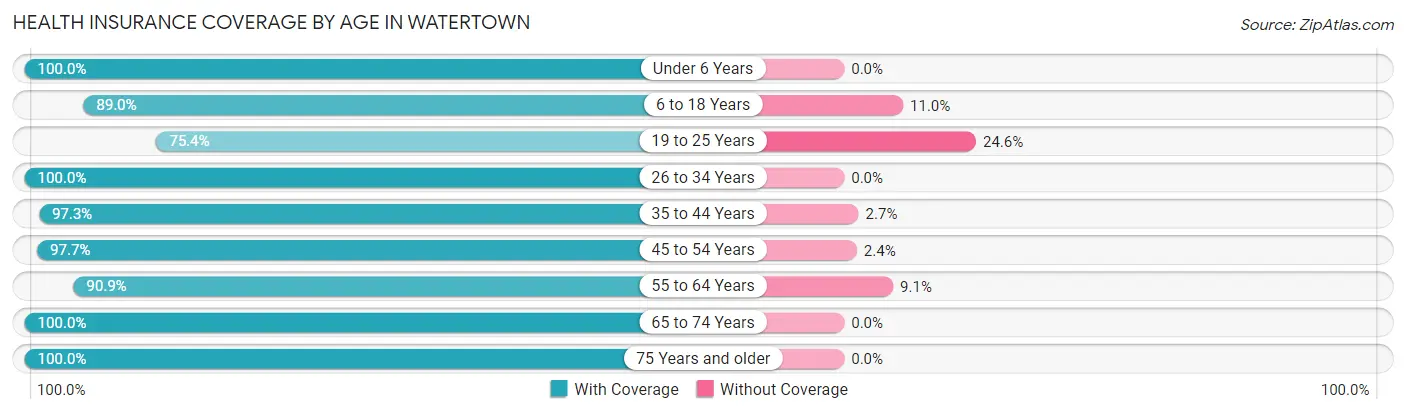
| Age Bracket | With Coverage | Without Coverage |
| Under 6 Years | 207 (100.0%) | 0 (0.0%) |
| 6 to 18 Years | 633 (89.0%) | 78 (11.0%) |
| 19 to 25 Years | 132 (75.4%) | 43 (24.6%) |
| 26 to 34 Years | 235 (100.0%) | 0 (0.0%) |
| 35 to 44 Years | 582 (97.3%) | 16 (2.7%) |
| 45 to 54 Years | 583 (97.7%) | 14 (2.4%) |
| 55 to 64 Years | 489 (90.9%) | 49 (9.1%) |
| 65 to 74 Years | 351 (100.0%) | 0 (0.0%) |
| 75 Years and older | 342 (100.0%) | 0 (0.0%) |
| Total | 3,554 (94.7%) | 200 (5.3%) |
Health Insurance Coverage by Citizenship Status in Watertown
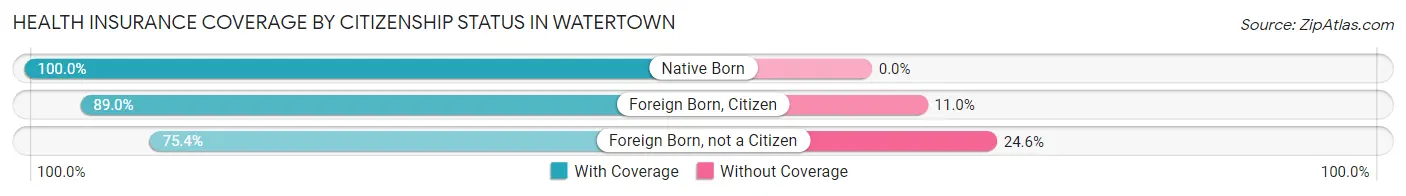
| Citizenship Status | With Coverage | Without Coverage |
| Native Born | 207 (100.0%) | 0 (0.0%) |
| Foreign Born, Citizen | 633 (89.0%) | 78 (11.0%) |
| Foreign Born, not a Citizen | 132 (75.4%) | 43 (24.6%) |
Health Insurance Coverage by Household Income in Watertown
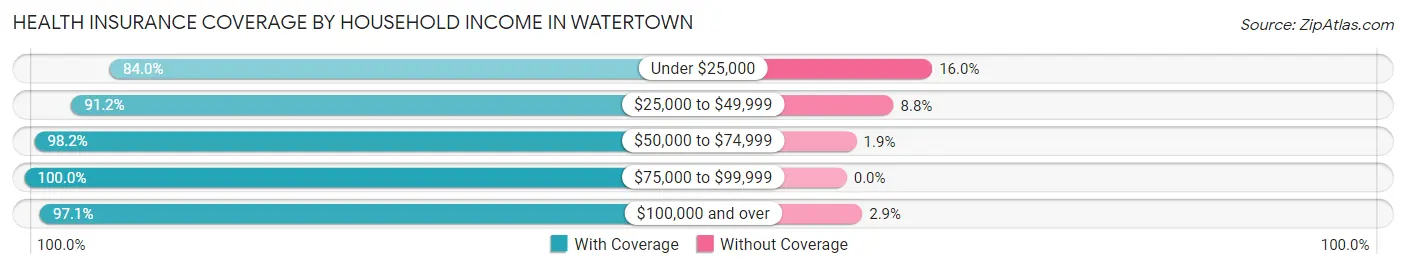
| Household Income | With Coverage | Without Coverage |
| Under $25,000 | 635 (84.0%) | 121 (16.0%) |
| $25,000 to $49,999 | 312 (91.2%) | 30 (8.8%) |
| $50,000 to $74,999 | 635 (98.2%) | 12 (1.8%) |
| $75,000 to $99,999 | 634 (100.0%) | 0 (0.0%) |
| $100,000 and over | 1,239 (97.1%) | 37 (2.9%) |
Public vs Private Health Insurance Coverage by Age in Watertown
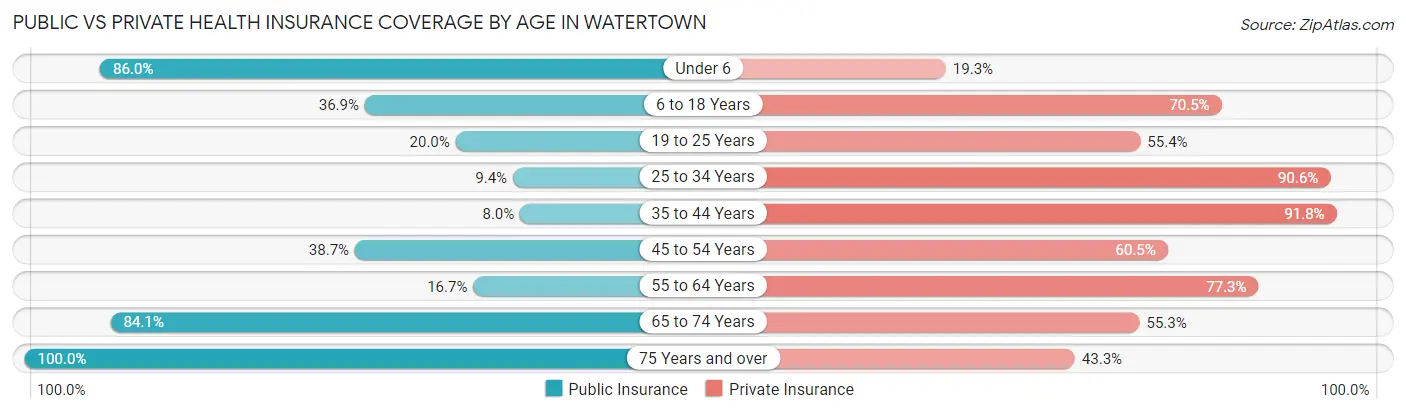
| Age Bracket | Public Insurance | Private Insurance |
| Under 6 | 178 (86.0%) | 40 (19.3%) |
| 6 to 18 Years | 262 (36.8%) | 501 (70.5%) |
| 19 to 25 Years | 35 (20.0%) | 97 (55.4%) |
| 25 to 34 Years | 22 (9.4%) | 213 (90.6%) |
| 35 to 44 Years | 48 (8.0%) | 549 (91.8%) |
| 45 to 54 Years | 231 (38.7%) | 361 (60.5%) |
| 55 to 64 Years | 90 (16.7%) | 416 (77.3%) |
| 65 to 74 Years | 295 (84.1%) | 194 (55.3%) |
| 75 Years and over | 342 (100.0%) | 148 (43.3%) |
| Total | 1,503 (40.0%) | 2,519 (67.1%) |
Disability Status by Sex by Age in Watertown
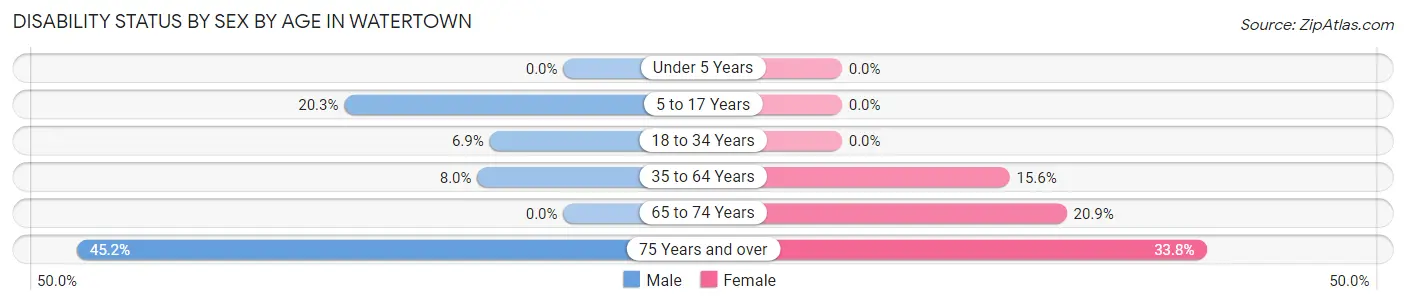
| Age Bracket | Male | Female |
| Under 5 Years | 0 (0.0%) | 0 (0.0%) |
| 5 to 17 Years | 85 (20.3%) | 0 (0.0%) |
| 18 to 34 Years | 17 (6.9%) | 0 (0.0%) |
| 35 to 64 Years | 63 (8.0%) | 147 (15.6%) |
| 65 to 74 Years | 0 (0.0%) | 34 (20.9%) |
| 75 Years and over | 93 (45.2%) | 46 (33.8%) |
Disability Class by Sex by Age in Watertown
Disability Class: Hearing Difficulty
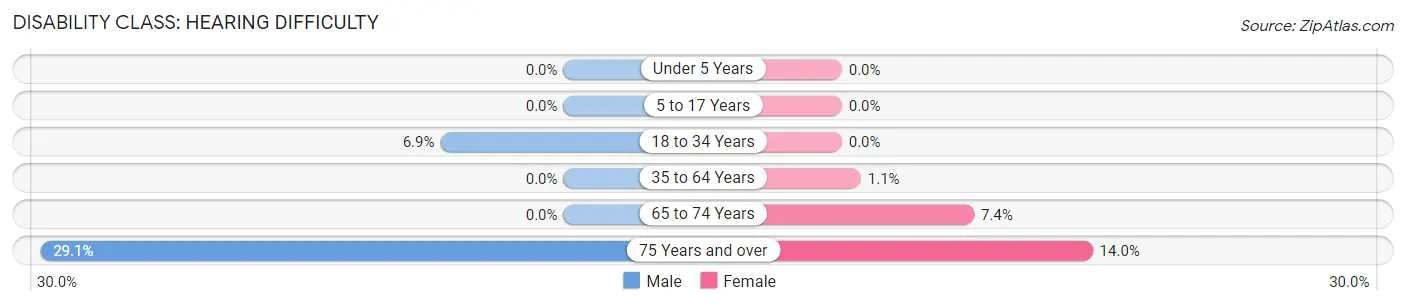
| Age Bracket | Male | Female |
| Under 5 Years | 0 (0.0%) | 0 (0.0%) |
| 5 to 17 Years | 0 (0.0%) | 0 (0.0%) |
| 18 to 34 Years | 17 (6.9%) | 0 (0.0%) |
| 35 to 64 Years | 0 (0.0%) | 10 (1.1%) |
| 65 to 74 Years | 0 (0.0%) | 12 (7.4%) |
| 75 Years and over | 60 (29.1%) | 19 (14.0%) |
Disability Class: Vision Difficulty
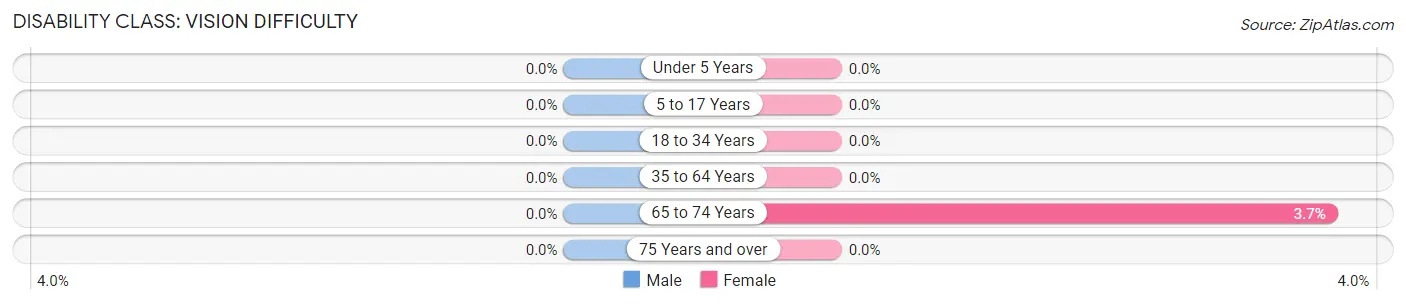
| Age Bracket | Male | Female |
| Under 5 Years | 0 (0.0%) | 0 (0.0%) |
| 5 to 17 Years | 0 (0.0%) | 0 (0.0%) |
| 18 to 34 Years | 0 (0.0%) | 0 (0.0%) |
| 35 to 64 Years | 0 (0.0%) | 0 (0.0%) |
| 65 to 74 Years | 0 (0.0%) | 6 (3.7%) |
| 75 Years and over | 0 (0.0%) | 0 (0.0%) |
Disability Class: Cognitive Difficulty
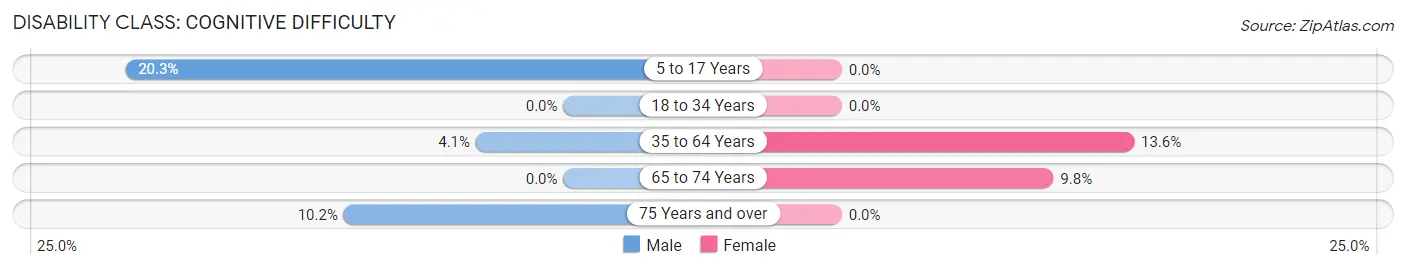
| Age Bracket | Male | Female |
| 5 to 17 Years | 85 (20.3%) | 0 (0.0%) |
| 18 to 34 Years | 0 (0.0%) | 0 (0.0%) |
| 35 to 64 Years | 32 (4.1%) | 128 (13.6%) |
| 65 to 74 Years | 0 (0.0%) | 16 (9.8%) |
| 75 Years and over | 21 (10.2%) | 0 (0.0%) |
Disability Class: Ambulatory Difficulty
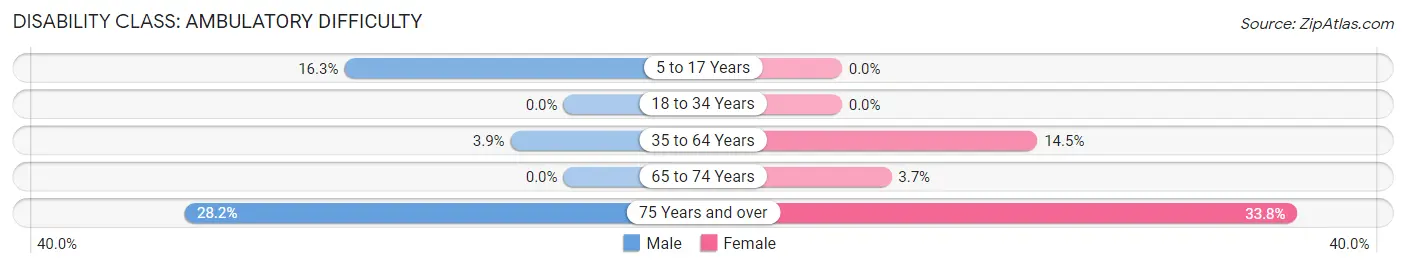
| Age Bracket | Male | Female |
| 5 to 17 Years | 68 (16.3%) | 0 (0.0%) |
| 18 to 34 Years | 0 (0.0%) | 0 (0.0%) |
| 35 to 64 Years | 31 (3.9%) | 137 (14.5%) |
| 65 to 74 Years | 0 (0.0%) | 6 (3.7%) |
| 75 Years and over | 58 (28.2%) | 46 (33.8%) |
Disability Class: Self-Care Difficulty
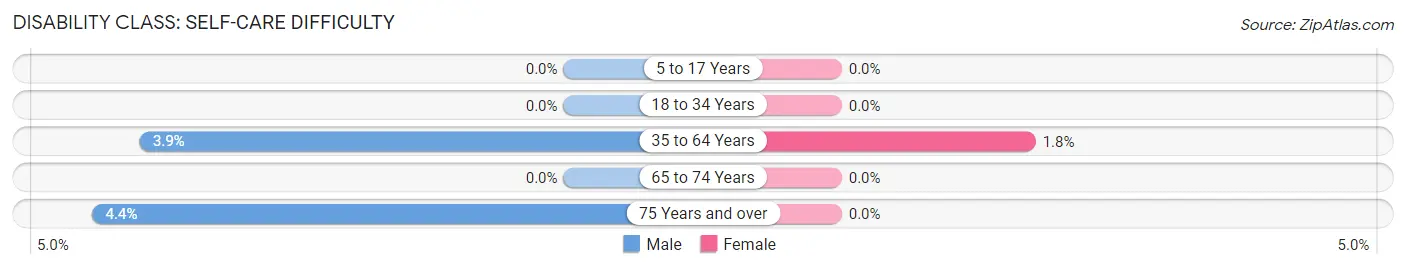
| Age Bracket | Male | Female |
| 5 to 17 Years | 0 (0.0%) | 0 (0.0%) |
| 18 to 34 Years | 0 (0.0%) | 0 (0.0%) |
| 35 to 64 Years | 31 (3.9%) | 17 (1.8%) |
| 65 to 74 Years | 0 (0.0%) | 0 (0.0%) |
| 75 Years and over | 9 (4.4%) | 0 (0.0%) |
Technology Access in Watertown
Computing Device Access in Watertown
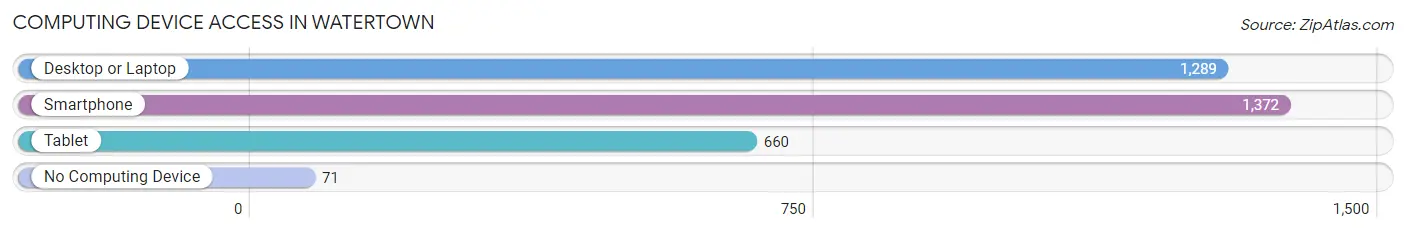
| Device Type | # Households | % Households |
| Desktop or Laptop | 1,289 | 82.8% |
| Smartphone | 1,372 | 88.2% |
| Tablet | 660 | 42.4% |
| No Computing Device | 71 | 4.6% |
| Total | 1,556 | 100.0% |
Internet Access in Watertown
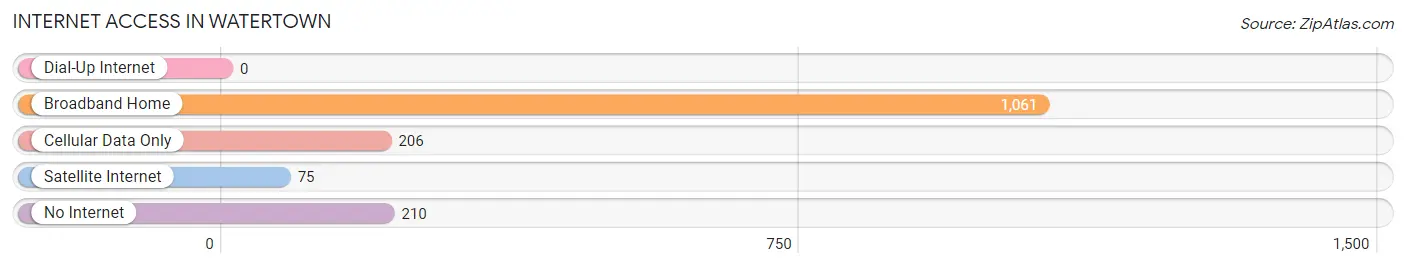
| Internet Type | # Households | % Households |
| Dial-Up Internet | 0 | 0.0% |
| Broadband Home | 1,061 | 68.2% |
| Cellular Data Only | 206 | 13.2% |
| Satellite Internet | 75 | 4.8% |
| No Internet | 210 | 13.5% |
| Total | 1,556 | 100.0% |
Watertown Summary
History
Watertown, Connecticut is a small town located in Litchfield County, Connecticut. It was first settled in 1780 by a group of settlers from Watertown, Massachusetts. The town was originally known as Salisbury, but was later changed to Watertown in 1807. The town was named after the original Watertown, Massachusetts, which was named after the English town of Waterton.
Watertown was an agricultural town for much of its history, with the main crops being corn, wheat, and hay. The town also had a number of mills, including a grist mill, a saw mill, and a paper mill. The town was also home to a number of small businesses, including a blacksmith, a tannery, and a shoe factory.
In the late 19th century, Watertown began to experience a period of industrialization. The town was home to a number of factories, including a woolen mill, a paper mill, and a machine shop. The town also had a number of stores, including a general store, a drug store, and a hardware store.
Geography
Watertown is located in Litchfield County, Connecticut. It is bordered by the towns of Bethlehem, Morris, and Woodbury. The town is located in the Naugatuck River Valley, and is surrounded by hills and mountains. The town is located approximately 40 miles from Hartford, Connecticut, and approximately 70 miles from New York City.
The town has a total area of 16.3 square miles, of which 16.2 square miles is land and 0.1 square miles is water. The town is located at an elevation of 590 feet above sea level.
Economy
Watertown’s economy is largely based on agriculture and manufacturing. The town is home to a number of farms, which produce corn, wheat, hay, and other crops. The town also has a number of factories, including a woolen mill, a paper mill, and a machine shop.
The town is also home to a number of small businesses, including a general store, a drug store, and a hardware store. The town also has a number of restaurants, including a pizza shop, a diner, and a Chinese restaurant.
Demographics
As of the 2010 census, Watertown had a population of 22,514. The racial makeup of the town was 94.3% White, 1.7% African American, 0.3% Native American, 1.2% Asian, 0.1% Pacific Islander, 1.2% from other races, and 1.4% from two or more races. Hispanic or Latino of any race were 4.2% of the population.
The median household income in Watertown was $68,945, and the median family income was $77,945. The per capita income for the town was $30,945. About 4.3% of families and 5.7% of the population were below the poverty line, including 6.3% of those under age 18 and 4.2% of those age 65 or over.
Common Questions
What is Per Capita Income in Watertown?
Per Capita income in Watertown is $37,847.
What is the Median Family Income in Watertown?
Median Family Income in Watertown is $80,417.
What is the Median Household income in Watertown?
Median Household Income in Watertown is $67,252.
What is Income or Wage Gap in Watertown?
Income or Wage Gap in Watertown is 20.4%.
Women in Watertown earn 79.6 cents for every dollar earned by a man.
What is Inequality or Gini Index in Watertown?
Inequality or Gini Index in Watertown is 0.42.
What is the Total Population of Watertown?
Total Population of Watertown is 3,765.
What is the Total Male Population of Watertown?
Total Male Population of Watertown is 1,860.
What is the Total Female Population of Watertown?
Total Female Population of Watertown is 1,905.
What is the Ratio of Males per 100 Females in Watertown?
There are 97.64 Males per 100 Females in Watertown.
What is the Ratio of Females per 100 Males in Watertown?
There are 102.42 Females per 100 Males in Watertown.
What is the Median Population Age in Watertown?
Median Population Age in Watertown is 43.6 Years.
What is the Average Family Size in Watertown
Average Family Size in Watertown is 3.0 People.
What is the Average Household Size in Watertown
Average Household Size in Watertown is 2.4 People.
How Large is the Labor Force in Watertown?
There are 2,002 People in the Labor Forcein in Watertown.
What is the Percentage of People in the Labor Force in Watertown?
67.4% of People are in the Labor Force in Watertown.
What is the Unemployment Rate in Watertown?
Unemployment Rate in Watertown is 4.1%.