Brooklyn, CT Map & Demographics
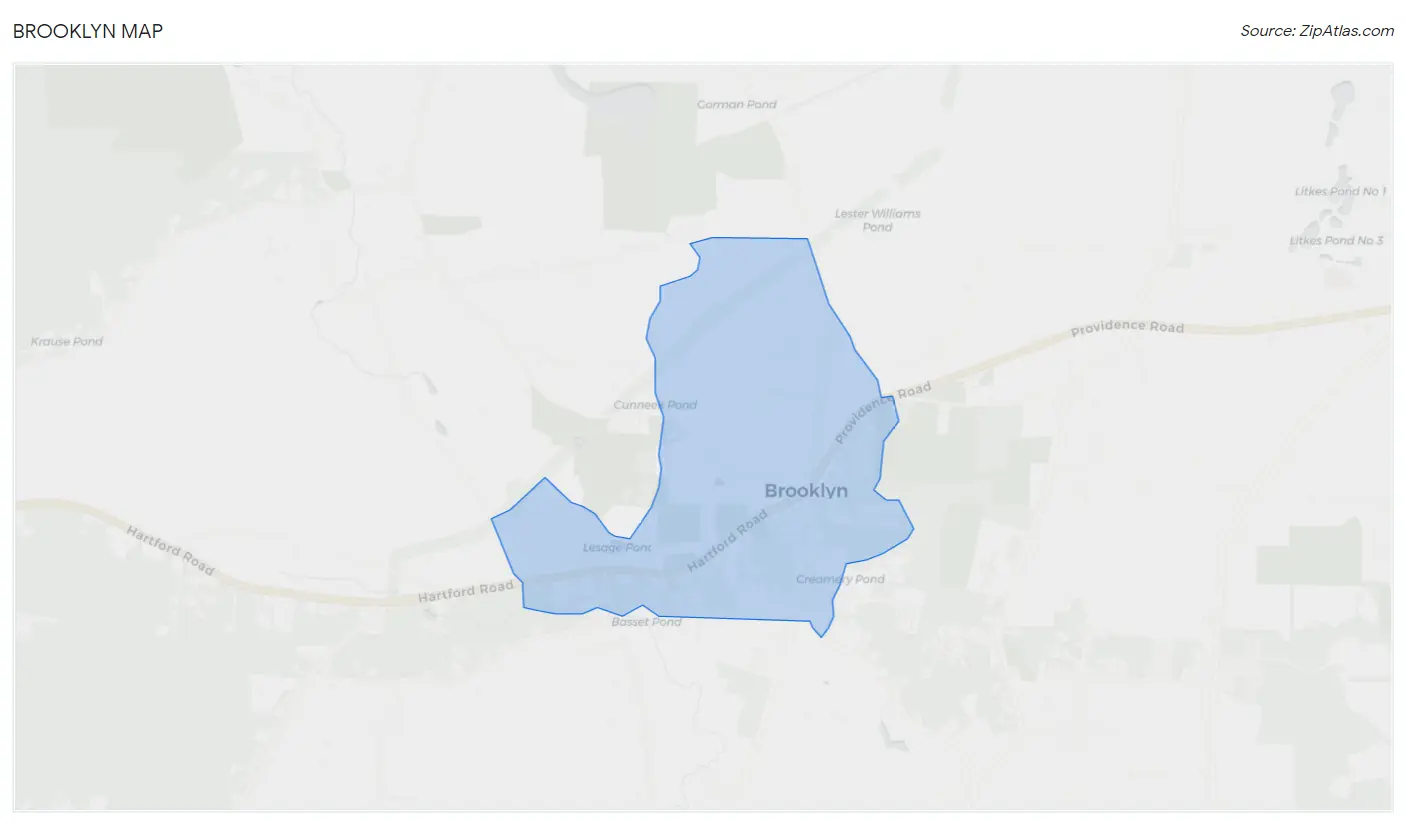
Brooklyn Map
Brooklyn Overview
$33,738
PER CAPITA INCOME
$71,543
AVG HOUSEHOLD INCOME
0.51
INEQUALITY / GINI INDEX
886
TOTAL POPULATION
629
MALE POPULATION
257
FEMALE POPULATION
244.75
MALES / 100 FEMALES
40.86
FEMALES / 100 MALES
42.8
MEDIAN AGE
2.5
AVG FAMILY SIZE
2.0
AVG HOUSEHOLD SIZE
307
LABOR FORCE [ PEOPLE ]
35.2%
PERCENT IN LABOR FORCE
Brooklyn Zip Codes
Brooklyn Area Codes
Income in Brooklyn
Income Overview in Brooklyn
| Characteristic | Number | Measure |
| Per Capita Income | 886 | $33,738 |
| Median Family Income | 139 | $0 |
| Mean Family Income | 139 | $177,824 |
| Median Household Income | 218 | $71,543 |
| Mean Household Income | 218 | $130,765 |
| Income Deficit | 139 | $0 |
| Wage / Income Gap (%) | 886 | 0.00% |
| Wage / Income Gap ($) | 886 | 100.00¢ per $1 |
| Gini / Inequality Index | 886 | 0.51 |
Earnings by Sex in Brooklyn
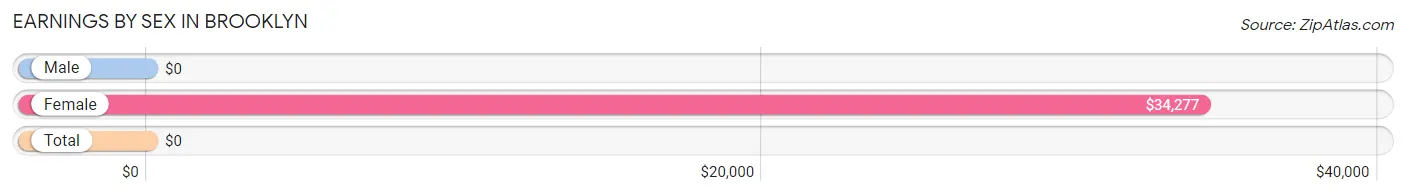
| Sex | Number | Average Earnings |
| Male | 375 (76.5%) | $0 |
| Female | 115 (23.5%) | $34,277 |
| Total | 490 (100.0%) | $0 |
Earnings by Sex by Income Bracket in Brooklyn
The most common earnings brackets in Brooklyn are $2,499 or less for men (106 | 28.3%) and $30,000 to $34,999 for women (64 | 55.6%).
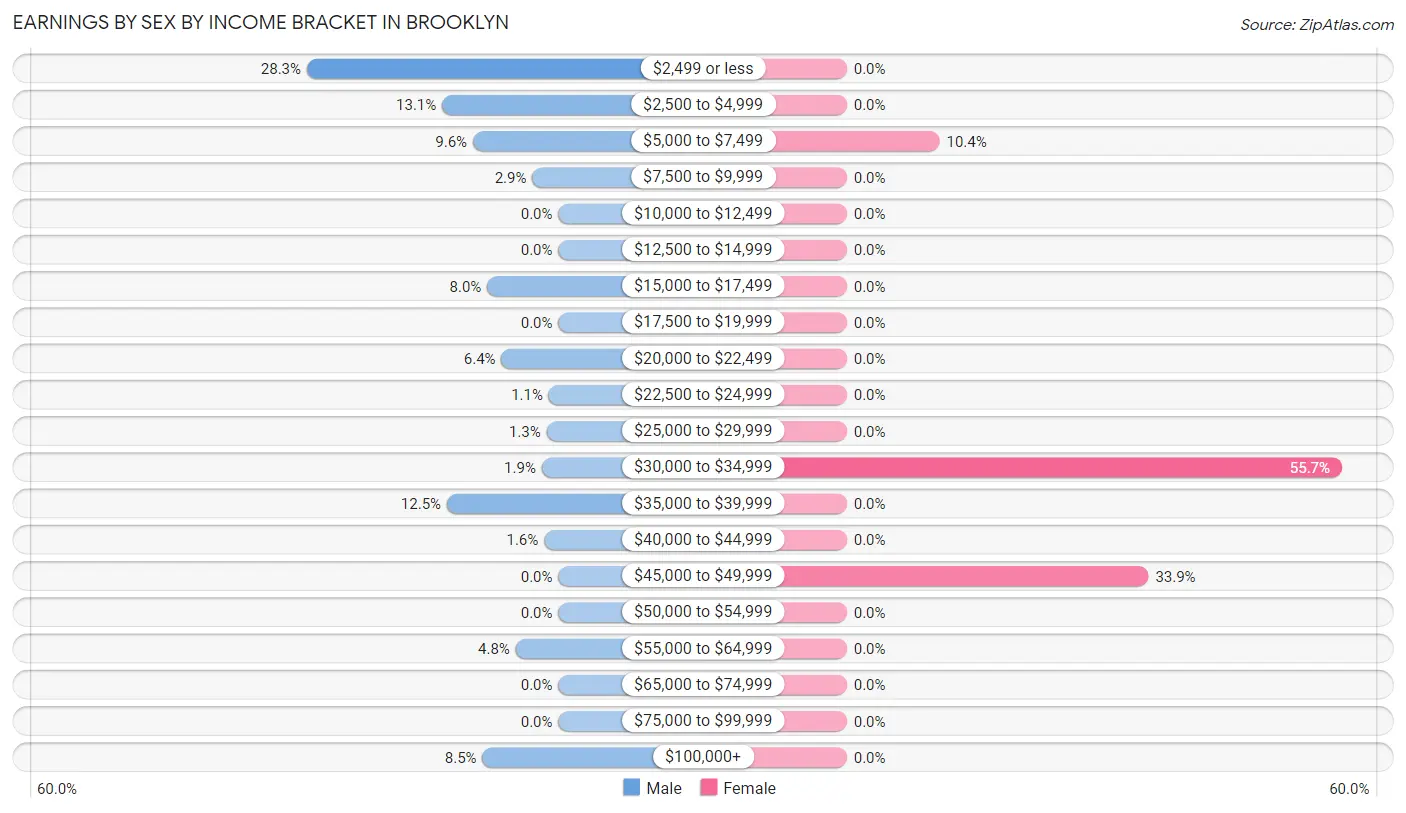
| Income | Male | Female |
| $2,499 or less | 106 (28.3%) | 0 (0.0%) |
| $2,500 to $4,999 | 49 (13.1%) | 0 (0.0%) |
| $5,000 to $7,499 | 36 (9.6%) | 12 (10.4%) |
| $7,500 to $9,999 | 11 (2.9%) | 0 (0.0%) |
| $10,000 to $12,499 | 0 (0.0%) | 0 (0.0%) |
| $12,500 to $14,999 | 0 (0.0%) | 0 (0.0%) |
| $15,000 to $17,499 | 30 (8.0%) | 0 (0.0%) |
| $17,500 to $19,999 | 0 (0.0%) | 0 (0.0%) |
| $20,000 to $22,499 | 24 (6.4%) | 0 (0.0%) |
| $22,500 to $24,999 | 4 (1.1%) | 0 (0.0%) |
| $25,000 to $29,999 | 5 (1.3%) | 0 (0.0%) |
| $30,000 to $34,999 | 7 (1.9%) | 64 (55.6%) |
| $35,000 to $39,999 | 47 (12.5%) | 0 (0.0%) |
| $40,000 to $44,999 | 6 (1.6%) | 0 (0.0%) |
| $45,000 to $49,999 | 0 (0.0%) | 39 (33.9%) |
| $50,000 to $54,999 | 0 (0.0%) | 0 (0.0%) |
| $55,000 to $64,999 | 18 (4.8%) | 0 (0.0%) |
| $65,000 to $74,999 | 0 (0.0%) | 0 (0.0%) |
| $75,000 to $99,999 | 0 (0.0%) | 0 (0.0%) |
| $100,000+ | 32 (8.5%) | 0 (0.0%) |
| Total | 375 (100.0%) | 115 (100.0%) |
Earnings by Sex by Educational Attainment in Brooklyn
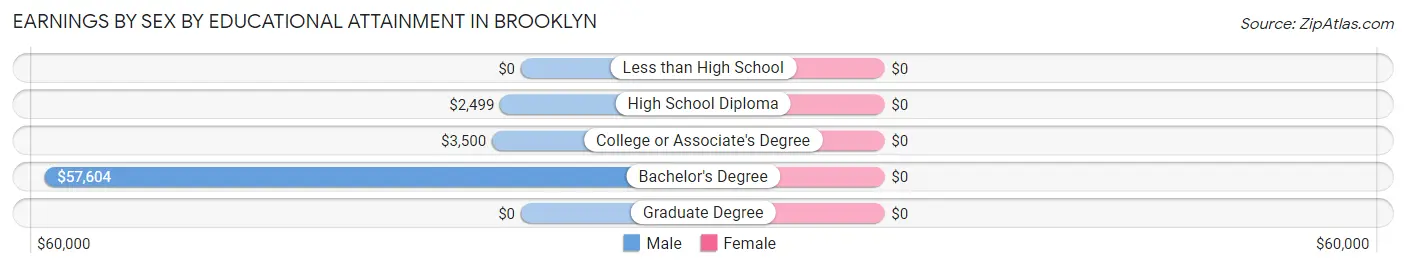
| Educational Attainment | Male Income | Female Income |
| Less than High School | - | - |
| High School Diploma | $2,499 | $0 |
| College or Associate's Degree | $3,500 | $0 |
| Bachelor's Degree | $57,604 | $0 |
| Graduate Degree | - | - |
| Total | $3,316 | $45,449 |
Family Income in Brooklyn
Family Income Brackets in Brooklyn
According to the Brooklyn family income data, there are 67 families falling into the $50,000 to $74,999 income range, which is the most common income bracket and makes up 48.2% of all families.
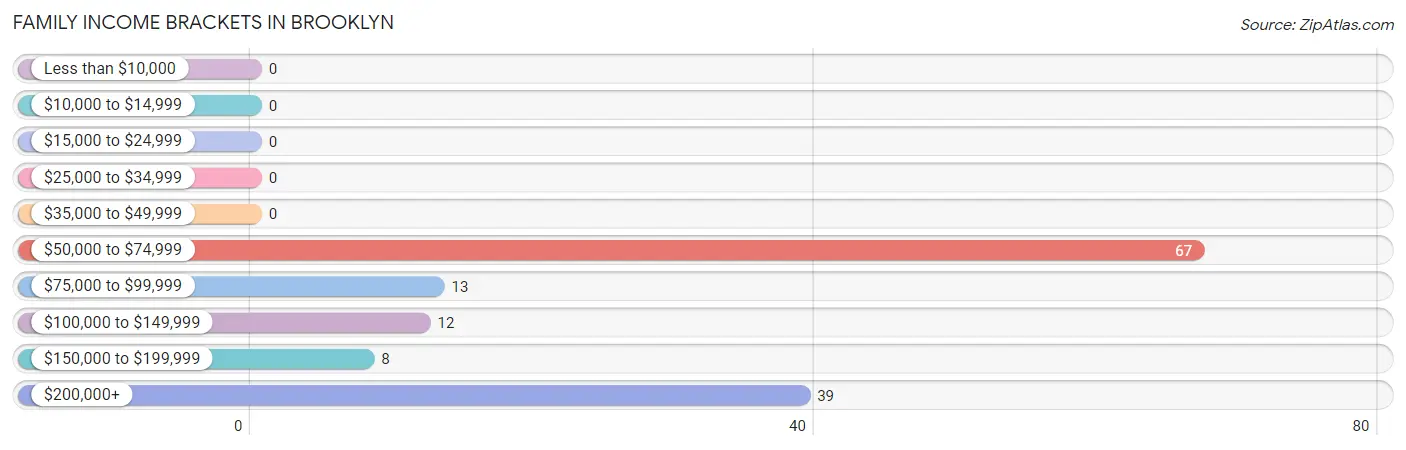
| Income Bracket | # Families | % Families |
| Less than $10,000 | 0 | 0.0% |
| $10,000 to $14,999 | 0 | 0.0% |
| $15,000 to $24,999 | 0 | 0.0% |
| $25,000 to $34,999 | 0 | 0.0% |
| $35,000 to $49,999 | 0 | 0.0% |
| $50,000 to $74,999 | 67 | 48.2% |
| $75,000 to $99,999 | 13 | 9.4% |
| $100,000 to $149,999 | 12 | 8.6% |
| $150,000 to $199,999 | 8 | 5.8% |
| $200,000+ | 39 | 28.1% |
Family Income by Famaliy Size in Brooklyn
2-person families (59 | 42.4%) account for the highest median family income in Brooklyn with $250,001 per family, while 2-person families (59 | 42.4%) have the highest median income of $125,000 per family member.
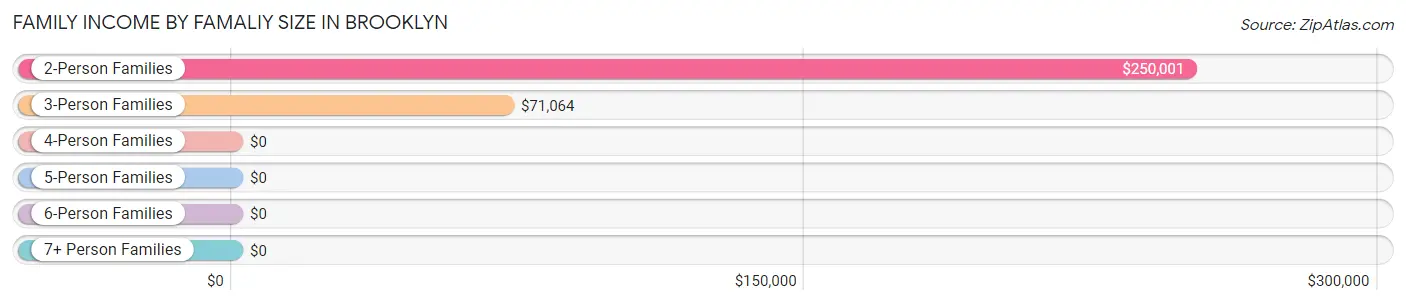
| Income Bracket | # Families | Median Income |
| 2-Person Families | 59 (42.4%) | $250,001 |
| 3-Person Families | 80 (57.6%) | $71,064 |
| 4-Person Families | 0 (0.0%) | $0 |
| 5-Person Families | 0 (0.0%) | $0 |
| 6-Person Families | 0 (0.0%) | $0 |
| 7+ Person Families | 0 (0.0%) | $0 |
| Total | 139 (100.0%) | $0 |
Family Income by Number of Earners in Brooklyn
| Number of Earners | # Families | Median Income |
| No Earners | 8 (5.8%) | $0 |
| 1 Earner | 0 (0.0%) | $0 |
| 2 Earners | 131 (94.2%) | $0 |
| 3+ Earners | 0 (0.0%) | $0 |
| Total | 139 (100.0%) | $0 |
Household Income in Brooklyn
Household Income Brackets in Brooklyn
With 67 households falling in the category, the $50,000 to $74,999 income range is the most frequent in Brooklyn, accounting for 30.7% of all households.
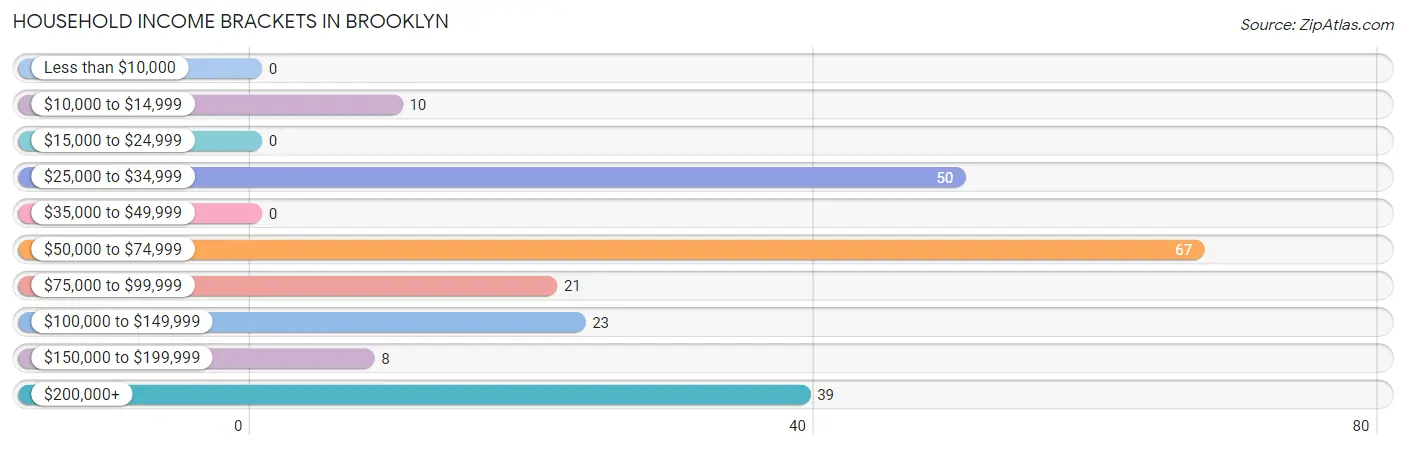
| Income Bracket | # Households | % Households |
| Less than $10,000 | 0 | 0.0% |
| $10,000 to $14,999 | 10 | 4.6% |
| $15,000 to $24,999 | 0 | 0.0% |
| $25,000 to $34,999 | 50 | 22.9% |
| $35,000 to $49,999 | 0 | 0.0% |
| $50,000 to $74,999 | 67 | 30.7% |
| $75,000 to $99,999 | 21 | 9.6% |
| $100,000 to $149,999 | 23 | 10.6% |
| $150,000 to $199,999 | 8 | 3.7% |
| $200,000+ | 39 | 17.9% |
Household Income by Householder Age in Brooklyn
The median household income in Brooklyn is $71,543, with the highest median household income of $250,001 found in the 45 to 64 years age bracket for the primary householder. A total of 62 households (28.4%) fall into this category. Meanwhile, the 15 to 24 years age bracket for the primary householder has the lowest median household income of $0, with 47 households (21.6%) in this group.
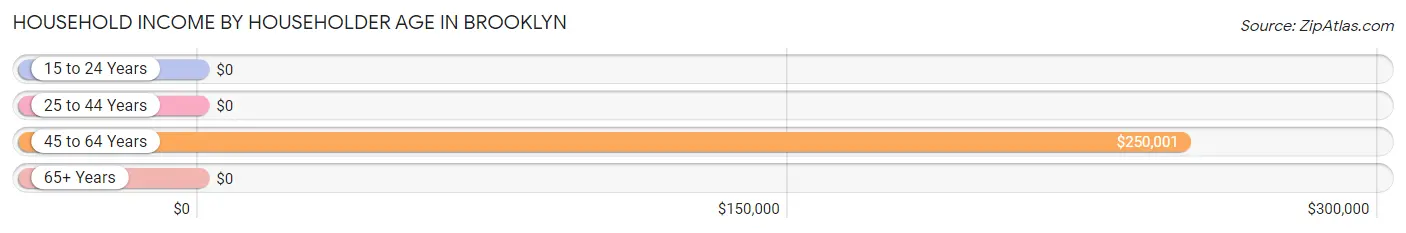
| Income Bracket | # Households | Median Income |
| 15 to 24 Years | 47 (21.6%) | $0 |
| 25 to 44 Years | 0 (0.0%) | $0 |
| 45 to 64 Years | 62 (28.4%) | $250,001 |
| 65+ Years | 109 (50.0%) | $0 |
| Total | 218 (100.0%) | $71,543 |
Poverty in Brooklyn
Income Below Poverty by Sex and Age in Brooklyn
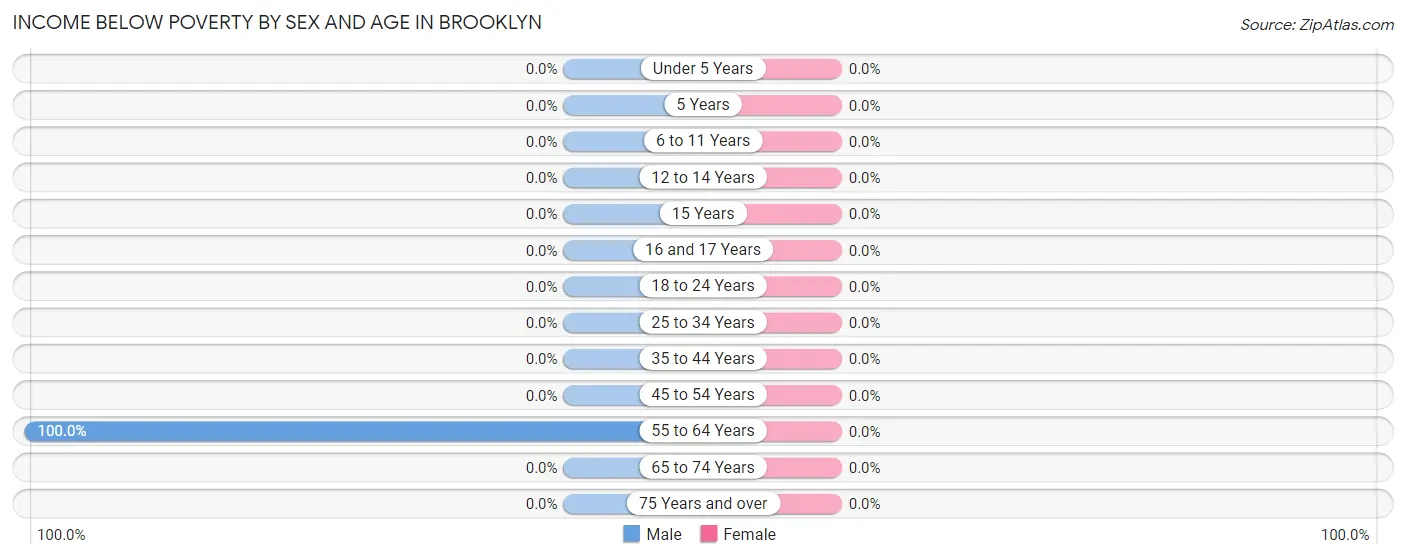
| Age Bracket | Male | Female |
| Under 5 Years | 0 (0.0%) | 0 (0.0%) |
| 5 Years | 0 (0.0%) | 0 (0.0%) |
| 6 to 11 Years | 0 (0.0%) | 0 (0.0%) |
| 12 to 14 Years | 0 (0.0%) | 0 (0.0%) |
| 15 Years | 0 (0.0%) | 0 (0.0%) |
| 16 and 17 Years | 0 (0.0%) | 0 (0.0%) |
| 18 to 24 Years | 0 (0.0%) | 0 (0.0%) |
| 25 to 34 Years | 0 (0.0%) | 0 (0.0%) |
| 35 to 44 Years | 0 (0.0%) | 0 (0.0%) |
| 45 to 54 Years | 0 (0.0%) | 0 (0.0%) |
| 55 to 64 Years | 32 (100.0%) | 0 (0.0%) |
| 65 to 74 Years | 0 (0.0%) | 0 (0.0%) |
| 75 Years and over | 0 (0.0%) | 0 (0.0%) |
| Total | 32 (11.5%) | 0 (0.0%) |
Income Above Poverty by Sex and Age in Brooklyn
According to the poverty statistics in Brooklyn, males aged 18 to 24 years and females aged under 5 years are the age groups that are most secure financially, with 100.0% of males and 100.0% of females in these age groups living above the poverty line.
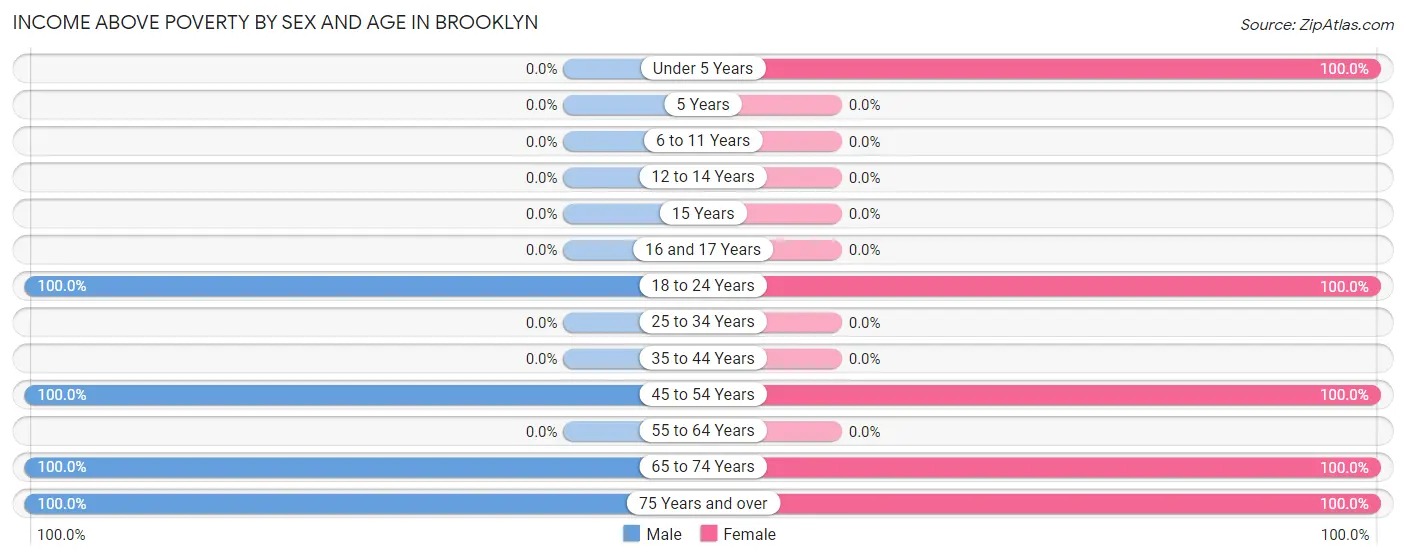
| Age Bracket | Male | Female |
| Under 5 Years | 0 (0.0%) | 15 (100.0%) |
| 5 Years | 0 (0.0%) | 0 (0.0%) |
| 6 to 11 Years | 0 (0.0%) | 0 (0.0%) |
| 12 to 14 Years | 0 (0.0%) | 0 (0.0%) |
| 15 Years | 0 (0.0%) | 0 (0.0%) |
| 16 and 17 Years | 0 (0.0%) | 0 (0.0%) |
| 18 to 24 Years | 125 (100.0%) | 51 (100.0%) |
| 25 to 34 Years | 0 (0.0%) | 0 (0.0%) |
| 35 to 44 Years | 0 (0.0%) | 0 (0.0%) |
| 45 to 54 Years | 71 (100.0%) | 52 (100.0%) |
| 55 to 64 Years | 0 (0.0%) | 0 (0.0%) |
| 65 to 74 Years | 43 (100.0%) | 28 (100.0%) |
| 75 Years and over | 8 (100.0%) | 50 (100.0%) |
| Total | 247 (88.5%) | 196 (100.0%) |
Income Below Poverty Among Married-Couple Families in Brooklyn
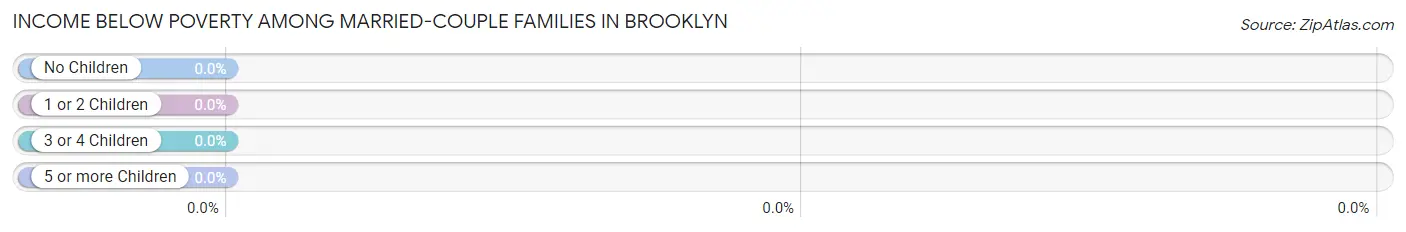
| Children | Above Poverty | Below Poverty |
| No Children | 33 (100.0%) | 0 (0.0%) |
| 1 or 2 Children | 47 (100.0%) | 0 (0.0%) |
| 3 or 4 Children | 0 (0.0%) | 0 (0.0%) |
| 5 or more Children | 0 (0.0%) | 0 (0.0%) |
| Total | 80 (100.0%) | 0 (0.0%) |
Income Below Poverty Among Single-Parent Households in Brooklyn
| Children | Single Father | Single Mother |
| No Children | 0 (0.0%) | 0 (0.0%) |
| 1 or 2 Children | 0 (0.0%) | 0 (0.0%) |
| 3 or 4 Children | 0 (0.0%) | 0 (0.0%) |
| 5 or more Children | 0 (0.0%) | 0 (0.0%) |
| Total | 0 (0.0%) | 0 (0.0%) |
Income Below Poverty Among Married-Couple vs Single-Parent Households in Brooklyn
| Children | Married-Couple Families | Single-Parent Households |
| No Children | 0 (0.0%) | 0 (0.0%) |
| 1 or 2 Children | 0 (0.0%) | 0 (0.0%) |
| 3 or 4 Children | 0 (0.0%) | 0 (0.0%) |
| 5 or more Children | 0 (0.0%) | 0 (0.0%) |
| Total | 0 (0.0%) | 0 (0.0%) |
Race in Brooklyn
The most populous races in Brooklyn are White / Caucasian (620 | 70.0%), Two or more Races (149 | 16.8%), and Hispanic or Latino (108 | 12.2%).
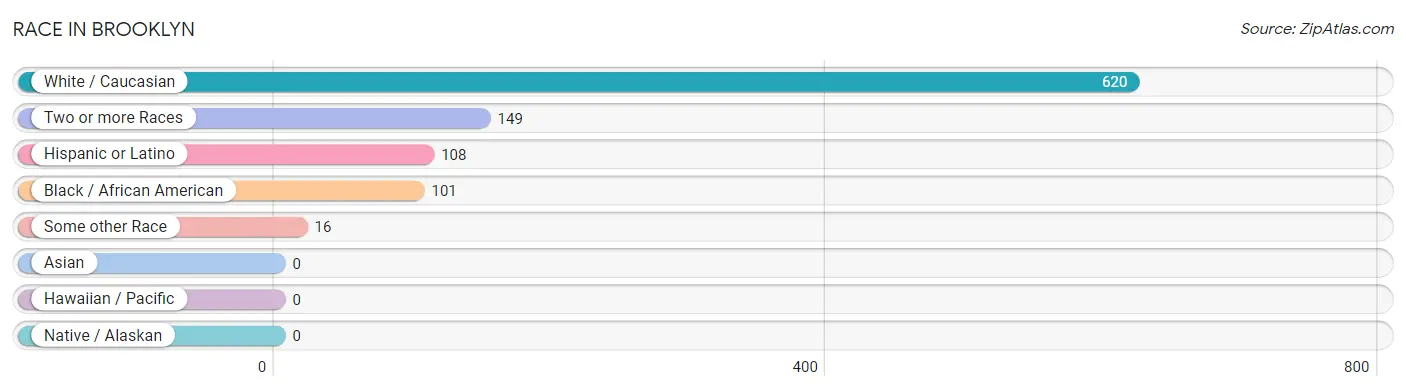
| Race | # Population | % Population |
| Asian | 0 | 0.0% |
| Black / African American | 101 | 11.4% |
| Hawaiian / Pacific | 0 | 0.0% |
| Hispanic or Latino | 108 | 12.2% |
| Native / Alaskan | 0 | 0.0% |
| White / Caucasian | 620 | 70.0% |
| Two or more Races | 149 | 16.8% |
| Some other Race | 16 | 1.8% |
| Total | 886 | 100.0% |
Ancestry in Brooklyn
The most populous ancestries reported in Brooklyn are Italian (282 | 31.8%), Irish (138 | 15.6%), Portuguese (66 | 7.4%), Puerto Rican (55 | 6.2%), and French Canadian (48 | 5.4%), together accounting for 66.5% of all Brooklyn residents.
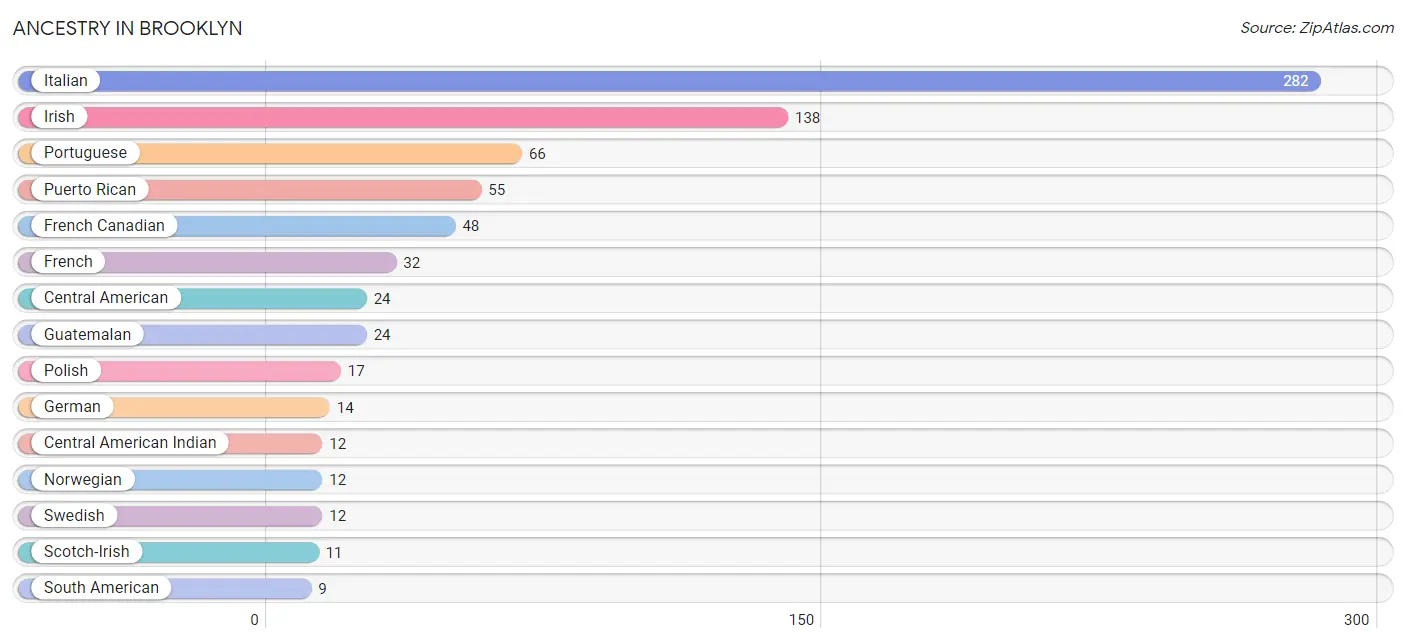
| Ancestry | # Population | % Population |
| Blackfeet | 6 | 0.7% |
| Central American | 24 | 2.7% |
| Central American Indian | 12 | 1.3% |
| Colombian | 5 | 0.6% |
| Creek | 6 | 0.7% |
| Cuban | 7 | 0.8% |
| Dominican | 6 | 0.7% |
| French | 32 | 3.6% |
| French Canadian | 48 | 5.4% |
| German | 14 | 1.6% |
| Guatemalan | 24 | 2.7% |
| Irish | 138 | 15.6% |
| Italian | 282 | 31.8% |
| Mexican | 7 | 0.8% |
| Norwegian | 12 | 1.3% |
| Peruvian | 4 | 0.4% |
| Polish | 17 | 1.9% |
| Portuguese | 66 | 7.4% |
| Puerto Rican | 55 | 6.2% |
| Scotch-Irish | 11 | 1.2% |
| Scottish | 6 | 0.7% |
| South American | 9 | 1.0% |
| Swedish | 12 | 1.3% | View All 23 Rows |
Immigrants in Brooklyn
The most numerous immigrant groups reported in Brooklyn came from Latin America (37 | 4.2%), Central America (28 | 3.2%), Guatemala (24 | 2.7%), Canada (11 | 1.2%), and Caribbean (9 | 1.0%), together accounting for 12.3% of all Brooklyn residents.
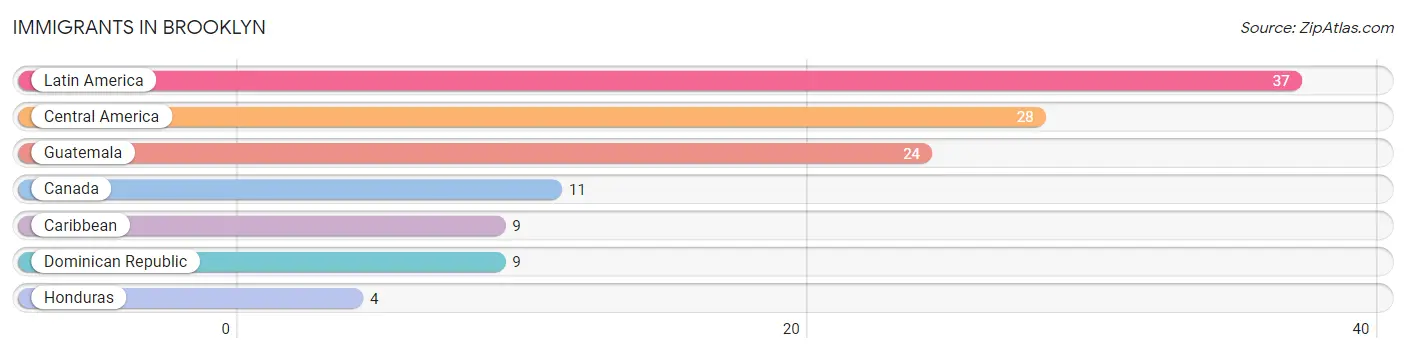
| Immigration Origin | # Population | % Population |
| Canada | 11 | 1.2% |
| Caribbean | 9 | 1.0% |
| Central America | 28 | 3.2% |
| Dominican Republic | 9 | 1.0% |
| Guatemala | 24 | 2.7% |
| Honduras | 4 | 0.4% |
| Latin America | 37 | 4.2% | View All 7 Rows |
Sex and Age in Brooklyn
Sex and Age in Brooklyn
The most populous age groups in Brooklyn are 20 to 24 Years (136 | 21.6%) for men and 85 Years and over (53 | 20.6%) for women.
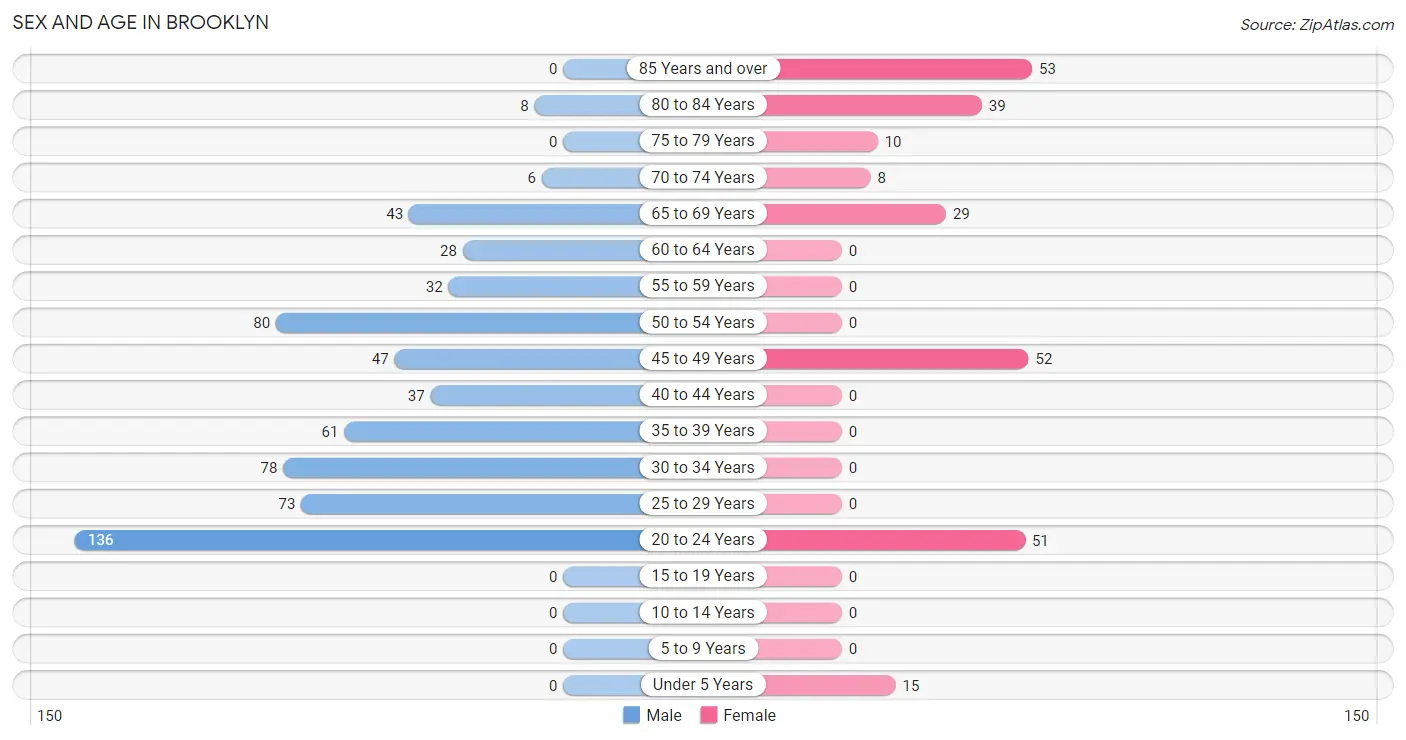
| Age Bracket | Male | Female |
| Under 5 Years | 0 (0.0%) | 15 (5.8%) |
| 5 to 9 Years | 0 (0.0%) | 0 (0.0%) |
| 10 to 14 Years | 0 (0.0%) | 0 (0.0%) |
| 15 to 19 Years | 0 (0.0%) | 0 (0.0%) |
| 20 to 24 Years | 136 (21.6%) | 51 (19.8%) |
| 25 to 29 Years | 73 (11.6%) | 0 (0.0%) |
| 30 to 34 Years | 78 (12.4%) | 0 (0.0%) |
| 35 to 39 Years | 61 (9.7%) | 0 (0.0%) |
| 40 to 44 Years | 37 (5.9%) | 0 (0.0%) |
| 45 to 49 Years | 47 (7.5%) | 52 (20.2%) |
| 50 to 54 Years | 80 (12.7%) | 0 (0.0%) |
| 55 to 59 Years | 32 (5.1%) | 0 (0.0%) |
| 60 to 64 Years | 28 (4.4%) | 0 (0.0%) |
| 65 to 69 Years | 43 (6.8%) | 29 (11.3%) |
| 70 to 74 Years | 6 (0.9%) | 8 (3.1%) |
| 75 to 79 Years | 0 (0.0%) | 10 (3.9%) |
| 80 to 84 Years | 8 (1.3%) | 39 (15.2%) |
| 85 Years and over | 0 (0.0%) | 53 (20.6%) |
| Total | 629 (100.0%) | 257 (100.0%) |
Families and Households in Brooklyn
Median Family Size in Brooklyn
The median family size in Brooklyn is 2.53 persons per family, with single male/father families (20 | 14.4%) accounting for the largest median family size of 4 persons per family. On the other hand, single female/mother families (39 | 28.1%) represent the smallest median family size with 1.82 persons per family.
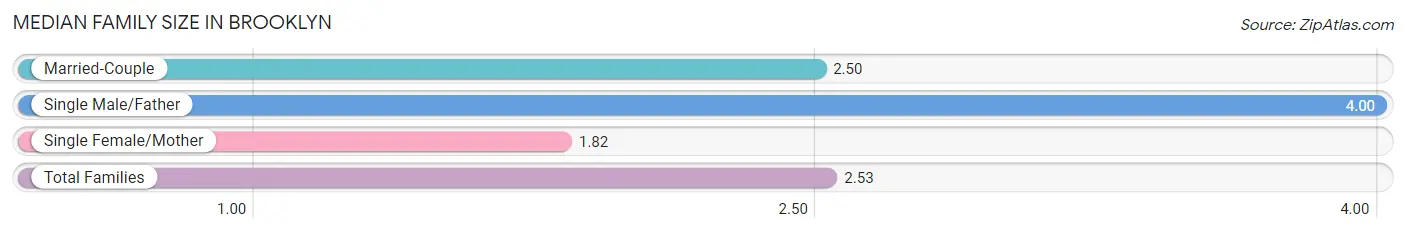
| Family Type | # Families | Family Size |
| Married-Couple | 80 (57.6%) | 2.50 |
| Single Male/Father | 20 (14.4%) | 4.00 |
| Single Female/Mother | 39 (28.1%) | 1.82 |
| Total Families | 139 (100.0%) | 2.53 |
Median Household Size in Brooklyn
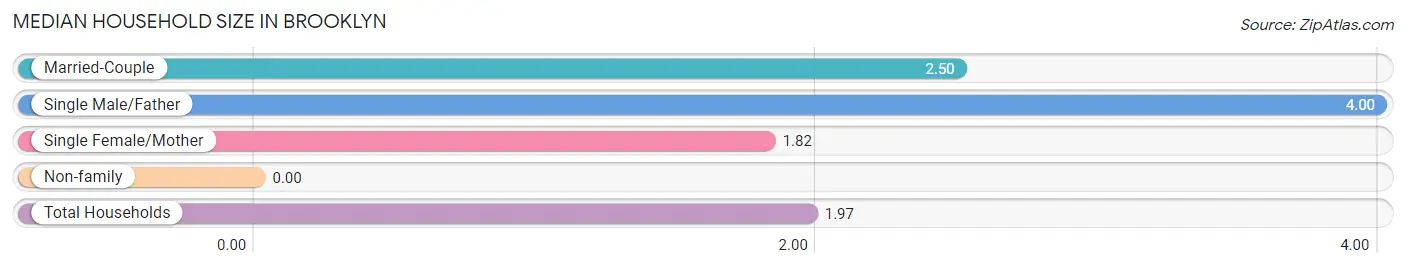
| Household Type | # Households | Household Size |
| Married-Couple | 80 (36.7%) | 2.50 |
| Single Male/Father | 20 (9.2%) | 4.00 |
| Single Female/Mother | 39 (17.9%) | 1.82 |
| Non-family | 79 (36.2%) | - |
| Total Households | 218 (100.0%) | 1.97 |
Household Size by Marriage Status in Brooklyn
Out of a total of 218 households in Brooklyn, 139 (63.8%) are family households, while 79 (36.2%) are nonfamily households. The most numerous type of family households are 3-person households, comprising 80, and the most common type of nonfamily households are 1-person households, comprising 79.
| Household Size | Family Households | Nonfamily Households |
| 1-Person Households | - | 79 (36.2%) |
| 2-Person Households | 59 (27.1%) | 0 (0.0%) |
| 3-Person Households | 80 (36.7%) | 0 (0.0%) |
| 4-Person Households | 0 (0.0%) | 0 (0.0%) |
| 5-Person Households | 0 (0.0%) | 0 (0.0%) |
| 6-Person Households | 0 (0.0%) | 0 (0.0%) |
| 7+ Person Households | 0 (0.0%) | 0 (0.0%) |
| Total | 139 (63.8%) | 79 (36.2%) |
Female Fertility in Brooklyn
Fertility by Age in Brooklyn
Average fertility rate in Brooklyn is 495.0 births per 1,000 women. Women in the age bracket of 20 to 34 years have the highest fertility rate with 1,000.0 births per 1,000 women. Women in the age bracket of 20 to 34 years acount for 100.0% of all women with births.
| Age Bracket | Women with Births | Births / 1,000 Women |
| 15 to 19 years | 0 (0.0%) | 0.0 |
| 20 to 34 years | 51 (100.0%) | 1,000.0 |
| 35 to 50 years | 0 (0.0%) | 0.0 |
| Total | 51 (100.0%) | 495.0 |
Fertility by Age by Marriage Status in Brooklyn
| Age Bracket | Married | Unmarried |
| 15 to 19 years | 0 (0.0%) | 0 (0.0%) |
| 20 to 34 years | 51 (100.0%) | 0 (0.0%) |
| 35 to 50 years | 0 (0.0%) | 0 (0.0%) |
| Total | 51 (100.0%) | 0 (0.0%) |
Fertility by Education in Brooklyn
| Educational Attainment | Women with Births | Births / 1,000 Women |
| Less than High School | 0 (0.0%) | 0.0 |
| High School Diploma | 0 (0.0%) | 0.0 |
| College or Associate's Degree | 51 (100.0%) | 567.0 |
| Bachelor's Degree | 0 (0.0%) | 0.0 |
| Graduate Degree | 0 (0.0%) | 0.0 |
| Total | 51 (100.0%) | 495.0 |
Fertility by Education by Marriage Status in Brooklyn
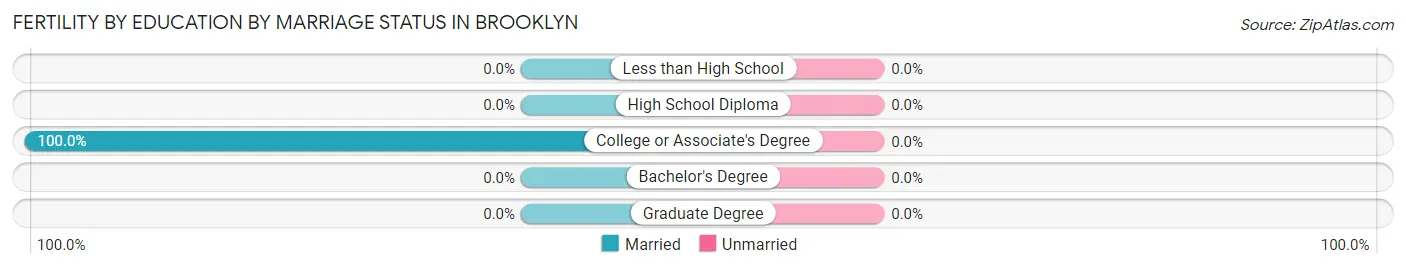
| Educational Attainment | Married | Unmarried |
| Less than High School | 0 (0.0%) | 0 (0.0%) |
| High School Diploma | 0 (0.0%) | 0 (0.0%) |
| College or Associate's Degree | 51 (100.0%) | 0 (0.0%) |
| Bachelor's Degree | 0 (0.0%) | 0 (0.0%) |
| Graduate Degree | 0 (0.0%) | 0 (0.0%) |
| Total | 51 (100.0%) | 0 (0.0%) |
Employment Characteristics in Brooklyn
Employment by Class of Employer in Brooklyn
Among the 268 employed individuals in Brooklyn, private company employees (215 | 80.2%), not-for-profit organizations (35 | 13.1%), and local government employees (18 | 6.7%) make up the most common classes of employment.
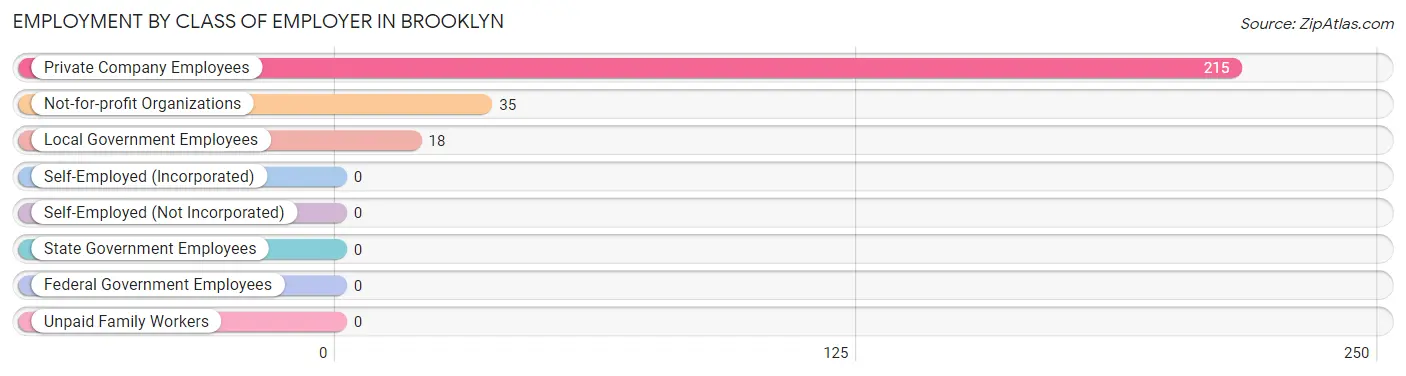
| Employer Class | # Employees | % Employees |
| Private Company Employees | 215 | 80.2% |
| Self-Employed (Incorporated) | 0 | 0.0% |
| Self-Employed (Not Incorporated) | 0 | 0.0% |
| Not-for-profit Organizations | 35 | 13.1% |
| Local Government Employees | 18 | 6.7% |
| State Government Employees | 0 | 0.0% |
| Federal Government Employees | 0 | 0.0% |
| Unpaid Family Workers | 0 | 0.0% |
| Total | 268 | 100.0% |
Employment Status by Age in Brooklyn
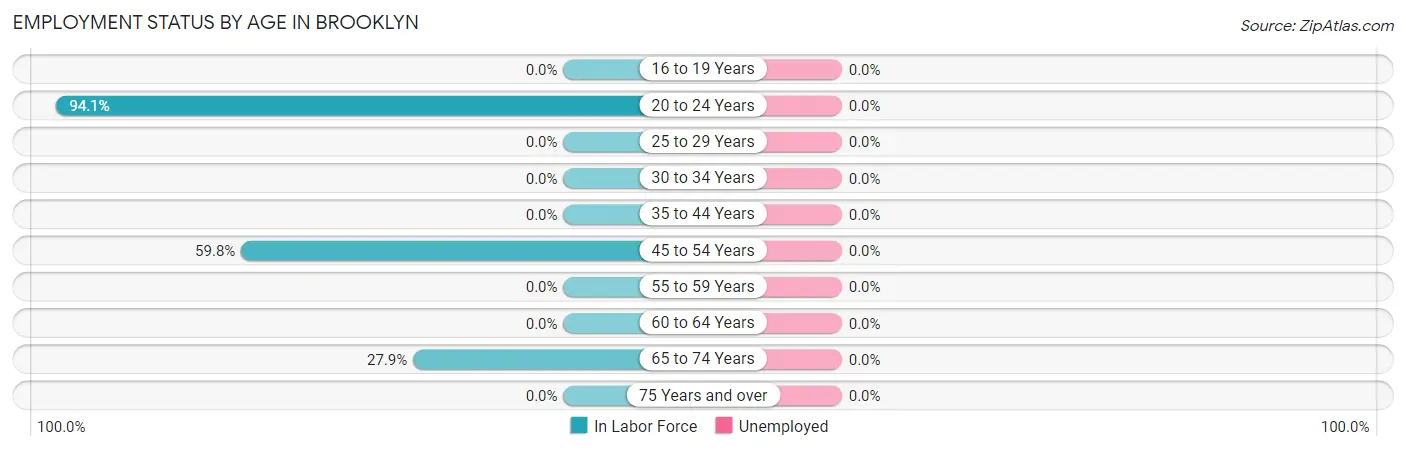
| Age Bracket | In Labor Force | Unemployed |
| 16 to 19 Years | 0 (0.0%) | 0 (0.0%) |
| 20 to 24 Years | 176 (94.1%) | 0 (0.0%) |
| 25 to 29 Years | 0 (0.0%) | 0 (0.0%) |
| 30 to 34 Years | 0 (0.0%) | 0 (0.0%) |
| 35 to 44 Years | 0 (0.0%) | 0 (0.0%) |
| 45 to 54 Years | 107 (59.8%) | 0 (0.0%) |
| 55 to 59 Years | 0 (0.0%) | 0 (0.0%) |
| 60 to 64 Years | 0 (0.0%) | 0 (0.0%) |
| 65 to 74 Years | 24 (27.9%) | 0 (0.0%) |
| 75 Years and over | 0 (0.0%) | 0 (0.0%) |
| Total | 307 (35.2%) | 0 (0.0%) |
Employment Status by Educational Attainment in Brooklyn
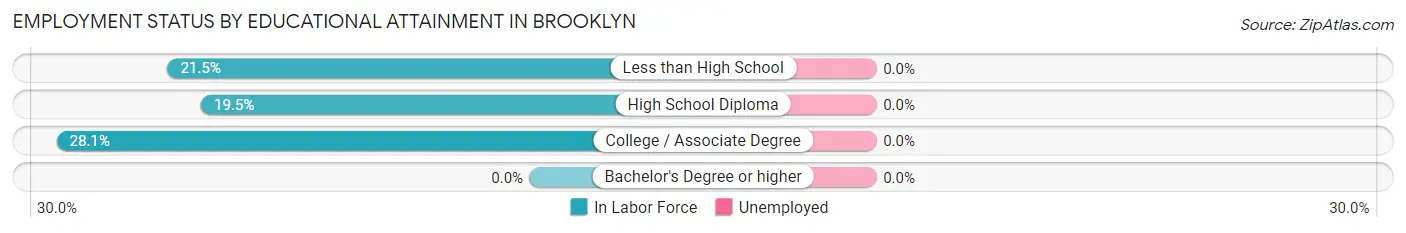
| Educational Attainment | In Labor Force | Unemployed |
| Less than High School | 23 (21.5%) | 0 (0.0%) |
| High School Diploma | 45 (19.5%) | 0 (0.0%) |
| College / Associate Degree | 39 (28.1%) | 0 (0.0%) |
| Bachelor's Degree or higher | 0 (0.0%) | 0 (0.0%) |
| Total | 107 (21.9%) | 0 (0.0%) |
Employment Occupations by Sex in Brooklyn
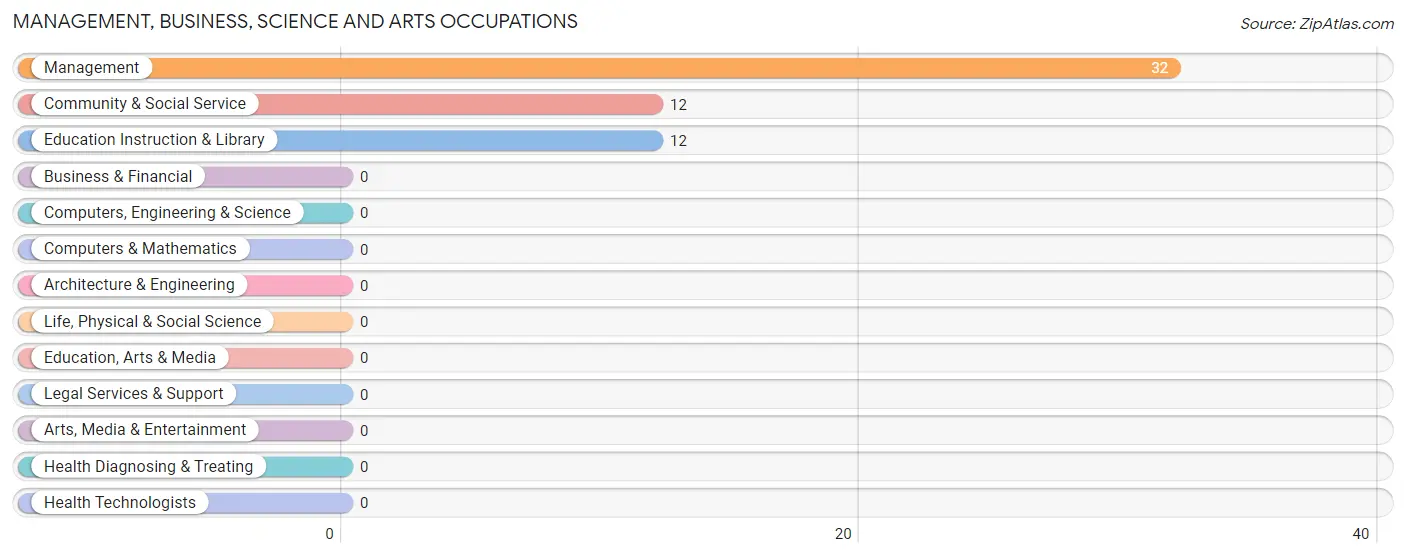
Management, Business, Science and Arts Occupations
The most common Management, Business, Science and Arts occupations in Brooklyn are Management (32 | 10.4%), Community & Social Service (12 | 3.9%), and Education Instruction & Library (12 | 3.9%).
Management, Business, Science and Arts Occupations by Sex
| Occupation | Male | Female |
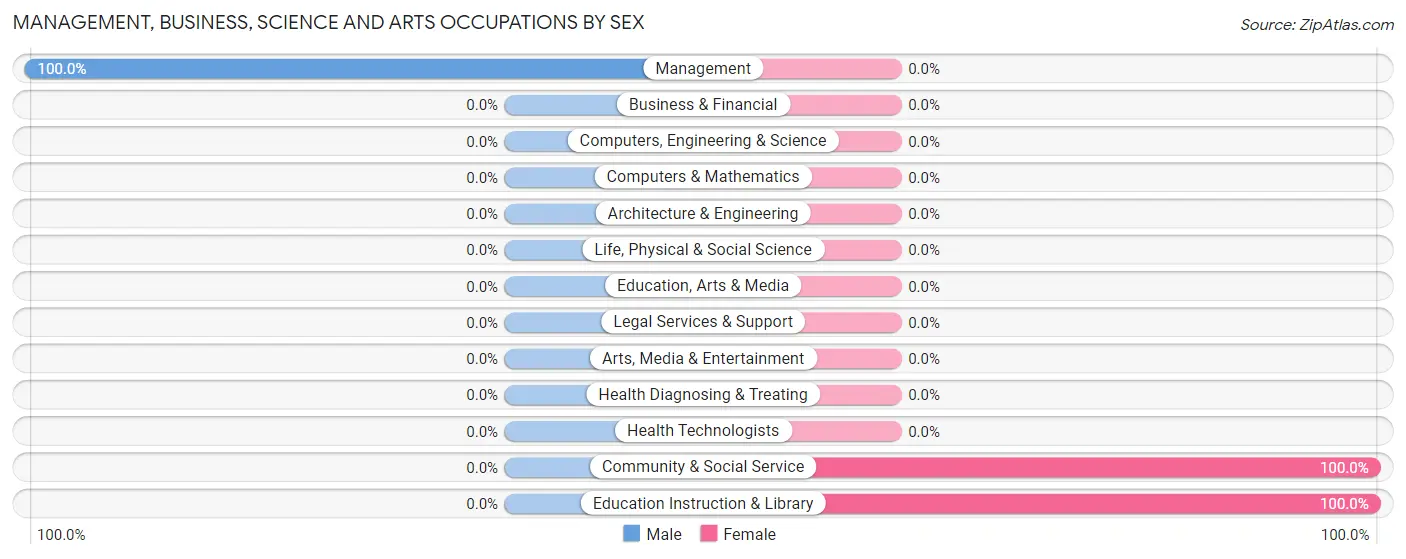
| Management | 32 (100.0%) | 0 (0.0%) |
| Business & Financial | 0 (0.0%) | 0 (0.0%) |
| Computers, Engineering & Science | 0 (0.0%) | 0 (0.0%) |
| Computers & Mathematics | 0 (0.0%) | 0 (0.0%) |
| Architecture & Engineering | 0 (0.0%) | 0 (0.0%) |
| Life, Physical & Social Science | 0 (0.0%) | 0 (0.0%) |
| Community & Social Service | 0 (0.0%) | 12 (100.0%) |
| Education, Arts & Media | 0 (0.0%) | 0 (0.0%) |
| Legal Services & Support | 0 (0.0%) | 0 (0.0%) |
| Education Instruction & Library | 0 (0.0%) | 12 (100.0%) |
| Arts, Media & Entertainment | 0 (0.0%) | 0 (0.0%) |
| Health Diagnosing & Treating | 0 (0.0%) | 0 (0.0%) |
| Health Technologists | 0 (0.0%) | 0 (0.0%) |
| Total (Category) | 32 (72.7%) | 12 (27.3%) |
| Total (Overall) | 192 (62.5%) | 115 (37.5%) |
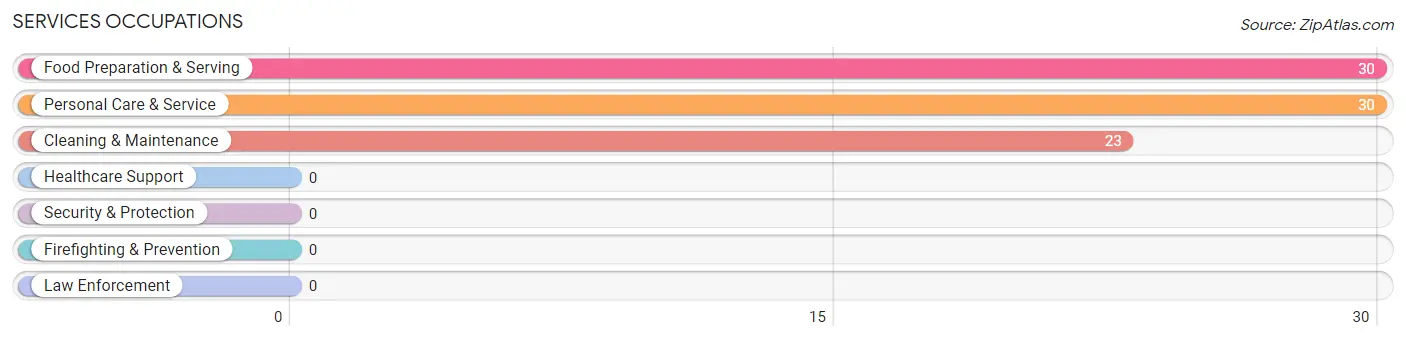
Services Occupations
The most common Services occupations in Brooklyn are Food Preparation & Serving (30 | 9.8%), Personal Care & Service (30 | 9.8%), and Cleaning & Maintenance (23 | 7.5%).
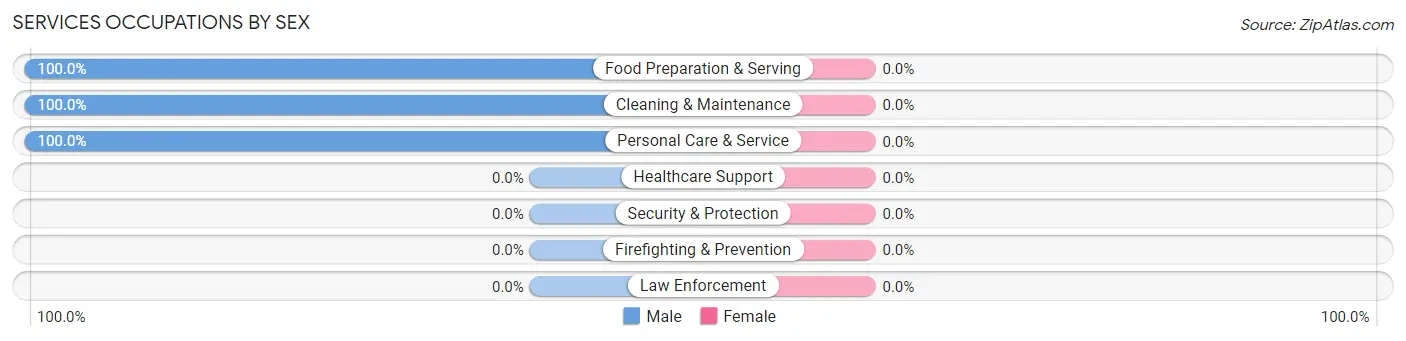
Services Occupations by Sex
| Occupation | Male | Female |
| Healthcare Support | 0 (0.0%) | 0 (0.0%) |
| Security & Protection | 0 (0.0%) | 0 (0.0%) |
| Firefighting & Prevention | 0 (0.0%) | 0 (0.0%) |
| Law Enforcement | 0 (0.0%) | 0 (0.0%) |
| Food Preparation & Serving | 30 (100.0%) | 0 (0.0%) |
| Cleaning & Maintenance | 23 (100.0%) | 0 (0.0%) |
| Personal Care & Service | 30 (100.0%) | 0 (0.0%) |
| Total (Category) | 83 (100.0%) | 0 (0.0%) |
| Total (Overall) | 192 (62.5%) | 115 (37.5%) |
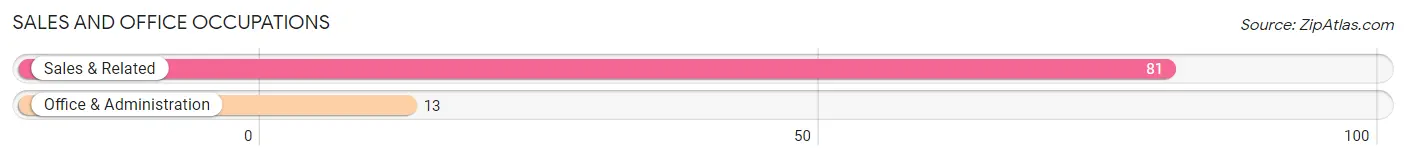
Sales and Office Occupations
The most common Sales and Office occupations in Brooklyn are Sales & Related (81 | 26.4%), and Office & Administration (13 | 4.2%).
Sales and Office Occupations by Sex
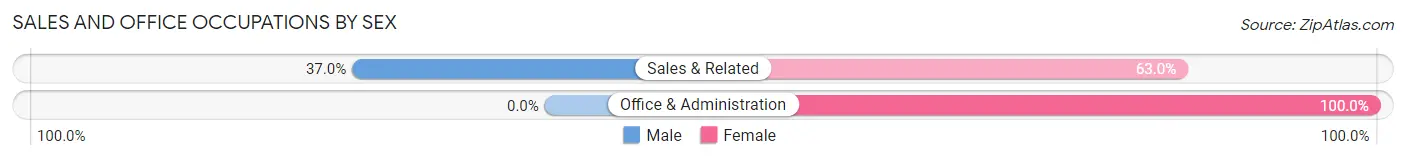
| Occupation | Male | Female |
| Sales & Related | 30 (37.0%) | 51 (63.0%) |
| Office & Administration | 0 (0.0%) | 13 (100.0%) |
| Total (Category) | 30 (31.9%) | 64 (68.1%) |
| Total (Overall) | 192 (62.5%) | 115 (37.5%) |
Natural Resources, Construction and Maintenance Occupations
Natural Resources, Construction and Maintenance Occupations by Sex
| Occupation | Male | Female |
| Farming, Fishing & Forestry | 0 (0.0%) | 0 (0.0%) |
| Construction & Extraction | 0 (0.0%) | 0 (0.0%) |
| Installation, Maintenance & Repair | 0 (0.0%) | 0 (0.0%) |
| Total (Category) | 0 (0.0%) | 0 (0.0%) |
| Total (Overall) | 192 (62.5%) | 115 (37.5%) |
Production, Transportation and Moving Occupations
The most common Production, Transportation and Moving occupations in Brooklyn are Production (47 | 15.3%), and Transportation (39 | 12.7%).
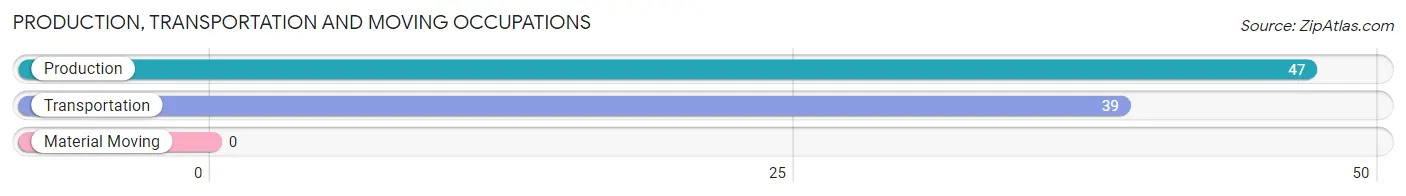
Production, Transportation and Moving Occupations by Sex
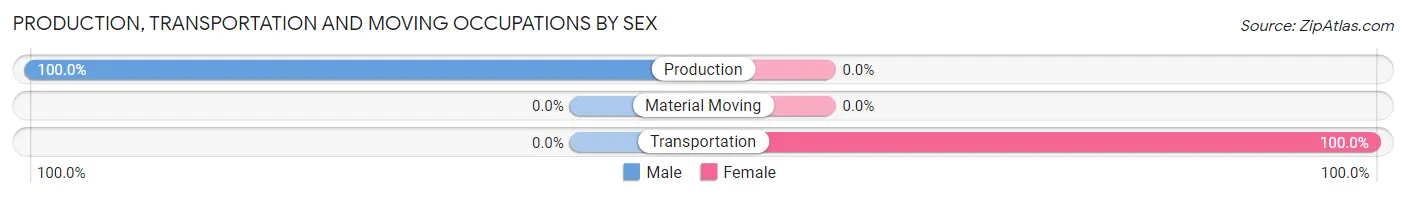
| Occupation | Male | Female |
| Production | 47 (100.0%) | 0 (0.0%) |
| Transportation | 0 (0.0%) | 39 (100.0%) |
| Material Moving | 0 (0.0%) | 0 (0.0%) |
| Total (Category) | 47 (54.6%) | 39 (45.4%) |
| Total (Overall) | 192 (62.5%) | 115 (37.5%) |
Employment Industries by Sex in Brooklyn
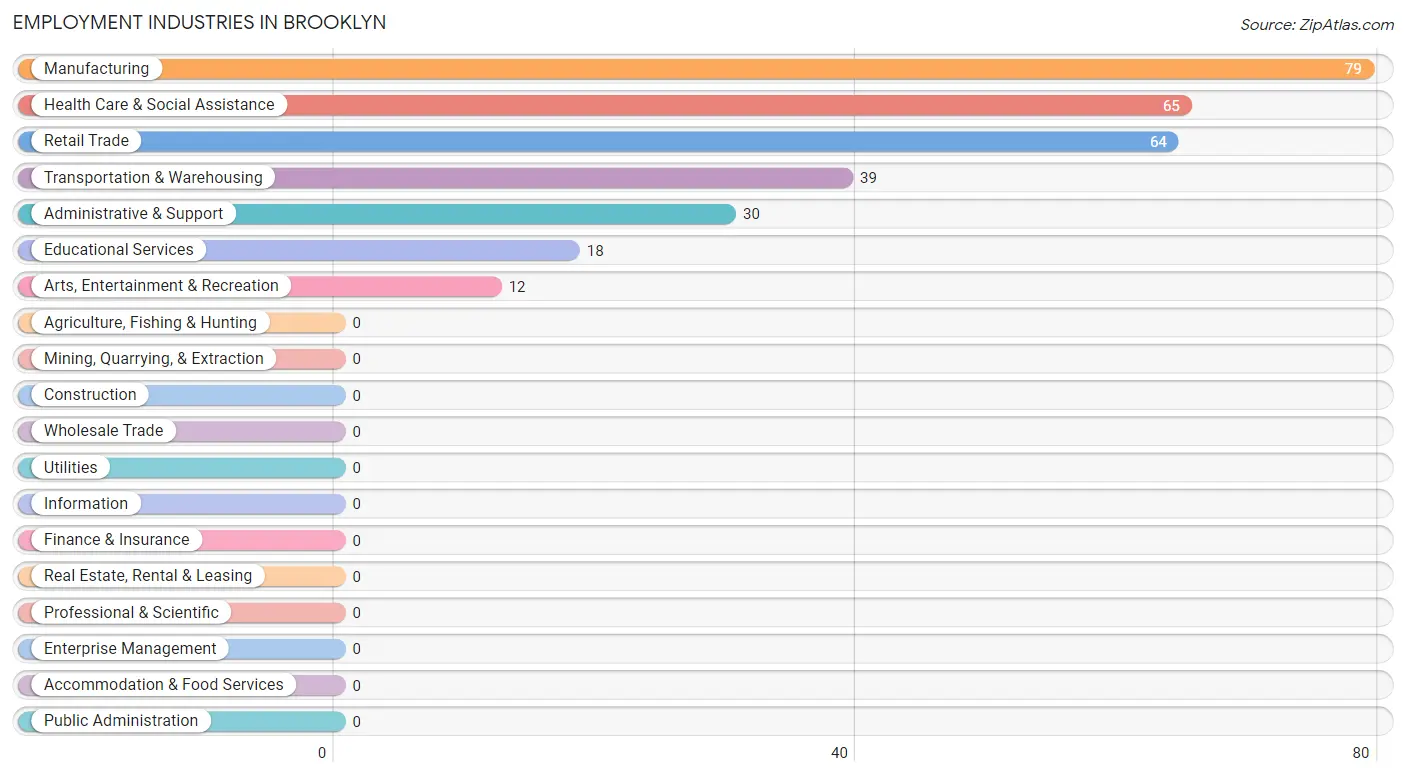
Employment Industries in Brooklyn
The major employment industries in Brooklyn include Manufacturing (79 | 25.7%), Health Care & Social Assistance (65 | 21.2%), Retail Trade (64 | 20.8%), Transportation & Warehousing (39 | 12.7%), and Administrative & Support (30 | 9.8%).
Employment Industries by Sex in Brooklyn
The Brooklyn industries that see more men than women are Manufacturing (100.0%), Administrative & Support (100.0%), and Educational Services (100.0%), whereas the industries that tend to have a higher number of women are Retail Trade (100.0%), Transportation & Warehousing (100.0%), and Health Care & Social Assistance (18.5%).
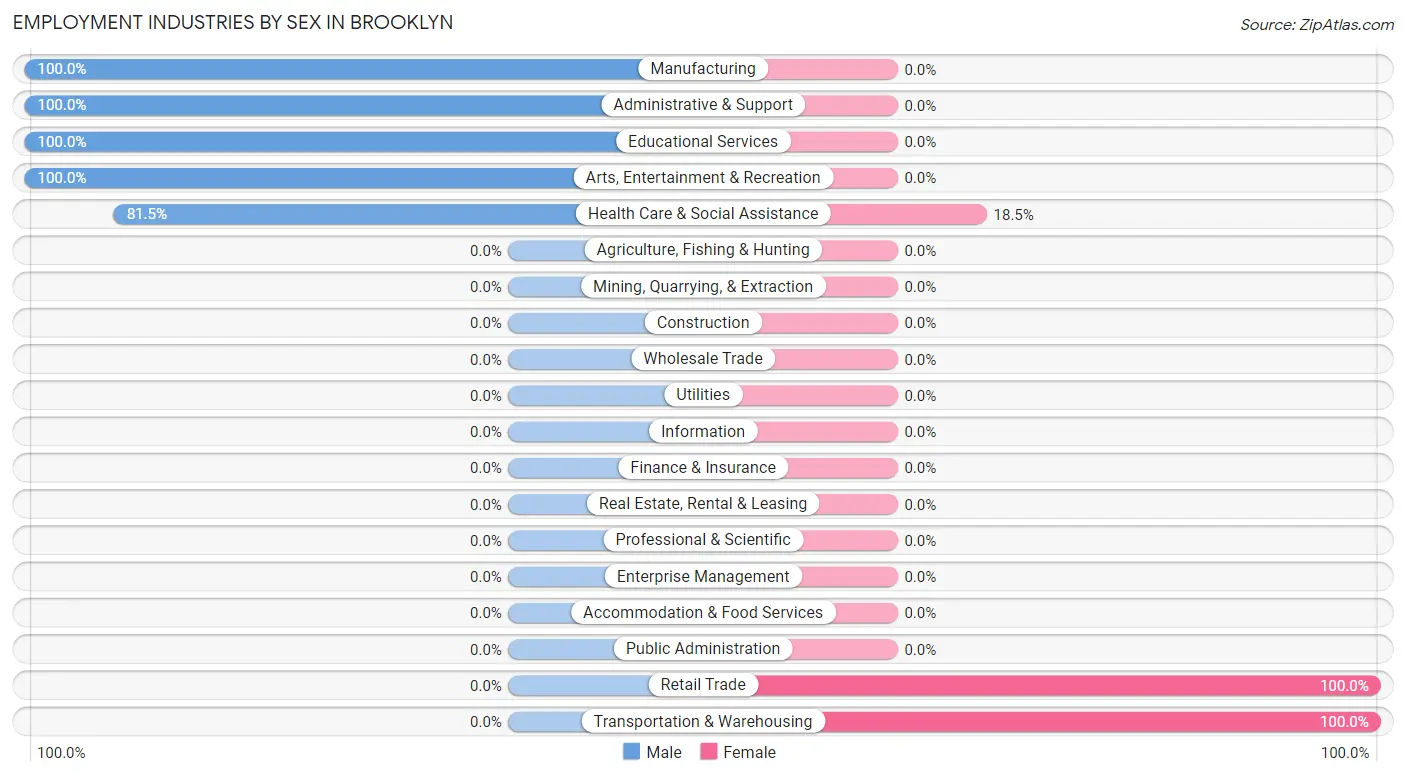
| Industry | Male | Female |
| Agriculture, Fishing & Hunting | 0 (0.0%) | 0 (0.0%) |
| Mining, Quarrying, & Extraction | 0 (0.0%) | 0 (0.0%) |
| Construction | 0 (0.0%) | 0 (0.0%) |
| Manufacturing | 79 (100.0%) | 0 (0.0%) |
| Wholesale Trade | 0 (0.0%) | 0 (0.0%) |
| Retail Trade | 0 (0.0%) | 64 (100.0%) |
| Transportation & Warehousing | 0 (0.0%) | 39 (100.0%) |
| Utilities | 0 (0.0%) | 0 (0.0%) |
| Information | 0 (0.0%) | 0 (0.0%) |
| Finance & Insurance | 0 (0.0%) | 0 (0.0%) |
| Real Estate, Rental & Leasing | 0 (0.0%) | 0 (0.0%) |
| Professional & Scientific | 0 (0.0%) | 0 (0.0%) |
| Enterprise Management | 0 (0.0%) | 0 (0.0%) |
| Administrative & Support | 30 (100.0%) | 0 (0.0%) |
| Educational Services | 18 (100.0%) | 0 (0.0%) |
| Health Care & Social Assistance | 53 (81.5%) | 12 (18.5%) |
| Arts, Entertainment & Recreation | 12 (100.0%) | 0 (0.0%) |
| Accommodation & Food Services | 0 (0.0%) | 0 (0.0%) |
| Public Administration | 0 (0.0%) | 0 (0.0%) |
| Total | 192 (62.5%) | 115 (37.5%) |
Education in Brooklyn
School Enrollment in Brooklyn
The most common levels of schooling among the 71 students in Brooklyn are college / undergraduate (63 | 88.7%), and graduate / professional (8 | 11.3%).
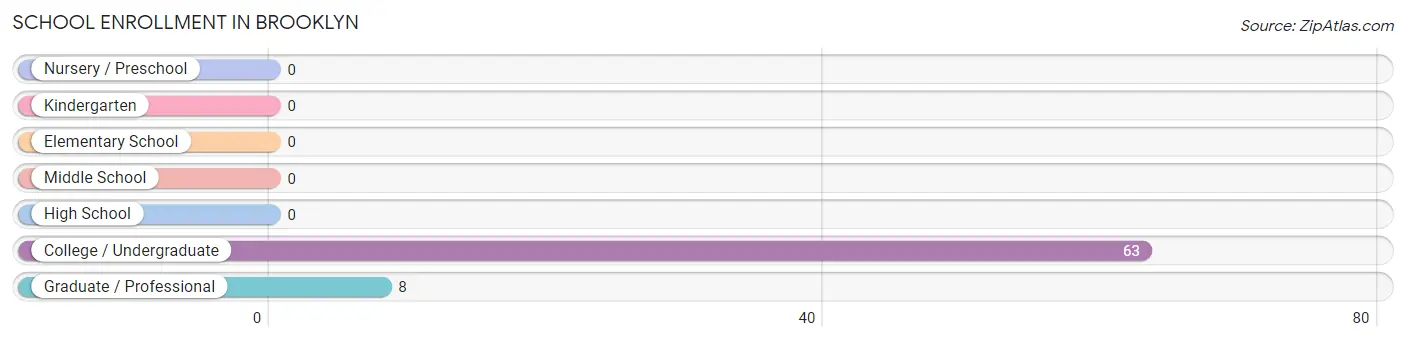
| School Level | # Students | % Students |
| Nursery / Preschool | 0 | 0.0% |
| Kindergarten | 0 | 0.0% |
| Elementary School | 0 | 0.0% |
| Middle School | 0 | 0.0% |
| High School | 0 | 0.0% |
| College / Undergraduate | 63 | 88.7% |
| Graduate / Professional | 8 | 11.3% |
| Total | 71 | 100.0% |
School Enrollment by Age by Funding Source in Brooklyn
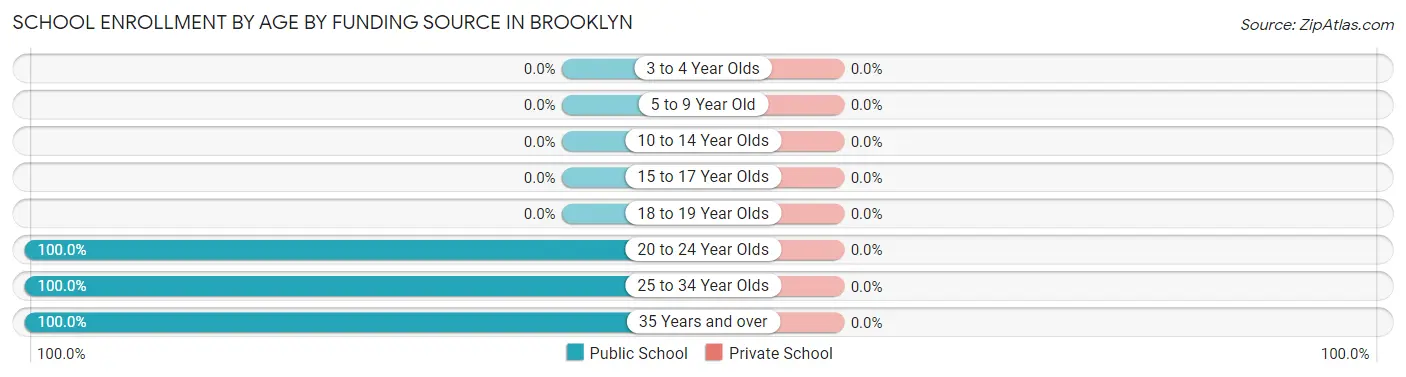
| Age Bracket | Public School | Private School |
| 3 to 4 Year Olds | 0 (0.0%) | 0 (0.0%) |
| 5 to 9 Year Old | 0 (0.0%) | 0 (0.0%) |
| 10 to 14 Year Olds | 0 (0.0%) | 0 (0.0%) |
| 15 to 17 Year Olds | 0 (0.0%) | 0 (0.0%) |
| 18 to 19 Year Olds | 0 (0.0%) | 0 (0.0%) |
| 20 to 24 Year Olds | 36 (100.0%) | 0 (0.0%) |
| 25 to 34 Year Olds | 19 (100.0%) | 0 (0.0%) |
| 35 Years and over | 16 (100.0%) | 0 (0.0%) |
| Total | 71 (100.0%) | 0 (0.0%) |
Educational Attainment by Field of Study in Brooklyn
Science & technology (47 | 38.8%), education (32 | 26.5%), business (15 | 12.4%), engineering (12 | 9.9%), and psychology (11 | 9.1%) are the most common fields of study among 121 individuals in Brooklyn who have obtained a bachelor's degree or higher.
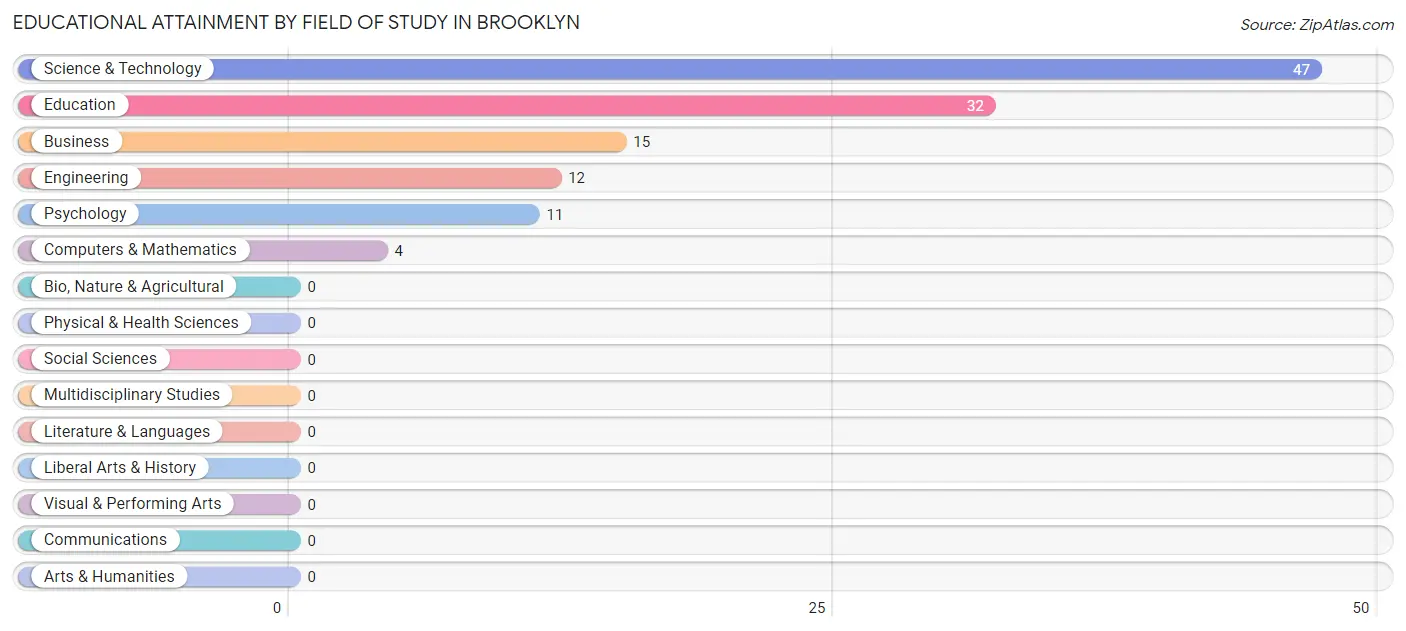
| Field of Study | # Graduates | % Graduates |
| Computers & Mathematics | 4 | 3.3% |
| Bio, Nature & Agricultural | 0 | 0.0% |
| Physical & Health Sciences | 0 | 0.0% |
| Psychology | 11 | 9.1% |
| Social Sciences | 0 | 0.0% |
| Engineering | 12 | 9.9% |
| Multidisciplinary Studies | 0 | 0.0% |
| Science & Technology | 47 | 38.8% |
| Business | 15 | 12.4% |
| Education | 32 | 26.5% |
| Literature & Languages | 0 | 0.0% |
| Liberal Arts & History | 0 | 0.0% |
| Visual & Performing Arts | 0 | 0.0% |
| Communications | 0 | 0.0% |
| Arts & Humanities | 0 | 0.0% |
| Total | 121 | 100.0% |
Transportation & Commute in Brooklyn
Vehicle Availability by Sex in Brooklyn
The most prevalent vehicle ownership categories in Brooklyn are males with 2 vehicles (91, accounting for 53.8%) and females with 2 vehicles (63, making up 119.7%).
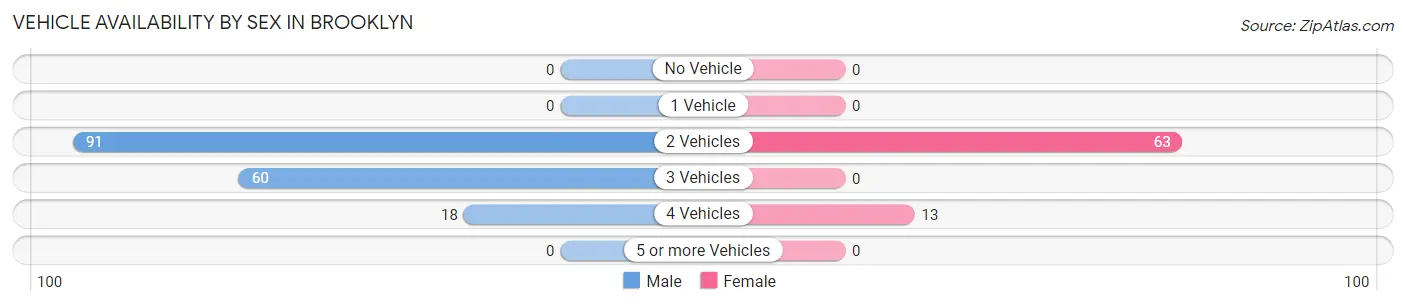
| Vehicles Available | Male | Female |
| No Vehicle | 0 (0.0%) | 0 (0.0%) |
| 1 Vehicle | 0 (0.0%) | 0 (0.0%) |
| 2 Vehicles | 91 (53.8%) | 63 (82.9%) |
| 3 Vehicles | 60 (35.5%) | 0 (0.0%) |
| 4 Vehicles | 18 (10.6%) | 13 (17.1%) |
| 5 or more Vehicles | 0 (0.0%) | 0 (0.0%) |
| Total | 169 (100.0%) | 76 (100.0%) |
Commute Time in Brooklyn
The most frequently occuring commute durations in Brooklyn are 15 to 19 minutes (63 commuters, 23.5%), 35 to 39 minutes (59 commuters, 22.0%), and 30 to 34 minutes (51 commuters, 19.0%).
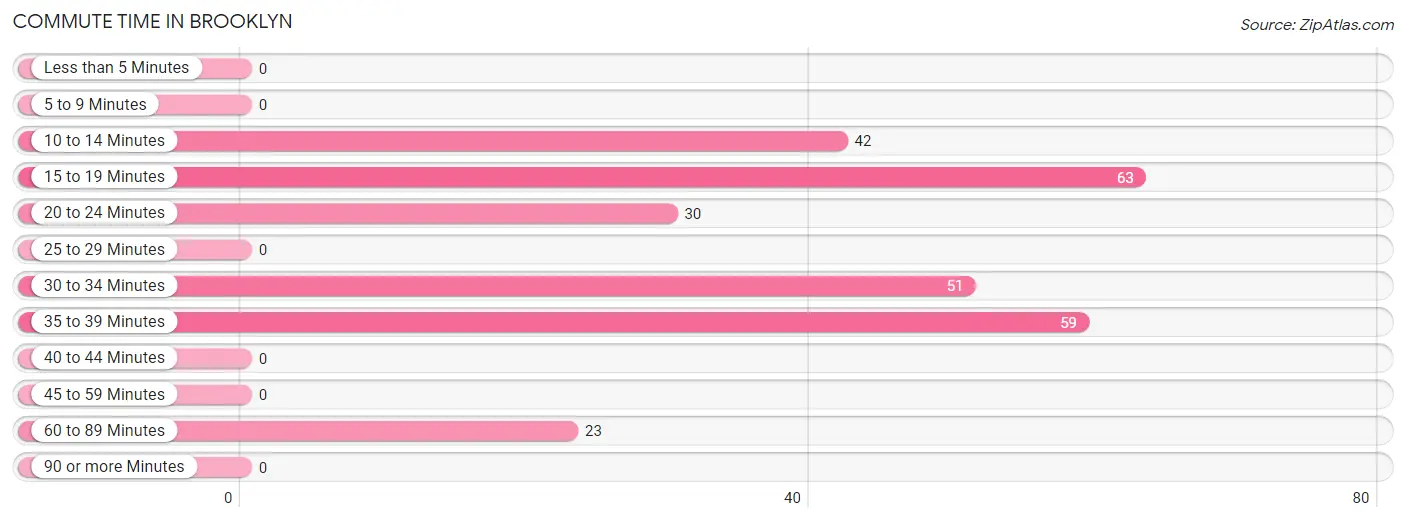
| Commute Time | # Commuters | % Commuters |
| Less than 5 Minutes | 0 | 0.0% |
| 5 to 9 Minutes | 0 | 0.0% |
| 10 to 14 Minutes | 42 | 15.7% |
| 15 to 19 Minutes | 63 | 23.5% |
| 20 to 24 Minutes | 30 | 11.2% |
| 25 to 29 Minutes | 0 | 0.0% |
| 30 to 34 Minutes | 51 | 19.0% |
| 35 to 39 Minutes | 59 | 22.0% |
| 40 to 44 Minutes | 0 | 0.0% |
| 45 to 59 Minutes | 0 | 0.0% |
| 60 to 89 Minutes | 23 | 8.6% |
| 90 or more Minutes | 0 | 0.0% |
Commute Time by Sex in Brooklyn
The most common commute times in Brooklyn are 35 to 39 minutes (59 commuters, 30.7%) for males and 30 to 34 minutes (51 commuters, 67.1%) for females.
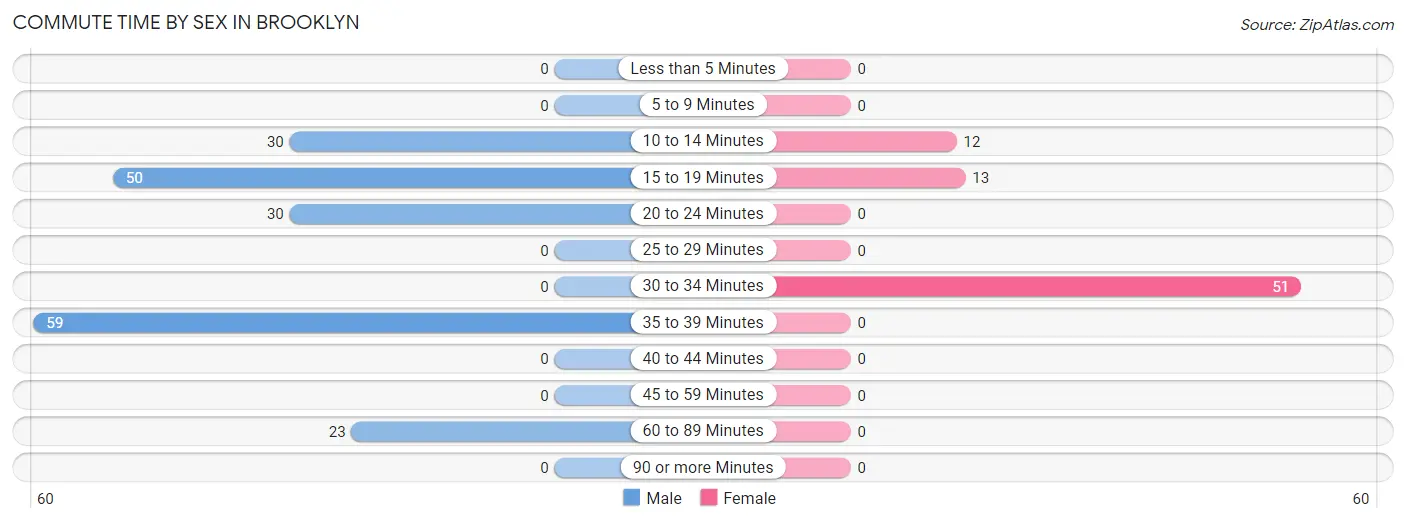
| Commute Time | Male | Female |
| Less than 5 Minutes | 0 (0.0%) | 0 (0.0%) |
| 5 to 9 Minutes | 0 (0.0%) | 0 (0.0%) |
| 10 to 14 Minutes | 30 (15.6%) | 12 (15.8%) |
| 15 to 19 Minutes | 50 (26.0%) | 13 (17.1%) |
| 20 to 24 Minutes | 30 (15.6%) | 0 (0.0%) |
| 25 to 29 Minutes | 0 (0.0%) | 0 (0.0%) |
| 30 to 34 Minutes | 0 (0.0%) | 51 (67.1%) |
| 35 to 39 Minutes | 59 (30.7%) | 0 (0.0%) |
| 40 to 44 Minutes | 0 (0.0%) | 0 (0.0%) |
| 45 to 59 Minutes | 0 (0.0%) | 0 (0.0%) |
| 60 to 89 Minutes | 23 (12.0%) | 0 (0.0%) |
| 90 or more Minutes | 0 (0.0%) | 0 (0.0%) |
Time of Departure to Work by Sex in Brooklyn
The most frequent times of departure to work in Brooklyn are 5:30 AM to 5:59 AM (80, 41.7%) for males and 12:00 PM to 3:59 PM (51, 67.1%) for females.
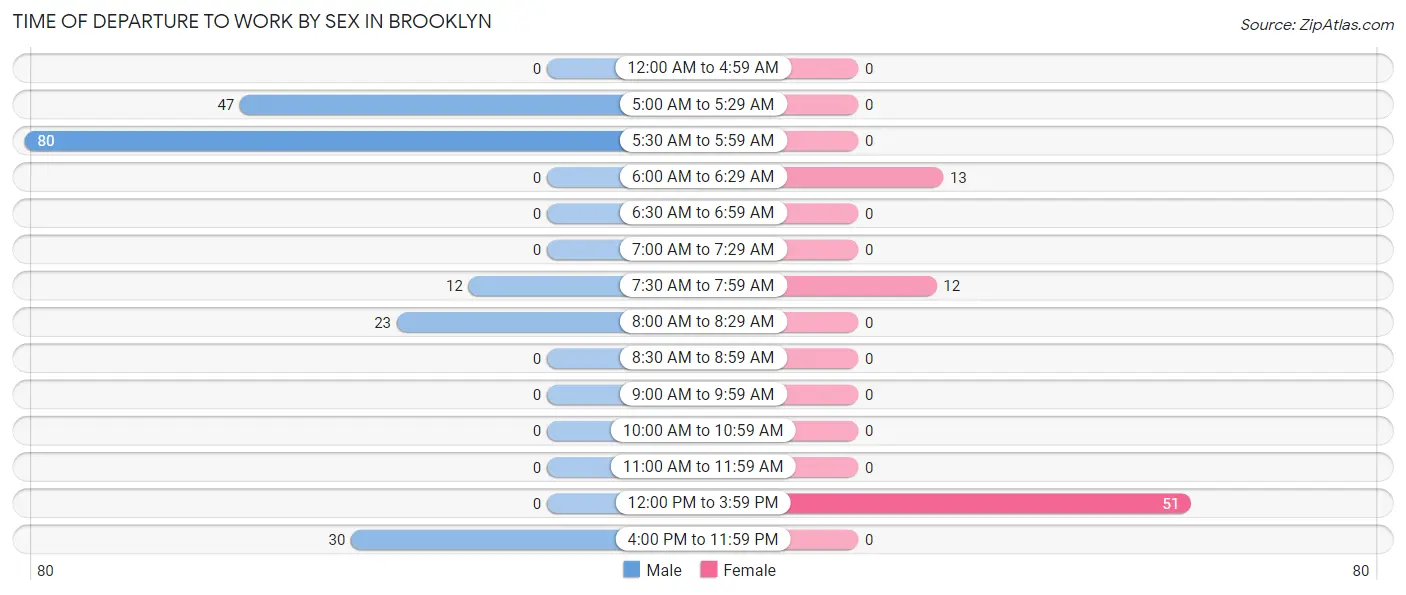
| Time of Departure | Male | Female |
| 12:00 AM to 4:59 AM | 0 (0.0%) | 0 (0.0%) |
| 5:00 AM to 5:29 AM | 47 (24.5%) | 0 (0.0%) |
| 5:30 AM to 5:59 AM | 80 (41.7%) | 0 (0.0%) |
| 6:00 AM to 6:29 AM | 0 (0.0%) | 13 (17.1%) |
| 6:30 AM to 6:59 AM | 0 (0.0%) | 0 (0.0%) |
| 7:00 AM to 7:29 AM | 0 (0.0%) | 0 (0.0%) |
| 7:30 AM to 7:59 AM | 12 (6.2%) | 12 (15.8%) |
| 8:00 AM to 8:29 AM | 23 (12.0%) | 0 (0.0%) |
| 8:30 AM to 8:59 AM | 0 (0.0%) | 0 (0.0%) |
| 9:00 AM to 9:59 AM | 0 (0.0%) | 0 (0.0%) |
| 10:00 AM to 10:59 AM | 0 (0.0%) | 0 (0.0%) |
| 11:00 AM to 11:59 AM | 0 (0.0%) | 0 (0.0%) |
| 12:00 PM to 3:59 PM | 0 (0.0%) | 51 (67.1%) |
| 4:00 PM to 11:59 PM | 30 (15.6%) | 0 (0.0%) |
| Total | 192 (100.0%) | 76 (100.0%) |
Housing Occupancy in Brooklyn
Occupancy by Ownership in Brooklyn
Of the total 218 dwellings in Brooklyn, owner-occupied units account for 101 (46.3%), while renter-occupied units make up 117 (53.7%).
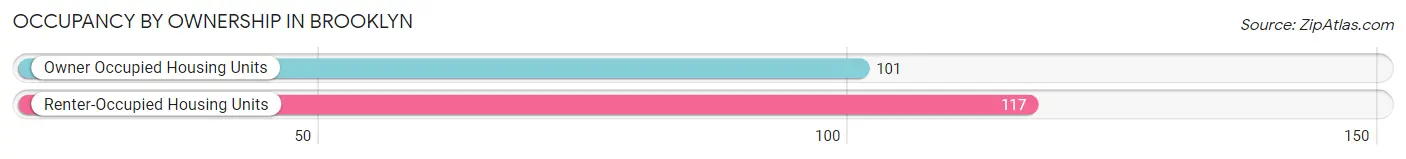
| Occupancy | # Housing Units | % Housing Units |
| Owner Occupied Housing Units | 101 | 46.3% |
| Renter-Occupied Housing Units | 117 | 53.7% |
| Total Occupied Housing Units | 218 | 100.0% |
Occupancy by Household Size in Brooklyn
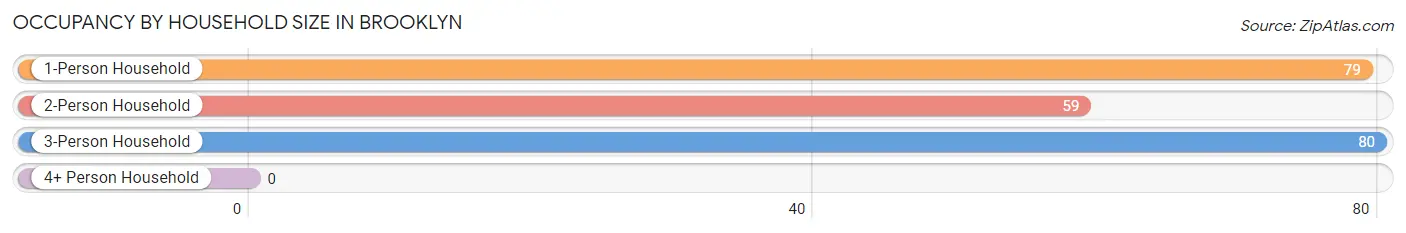
| Household Size | # Housing Units | % Housing Units |
| 1-Person Household | 79 | 36.2% |
| 2-Person Household | 59 | 27.1% |
| 3-Person Household | 80 | 36.7% |
| 4+ Person Household | 0 | 0.0% |
| Total Housing Units | 218 | 100.0% |
Occupancy by Ownership by Household Size in Brooklyn
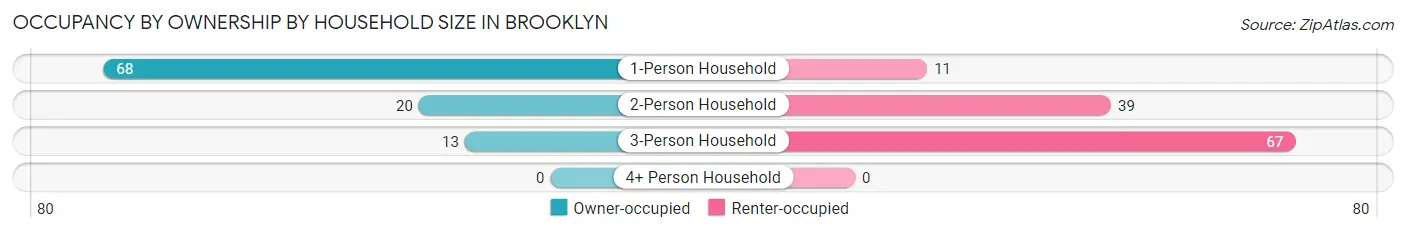
| Household Size | Owner-occupied | Renter-occupied |
| 1-Person Household | 68 (86.1%) | 11 (13.9%) |
| 2-Person Household | 20 (33.9%) | 39 (66.1%) |
| 3-Person Household | 13 (16.3%) | 67 (83.8%) |
| 4+ Person Household | 0 (0.0%) | 0 (0.0%) |
| Total Housing Units | 101 (46.3%) | 117 (53.7%) |
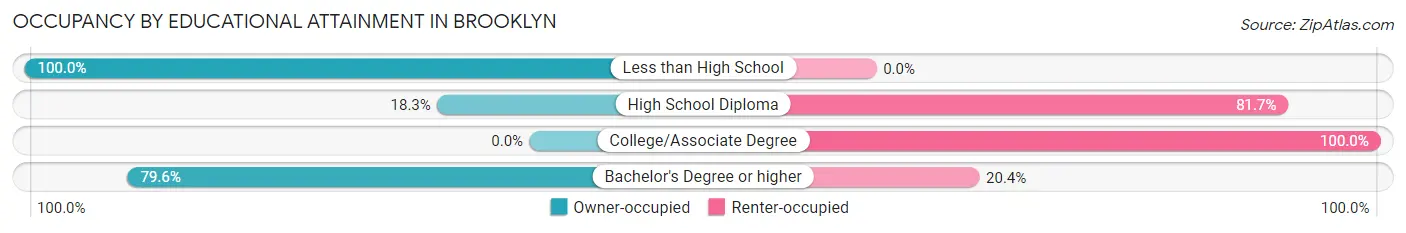
Occupancy by Educational Attainment in Brooklyn
| Household Size | Owner-occupied | Renter-occupied |
| Less than High School | 10 (100.0%) | 0 (0.0%) |
| High School Diploma | 13 (18.3%) | 58 (81.7%) |
| College/Associate Degree | 0 (0.0%) | 39 (100.0%) |
| Bachelor's Degree or higher | 78 (79.6%) | 20 (20.4%) |
Occupancy by Age of Householder in Brooklyn
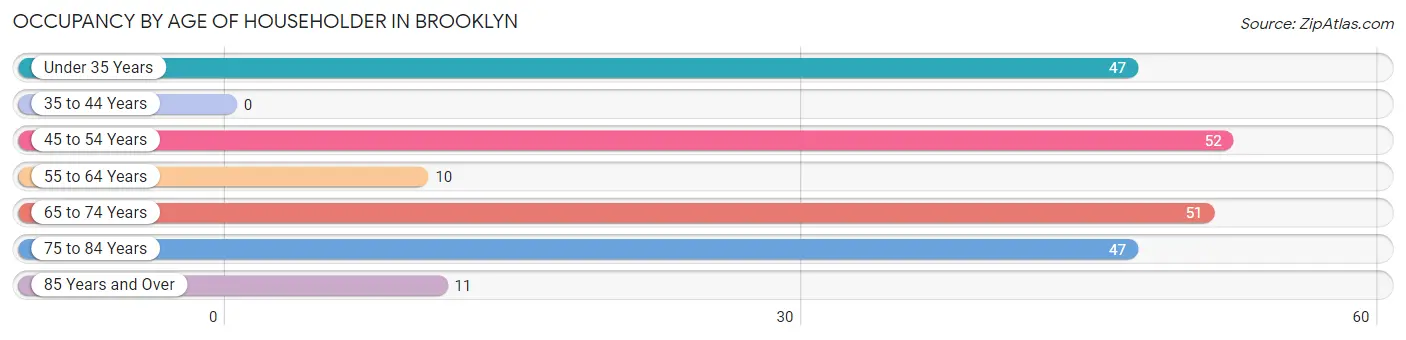
| Age Bracket | # Households | % Households |
| Under 35 Years | 47 | 21.6% |
| 35 to 44 Years | 0 | 0.0% |
| 45 to 54 Years | 52 | 23.8% |
| 55 to 64 Years | 10 | 4.6% |
| 65 to 74 Years | 51 | 23.4% |
| 75 to 84 Years | 47 | 21.6% |
| 85 Years and Over | 11 | 5.1% |
| Total | 218 | 100.0% |
Housing Finances in Brooklyn
Median Income by Occupancy in Brooklyn
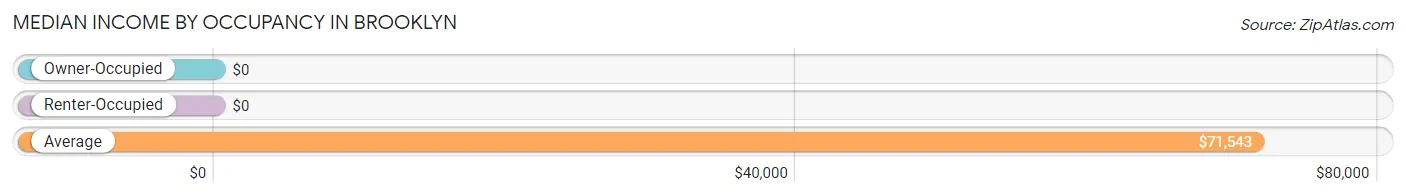
| Occupancy Type | # Households | Median Income |
| Owner-Occupied | 101 (46.3%) | $0 |
| Renter-Occupied | 117 (53.7%) | $0 |
| Average | 218 (100.0%) | $71,543 |
Occupancy by Householder Income Bracket in Brooklyn
| Income Bracket | Owner-occupied | Renter-occupied |
| Less than $5,000 | 0 (0.0%) | 0 (0.0%) |
| $5,000 to $9,999 | 0 (0.0%) | 0 (0.0%) |
| $10,000 to $14,999 | 10 (9.9%) | 0 (0.0%) |
| $15,000 to $19,999 | 0 (0.0%) | 0 (0.0%) |
| $20,000 to $24,999 | 0 (0.0%) | 0 (0.0%) |
| $25,000 to $34,999 | 39 (38.6%) | 11 (9.4%) |
| $35,000 to $49,999 | 0 (0.0%) | 0 (0.0%) |
| $50,000 to $74,999 | 0 (0.0%) | 67 (57.3%) |
| $75,000 to $99,999 | 21 (20.8%) | 0 (0.0%) |
| $100,000 to $149,999 | 23 (22.8%) | 0 (0.0%) |
| $150,000 or more | 8 (7.9%) | 39 (33.3%) |
| Total | 101 (100.0%) | 117 (100.0%) |
Monthly Housing Cost Tiers in Brooklyn
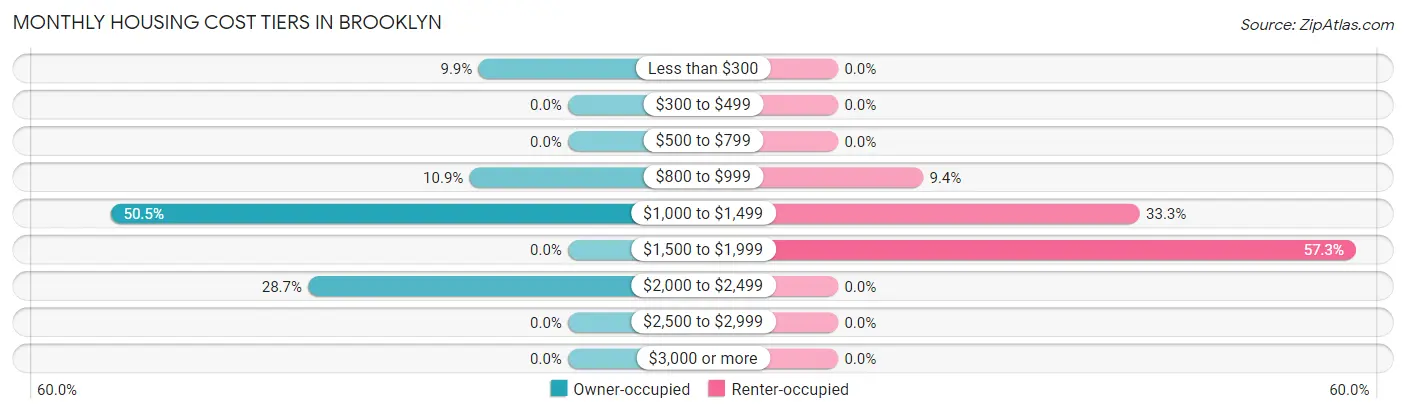
| Monthly Cost | Owner-occupied | Renter-occupied |
| Less than $300 | 10 (9.9%) | 0 (0.0%) |
| $300 to $499 | 0 (0.0%) | 0 (0.0%) |
| $500 to $799 | 0 (0.0%) | 0 (0.0%) |
| $800 to $999 | 11 (10.9%) | 11 (9.4%) |
| $1,000 to $1,499 | 51 (50.5%) | 39 (33.3%) |
| $1,500 to $1,999 | 0 (0.0%) | 67 (57.3%) |
| $2,000 to $2,499 | 29 (28.7%) | 0 (0.0%) |
| $2,500 to $2,999 | 0 (0.0%) | 0 (0.0%) |
| $3,000 or more | 0 (0.0%) | 0 (0.0%) |
| Total | 101 (100.0%) | 117 (100.0%) |
Physical Housing Characteristics in Brooklyn
Housing Structures in Brooklyn
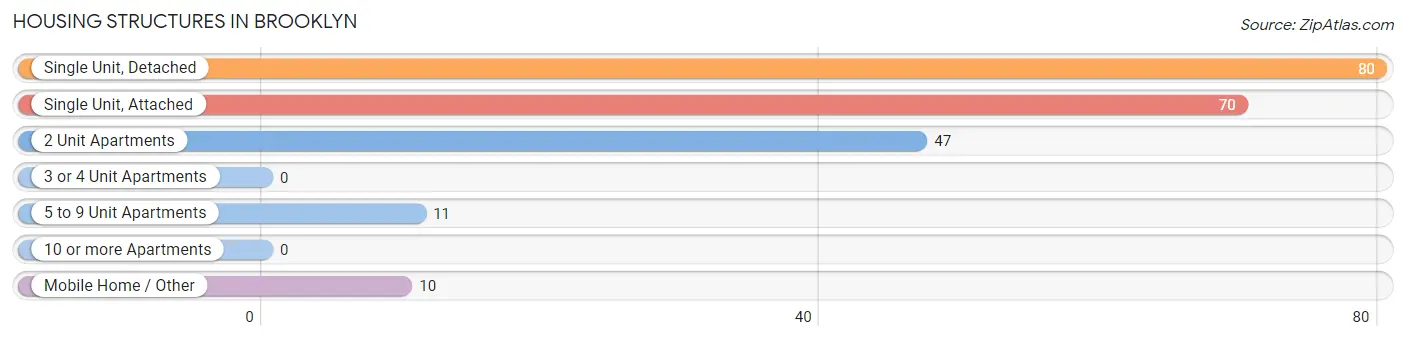
| Structure Type | # Housing Units | % Housing Units |
| Single Unit, Detached | 80 | 36.7% |
| Single Unit, Attached | 70 | 32.1% |
| 2 Unit Apartments | 47 | 21.6% |
| 3 or 4 Unit Apartments | 0 | 0.0% |
| 5 to 9 Unit Apartments | 11 | 5.1% |
| 10 or more Apartments | 0 | 0.0% |
| Mobile Home / Other | 10 | 4.6% |
| Total | 218 | 100.0% |
Housing Structures by Occupancy in Brooklyn
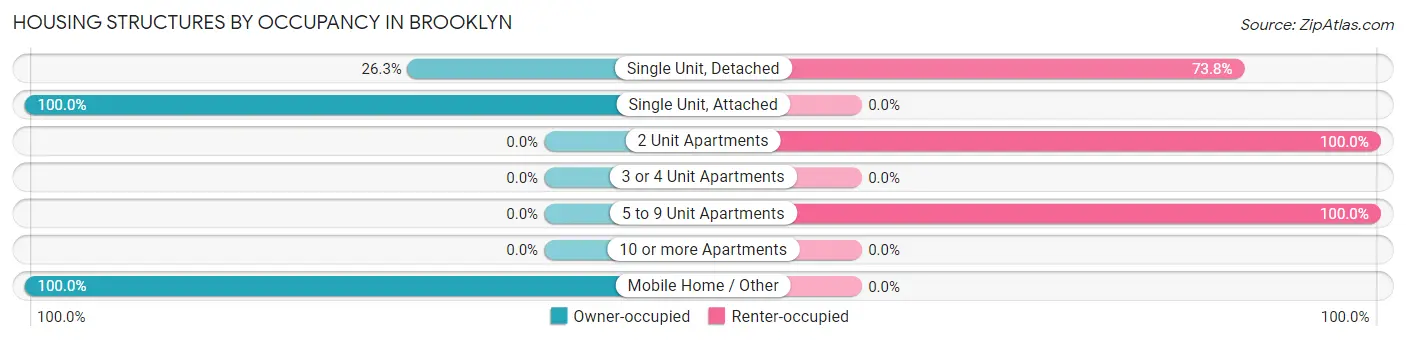
| Structure Type | Owner-occupied | Renter-occupied |
| Single Unit, Detached | 21 (26.3%) | 59 (73.8%) |
| Single Unit, Attached | 70 (100.0%) | 0 (0.0%) |
| 2 Unit Apartments | 0 (0.0%) | 47 (100.0%) |
| 3 or 4 Unit Apartments | 0 (0.0%) | 0 (0.0%) |
| 5 to 9 Unit Apartments | 0 (0.0%) | 11 (100.0%) |
| 10 or more Apartments | 0 (0.0%) | 0 (0.0%) |
| Mobile Home / Other | 10 (100.0%) | 0 (0.0%) |
| Total | 101 (46.3%) | 117 (53.7%) |
Housing Structures by Number of Rooms in Brooklyn
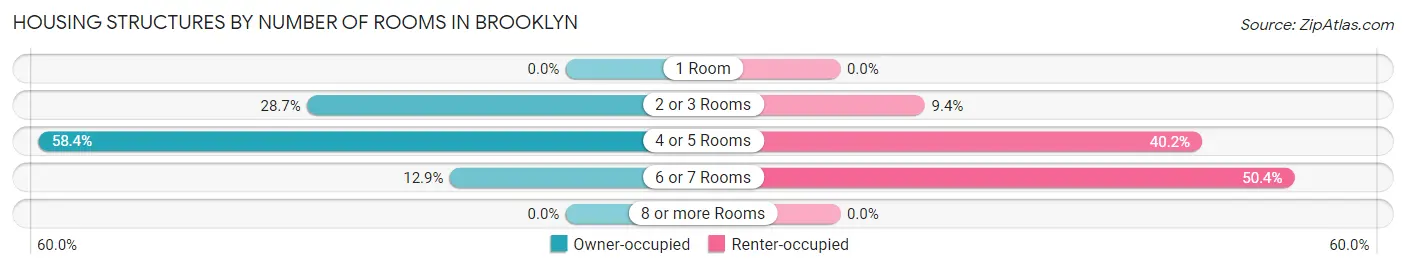
| Number of Rooms | Owner-occupied | Renter-occupied |
| 1 Room | 0 (0.0%) | 0 (0.0%) |
| 2 or 3 Rooms | 29 (28.7%) | 11 (9.4%) |
| 4 or 5 Rooms | 59 (58.4%) | 47 (40.2%) |
| 6 or 7 Rooms | 13 (12.9%) | 59 (50.4%) |
| 8 or more Rooms | 0 (0.0%) | 0 (0.0%) |
| Total | 101 (100.0%) | 117 (100.0%) |
Housing Structure by Heating Type in Brooklyn
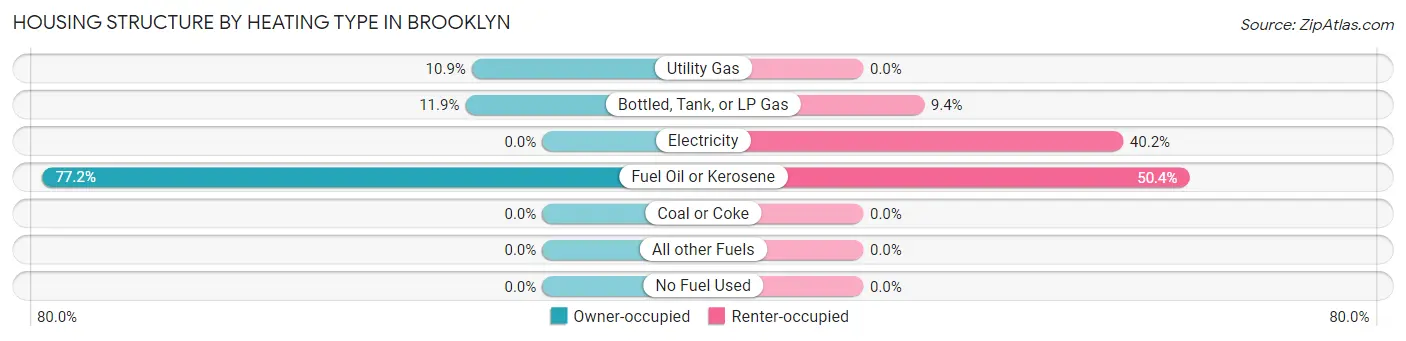
| Heating Type | Owner-occupied | Renter-occupied |
| Utility Gas | 11 (10.9%) | 0 (0.0%) |
| Bottled, Tank, or LP Gas | 12 (11.9%) | 11 (9.4%) |
| Electricity | 0 (0.0%) | 47 (40.2%) |
| Fuel Oil or Kerosene | 78 (77.2%) | 59 (50.4%) |
| Coal or Coke | 0 (0.0%) | 0 (0.0%) |
| All other Fuels | 0 (0.0%) | 0 (0.0%) |
| No Fuel Used | 0 (0.0%) | 0 (0.0%) |
| Total | 101 (100.0%) | 117 (100.0%) |
Household Vehicle Usage in Brooklyn
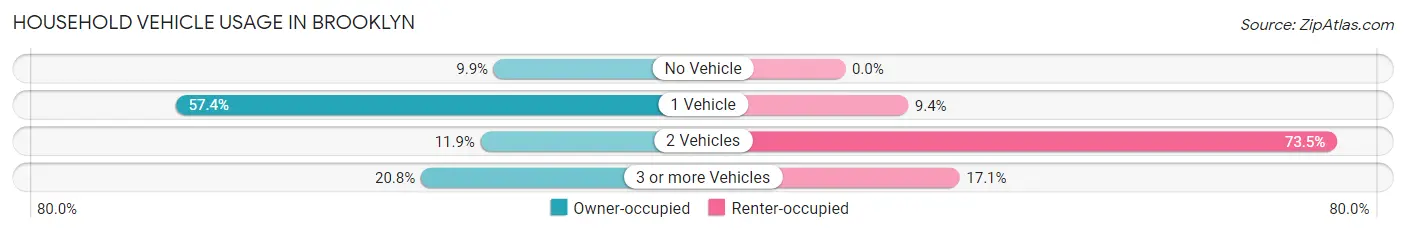
| Vehicles per Household | Owner-occupied | Renter-occupied |
| No Vehicle | 10 (9.9%) | 0 (0.0%) |
| 1 Vehicle | 58 (57.4%) | 11 (9.4%) |
| 2 Vehicles | 12 (11.9%) | 86 (73.5%) |
| 3 or more Vehicles | 21 (20.8%) | 20 (17.1%) |
| Total | 101 (100.0%) | 117 (100.0%) |
Real Estate & Mortgages in Brooklyn
Real Estate and Mortgage Overview in Brooklyn
| Characteristic | Without Mortgage | With Mortgage |
| Housing Units | 72 | 29 |
| Median Property Value | $233,300 | $275,000 |
| Median Household Income | - | - |
| Monthly Housing Costs | $1,029 | $0 |
| Real Estate Taxes | $4,520 | $0 |
Property Value by Mortgage Status in Brooklyn
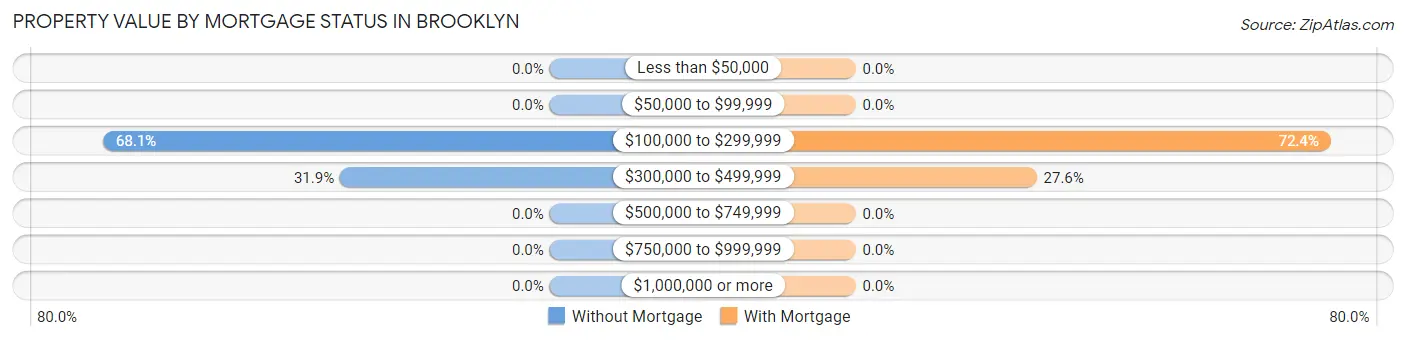
| Property Value | Without Mortgage | With Mortgage |
| Less than $50,000 | 0 (0.0%) | 0 (0.0%) |
| $50,000 to $99,999 | 0 (0.0%) | 0 (0.0%) |
| $100,000 to $299,999 | 49 (68.1%) | 21 (72.4%) |
| $300,000 to $499,999 | 23 (31.9%) | 8 (27.6%) |
| $500,000 to $749,999 | 0 (0.0%) | 0 (0.0%) |
| $750,000 to $999,999 | 0 (0.0%) | 0 (0.0%) |
| $1,000,000 or more | 0 (0.0%) | 0 (0.0%) |
| Total | 72 (100.0%) | 29 (100.0%) |
Household Income by Mortgage Status in Brooklyn
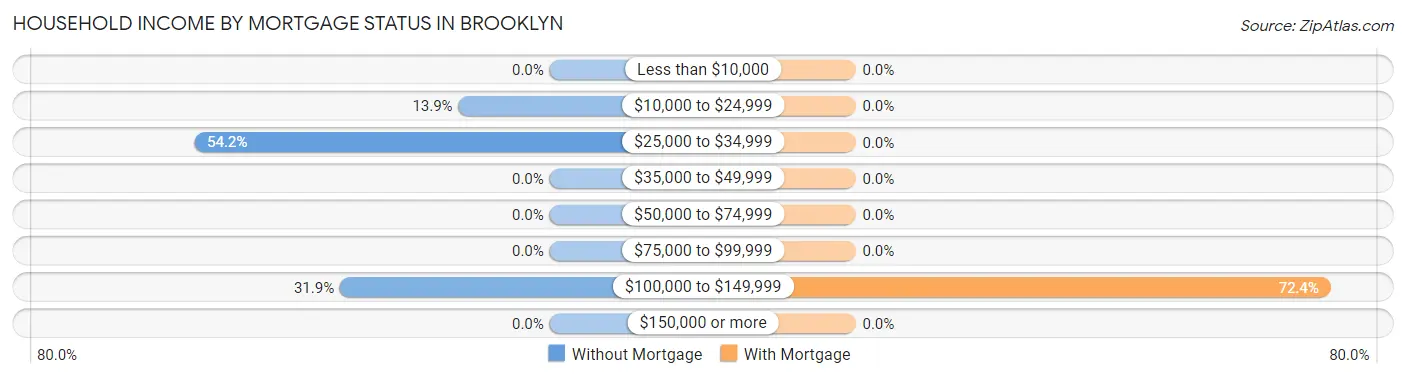
| Household Income | Without Mortgage | With Mortgage |
| Less than $10,000 | 0 (0.0%) | 0 (0.0%) |
| $10,000 to $24,999 | 10 (13.9%) | 0 (0.0%) |
| $25,000 to $34,999 | 39 (54.2%) | 0 (0.0%) |
| $35,000 to $49,999 | 0 (0.0%) | 0 (0.0%) |
| $50,000 to $74,999 | 0 (0.0%) | 0 (0.0%) |
| $75,000 to $99,999 | 0 (0.0%) | 0 (0.0%) |
| $100,000 to $149,999 | 23 (31.9%) | 21 (72.4%) |
| $150,000 or more | 0 (0.0%) | 0 (0.0%) |
| Total | 72 (100.0%) | 29 (100.0%) |
Property Value to Household Income Ratio in Brooklyn
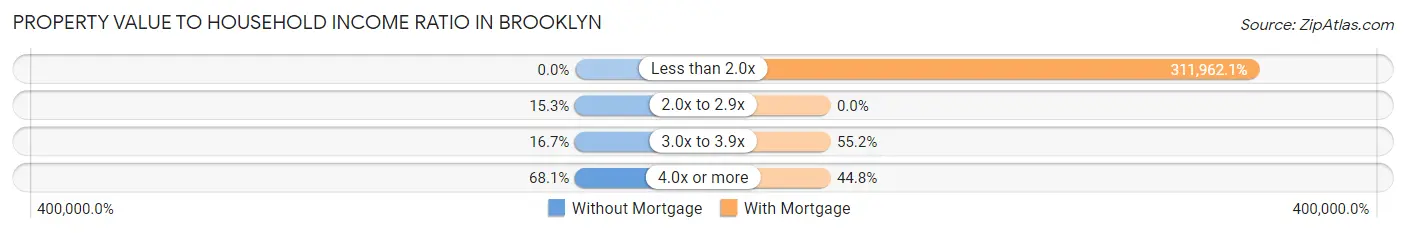
| Value-to-Income Ratio | Without Mortgage | With Mortgage |
| Less than 2.0x | 0 (0.0%) | 90,469 (311,962.1%) |
| 2.0x to 2.9x | 11 (15.3%) | 0 (0.0%) |
| 3.0x to 3.9x | 12 (16.7%) | 16 (55.2%) |
| 4.0x or more | 49 (68.1%) | 13 (44.8%) |
| Total | 72 (100.0%) | 29 (100.0%) |
Real Estate Taxes by Mortgage Status in Brooklyn
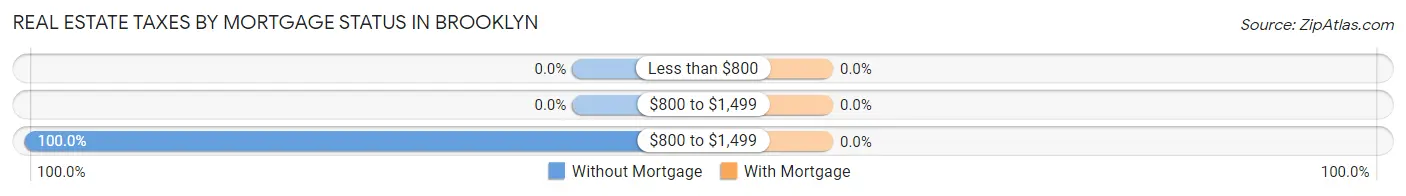
| Property Taxes | Without Mortgage | With Mortgage |
| Less than $800 | 0 (0.0%) | 0 (0.0%) |
| $800 to $1,499 | 0 (0.0%) | 0 (0.0%) |
| $800 to $1,499 | 72 (100.0%) | 0 (0.0%) |
| Total | 72 (100.0%) | 29 (100.0%) |
Health & Disability in Brooklyn
Health Insurance Coverage by Age in Brooklyn
| Age Bracket | With Coverage | Without Coverage |
| Under 6 Years | 15 (100.0%) | 0 (0.0%) |
| 6 to 18 Years | 0 (0.0%) | 0 (0.0%) |
| 19 to 25 Years | 176 (100.0%) | 0 (0.0%) |
| 26 to 34 Years | 0 (0.0%) | 0 (0.0%) |
| 35 to 44 Years | 0 (0.0%) | 0 (0.0%) |
| 45 to 54 Years | 123 (100.0%) | 0 (0.0%) |
| 55 to 64 Years | 32 (100.0%) | 0 (0.0%) |
| 65 to 74 Years | 71 (100.0%) | 0 (0.0%) |
| 75 Years and older | 58 (100.0%) | 0 (0.0%) |
| Total | 475 (100.0%) | 0 (0.0%) |
Health Insurance Coverage by Citizenship Status in Brooklyn
| Citizenship Status | With Coverage | Without Coverage |
| Native Born | 15 (100.0%) | 0 (0.0%) |
| Foreign Born, Citizen | 0 (0.0%) | 0 (0.0%) |
| Foreign Born, not a Citizen | 176 (100.0%) | 0 (0.0%) |
Health Insurance Coverage by Household Income in Brooklyn
| Household Income | With Coverage | Without Coverage |
| Under $25,000 | 10 (100.0%) | 0 (0.0%) |
| $25,000 to $49,999 | 50 (100.0%) | 0 (0.0%) |
| $50,000 to $74,999 | 193 (100.0%) | 0 (0.0%) |
| $75,000 to $99,999 | 55 (100.0%) | 0 (0.0%) |
| $100,000 and over | 122 (100.0%) | 0 (0.0%) |
Public vs Private Health Insurance Coverage by Age in Brooklyn
| Age Bracket | Public Insurance | Private Insurance |
| Under 6 | 15 (100.0%) | 0 (0.0%) |
| 6 to 18 Years | 0 (0.0%) | 0 (0.0%) |
| 19 to 25 Years | 30 (17.1%) | 176 (100.0%) |
| 25 to 34 Years | 0 (0.0%) | 0 (0.0%) |
| 35 to 44 Years | 0 (0.0%) | 0 (0.0%) |
| 45 to 54 Years | 39 (31.7%) | 100 (81.3%) |
| 55 to 64 Years | 32 (100.0%) | 0 (0.0%) |
| 65 to 74 Years | 71 (100.0%) | 48 (67.6%) |
| 75 Years and over | 58 (100.0%) | 58 (100.0%) |
| Total | 245 (51.6%) | 382 (80.4%) |
Disability Status by Sex by Age in Brooklyn
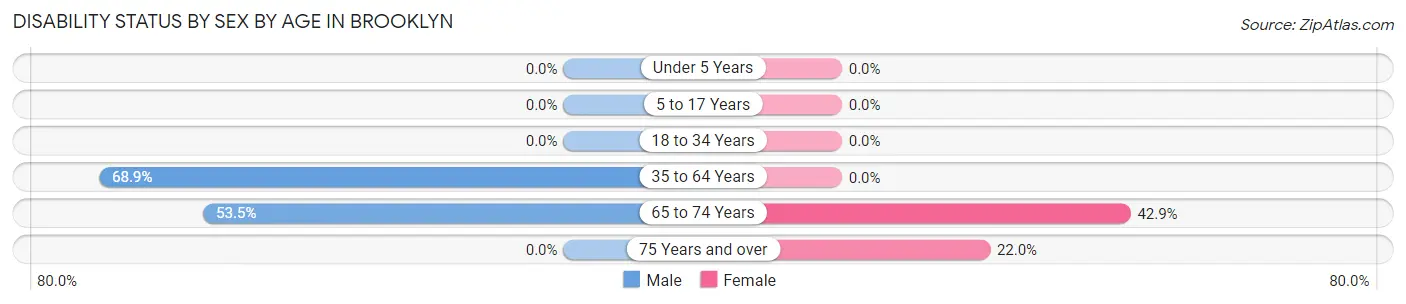
| Age Bracket | Male | Female |
| Under 5 Years | 0 (0.0%) | 0 (0.0%) |
| 5 to 17 Years | 0 (0.0%) | 0 (0.0%) |
| 18 to 34 Years | 0 (0.0%) | 0 (0.0%) |
| 35 to 64 Years | 71 (68.9%) | 0 (0.0%) |
| 65 to 74 Years | 23 (53.5%) | 12 (42.9%) |
| 75 Years and over | 0 (0.0%) | 11 (22.0%) |
Disability Class by Sex by Age in Brooklyn
Disability Class: Hearing Difficulty
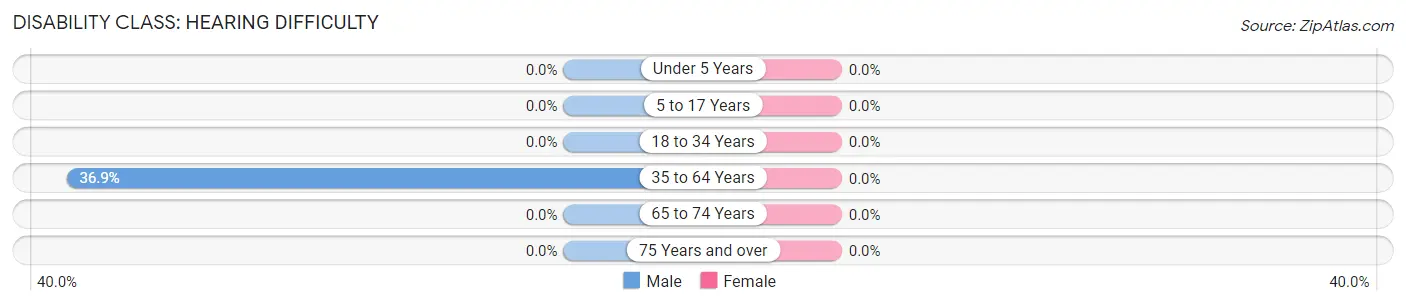
| Age Bracket | Male | Female |
| Under 5 Years | 0 (0.0%) | 0 (0.0%) |
| 5 to 17 Years | 0 (0.0%) | 0 (0.0%) |
| 18 to 34 Years | 0 (0.0%) | 0 (0.0%) |
| 35 to 64 Years | 38 (36.9%) | 0 (0.0%) |
| 65 to 74 Years | 0 (0.0%) | 0 (0.0%) |
| 75 Years and over | 0 (0.0%) | 0 (0.0%) |
Disability Class: Vision Difficulty
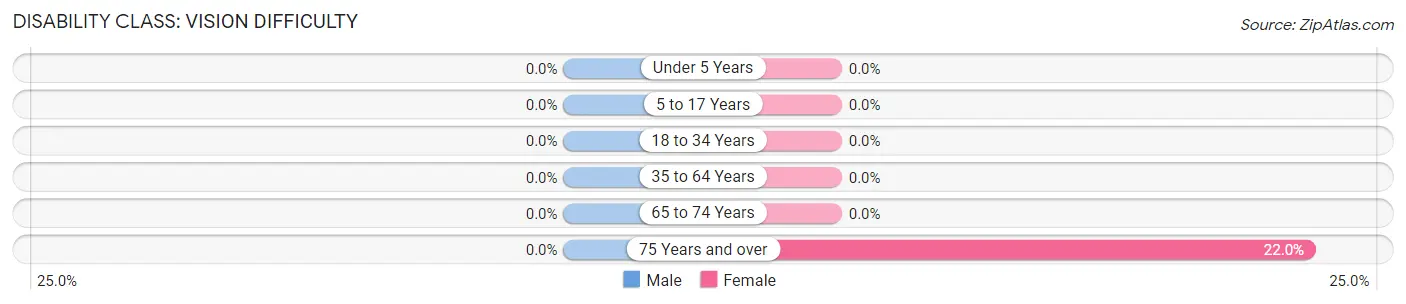
| Age Bracket | Male | Female |
| Under 5 Years | 0 (0.0%) | 0 (0.0%) |
| 5 to 17 Years | 0 (0.0%) | 0 (0.0%) |
| 18 to 34 Years | 0 (0.0%) | 0 (0.0%) |
| 35 to 64 Years | 0 (0.0%) | 0 (0.0%) |
| 65 to 74 Years | 0 (0.0%) | 0 (0.0%) |
| 75 Years and over | 0 (0.0%) | 11 (22.0%) |
Disability Class: Cognitive Difficulty
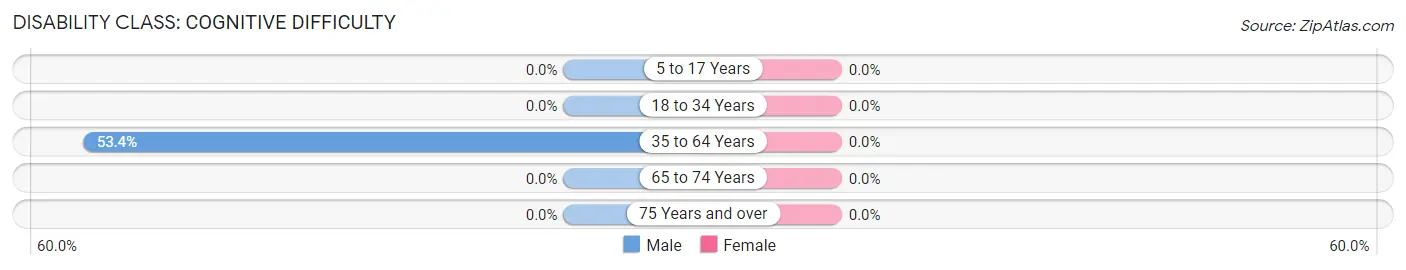
| Age Bracket | Male | Female |
| 5 to 17 Years | 0 (0.0%) | 0 (0.0%) |
| 18 to 34 Years | 0 (0.0%) | 0 (0.0%) |
| 35 to 64 Years | 55 (53.4%) | 0 (0.0%) |
| 65 to 74 Years | 0 (0.0%) | 0 (0.0%) |
| 75 Years and over | 0 (0.0%) | 0 (0.0%) |
Disability Class: Ambulatory Difficulty
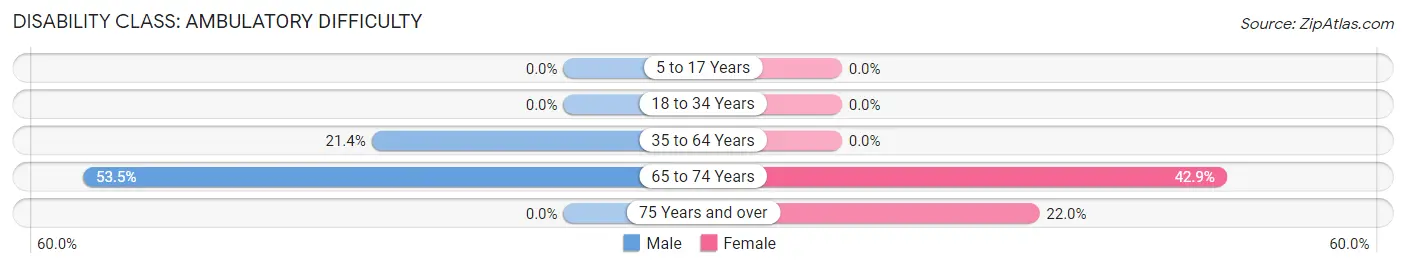
| Age Bracket | Male | Female |
| 5 to 17 Years | 0 (0.0%) | 0 (0.0%) |
| 18 to 34 Years | 0 (0.0%) | 0 (0.0%) |
| 35 to 64 Years | 22 (21.4%) | 0 (0.0%) |
| 65 to 74 Years | 23 (53.5%) | 12 (42.9%) |
| 75 Years and over | 0 (0.0%) | 11 (22.0%) |
Disability Class: Self-Care Difficulty
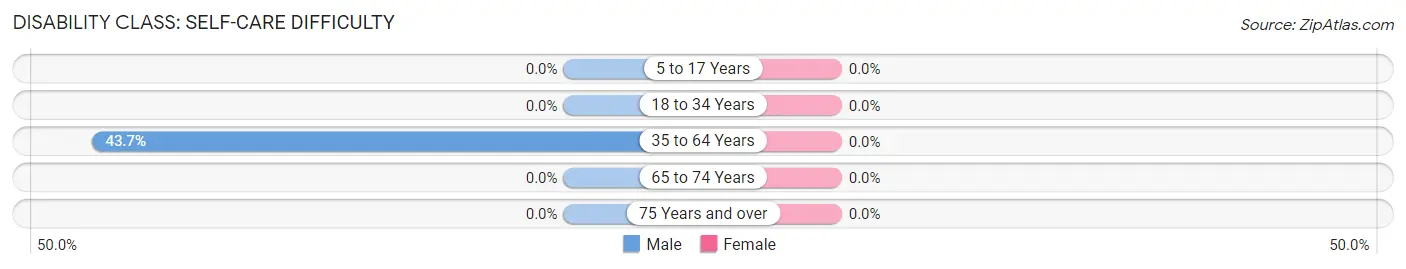
| Age Bracket | Male | Female |
| 5 to 17 Years | 0 (0.0%) | 0 (0.0%) |
| 18 to 34 Years | 0 (0.0%) | 0 (0.0%) |
| 35 to 64 Years | 45 (43.7%) | 0 (0.0%) |
| 65 to 74 Years | 0 (0.0%) | 0 (0.0%) |
| 75 Years and over | 0 (0.0%) | 0 (0.0%) |
Technology Access in Brooklyn
Computing Device Access in Brooklyn
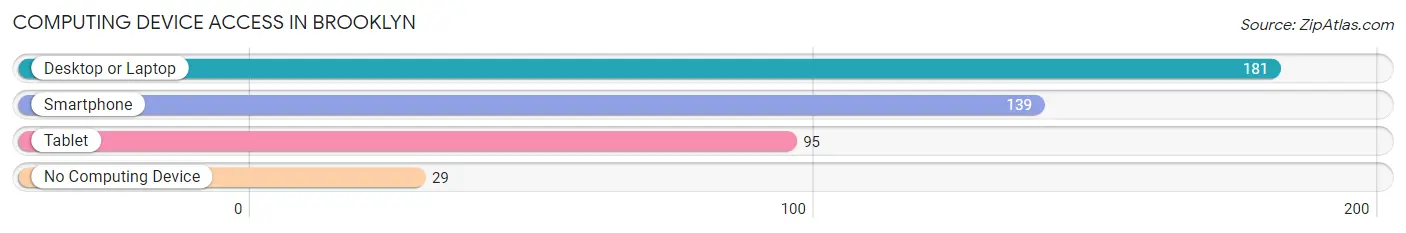
| Device Type | # Households | % Households |
| Desktop or Laptop | 181 | 83.0% |
| Smartphone | 139 | 63.8% |
| Tablet | 95 | 43.6% |
| No Computing Device | 29 | 13.3% |
| Total | 218 | 100.0% |
Internet Access in Brooklyn
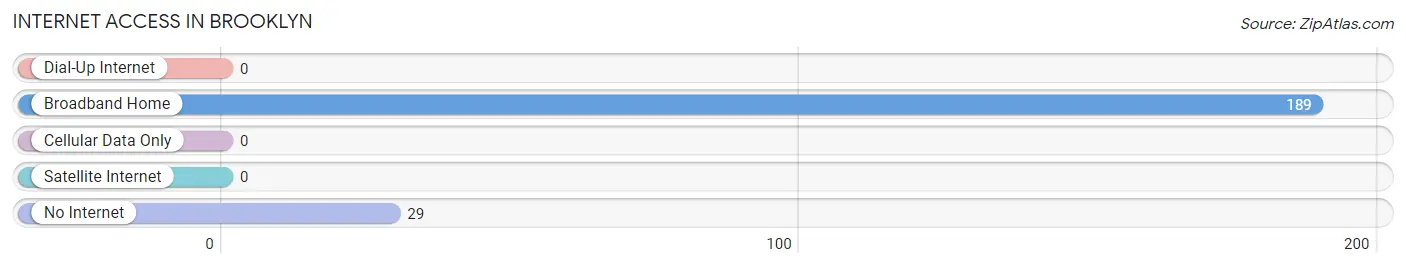
| Internet Type | # Households | % Households |
| Dial-Up Internet | 0 | 0.0% |
| Broadband Home | 189 | 86.7% |
| Cellular Data Only | 0 | 0.0% |
| Satellite Internet | 0 | 0.0% |
| No Internet | 29 | 13.3% |
| Total | 218 | 100.0% |
Brooklyn Summary
Brooklyn, Connecticut is a small town located in Windham County in the northeastern part of the state. It is bordered by the towns of Canterbury, Pomfret, and Hampton. The town has a population of approximately 8,000 people and covers an area of about 28 square miles.
History
The area that is now Brooklyn was originally inhabited by the Mohegan Indians. The first European settlers arrived in the area in the early 1700s. The town was incorporated in 1786 and was named after the Dutch city of Breukelen. The town was primarily an agricultural community, with the main crops being corn, wheat, and hay.
In the 19th century, the town became a popular summer resort destination. The town was home to several large hotels, including the Brooklyn House, which was built in 1845. The town also had several factories, including a paper mill, a grist mill, and a saw mill.
Geography
Brooklyn is located in the northeastern part of Connecticut, in Windham County. It is bordered by the towns of Canterbury, Pomfret, and Hampton. The town is located in the Quinebaug River Valley, which is part of the Connecticut River Valley. The town is mostly rural, with rolling hills and forests. The highest point in the town is the summit of Mount Riga, which is 890 feet above sea level.
Economy
The economy of Brooklyn is primarily based on agriculture and tourism. The town is home to several farms, which produce a variety of crops, including corn, wheat, hay, and vegetables. The town is also home to several wineries, which produce a variety of wines.
The town is also home to several small businesses, including restaurants, retail stores, and professional services. The town is also home to several manufacturing companies, including a paper mill, a grist mill, and a saw mill.
Demographics
As of the 2010 census, the population of Brooklyn was 8,210. The racial makeup of the town was 94.3% White, 1.7% African American, 0.3% Native American, 0.7% Asian, 0.1% Pacific Islander, 1.2% from other races, and 1.9% from two or more races. Hispanic or Latino of any race were 3.3% of the population.
The median household income in Brooklyn was $60,972, and the median family income was $71,944. The per capita income for the town was $27,945. About 5.3% of families and 7.2% of the population were below the poverty line, including 8.3% of those under age 18 and 5.2% of those age 65 or over.
Common Questions
What is Per Capita Income in Brooklyn?
Per Capita income in Brooklyn is $33,738.
What is the Median Household income in Brooklyn?
Median Household Income in Brooklyn is $71,543.
What is Inequality or Gini Index in Brooklyn?
Inequality or Gini Index in Brooklyn is 0.51.
What is the Total Population of Brooklyn?
Total Population of Brooklyn is 886.
What is the Total Male Population of Brooklyn?
Total Male Population of Brooklyn is 629.
What is the Total Female Population of Brooklyn?
Total Female Population of Brooklyn is 257.
What is the Ratio of Males per 100 Females in Brooklyn?
There are 244.75 Males per 100 Females in Brooklyn.
What is the Ratio of Females per 100 Males in Brooklyn?
There are 40.86 Females per 100 Males in Brooklyn.
What is the Median Population Age in Brooklyn?
Median Population Age in Brooklyn is 42.8 Years.
What is the Average Family Size in Brooklyn
Average Family Size in Brooklyn is 2.5 People.
What is the Average Household Size in Brooklyn
Average Household Size in Brooklyn is 2.0 People.
How Large is the Labor Force in Brooklyn?
There are 307 People in the Labor Forcein in Brooklyn.
What is the Percentage of People in the Labor Force in Brooklyn?
35.2% of People are in the Labor Force in Brooklyn.