Plantsville, CT Map & Demographics
Plantsville Map
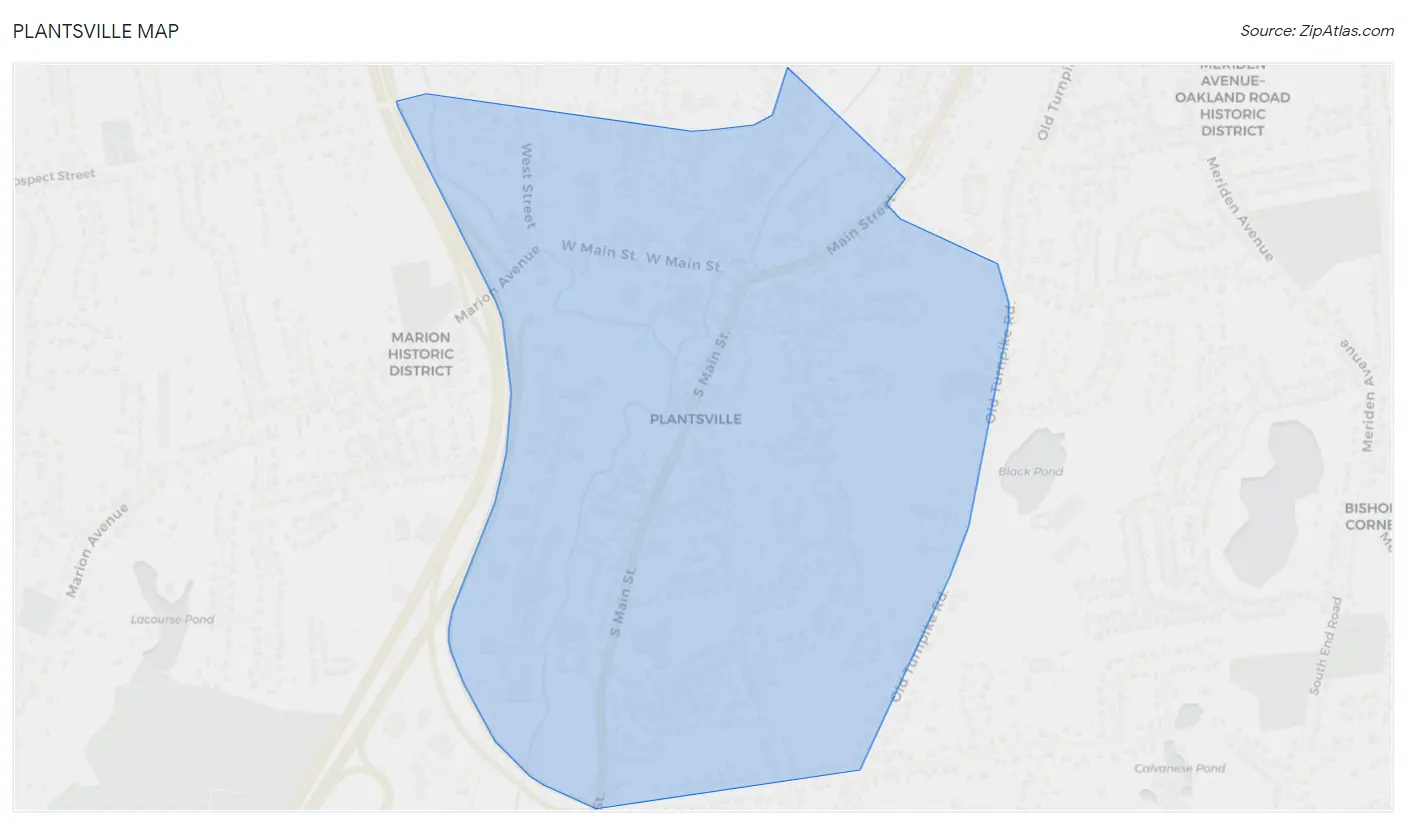
Plantsville Overview
$46,959
PER CAPITA INCOME
$107,358
AVG FAMILY INCOME
$105,674
AVG HOUSEHOLD INCOME
17.6%
WAGE / INCOME GAP [ % ]
82.4¢/ $1
WAGE / INCOME GAP [ $ ]
0.36
INEQUALITY / GINI INDEX
2,084
TOTAL POPULATION
892
MALE POPULATION
1,192
FEMALE POPULATION
74.83
MALES / 100 FEMALES
133.63
FEMALES / 100 MALES
53.8
MEDIAN AGE
2.6
AVG FAMILY SIZE
2.1
AVG HOUSEHOLD SIZE
1,185
LABOR FORCE [ PEOPLE ]
66.7%
PERCENT IN LABOR FORCE
2.4%
UNEMPLOYMENT RATE
Plantsville Zip Codes
Plantsville Area Codes
Income in Plantsville
Income Overview in Plantsville
Per Capita Income in Plantsville is $46,959, while median incomes of families and households are $107,358 and $105,674 respectively.
| Characteristic | Number | Measure |
| Per Capita Income | 2,084 | $46,959 |
| Median Family Income | 646 | $107,358 |
| Mean Family Income | 646 | $121,446 |
| Median Household Income | 998 | $105,674 |
| Mean Household Income | 998 | $98,981 |
| Income Deficit | 646 | $0 |
| Wage / Income Gap (%) | 2,084 | 17.61% |
| Wage / Income Gap ($) | 2,084 | 82.39¢ per $1 |
| Gini / Inequality Index | 2,084 | 0.36 |
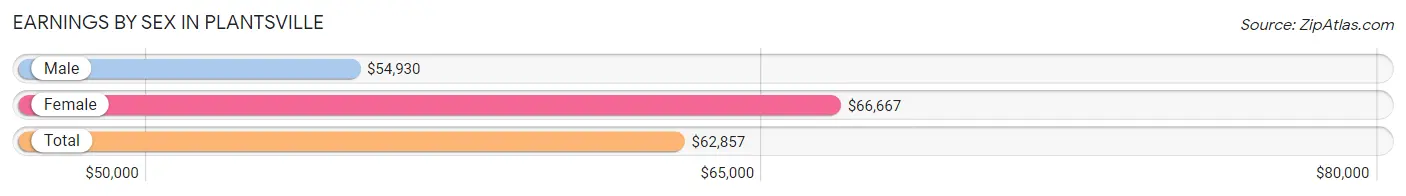
Earnings by Sex in Plantsville
Average Earnings in Plantsville are $62,857, $54,930 for men and $66,667 for women, a difference of 17.6%.
| Sex | Number | Average Earnings |
| Male | 534 (44.2%) | $54,930 |
| Female | 674 (55.8%) | $66,667 |
| Total | 1,208 (100.0%) | $62,857 |
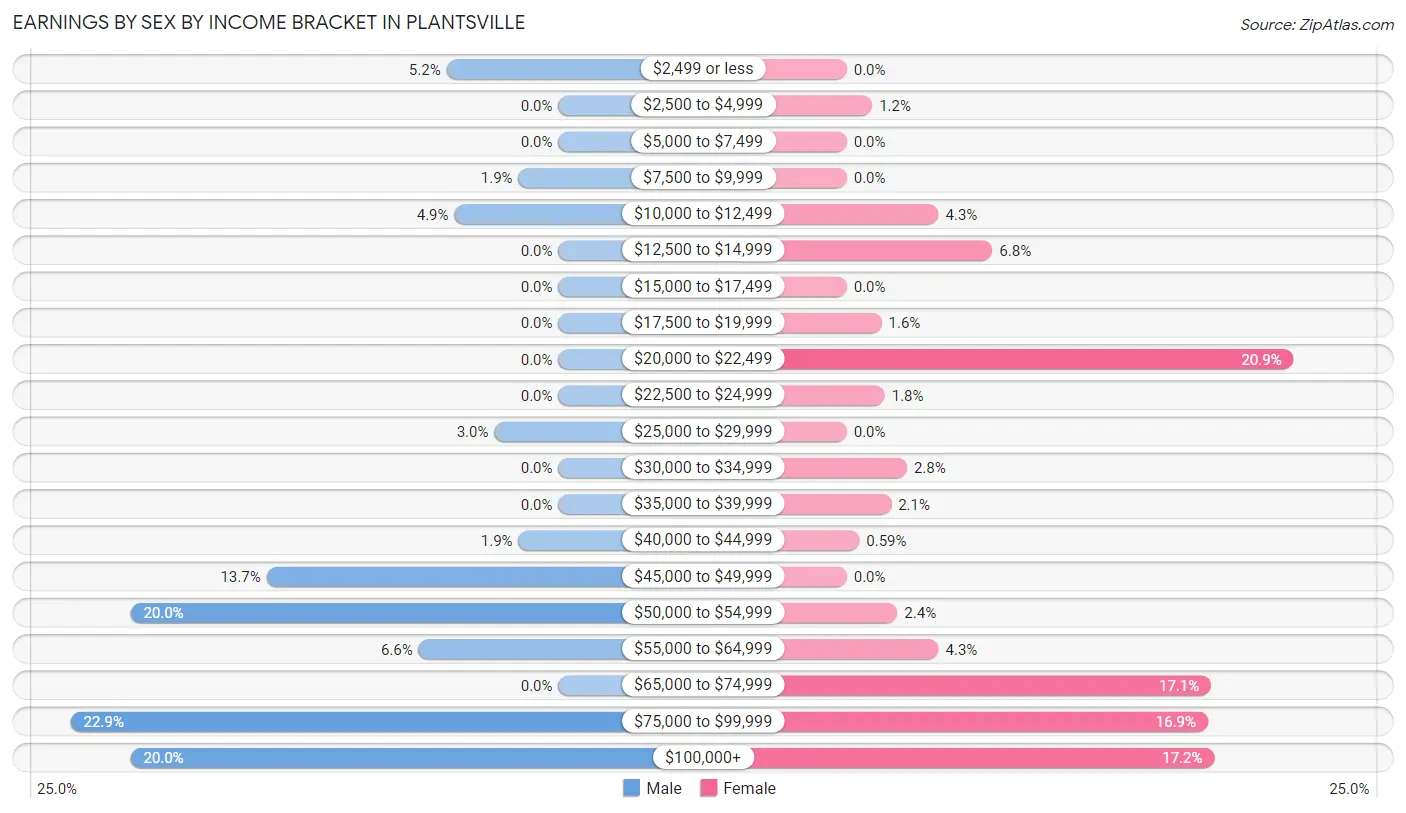
Earnings by Sex by Income Bracket in Plantsville
The most common earnings brackets in Plantsville are $75,000 to $99,999 for men (122 | 22.9%) and $20,000 to $22,499 for women (141 | 20.9%).
| Income | Male | Female |
| $2,499 or less | 28 (5.2%) | 0 (0.0%) |
| $2,500 to $4,999 | 0 (0.0%) | 8 (1.2%) |
| $5,000 to $7,499 | 0 (0.0%) | 0 (0.0%) |
| $7,500 to $9,999 | 10 (1.9%) | 0 (0.0%) |
| $10,000 to $12,499 | 26 (4.9%) | 29 (4.3%) |
| $12,500 to $14,999 | 0 (0.0%) | 46 (6.8%) |
| $15,000 to $17,499 | 0 (0.0%) | 0 (0.0%) |
| $17,500 to $19,999 | 0 (0.0%) | 11 (1.6%) |
| $20,000 to $22,499 | 0 (0.0%) | 141 (20.9%) |
| $22,500 to $24,999 | 0 (0.0%) | 12 (1.8%) |
| $25,000 to $29,999 | 16 (3.0%) | 0 (0.0%) |
| $30,000 to $34,999 | 0 (0.0%) | 19 (2.8%) |
| $35,000 to $39,999 | 0 (0.0%) | 14 (2.1%) |
| $40,000 to $44,999 | 10 (1.9%) | 4 (0.6%) |
| $45,000 to $49,999 | 73 (13.7%) | 0 (0.0%) |
| $50,000 to $54,999 | 107 (20.0%) | 16 (2.4%) |
| $55,000 to $64,999 | 35 (6.6%) | 29 (4.3%) |
| $65,000 to $74,999 | 0 (0.0%) | 115 (17.1%) |
| $75,000 to $99,999 | 122 (22.9%) | 114 (16.9%) |
| $100,000+ | 107 (20.0%) | 116 (17.2%) |
| Total | 534 (100.0%) | 674 (100.0%) |
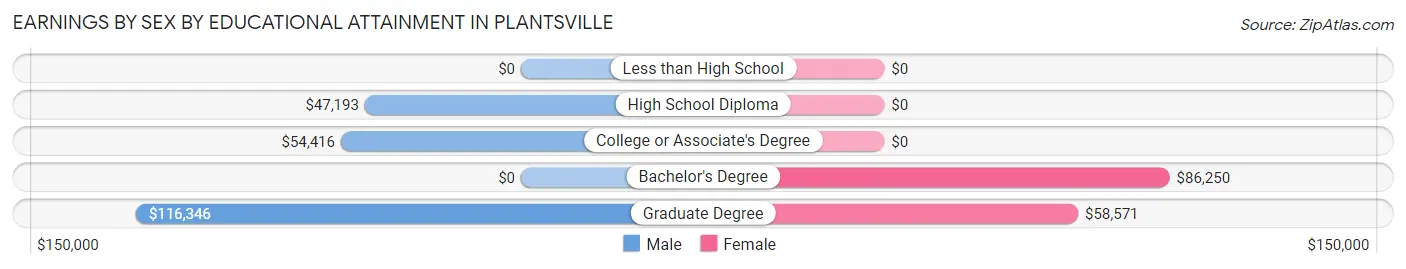
Earnings by Sex by Educational Attainment in Plantsville
Average earnings in Plantsville are $64,571 for men and $70,253 for women, a difference of 8.1%. Men with an educational attainment of graduate degree enjoy the highest average annual earnings of $116,346, while those with high school diploma education earn the least with $47,193. Women with an educational attainment of bachelor's degree earn the most with the average annual earnings of $86,250, while those with graduate degree education have the smallest earnings of $58,571.
| Educational Attainment | Male Income | Female Income |
| Less than High School | - | - |
| High School Diploma | $47,193 | $0 |
| College or Associate's Degree | $54,416 | $0 |
| Bachelor's Degree | - | - |
| Graduate Degree | $116,346 | $58,571 |
| Total | $64,571 | $70,253 |
Family Income in Plantsville
Family Income Brackets in Plantsville
According to the Plantsville family income data, there are 298 families falling into the $100,000 to $149,999 income range, which is the most common income bracket and makes up 46.1% of all families.
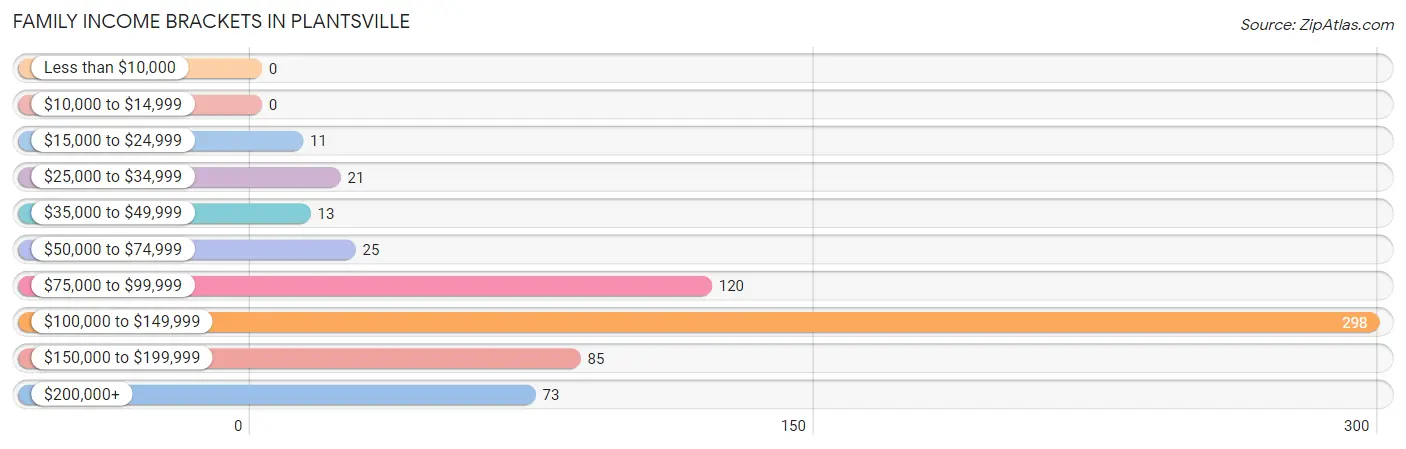
| Income Bracket | # Families | % Families |
| Less than $10,000 | 0 | 0.0% |
| $10,000 to $14,999 | 0 | 0.0% |
| $15,000 to $24,999 | 11 | 1.7% |
| $25,000 to $34,999 | 21 | 3.3% |
| $35,000 to $49,999 | 13 | 2.0% |
| $50,000 to $74,999 | 25 | 3.9% |
| $75,000 to $99,999 | 120 | 18.6% |
| $100,000 to $149,999 | 298 | 46.1% |
| $150,000 to $199,999 | 85 | 13.2% |
| $200,000+ | 73 | 11.3% |
Family Income by Famaliy Size in Plantsville
4-person families (71 | 11.0%) account for the highest median family income in Plantsville with $201,453 per family, while 2-person families (352 | 54.5%) have the highest median income of $53,324 per family member.
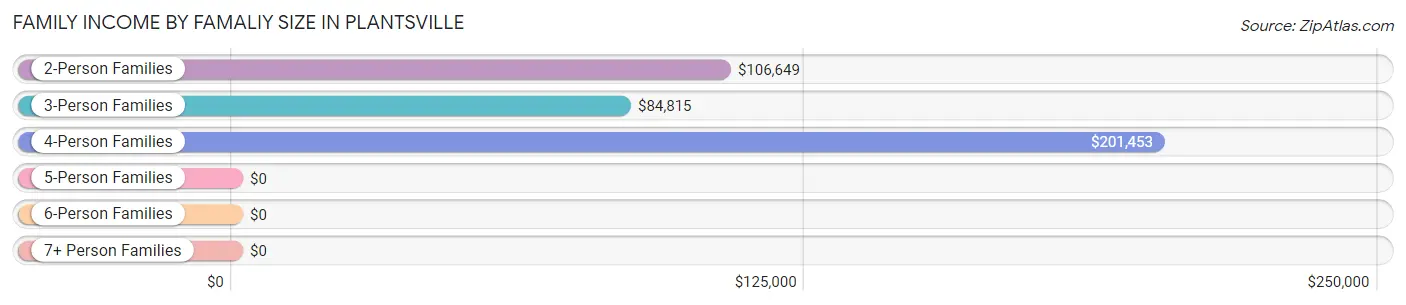
| Income Bracket | # Families | Median Income |
| 2-Person Families | 352 (54.5%) | $106,649 |
| 3-Person Families | 206 (31.9%) | $84,815 |
| 4-Person Families | 71 (11.0%) | $201,453 |
| 5-Person Families | 0 (0.0%) | $0 |
| 6-Person Families | 17 (2.6%) | $0 |
| 7+ Person Families | 0 (0.0%) | $0 |
| Total | 646 (100.0%) | $107,358 |
Family Income by Number of Earners in Plantsville
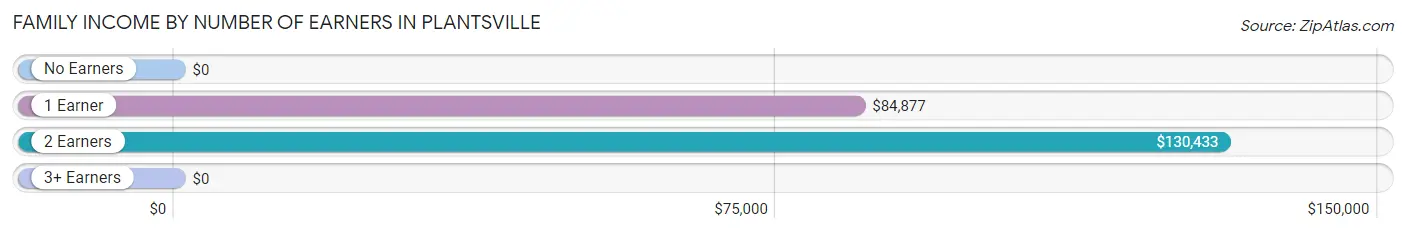
| Number of Earners | # Families | Median Income |
| No Earners | 71 (11.0%) | $0 |
| 1 Earner | 135 (20.9%) | $84,877 |
| 2 Earners | 384 (59.4%) | $130,433 |
| 3+ Earners | 56 (8.7%) | $0 |
| Total | 646 (100.0%) | $107,358 |
Household Income in Plantsville
Household Income Brackets in Plantsville
With 346 households falling in the category, the $100,000 to $149,999 income range is the most frequent in Plantsville, accounting for 34.7% of all households. In contrast, only 13 households (1.3%) fall into the $35,000 to $49,999 income bracket, making it the least populous group.
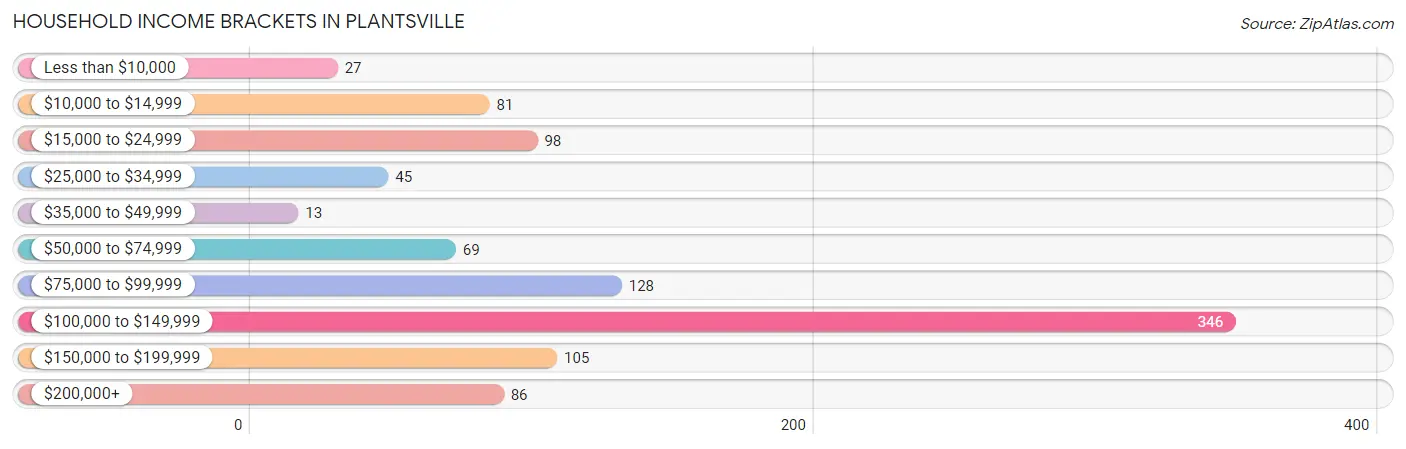
| Income Bracket | # Households | % Households |
| Less than $10,000 | 27 | 2.7% |
| $10,000 to $14,999 | 81 | 8.1% |
| $15,000 to $24,999 | 98 | 9.8% |
| $25,000 to $34,999 | 45 | 4.5% |
| $35,000 to $49,999 | 13 | 1.3% |
| $50,000 to $74,999 | 69 | 6.9% |
| $75,000 to $99,999 | 128 | 12.8% |
| $100,000 to $149,999 | 346 | 34.7% |
| $150,000 to $199,999 | 105 | 10.5% |
| $200,000+ | 86 | 8.6% |
Household Income by Householder Age in Plantsville
The median household income in Plantsville is $105,674, with the highest median household income of $132,434 found in the 25 to 44 years age bracket for the primary householder. A total of 159 households (15.9%) fall into this category.
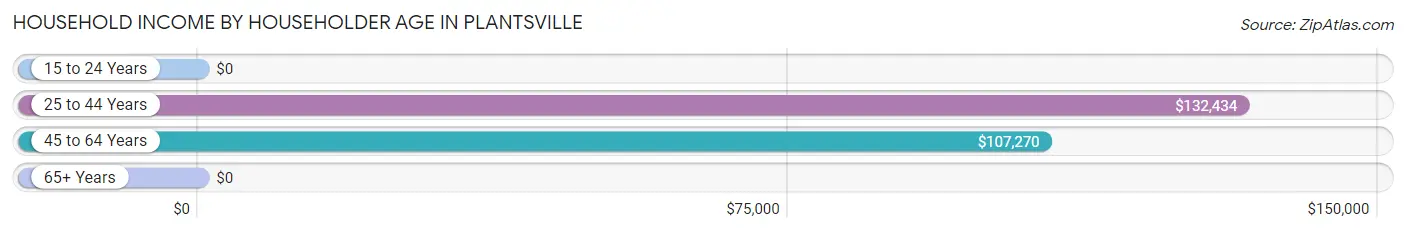
| Income Bracket | # Households | Median Income |
| 15 to 24 Years | 0 (0.0%) | $0 |
| 25 to 44 Years | 159 (15.9%) | $132,434 |
| 45 to 64 Years | 484 (48.5%) | $107,270 |
| 65+ Years | 355 (35.6%) | $0 |
| Total | 998 (100.0%) | $105,674 |
Poverty in Plantsville
Income Below Poverty by Sex and Age in Plantsville
With 3.5% poverty level for males and 9.4% for females among the residents of Plantsville, 16 and 17 year old males and 65 to 74 year old females are the most vulnerable to poverty, with 13 males (46.4%) and 81 females (57.9%) in their respective age groups living below the poverty level.
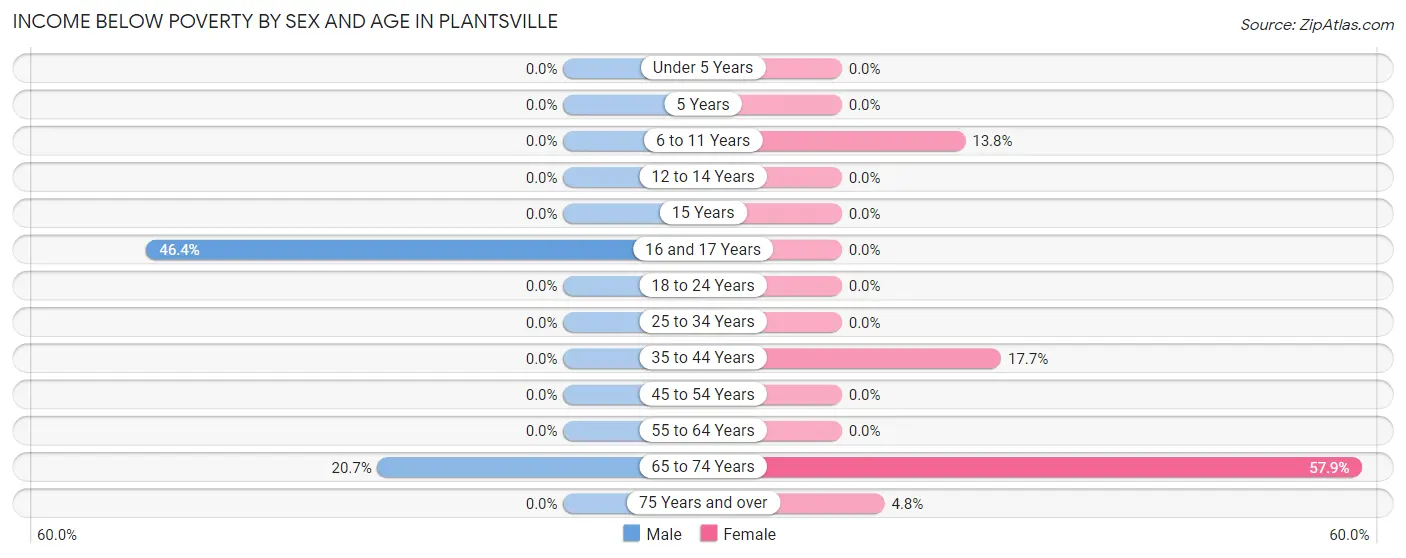
| Age Bracket | Male | Female |
| Under 5 Years | 0 (0.0%) | 0 (0.0%) |
| 5 Years | 0 (0.0%) | 0 (0.0%) |
| 6 to 11 Years | 0 (0.0%) | 11 (13.8%) |
| 12 to 14 Years | 0 (0.0%) | 0 (0.0%) |
| 15 Years | 0 (0.0%) | 0 (0.0%) |
| 16 and 17 Years | 13 (46.4%) | 0 (0.0%) |
| 18 to 24 Years | 0 (0.0%) | 0 (0.0%) |
| 25 to 34 Years | 0 (0.0%) | 0 (0.0%) |
| 35 to 44 Years | 0 (0.0%) | 11 (17.7%) |
| 45 to 54 Years | 0 (0.0%) | 0 (0.0%) |
| 55 to 64 Years | 0 (0.0%) | 0 (0.0%) |
| 65 to 74 Years | 18 (20.7%) | 81 (57.9%) |
| 75 Years and over | 0 (0.0%) | 9 (4.8%) |
| Total | 31 (3.5%) | 112 (9.4%) |
Income Above Poverty by Sex and Age in Plantsville
According to the poverty statistics in Plantsville, males aged under 5 years and females aged under 5 years are the age groups that are most secure financially, with 100.0% of males and 100.0% of females in these age groups living above the poverty line.
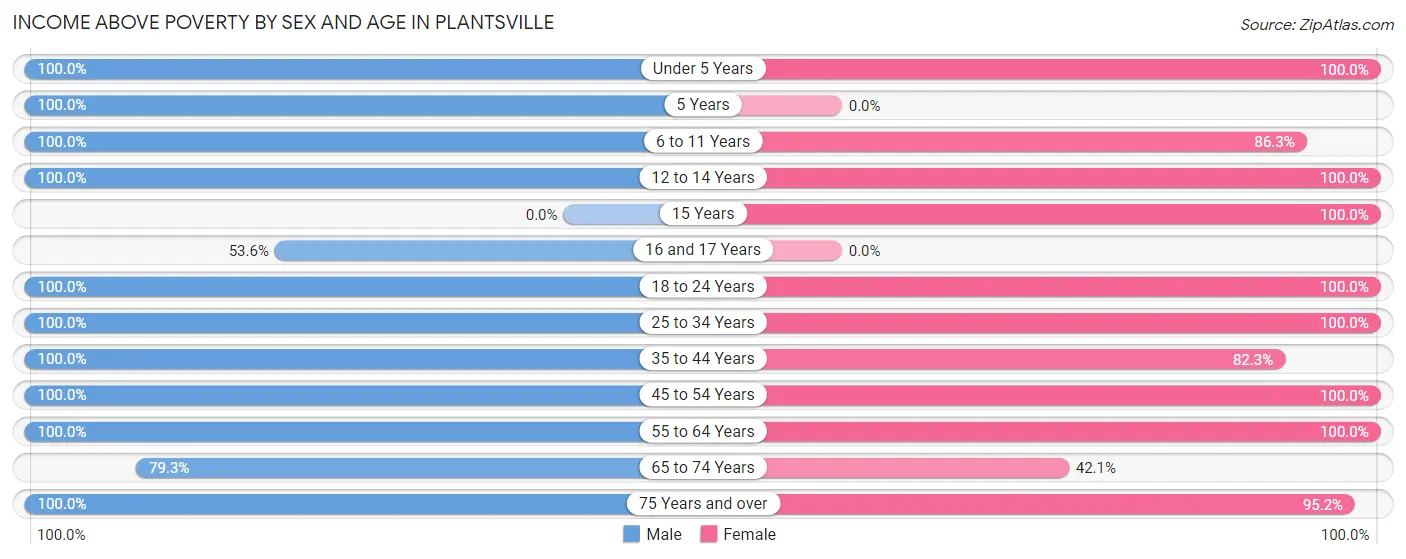
| Age Bracket | Male | Female |
| Under 5 Years | 39 (100.0%) | 56 (100.0%) |
| 5 Years | 39 (100.0%) | 0 (0.0%) |
| 6 to 11 Years | 36 (100.0%) | 69 (86.3%) |
| 12 to 14 Years | 34 (100.0%) | 4 (100.0%) |
| 15 Years | 0 (0.0%) | 20 (100.0%) |
| 16 and 17 Years | 15 (53.6%) | 0 (0.0%) |
| 18 to 24 Years | 36 (100.0%) | 45 (100.0%) |
| 25 to 34 Years | 65 (100.0%) | 88 (100.0%) |
| 35 to 44 Years | 34 (100.0%) | 51 (82.3%) |
| 45 to 54 Years | 155 (100.0%) | 235 (100.0%) |
| 55 to 64 Years | 206 (100.0%) | 273 (100.0%) |
| 65 to 74 Years | 69 (79.3%) | 59 (42.1%) |
| 75 Years and over | 133 (100.0%) | 180 (95.2%) |
| Total | 861 (96.5%) | 1,080 (90.6%) |
Income Below Poverty Among Married-Couple Families in Plantsville
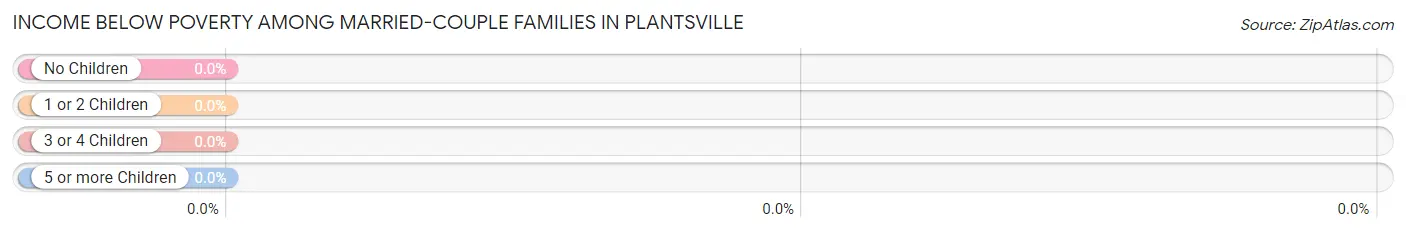
| Children | Above Poverty | Below Poverty |
| No Children | 373 (100.0%) | 0 (0.0%) |
| 1 or 2 Children | 152 (100.0%) | 0 (0.0%) |
| 3 or 4 Children | 0 (0.0%) | 0 (0.0%) |
| 5 or more Children | 0 (0.0%) | 0 (0.0%) |
| Total | 525 (100.0%) | 0 (0.0%) |
Income Below Poverty Among Single-Parent Households in Plantsville
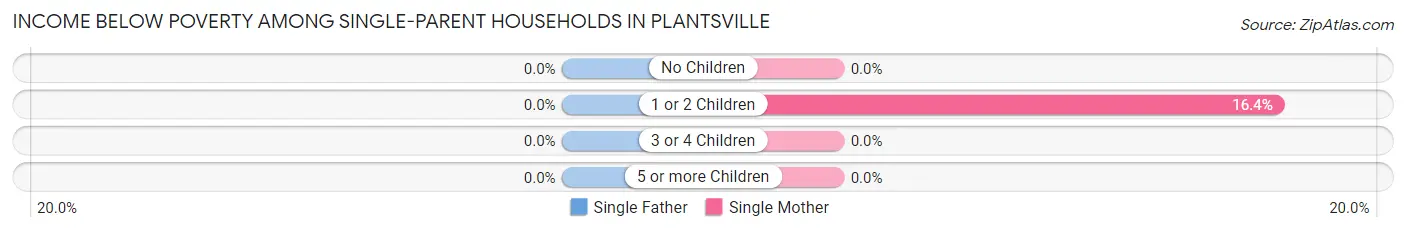
| Children | Single Father | Single Mother |
| No Children | 0 (0.0%) | 0 (0.0%) |
| 1 or 2 Children | 0 (0.0%) | 11 (16.4%) |
| 3 or 4 Children | 0 (0.0%) | 0 (0.0%) |
| 5 or more Children | 0 (0.0%) | 0 (0.0%) |
| Total | 0 (0.0%) | 11 (9.1%) |
Income Below Poverty Among Married-Couple vs Single-Parent Households in Plantsville
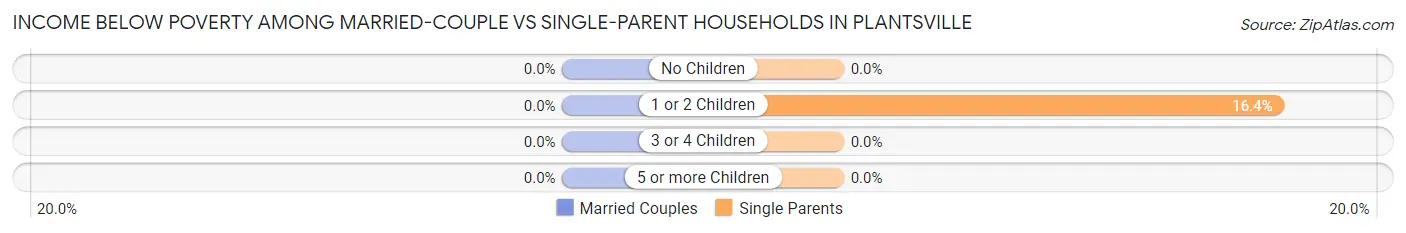
| Children | Married-Couple Families | Single-Parent Households |
| No Children | 0 (0.0%) | 0 (0.0%) |
| 1 or 2 Children | 0 (0.0%) | 11 (16.4%) |
| 3 or 4 Children | 0 (0.0%) | 0 (0.0%) |
| 5 or more Children | 0 (0.0%) | 0 (0.0%) |
| Total | 0 (0.0%) | 11 (9.1%) |
Race in Plantsville
The most populous races in Plantsville are White / Caucasian (1,969 | 94.5%), Two or more Races (55 | 2.6%), and Black / African American (46 | 2.2%).
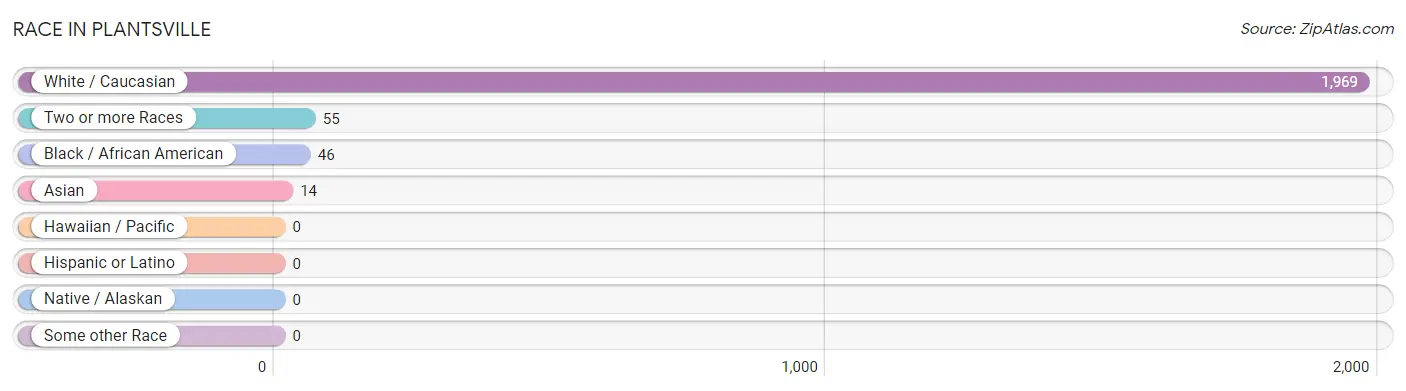
| Race | # Population | % Population |
| Asian | 14 | 0.7% |
| Black / African American | 46 | 2.2% |
| Hawaiian / Pacific | 0 | 0.0% |
| Hispanic or Latino | 0 | 0.0% |
| Native / Alaskan | 0 | 0.0% |
| White / Caucasian | 1,969 | 94.5% |
| Two or more Races | 55 | 2.6% |
| Some other Race | 0 | 0.0% |
| Total | 2,084 | 100.0% |
Ancestry in Plantsville
The most populous ancestries reported in Plantsville are Italian (646 | 31.0%), American (399 | 19.2%), Polish (350 | 16.8%), Irish (287 | 13.8%), and German (261 | 12.5%), together accounting for 93.2% of all Plantsville residents.
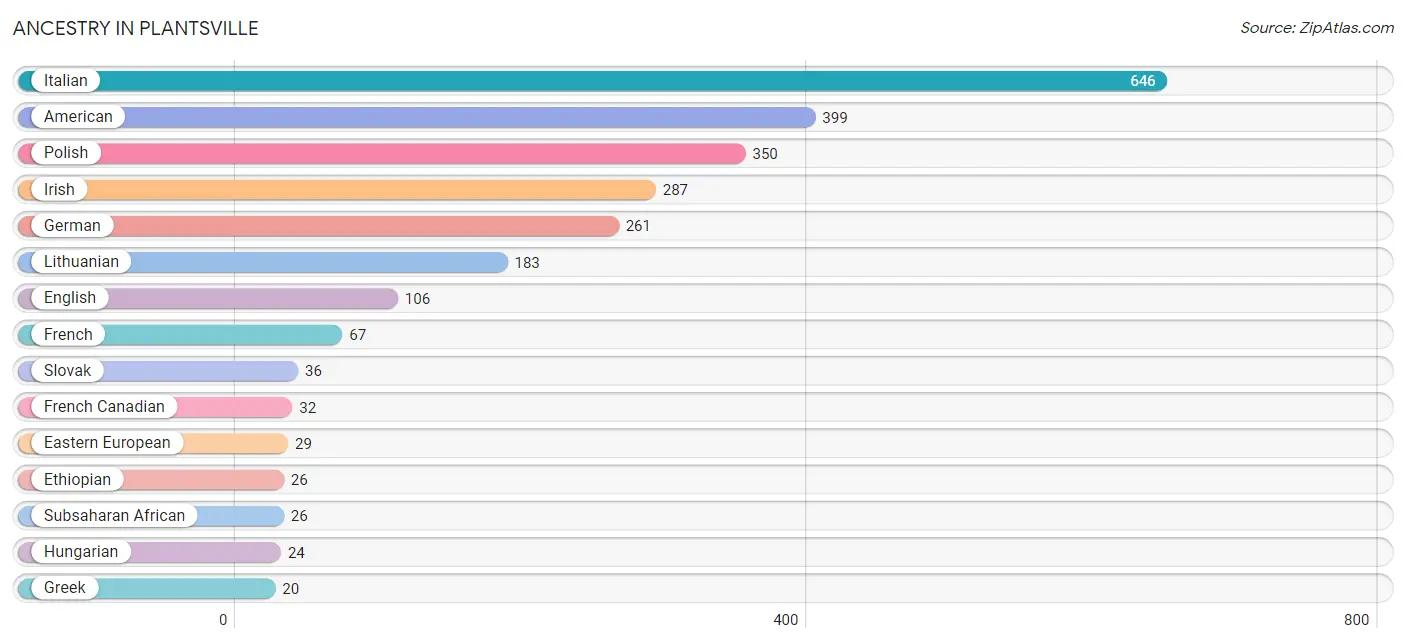
| Ancestry | # Population | % Population |
| American | 399 | 19.2% |
| Czech | 16 | 0.8% |
| Danish | 17 | 0.8% |
| Eastern European | 29 | 1.4% |
| English | 106 | 5.1% |
| Ethiopian | 26 | 1.3% |
| French | 67 | 3.2% |
| French Canadian | 32 | 1.5% |
| German | 261 | 12.5% |
| Greek | 20 | 1.0% |
| Haitian | 20 | 1.0% |
| Hungarian | 24 | 1.1% |
| Indian (Asian) | 14 | 0.7% |
| Irish | 287 | 13.8% |
| Italian | 646 | 31.0% |
| Lithuanian | 183 | 8.8% |
| Polish | 350 | 16.8% |
| Russian | 10 | 0.5% |
| Scotch-Irish | 13 | 0.6% |
| Slovak | 36 | 1.7% |
| Subsaharan African | 26 | 1.3% | View All 21 Rows |
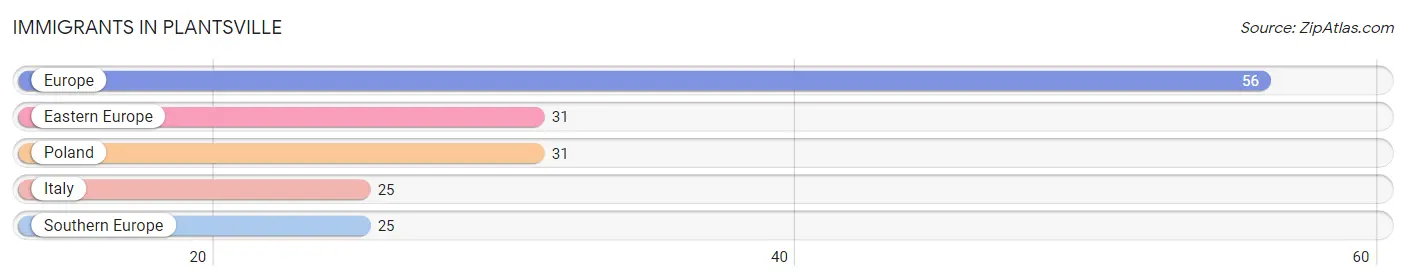
Immigrants in Plantsville
The most numerous immigrant groups reported in Plantsville came from Europe (56 | 2.7%), Eastern Europe (31 | 1.5%), Poland (31 | 1.5%), Italy (25 | 1.2%), and Southern Europe (25 | 1.2%), together accounting for 8.1% of all Plantsville residents.
| Immigration Origin | # Population | % Population |
| Eastern Europe | 31 | 1.5% |
| Europe | 56 | 2.7% |
| Italy | 25 | 1.2% |
| Poland | 31 | 1.5% |
| Southern Europe | 25 | 1.2% | View All 5 Rows |
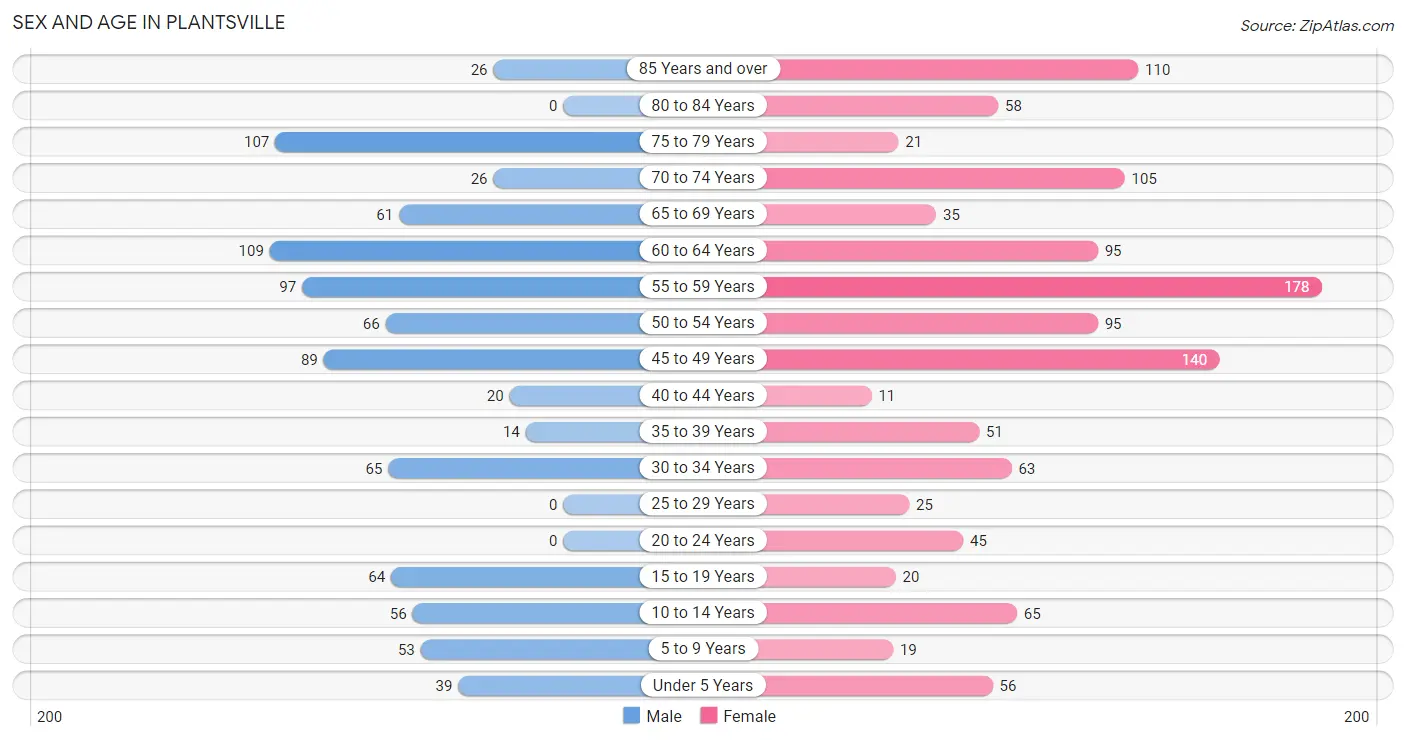
Sex and Age in Plantsville
Sex and Age in Plantsville
The most populous age groups in Plantsville are 60 to 64 Years (109 | 12.2%) for men and 55 to 59 Years (178 | 14.9%) for women.
| Age Bracket | Male | Female |
| Under 5 Years | 39 (4.4%) | 56 (4.7%) |
| 5 to 9 Years | 53 (5.9%) | 19 (1.6%) |
| 10 to 14 Years | 56 (6.3%) | 65 (5.4%) |
| 15 to 19 Years | 64 (7.2%) | 20 (1.7%) |
| 20 to 24 Years | 0 (0.0%) | 45 (3.8%) |
| 25 to 29 Years | 0 (0.0%) | 25 (2.1%) |
| 30 to 34 Years | 65 (7.3%) | 63 (5.3%) |
| 35 to 39 Years | 14 (1.6%) | 51 (4.3%) |
| 40 to 44 Years | 20 (2.2%) | 11 (0.9%) |
| 45 to 49 Years | 89 (10.0%) | 140 (11.7%) |
| 50 to 54 Years | 66 (7.4%) | 95 (8.0%) |
| 55 to 59 Years | 97 (10.9%) | 178 (14.9%) |
| 60 to 64 Years | 109 (12.2%) | 95 (8.0%) |
| 65 to 69 Years | 61 (6.8%) | 35 (2.9%) |
| 70 to 74 Years | 26 (2.9%) | 105 (8.8%) |
| 75 to 79 Years | 107 (12.0%) | 21 (1.8%) |
| 80 to 84 Years | 0 (0.0%) | 58 (4.9%) |
| 85 Years and over | 26 (2.9%) | 110 (9.2%) |
| Total | 892 (100.0%) | 1,192 (100.0%) |
Families and Households in Plantsville
Median Family Size in Plantsville
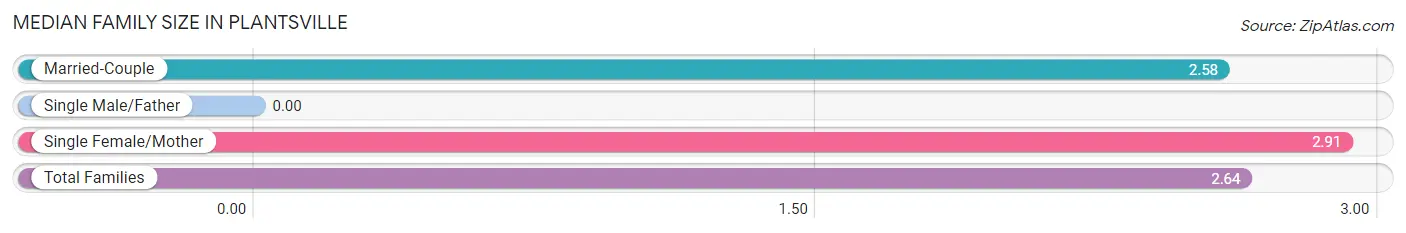
| Family Type | # Families | Family Size |
| Married-Couple | 525 (81.3%) | 2.58 |
| Single Male/Father | 0 (0.0%) | - |
| Single Female/Mother | 121 (18.7%) | 2.91 |
| Total Families | 646 (100.0%) | 2.64 |
Median Household Size in Plantsville
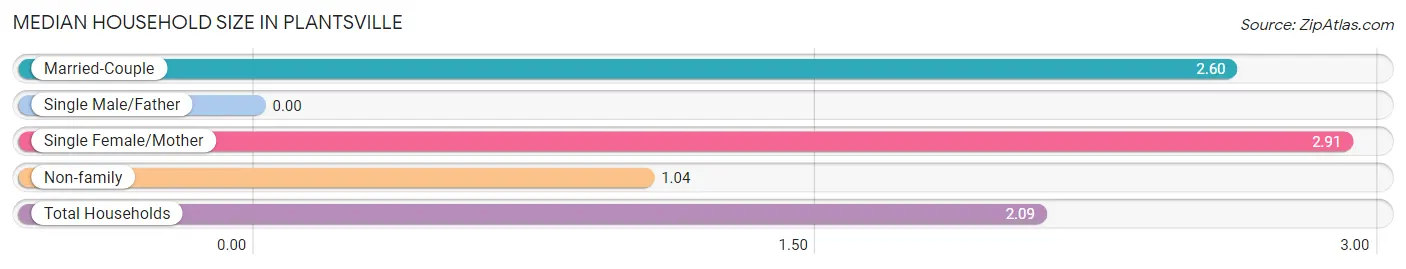
| Household Type | # Households | Household Size |
| Married-Couple | 525 (52.6%) | 2.60 |
| Single Male/Father | 0 (0.0%) | - |
| Single Female/Mother | 121 (12.1%) | 2.91 |
| Non-family | 352 (35.3%) | 1.04 |
| Total Households | 998 (100.0%) | 2.09 |
Household Size by Marriage Status in Plantsville
Out of a total of 998 households in Plantsville, 646 (64.7%) are family households, while 352 (35.3%) are nonfamily households. The most numerous type of family households are 2-person households, comprising 352, and the most common type of nonfamily households are 1-person households, comprising 339.
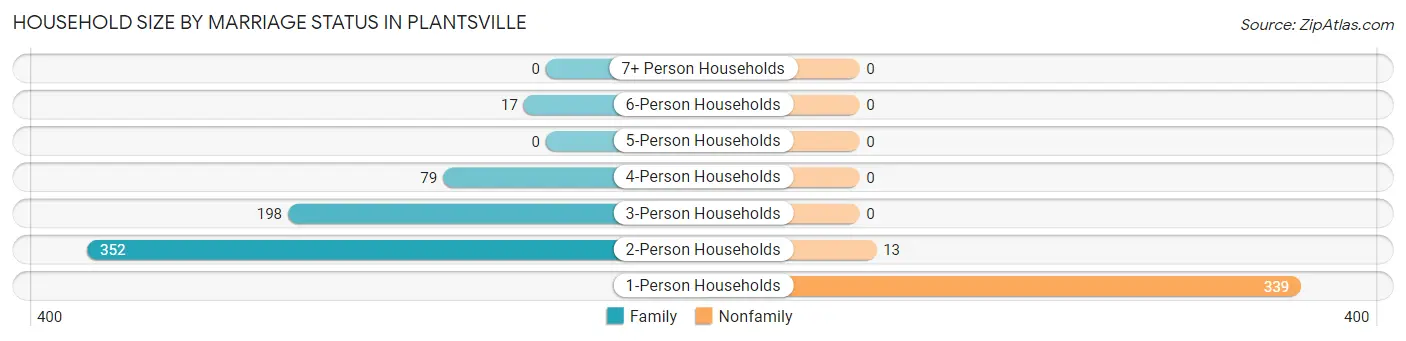
| Household Size | Family Households | Nonfamily Households |
| 1-Person Households | - | 339 (34.0%) |
| 2-Person Households | 352 (35.3%) | 13 (1.3%) |
| 3-Person Households | 198 (19.8%) | 0 (0.0%) |
| 4-Person Households | 79 (7.9%) | 0 (0.0%) |
| 5-Person Households | 0 (0.0%) | 0 (0.0%) |
| 6-Person Households | 17 (1.7%) | 0 (0.0%) |
| 7+ Person Households | 0 (0.0%) | 0 (0.0%) |
| Total | 646 (64.7%) | 352 (35.3%) |
Female Fertility in Plantsville
Fertility by Age in Plantsville
| Age Bracket | Women with Births | Births / 1,000 Women |
| 15 to 19 years | 0 (0.0%) | 0.0 |
| 20 to 34 years | 0 (0.0%) | 0.0 |
| 35 to 50 years | 0 (0.0%) | 0.0 |
| Total | 0 (0.0%) | 0.0 |
Fertility by Age by Marriage Status in Plantsville
| Age Bracket | Married | Unmarried |
| 15 to 19 years | 0 (0.0%) | 0 (0.0%) |
| 20 to 34 years | 0 (0.0%) | 0 (0.0%) |
| 35 to 50 years | 0 (0.0%) | 0 (0.0%) |
| Total | 0 (0.0%) | 0 (0.0%) |
Fertility by Education in Plantsville
| Educational Attainment | Women with Births | Births / 1,000 Women |
| Less than High School | 0 (0.0%) | 0.0 |
| High School Diploma | 0 (0.0%) | 0.0 |
| College or Associate's Degree | 0 (0.0%) | 0.0 |
| Bachelor's Degree | 0 (0.0%) | 0.0 |
| Graduate Degree | 0 (0.0%) | 0.0 |
| Total | 0 (0.0%) | 0.0 |
Fertility by Education by Marriage Status in Plantsville
| Educational Attainment | Married | Unmarried |
| Less than High School | 0 (0.0%) | 0 (0.0%) |
| High School Diploma | 0 (0.0%) | 0 (0.0%) |
| College or Associate's Degree | 0 (0.0%) | 0 (0.0%) |
| Bachelor's Degree | 0 (0.0%) | 0 (0.0%) |
| Graduate Degree | 0 (0.0%) | 0 (0.0%) |
| Total | 0 (0.0%) | 0 (0.0%) |
Employment Characteristics in Plantsville
Employment by Class of Employer in Plantsville
Among the 1,147 employed individuals in Plantsville, private company employees (847 | 73.8%), not-for-profit organizations (113 | 9.9%), and local government employees (81 | 7.1%) make up the most common classes of employment.
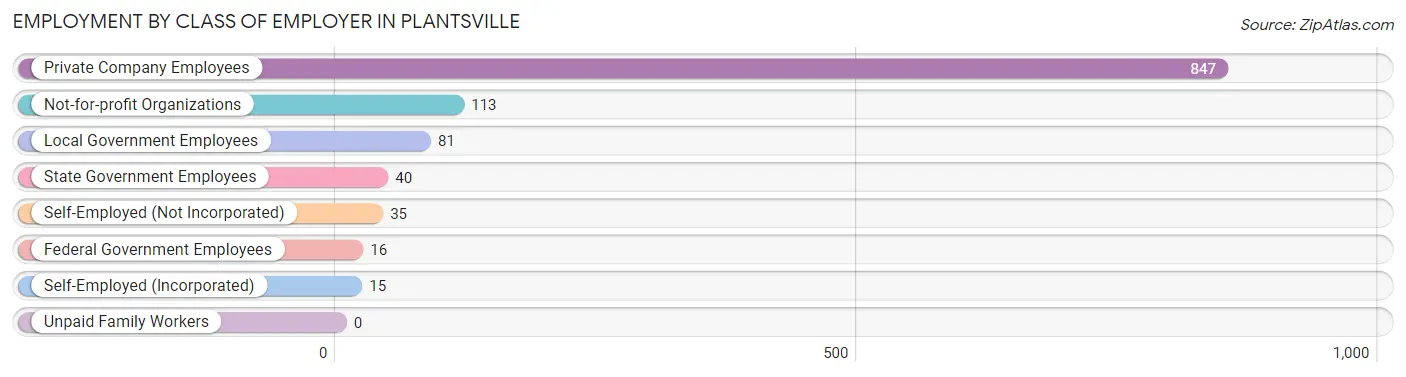
| Employer Class | # Employees | % Employees |
| Private Company Employees | 847 | 73.8% |
| Self-Employed (Incorporated) | 15 | 1.3% |
| Self-Employed (Not Incorporated) | 35 | 3.0% |
| Not-for-profit Organizations | 113 | 9.9% |
| Local Government Employees | 81 | 7.1% |
| State Government Employees | 40 | 3.5% |
| Federal Government Employees | 16 | 1.4% |
| Unpaid Family Workers | 0 | 0.0% |
| Total | 1,147 | 100.0% |
Employment Status by Age in Plantsville
According to the labor force statistics for Plantsville, out of the total population over 16 years of age (1,776), 66.7% or 1,185 individuals are in the labor force, with 2.4% or 28 of them unemployed. The age group with the highest labor force participation rate is 20 to 24 years, with 100.0% or 45 individuals in the labor force. Within the labor force, the 20 to 24 years age range has the highest percentage of unemployed individuals, with 26.7% or 12 of them being unemployed.
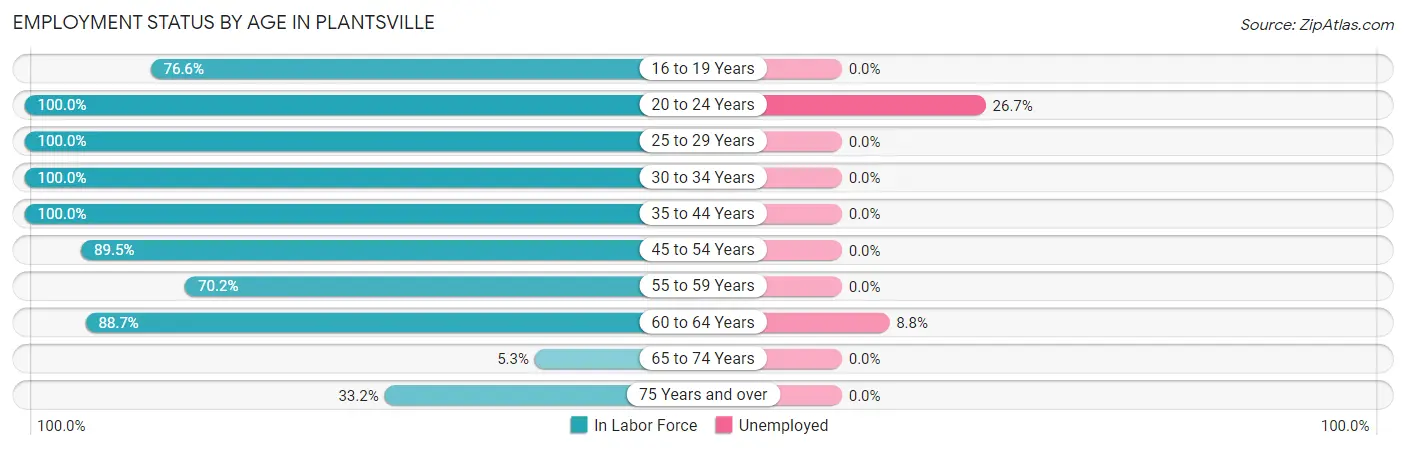
| Age Bracket | In Labor Force | Unemployed |
| 16 to 19 Years | 49 (76.6%) | 0 (0.0%) |
| 20 to 24 Years | 45 (100.0%) | 12 (26.7%) |
| 25 to 29 Years | 25 (100.0%) | 0 (0.0%) |
| 30 to 34 Years | 128 (100.0%) | 0 (0.0%) |
| 35 to 44 Years | 96 (100.0%) | 0 (0.0%) |
| 45 to 54 Years | 349 (89.5%) | 0 (0.0%) |
| 55 to 59 Years | 193 (70.2%) | 0 (0.0%) |
| 60 to 64 Years | 181 (88.7%) | 16 (8.8%) |
| 65 to 74 Years | 12 (5.3%) | 0 (0.0%) |
| 75 Years and over | 107 (33.2%) | 0 (0.0%) |
| Total | 1,185 (66.7%) | 28 (2.4%) |
Employment Status by Educational Attainment in Plantsville
According to labor force statistics for Plantsville, 86.9% of individuals (972) out of the total population between 25 and 64 years of age (1,118) are in the labor force, with 1.6% or 16 of them being unemployed. The group with the highest labor force participation rate are those with the educational attainment of bachelor's degree or higher, with 100.0% or 365 individuals in the labor force. Within the labor force, individuals with bachelor's degree or higher education have the highest percentage of unemployment, with 4.4% or 16 of them being unemployed.
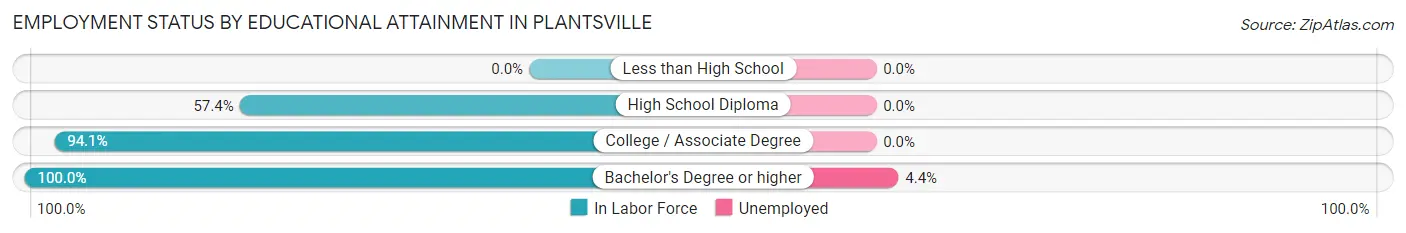
| Educational Attainment | In Labor Force | Unemployed |
| Less than High School | 0 (0.0%) | 0 (0.0%) |
| High School Diploma | 159 (57.4%) | 0 (0.0%) |
| College / Associate Degree | 448 (94.1%) | 0 (0.0%) |
| Bachelor's Degree or higher | 365 (100.0%) | 16 (4.4%) |
| Total | 972 (86.9%) | 18 (1.6%) |
Employment Occupations by Sex in Plantsville
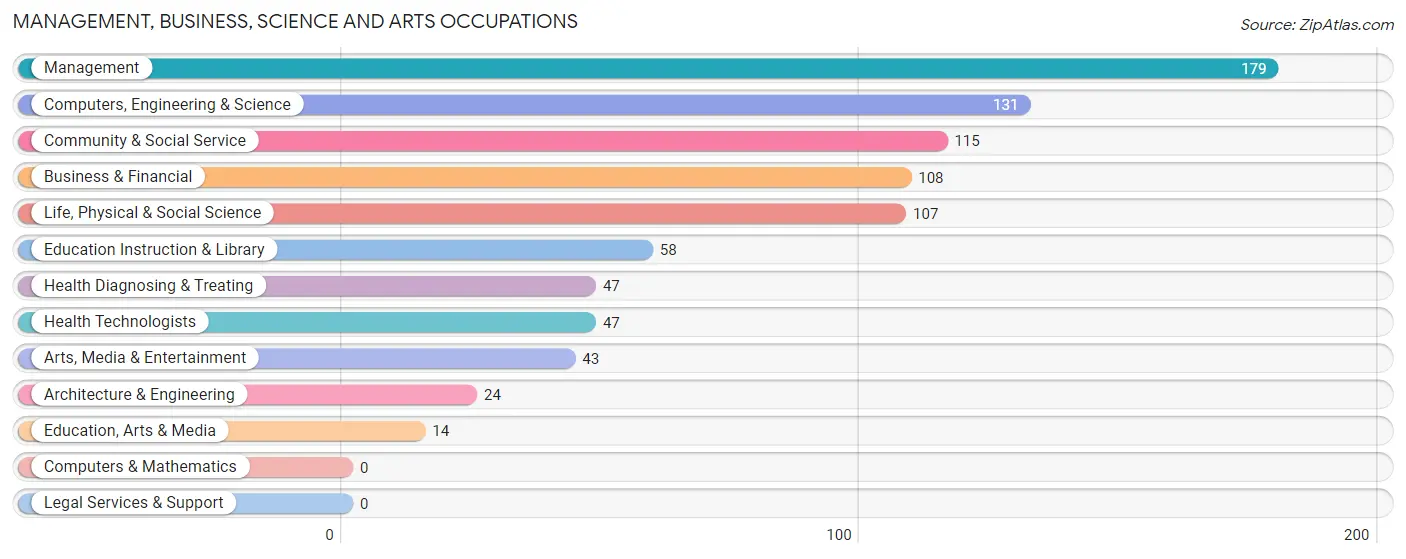
Management, Business, Science and Arts Occupations
The most common Management, Business, Science and Arts occupations in Plantsville are Management (179 | 15.5%), Computers, Engineering & Science (131 | 11.3%), Community & Social Service (115 | 9.9%), Business & Financial (108 | 9.3%), and Life, Physical & Social Science (107 | 9.2%).
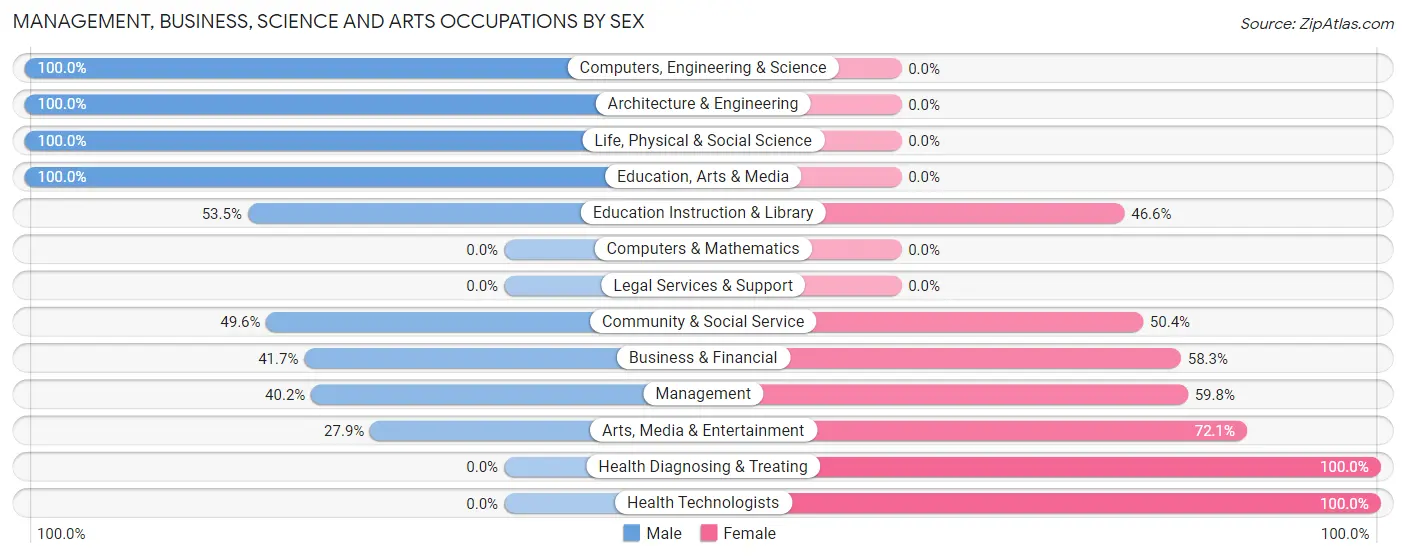
Management, Business, Science and Arts Occupations by Sex
Within the Management, Business, Science and Arts occupations in Plantsville, the most male-oriented occupations are Computers, Engineering & Science (100.0%), Architecture & Engineering (100.0%), and Life, Physical & Social Science (100.0%), while the most female-oriented occupations are Health Diagnosing & Treating (100.0%), Health Technologists (100.0%), and Arts, Media & Entertainment (72.1%).
| Occupation | Male | Female |
| Management | 72 (40.2%) | 107 (59.8%) |
| Business & Financial | 45 (41.7%) | 63 (58.3%) |
| Computers, Engineering & Science | 131 (100.0%) | 0 (0.0%) |
| Computers & Mathematics | 0 (0.0%) | 0 (0.0%) |
| Architecture & Engineering | 24 (100.0%) | 0 (0.0%) |
| Life, Physical & Social Science | 107 (100.0%) | 0 (0.0%) |
| Community & Social Service | 57 (49.6%) | 58 (50.4%) |
| Education, Arts & Media | 14 (100.0%) | 0 (0.0%) |
| Legal Services & Support | 0 (0.0%) | 0 (0.0%) |
| Education Instruction & Library | 31 (53.4%) | 27 (46.6%) |
| Arts, Media & Entertainment | 12 (27.9%) | 31 (72.1%) |
| Health Diagnosing & Treating | 0 (0.0%) | 47 (100.0%) |
| Health Technologists | 0 (0.0%) | 47 (100.0%) |
| Total (Category) | 305 (52.6%) | 275 (47.4%) |
| Total (Overall) | 503 (43.5%) | 654 (56.5%) |
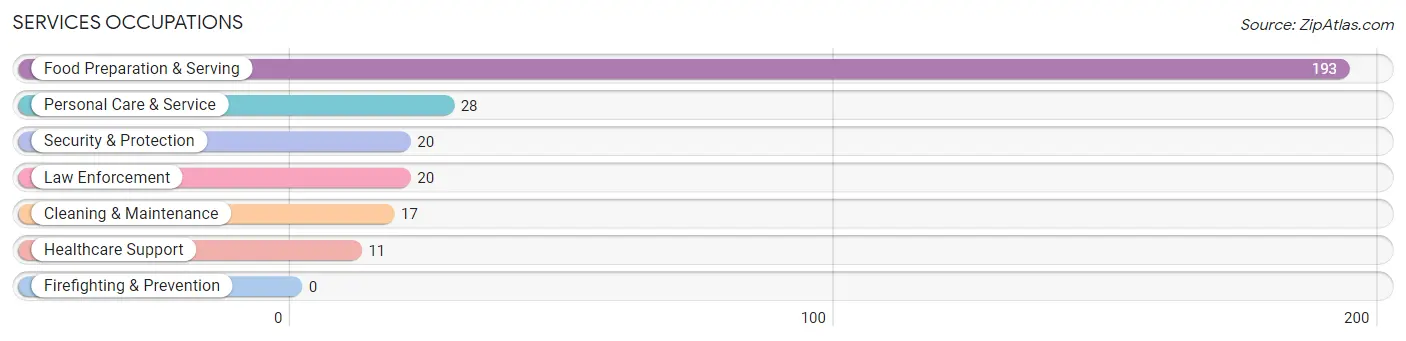
Services Occupations
The most common Services occupations in Plantsville are Food Preparation & Serving (193 | 16.7%), Personal Care & Service (28 | 2.4%), Security & Protection (20 | 1.7%), Law Enforcement (20 | 1.7%), and Cleaning & Maintenance (17 | 1.5%).
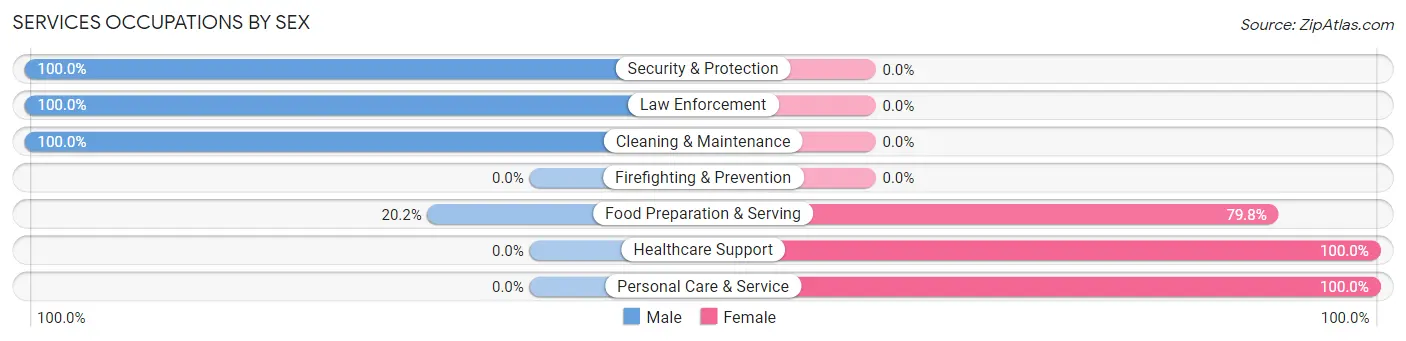
Services Occupations by Sex
Within the Services occupations in Plantsville, the most male-oriented occupations are Security & Protection (100.0%), Law Enforcement (100.0%), and Cleaning & Maintenance (100.0%), while the most female-oriented occupations are Healthcare Support (100.0%), Personal Care & Service (100.0%), and Food Preparation & Serving (79.8%).
| Occupation | Male | Female |
| Healthcare Support | 0 (0.0%) | 11 (100.0%) |
| Security & Protection | 20 (100.0%) | 0 (0.0%) |
| Firefighting & Prevention | 0 (0.0%) | 0 (0.0%) |
| Law Enforcement | 20 (100.0%) | 0 (0.0%) |
| Food Preparation & Serving | 39 (20.2%) | 154 (79.8%) |
| Cleaning & Maintenance | 17 (100.0%) | 0 (0.0%) |
| Personal Care & Service | 0 (0.0%) | 28 (100.0%) |
| Total (Category) | 76 (28.2%) | 193 (71.8%) |
| Total (Overall) | 503 (43.5%) | 654 (56.5%) |
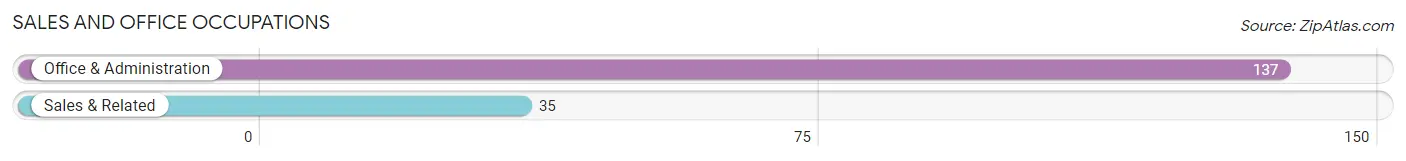
Sales and Office Occupations
The most common Sales and Office occupations in Plantsville are Office & Administration (137 | 11.8%), and Sales & Related (35 | 3.0%).
Sales and Office Occupations by Sex
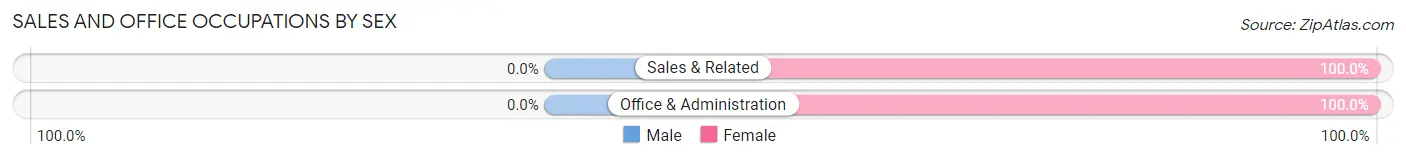
| Occupation | Male | Female |
| Sales & Related | 0 (0.0%) | 35 (100.0%) |
| Office & Administration | 0 (0.0%) | 137 (100.0%) |
| Total (Category) | 0 (0.0%) | 172 (100.0%) |
| Total (Overall) | 503 (43.5%) | 654 (56.5%) |
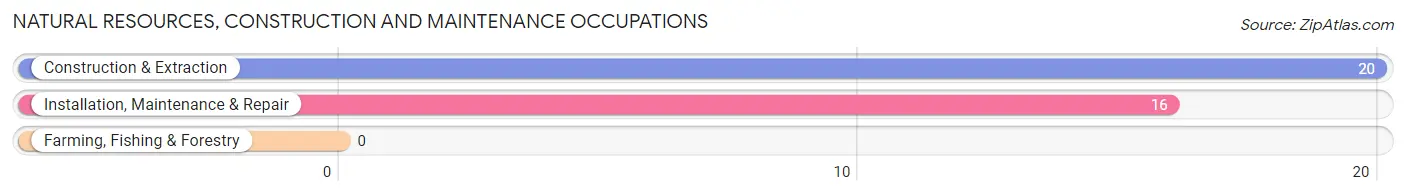
Natural Resources, Construction and Maintenance Occupations
The most common Natural Resources, Construction and Maintenance occupations in Plantsville are Construction & Extraction (20 | 1.7%), and Installation, Maintenance & Repair (16 | 1.4%).
Natural Resources, Construction and Maintenance Occupations by Sex
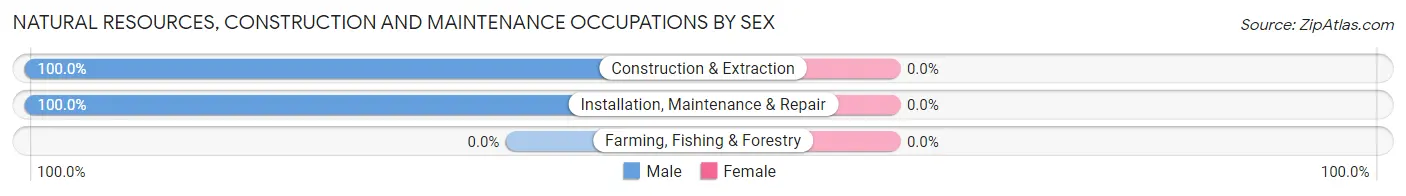
| Occupation | Male | Female |
| Farming, Fishing & Forestry | 0 (0.0%) | 0 (0.0%) |
| Construction & Extraction | 20 (100.0%) | 0 (0.0%) |
| Installation, Maintenance & Repair | 16 (100.0%) | 0 (0.0%) |
| Total (Category) | 36 (100.0%) | 0 (0.0%) |
| Total (Overall) | 503 (43.5%) | 654 (56.5%) |
Production, Transportation and Moving Occupations
The most common Production, Transportation and Moving occupations in Plantsville are Production (80 | 6.9%), and Transportation (20 | 1.7%).
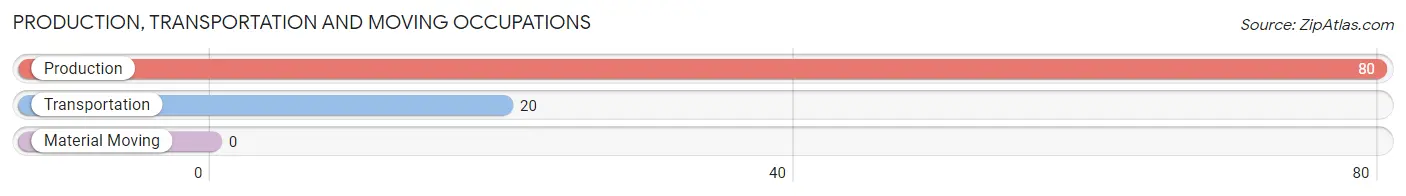
Production, Transportation and Moving Occupations by Sex
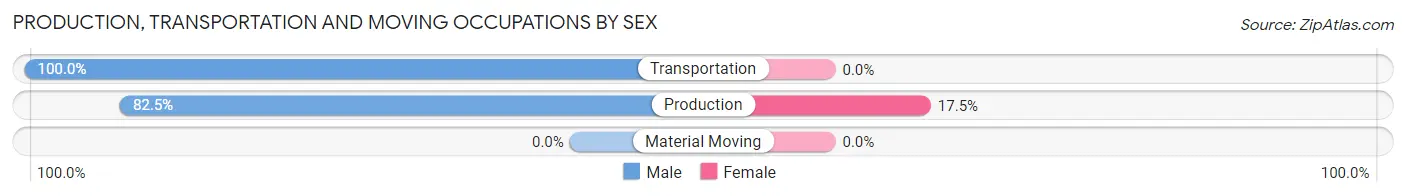
| Occupation | Male | Female |
| Production | 66 (82.5%) | 14 (17.5%) |
| Transportation | 20 (100.0%) | 0 (0.0%) |
| Material Moving | 0 (0.0%) | 0 (0.0%) |
| Total (Category) | 86 (86.0%) | 14 (14.0%) |
| Total (Overall) | 503 (43.5%) | 654 (56.5%) |
Employment Industries by Sex in Plantsville
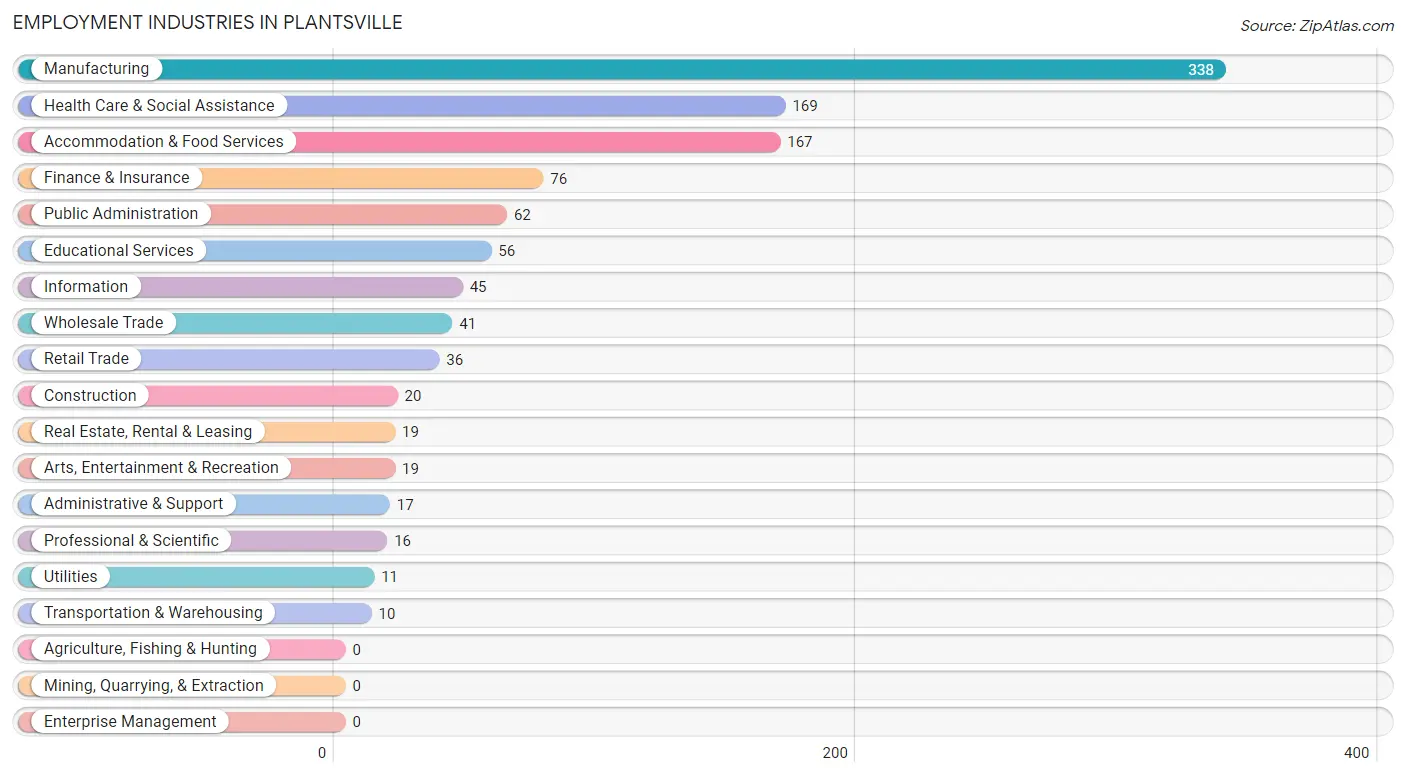
Employment Industries in Plantsville
The major employment industries in Plantsville include Manufacturing (338 | 29.2%), Health Care & Social Assistance (169 | 14.6%), Accommodation & Food Services (167 | 14.4%), Finance & Insurance (76 | 6.6%), and Public Administration (62 | 5.4%).
Employment Industries by Sex in Plantsville
The Plantsville industries that see more men than women are Construction (100.0%), Retail Trade (100.0%), and Transportation & Warehousing (100.0%), whereas the industries that tend to have a higher number of women are Utilities (100.0%), Finance & Insurance (100.0%), and Real Estate, Rental & Leasing (100.0%).
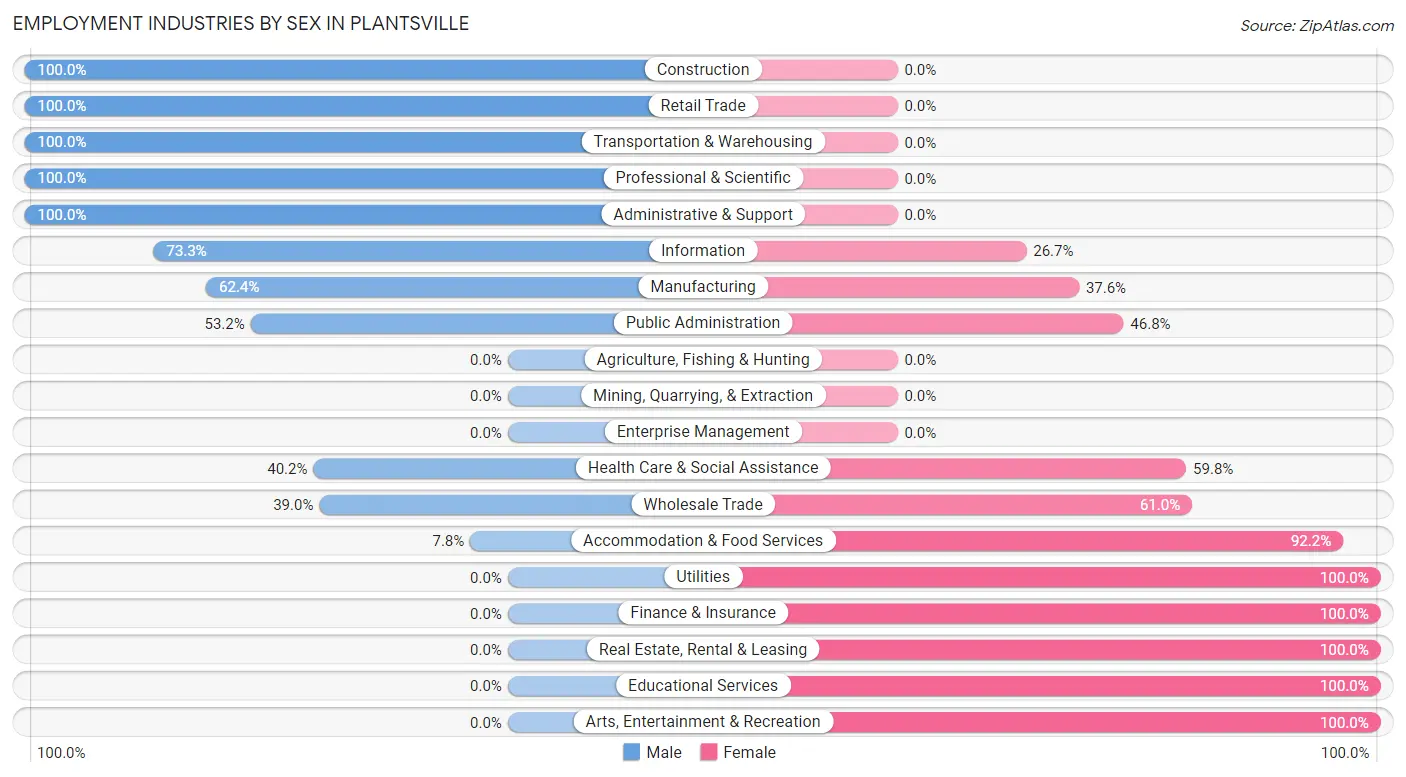
| Industry | Male | Female |
| Agriculture, Fishing & Hunting | 0 (0.0%) | 0 (0.0%) |
| Mining, Quarrying, & Extraction | 0 (0.0%) | 0 (0.0%) |
| Construction | 20 (100.0%) | 0 (0.0%) |
| Manufacturing | 211 (62.4%) | 127 (37.6%) |
| Wholesale Trade | 16 (39.0%) | 25 (61.0%) |
| Retail Trade | 36 (100.0%) | 0 (0.0%) |
| Transportation & Warehousing | 10 (100.0%) | 0 (0.0%) |
| Utilities | 0 (0.0%) | 11 (100.0%) |
| Information | 33 (73.3%) | 12 (26.7%) |
| Finance & Insurance | 0 (0.0%) | 76 (100.0%) |
| Real Estate, Rental & Leasing | 0 (0.0%) | 19 (100.0%) |
| Professional & Scientific | 16 (100.0%) | 0 (0.0%) |
| Enterprise Management | 0 (0.0%) | 0 (0.0%) |
| Administrative & Support | 17 (100.0%) | 0 (0.0%) |
| Educational Services | 0 (0.0%) | 56 (100.0%) |
| Health Care & Social Assistance | 68 (40.2%) | 101 (59.8%) |
| Arts, Entertainment & Recreation | 0 (0.0%) | 19 (100.0%) |
| Accommodation & Food Services | 13 (7.8%) | 154 (92.2%) |
| Public Administration | 33 (53.2%) | 29 (46.8%) |
| Total | 503 (43.5%) | 654 (56.5%) |
Education in Plantsville
School Enrollment in Plantsville
The most common levels of schooling among the 281 students in Plantsville are elementary school (75 | 26.7%), high school (68 | 24.2%), and middle school (59 | 21.0%).
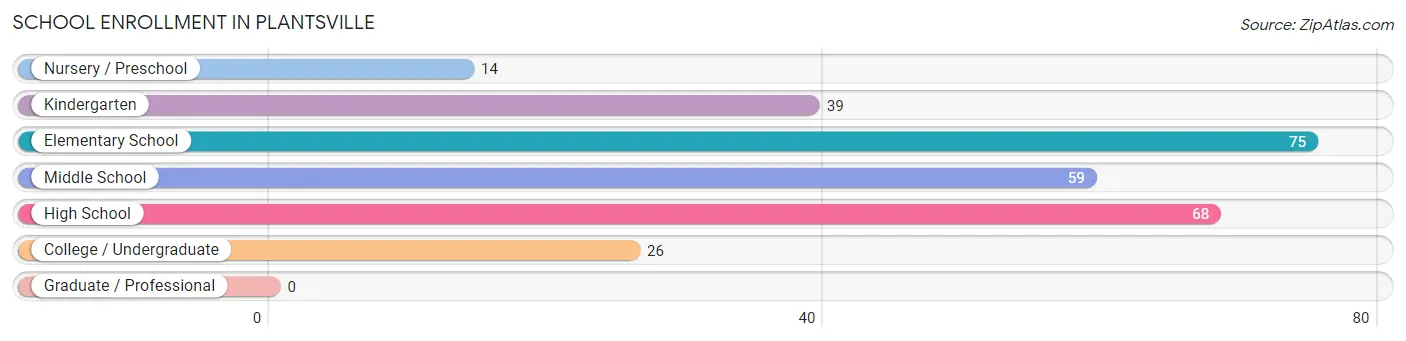
| School Level | # Students | % Students |
| Nursery / Preschool | 14 | 5.0% |
| Kindergarten | 39 | 13.9% |
| Elementary School | 75 | 26.7% |
| Middle School | 59 | 21.0% |
| High School | 68 | 24.2% |
| College / Undergraduate | 26 | 9.2% |
| Graduate / Professional | 0 | 0.0% |
| Total | 281 | 100.0% |
School Enrollment by Age by Funding Source in Plantsville
Out of a total of 281 students who are enrolled in schools in Plantsville, 48 (17.1%) attend a private institution, while the remaining 233 (82.9%) are enrolled in public schools. The age group of 3 to 4 year olds has the highest likelihood of being enrolled in private schools, with 14 (100.0% in the age bracket) enrolled. Conversely, the age group of 5 to 9 year old has the lowest likelihood of being enrolled in a private school, with 72 (100.0% in the age bracket) attending a public institution.
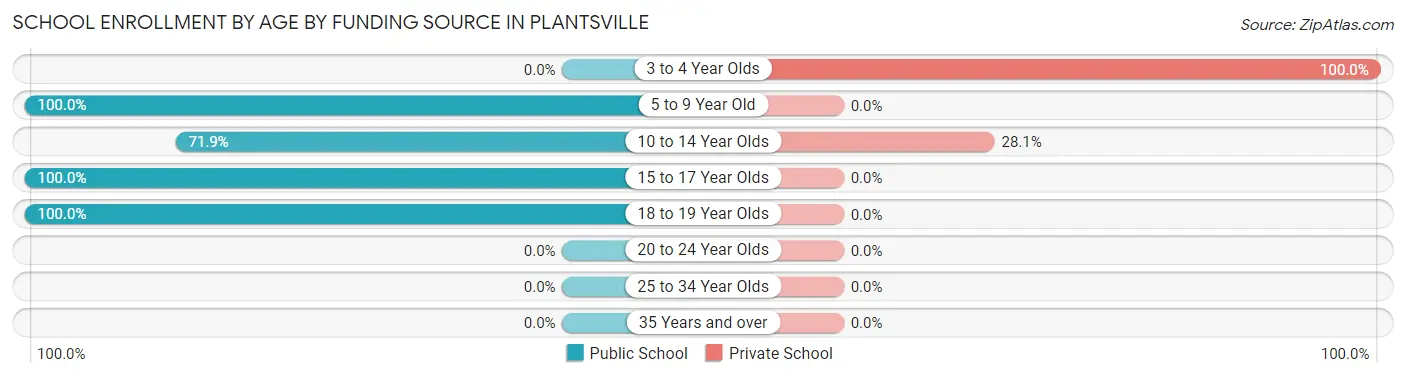
| Age Bracket | Public School | Private School |
| 3 to 4 Year Olds | 0 (0.0%) | 14 (100.0%) |
| 5 to 9 Year Old | 72 (100.0%) | 0 (0.0%) |
| 10 to 14 Year Olds | 87 (71.9%) | 34 (28.1%) |
| 15 to 17 Year Olds | 48 (100.0%) | 0 (0.0%) |
| 18 to 19 Year Olds | 26 (100.0%) | 0 (0.0%) |
| 20 to 24 Year Olds | 0 (0.0%) | 0 (0.0%) |
| 25 to 34 Year Olds | 0 (0.0%) | 0 (0.0%) |
| 35 Years and over | 0 (0.0%) | 0 (0.0%) |
| Total | 233 (82.9%) | 48 (17.1%) |
Educational Attainment by Field of Study in Plantsville
Business (96 | 19.5%), science & technology (73 | 14.8%), arts & humanities (61 | 12.4%), engineering (59 | 12.0%), and education (51 | 10.4%) are the most common fields of study among 492 individuals in Plantsville who have obtained a bachelor's degree or higher.
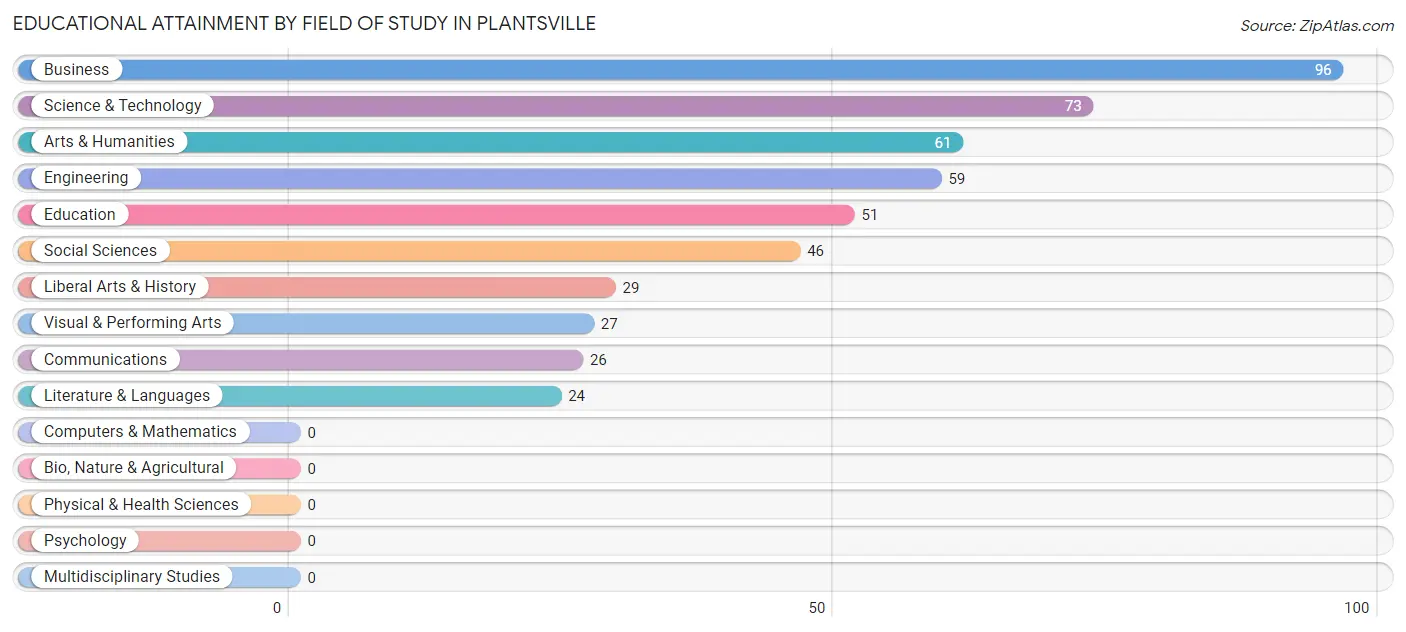
| Field of Study | # Graduates | % Graduates |
| Computers & Mathematics | 0 | 0.0% |
| Bio, Nature & Agricultural | 0 | 0.0% |
| Physical & Health Sciences | 0 | 0.0% |
| Psychology | 0 | 0.0% |
| Social Sciences | 46 | 9.3% |
| Engineering | 59 | 12.0% |
| Multidisciplinary Studies | 0 | 0.0% |
| Science & Technology | 73 | 14.8% |
| Business | 96 | 19.5% |
| Education | 51 | 10.4% |
| Literature & Languages | 24 | 4.9% |
| Liberal Arts & History | 29 | 5.9% |
| Visual & Performing Arts | 27 | 5.5% |
| Communications | 26 | 5.3% |
| Arts & Humanities | 61 | 12.4% |
| Total | 492 | 100.0% |
Transportation & Commute in Plantsville
Vehicle Availability by Sex in Plantsville
The most prevalent vehicle ownership categories in Plantsville are males with 2 vehicles (299, accounting for 60.7%) and females with 2 vehicles (364, making up 45.7%).
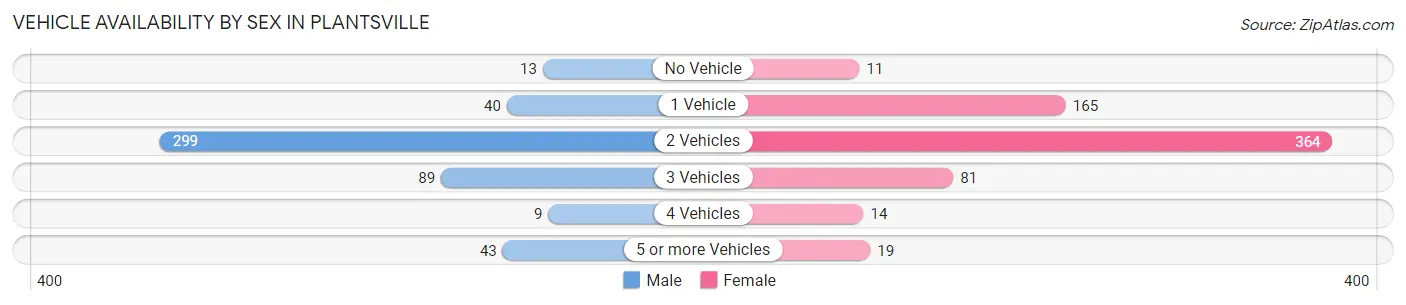
| Vehicles Available | Male | Female |
| No Vehicle | 13 (2.6%) | 11 (1.7%) |
| 1 Vehicle | 40 (8.1%) | 165 (25.2%) |
| 2 Vehicles | 299 (60.7%) | 364 (55.7%) |
| 3 Vehicles | 89 (18.0%) | 81 (12.4%) |
| 4 Vehicles | 9 (1.8%) | 14 (2.1%) |
| 5 or more Vehicles | 43 (8.7%) | 19 (2.9%) |
| Total | 493 (100.0%) | 654 (100.0%) |
Commute Time in Plantsville
The most frequently occuring commute durations in Plantsville are 5 to 9 minutes (239 commuters, 21.6%), 10 to 14 minutes (168 commuters, 15.2%), and 20 to 24 minutes (160 commuters, 14.5%).
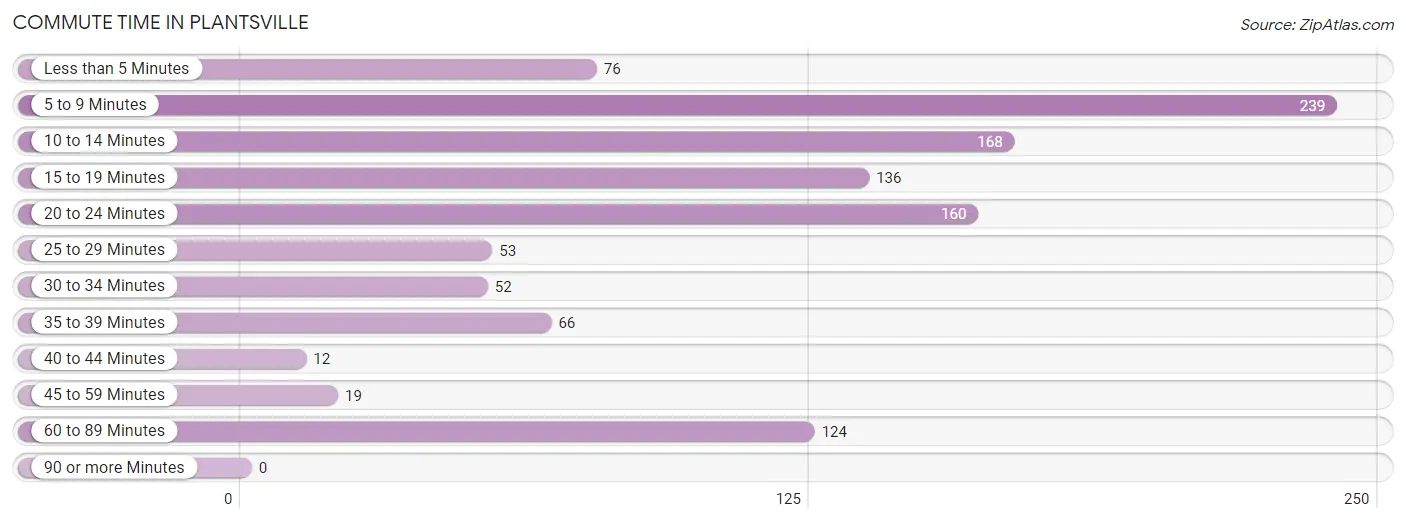
| Commute Time | # Commuters | % Commuters |
| Less than 5 Minutes | 76 | 6.9% |
| 5 to 9 Minutes | 239 | 21.6% |
| 10 to 14 Minutes | 168 | 15.2% |
| 15 to 19 Minutes | 136 | 12.3% |
| 20 to 24 Minutes | 160 | 14.5% |
| 25 to 29 Minutes | 53 | 4.8% |
| 30 to 34 Minutes | 52 | 4.7% |
| 35 to 39 Minutes | 66 | 6.0% |
| 40 to 44 Minutes | 12 | 1.1% |
| 45 to 59 Minutes | 19 | 1.7% |
| 60 to 89 Minutes | 124 | 11.2% |
| 90 or more Minutes | 0 | 0.0% |
Commute Time by Sex in Plantsville
The most common commute times in Plantsville are 10 to 14 minutes (137 commuters, 29.5%) for males and 5 to 9 minutes (203 commuters, 31.7%) for females.
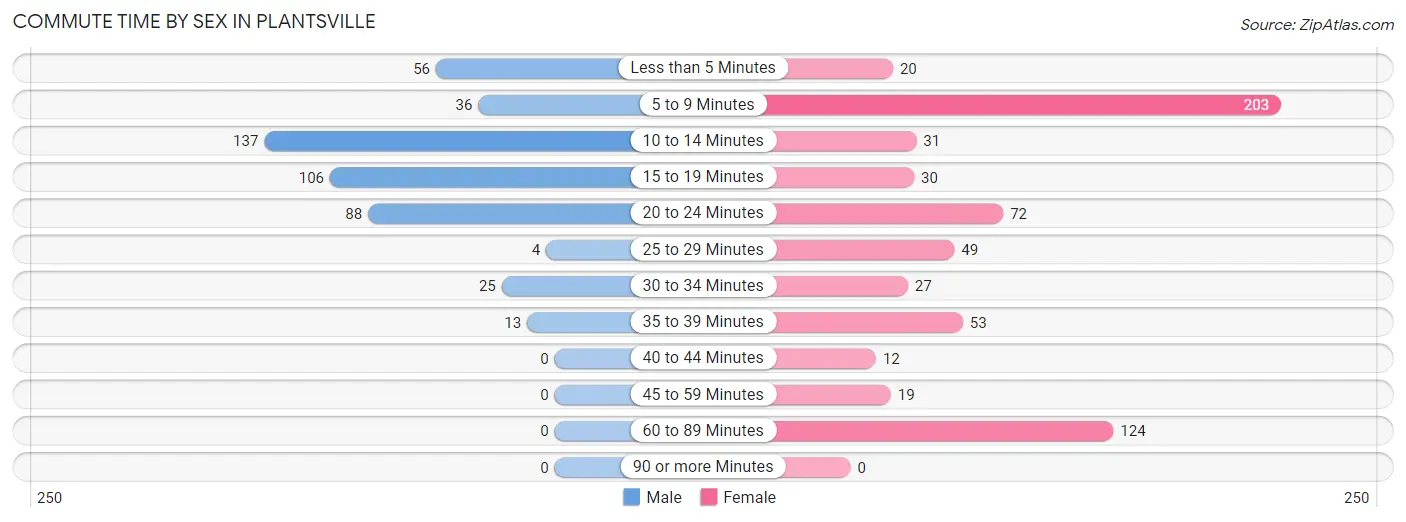
| Commute Time | Male | Female |
| Less than 5 Minutes | 56 (12.0%) | 20 (3.1%) |
| 5 to 9 Minutes | 36 (7.7%) | 203 (31.7%) |
| 10 to 14 Minutes | 137 (29.5%) | 31 (4.8%) |
| 15 to 19 Minutes | 106 (22.8%) | 30 (4.7%) |
| 20 to 24 Minutes | 88 (18.9%) | 72 (11.3%) |
| 25 to 29 Minutes | 4 (0.9%) | 49 (7.7%) |
| 30 to 34 Minutes | 25 (5.4%) | 27 (4.2%) |
| 35 to 39 Minutes | 13 (2.8%) | 53 (8.3%) |
| 40 to 44 Minutes | 0 (0.0%) | 12 (1.9%) |
| 45 to 59 Minutes | 0 (0.0%) | 19 (3.0%) |
| 60 to 89 Minutes | 0 (0.0%) | 124 (19.4%) |
| 90 or more Minutes | 0 (0.0%) | 0 (0.0%) |
Time of Departure to Work by Sex in Plantsville
The most frequent times of departure to work in Plantsville are 5:00 AM to 5:29 AM (140, 30.1%) for males and 8:00 AM to 8:29 AM (153, 23.9%) for females.
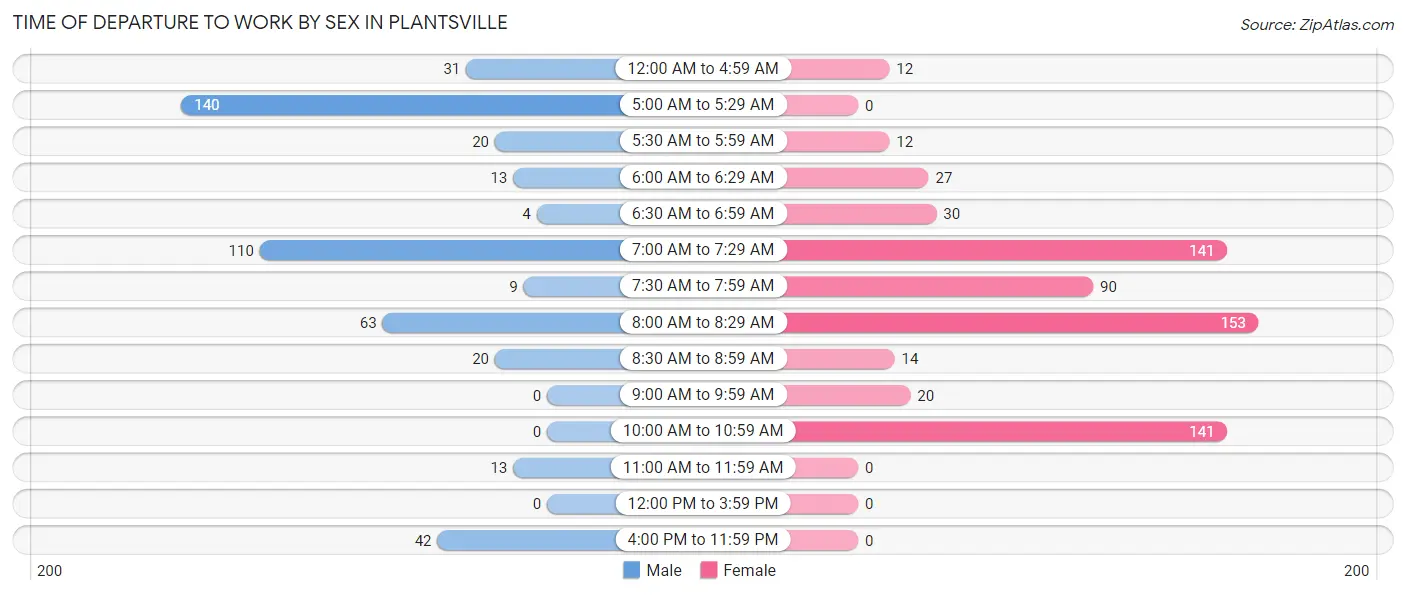
| Time of Departure | Male | Female |
| 12:00 AM to 4:59 AM | 31 (6.7%) | 12 (1.9%) |
| 5:00 AM to 5:29 AM | 140 (30.1%) | 0 (0.0%) |
| 5:30 AM to 5:59 AM | 20 (4.3%) | 12 (1.9%) |
| 6:00 AM to 6:29 AM | 13 (2.8%) | 27 (4.2%) |
| 6:30 AM to 6:59 AM | 4 (0.9%) | 30 (4.7%) |
| 7:00 AM to 7:29 AM | 110 (23.7%) | 141 (22.0%) |
| 7:30 AM to 7:59 AM | 9 (1.9%) | 90 (14.1%) |
| 8:00 AM to 8:29 AM | 63 (13.6%) | 153 (23.9%) |
| 8:30 AM to 8:59 AM | 20 (4.3%) | 14 (2.2%) |
| 9:00 AM to 9:59 AM | 0 (0.0%) | 20 (3.1%) |
| 10:00 AM to 10:59 AM | 0 (0.0%) | 141 (22.0%) |
| 11:00 AM to 11:59 AM | 13 (2.8%) | 0 (0.0%) |
| 12:00 PM to 3:59 PM | 0 (0.0%) | 0 (0.0%) |
| 4:00 PM to 11:59 PM | 42 (9.0%) | 0 (0.0%) |
| Total | 465 (100.0%) | 640 (100.0%) |
Housing Occupancy in Plantsville
Occupancy by Ownership in Plantsville
Of the total 998 dwellings in Plantsville, owner-occupied units account for 679 (68.0%), while renter-occupied units make up 319 (32.0%).
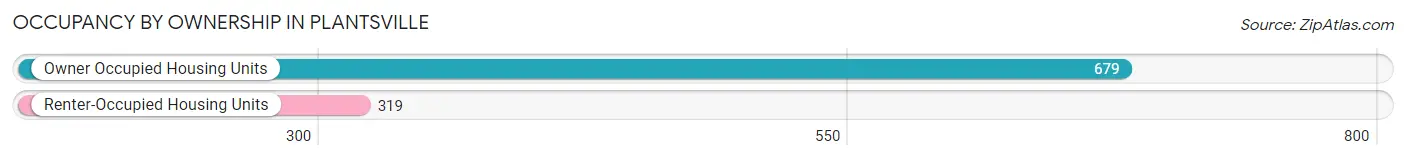
| Occupancy | # Housing Units | % Housing Units |
| Owner Occupied Housing Units | 679 | 68.0% |
| Renter-Occupied Housing Units | 319 | 32.0% |
| Total Occupied Housing Units | 998 | 100.0% |
Occupancy by Household Size in Plantsville
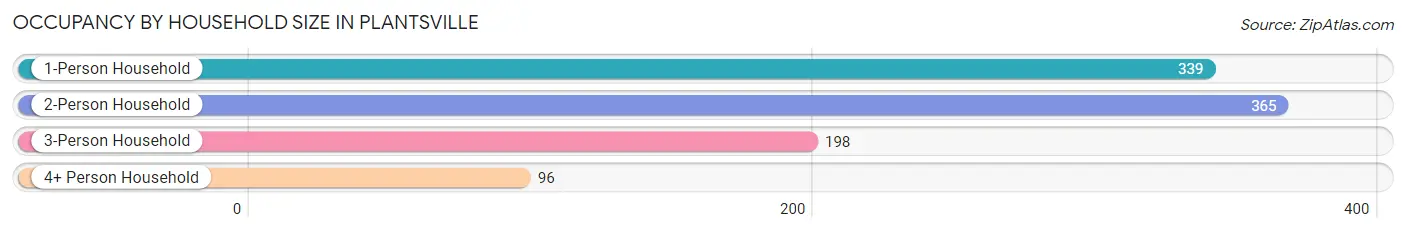
| Household Size | # Housing Units | % Housing Units |
| 1-Person Household | 339 | 34.0% |
| 2-Person Household | 365 | 36.6% |
| 3-Person Household | 198 | 19.8% |
| 4+ Person Household | 96 | 9.6% |
| Total Housing Units | 998 | 100.0% |
Occupancy by Ownership by Household Size in Plantsville
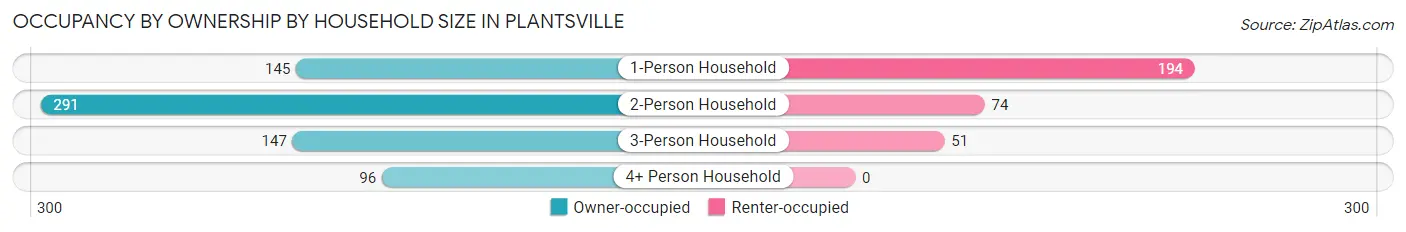
| Household Size | Owner-occupied | Renter-occupied |
| 1-Person Household | 145 (42.8%) | 194 (57.2%) |
| 2-Person Household | 291 (79.7%) | 74 (20.3%) |
| 3-Person Household | 147 (74.2%) | 51 (25.8%) |
| 4+ Person Household | 96 (100.0%) | 0 (0.0%) |
| Total Housing Units | 679 (68.0%) | 319 (32.0%) |
Occupancy by Educational Attainment in Plantsville
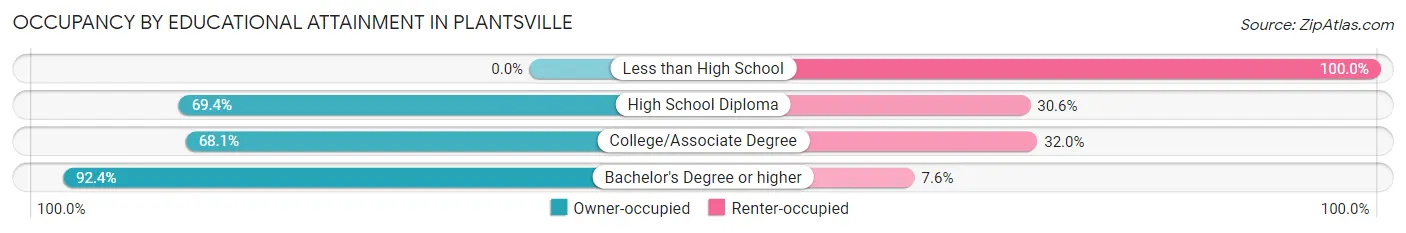
| Household Size | Owner-occupied | Renter-occupied |
| Less than High School | 0 (0.0%) | 99 (100.0%) |
| High School Diploma | 175 (69.4%) | 77 (30.6%) |
| College/Associate Degree | 262 (68.0%) | 123 (32.0%) |
| Bachelor's Degree or higher | 242 (92.4%) | 20 (7.6%) |
Occupancy by Age of Householder in Plantsville
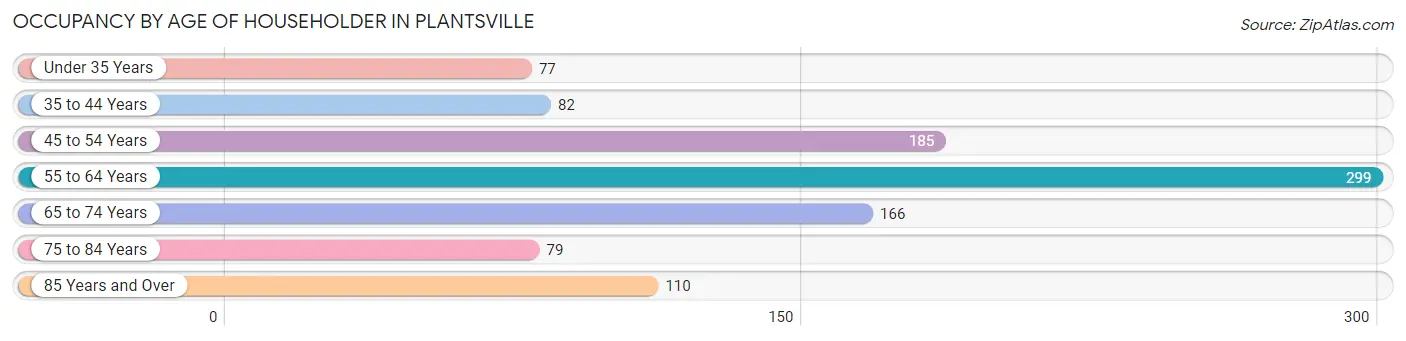
| Age Bracket | # Households | % Households |
| Under 35 Years | 77 | 7.7% |
| 35 to 44 Years | 82 | 8.2% |
| 45 to 54 Years | 185 | 18.5% |
| 55 to 64 Years | 299 | 30.0% |
| 65 to 74 Years | 166 | 16.6% |
| 75 to 84 Years | 79 | 7.9% |
| 85 Years and Over | 110 | 11.0% |
| Total | 998 | 100.0% |
Housing Finances in Plantsville
Median Income by Occupancy in Plantsville
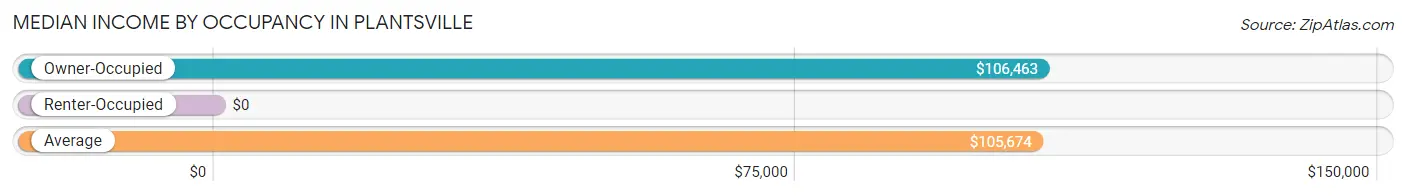
| Occupancy Type | # Households | Median Income |
| Owner-Occupied | 679 (68.0%) | $106,463 |
| Renter-Occupied | 319 (32.0%) | $0 |
| Average | 998 (100.0%) | $105,674 |
Occupancy by Householder Income Bracket in Plantsville
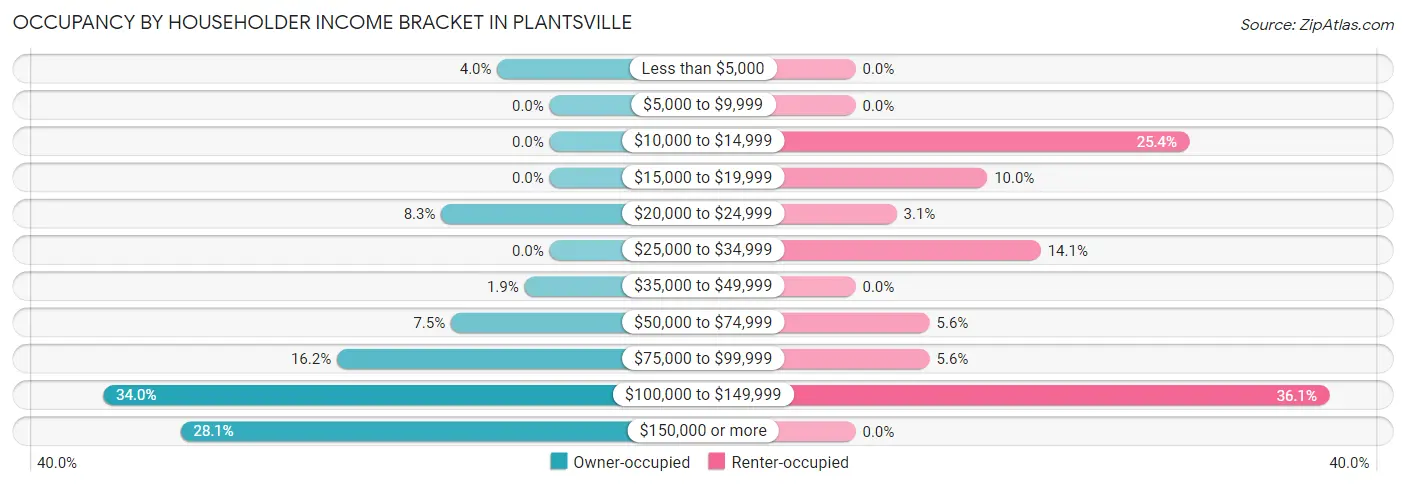
| Income Bracket | Owner-occupied | Renter-occupied |
| Less than $5,000 | 27 (4.0%) | 0 (0.0%) |
| $5,000 to $9,999 | 0 (0.0%) | 0 (0.0%) |
| $10,000 to $14,999 | 0 (0.0%) | 81 (25.4%) |
| $15,000 to $19,999 | 0 (0.0%) | 32 (10.0%) |
| $20,000 to $24,999 | 56 (8.3%) | 10 (3.1%) |
| $25,000 to $34,999 | 0 (0.0%) | 45 (14.1%) |
| $35,000 to $49,999 | 13 (1.9%) | 0 (0.0%) |
| $50,000 to $74,999 | 51 (7.5%) | 18 (5.6%) |
| $75,000 to $99,999 | 110 (16.2%) | 18 (5.6%) |
| $100,000 to $149,999 | 231 (34.0%) | 115 (36.0%) |
| $150,000 or more | 191 (28.1%) | 0 (0.0%) |
| Total | 679 (100.0%) | 319 (100.0%) |
Monthly Housing Cost Tiers in Plantsville
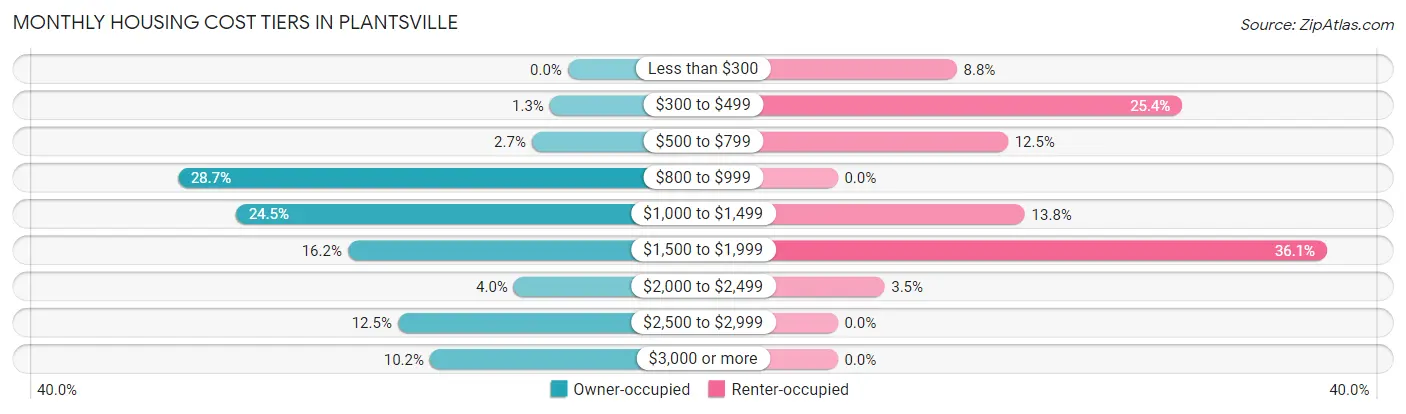
| Monthly Cost | Owner-occupied | Renter-occupied |
| Less than $300 | 0 (0.0%) | 28 (8.8%) |
| $300 to $499 | 9 (1.3%) | 81 (25.4%) |
| $500 to $799 | 18 (2.6%) | 40 (12.5%) |
| $800 to $999 | 195 (28.7%) | 0 (0.0%) |
| $1,000 to $1,499 | 166 (24.4%) | 44 (13.8%) |
| $1,500 to $1,999 | 110 (16.2%) | 115 (36.0%) |
| $2,000 to $2,499 | 27 (4.0%) | 11 (3.5%) |
| $2,500 to $2,999 | 85 (12.5%) | 0 (0.0%) |
| $3,000 or more | 69 (10.2%) | 0 (0.0%) |
| Total | 679 (100.0%) | 319 (100.0%) |
Physical Housing Characteristics in Plantsville
Housing Structures in Plantsville
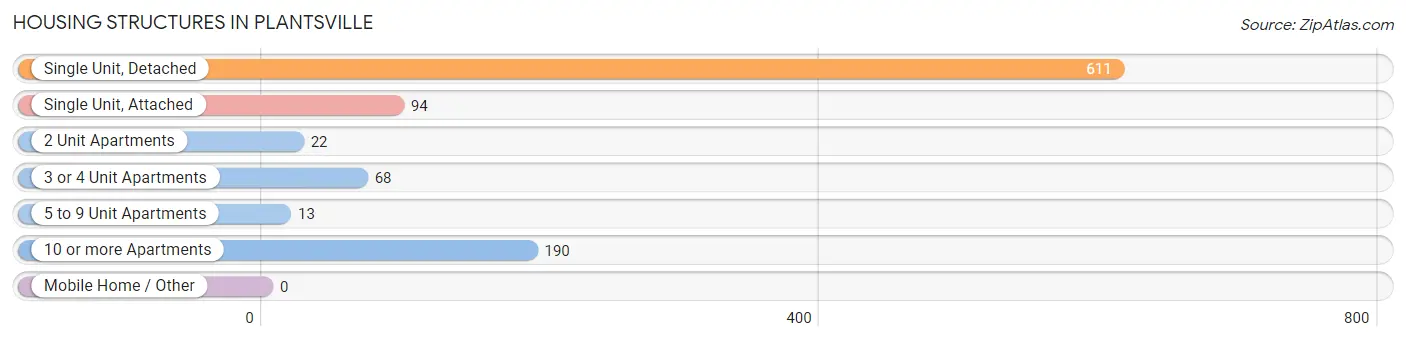
| Structure Type | # Housing Units | % Housing Units |
| Single Unit, Detached | 611 | 61.2% |
| Single Unit, Attached | 94 | 9.4% |
| 2 Unit Apartments | 22 | 2.2% |
| 3 or 4 Unit Apartments | 68 | 6.8% |
| 5 to 9 Unit Apartments | 13 | 1.3% |
| 10 or more Apartments | 190 | 19.0% |
| Mobile Home / Other | 0 | 0.0% |
| Total | 998 | 100.0% |
Housing Structures by Occupancy in Plantsville
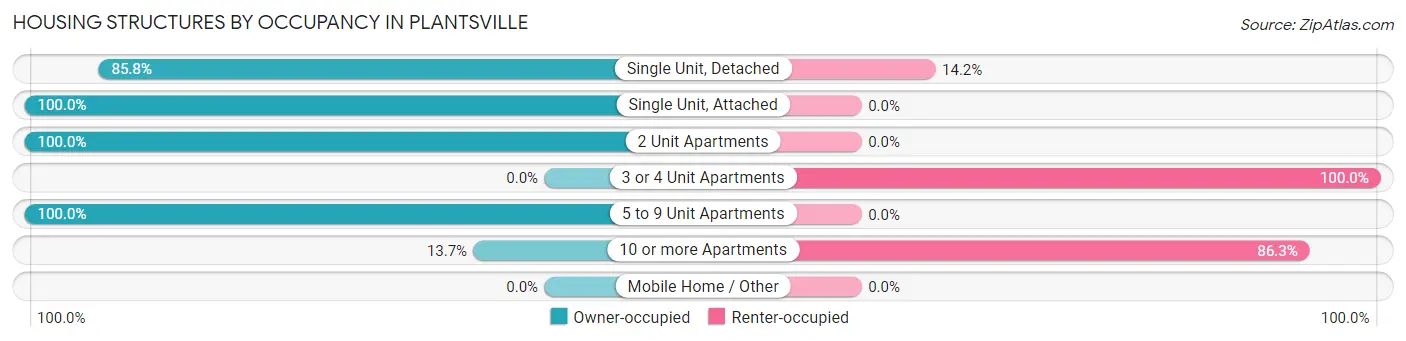
| Structure Type | Owner-occupied | Renter-occupied |
| Single Unit, Detached | 524 (85.8%) | 87 (14.2%) |
| Single Unit, Attached | 94 (100.0%) | 0 (0.0%) |
| 2 Unit Apartments | 22 (100.0%) | 0 (0.0%) |
| 3 or 4 Unit Apartments | 0 (0.0%) | 68 (100.0%) |
| 5 to 9 Unit Apartments | 13 (100.0%) | 0 (0.0%) |
| 10 or more Apartments | 26 (13.7%) | 164 (86.3%) |
| Mobile Home / Other | 0 (0.0%) | 0 (0.0%) |
| Total | 679 (68.0%) | 319 (32.0%) |
Housing Structures by Number of Rooms in Plantsville
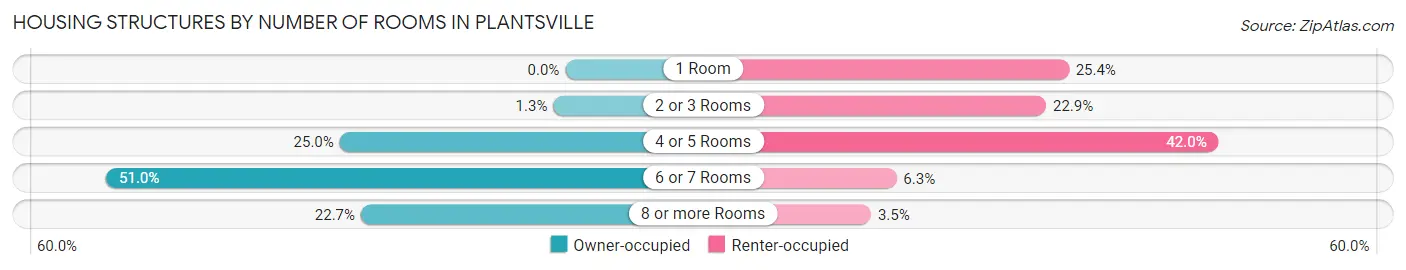
| Number of Rooms | Owner-occupied | Renter-occupied |
| 1 Room | 0 (0.0%) | 81 (25.4%) |
| 2 or 3 Rooms | 9 (1.3%) | 73 (22.9%) |
| 4 or 5 Rooms | 170 (25.0%) | 134 (42.0%) |
| 6 or 7 Rooms | 346 (51.0%) | 20 (6.3%) |
| 8 or more Rooms | 154 (22.7%) | 11 (3.5%) |
| Total | 679 (100.0%) | 319 (100.0%) |
Housing Structure by Heating Type in Plantsville
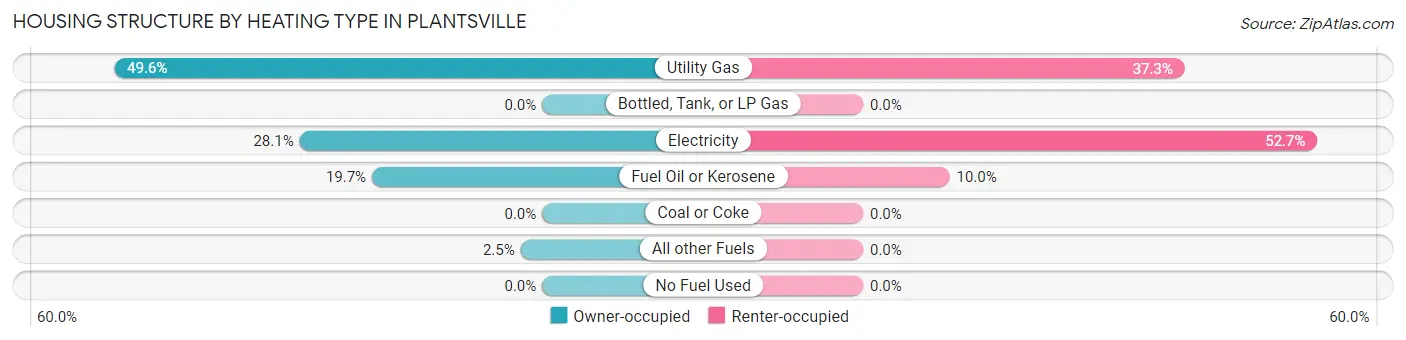
| Heating Type | Owner-occupied | Renter-occupied |
| Utility Gas | 337 (49.6%) | 119 (37.3%) |
| Bottled, Tank, or LP Gas | 0 (0.0%) | 0 (0.0%) |
| Electricity | 191 (28.1%) | 168 (52.7%) |
| Fuel Oil or Kerosene | 134 (19.7%) | 32 (10.0%) |
| Coal or Coke | 0 (0.0%) | 0 (0.0%) |
| All other Fuels | 17 (2.5%) | 0 (0.0%) |
| No Fuel Used | 0 (0.0%) | 0 (0.0%) |
| Total | 679 (100.0%) | 319 (100.0%) |
Household Vehicle Usage in Plantsville
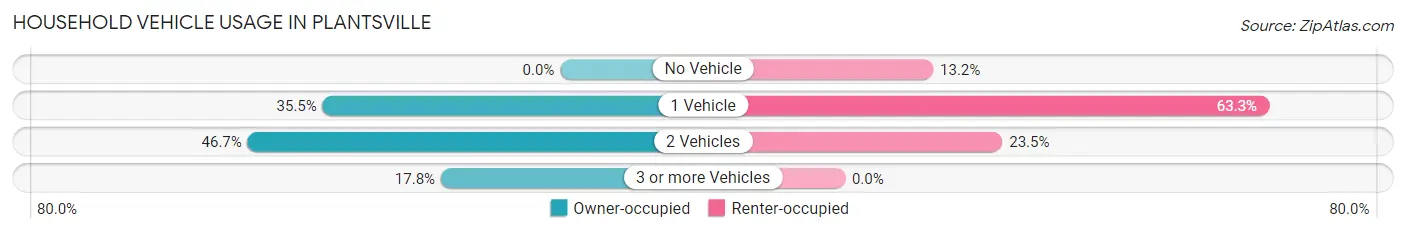
| Vehicles per Household | Owner-occupied | Renter-occupied |
| No Vehicle | 0 (0.0%) | 42 (13.2%) |
| 1 Vehicle | 241 (35.5%) | 202 (63.3%) |
| 2 Vehicles | 317 (46.7%) | 75 (23.5%) |
| 3 or more Vehicles | 121 (17.8%) | 0 (0.0%) |
| Total | 679 (100.0%) | 319 (100.0%) |
Real Estate & Mortgages in Plantsville
Real Estate and Mortgage Overview in Plantsville
| Characteristic | Without Mortgage | With Mortgage |
| Housing Units | 412 | 267 |
| Median Property Value | $281,800 | $349,000 |
| Median Household Income | $105,035 | $154 |
| Monthly Housing Costs | $970 | $69 |
| Real Estate Taxes | $4,646 | $0 |
Property Value by Mortgage Status in Plantsville
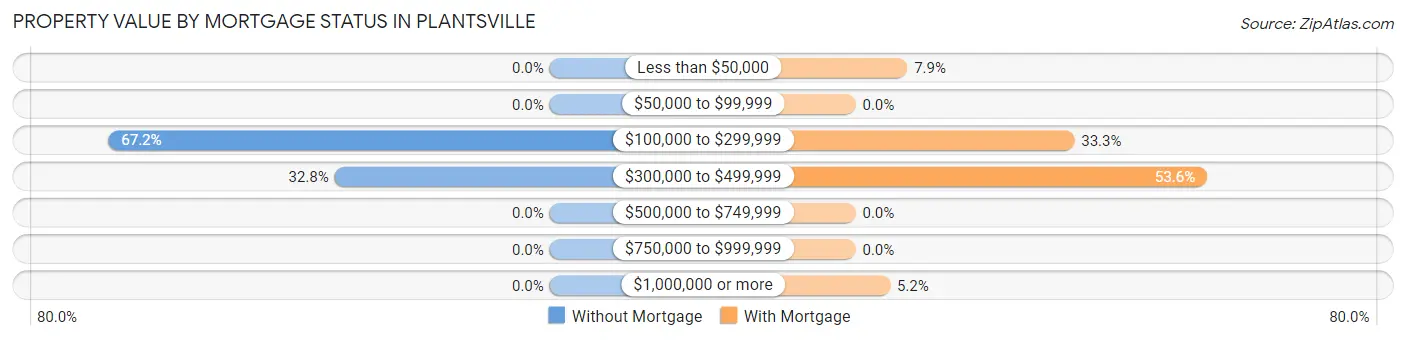
| Property Value | Without Mortgage | With Mortgage |
| Less than $50,000 | 0 (0.0%) | 21 (7.9%) |
| $50,000 to $99,999 | 0 (0.0%) | 0 (0.0%) |
| $100,000 to $299,999 | 277 (67.2%) | 89 (33.3%) |
| $300,000 to $499,999 | 135 (32.8%) | 143 (53.6%) |
| $500,000 to $749,999 | 0 (0.0%) | 0 (0.0%) |
| $750,000 to $999,999 | 0 (0.0%) | 0 (0.0%) |
| $1,000,000 or more | 0 (0.0%) | 14 (5.2%) |
| Total | 412 (100.0%) | 267 (100.0%) |
Household Income by Mortgage Status in Plantsville
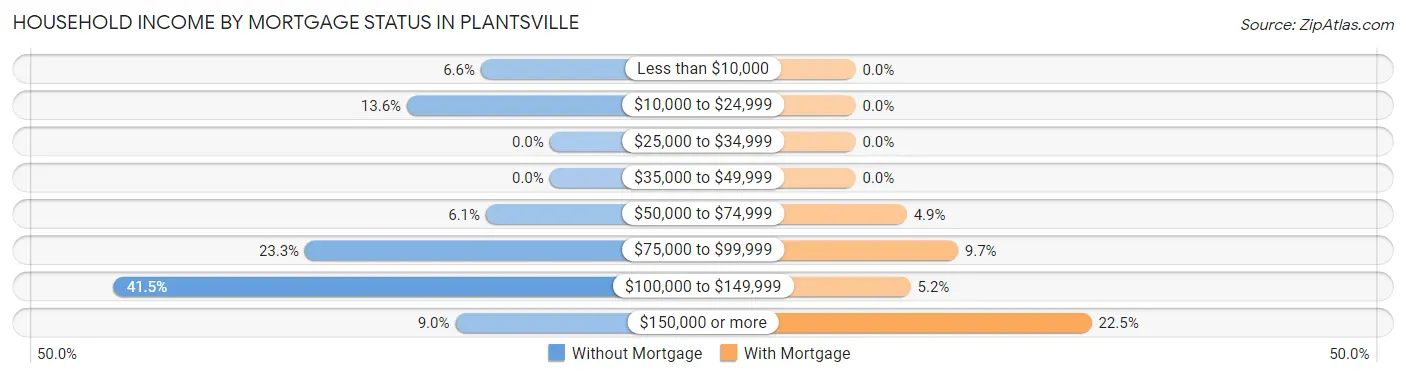
| Household Income | Without Mortgage | With Mortgage |
| Less than $10,000 | 27 (6.6%) | 0 (0.0%) |
| $10,000 to $24,999 | 56 (13.6%) | 0 (0.0%) |
| $25,000 to $34,999 | 0 (0.0%) | 0 (0.0%) |
| $35,000 to $49,999 | 0 (0.0%) | 0 (0.0%) |
| $50,000 to $74,999 | 25 (6.1%) | 13 (4.9%) |
| $75,000 to $99,999 | 96 (23.3%) | 26 (9.7%) |
| $100,000 to $149,999 | 171 (41.5%) | 14 (5.2%) |
| $150,000 or more | 37 (9.0%) | 60 (22.5%) |
| Total | 412 (100.0%) | 267 (100.0%) |
Property Value to Household Income Ratio in Plantsville
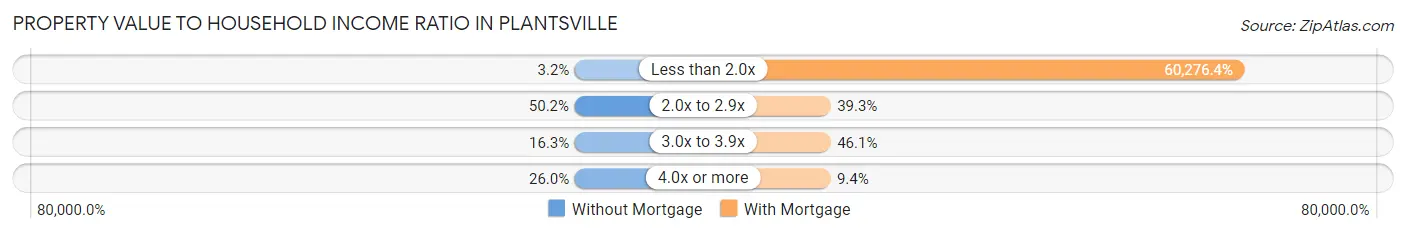
| Value-to-Income Ratio | Without Mortgage | With Mortgage |
| Less than 2.0x | 13 (3.2%) | 160,938 (60,276.4%) |
| 2.0x to 2.9x | 207 (50.2%) | 105 (39.3%) |
| 3.0x to 3.9x | 67 (16.3%) | 123 (46.1%) |
| 4.0x or more | 107 (26.0%) | 25 (9.4%) |
| Total | 412 (100.0%) | 267 (100.0%) |
Real Estate Taxes by Mortgage Status in Plantsville
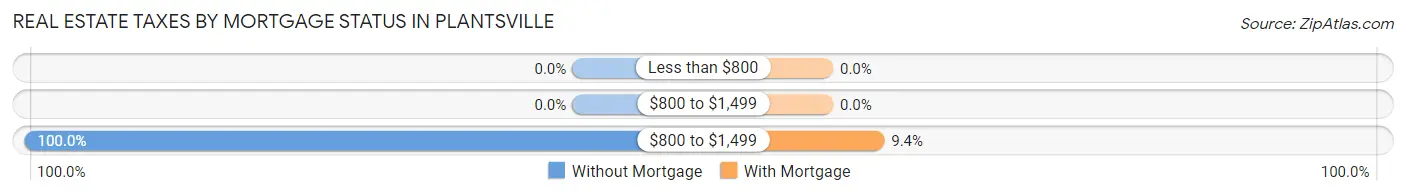
| Property Taxes | Without Mortgage | With Mortgage |
| Less than $800 | 0 (0.0%) | 0 (0.0%) |
| $800 to $1,499 | 0 (0.0%) | 0 (0.0%) |
| $800 to $1,499 | 412 (100.0%) | 25 (9.4%) |
| Total | 412 (100.0%) | 267 (100.0%) |
Health & Disability in Plantsville
Health Insurance Coverage by Age in Plantsville
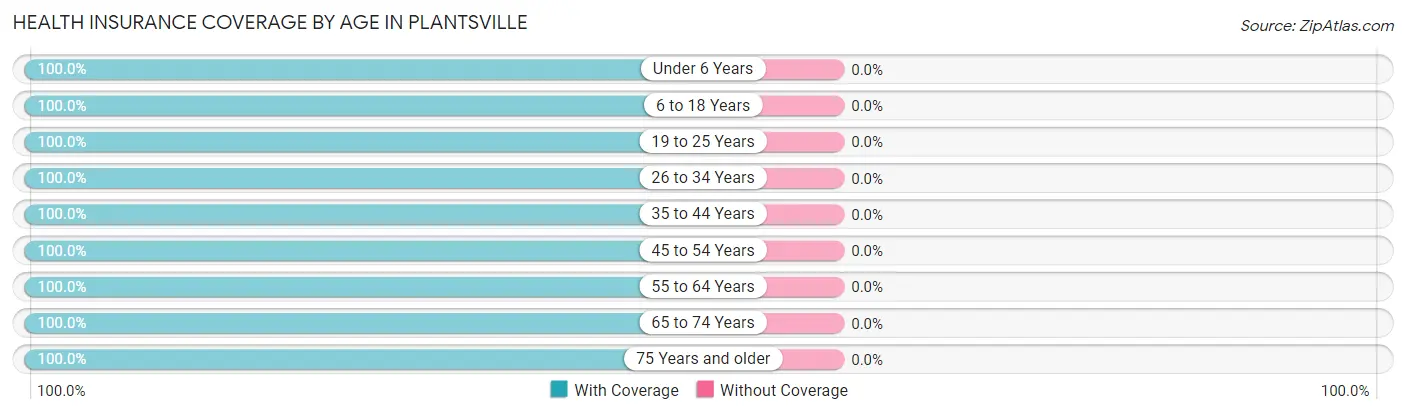
| Age Bracket | With Coverage | Without Coverage |
| Under 6 Years | 134 (100.0%) | 0 (0.0%) |
| 6 to 18 Years | 202 (100.0%) | 0 (0.0%) |
| 19 to 25 Years | 94 (100.0%) | 0 (0.0%) |
| 26 to 34 Years | 140 (100.0%) | 0 (0.0%) |
| 35 to 44 Years | 96 (100.0%) | 0 (0.0%) |
| 45 to 54 Years | 390 (100.0%) | 0 (0.0%) |
| 55 to 64 Years | 479 (100.0%) | 0 (0.0%) |
| 65 to 74 Years | 227 (100.0%) | 0 (0.0%) |
| 75 Years and older | 322 (100.0%) | 0 (0.0%) |
| Total | 2,084 (100.0%) | 0 (0.0%) |
Health Insurance Coverage by Citizenship Status in Plantsville
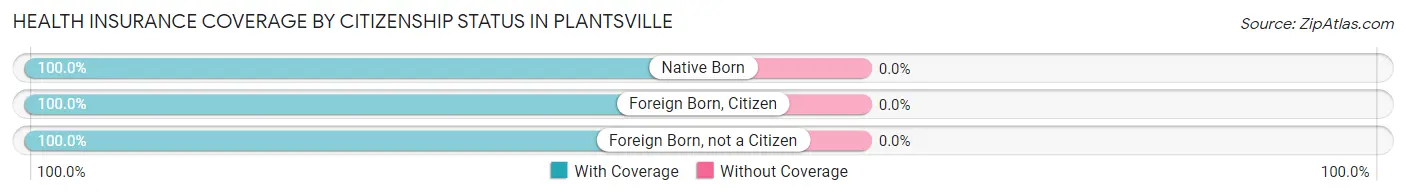
| Citizenship Status | With Coverage | Without Coverage |
| Native Born | 134 (100.0%) | 0 (0.0%) |
| Foreign Born, Citizen | 202 (100.0%) | 0 (0.0%) |
| Foreign Born, not a Citizen | 94 (100.0%) | 0 (0.0%) |
Health Insurance Coverage by Household Income in Plantsville
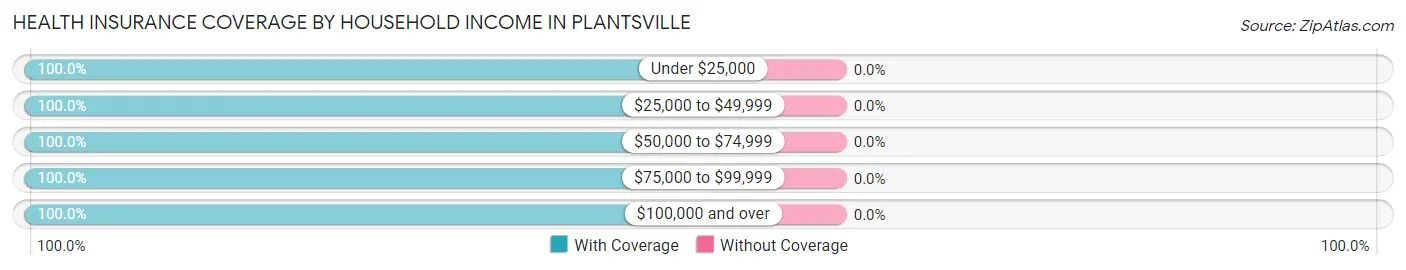
| Household Income | With Coverage | Without Coverage |
| Under $25,000 | 230 (100.0%) | 0 (0.0%) |
| $25,000 to $49,999 | 124 (100.0%) | 0 (0.0%) |
| $50,000 to $74,999 | 95 (100.0%) | 0 (0.0%) |
| $75,000 to $99,999 | 320 (100.0%) | 0 (0.0%) |
| $100,000 and over | 1,315 (100.0%) | 0 (0.0%) |
Public vs Private Health Insurance Coverage by Age in Plantsville
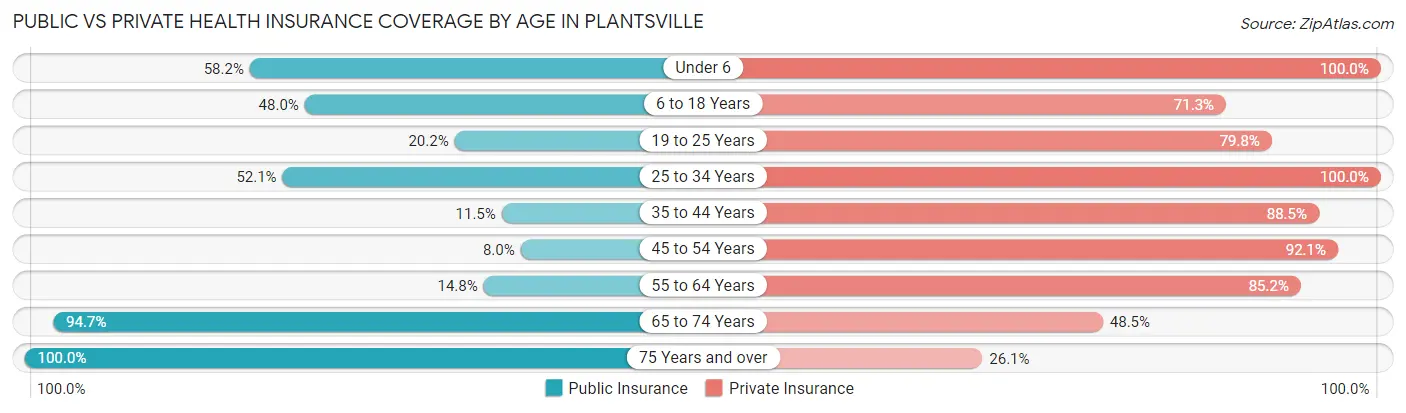
| Age Bracket | Public Insurance | Private Insurance |
| Under 6 | 78 (58.2%) | 134 (100.0%) |
| 6 to 18 Years | 97 (48.0%) | 144 (71.3%) |
| 19 to 25 Years | 19 (20.2%) | 75 (79.8%) |
| 25 to 34 Years | 73 (52.1%) | 140 (100.0%) |
| 35 to 44 Years | 11 (11.5%) | 85 (88.5%) |
| 45 to 54 Years | 31 (8.0%) | 359 (92.0%) |
| 55 to 64 Years | 71 (14.8%) | 408 (85.2%) |
| 65 to 74 Years | 215 (94.7%) | 110 (48.5%) |
| 75 Years and over | 322 (100.0%) | 84 (26.1%) |
| Total | 917 (44.0%) | 1,539 (73.9%) |
Disability Status by Sex by Age in Plantsville
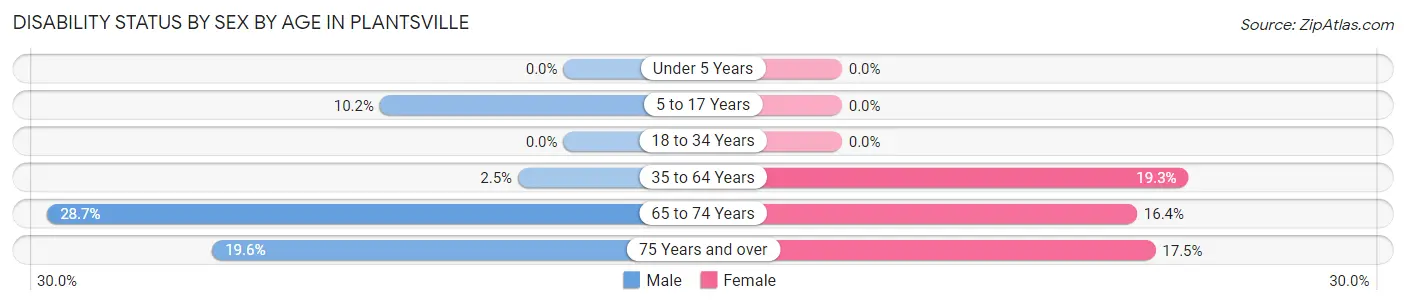
| Age Bracket | Male | Female |
| Under 5 Years | 0 (0.0%) | 0 (0.0%) |
| 5 to 17 Years | 14 (10.2%) | 0 (0.0%) |
| 18 to 34 Years | 0 (0.0%) | 0 (0.0%) |
| 35 to 64 Years | 10 (2.5%) | 110 (19.3%) |
| 65 to 74 Years | 25 (28.7%) | 23 (16.4%) |
| 75 Years and over | 26 (19.6%) | 33 (17.5%) |
Disability Class by Sex by Age in Plantsville
Disability Class: Hearing Difficulty
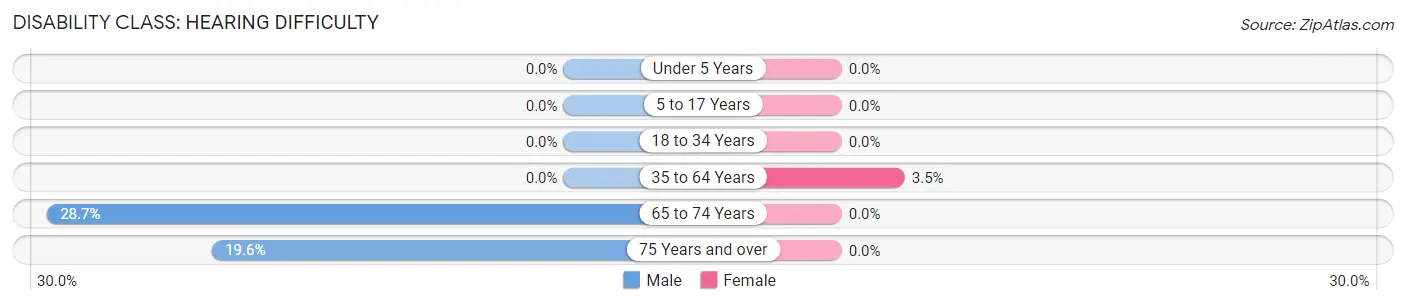
| Age Bracket | Male | Female |
| Under 5 Years | 0 (0.0%) | 0 (0.0%) |
| 5 to 17 Years | 0 (0.0%) | 0 (0.0%) |
| 18 to 34 Years | 0 (0.0%) | 0 (0.0%) |
| 35 to 64 Years | 0 (0.0%) | 20 (3.5%) |
| 65 to 74 Years | 25 (28.7%) | 0 (0.0%) |
| 75 Years and over | 26 (19.6%) | 0 (0.0%) |
Disability Class: Vision Difficulty
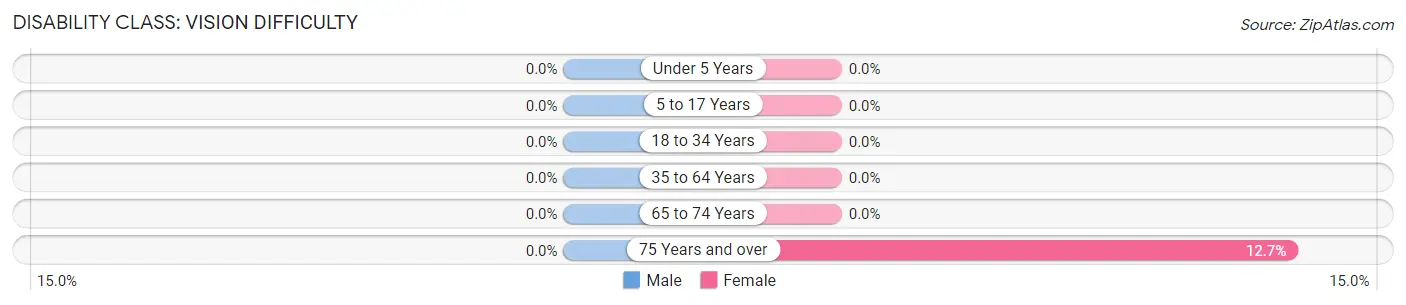
| Age Bracket | Male | Female |
| Under 5 Years | 0 (0.0%) | 0 (0.0%) |
| 5 to 17 Years | 0 (0.0%) | 0 (0.0%) |
| 18 to 34 Years | 0 (0.0%) | 0 (0.0%) |
| 35 to 64 Years | 0 (0.0%) | 0 (0.0%) |
| 65 to 74 Years | 0 (0.0%) | 0 (0.0%) |
| 75 Years and over | 0 (0.0%) | 24 (12.7%) |
Disability Class: Cognitive Difficulty
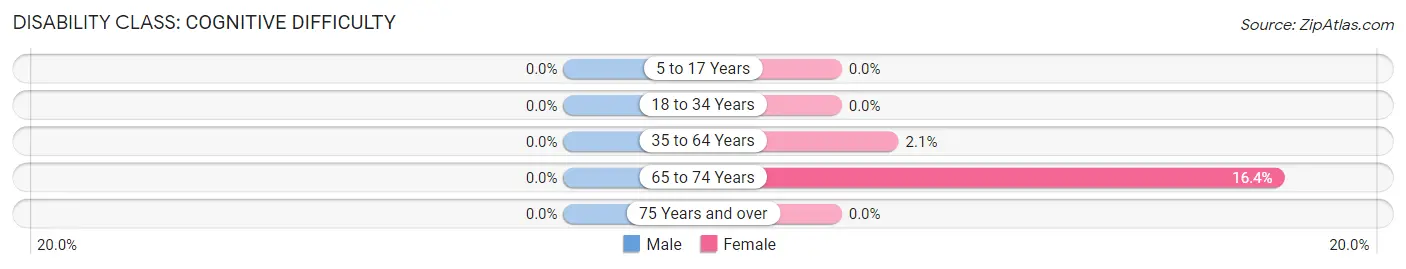
| Age Bracket | Male | Female |
| 5 to 17 Years | 0 (0.0%) | 0 (0.0%) |
| 18 to 34 Years | 0 (0.0%) | 0 (0.0%) |
| 35 to 64 Years | 0 (0.0%) | 12 (2.1%) |
| 65 to 74 Years | 0 (0.0%) | 23 (16.4%) |
| 75 Years and over | 0 (0.0%) | 0 (0.0%) |
Disability Class: Ambulatory Difficulty
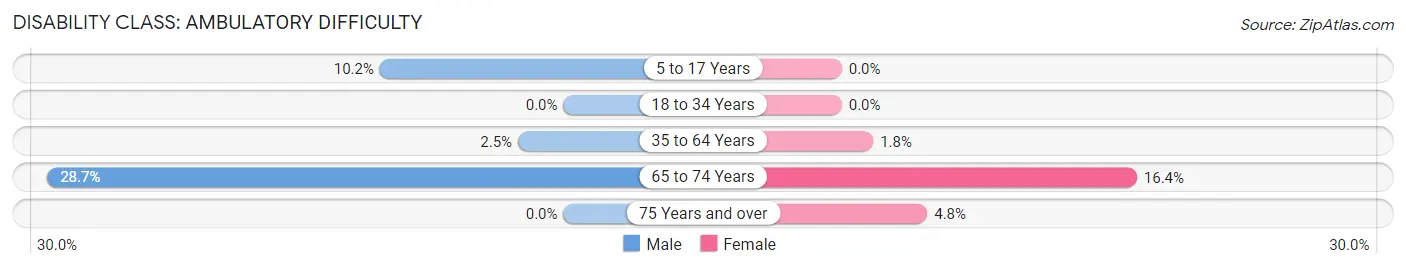
| Age Bracket | Male | Female |
| 5 to 17 Years | 14 (10.2%) | 0 (0.0%) |
| 18 to 34 Years | 0 (0.0%) | 0 (0.0%) |
| 35 to 64 Years | 10 (2.5%) | 10 (1.8%) |
| 65 to 74 Years | 25 (28.7%) | 23 (16.4%) |
| 75 Years and over | 0 (0.0%) | 9 (4.8%) |
Disability Class: Self-Care Difficulty
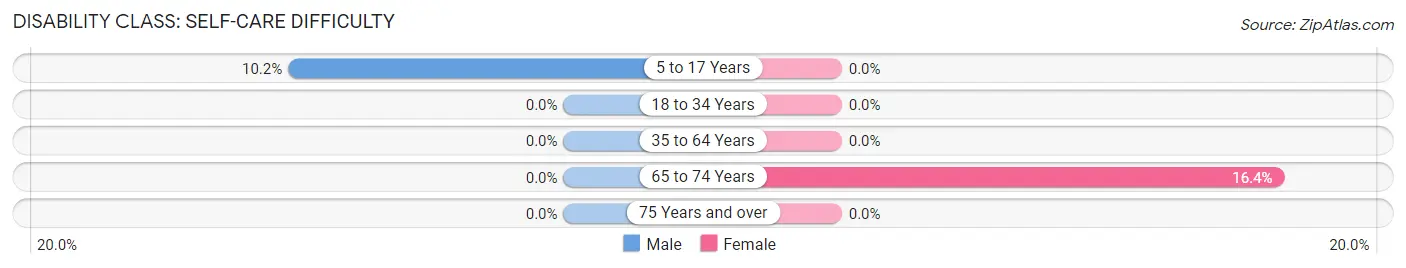
| Age Bracket | Male | Female |
| 5 to 17 Years | 14 (10.2%) | 0 (0.0%) |
| 18 to 34 Years | 0 (0.0%) | 0 (0.0%) |
| 35 to 64 Years | 0 (0.0%) | 0 (0.0%) |
| 65 to 74 Years | 0 (0.0%) | 23 (16.4%) |
| 75 Years and over | 0 (0.0%) | 0 (0.0%) |
Technology Access in Plantsville
Computing Device Access in Plantsville
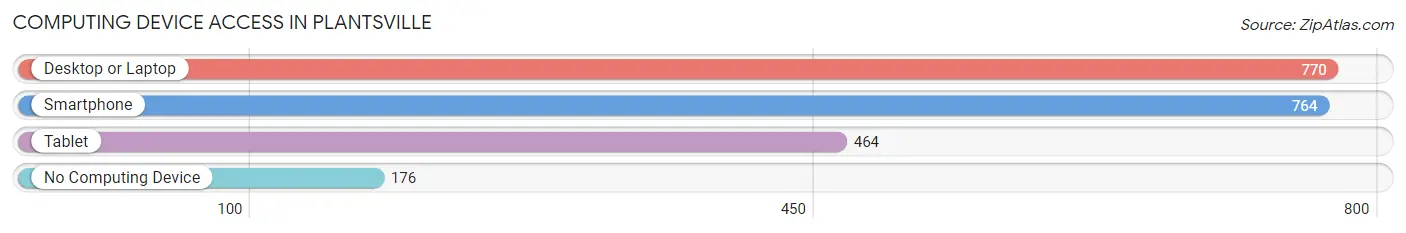
| Device Type | # Households | % Households |
| Desktop or Laptop | 770 | 77.1% |
| Smartphone | 764 | 76.5% |
| Tablet | 464 | 46.5% |
| No Computing Device | 176 | 17.6% |
| Total | 998 | 100.0% |
Internet Access in Plantsville
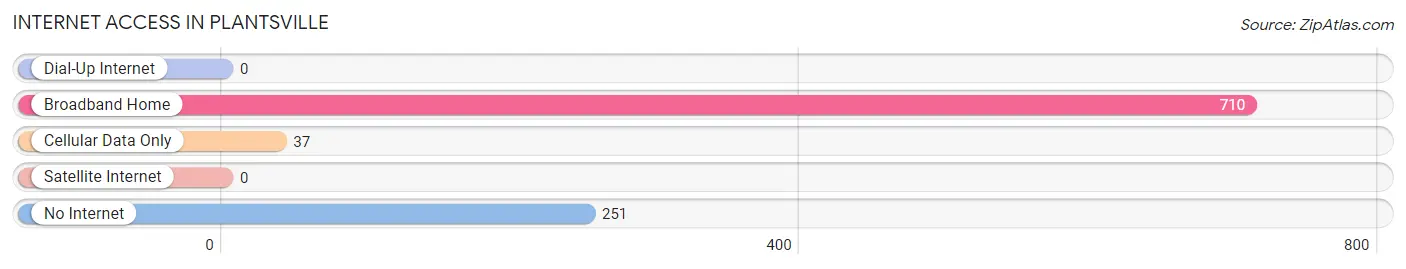
| Internet Type | # Households | % Households |
| Dial-Up Internet | 0 | 0.0% |
| Broadband Home | 710 | 71.1% |
| Cellular Data Only | 37 | 3.7% |
| Satellite Internet | 0 | 0.0% |
| No Internet | 251 | 25.2% |
| Total | 998 | 100.0% |
Plantsville Summary
Plantsville is a small town located in Hartford County, Connecticut. It is part of the town of Southington and is located in the central part of the state. The town has a population of approximately 5,000 people and is located in the New England region of the United States.
History
Plantsville was first settled in 1779 by a group of settlers from nearby Southington. The town was named after the many plants that grew in the area. The town was officially incorporated in 1845 and was primarily an agricultural community. The town was home to several mills, including a paper mill, a grist mill, and a saw mill. The town also had a blacksmith shop and a tannery.
In the late 19th century, the town began to industrialize and the population began to grow. The town was home to several factories, including a rubber factory, a machine shop, and a foundry. The town also had a railroad station, which connected it to other towns in the area.
Geography
Plantsville is located in the central part of Connecticut, in Hartford County. The town is bordered by Southington to the north, Cheshire to the east, Meriden to the south, and Waterbury to the west. The town is located in the New England region of the United States and is part of the Hartford-New Haven-Springfield metropolitan area.
The town has a total area of 4.2 square miles, all of which is land. The town is located in a hilly area and is home to several small streams and ponds. The town is located in a humid continental climate zone and has warm summers and cold winters.
Economy
The economy of Plantsville is primarily based on manufacturing and services. The town is home to several factories, including a rubber factory, a machine shop, and a foundry. The town also has several retail stores and restaurants. The town is also home to several small businesses, including a bakery, a florist, and a hardware store.
Demographics
As of the 2010 census, the population of Plantsville was 5,214. The racial makeup of the town was 94.3% White, 1.3% African American, 0.3% Native American, 1.2% Asian, 0.1% Pacific Islander, 1.2% from other races, and 1.6% from two or more races. Hispanic or Latino of any race were 4.2% of the population.
The median household income in Plantsville was $68,958, and the median family income was $77,917. The per capita income for the town was $30,945. About 4.2% of families and 5.3% of the population were below the poverty line, including 6.2% of those under age 18 and 4.2% of those age 65 or over.
Common Questions
What is Per Capita Income in Plantsville?
Per Capita income in Plantsville is $46,959.
What is the Median Family Income in Plantsville?
Median Family Income in Plantsville is $107,358.
What is the Median Household income in Plantsville?
Median Household Income in Plantsville is $105,674.
What is Income or Wage Gap in Plantsville?
Income or Wage Gap in Plantsville is 17.6%.
Women in Plantsville earn 82.4 cents for every dollar earned by a man.
What is Inequality or Gini Index in Plantsville?
Inequality or Gini Index in Plantsville is 0.36.
What is the Total Population of Plantsville?
Total Population of Plantsville is 2,084.
What is the Total Male Population of Plantsville?
Total Male Population of Plantsville is 892.
What is the Total Female Population of Plantsville?
Total Female Population of Plantsville is 1,192.
What is the Ratio of Males per 100 Females in Plantsville?
There are 74.83 Males per 100 Females in Plantsville.
What is the Ratio of Females per 100 Males in Plantsville?
There are 133.63 Females per 100 Males in Plantsville.
What is the Median Population Age in Plantsville?
Median Population Age in Plantsville is 53.8 Years.
What is the Average Family Size in Plantsville
Average Family Size in Plantsville is 2.6 People.
What is the Average Household Size in Plantsville
Average Household Size in Plantsville is 2.1 People.
How Large is the Labor Force in Plantsville?
There are 1,185 People in the Labor Forcein in Plantsville.
What is the Percentage of People in the Labor Force in Plantsville?
66.7% of People are in the Labor Force in Plantsville.
What is the Unemployment Rate in Plantsville?
Unemployment Rate in Plantsville is 2.4%.