Windsor Locks, CT Map & Demographics
Windsor Locks Map
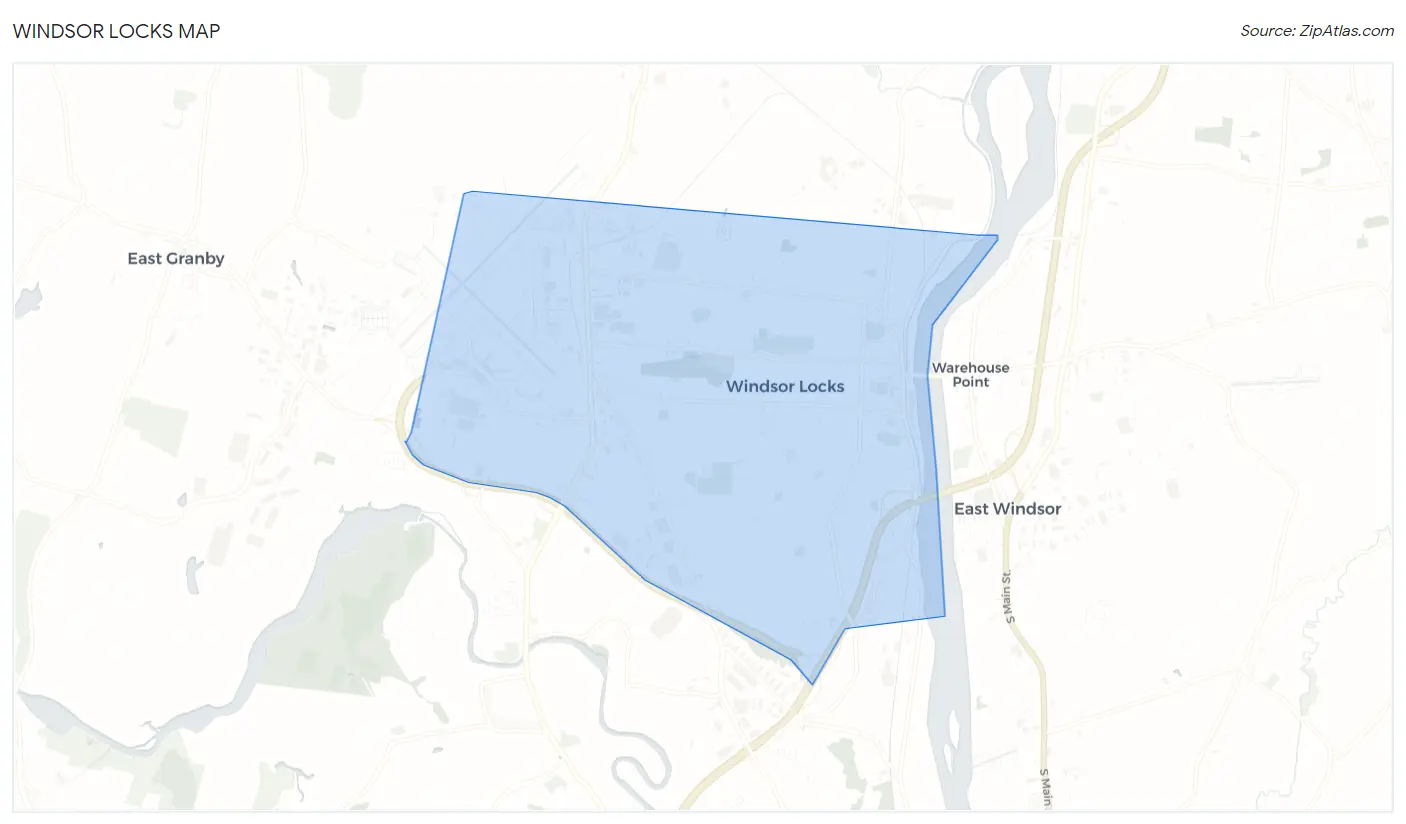
Windsor Locks Overview
$44,568
PER CAPITA INCOME
$105,544
AVG FAMILY INCOME
$85,570
AVG HOUSEHOLD INCOME
16.0%
WAGE / INCOME GAP [ % ]
84.0¢/ $1
WAGE / INCOME GAP [ $ ]
0.40
INEQUALITY / GINI INDEX
12,563
TOTAL POPULATION
5,852
MALE POPULATION
6,711
FEMALE POPULATION
87.20
MALES / 100 FEMALES
114.68
FEMALES / 100 MALES
42.0
MEDIAN AGE
2.9
AVG FAMILY SIZE
2.3
AVG HOUSEHOLD SIZE
7,663
LABOR FORCE [ PEOPLE ]
72.9%
PERCENT IN LABOR FORCE
7.3%
UNEMPLOYMENT RATE
Windsor Locks Zip Codes
Windsor Locks Area Codes
Income in Windsor Locks
Income Overview in Windsor Locks
Per Capita Income in Windsor Locks is $44,568, while median incomes of families and households are $105,544 and $85,570 respectively.
| Characteristic | Number | Measure |
| Per Capita Income | 12,563 | $44,568 |
| Median Family Income | 3,504 | $105,544 |
| Mean Family Income | 3,504 | $119,769 |
| Median Household Income | 5,417 | $85,570 |
| Mean Household Income | 5,417 | $103,320 |
| Income Deficit | 3,504 | $0 |
| Wage / Income Gap (%) | 12,563 | 16.00% |
| Wage / Income Gap ($) | 12,563 | 84.00¢ per $1 |
| Gini / Inequality Index | 12,563 | 0.40 |
Earnings by Sex in Windsor Locks
Average Earnings in Windsor Locks are $50,420, $55,679 for men and $46,773 for women, a difference of 16.0%.
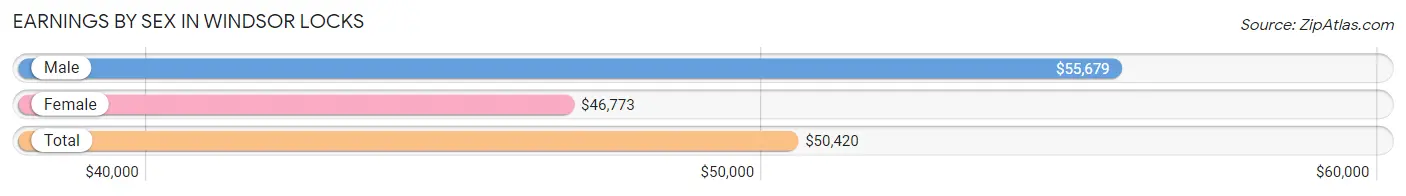
| Sex | Number | Average Earnings |
| Male | 3,834 (50.0%) | $55,679 |
| Female | 3,840 (50.0%) | $46,773 |
| Total | 7,674 (100.0%) | $50,420 |
Earnings by Sex by Income Bracket in Windsor Locks
The most common earnings brackets in Windsor Locks are $100,000+ for men (841 | 21.9%) and $75,000 to $99,999 for women (580 | 15.1%).
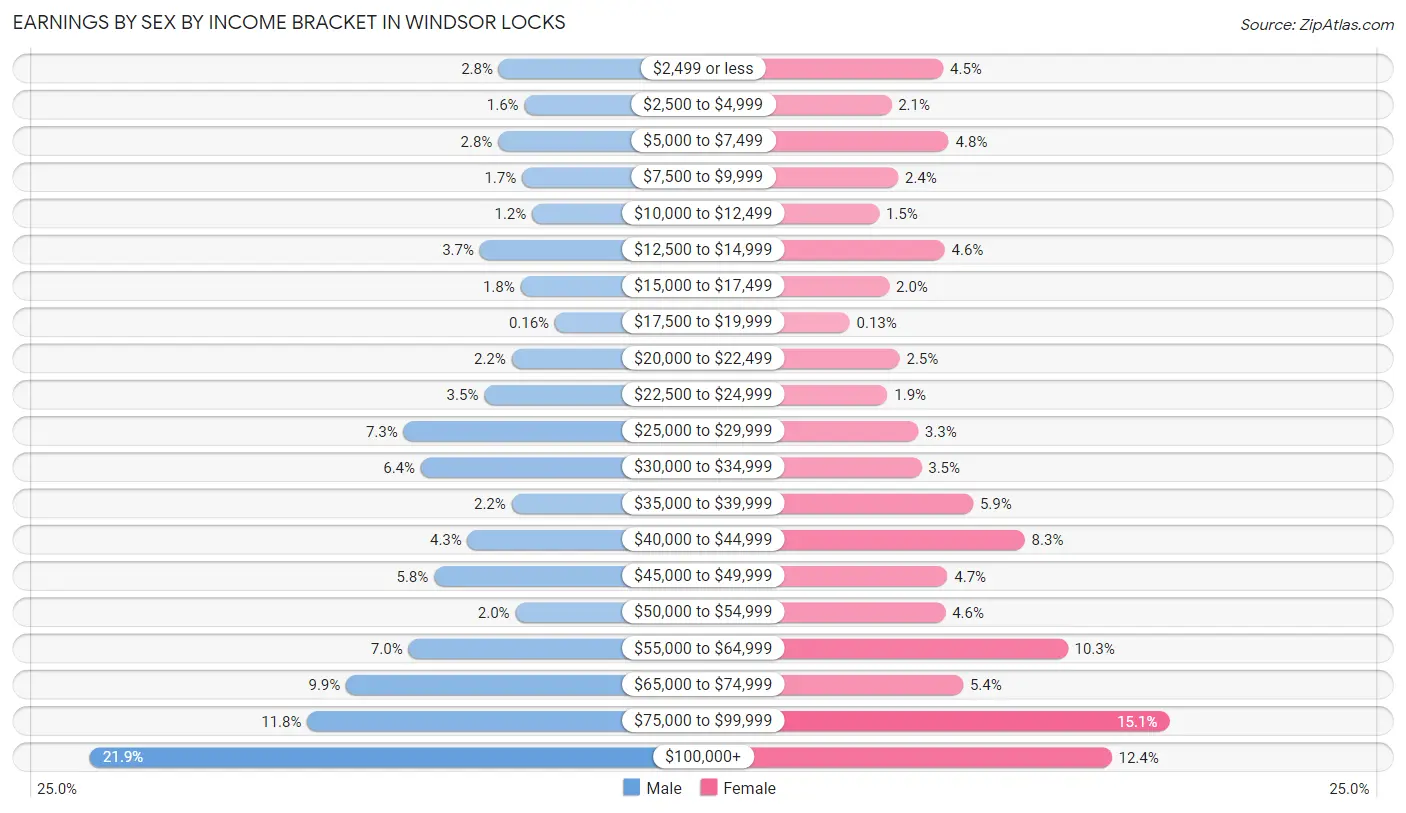
| Income | Male | Female |
| $2,499 or less | 107 (2.8%) | 173 (4.5%) |
| $2,500 to $4,999 | 61 (1.6%) | 80 (2.1%) |
| $5,000 to $7,499 | 108 (2.8%) | 183 (4.8%) |
| $7,500 to $9,999 | 65 (1.7%) | 92 (2.4%) |
| $10,000 to $12,499 | 47 (1.2%) | 58 (1.5%) |
| $12,500 to $14,999 | 141 (3.7%) | 176 (4.6%) |
| $15,000 to $17,499 | 68 (1.8%) | 76 (2.0%) |
| $17,500 to $19,999 | 6 (0.2%) | 5 (0.1%) |
| $20,000 to $22,499 | 84 (2.2%) | 95 (2.5%) |
| $22,500 to $24,999 | 133 (3.5%) | 73 (1.9%) |
| $25,000 to $29,999 | 278 (7.2%) | 128 (3.3%) |
| $30,000 to $34,999 | 247 (6.4%) | 134 (3.5%) |
| $35,000 to $39,999 | 84 (2.2%) | 227 (5.9%) |
| $40,000 to $44,999 | 163 (4.3%) | 320 (8.3%) |
| $45,000 to $49,999 | 223 (5.8%) | 181 (4.7%) |
| $50,000 to $54,999 | 77 (2.0%) | 177 (4.6%) |
| $55,000 to $64,999 | 269 (7.0%) | 397 (10.3%) |
| $65,000 to $74,999 | 381 (9.9%) | 209 (5.4%) |
| $75,000 to $99,999 | 451 (11.8%) | 580 (15.1%) |
| $100,000+ | 841 (21.9%) | 476 (12.4%) |
| Total | 3,834 (100.0%) | 3,840 (100.0%) |
Earnings by Sex by Educational Attainment in Windsor Locks
Average earnings in Windsor Locks are $60,697 for men and $53,646 for women, a difference of 11.6%. Men with an educational attainment of bachelor's degree enjoy the highest average annual earnings of $100,408, while those with college or associate's degree education earn the least with $49,620. Women with an educational attainment of bachelor's degree earn the most with the average annual earnings of $72,500, while those with less than high school education have the smallest earnings of $33,056.
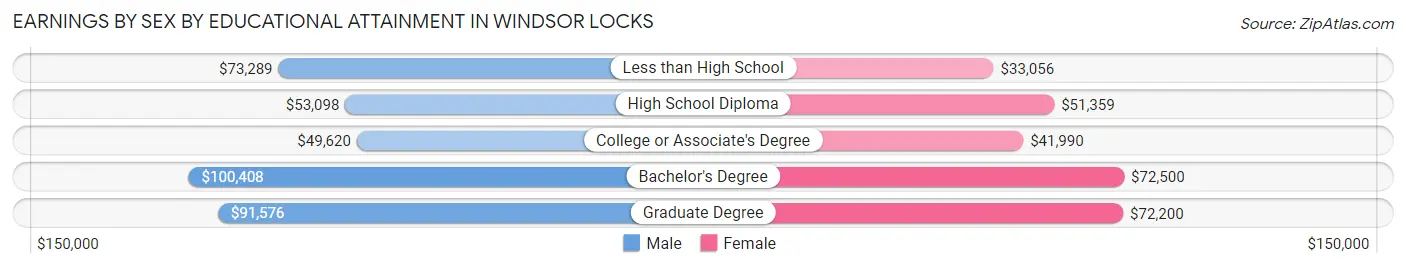
| Educational Attainment | Male Income | Female Income |
| Less than High School | $73,289 | $33,056 |
| High School Diploma | $53,098 | $51,359 |
| College or Associate's Degree | $49,620 | $41,990 |
| Bachelor's Degree | $100,408 | $72,500 |
| Graduate Degree | $91,576 | $72,200 |
| Total | $60,697 | $53,646 |
Family Income in Windsor Locks
Family Income Brackets in Windsor Locks
According to the Windsor Locks family income data, there are 957 families falling into the $100,000 to $149,999 income range, which is the most common income bracket and makes up 27.3% of all families.
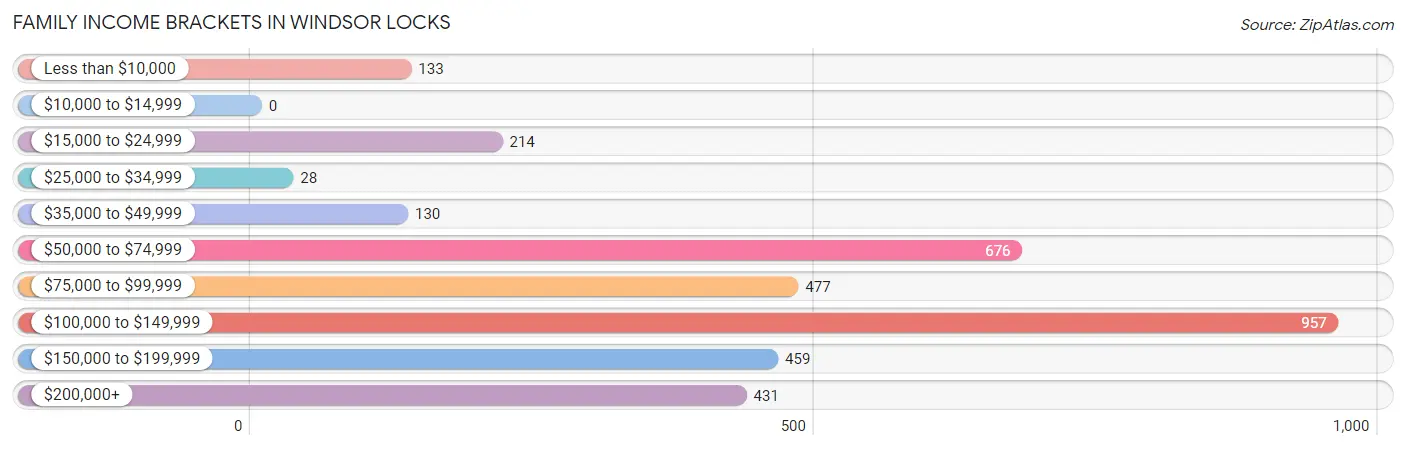
| Income Bracket | # Families | % Families |
| Less than $10,000 | 133 | 3.8% |
| $10,000 to $14,999 | 0 | 0.0% |
| $15,000 to $24,999 | 214 | 6.1% |
| $25,000 to $34,999 | 28 | 0.8% |
| $35,000 to $49,999 | 130 | 3.7% |
| $50,000 to $74,999 | 676 | 19.3% |
| $75,000 to $99,999 | 477 | 13.6% |
| $100,000 to $149,999 | 957 | 27.3% |
| $150,000 to $199,999 | 459 | 13.1% |
| $200,000+ | 431 | 12.3% |
Family Income by Famaliy Size in Windsor Locks
4-person families (725 | 20.7%) account for the highest median family income in Windsor Locks with $118,580 per family, while 2-person families (1,633 | 46.6%) have the highest median income of $45,436 per family member.
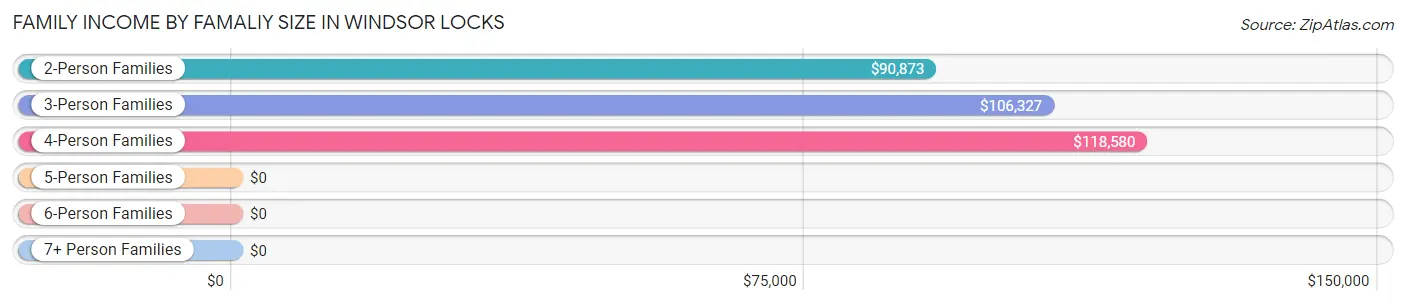
| Income Bracket | # Families | Median Income |
| 2-Person Families | 1,633 (46.6%) | $90,873 |
| 3-Person Families | 994 (28.4%) | $106,327 |
| 4-Person Families | 725 (20.7%) | $118,580 |
| 5-Person Families | 116 (3.3%) | $0 |
| 6-Person Families | 36 (1.0%) | $0 |
| 7+ Person Families | 0 (0.0%) | $0 |
| Total | 3,504 (100.0%) | $105,544 |
Family Income by Number of Earners in Windsor Locks
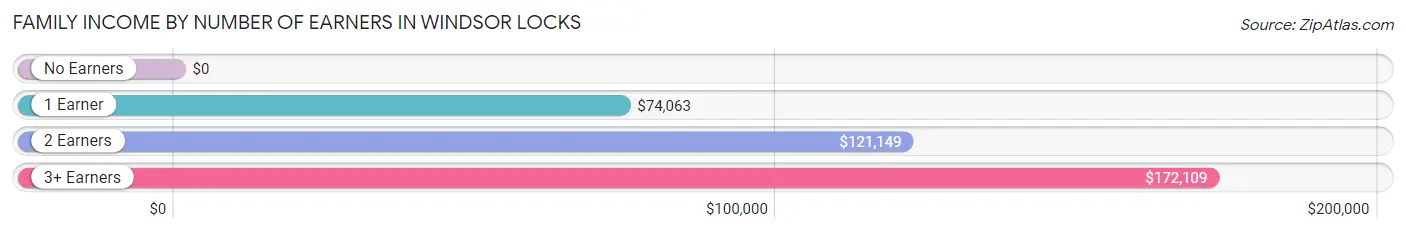
| Number of Earners | # Families | Median Income |
| No Earners | 526 (15.0%) | $0 |
| 1 Earner | 840 (24.0%) | $74,063 |
| 2 Earners | 1,600 (45.7%) | $121,149 |
| 3+ Earners | 538 (15.3%) | $172,109 |
| Total | 3,504 (100.0%) | $105,544 |
Household Income in Windsor Locks
Household Income Brackets in Windsor Locks
With 1,371 households falling in the category, the $100,000 to $149,999 income range is the most frequent in Windsor Locks, accounting for 25.3% of all households. In contrast, only 43 households (0.8%) fall into the $10,000 to $14,999 income bracket, making it the least populous group.
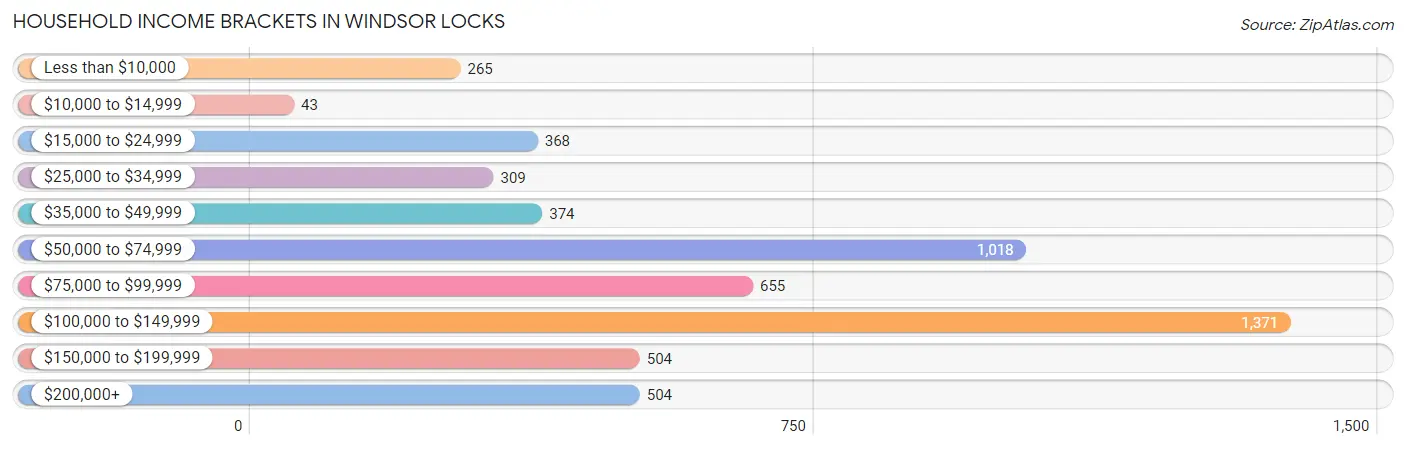
| Income Bracket | # Households | % Households |
| Less than $10,000 | 265 | 4.9% |
| $10,000 to $14,999 | 43 | 0.8% |
| $15,000 to $24,999 | 368 | 6.8% |
| $25,000 to $34,999 | 309 | 5.7% |
| $35,000 to $49,999 | 374 | 6.9% |
| $50,000 to $74,999 | 1,018 | 18.8% |
| $75,000 to $99,999 | 655 | 12.1% |
| $100,000 to $149,999 | 1,371 | 25.3% |
| $150,000 to $199,999 | 504 | 9.3% |
| $200,000+ | 504 | 9.3% |
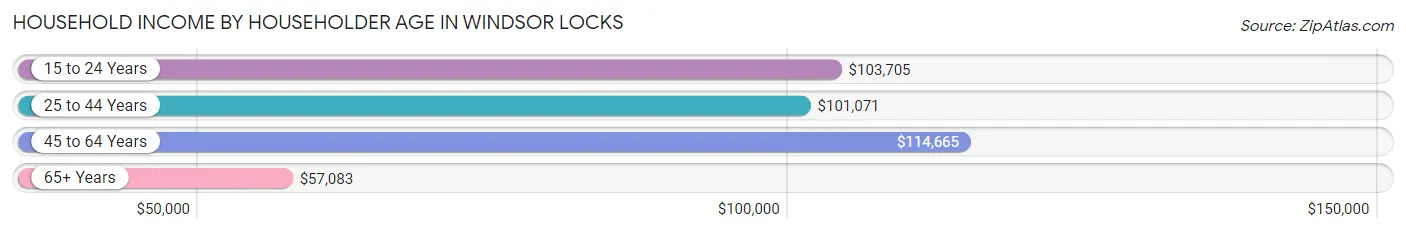
Household Income by Householder Age in Windsor Locks
The median household income in Windsor Locks is $85,570, with the highest median household income of $114,665 found in the 45 to 64 years age bracket for the primary householder. A total of 2,067 households (38.2%) fall into this category. Meanwhile, the 65+ years age bracket for the primary householder has the lowest median household income of $57,083, with 1,483 households (27.4%) in this group.
| Income Bracket | # Households | Median Income |
| 15 to 24 Years | 179 (3.3%) | $103,705 |
| 25 to 44 Years | 1,688 (31.2%) | $101,071 |
| 45 to 64 Years | 2,067 (38.2%) | $114,665 |
| 65+ Years | 1,483 (27.4%) | $57,083 |
| Total | 5,417 (100.0%) | $85,570 |
Poverty in Windsor Locks
Income Below Poverty by Sex and Age in Windsor Locks
With 8.0% poverty level for males and 9.9% for females among the residents of Windsor Locks, 12 to 14 year old males and 75 year old and over females are the most vulnerable to poverty, with 104 males (47.3%) and 150 females (21.8%) in their respective age groups living below the poverty level.
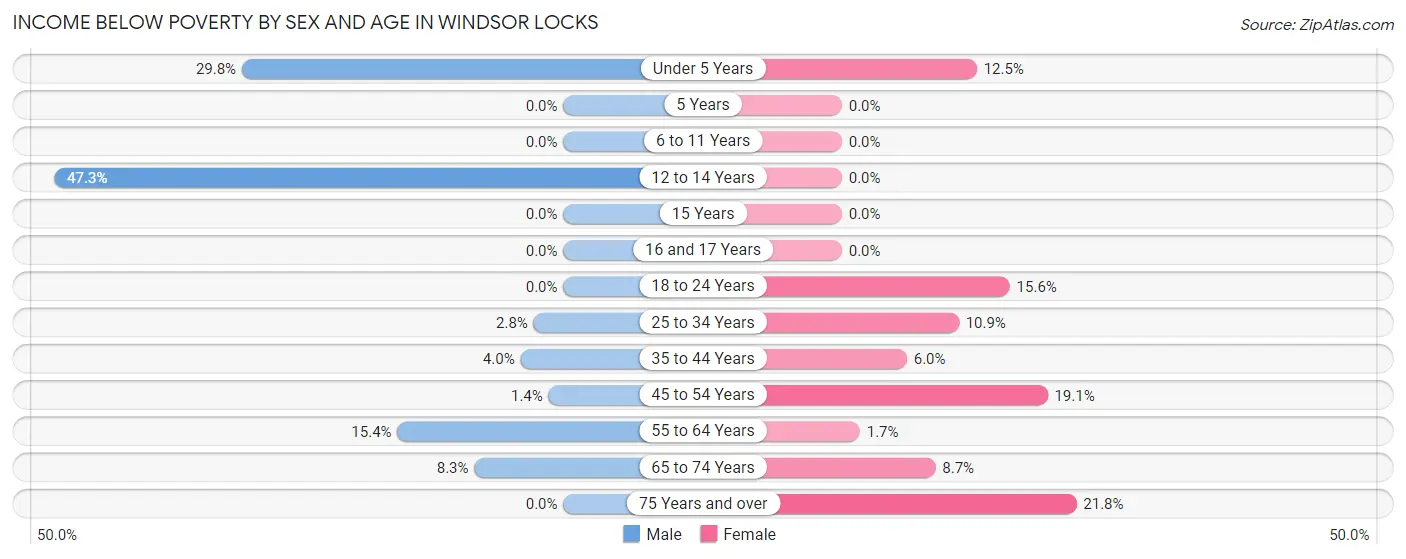
| Age Bracket | Male | Female |
| Under 5 Years | 71 (29.8%) | 64 (12.5%) |
| 5 Years | 0 (0.0%) | 0 (0.0%) |
| 6 to 11 Years | 0 (0.0%) | 0 (0.0%) |
| 12 to 14 Years | 104 (47.3%) | 0 (0.0%) |
| 15 Years | 0 (0.0%) | 0 (0.0%) |
| 16 and 17 Years | 0 (0.0%) | 0 (0.0%) |
| 18 to 24 Years | 0 (0.0%) | 79 (15.6%) |
| 25 to 34 Years | 21 (2.8%) | 97 (10.8%) |
| 35 to 44 Years | 34 (4.0%) | 49 (6.0%) |
| 45 to 54 Years | 8 (1.4%) | 151 (19.1%) |
| 55 to 64 Years | 187 (15.4%) | 18 (1.7%) |
| 65 to 74 Years | 44 (8.3%) | 50 (8.7%) |
| 75 Years and over | 0 (0.0%) | 150 (21.8%) |
| Total | 469 (8.0%) | 658 (9.9%) |
Income Above Poverty by Sex and Age in Windsor Locks
According to the poverty statistics in Windsor Locks, males aged 5 years and females aged 6 to 11 years are the age groups that are most secure financially, with 100.0% of males and 100.0% of females in these age groups living above the poverty line.
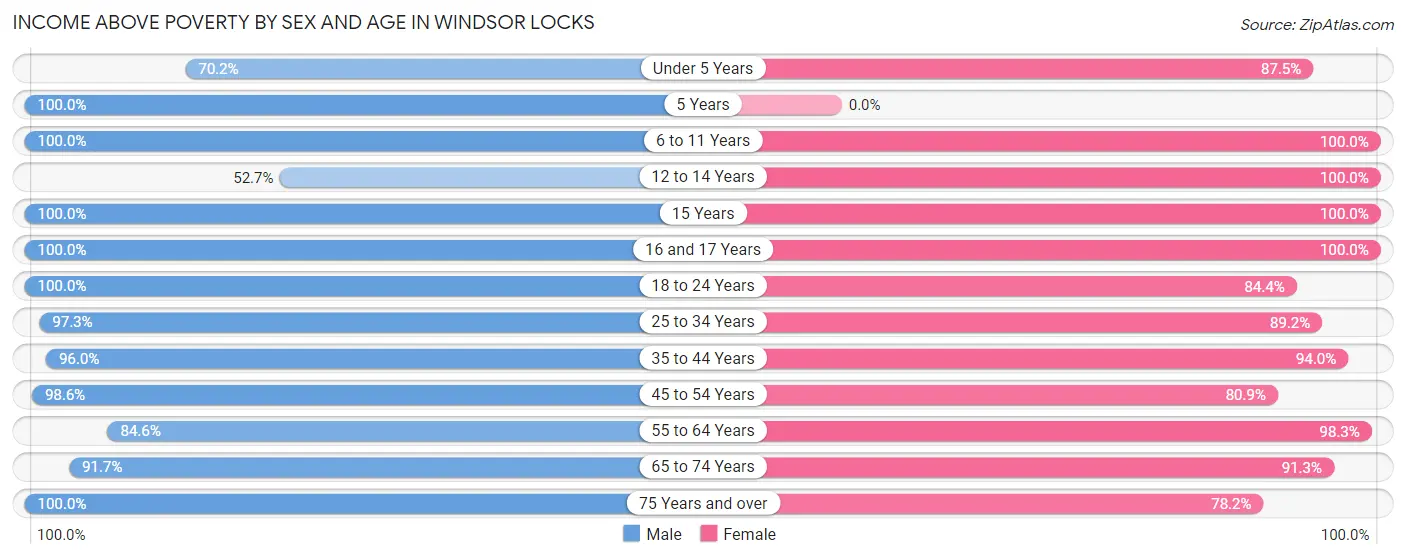
| Age Bracket | Male | Female |
| Under 5 Years | 167 (70.2%) | 447 (87.5%) |
| 5 Years | 86 (100.0%) | 0 (0.0%) |
| 6 to 11 Years | 225 (100.0%) | 482 (100.0%) |
| 12 to 14 Years | 116 (52.7%) | 160 (100.0%) |
| 15 Years | 97 (100.0%) | 24 (100.0%) |
| 16 and 17 Years | 143 (100.0%) | 148 (100.0%) |
| 18 to 24 Years | 534 (100.0%) | 428 (84.4%) |
| 25 to 34 Years | 743 (97.3%) | 797 (89.1%) |
| 35 to 44 Years | 820 (96.0%) | 763 (94.0%) |
| 45 to 54 Years | 574 (98.6%) | 640 (80.9%) |
| 55 to 64 Years | 1,027 (84.6%) | 1,058 (98.3%) |
| 65 to 74 Years | 489 (91.7%) | 526 (91.3%) |
| 75 Years and over | 353 (100.0%) | 539 (78.2%) |
| Total | 5,374 (92.0%) | 6,012 (90.1%) |
Income Below Poverty Among Married-Couple Families in Windsor Locks
The poverty statistics for married-couple families in Windsor Locks show that 6.3% or 152 of the total 2,424 families live below the poverty line. Families with 1 or 2 children have the highest poverty rate of 14.2%, comprising of 130 families. On the other hand, families with 3 or 4 children have the lowest poverty rate of 0.0%, which includes 0 families.
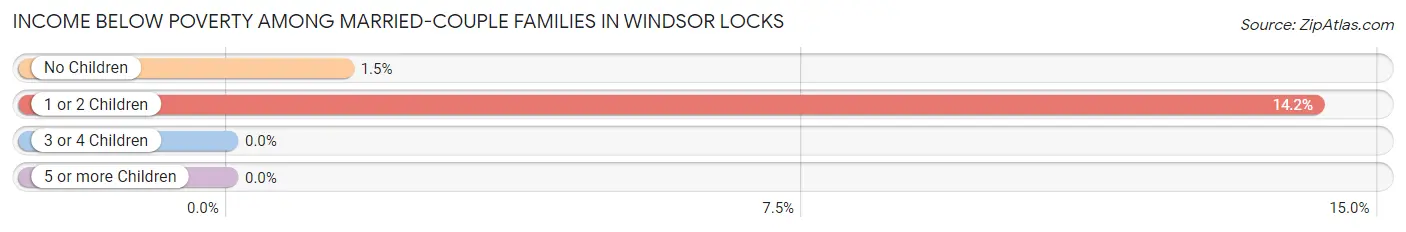
| Children | Above Poverty | Below Poverty |
| No Children | 1,436 (98.5%) | 22 (1.5%) |
| 1 or 2 Children | 786 (85.8%) | 130 (14.2%) |
| 3 or 4 Children | 50 (100.0%) | 0 (0.0%) |
| 5 or more Children | 0 (0.0%) | 0 (0.0%) |
| Total | 2,272 (93.7%) | 152 (6.3%) |
Income Below Poverty Among Single-Parent Households in Windsor Locks
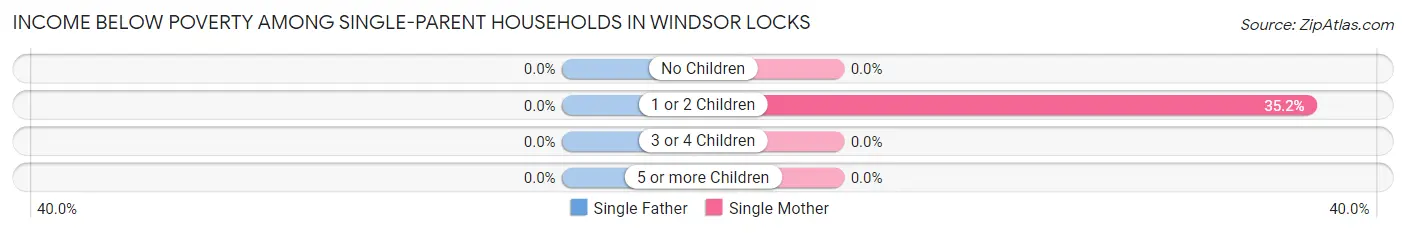
| Children | Single Father | Single Mother |
| No Children | 0 (0.0%) | 0 (0.0%) |
| 1 or 2 Children | 0 (0.0%) | 112 (35.2%) |
| 3 or 4 Children | 0 (0.0%) | 0 (0.0%) |
| 5 or more Children | 0 (0.0%) | 0 (0.0%) |
| Total | 0 (0.0%) | 112 (15.6%) |
Income Below Poverty Among Married-Couple vs Single-Parent Households in Windsor Locks
The poverty data for Windsor Locks shows that 152 of the married-couple family households (6.3%) and 112 of the single-parent households (10.4%) are living below the poverty level. Within the married-couple family households, those with 1 or 2 children have the highest poverty rate, with 130 households (14.2%) falling below the poverty line. Among the single-parent households, those with 1 or 2 children have the highest poverty rate, with 112 household (26.1%) living below poverty.
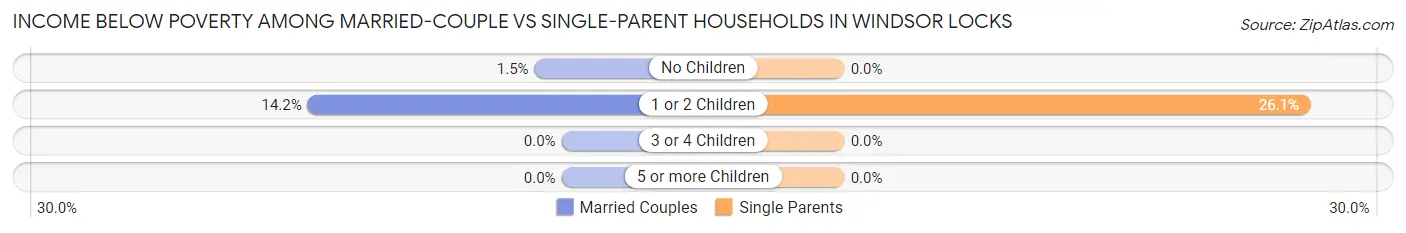
| Children | Married-Couple Families | Single-Parent Households |
| No Children | 22 (1.5%) | 0 (0.0%) |
| 1 or 2 Children | 130 (14.2%) | 112 (26.1%) |
| 3 or 4 Children | 0 (0.0%) | 0 (0.0%) |
| 5 or more Children | 0 (0.0%) | 0 (0.0%) |
| Total | 152 (6.3%) | 112 (10.4%) |
Race in Windsor Locks
The most populous races in Windsor Locks are White / Caucasian (9,560 | 76.1%), Two or more Races (978 | 7.8%), and Hispanic or Latino (862 | 6.9%).
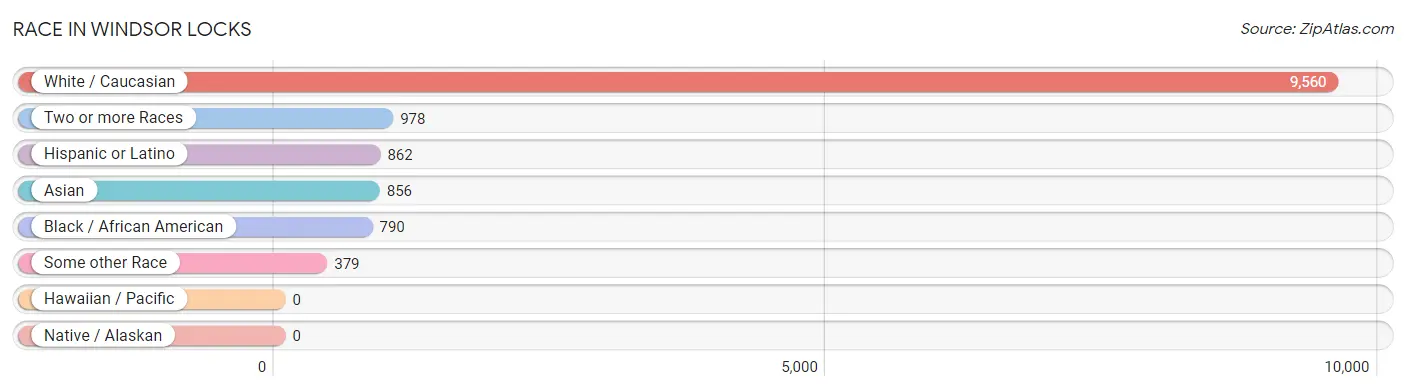
| Race | # Population | % Population |
| Asian | 856 | 6.8% |
| Black / African American | 790 | 6.3% |
| Hawaiian / Pacific | 0 | 0.0% |
| Hispanic or Latino | 862 | 6.9% |
| Native / Alaskan | 0 | 0.0% |
| White / Caucasian | 9,560 | 76.1% |
| Two or more Races | 978 | 7.8% |
| Some other Race | 379 | 3.0% |
| Total | 12,563 | 100.0% |
Ancestry in Windsor Locks
The most populous ancestries reported in Windsor Locks are Irish (2,628 | 20.9%), Italian (1,896 | 15.1%), Polish (1,272 | 10.1%), English (1,119 | 8.9%), and French (913 | 7.3%), together accounting for 62.3% of all Windsor Locks residents.
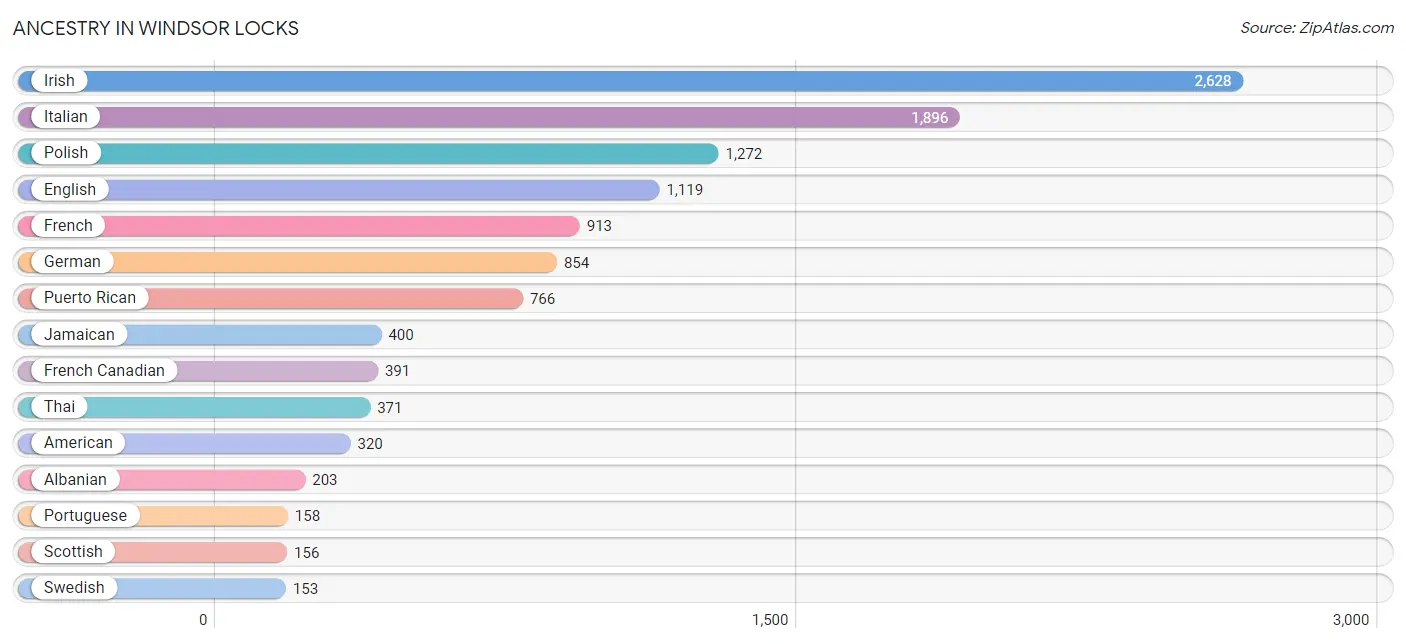
| Ancestry | # Population | % Population |
| African | 11 | 0.1% |
| Albanian | 203 | 1.6% |
| American | 320 | 2.5% |
| Argentinean | 35 | 0.3% |
| Assyrian / Chaldean / Syriac | 15 | 0.1% |
| Bangladeshi | 13 | 0.1% |
| Blackfeet | 63 | 0.5% |
| British | 26 | 0.2% |
| Burmese | 37 | 0.3% |
| Canadian | 42 | 0.3% |
| Cuban | 15 | 0.1% |
| Czech | 57 | 0.4% |
| Danish | 11 | 0.1% |
| Dutch | 41 | 0.3% |
| Eastern European | 25 | 0.2% |
| English | 1,119 | 8.9% |
| European | 141 | 1.1% |
| Finnish | 30 | 0.2% |
| French | 913 | 7.3% |
| French Canadian | 391 | 3.1% |
| German | 854 | 6.8% |
| Haitian | 96 | 0.8% |
| Hungarian | 19 | 0.2% |
| Indian (Asian) | 65 | 0.5% |
| Irish | 2,628 | 20.9% |
| Italian | 1,896 | 15.1% |
| Jamaican | 400 | 3.2% |
| Korean | 96 | 0.8% |
| Laotian | 54 | 0.4% |
| Lithuanian | 25 | 0.2% |
| Malaysian | 131 | 1.0% |
| Norwegian | 33 | 0.3% |
| Pakistani | 17 | 0.1% |
| Peruvian | 46 | 0.4% |
| Polish | 1,272 | 10.1% |
| Portuguese | 158 | 1.3% |
| Puerto Rican | 766 | 6.1% |
| Russian | 46 | 0.4% |
| Scandinavian | 27 | 0.2% |
| Scotch-Irish | 40 | 0.3% |
| Scottish | 156 | 1.2% |
| Sioux | 2 | 0.0% |
| Slovak | 29 | 0.2% |
| Slovene | 26 | 0.2% |
| South American | 81 | 0.6% |
| Sri Lankan | 96 | 0.8% |
| Subsaharan African | 11 | 0.1% |
| Swedish | 153 | 1.2% |
| Thai | 371 | 2.9% |
| Ukrainian | 33 | 0.3% |
| Welsh | 22 | 0.2% | View All 51 Rows |
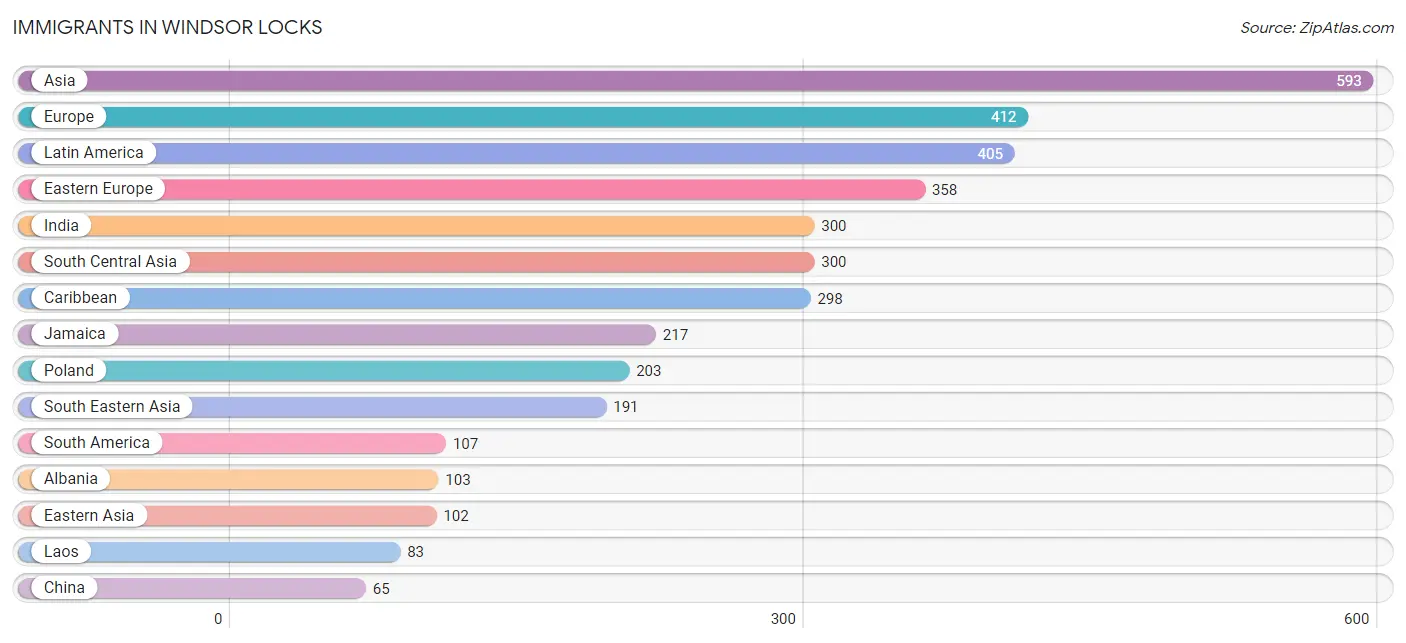
Immigrants in Windsor Locks
The most numerous immigrant groups reported in Windsor Locks came from Asia (593 | 4.7%), Europe (412 | 3.3%), Latin America (405 | 3.2%), Eastern Europe (358 | 2.9%), and India (300 | 2.4%), together accounting for 16.5% of all Windsor Locks residents.
| Immigration Origin | # Population | % Population |
| Africa | 37 | 0.3% |
| Albania | 103 | 0.8% |
| Argentina | 35 | 0.3% |
| Asia | 593 | 4.7% |
| Brazil | 22 | 0.2% |
| Canada | 18 | 0.1% |
| Caribbean | 298 | 2.4% |
| China | 65 | 0.5% |
| Cuba | 34 | 0.3% |
| Czechoslovakia | 52 | 0.4% |
| Eastern Asia | 102 | 0.8% |
| Eastern Europe | 358 | 2.9% |
| Egypt | 37 | 0.3% |
| Europe | 412 | 3.3% |
| Germany | 6 | 0.1% |
| Guyana | 50 | 0.4% |
| Haiti | 47 | 0.4% |
| India | 300 | 2.4% |
| Indonesia | 34 | 0.3% |
| Ireland | 8 | 0.1% |
| Italy | 18 | 0.1% |
| Jamaica | 217 | 1.7% |
| Korea | 37 | 0.3% |
| Laos | 83 | 0.7% |
| Latin America | 405 | 3.2% |
| Northern Africa | 37 | 0.3% |
| Northern Europe | 20 | 0.2% |
| Philippines | 32 | 0.3% |
| Poland | 203 | 1.6% |
| Portugal | 10 | 0.1% |
| Scotland | 12 | 0.1% |
| South America | 107 | 0.9% |
| South Central Asia | 300 | 2.4% |
| South Eastern Asia | 191 | 1.5% |
| Southern Europe | 28 | 0.2% |
| Vietnam | 42 | 0.3% |
| Western Europe | 6 | 0.1% | View All 37 Rows |
Sex and Age in Windsor Locks
Sex and Age in Windsor Locks
The most populous age groups in Windsor Locks are 55 to 59 Years (659 | 11.3%) for men and 55 to 59 Years (600 | 8.9%) for women.
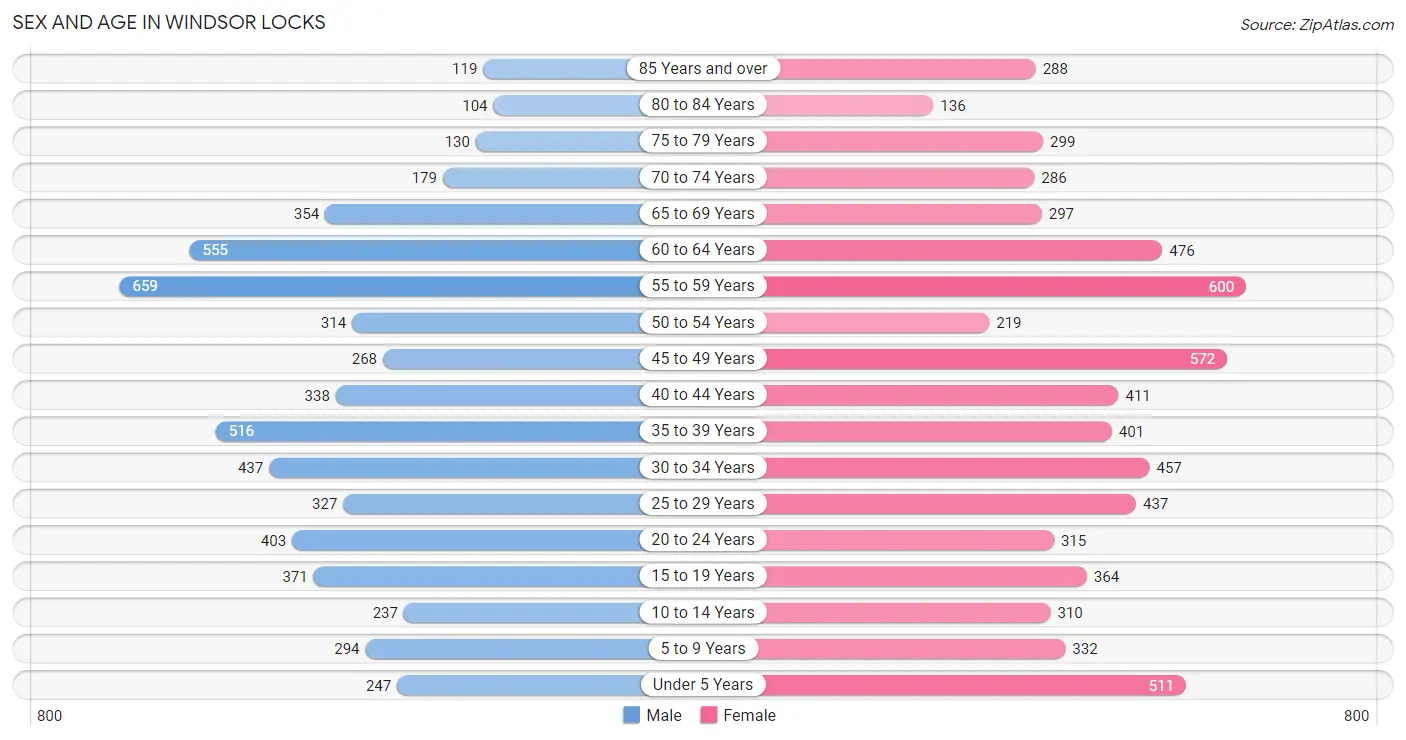
| Age Bracket | Male | Female |
| Under 5 Years | 247 (4.2%) | 511 (7.6%) |
| 5 to 9 Years | 294 (5.0%) | 332 (5.0%) |
| 10 to 14 Years | 237 (4.1%) | 310 (4.6%) |
| 15 to 19 Years | 371 (6.3%) | 364 (5.4%) |
| 20 to 24 Years | 403 (6.9%) | 315 (4.7%) |
| 25 to 29 Years | 327 (5.6%) | 437 (6.5%) |
| 30 to 34 Years | 437 (7.5%) | 457 (6.8%) |
| 35 to 39 Years | 516 (8.8%) | 401 (6.0%) |
| 40 to 44 Years | 338 (5.8%) | 411 (6.1%) |
| 45 to 49 Years | 268 (4.6%) | 572 (8.5%) |
| 50 to 54 Years | 314 (5.4%) | 219 (3.3%) |
| 55 to 59 Years | 659 (11.3%) | 600 (8.9%) |
| 60 to 64 Years | 555 (9.5%) | 476 (7.1%) |
| 65 to 69 Years | 354 (6.0%) | 297 (4.4%) |
| 70 to 74 Years | 179 (3.1%) | 286 (4.3%) |
| 75 to 79 Years | 130 (2.2%) | 299 (4.5%) |
| 80 to 84 Years | 104 (1.8%) | 136 (2.0%) |
| 85 Years and over | 119 (2.0%) | 288 (4.3%) |
| Total | 5,852 (100.0%) | 6,711 (100.0%) |
Families and Households in Windsor Locks
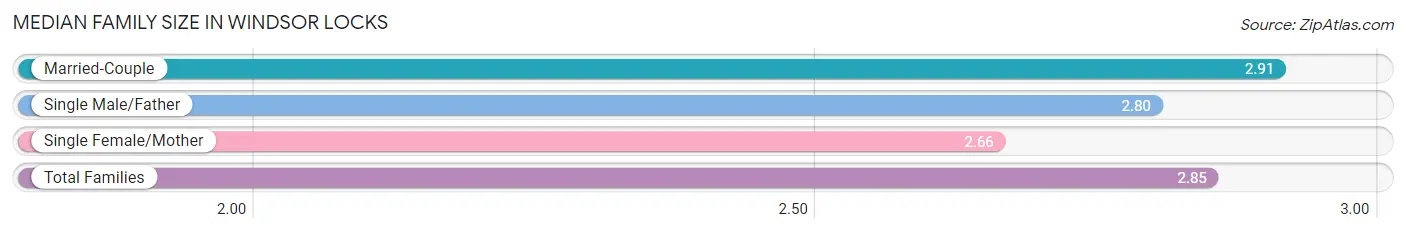
Median Family Size in Windsor Locks
The median family size in Windsor Locks is 2.85 persons per family, with married-couple families (2,424 | 69.2%) accounting for the largest median family size of 2.91 persons per family. On the other hand, single female/mother families (719 | 20.5%) represent the smallest median family size with 2.66 persons per family.
| Family Type | # Families | Family Size |
| Married-Couple | 2,424 (69.2%) | 2.91 |
| Single Male/Father | 361 (10.3%) | 2.80 |
| Single Female/Mother | 719 (20.5%) | 2.66 |
| Total Families | 3,504 (100.0%) | 2.85 |
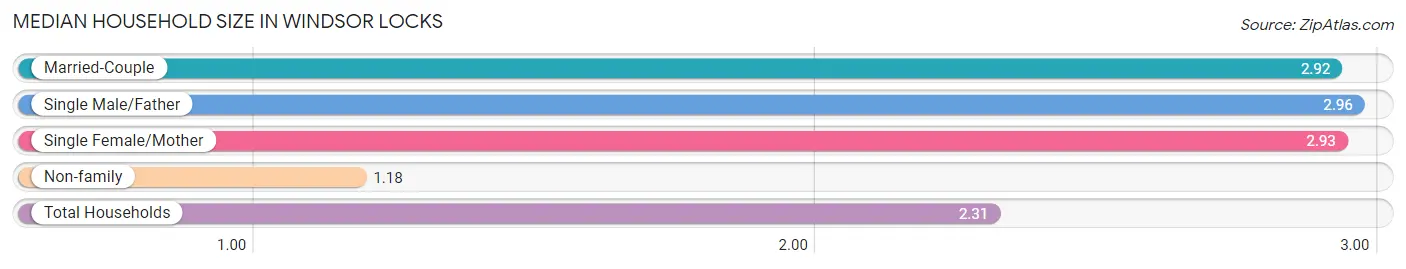
Median Household Size in Windsor Locks
The median household size in Windsor Locks is 2.31 persons per household, with single male/father households (361 | 6.7%) accounting for the largest median household size of 2.96 persons per household. non-family households (1,913 | 35.3%) represent the smallest median household size with 1.18 persons per household.
| Household Type | # Households | Household Size |
| Married-Couple | 2,424 (44.8%) | 2.92 |
| Single Male/Father | 361 (6.7%) | 2.96 |
| Single Female/Mother | 719 (13.3%) | 2.93 |
| Non-family | 1,913 (35.3%) | 1.18 |
| Total Households | 5,417 (100.0%) | 2.31 |
Household Size by Marriage Status in Windsor Locks
Out of a total of 5,417 households in Windsor Locks, 3,504 (64.7%) are family households, while 1,913 (35.3%) are nonfamily households. The most numerous type of family households are 2-person households, comprising 1,478, and the most common type of nonfamily households are 1-person households, comprising 1,597.
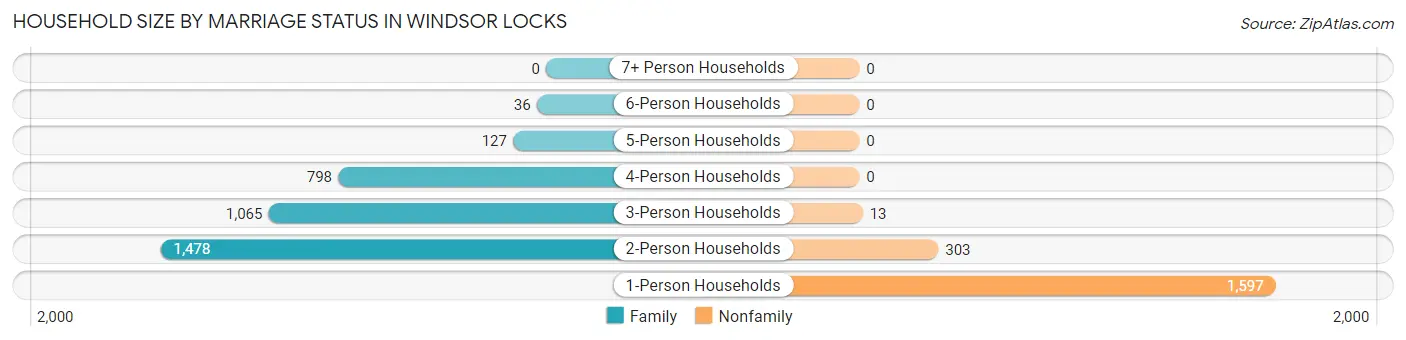
| Household Size | Family Households | Nonfamily Households |
| 1-Person Households | - | 1,597 (29.5%) |
| 2-Person Households | 1,478 (27.3%) | 303 (5.6%) |
| 3-Person Households | 1,065 (19.7%) | 13 (0.2%) |
| 4-Person Households | 798 (14.7%) | 0 (0.0%) |
| 5-Person Households | 127 (2.3%) | 0 (0.0%) |
| 6-Person Households | 36 (0.7%) | 0 (0.0%) |
| 7+ Person Households | 0 (0.0%) | 0 (0.0%) |
| Total | 3,504 (64.7%) | 1,913 (35.3%) |
Female Fertility in Windsor Locks
Fertility by Age in Windsor Locks
Average fertility rate in Windsor Locks is 66.0 births per 1,000 women. Women in the age bracket of 20 to 34 years have the highest fertility rate with 146.0 births per 1,000 women. Women in the age bracket of 20 to 34 years acount for 89.4% of all women with births.
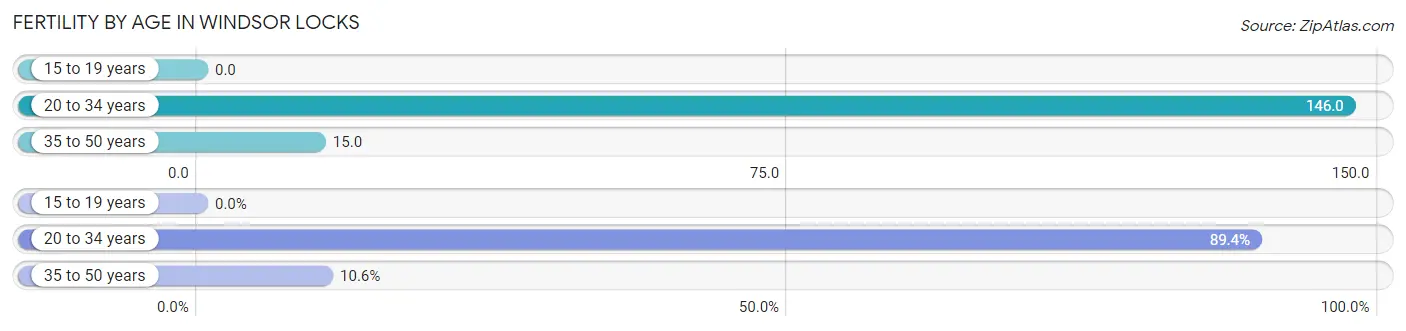
| Age Bracket | Women with Births | Births / 1,000 Women |
| 15 to 19 years | 0 (0.0%) | 0.0 |
| 20 to 34 years | 177 (89.4%) | 146.0 |
| 35 to 50 years | 21 (10.6%) | 15.0 |
| Total | 198 (100.0%) | 66.0 |
Fertility by Age by Marriage Status in Windsor Locks
23.2% of women with births (198) in Windsor Locks are married. The highest percentage of unmarried women with births falls into 20 to 34 years age bracket with 79.1% of them unmarried at the time of birth, while the lowest percentage of unmarried women with births belong to 35 to 50 years age bracket with 57.1% of them unmarried.
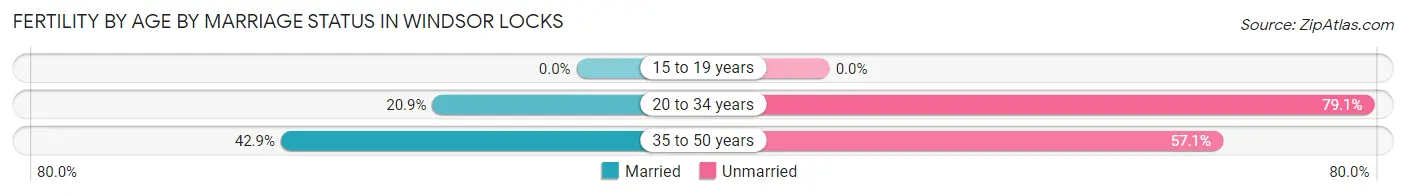
| Age Bracket | Married | Unmarried |
| 15 to 19 years | 0 (0.0%) | 0 (0.0%) |
| 20 to 34 years | 37 (20.9%) | 140 (79.1%) |
| 35 to 50 years | 9 (42.9%) | 12 (57.1%) |
| Total | 46 (23.2%) | 152 (76.8%) |
Fertility by Education in Windsor Locks
Average fertility rate in Windsor Locks is 66.0 births per 1,000 women. Women with the education attainment of high school diploma have the highest fertility rate of 112.0 births per 1,000 women, while women with the education attainment of college or associate's degree have the lowest fertility at 44.0 births per 1,000 women. Women with the education attainment of high school diploma represent 36.4% of all women with births.
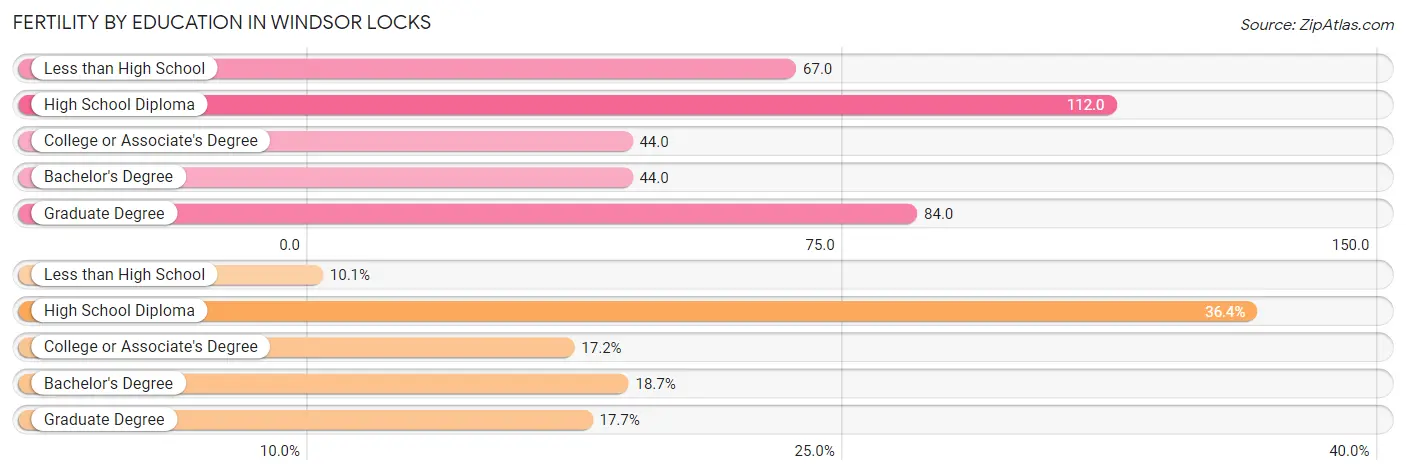
| Educational Attainment | Women with Births | Births / 1,000 Women |
| Less than High School | 20 (10.1%) | 67.0 |
| High School Diploma | 72 (36.4%) | 112.0 |
| College or Associate's Degree | 34 (17.2%) | 44.0 |
| Bachelor's Degree | 37 (18.7%) | 44.0 |
| Graduate Degree | 35 (17.7%) | 84.0 |
| Total | 198 (100.0%) | 66.0 |
Fertility by Education by Marriage Status in Windsor Locks
76.8% of women with births in Windsor Locks are unmarried. Women with the educational attainment of bachelor's degree are most likely to be married with 100.0% of them married at childbirth, while women with the educational attainment of high school diploma are least likely to be married with 100.0% of them unmarried at childbirth.
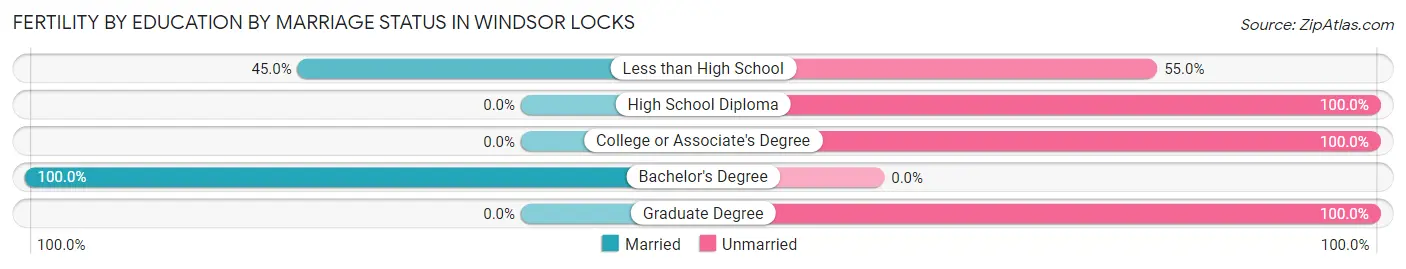
| Educational Attainment | Married | Unmarried |
| Less than High School | 9 (45.0%) | 11 (55.0%) |
| High School Diploma | 0 (0.0%) | 72 (100.0%) |
| College or Associate's Degree | 0 (0.0%) | 34 (100.0%) |
| Bachelor's Degree | 37 (100.0%) | 0 (0.0%) |
| Graduate Degree | 0 (0.0%) | 35 (100.0%) |
| Total | 46 (23.2%) | 152 (76.8%) |
Employment Characteristics in Windsor Locks
Employment by Class of Employer in Windsor Locks
Among the 6,986 employed individuals in Windsor Locks, private company employees (5,159 | 73.9%), local government employees (560 | 8.0%), and not-for-profit organizations (511 | 7.3%) make up the most common classes of employment.
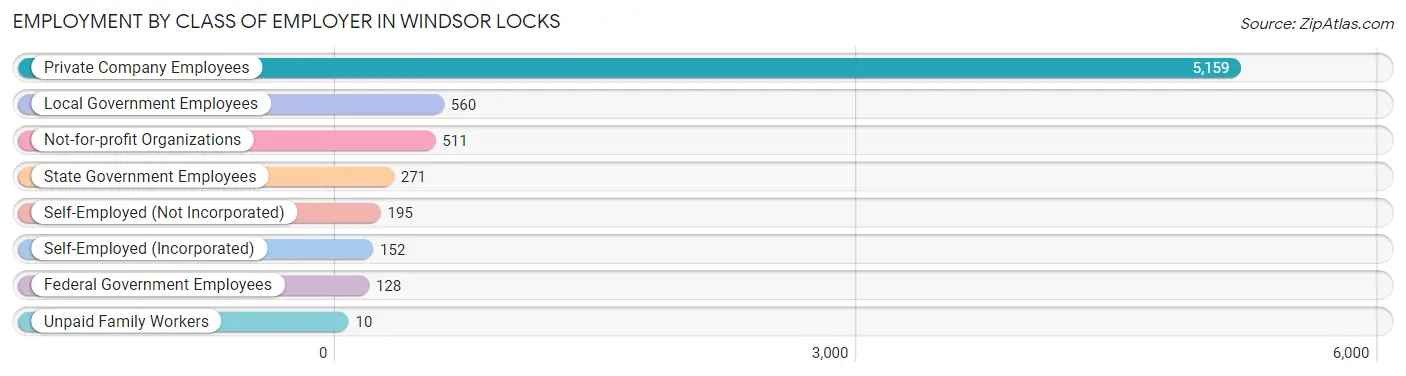
| Employer Class | # Employees | % Employees |
| Private Company Employees | 5,159 | 73.9% |
| Self-Employed (Incorporated) | 152 | 2.2% |
| Self-Employed (Not Incorporated) | 195 | 2.8% |
| Not-for-profit Organizations | 511 | 7.3% |
| Local Government Employees | 560 | 8.0% |
| State Government Employees | 271 | 3.9% |
| Federal Government Employees | 128 | 1.8% |
| Unpaid Family Workers | 10 | 0.1% |
| Total | 6,986 | 100.0% |
Employment Status by Age in Windsor Locks
According to the labor force statistics for Windsor Locks, out of the total population over 16 years of age (10,511), 72.9% or 7,663 individuals are in the labor force, with 7.3% or 559 of them unemployed. The age group with the highest labor force participation rate is 25 to 29 years, with 95.9% or 733 individuals in the labor force. Within the labor force, the 16 to 19 years age range has the highest percentage of unemployed individuals, with 33.2% or 125 of them being unemployed.
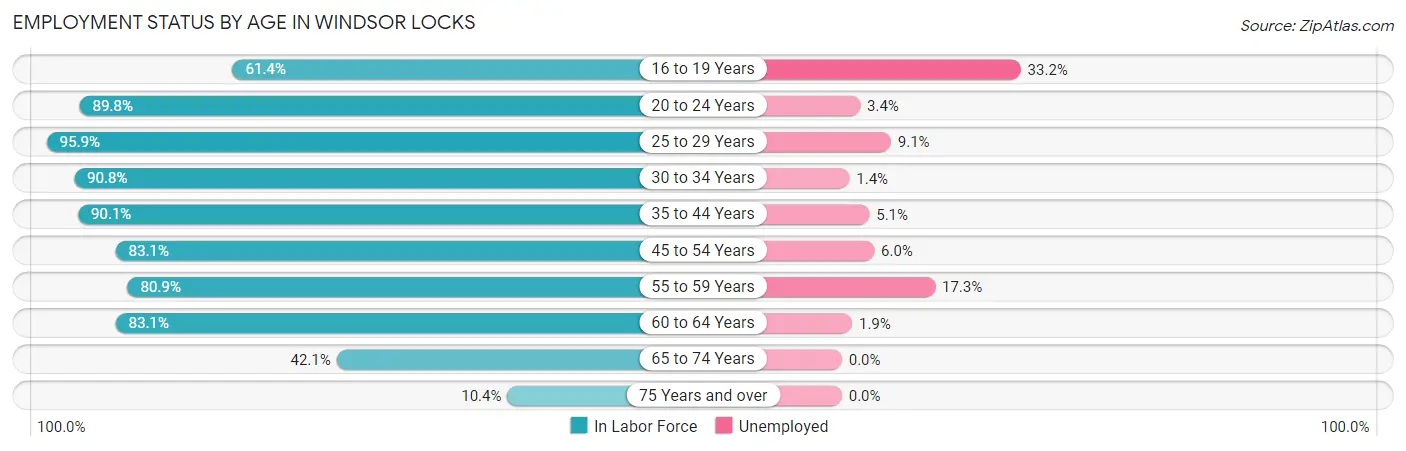
| Age Bracket | In Labor Force | Unemployed |
| 16 to 19 Years | 377 (61.4%) | 125 (33.2%) |
| 20 to 24 Years | 645 (89.8%) | 22 (3.4%) |
| 25 to 29 Years | 733 (95.9%) | 67 (9.1%) |
| 30 to 34 Years | 812 (90.8%) | 11 (1.4%) |
| 35 to 44 Years | 1,501 (90.1%) | 77 (5.1%) |
| 45 to 54 Years | 1,141 (83.1%) | 68 (6.0%) |
| 55 to 59 Years | 1,019 (80.9%) | 176 (17.3%) |
| 60 to 64 Years | 857 (83.1%) | 16 (1.9%) |
| 65 to 74 Years | 470 (42.1%) | 0 (0.0%) |
| 75 Years and over | 112 (10.4%) | 0 (0.0%) |
| Total | 7,663 (72.9%) | 559 (7.3%) |
Employment Status by Educational Attainment in Windsor Locks
According to labor force statistics for Windsor Locks, 86.8% of individuals (6,065) out of the total population between 25 and 64 years of age (6,987) are in the labor force, with 6.8% or 412 of them being unemployed. The group with the highest labor force participation rate are those with the educational attainment of bachelor's degree or higher, with 96.8% or 2,083 individuals in the labor force. Within the labor force, individuals with less than high school education have the highest percentage of unemployment, with 39.0% or 67 of them being unemployed.
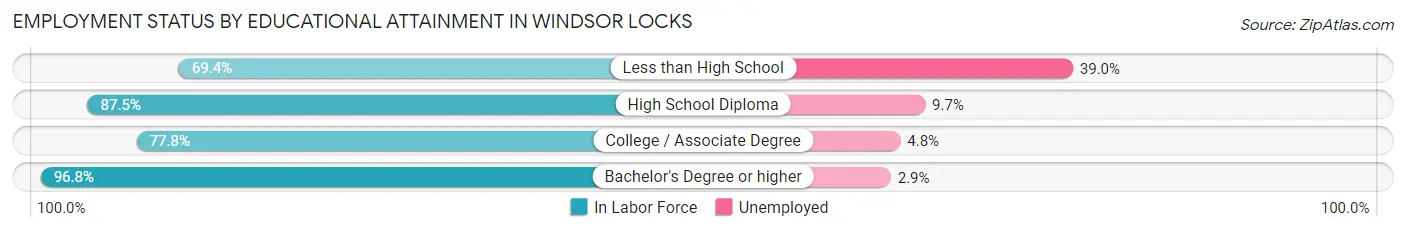
| Educational Attainment | In Labor Force | Unemployed |
| Less than High School | 172 (69.4%) | 97 (39.0%) |
| High School Diploma | 2,146 (87.5%) | 238 (9.7%) |
| College / Associate Degree | 1,661 (77.8%) | 102 (4.8%) |
| Bachelor's Degree or higher | 2,083 (96.8%) | 62 (2.9%) |
| Total | 6,065 (86.8%) | 475 (6.8%) |
Employment Occupations by Sex in Windsor Locks
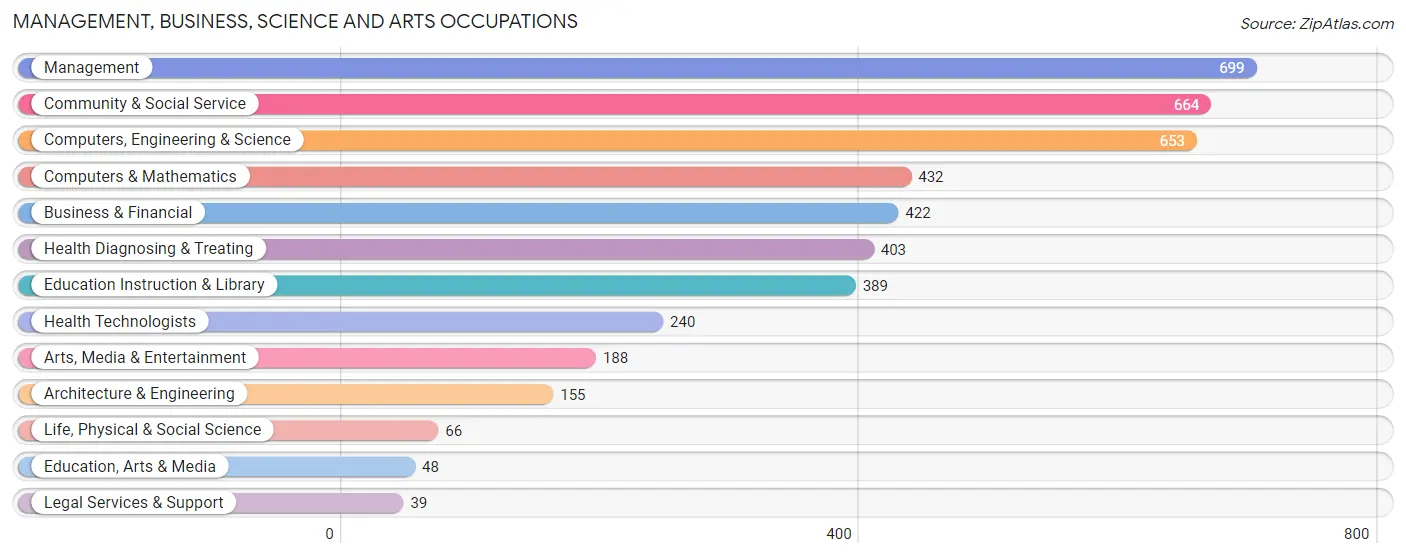
Management, Business, Science and Arts Occupations
The most common Management, Business, Science and Arts occupations in Windsor Locks are Management (699 | 9.8%), Community & Social Service (664 | 9.3%), Computers, Engineering & Science (653 | 9.2%), Computers & Mathematics (432 | 6.1%), and Business & Financial (422 | 5.9%).
Management, Business, Science and Arts Occupations by Sex
Within the Management, Business, Science and Arts occupations in Windsor Locks, the most male-oriented occupations are Architecture & Engineering (61.9%), Education, Arts & Media (60.4%), and Computers & Mathematics (57.9%), while the most female-oriented occupations are Life, Physical & Social Science (100.0%), Legal Services & Support (100.0%), and Health Technologists (100.0%).
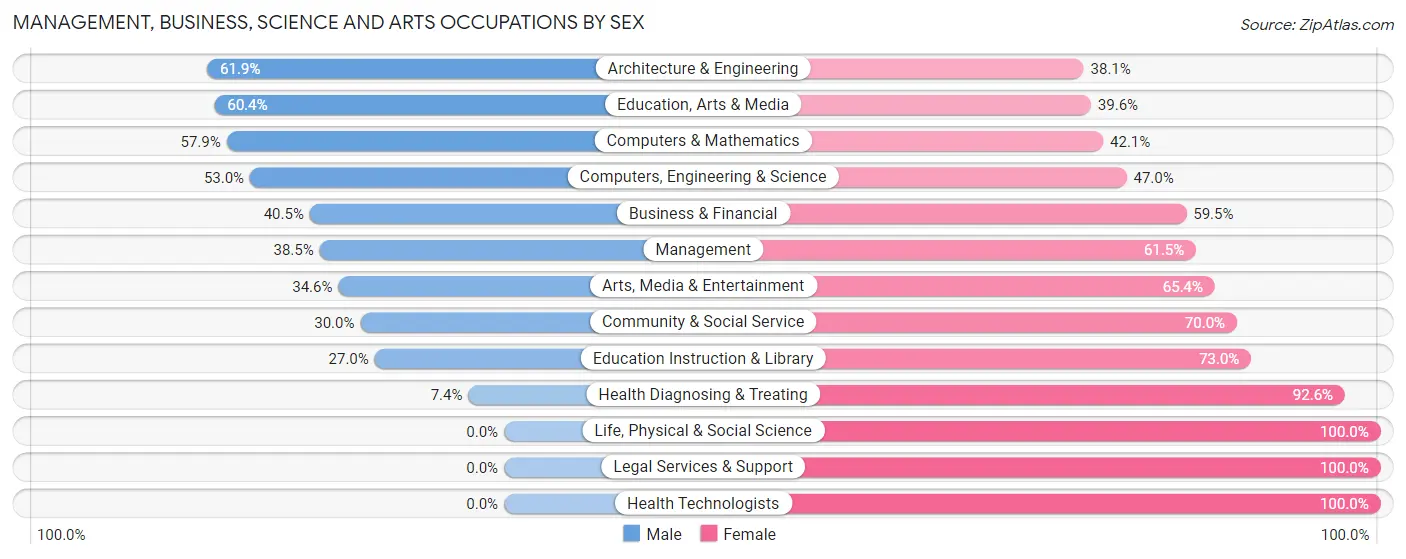
| Occupation | Male | Female |
| Management | 269 (38.5%) | 430 (61.5%) |
| Business & Financial | 171 (40.5%) | 251 (59.5%) |
| Computers, Engineering & Science | 346 (53.0%) | 307 (47.0%) |
| Computers & Mathematics | 250 (57.9%) | 182 (42.1%) |
| Architecture & Engineering | 96 (61.9%) | 59 (38.1%) |
| Life, Physical & Social Science | 0 (0.0%) | 66 (100.0%) |
| Community & Social Service | 199 (30.0%) | 465 (70.0%) |
| Education, Arts & Media | 29 (60.4%) | 19 (39.6%) |
| Legal Services & Support | 0 (0.0%) | 39 (100.0%) |
| Education Instruction & Library | 105 (27.0%) | 284 (73.0%) |
| Arts, Media & Entertainment | 65 (34.6%) | 123 (65.4%) |
| Health Diagnosing & Treating | 30 (7.4%) | 373 (92.6%) |
| Health Technologists | 0 (0.0%) | 240 (100.0%) |
| Total (Category) | 1,015 (35.7%) | 1,826 (64.3%) |
| Total (Overall) | 3,606 (50.7%) | 3,500 (49.2%) |
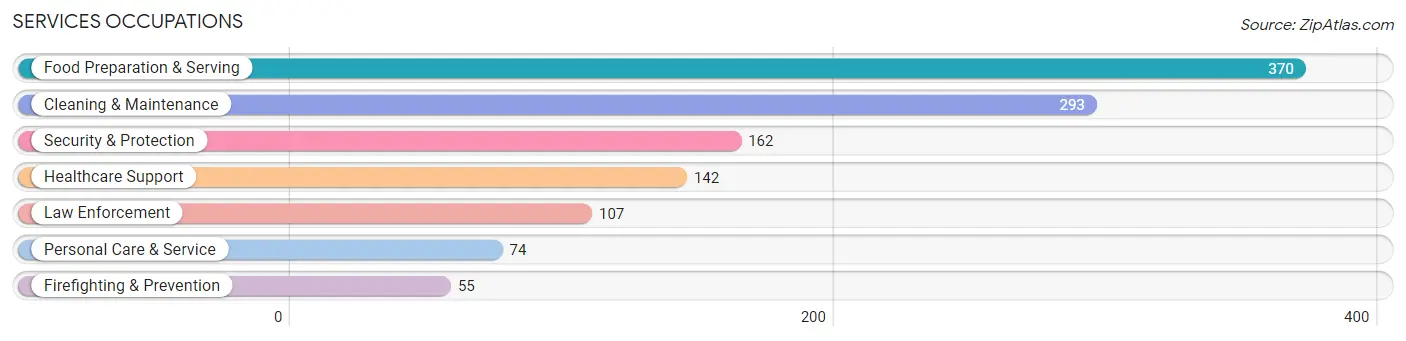
Services Occupations
The most common Services occupations in Windsor Locks are Food Preparation & Serving (370 | 5.2%), Cleaning & Maintenance (293 | 4.1%), Security & Protection (162 | 2.3%), Healthcare Support (142 | 2.0%), and Law Enforcement (107 | 1.5%).
Services Occupations by Sex
Within the Services occupations in Windsor Locks, the most male-oriented occupations are Firefighting & Prevention (100.0%), Cleaning & Maintenance (93.9%), and Security & Protection (88.9%), while the most female-oriented occupations are Healthcare Support (100.0%), Personal Care & Service (100.0%), and Food Preparation & Serving (59.5%).
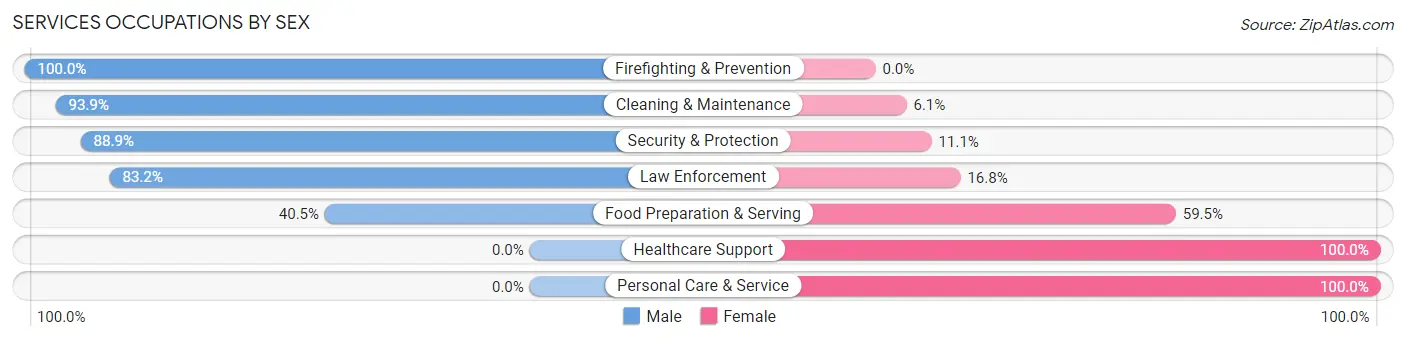
| Occupation | Male | Female |
| Healthcare Support | 0 (0.0%) | 142 (100.0%) |
| Security & Protection | 144 (88.9%) | 18 (11.1%) |
| Firefighting & Prevention | 55 (100.0%) | 0 (0.0%) |
| Law Enforcement | 89 (83.2%) | 18 (16.8%) |
| Food Preparation & Serving | 150 (40.5%) | 220 (59.5%) |
| Cleaning & Maintenance | 275 (93.9%) | 18 (6.1%) |
| Personal Care & Service | 0 (0.0%) | 74 (100.0%) |
| Total (Category) | 569 (54.7%) | 472 (45.3%) |
| Total (Overall) | 3,606 (50.7%) | 3,500 (49.2%) |
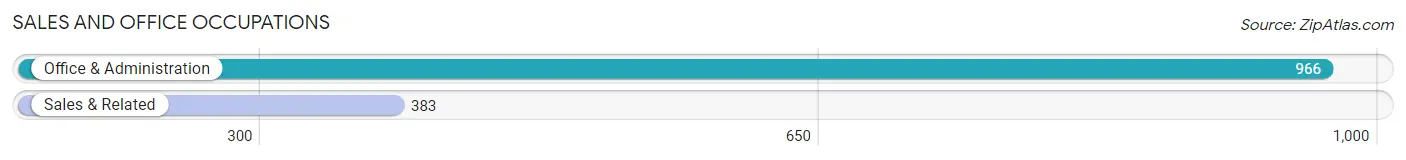
Sales and Office Occupations
The most common Sales and Office occupations in Windsor Locks are Office & Administration (966 | 13.6%), and Sales & Related (383 | 5.4%).
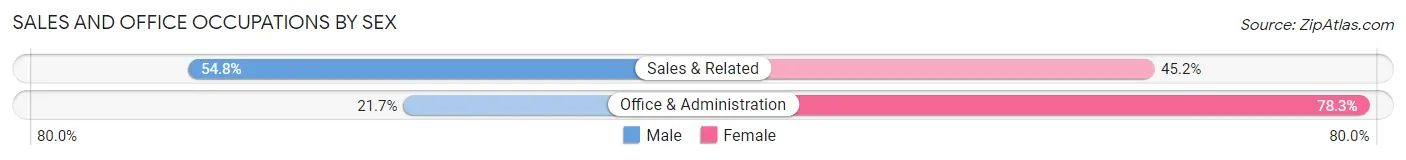
Sales and Office Occupations by Sex
| Occupation | Male | Female |
| Sales & Related | 210 (54.8%) | 173 (45.2%) |
| Office & Administration | 210 (21.7%) | 756 (78.3%) |
| Total (Category) | 420 (31.1%) | 929 (68.9%) |
| Total (Overall) | 3,606 (50.7%) | 3,500 (49.2%) |
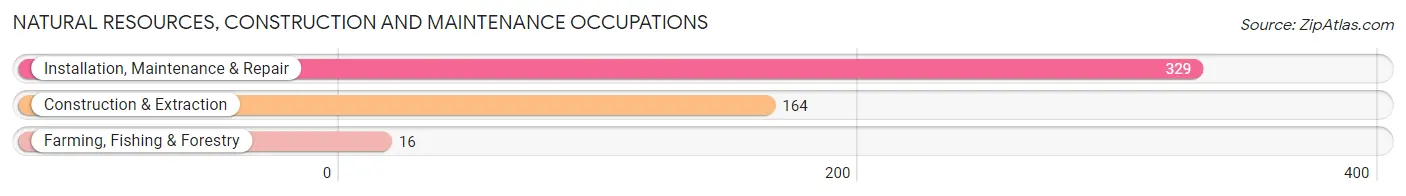
Natural Resources, Construction and Maintenance Occupations
The most common Natural Resources, Construction and Maintenance occupations in Windsor Locks are Installation, Maintenance & Repair (329 | 4.6%), Construction & Extraction (164 | 2.3%), and Farming, Fishing & Forestry (16 | 0.2%).
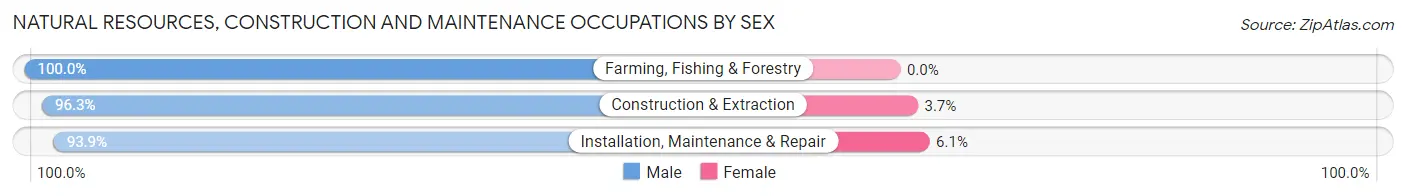
Natural Resources, Construction and Maintenance Occupations by Sex
| Occupation | Male | Female |
| Farming, Fishing & Forestry | 16 (100.0%) | 0 (0.0%) |
| Construction & Extraction | 158 (96.3%) | 6 (3.7%) |
| Installation, Maintenance & Repair | 309 (93.9%) | 20 (6.1%) |
| Total (Category) | 483 (94.9%) | 26 (5.1%) |
| Total (Overall) | 3,606 (50.7%) | 3,500 (49.2%) |
Production, Transportation and Moving Occupations
The most common Production, Transportation and Moving occupations in Windsor Locks are Production (588 | 8.3%), Transportation (494 | 7.0%), and Material Moving (284 | 4.0%).

Production, Transportation and Moving Occupations by Sex
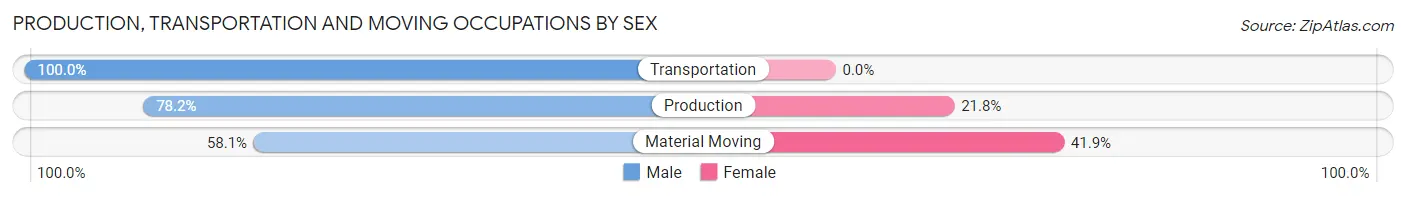
| Occupation | Male | Female |
| Production | 460 (78.2%) | 128 (21.8%) |
| Transportation | 494 (100.0%) | 0 (0.0%) |
| Material Moving | 165 (58.1%) | 119 (41.9%) |
| Total (Category) | 1,119 (81.9%) | 247 (18.1%) |
| Total (Overall) | 3,606 (50.7%) | 3,500 (49.2%) |
Employment Industries by Sex in Windsor Locks
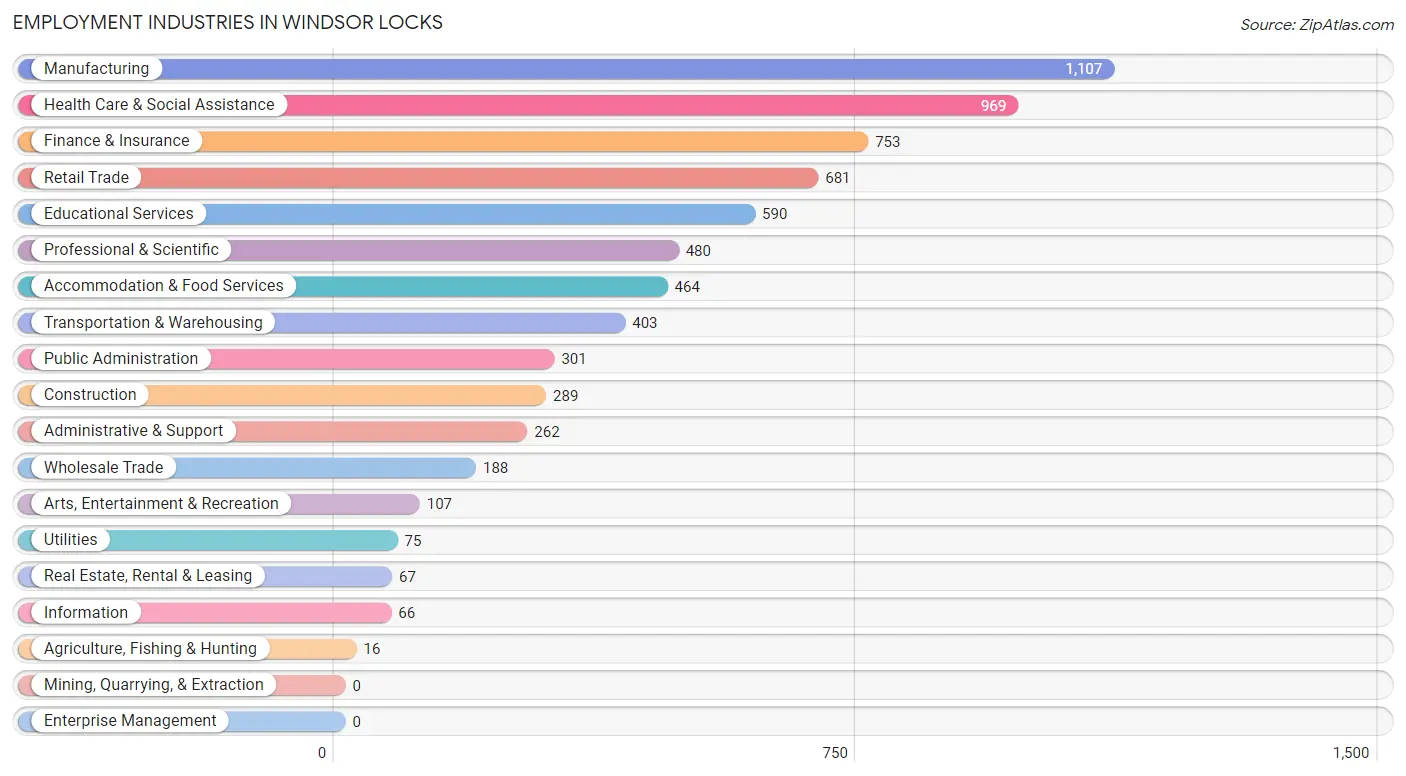
Employment Industries in Windsor Locks
The major employment industries in Windsor Locks include Manufacturing (1,107 | 15.6%), Health Care & Social Assistance (969 | 13.6%), Finance & Insurance (753 | 10.6%), Retail Trade (681 | 9.6%), and Educational Services (590 | 8.3%).
Employment Industries by Sex in Windsor Locks
The Windsor Locks industries that see more men than women are Agriculture, Fishing & Hunting (100.0%), Utilities (100.0%), and Transportation & Warehousing (95.5%), whereas the industries that tend to have a higher number of women are Health Care & Social Assistance (81.6%), Finance & Insurance (80.7%), and Arts, Entertainment & Recreation (71.0%).
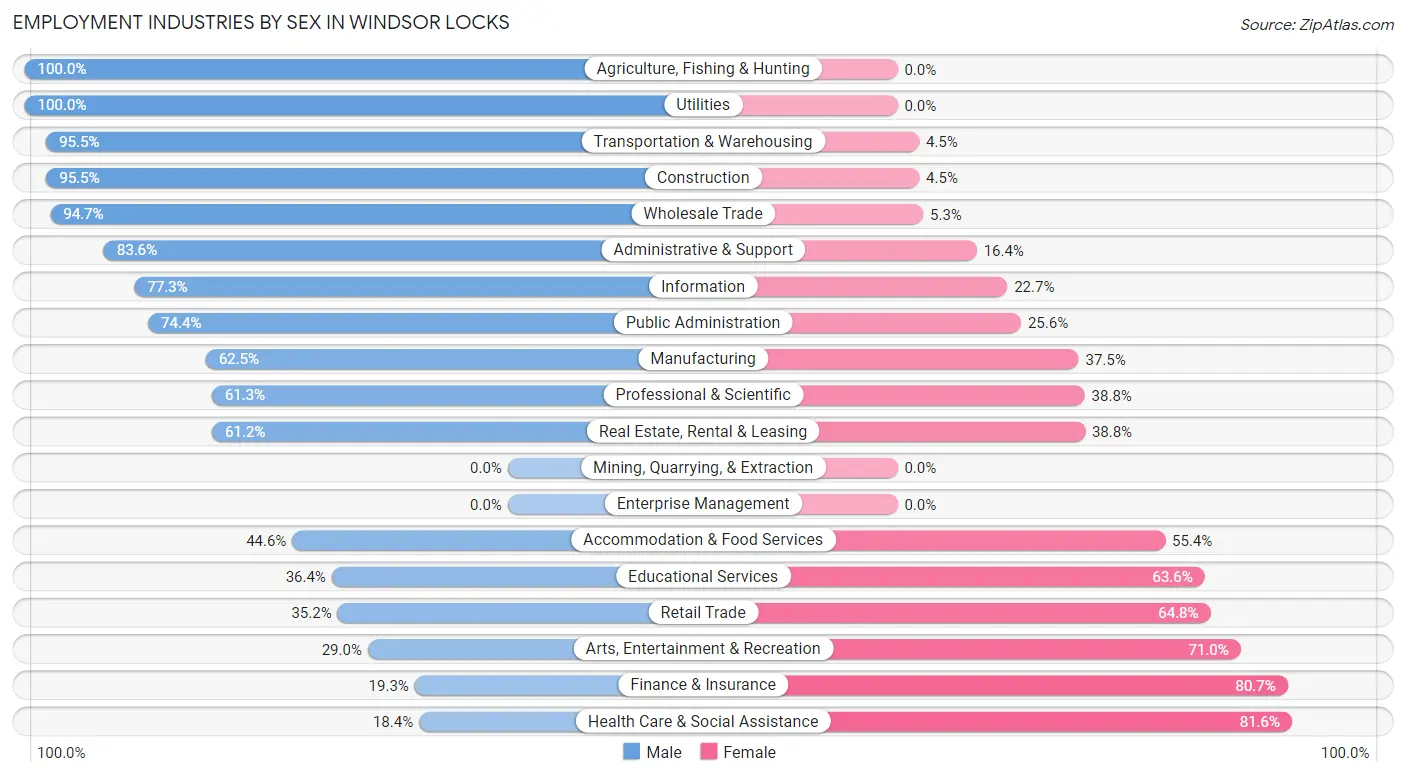
| Industry | Male | Female |
| Agriculture, Fishing & Hunting | 16 (100.0%) | 0 (0.0%) |
| Mining, Quarrying, & Extraction | 0 (0.0%) | 0 (0.0%) |
| Construction | 276 (95.5%) | 13 (4.5%) |
| Manufacturing | 692 (62.5%) | 415 (37.5%) |
| Wholesale Trade | 178 (94.7%) | 10 (5.3%) |
| Retail Trade | 240 (35.2%) | 441 (64.8%) |
| Transportation & Warehousing | 385 (95.5%) | 18 (4.5%) |
| Utilities | 75 (100.0%) | 0 (0.0%) |
| Information | 51 (77.3%) | 15 (22.7%) |
| Finance & Insurance | 145 (19.3%) | 608 (80.7%) |
| Real Estate, Rental & Leasing | 41 (61.2%) | 26 (38.8%) |
| Professional & Scientific | 294 (61.3%) | 186 (38.8%) |
| Enterprise Management | 0 (0.0%) | 0 (0.0%) |
| Administrative & Support | 219 (83.6%) | 43 (16.4%) |
| Educational Services | 215 (36.4%) | 375 (63.6%) |
| Health Care & Social Assistance | 178 (18.4%) | 791 (81.6%) |
| Arts, Entertainment & Recreation | 31 (29.0%) | 76 (71.0%) |
| Accommodation & Food Services | 207 (44.6%) | 257 (55.4%) |
| Public Administration | 224 (74.4%) | 77 (25.6%) |
| Total | 3,606 (50.7%) | 3,500 (49.2%) |
Education in Windsor Locks
School Enrollment in Windsor Locks
The most common levels of schooling among the 3,028 students in Windsor Locks are high school (664 | 21.9%), college / undergraduate (647 | 21.4%), and elementary school (550 | 18.2%).
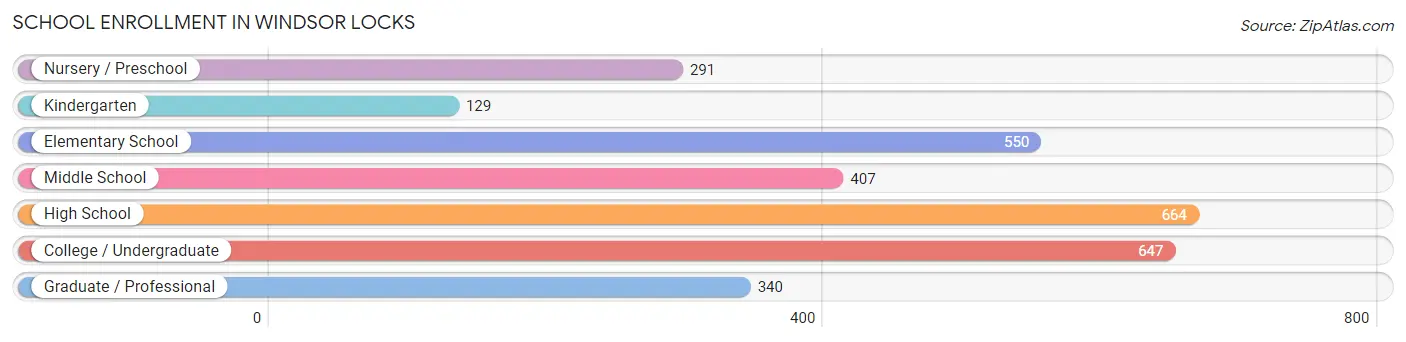
| School Level | # Students | % Students |
| Nursery / Preschool | 291 | 9.6% |
| Kindergarten | 129 | 4.3% |
| Elementary School | 550 | 18.2% |
| Middle School | 407 | 13.4% |
| High School | 664 | 21.9% |
| College / Undergraduate | 647 | 21.4% |
| Graduate / Professional | 340 | 11.2% |
| Total | 3,028 | 100.0% |
School Enrollment by Age by Funding Source in Windsor Locks
Out of a total of 3,028 students who are enrolled in schools in Windsor Locks, 527 (17.4%) attend a private institution, while the remaining 2,501 (82.6%) are enrolled in public schools. The age group of 20 to 24 year olds has the highest likelihood of being enrolled in private schools, with 124 (47.0% in the age bracket) enrolled. Conversely, the age group of 5 to 9 year old has the lowest likelihood of being enrolled in a private school, with 589 (96.6% in the age bracket) attending a public institution.
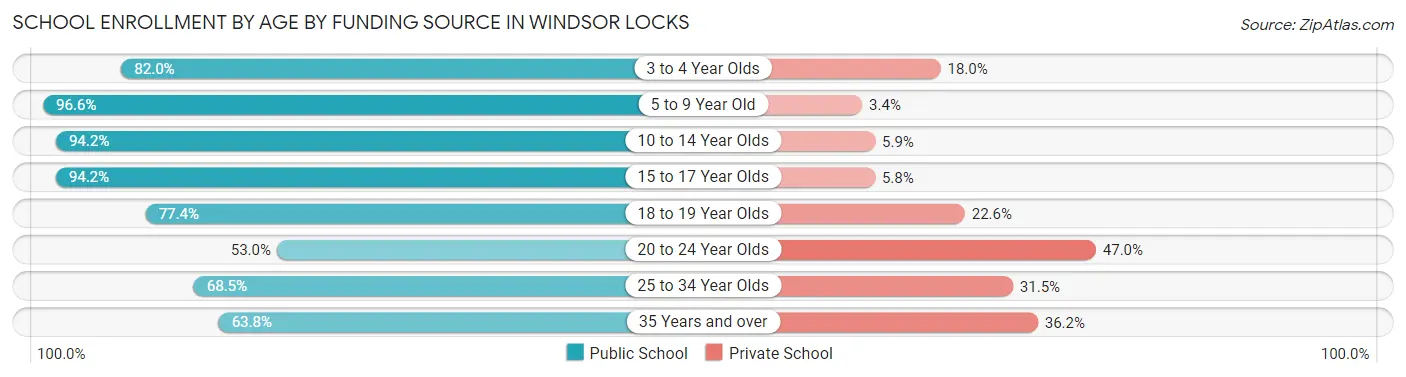
| Age Bracket | Public School | Private School |
| 3 to 4 Year Olds | 259 (82.0%) | 57 (18.0%) |
| 5 to 9 Year Old | 589 (96.6%) | 21 (3.4%) |
| 10 to 14 Year Olds | 515 (94.2%) | 32 (5.9%) |
| 15 to 17 Year Olds | 388 (94.2%) | 24 (5.8%) |
| 18 to 19 Year Olds | 151 (77.4%) | 44 (22.6%) |
| 20 to 24 Year Olds | 140 (53.0%) | 124 (47.0%) |
| 25 to 34 Year Olds | 315 (68.5%) | 145 (31.5%) |
| 35 Years and over | 143 (63.8%) | 81 (36.2%) |
| Total | 2,501 (82.6%) | 527 (17.4%) |
Educational Attainment by Field of Study in Windsor Locks
Business (620 | 22.3%), education (330 | 11.8%), science & technology (309 | 11.1%), engineering (261 | 9.4%), and computers & mathematics (185 | 6.6%) are the most common fields of study among 2,787 individuals in Windsor Locks who have obtained a bachelor's degree or higher.
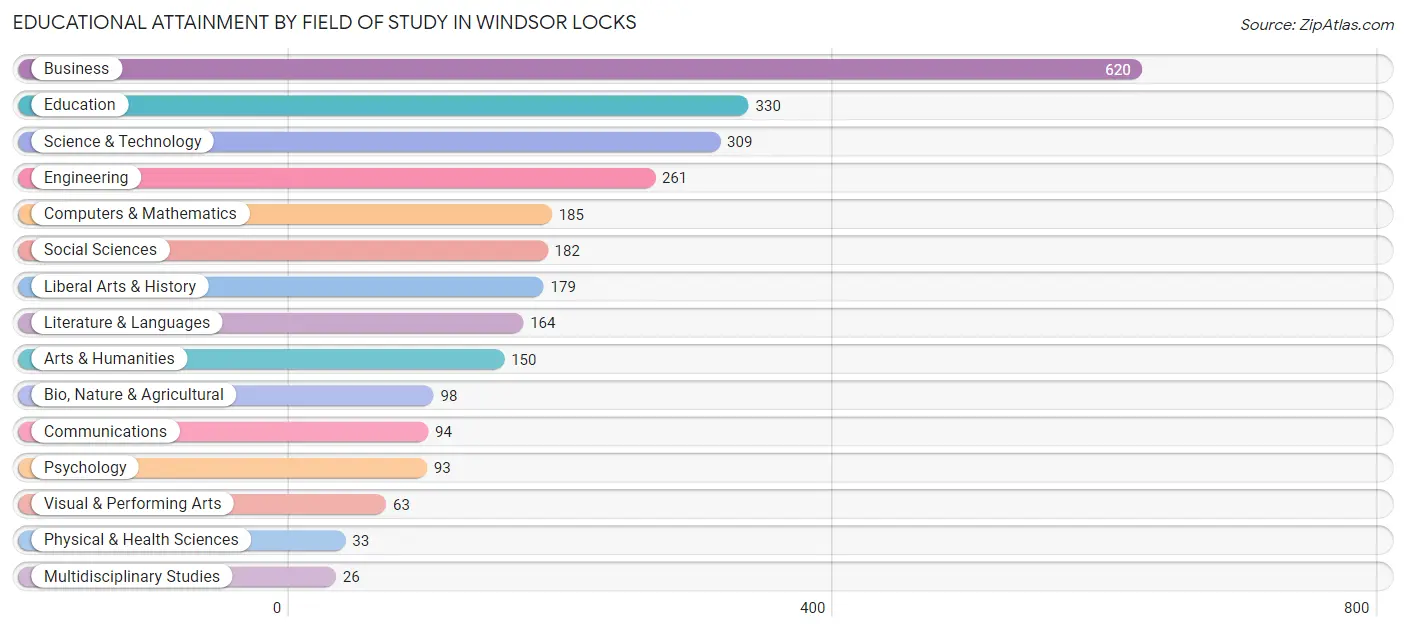
| Field of Study | # Graduates | % Graduates |
| Computers & Mathematics | 185 | 6.6% |
| Bio, Nature & Agricultural | 98 | 3.5% |
| Physical & Health Sciences | 33 | 1.2% |
| Psychology | 93 | 3.3% |
| Social Sciences | 182 | 6.5% |
| Engineering | 261 | 9.4% |
| Multidisciplinary Studies | 26 | 0.9% |
| Science & Technology | 309 | 11.1% |
| Business | 620 | 22.3% |
| Education | 330 | 11.8% |
| Literature & Languages | 164 | 5.9% |
| Liberal Arts & History | 179 | 6.4% |
| Visual & Performing Arts | 63 | 2.3% |
| Communications | 94 | 3.4% |
| Arts & Humanities | 150 | 5.4% |
| Total | 2,787 | 100.0% |
Transportation & Commute in Windsor Locks
Vehicle Availability by Sex in Windsor Locks
The most prevalent vehicle ownership categories in Windsor Locks are males with 2 vehicles (1,325, accounting for 37.7%) and females with 2 vehicles (1,474, making up 38.2%).
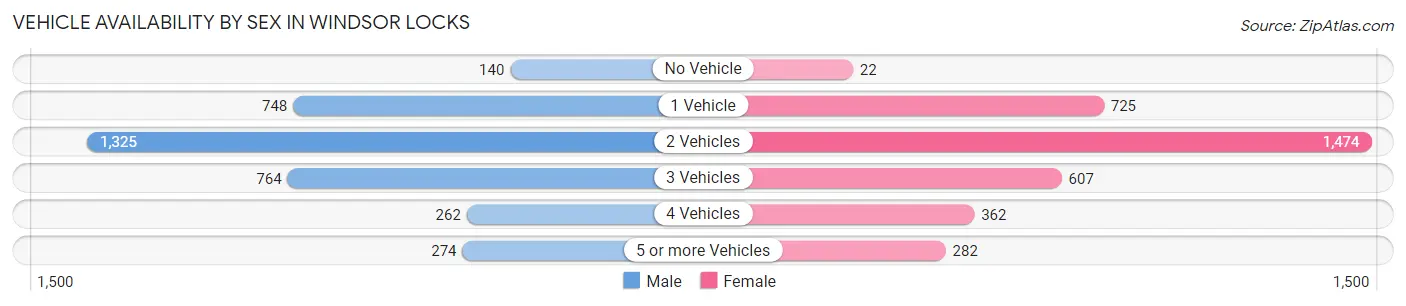
| Vehicles Available | Male | Female |
| No Vehicle | 140 (4.0%) | 22 (0.6%) |
| 1 Vehicle | 748 (21.3%) | 725 (20.9%) |
| 2 Vehicles | 1,325 (37.7%) | 1,474 (42.4%) |
| 3 Vehicles | 764 (21.7%) | 607 (17.5%) |
| 4 Vehicles | 262 (7.5%) | 362 (10.4%) |
| 5 or more Vehicles | 274 (7.8%) | 282 (8.1%) |
| Total | 3,513 (100.0%) | 3,472 (100.0%) |
Commute Time in Windsor Locks
The most frequently occuring commute durations in Windsor Locks are 15 to 19 minutes (1,100 commuters, 17.5%), 20 to 24 minutes (931 commuters, 14.8%), and 5 to 9 minutes (842 commuters, 13.4%).
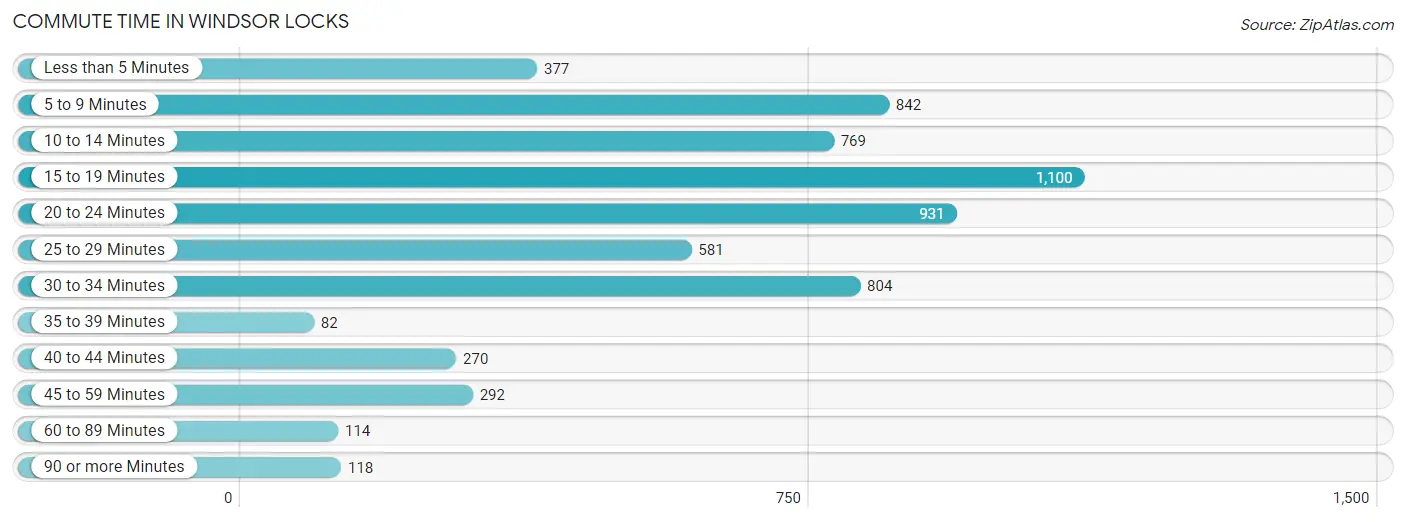
| Commute Time | # Commuters | % Commuters |
| Less than 5 Minutes | 377 | 6.0% |
| 5 to 9 Minutes | 842 | 13.4% |
| 10 to 14 Minutes | 769 | 12.2% |
| 15 to 19 Minutes | 1,100 | 17.5% |
| 20 to 24 Minutes | 931 | 14.8% |
| 25 to 29 Minutes | 581 | 9.2% |
| 30 to 34 Minutes | 804 | 12.8% |
| 35 to 39 Minutes | 82 | 1.3% |
| 40 to 44 Minutes | 270 | 4.3% |
| 45 to 59 Minutes | 292 | 4.6% |
| 60 to 89 Minutes | 114 | 1.8% |
| 90 or more Minutes | 118 | 1.9% |
Commute Time by Sex in Windsor Locks
The most common commute times in Windsor Locks are 20 to 24 minutes (585 commuters, 18.1%) for males and 15 to 19 minutes (646 commuters, 21.1%) for females.
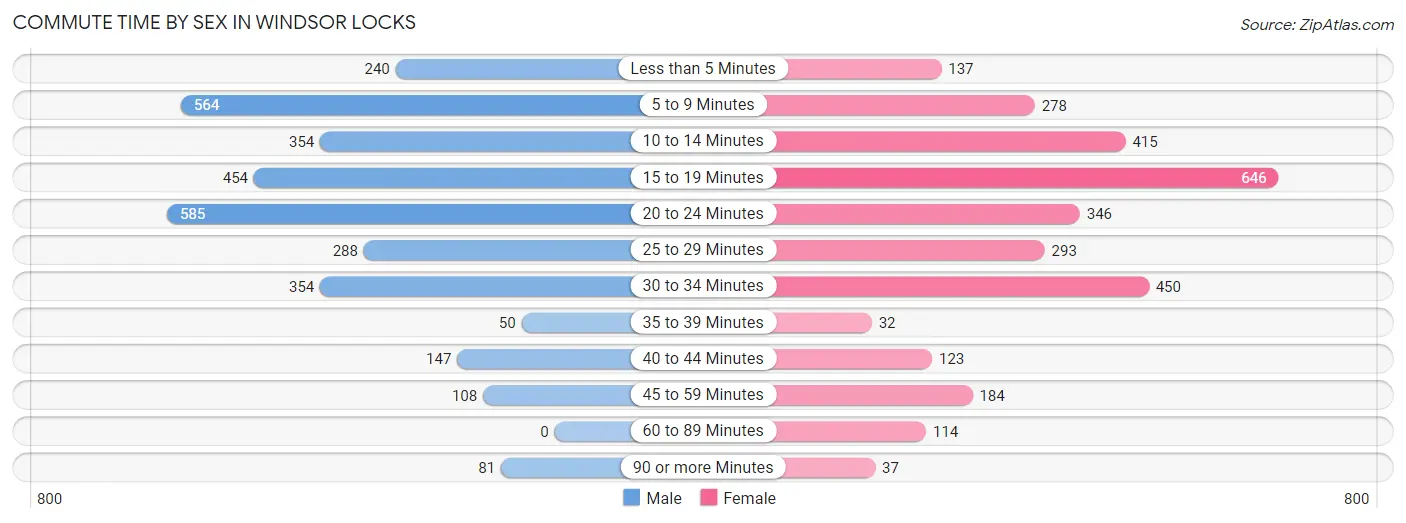
| Commute Time | Male | Female |
| Less than 5 Minutes | 240 (7.4%) | 137 (4.5%) |
| 5 to 9 Minutes | 564 (17.5%) | 278 (9.1%) |
| 10 to 14 Minutes | 354 (11.0%) | 415 (13.6%) |
| 15 to 19 Minutes | 454 (14.1%) | 646 (21.1%) |
| 20 to 24 Minutes | 585 (18.1%) | 346 (11.3%) |
| 25 to 29 Minutes | 288 (8.9%) | 293 (9.6%) |
| 30 to 34 Minutes | 354 (11.0%) | 450 (14.7%) |
| 35 to 39 Minutes | 50 (1.5%) | 32 (1.1%) |
| 40 to 44 Minutes | 147 (4.6%) | 123 (4.0%) |
| 45 to 59 Minutes | 108 (3.4%) | 184 (6.0%) |
| 60 to 89 Minutes | 0 (0.0%) | 114 (3.7%) |
| 90 or more Minutes | 81 (2.5%) | 37 (1.2%) |
Time of Departure to Work by Sex in Windsor Locks
The most frequent times of departure to work in Windsor Locks are 6:30 AM to 6:59 AM (590, 18.3%) for males and 7:30 AM to 7:59 AM (728, 23.8%) for females.
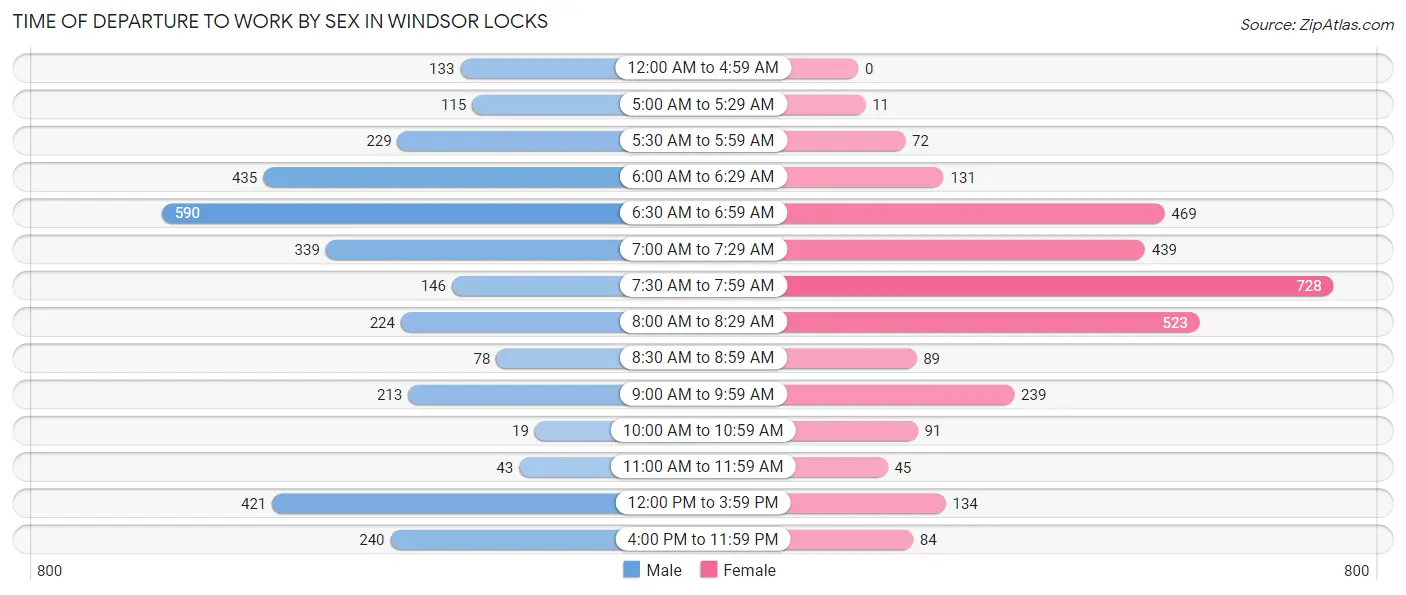
| Time of Departure | Male | Female |
| 12:00 AM to 4:59 AM | 133 (4.1%) | 0 (0.0%) |
| 5:00 AM to 5:29 AM | 115 (3.6%) | 11 (0.4%) |
| 5:30 AM to 5:59 AM | 229 (7.1%) | 72 (2.4%) |
| 6:00 AM to 6:29 AM | 435 (13.5%) | 131 (4.3%) |
| 6:30 AM to 6:59 AM | 590 (18.3%) | 469 (15.3%) |
| 7:00 AM to 7:29 AM | 339 (10.5%) | 439 (14.4%) |
| 7:30 AM to 7:59 AM | 146 (4.5%) | 728 (23.8%) |
| 8:00 AM to 8:29 AM | 224 (7.0%) | 523 (17.1%) |
| 8:30 AM to 8:59 AM | 78 (2.4%) | 89 (2.9%) |
| 9:00 AM to 9:59 AM | 213 (6.6%) | 239 (7.8%) |
| 10:00 AM to 10:59 AM | 19 (0.6%) | 91 (3.0%) |
| 11:00 AM to 11:59 AM | 43 (1.3%) | 45 (1.5%) |
| 12:00 PM to 3:59 PM | 421 (13.1%) | 134 (4.4%) |
| 4:00 PM to 11:59 PM | 240 (7.4%) | 84 (2.8%) |
| Total | 3,225 (100.0%) | 3,055 (100.0%) |
Housing Occupancy in Windsor Locks
Occupancy by Ownership in Windsor Locks
Of the total 5,417 dwellings in Windsor Locks, owner-occupied units account for 4,327 (79.9%), while renter-occupied units make up 1,090 (20.1%).
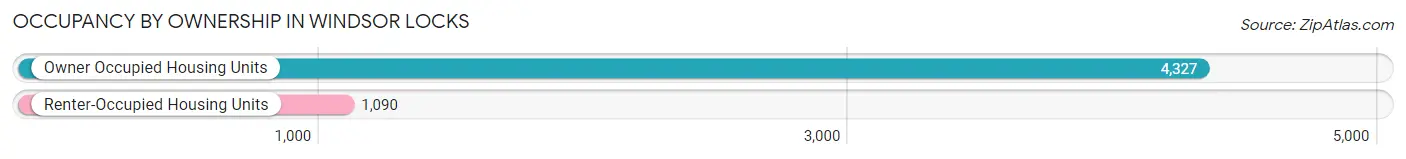
| Occupancy | # Housing Units | % Housing Units |
| Owner Occupied Housing Units | 4,327 | 79.9% |
| Renter-Occupied Housing Units | 1,090 | 20.1% |
| Total Occupied Housing Units | 5,417 | 100.0% |
Occupancy by Household Size in Windsor Locks
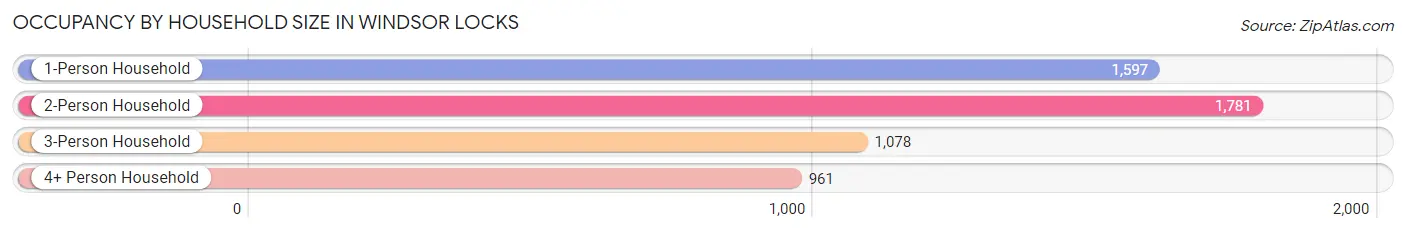
| Household Size | # Housing Units | % Housing Units |
| 1-Person Household | 1,597 | 29.5% |
| 2-Person Household | 1,781 | 32.9% |
| 3-Person Household | 1,078 | 19.9% |
| 4+ Person Household | 961 | 17.7% |
| Total Housing Units | 5,417 | 100.0% |
Occupancy by Ownership by Household Size in Windsor Locks
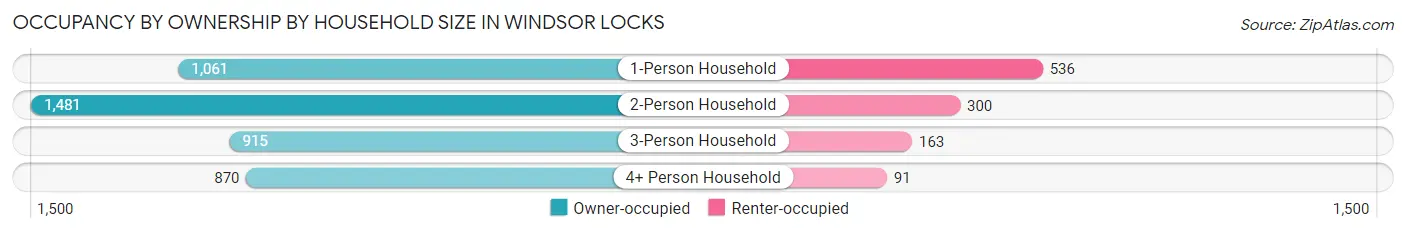
| Household Size | Owner-occupied | Renter-occupied |
| 1-Person Household | 1,061 (66.4%) | 536 (33.6%) |
| 2-Person Household | 1,481 (83.2%) | 300 (16.8%) |
| 3-Person Household | 915 (84.9%) | 163 (15.1%) |
| 4+ Person Household | 870 (90.5%) | 91 (9.5%) |
| Total Housing Units | 4,327 (79.9%) | 1,090 (20.1%) |
Occupancy by Educational Attainment in Windsor Locks
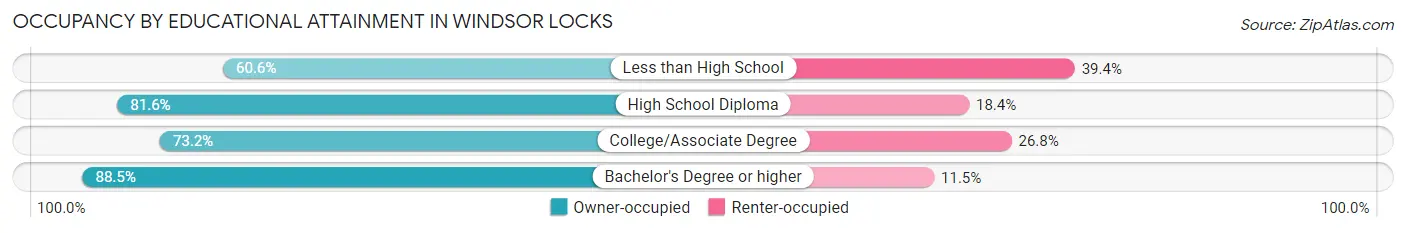
| Household Size | Owner-occupied | Renter-occupied |
| Less than High School | 154 (60.6%) | 100 (39.4%) |
| High School Diploma | 1,387 (81.6%) | 313 (18.4%) |
| College/Associate Degree | 1,330 (73.2%) | 488 (26.8%) |
| Bachelor's Degree or higher | 1,456 (88.5%) | 189 (11.5%) |
Occupancy by Age of Householder in Windsor Locks
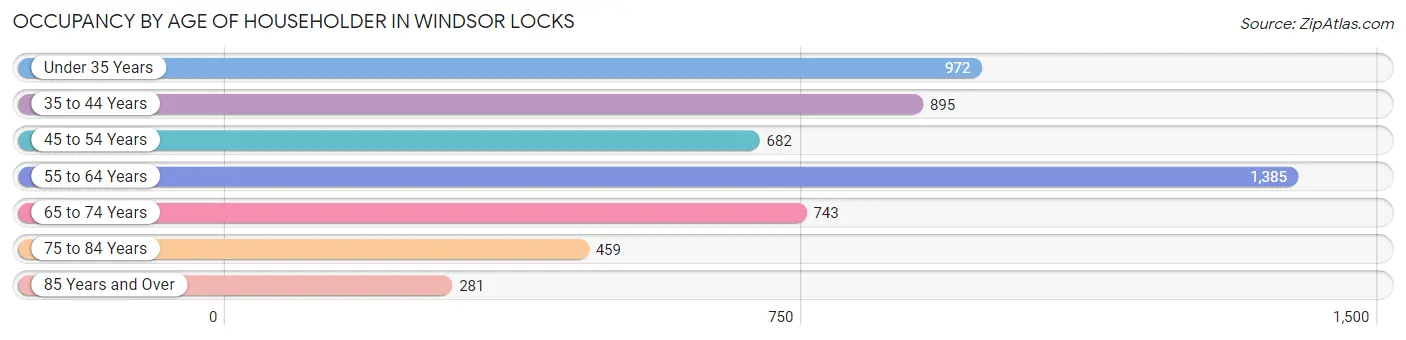
| Age Bracket | # Households | % Households |
| Under 35 Years | 972 | 17.9% |
| 35 to 44 Years | 895 | 16.5% |
| 45 to 54 Years | 682 | 12.6% |
| 55 to 64 Years | 1,385 | 25.6% |
| 65 to 74 Years | 743 | 13.7% |
| 75 to 84 Years | 459 | 8.5% |
| 85 Years and Over | 281 | 5.2% |
| Total | 5,417 | 100.0% |
Housing Finances in Windsor Locks
Median Income by Occupancy in Windsor Locks
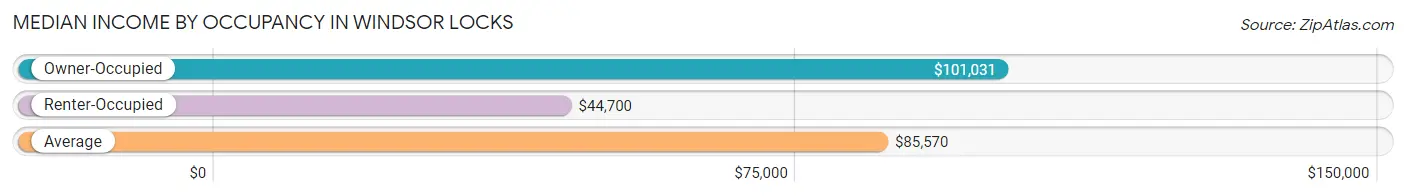
| Occupancy Type | # Households | Median Income |
| Owner-Occupied | 4,327 (79.9%) | $101,031 |
| Renter-Occupied | 1,090 (20.1%) | $44,700 |
| Average | 5,417 (100.0%) | $85,570 |
Occupancy by Householder Income Bracket in Windsor Locks
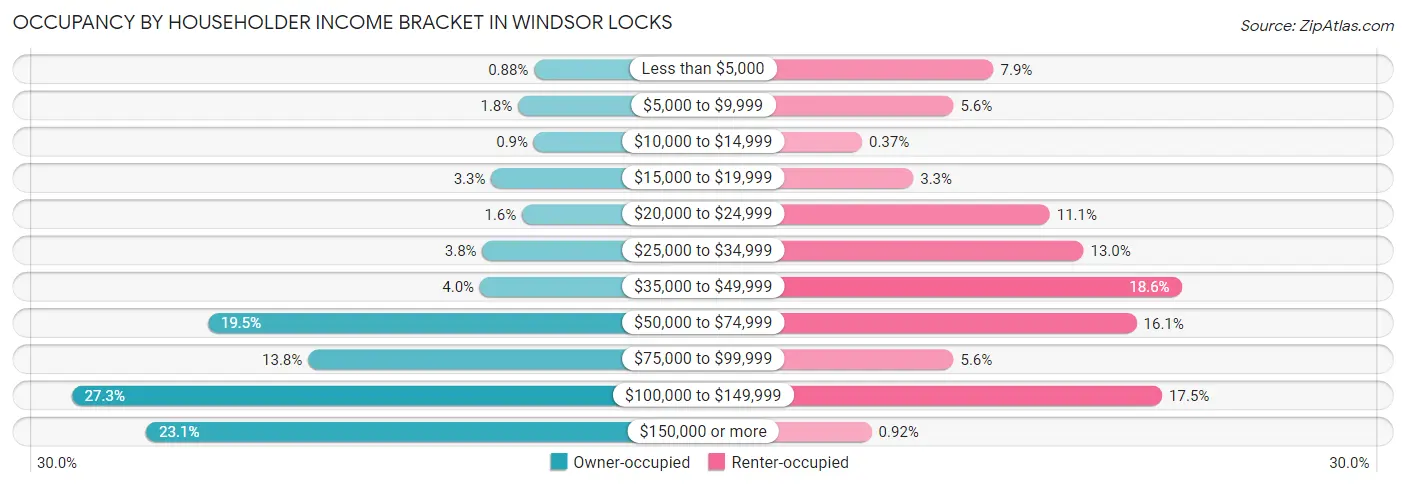
| Income Bracket | Owner-occupied | Renter-occupied |
| Less than $5,000 | 38 (0.9%) | 86 (7.9%) |
| $5,000 to $9,999 | 78 (1.8%) | 61 (5.6%) |
| $10,000 to $14,999 | 39 (0.9%) | 4 (0.4%) |
| $15,000 to $19,999 | 144 (3.3%) | 36 (3.3%) |
| $20,000 to $24,999 | 68 (1.6%) | 121 (11.1%) |
| $25,000 to $34,999 | 166 (3.8%) | 142 (13.0%) |
| $35,000 to $49,999 | 172 (4.0%) | 203 (18.6%) |
| $50,000 to $74,999 | 845 (19.5%) | 175 (16.1%) |
| $75,000 to $99,999 | 597 (13.8%) | 61 (5.6%) |
| $100,000 to $149,999 | 1,182 (27.3%) | 191 (17.5%) |
| $150,000 or more | 998 (23.1%) | 10 (0.9%) |
| Total | 4,327 (100.0%) | 1,090 (100.0%) |
Monthly Housing Cost Tiers in Windsor Locks
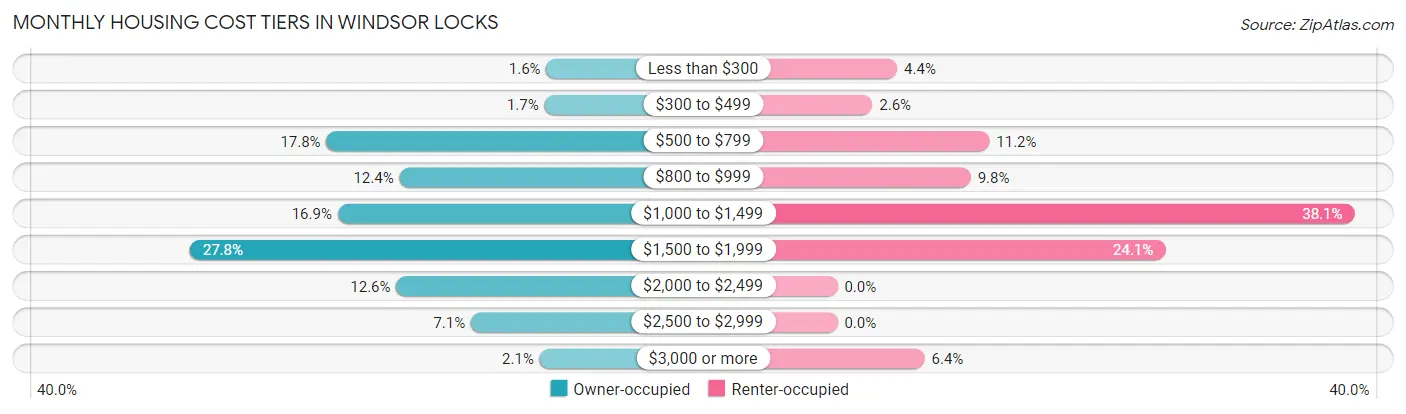
| Monthly Cost | Owner-occupied | Renter-occupied |
| Less than $300 | 68 (1.6%) | 48 (4.4%) |
| $300 to $499 | 74 (1.7%) | 28 (2.6%) |
| $500 to $799 | 769 (17.8%) | 122 (11.2%) |
| $800 to $999 | 536 (12.4%) | 107 (9.8%) |
| $1,000 to $1,499 | 733 (16.9%) | 415 (38.1%) |
| $1,500 to $1,999 | 1,204 (27.8%) | 263 (24.1%) |
| $2,000 to $2,499 | 546 (12.6%) | 0 (0.0%) |
| $2,500 to $2,999 | 308 (7.1%) | 0 (0.0%) |
| $3,000 or more | 89 (2.1%) | 70 (6.4%) |
| Total | 4,327 (100.0%) | 1,090 (100.0%) |
Physical Housing Characteristics in Windsor Locks
Housing Structures in Windsor Locks
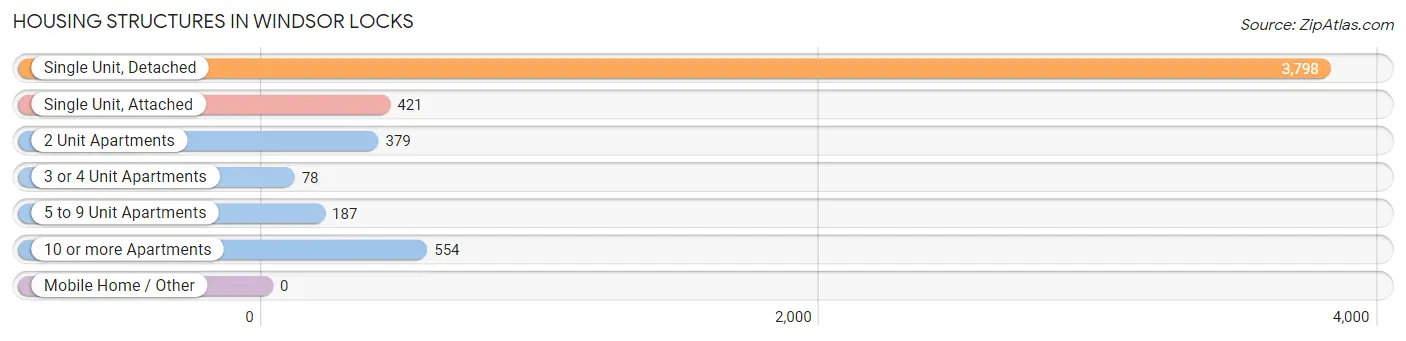
| Structure Type | # Housing Units | % Housing Units |
| Single Unit, Detached | 3,798 | 70.1% |
| Single Unit, Attached | 421 | 7.8% |
| 2 Unit Apartments | 379 | 7.0% |
| 3 or 4 Unit Apartments | 78 | 1.4% |
| 5 to 9 Unit Apartments | 187 | 3.5% |
| 10 or more Apartments | 554 | 10.2% |
| Mobile Home / Other | 0 | 0.0% |
| Total | 5,417 | 100.0% |
Housing Structures by Occupancy in Windsor Locks
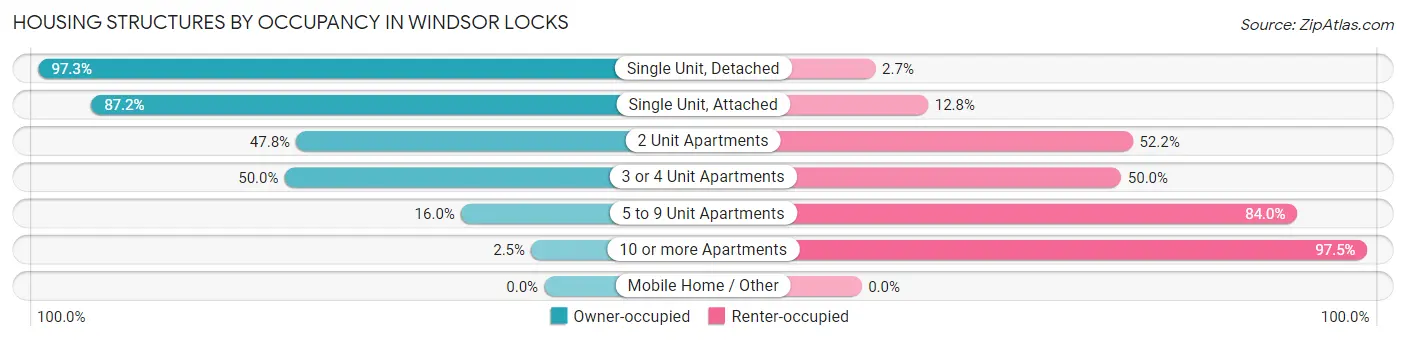
| Structure Type | Owner-occupied | Renter-occupied |
| Single Unit, Detached | 3,696 (97.3%) | 102 (2.7%) |
| Single Unit, Attached | 367 (87.2%) | 54 (12.8%) |
| 2 Unit Apartments | 181 (47.8%) | 198 (52.2%) |
| 3 or 4 Unit Apartments | 39 (50.0%) | 39 (50.0%) |
| 5 to 9 Unit Apartments | 30 (16.0%) | 157 (84.0%) |
| 10 or more Apartments | 14 (2.5%) | 540 (97.5%) |
| Mobile Home / Other | 0 (0.0%) | 0 (0.0%) |
| Total | 4,327 (79.9%) | 1,090 (20.1%) |
Housing Structures by Number of Rooms in Windsor Locks
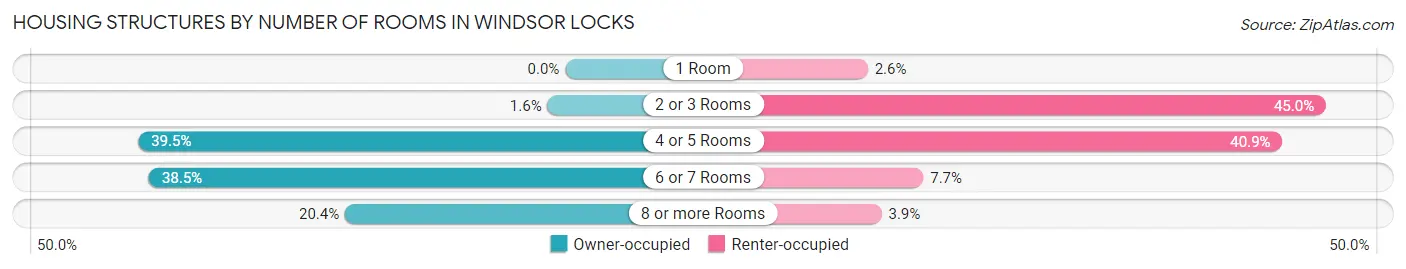
| Number of Rooms | Owner-occupied | Renter-occupied |
| 1 Room | 0 (0.0%) | 28 (2.6%) |
| 2 or 3 Rooms | 71 (1.6%) | 490 (45.0%) |
| 4 or 5 Rooms | 1,709 (39.5%) | 446 (40.9%) |
| 6 or 7 Rooms | 1,666 (38.5%) | 84 (7.7%) |
| 8 or more Rooms | 881 (20.4%) | 42 (3.8%) |
| Total | 4,327 (100.0%) | 1,090 (100.0%) |
Housing Structure by Heating Type in Windsor Locks
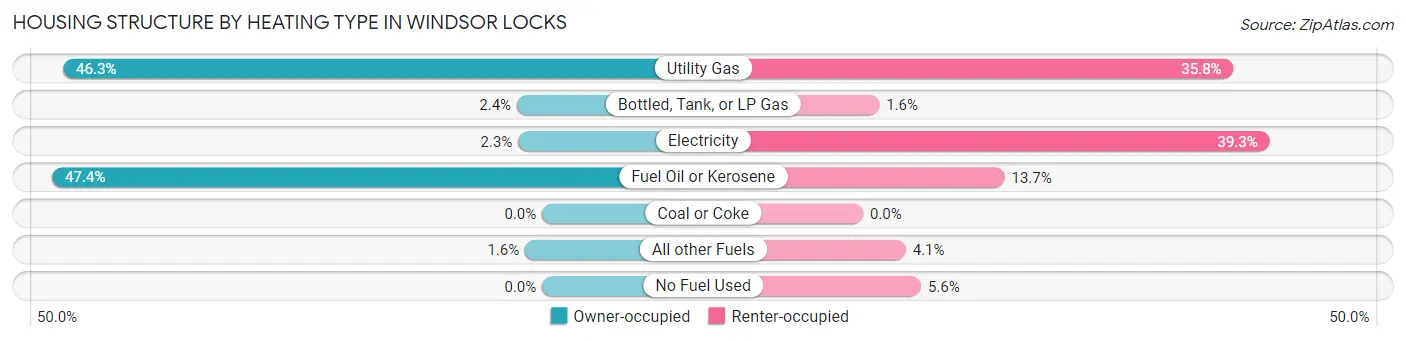
| Heating Type | Owner-occupied | Renter-occupied |
| Utility Gas | 2,002 (46.3%) | 390 (35.8%) |
| Bottled, Tank, or LP Gas | 105 (2.4%) | 17 (1.6%) |
| Electricity | 100 (2.3%) | 428 (39.3%) |
| Fuel Oil or Kerosene | 2,049 (47.3%) | 149 (13.7%) |
| Coal or Coke | 0 (0.0%) | 0 (0.0%) |
| All other Fuels | 71 (1.6%) | 45 (4.1%) |
| No Fuel Used | 0 (0.0%) | 61 (5.6%) |
| Total | 4,327 (100.0%) | 1,090 (100.0%) |
Household Vehicle Usage in Windsor Locks
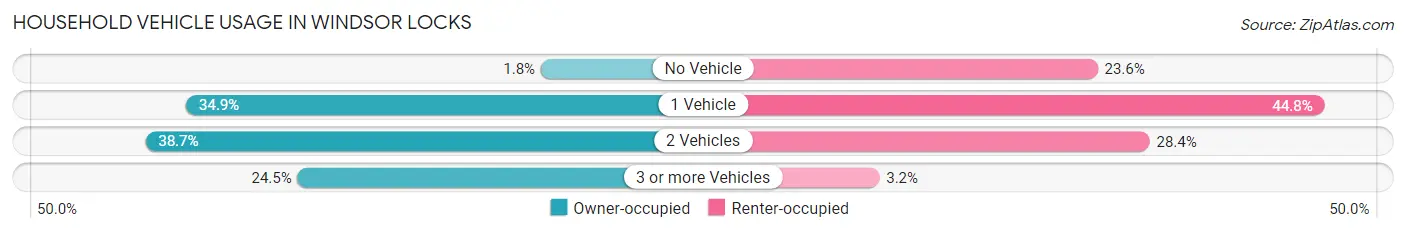
| Vehicles per Household | Owner-occupied | Renter-occupied |
| No Vehicle | 78 (1.8%) | 257 (23.6%) |
| 1 Vehicle | 1,512 (34.9%) | 488 (44.8%) |
| 2 Vehicles | 1,676 (38.7%) | 310 (28.4%) |
| 3 or more Vehicles | 1,061 (24.5%) | 35 (3.2%) |
| Total | 4,327 (100.0%) | 1,090 (100.0%) |
Real Estate & Mortgages in Windsor Locks
Real Estate and Mortgage Overview in Windsor Locks
| Characteristic | Without Mortgage | With Mortgage |
| Housing Units | 1,635 | 2,692 |
| Median Property Value | $249,100 | $231,200 |
| Median Household Income | $70,734 | $671 |
| Monthly Housing Costs | $791 | $89 |
| Real Estate Taxes | $3,817 | $19 |
Property Value by Mortgage Status in Windsor Locks
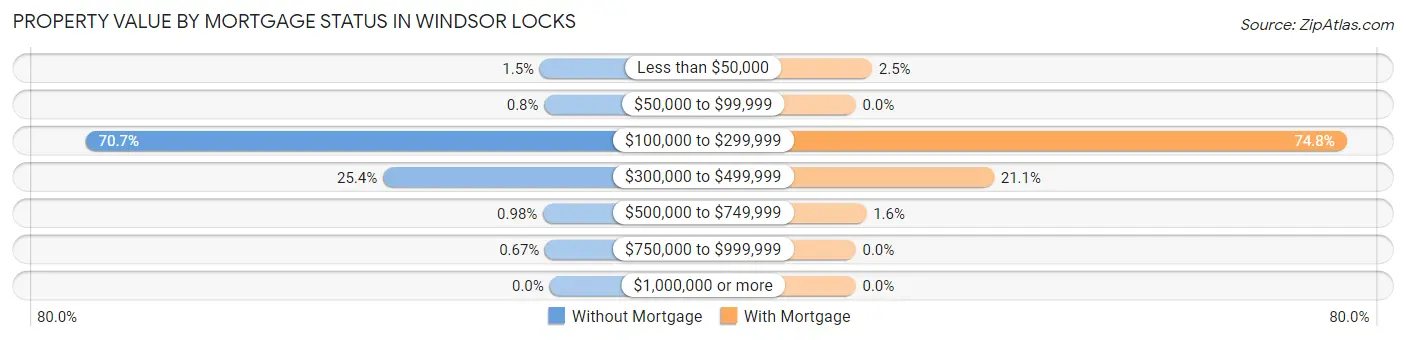
| Property Value | Without Mortgage | With Mortgage |
| Less than $50,000 | 24 (1.5%) | 67 (2.5%) |
| $50,000 to $99,999 | 13 (0.8%) | 0 (0.0%) |
| $100,000 to $299,999 | 1,156 (70.7%) | 2,014 (74.8%) |
| $300,000 to $499,999 | 415 (25.4%) | 567 (21.1%) |
| $500,000 to $749,999 | 16 (1.0%) | 44 (1.6%) |
| $750,000 to $999,999 | 11 (0.7%) | 0 (0.0%) |
| $1,000,000 or more | 0 (0.0%) | 0 (0.0%) |
| Total | 1,635 (100.0%) | 2,692 (100.0%) |
Household Income by Mortgage Status in Windsor Locks
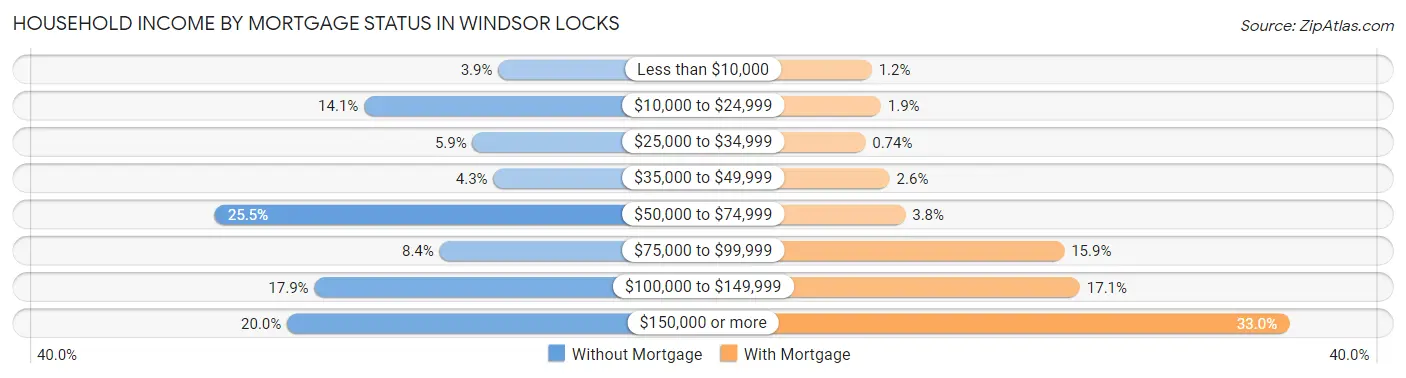
| Household Income | Without Mortgage | With Mortgage |
| Less than $10,000 | 64 (3.9%) | 33 (1.2%) |
| $10,000 to $24,999 | 231 (14.1%) | 52 (1.9%) |
| $25,000 to $34,999 | 96 (5.9%) | 20 (0.7%) |
| $35,000 to $49,999 | 70 (4.3%) | 70 (2.6%) |
| $50,000 to $74,999 | 417 (25.5%) | 102 (3.8%) |
| $75,000 to $99,999 | 137 (8.4%) | 428 (15.9%) |
| $100,000 to $149,999 | 293 (17.9%) | 460 (17.1%) |
| $150,000 or more | 327 (20.0%) | 889 (33.0%) |
| Total | 1,635 (100.0%) | 2,692 (100.0%) |
Property Value to Household Income Ratio in Windsor Locks
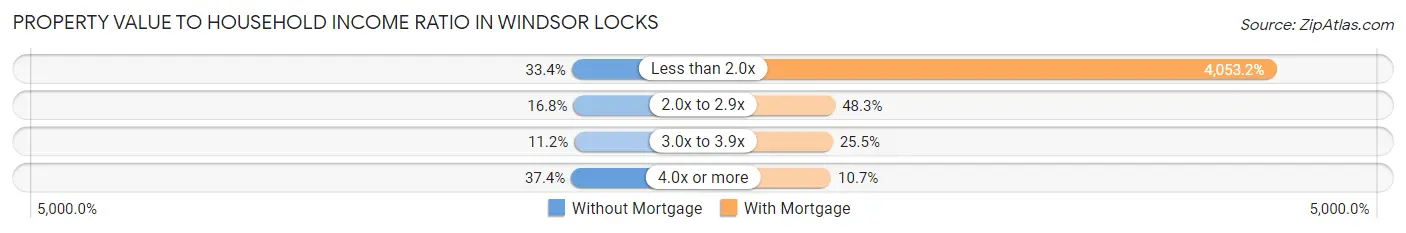
| Value-to-Income Ratio | Without Mortgage | With Mortgage |
| Less than 2.0x | 546 (33.4%) | 109,113 (4,053.2%) |
| 2.0x to 2.9x | 275 (16.8%) | 1,299 (48.2%) |
| 3.0x to 3.9x | 183 (11.2%) | 685 (25.5%) |
| 4.0x or more | 612 (37.4%) | 287 (10.7%) |
| Total | 1,635 (100.0%) | 2,692 (100.0%) |
Real Estate Taxes by Mortgage Status in Windsor Locks
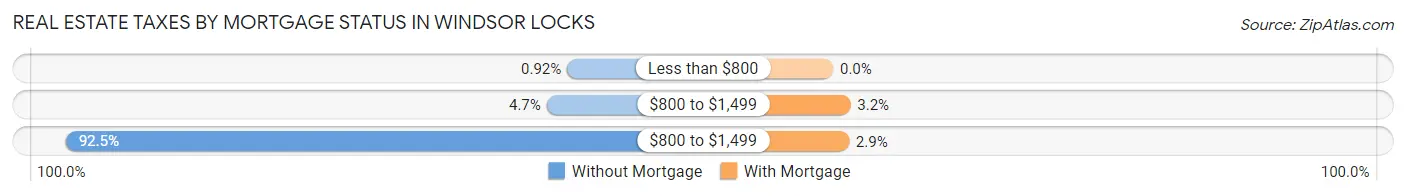
| Property Taxes | Without Mortgage | With Mortgage |
| Less than $800 | 15 (0.9%) | 0 (0.0%) |
| $800 to $1,499 | 76 (4.6%) | 85 (3.2%) |
| $800 to $1,499 | 1,512 (92.5%) | 78 (2.9%) |
| Total | 1,635 (100.0%) | 2,692 (100.0%) |
Health & Disability in Windsor Locks
Health Insurance Coverage by Age in Windsor Locks
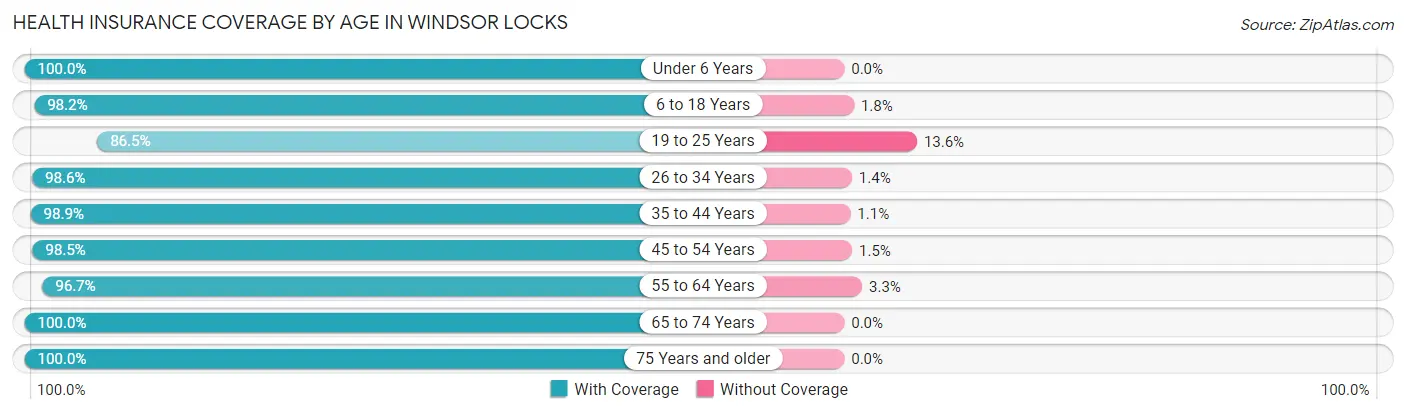
| Age Bracket | With Coverage | Without Coverage |
| Under 6 Years | 844 (100.0%) | 0 (0.0%) |
| 6 to 18 Years | 1,687 (98.2%) | 31 (1.8%) |
| 19 to 25 Years | 868 (86.5%) | 136 (13.6%) |
| 26 to 34 Years | 1,455 (98.6%) | 21 (1.4%) |
| 35 to 44 Years | 1,647 (98.9%) | 19 (1.1%) |
| 45 to 54 Years | 1,353 (98.5%) | 20 (1.5%) |
| 55 to 64 Years | 2,214 (96.7%) | 76 (3.3%) |
| 65 to 74 Years | 1,109 (100.0%) | 0 (0.0%) |
| 75 Years and older | 1,042 (100.0%) | 0 (0.0%) |
| Total | 12,219 (97.6%) | 303 (2.4%) |
Health Insurance Coverage by Citizenship Status in Windsor Locks
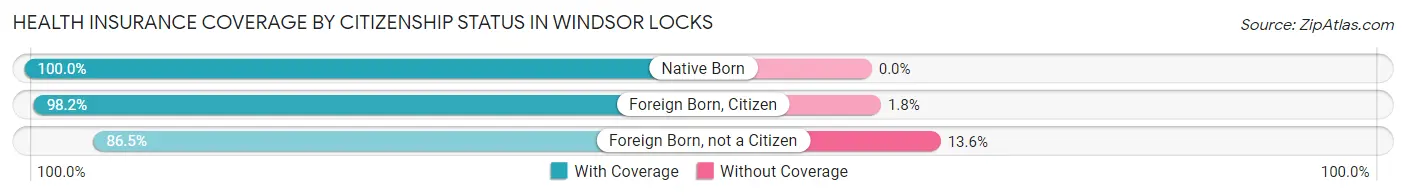
| Citizenship Status | With Coverage | Without Coverage |
| Native Born | 844 (100.0%) | 0 (0.0%) |
| Foreign Born, Citizen | 1,687 (98.2%) | 31 (1.8%) |
| Foreign Born, not a Citizen | 868 (86.5%) | 136 (13.6%) |
Health Insurance Coverage by Household Income in Windsor Locks
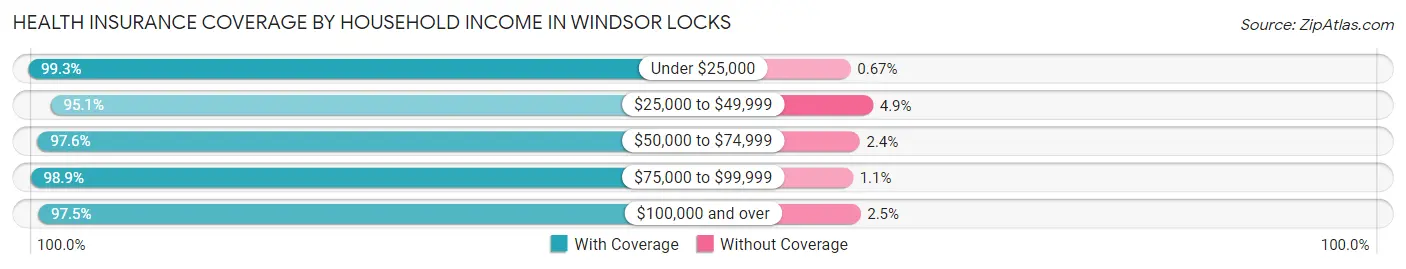
| Household Income | With Coverage | Without Coverage |
| Under $25,000 | 1,038 (99.3%) | 7 (0.7%) |
| $25,000 to $49,999 | 1,191 (95.1%) | 61 (4.9%) |
| $50,000 to $74,999 | 2,209 (97.6%) | 54 (2.4%) |
| $75,000 to $99,999 | 1,425 (98.9%) | 16 (1.1%) |
| $100,000 and over | 6,346 (97.5%) | 165 (2.5%) |
Public vs Private Health Insurance Coverage by Age in Windsor Locks
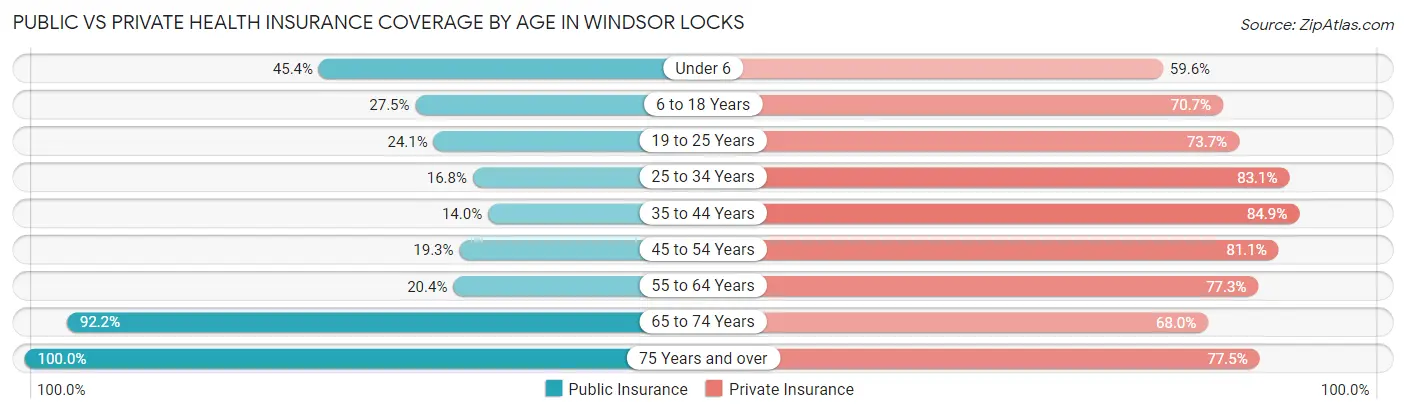
| Age Bracket | Public Insurance | Private Insurance |
| Under 6 | 383 (45.4%) | 503 (59.6%) |
| 6 to 18 Years | 472 (27.5%) | 1,215 (70.7%) |
| 19 to 25 Years | 242 (24.1%) | 740 (73.7%) |
| 25 to 34 Years | 248 (16.8%) | 1,226 (83.1%) |
| 35 to 44 Years | 233 (14.0%) | 1,414 (84.9%) |
| 45 to 54 Years | 265 (19.3%) | 1,113 (81.1%) |
| 55 to 64 Years | 468 (20.4%) | 1,770 (77.3%) |
| 65 to 74 Years | 1,022 (92.2%) | 754 (68.0%) |
| 75 Years and over | 1,042 (100.0%) | 808 (77.5%) |
| Total | 4,375 (34.9%) | 9,543 (76.2%) |
Disability Status by Sex by Age in Windsor Locks
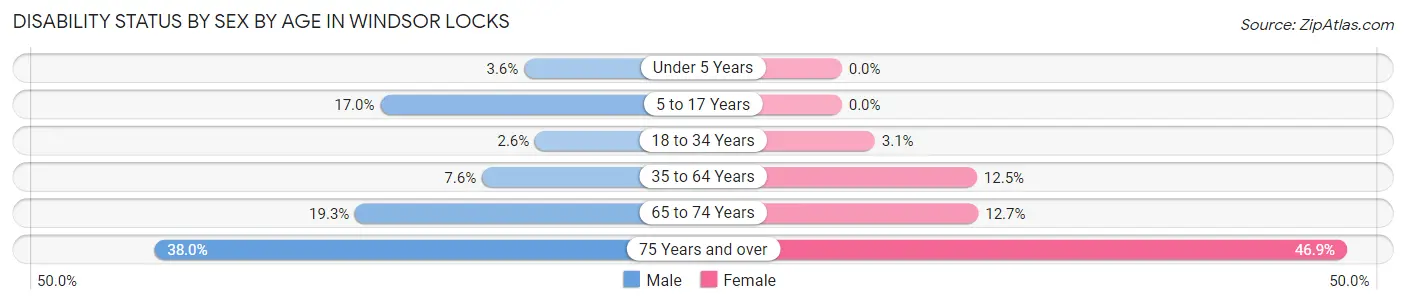
| Age Bracket | Male | Female |
| Under 5 Years | 9 (3.6%) | 0 (0.0%) |
| 5 to 17 Years | 131 (17.0%) | 0 (0.0%) |
| 18 to 34 Years | 34 (2.6%) | 43 (3.1%) |
| 35 to 64 Years | 200 (7.5%) | 336 (12.5%) |
| 65 to 74 Years | 103 (19.3%) | 73 (12.7%) |
| 75 Years and over | 134 (38.0%) | 323 (46.9%) |
Disability Class by Sex by Age in Windsor Locks
Disability Class: Hearing Difficulty
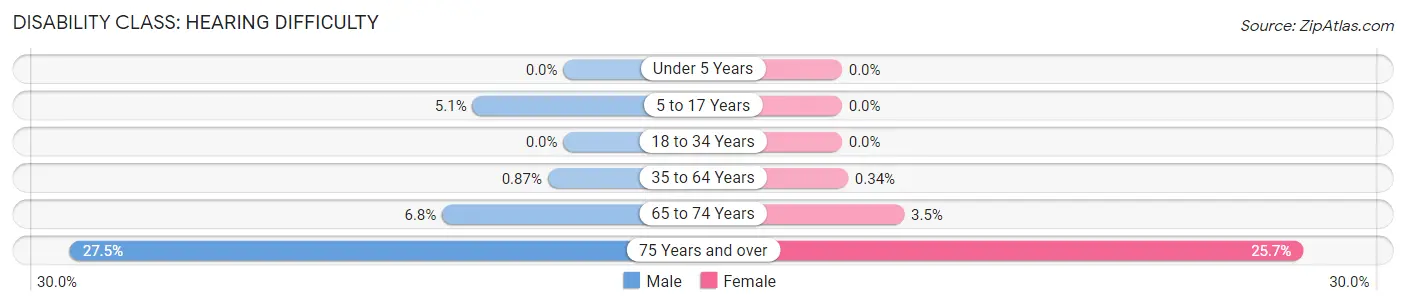
| Age Bracket | Male | Female |
| Under 5 Years | 0 (0.0%) | 0 (0.0%) |
| 5 to 17 Years | 39 (5.1%) | 0 (0.0%) |
| 18 to 34 Years | 0 (0.0%) | 0 (0.0%) |
| 35 to 64 Years | 23 (0.9%) | 9 (0.3%) |
| 65 to 74 Years | 36 (6.8%) | 20 (3.5%) |
| 75 Years and over | 97 (27.5%) | 177 (25.7%) |
Disability Class: Vision Difficulty
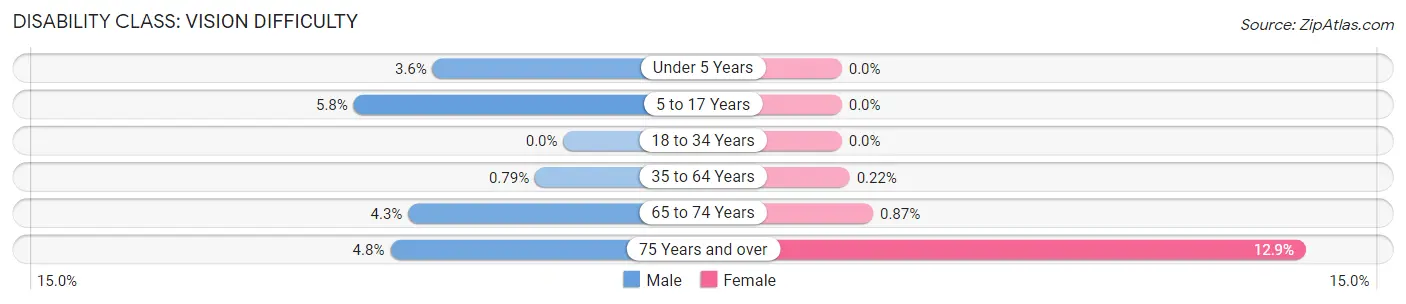
| Age Bracket | Male | Female |
| Under 5 Years | 9 (3.6%) | 0 (0.0%) |
| 5 to 17 Years | 45 (5.8%) | 0 (0.0%) |
| 18 to 34 Years | 0 (0.0%) | 0 (0.0%) |
| 35 to 64 Years | 21 (0.8%) | 6 (0.2%) |
| 65 to 74 Years | 23 (4.3%) | 5 (0.9%) |
| 75 Years and over | 17 (4.8%) | 89 (12.9%) |
Disability Class: Cognitive Difficulty
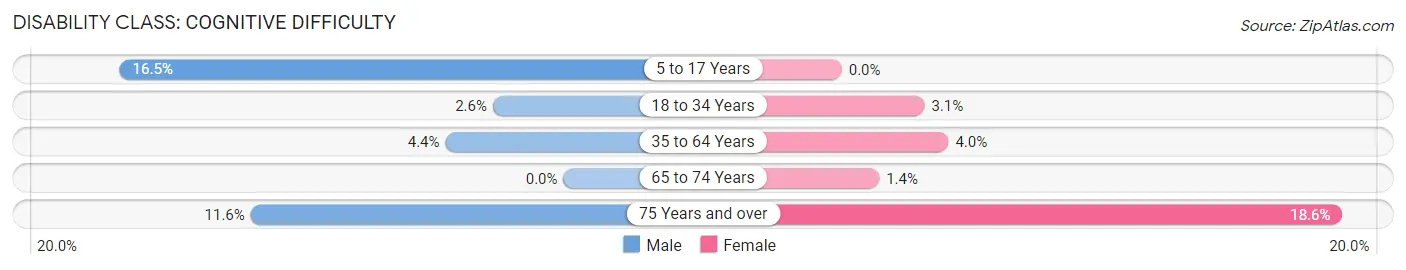
| Age Bracket | Male | Female |
| 5 to 17 Years | 127 (16.5%) | 0 (0.0%) |
| 18 to 34 Years | 34 (2.6%) | 43 (3.1%) |
| 35 to 64 Years | 116 (4.4%) | 106 (4.0%) |
| 65 to 74 Years | 0 (0.0%) | 8 (1.4%) |
| 75 Years and over | 41 (11.6%) | 128 (18.6%) |
Disability Class: Ambulatory Difficulty
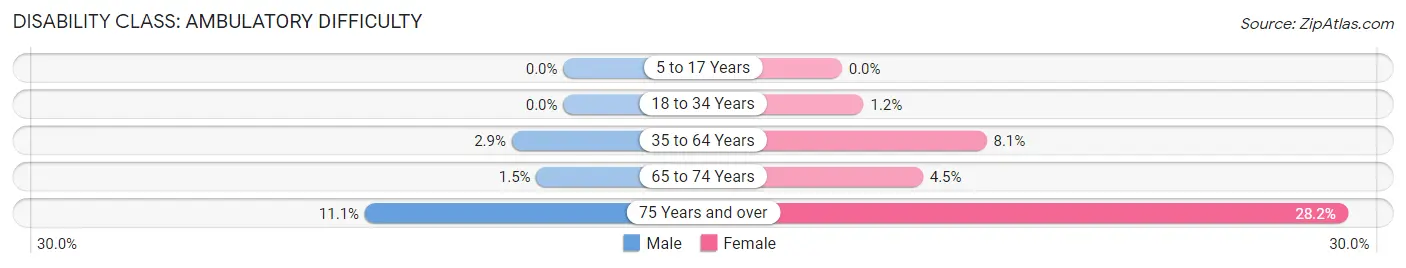
| Age Bracket | Male | Female |
| 5 to 17 Years | 0 (0.0%) | 0 (0.0%) |
| 18 to 34 Years | 0 (0.0%) | 17 (1.2%) |
| 35 to 64 Years | 76 (2.9%) | 216 (8.1%) |
| 65 to 74 Years | 8 (1.5%) | 26 (4.5%) |
| 75 Years and over | 39 (11.1%) | 194 (28.2%) |
Disability Class: Self-Care Difficulty
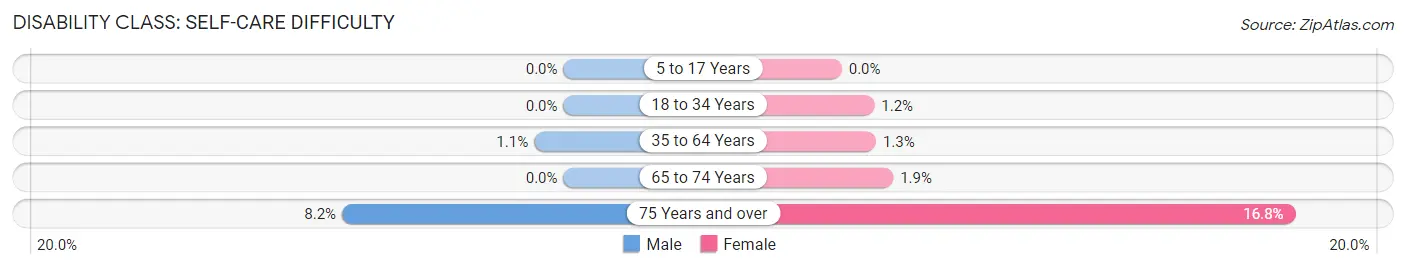
| Age Bracket | Male | Female |
| 5 to 17 Years | 0 (0.0%) | 0 (0.0%) |
| 18 to 34 Years | 0 (0.0%) | 17 (1.2%) |
| 35 to 64 Years | 29 (1.1%) | 34 (1.3%) |
| 65 to 74 Years | 0 (0.0%) | 11 (1.9%) |
| 75 Years and over | 29 (8.2%) | 116 (16.8%) |
Technology Access in Windsor Locks
Computing Device Access in Windsor Locks
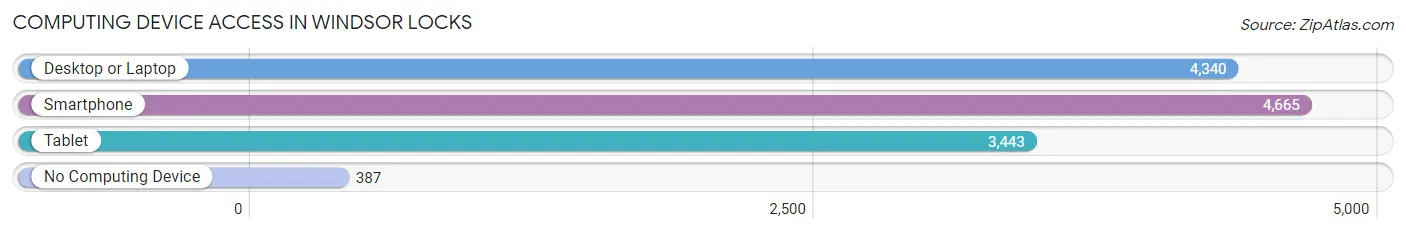
| Device Type | # Households | % Households |
| Desktop or Laptop | 4,340 | 80.1% |
| Smartphone | 4,665 | 86.1% |
| Tablet | 3,443 | 63.6% |
| No Computing Device | 387 | 7.1% |
| Total | 5,417 | 100.0% |
Internet Access in Windsor Locks
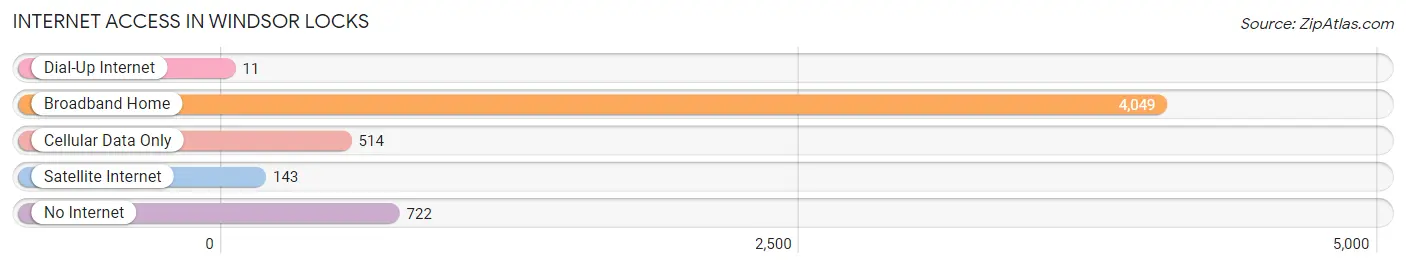
| Internet Type | # Households | % Households |
| Dial-Up Internet | 11 | 0.2% |
| Broadband Home | 4,049 | 74.8% |
| Cellular Data Only | 514 | 9.5% |
| Satellite Internet | 143 | 2.6% |
| No Internet | 722 | 13.3% |
| Total | 5,417 | 100.0% |
Windsor Locks Summary
Windsor Locks is a town located in Hartford County, Connecticut, United States. It is situated on the Connecticut River, near the Massachusetts border. The population was 12,498 at the 2010 census.
History
The area that is now Windsor Locks was originally inhabited by the Podunk Native American tribe. The first European settlers arrived in the area in 1663, and the town was officially incorporated in 1854. The town was named after a set of locks on the Connecticut River, which were built in 1829 to facilitate navigation.
The town was an important transportation hub in the 19th century, with the Connecticut River providing access to the Atlantic Ocean. The town was also home to the first airmail service in the United States, which began in 1918.
Geography
Windsor Locks is located in central Connecticut, about 10 miles north of Hartford. It is bordered by the towns of East Granby, Suffield, East Windsor, and Enfield. The Connecticut River forms the western border of the town.
The town has a total area of 8.7 square miles, of which 8.3 square miles is land and 0.4 square miles is water. The terrain is mostly flat, with some hills in the northern part of town.
Economy
Windsor Locks is home to several major employers, including Pratt & Whitney, a manufacturer of aircraft engines; Hamilton Sundstrand, a manufacturer of aerospace components; and the Bradley International Airport. The town is also home to several smaller businesses, including a number of restaurants and retail stores.
Demographics
As of the 2010 census, there were 12,498 people, 4,845 households, and 3,092 families residing in the town. The population density was 1,502.3 people per square mile. The racial makeup of the town was 87.2% White, 4.3% African American, 0.3% Native American, 4.2% Asian, 0.1% Pacific Islander, 1.7% from other races, and 2.3% from two or more races. Hispanic or Latino of any race were 5.3% of the population.
The median income for a household in the town was $60,945, and the median income for a family was $71,945. The per capita income for the town was $27,945. About 4.2% of families and 5.7% of the population were below the poverty line, including 6.7% of those under age 18 and 5.2% of those age 65 or over.
Common Questions
What is Per Capita Income in Windsor Locks?
Per Capita income in Windsor Locks is $44,568.
What is the Median Family Income in Windsor Locks?
Median Family Income in Windsor Locks is $105,544.
What is the Median Household income in Windsor Locks?
Median Household Income in Windsor Locks is $85,570.
What is Income or Wage Gap in Windsor Locks?
Income or Wage Gap in Windsor Locks is 16.0%.
Women in Windsor Locks earn 84.0 cents for every dollar earned by a man.
What is Inequality or Gini Index in Windsor Locks?
Inequality or Gini Index in Windsor Locks is 0.40.
What is the Total Population of Windsor Locks?
Total Population of Windsor Locks is 12,563.
What is the Total Male Population of Windsor Locks?
Total Male Population of Windsor Locks is 5,852.
What is the Total Female Population of Windsor Locks?
Total Female Population of Windsor Locks is 6,711.
What is the Ratio of Males per 100 Females in Windsor Locks?
There are 87.20 Males per 100 Females in Windsor Locks.
What is the Ratio of Females per 100 Males in Windsor Locks?
There are 114.68 Females per 100 Males in Windsor Locks.
What is the Median Population Age in Windsor Locks?
Median Population Age in Windsor Locks is 42.0 Years.
What is the Average Family Size in Windsor Locks
Average Family Size in Windsor Locks is 2.9 People.
What is the Average Household Size in Windsor Locks
Average Household Size in Windsor Locks is 2.3 People.
How Large is the Labor Force in Windsor Locks?
There are 7,663 People in the Labor Forcein in Windsor Locks.
What is the Percentage of People in the Labor Force in Windsor Locks?
72.9% of People are in the Labor Force in Windsor Locks.
What is the Unemployment Rate in Windsor Locks?
Unemployment Rate in Windsor Locks is 7.3%.