Cities with the Highest Inequality / Gini Index in Connecticut
RELATED REPORTS & OPTIONS
Highest Inequality / Gini Index
Connecticut
Compare Cities
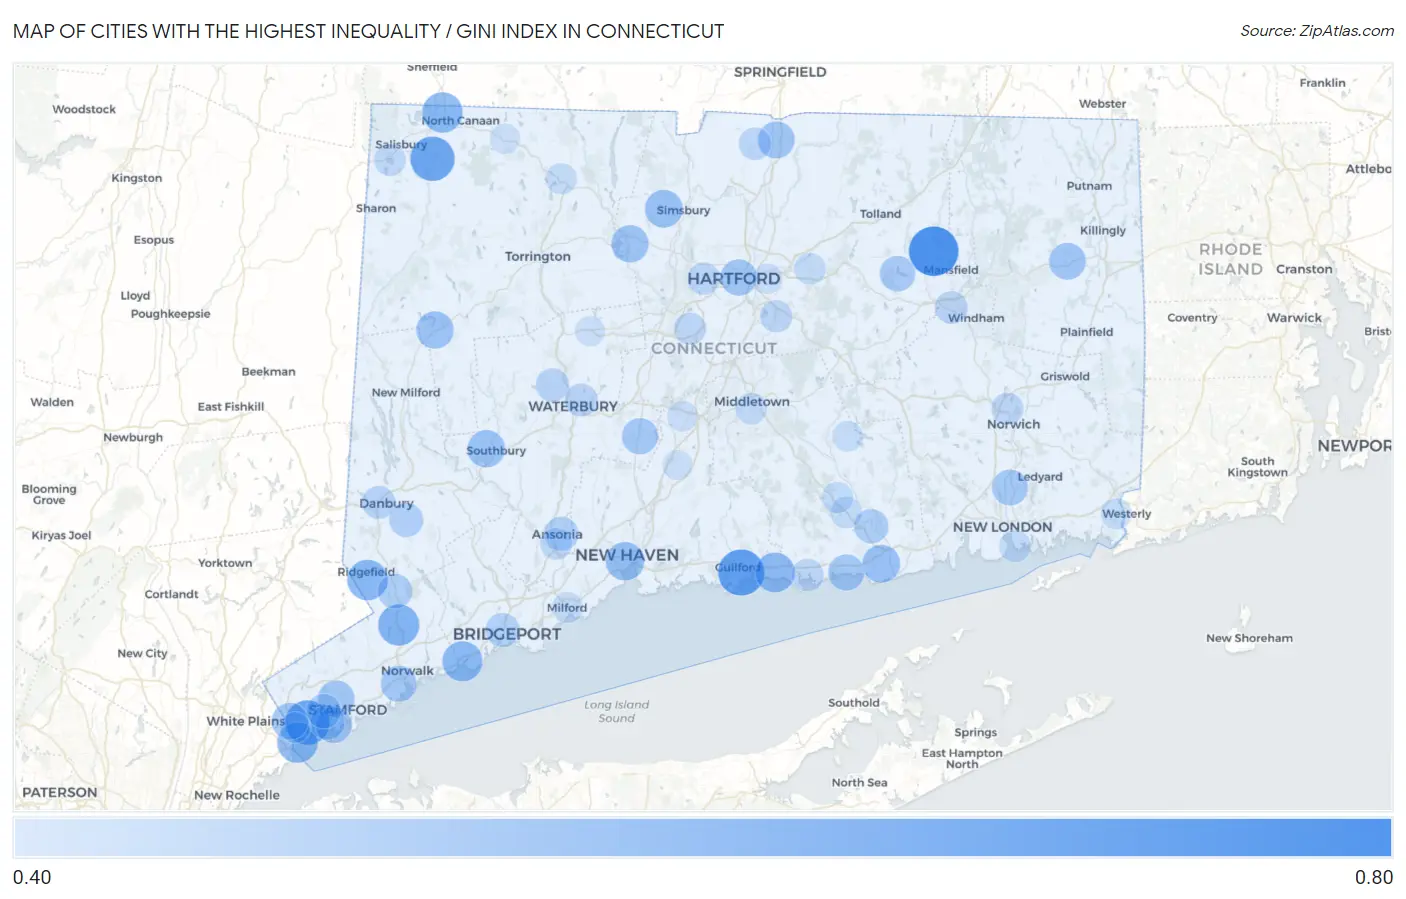
Map of Cities with the Highest Inequality / Gini Index in Connecticut
0.00
0.80
Cities with the Highest Inequality / Gini Index in Connecticut
| City | Inequality / Gini Index | vs State | vs National | |
| 1. | Storrs | 0.66 | 0.50(+0.162)#1 | 0.48(+0.178)#133 |
| 2. | Cornwall Bridge | 0.63 | 0.50(+0.132)#2 | 0.48(+0.148)#217 |
| 3. | Guilford Center | 0.62 | 0.50(+0.123)#3 | 0.48(+0.140)#265 |
| 4. | Cornwall | 0.61 | 0.50(+0.112)#4 | 0.48(+0.129)#327 |
| 5. | Greenwich | 0.60 | 0.50(+0.102)#5 | 0.48(+0.119)#400 |
| 6. | Falls Village | 0.60 | 0.50(+0.101)#6 | 0.48(+0.117)#411 |
| 7. | Groton Long Point Borough | 0.60 | 0.50(+0.099)#7 | 0.48(+0.115)#438 |
| 8. | Stonington Borough | 0.59 | 0.50(+0.088)#8 | 0.48(+0.104)#547 |
| 9. | Fenwick Borough | 0.58 | 0.50(+0.076)#9 | 0.48(+0.093)#680 |
| 10. | Wilton Center | 0.56 | 0.50(+0.065)#10 | 0.48(+0.081)#857 |
| 11. | Ridgefield | 0.56 | 0.50(+0.056)#11 | 0.48(+0.072)#1,019 |
| 12. | Byram | 0.55 | 0.50(+0.056)#12 | 0.48(+0.072)#1,032 |
| 13. | Canaan | 0.55 | 0.50(+0.054)#13 | 0.48(+0.071)#1,063 |
| 14. | Southport | 0.55 | 0.50(+0.052)#14 | 0.48(+0.068)#1,123 |
| 15. | Madison Center | 0.55 | 0.50(+0.047)#15 | 0.48(+0.064)#1,224 |
| 16. | Lakeside Woods | 0.55 | 0.50(+0.046)#16 | 0.48(+0.063)#1,245 |
| 17. | Indian Field | 0.54 | 0.50(+0.044)#17 | 0.48(+0.061)#1,300 |
| 18. | New Canaan | 0.54 | 0.50(+0.044)#18 | 0.48(+0.061)#1,303 |
| 19. | West Cornwall | 0.54 | 0.50(+0.042)#19 | 0.48(+0.058)#1,354 |
| 20. | New Haven | 0.53 | 0.50(+0.033)#20 | 0.48(+0.050)#1,605 |
| 21. | Saugatuck | 0.53 | 0.50(+0.029)#21 | 0.48(+0.045)#1,767 |
| 22. | Knollcrest | 0.53 | 0.50(+0.027)#22 | 0.48(+0.044)#1,831 |
| 23. | Staples | 0.53 | 0.50(+0.027)#23 | 0.48(+0.043)#1,857 |
| 24. | Old Saybrook Center | 0.52 | 0.50(+0.025)#24 | 0.48(+0.041)#1,926 |
| 25. | West Simsbury | 0.52 | 0.50(+0.025)#25 | 0.48(+0.041)#1,929 |
| 26. | Heritage Village | 0.52 | 0.50(+0.021)#26 | 0.48(+0.037)#2,078 |
| 27. | New Preston | 0.52 | 0.50(+0.021)#27 | 0.48(+0.037)#2,111 |
| 28. | Collinsville | 0.52 | 0.50(+0.019)#28 | 0.48(+0.035)#2,176 |
| 29. | Rock Ridge | 0.51 | 0.50(+0.015)#29 | 0.48(+0.032)#2,336 |
| 30. | Darien Downtown | 0.51 | 0.50(+0.015)#30 | 0.48(+0.031)#2,351 |
| 31. | Thompsonville | 0.51 | 0.50(+0.014)#31 | 0.48(+0.030)#2,401 |
| 32. | South Wilton | 0.51 | 0.50(+0.014)#32 | 0.48(+0.030)#2,416 |
| 33. | Brooklyn | 0.51 | 0.50(+0.014)#33 | 0.48(+0.030)#2,418 |
| 34. | Glenville | 0.51 | 0.50(+0.013)#34 | 0.48(+0.030)#2,420 |
| 35. | Stamford | 0.51 | 0.50(+0.011)#35 | 0.48(+0.027)#2,562 |
| 36. | Compo | 0.51 | 0.50(+0.010)#36 | 0.48(+0.026)#2,596 |
| 37. | Hartford | 0.51 | 0.50(+0.010)#37 | 0.48(+0.026)#2,615 |
| 38. | Mamanasco Lake | 0.51 | 0.50(+0.009)#38 | 0.48(+0.026)#2,630 |
| 39. | Cheshire Village | 0.51 | 0.50(+0.007)#39 | 0.48(+0.023)#2,770 |
| 40. | Poplar Plains | 0.51 | 0.50(+0.006)#40 | 0.48(+0.023)#2,783 |
| 41. | Westbrook Center | 0.51 | 0.50(+0.006)#41 | 0.48(+0.022)#2,812 |
| 42. | Candlewood Orchards | 0.51 | 0.50(+0.006)#42 | 0.48(+0.022)#2,815 |
| 43. | Norwalk | 0.50 | 0.50(+0.005)#43 | 0.48(+0.021)#2,888 |
| 44. | Old Greenwich | 0.50 | 0.50(+0.004)#44 | 0.48(+0.020)#2,944 |
| 45. | Gales Ferry | 0.50 | 0.50(+0.003)#45 | 0.48(+0.019)#2,975 |
| 46. | Bantam Borough | 0.50 | 0.50(+0.001)#46 | 0.48(+0.018)#3,067 |
| 47. | Coventry Lake | 0.50 | 0.50(-0.000)#47 | 0.48(+0.016)#3,159 |
| 48. | Coleytown | 0.50 | 0.50(-0.000)#48 | 0.48(+0.016)#3,164 |
| 49. | Noroton | 0.49 | 0.50(-0.009)#49 | 0.48(+0.007)#3,726 |
| 50. | Riverside | 0.49 | 0.50(-0.010)#50 | 0.48(+0.006)#3,794 |
| 51. | Georgetown | 0.49 | 0.50(-0.011)#51 | 0.48(+0.006)#3,844 |
| 52. | Essex Village | 0.49 | 0.50(-0.012)#52 | 0.48(+0.004)#3,986 |
| 53. | Cos Cob | 0.49 | 0.50(-0.013)#53 | 0.48(+0.003)#4,058 |
| 54. | Ansonia | 0.48 | 0.50(-0.015)#54 | 0.48(+0.001)#4,220 |
| 55. | Bethel | 0.48 | 0.50(-0.016)#55 | 0.48(=0.000)#4,320 |
| 56. | Litchfield Borough | 0.48 | 0.50(-0.017)#56 | 0.48(-0.001)#4,440 |
| 57. | Bridgeport | 0.48 | 0.50(-0.018)#57 | 0.48(-0.002)#4,507 |
| 58. | Westport | 0.48 | 0.50(-0.019)#58 | 0.48(-0.003)#4,579 |
| 59. | Oronoque | 0.48 | 0.50(-0.020)#59 | 0.48(-0.004)#4,655 |
| 60. | Greens Farms | 0.48 | 0.50(-0.022)#60 | 0.48(-0.006)#4,794 |
| 61. | Oakville | 0.47 | 0.50(-0.027)#61 | 0.48(-0.010)#5,260 |
| 62. | Danbury | 0.47 | 0.50(-0.028)#62 | 0.48(-0.011)#5,350 |
| 63. | Waterbury | 0.47 | 0.50(-0.030)#63 | 0.48(-0.014)#5,634 |
| 64. | Willimantic | 0.47 | 0.50(-0.032)#64 | 0.48(-0.016)#5,854 |
| 65. | Woodmont Borough | 0.46 | 0.50(-0.035)#65 | 0.48(-0.019)#6,116 |
| 66. | Suffield Depot | 0.46 | 0.50(-0.035)#66 | 0.48(-0.019)#6,185 |
| 67. | West Hartford | 0.46 | 0.50(-0.036)#67 | 0.48(-0.019)#6,207 |
| 68. | Old Hill | 0.46 | 0.50(-0.036)#68 | 0.48(-0.020)#6,245 |
| 69. | Clinton | 0.46 | 0.50(-0.036)#69 | 0.48(-0.020)#6,261 |
| 70. | Noroton Heights | 0.46 | 0.50(-0.037)#70 | 0.48(-0.021)#6,344 |
| 71. | Glastonbury Center | 0.46 | 0.50(-0.037)#71 | 0.48(-0.021)#6,356 |
| 72. | New Britain | 0.46 | 0.50(-0.039)#72 | 0.48(-0.023)#6,638 |
| 73. | Norwich | 0.46 | 0.50(-0.040)#73 | 0.48(-0.023)#6,656 |
| 74. | Lakeville | 0.46 | 0.50(-0.041)#74 | 0.48(-0.025)#6,838 |
| 75. | Lordship | 0.46 | 0.50(-0.042)#75 | 0.48(-0.025)#6,920 |
| 76. | Derby | 0.46 | 0.50(-0.043)#76 | 0.48(-0.027)#7,092 |
| 77. | Groton | 0.46 | 0.50(-0.044)#77 | 0.48(-0.028)#7,201 |
| 78. | Middletown | 0.45 | 0.50(-0.045)#78 | 0.48(-0.028)#7,293 |
| 79. | Manchester | 0.45 | 0.50(-0.045)#79 | 0.48(-0.029)#7,335 |
| 80. | Deep River Center | 0.45 | 0.50(-0.045)#80 | 0.48(-0.029)#7,355 |
| 81. | Tokeneke | 0.45 | 0.50(-0.047)#81 | 0.48(-0.031)#7,630 |
| 82. | Chester Center | 0.45 | 0.50(-0.048)#82 | 0.48(-0.031)#7,658 |
| 83. | Winsted | 0.45 | 0.50(-0.049)#83 | 0.48(-0.033)#7,852 |
| 84. | Milford City Balance | 0.45 | 0.50(-0.049)#84 | 0.48(-0.033)#7,877 |
| 85. | Pawcatuck | 0.45 | 0.50(-0.050)#85 | 0.48(-0.034)#8,024 |
| 86. | Daniels Farm | 0.45 | 0.50(-0.054)#86 | 0.48(-0.037)#8,458 |
| 87. | West Mountain | 0.45 | 0.50(-0.054)#87 | 0.48(-0.037)#8,465 |
| 88. | Stratford Downtown | 0.45 | 0.50(-0.054)#88 | 0.48(-0.038)#8,531 |
| 89. | Sandy Hook | 0.44 | 0.50(-0.054)#89 | 0.48(-0.038)#8,541 |
| 90. | Moodus | 0.44 | 0.50(-0.054)#90 | 0.48(-0.038)#8,564 |
| 91. | Pemberwick | 0.44 | 0.50(-0.055)#91 | 0.48(-0.038)#8,599 |
| 92. | Meriden | 0.44 | 0.50(-0.055)#92 | 0.48(-0.039)#8,679 |
| 93. | Ridgebury | 0.44 | 0.50(-0.056)#93 | 0.48(-0.039)#8,765 |
| 94. | East Hartford | 0.44 | 0.50(-0.057)#94 | 0.48(-0.041)#8,947 |
| 95. | Weston | 0.44 | 0.50(-0.057)#95 | 0.48(-0.041)#8,999 |
| 96. | Norfolk | 0.44 | 0.50(-0.059)#96 | 0.48(-0.042)#9,207 |
| 97. | Tashua | 0.44 | 0.50(-0.059)#97 | 0.48(-0.043)#9,217 |
| 98. | Terryville | 0.44 | 0.50(-0.059)#98 | 0.48(-0.043)#9,261 |
| 99. | Wallingford Center | 0.44 | 0.50(-0.060)#99 | 0.48(-0.044)#9,370 |
| 100. | Murray | 0.44 | 0.50(-0.061)#100 | 0.48(-0.044)#9,439 |
Common Questions
What are the Top 10 Cities with the Highest Inequality / Gini Index in Connecticut?
Top 10 Cities with the Highest Inequality / Gini Index in Connecticut are:
#1
0.66
#2
0.62
#3
0.60
#4
0.60
#5
0.56
#6
0.56
#7
0.55
#8
0.55
#9
0.55
#10
0.55
What city has the Highest Inequality / Gini Index in Connecticut?
Storrs has the Highest Inequality / Gini Index in Connecticut with 0.66.
What is the Inequality / Gini Index in the State of Connecticut?
Inequality / Gini Index in Connecticut is 0.50.
What is the Inequality / Gini Index in the United States?
Inequality / Gini Index in the United States is 0.48.