Higganum, CT Map & Demographics
Higganum Map
Higganum Overview
$66,044
PER CAPITA INCOME
$143,565
AVG FAMILY INCOME
$130,411
AVG HOUSEHOLD INCOME
26.7%
WAGE / INCOME GAP [ % ]
73.3¢/ $1
WAGE / INCOME GAP [ $ ]
0.38
INEQUALITY / GINI INDEX
1,693
TOTAL POPULATION
963
MALE POPULATION
730
FEMALE POPULATION
131.92
MALES / 100 FEMALES
75.80
FEMALES / 100 MALES
43.2
MEDIAN AGE
2.5
AVG FAMILY SIZE
2.2
AVG HOUSEHOLD SIZE
932
LABOR FORCE [ PEOPLE ]
69.0%
PERCENT IN LABOR FORCE
Higganum Zip Codes
Higganum Area Codes
Income in Higganum
Income Overview in Higganum
Per Capita Income in Higganum is $66,044, while median incomes of families and households are $143,565 and $130,411 respectively.
| Characteristic | Number | Measure |
| Per Capita Income | 1,693 | $66,044 |
| Median Family Income | 583 | $143,565 |
| Mean Family Income | 583 | $168,881 |
| Median Household Income | 765 | $130,411 |
| Mean Household Income | 765 | $140,131 |
| Income Deficit | 583 | $0 |
| Wage / Income Gap (%) | 1,693 | 26.73% |
| Wage / Income Gap ($) | 1,693 | 73.27¢ per $1 |
| Gini / Inequality Index | 1,693 | 0.38 |
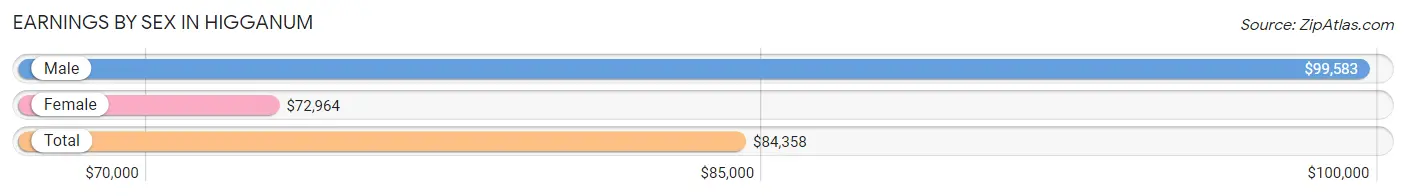
Earnings by Sex in Higganum
Average Earnings in Higganum are $84,358, $99,583 for men and $72,964 for women, a difference of 26.7%.
| Sex | Number | Average Earnings |
| Male | 586 (58.2%) | $99,583 |
| Female | 421 (41.8%) | $72,964 |
| Total | 1,007 (100.0%) | $84,358 |
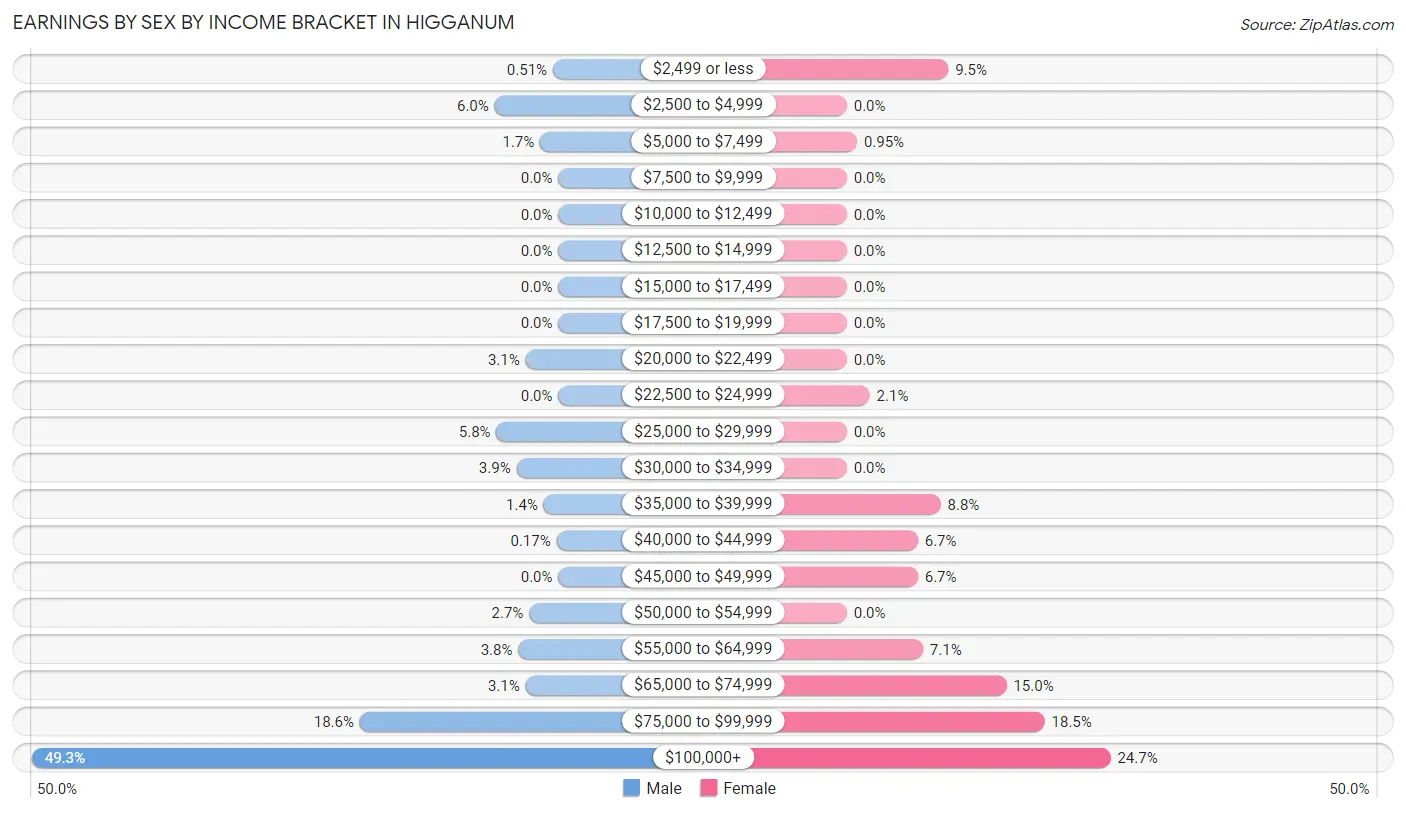
Earnings by Sex by Income Bracket in Higganum
The most common earnings brackets in Higganum are $100,000+ for men (289 | 49.3%) and $100,000+ for women (104 | 24.7%).
| Income | Male | Female |
| $2,499 or less | 3 (0.5%) | 40 (9.5%) |
| $2,500 to $4,999 | 35 (6.0%) | 0 (0.0%) |
| $5,000 to $7,499 | 10 (1.7%) | 4 (0.9%) |
| $7,500 to $9,999 | 0 (0.0%) | 0 (0.0%) |
| $10,000 to $12,499 | 0 (0.0%) | 0 (0.0%) |
| $12,500 to $14,999 | 0 (0.0%) | 0 (0.0%) |
| $15,000 to $17,499 | 0 (0.0%) | 0 (0.0%) |
| $17,500 to $19,999 | 0 (0.0%) | 0 (0.0%) |
| $20,000 to $22,499 | 18 (3.1%) | 0 (0.0%) |
| $22,500 to $24,999 | 0 (0.0%) | 9 (2.1%) |
| $25,000 to $29,999 | 34 (5.8%) | 0 (0.0%) |
| $30,000 to $34,999 | 23 (3.9%) | 0 (0.0%) |
| $35,000 to $39,999 | 8 (1.4%) | 37 (8.8%) |
| $40,000 to $44,999 | 1 (0.2%) | 28 (6.7%) |
| $45,000 to $49,999 | 0 (0.0%) | 28 (6.7%) |
| $50,000 to $54,999 | 16 (2.7%) | 0 (0.0%) |
| $55,000 to $64,999 | 22 (3.7%) | 30 (7.1%) |
| $65,000 to $74,999 | 18 (3.1%) | 63 (15.0%) |
| $75,000 to $99,999 | 109 (18.6%) | 78 (18.5%) |
| $100,000+ | 289 (49.3%) | 104 (24.7%) |
| Total | 586 (100.0%) | 421 (100.0%) |
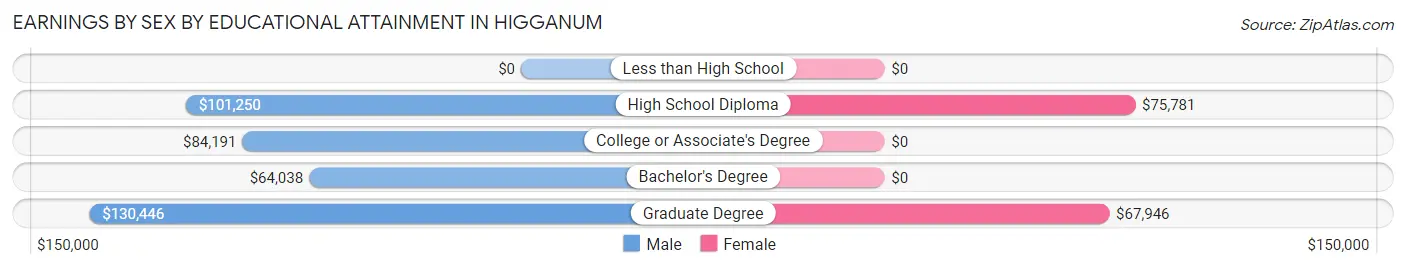
Earnings by Sex by Educational Attainment in Higganum
Average earnings in Higganum are $99,583 for men and $73,643 for women, a difference of 26.1%. Men with an educational attainment of graduate degree enjoy the highest average annual earnings of $130,446, while those with bachelor's degree education earn the least with $64,038. Women with an educational attainment of high school diploma earn the most with the average annual earnings of $75,781, while those with graduate degree education have the smallest earnings of $67,946.
| Educational Attainment | Male Income | Female Income |
| Less than High School | - | - |
| High School Diploma | $101,250 | $75,781 |
| College or Associate's Degree | $84,191 | $0 |
| Bachelor's Degree | $64,038 | $0 |
| Graduate Degree | $130,446 | $67,946 |
| Total | $99,583 | $73,643 |
Family Income in Higganum
Family Income Brackets in Higganum
According to the Higganum family income data, there are 181 families falling into the $100,000 to $149,999 income range, which is the most common income bracket and makes up 31.0% of all families.
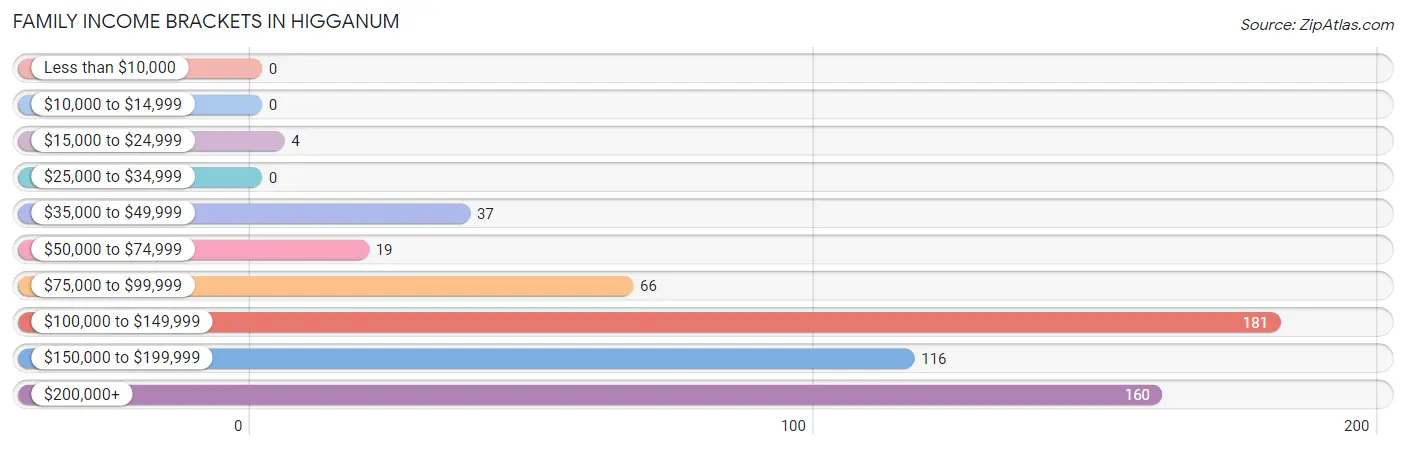
| Income Bracket | # Families | % Families |
| Less than $10,000 | 0 | 0.0% |
| $10,000 to $14,999 | 0 | 0.0% |
| $15,000 to $24,999 | 4 | 0.7% |
| $25,000 to $34,999 | 0 | 0.0% |
| $35,000 to $49,999 | 37 | 6.3% |
| $50,000 to $74,999 | 19 | 3.3% |
| $75,000 to $99,999 | 66 | 11.3% |
| $100,000 to $149,999 | 181 | 31.0% |
| $150,000 to $199,999 | 116 | 19.9% |
| $200,000+ | 160 | 27.4% |
Family Income by Famaliy Size in Higganum
4-person families (45 | 7.7%) account for the highest median family income in Higganum with $250,001 per family, while 2-person families (359 | 61.6%) have the highest median income of $79,125 per family member.
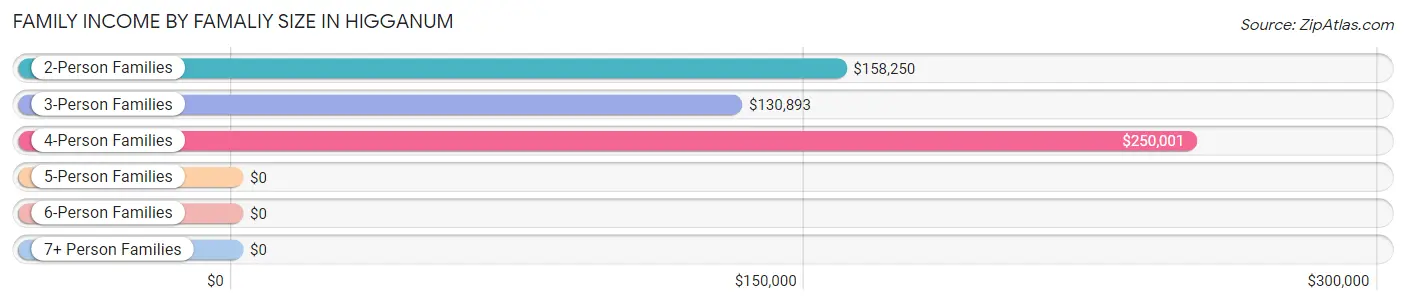
| Income Bracket | # Families | Median Income |
| 2-Person Families | 359 (61.6%) | $158,250 |
| 3-Person Families | 164 (28.1%) | $130,893 |
| 4-Person Families | 45 (7.7%) | $250,001 |
| 5-Person Families | 15 (2.6%) | $0 |
| 6-Person Families | 0 (0.0%) | $0 |
| 7+ Person Families | 0 (0.0%) | $0 |
| Total | 583 (100.0%) | $143,565 |
Family Income by Number of Earners in Higganum
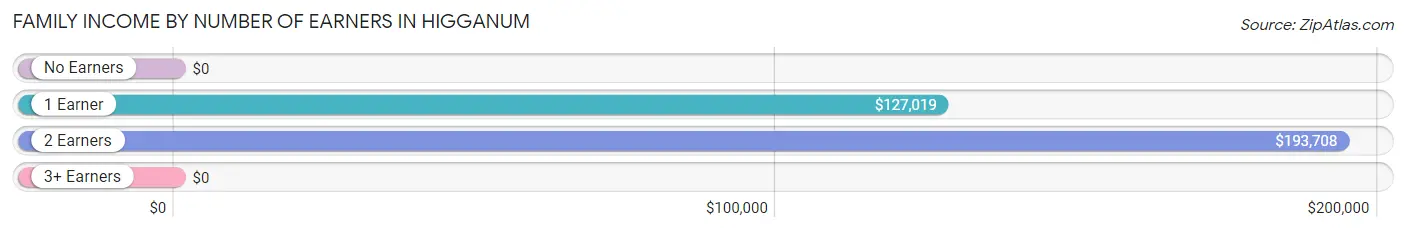
| Number of Earners | # Families | Median Income |
| No Earners | 48 (8.2%) | $0 |
| 1 Earner | 244 (41.8%) | $127,019 |
| 2 Earners | 271 (46.5%) | $193,708 |
| 3+ Earners | 20 (3.4%) | $0 |
| Total | 583 (100.0%) | $143,565 |
Household Income in Higganum
Household Income Brackets in Higganum
With 207 households falling in the category, the $100,000 to $149,999 income range is the most frequent in Higganum, accounting for 27.1% of all households. In contrast, only 13 households (1.7%) fall into the less than $10,000 income bracket, making it the least populous group.
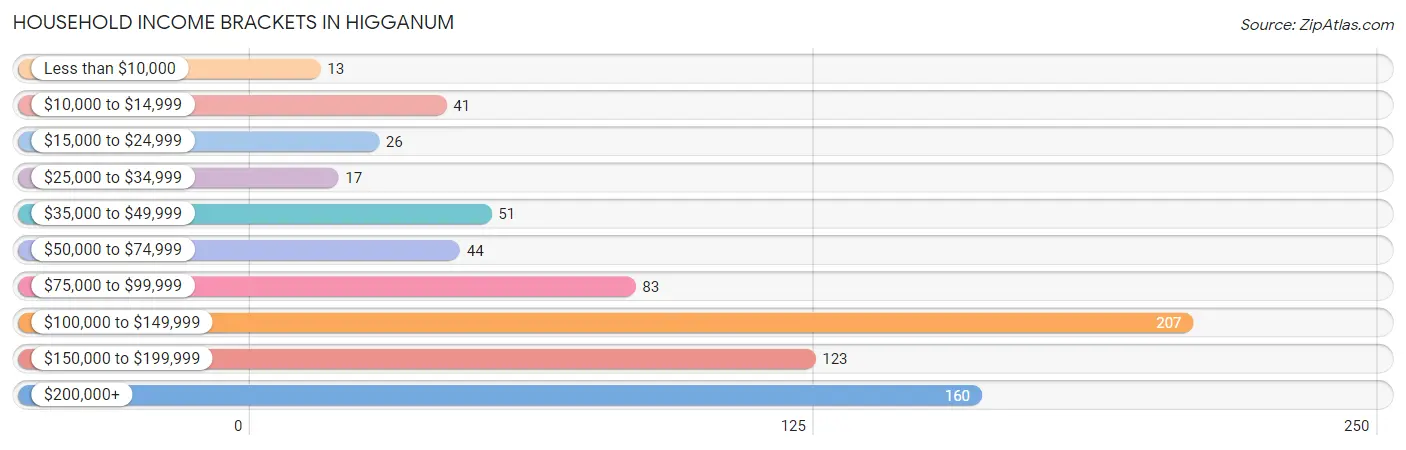
| Income Bracket | # Households | % Households |
| Less than $10,000 | 13 | 1.7% |
| $10,000 to $14,999 | 41 | 5.4% |
| $15,000 to $24,999 | 26 | 3.4% |
| $25,000 to $34,999 | 17 | 2.2% |
| $35,000 to $49,999 | 51 | 6.7% |
| $50,000 to $74,999 | 44 | 5.8% |
| $75,000 to $99,999 | 83 | 10.8% |
| $100,000 to $149,999 | 207 | 27.1% |
| $150,000 to $199,999 | 123 | 16.1% |
| $200,000+ | 160 | 20.9% |
Household Income by Householder Age in Higganum
The median household income in Higganum is $130,411, with the highest median household income of $174,435 found in the 45 to 64 years age bracket for the primary householder. A total of 236 households (30.8%) fall into this category.
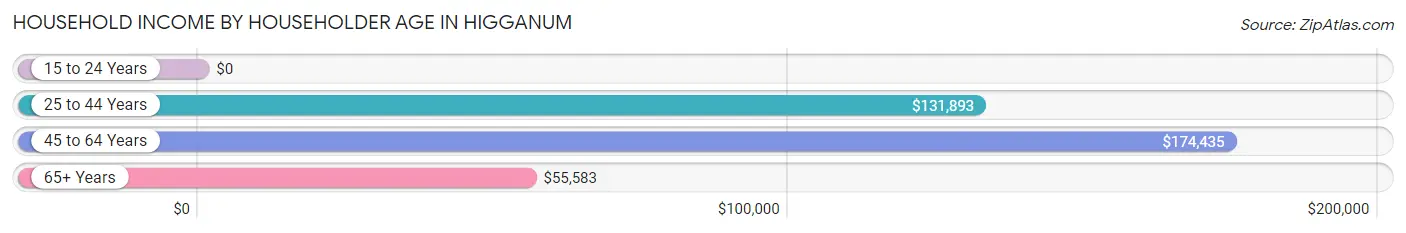
| Income Bracket | # Households | Median Income |
| 15 to 24 Years | 0 (0.0%) | $0 |
| 25 to 44 Years | 310 (40.5%) | $131,893 |
| 45 to 64 Years | 236 (30.8%) | $174,435 |
| 65+ Years | 219 (28.6%) | $55,583 |
| Total | 765 (100.0%) | $130,411 |
Poverty in Higganum
Income Below Poverty by Sex and Age in Higganum
With 4.0% poverty level for males and 5.8% for females among the residents of Higganum, 65 to 74 year old males and 65 to 74 year old females are the most vulnerable to poverty, with 35 males (22.2%) and 34 females (24.1%) in their respective age groups living below the poverty level.
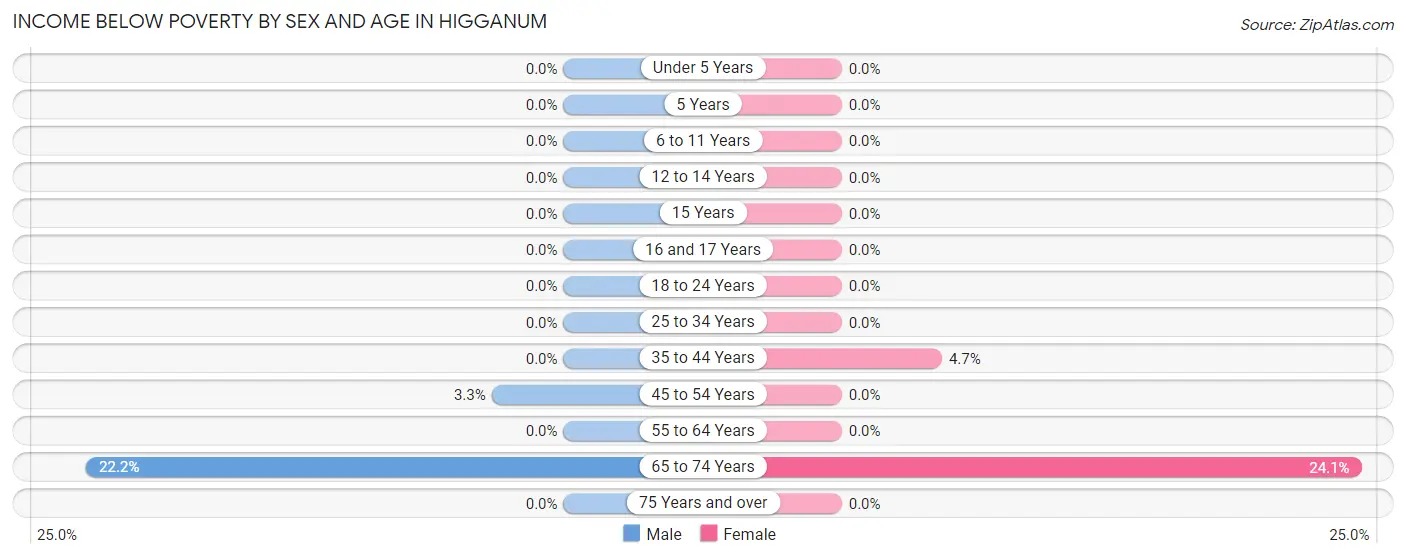
| Age Bracket | Male | Female |
| Under 5 Years | 0 (0.0%) | 0 (0.0%) |
| 5 Years | 0 (0.0%) | 0 (0.0%) |
| 6 to 11 Years | 0 (0.0%) | 0 (0.0%) |
| 12 to 14 Years | 0 (0.0%) | 0 (0.0%) |
| 15 Years | 0 (0.0%) | 0 (0.0%) |
| 16 and 17 Years | 0 (0.0%) | 0 (0.0%) |
| 18 to 24 Years | 0 (0.0%) | 0 (0.0%) |
| 25 to 34 Years | 0 (0.0%) | 0 (0.0%) |
| 35 to 44 Years | 0 (0.0%) | 8 (4.6%) |
| 45 to 54 Years | 3 (3.3%) | 0 (0.0%) |
| 55 to 64 Years | 0 (0.0%) | 0 (0.0%) |
| 65 to 74 Years | 35 (22.2%) | 34 (24.1%) |
| 75 Years and over | 0 (0.0%) | 0 (0.0%) |
| Total | 38 (4.0%) | 42 (5.8%) |
Income Above Poverty by Sex and Age in Higganum
According to the poverty statistics in Higganum, males aged 6 to 11 years and females aged under 5 years are the age groups that are most secure financially, with 100.0% of males and 100.0% of females in these age groups living above the poverty line.
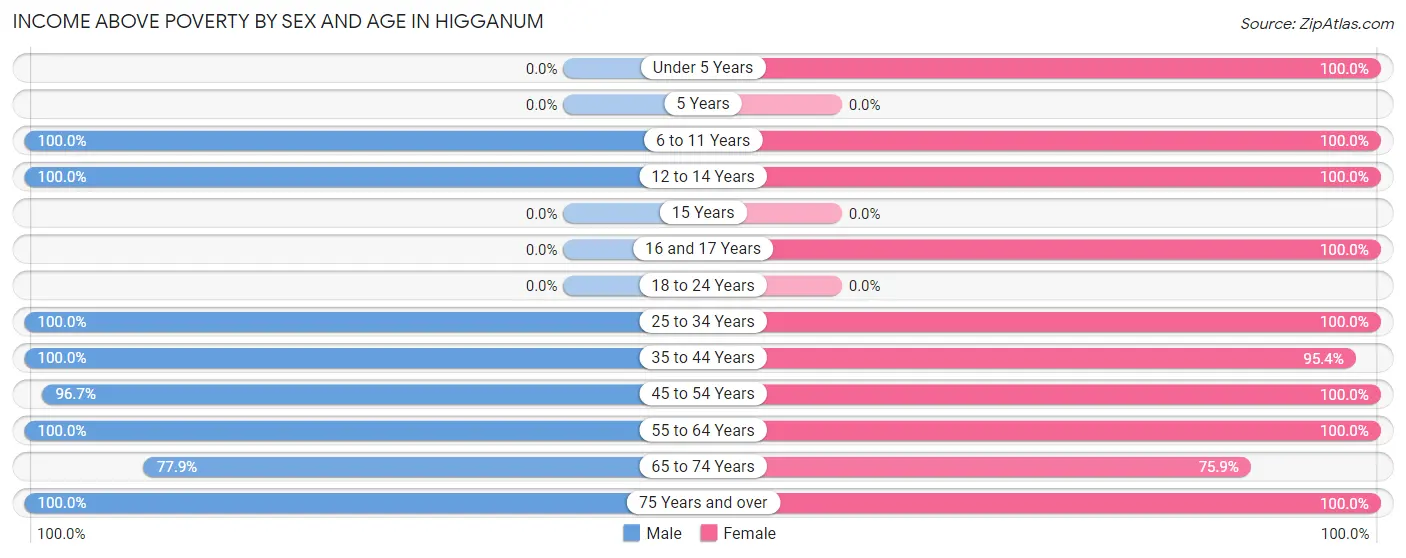
| Age Bracket | Male | Female |
| Under 5 Years | 0 (0.0%) | 27 (100.0%) |
| 5 Years | 0 (0.0%) | 0 (0.0%) |
| 6 to 11 Years | 194 (100.0%) | 63 (100.0%) |
| 12 to 14 Years | 26 (100.0%) | 32 (100.0%) |
| 15 Years | 0 (0.0%) | 0 (0.0%) |
| 16 and 17 Years | 0 (0.0%) | 19 (100.0%) |
| 18 to 24 Years | 0 (0.0%) | 0 (0.0%) |
| 25 to 34 Years | 119 (100.0%) | 56 (100.0%) |
| 35 to 44 Years | 179 (100.0%) | 164 (95.4%) |
| 45 to 54 Years | 87 (96.7%) | 102 (100.0%) |
| 55 to 64 Years | 149 (100.0%) | 86 (100.0%) |
| 65 to 74 Years | 123 (77.8%) | 107 (75.9%) |
| 75 Years and over | 48 (100.0%) | 32 (100.0%) |
| Total | 925 (96.1%) | 688 (94.3%) |
Income Below Poverty Among Married-Couple Families in Higganum
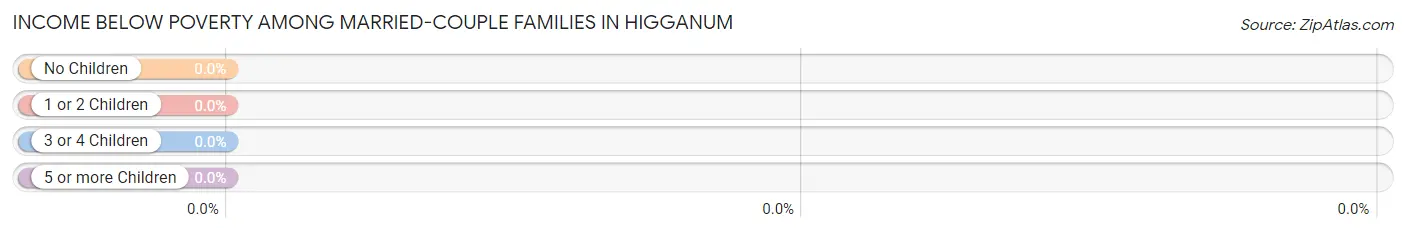
| Children | Above Poverty | Below Poverty |
| No Children | 379 (100.0%) | 0 (0.0%) |
| 1 or 2 Children | 50 (100.0%) | 0 (0.0%) |
| 3 or 4 Children | 15 (100.0%) | 0 (0.0%) |
| 5 or more Children | 0 (0.0%) | 0 (0.0%) |
| Total | 444 (100.0%) | 0 (0.0%) |
Income Below Poverty Among Single-Parent Households in Higganum
| Children | Single Father | Single Mother |
| No Children | 0 (0.0%) | 0 (0.0%) |
| 1 or 2 Children | 0 (0.0%) | 0 (0.0%) |
| 3 or 4 Children | 0 (0.0%) | 0 (0.0%) |
| 5 or more Children | 0 (0.0%) | 0 (0.0%) |
| Total | 0 (0.0%) | 0 (0.0%) |
Income Below Poverty Among Married-Couple vs Single-Parent Households in Higganum
| Children | Married-Couple Families | Single-Parent Households |
| No Children | 0 (0.0%) | 0 (0.0%) |
| 1 or 2 Children | 0 (0.0%) | 0 (0.0%) |
| 3 or 4 Children | 0 (0.0%) | 0 (0.0%) |
| 5 or more Children | 0 (0.0%) | 0 (0.0%) |
| Total | 0 (0.0%) | 0 (0.0%) |
Race in Higganum
The most populous races in Higganum are White / Caucasian (1,581 | 93.4%), Hispanic or Latino (146 | 8.6%), and Asian (95 | 5.6%).
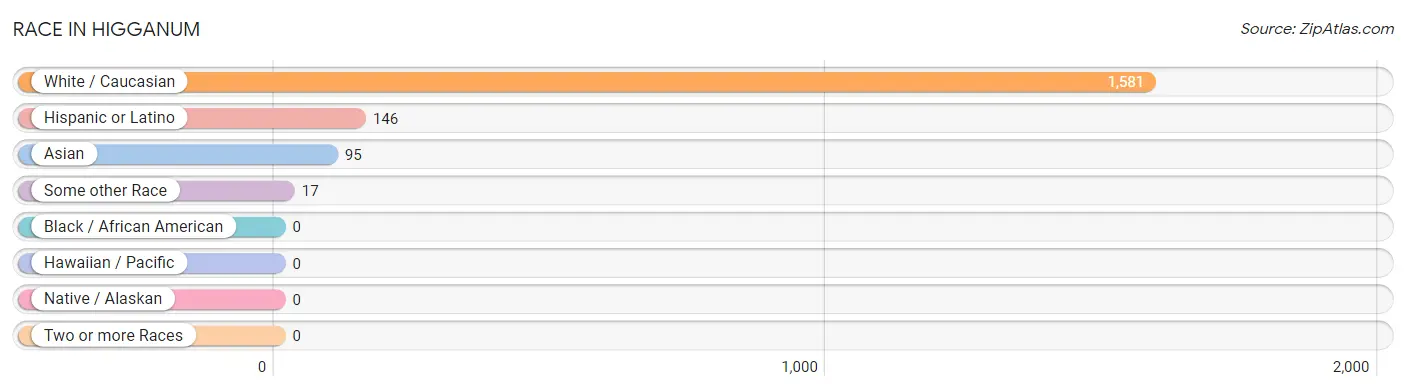
| Race | # Population | % Population |
| Asian | 95 | 5.6% |
| Black / African American | 0 | 0.0% |
| Hawaiian / Pacific | 0 | 0.0% |
| Hispanic or Latino | 146 | 8.6% |
| Native / Alaskan | 0 | 0.0% |
| White / Caucasian | 1,581 | 93.4% |
| Two or more Races | 0 | 0.0% |
| Some other Race | 17 | 1.0% |
| Total | 1,693 | 100.0% |
Ancestry in Higganum
The most populous ancestries reported in Higganum are Italian (472 | 27.9%), Irish (349 | 20.6%), Polish (311 | 18.4%), English (282 | 16.7%), and German (192 | 11.3%), together accounting for 94.9% of all Higganum residents.
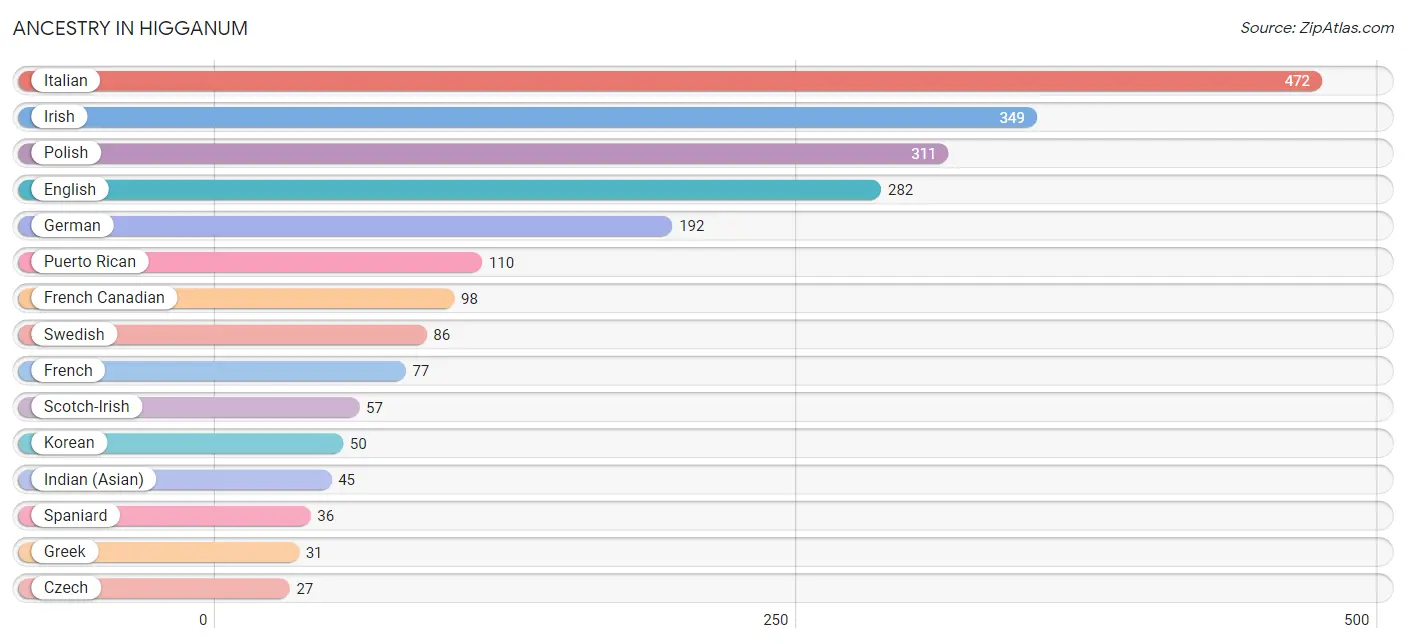
| Ancestry | # Population | % Population |
| American | 7 | 0.4% |
| British | 13 | 0.8% |
| Czech | 27 | 1.6% |
| Dutch | 8 | 0.5% |
| English | 282 | 16.7% |
| European | 15 | 0.9% |
| Finnish | 7 | 0.4% |
| French | 77 | 4.5% |
| French Canadian | 98 | 5.8% |
| German | 192 | 11.3% |
| Greek | 31 | 1.8% |
| Hungarian | 16 | 0.9% |
| Indian (Asian) | 45 | 2.7% |
| Irish | 349 | 20.6% |
| Italian | 472 | 27.9% |
| Korean | 50 | 2.9% |
| Polish | 311 | 18.4% |
| Portuguese | 7 | 0.4% |
| Puerto Rican | 110 | 6.5% |
| Russian | 25 | 1.5% |
| Scotch-Irish | 57 | 3.4% |
| Slovak | 3 | 0.2% |
| Spaniard | 36 | 2.1% |
| Swedish | 86 | 5.1% |
| Ukrainian | 17 | 1.0% | View All 25 Rows |
Immigrants in Higganum
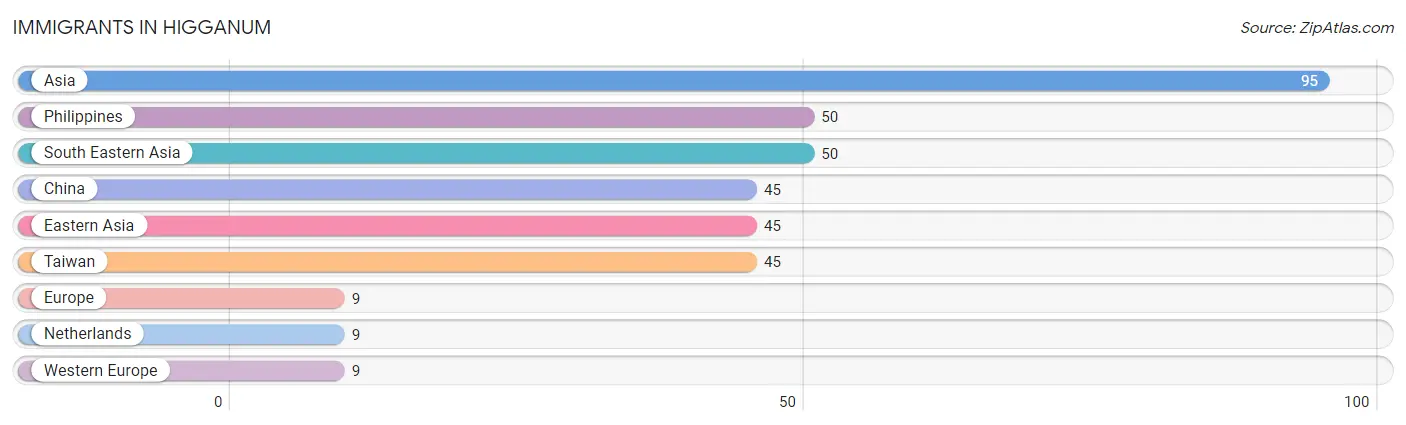
The most numerous immigrant groups reported in Higganum came from Asia (95 | 5.6%), Philippines (50 | 2.9%), South Eastern Asia (50 | 2.9%), China (45 | 2.7%), and Eastern Asia (45 | 2.7%), together accounting for 16.8% of all Higganum residents.
| Immigration Origin | # Population | % Population |
| Asia | 95 | 5.6% |
| China | 45 | 2.7% |
| Eastern Asia | 45 | 2.7% |
| Europe | 9 | 0.5% |
| Netherlands | 9 | 0.5% |
| Philippines | 50 | 2.9% |
| South Eastern Asia | 50 | 2.9% |
| Taiwan | 45 | 2.7% |
| Western Europe | 9 | 0.5% | View All 9 Rows |
Sex and Age in Higganum
Sex and Age in Higganum
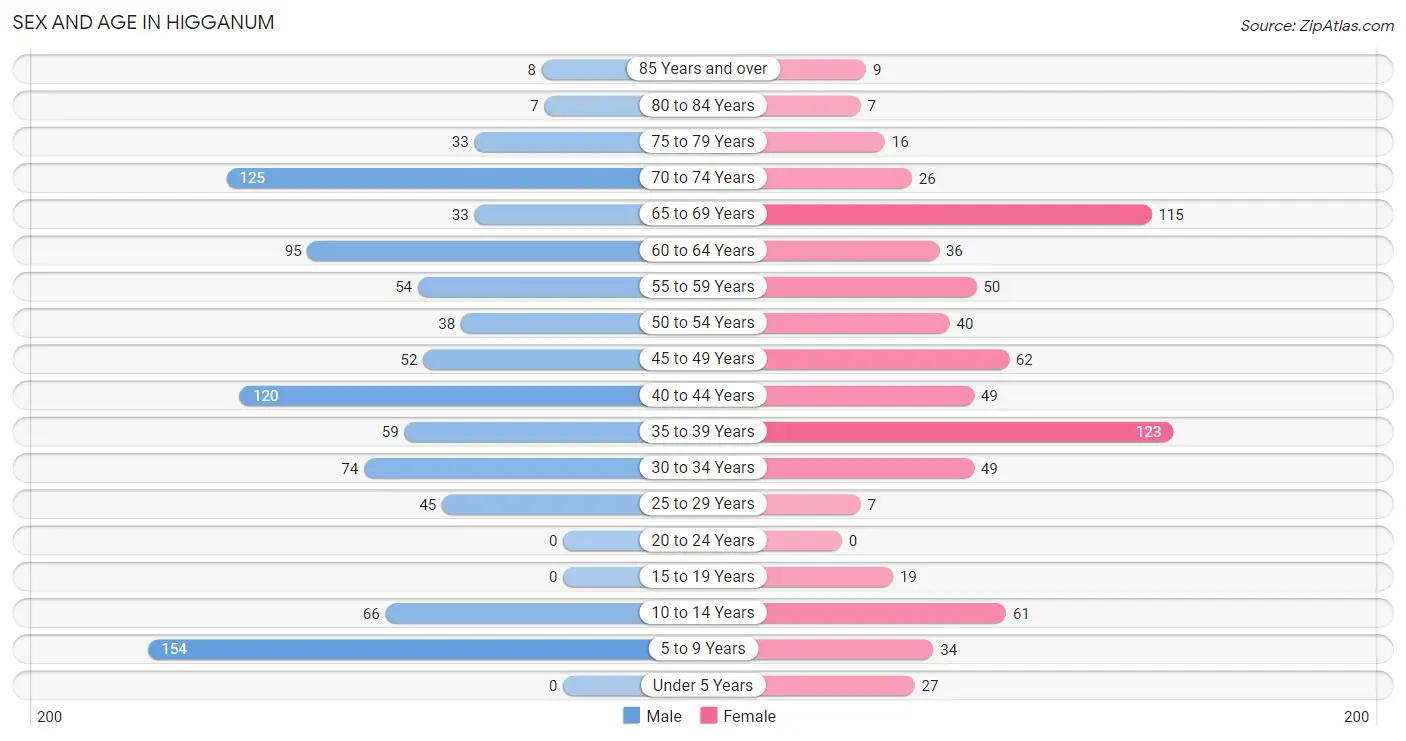
The most populous age groups in Higganum are 5 to 9 Years (154 | 16.0%) for men and 35 to 39 Years (123 | 16.9%) for women.
| Age Bracket | Male | Female |
| Under 5 Years | 0 (0.0%) | 27 (3.7%) |
| 5 to 9 Years | 154 (16.0%) | 34 (4.7%) |
| 10 to 14 Years | 66 (6.9%) | 61 (8.4%) |
| 15 to 19 Years | 0 (0.0%) | 19 (2.6%) |
| 20 to 24 Years | 0 (0.0%) | 0 (0.0%) |
| 25 to 29 Years | 45 (4.7%) | 7 (1.0%) |
| 30 to 34 Years | 74 (7.7%) | 49 (6.7%) |
| 35 to 39 Years | 59 (6.1%) | 123 (16.9%) |
| 40 to 44 Years | 120 (12.5%) | 49 (6.7%) |
| 45 to 49 Years | 52 (5.4%) | 62 (8.5%) |
| 50 to 54 Years | 38 (4.0%) | 40 (5.5%) |
| 55 to 59 Years | 54 (5.6%) | 50 (6.9%) |
| 60 to 64 Years | 95 (9.9%) | 36 (4.9%) |
| 65 to 69 Years | 33 (3.4%) | 115 (15.8%) |
| 70 to 74 Years | 125 (13.0%) | 26 (3.6%) |
| 75 to 79 Years | 33 (3.4%) | 16 (2.2%) |
| 80 to 84 Years | 7 (0.7%) | 7 (1.0%) |
| 85 Years and over | 8 (0.8%) | 9 (1.2%) |
| Total | 963 (100.0%) | 730 (100.0%) |
Families and Households in Higganum
Median Family Size in Higganum
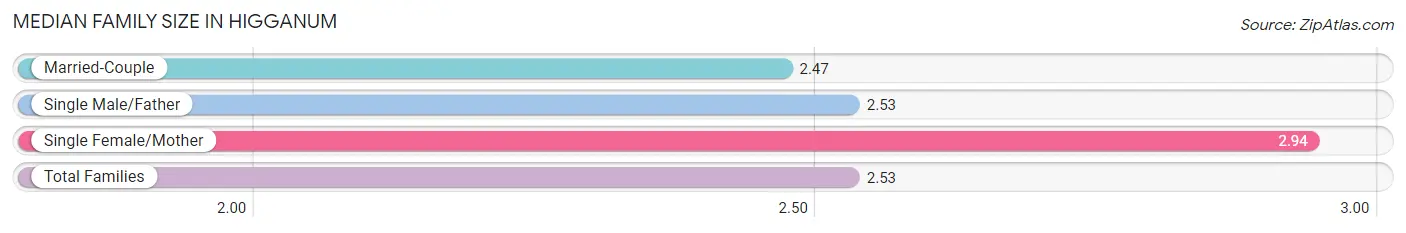
The median family size in Higganum is 2.53 persons per family, with single female/mother families (65 | 11.2%) accounting for the largest median family size of 2.94 persons per family. On the other hand, married-couple families (444 | 76.2%) represent the smallest median family size with 2.47 persons per family.
| Family Type | # Families | Family Size |
| Married-Couple | 444 (76.2%) | 2.47 |
| Single Male/Father | 74 (12.7%) | 2.53 |
| Single Female/Mother | 65 (11.2%) | 2.94 |
| Total Families | 583 (100.0%) | 2.53 |
Median Household Size in Higganum
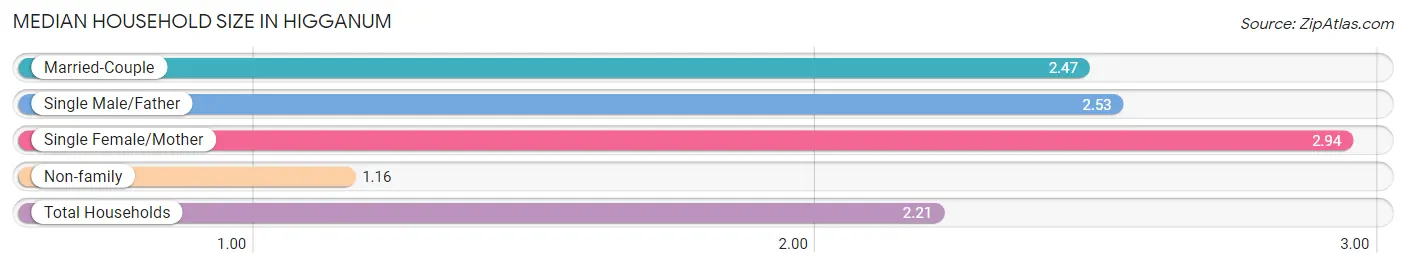
The median household size in Higganum is 2.21 persons per household, with single female/mother households (65 | 8.5%) accounting for the largest median household size of 2.94 persons per household. non-family households (182 | 23.8%) represent the smallest median household size with 1.16 persons per household.
| Household Type | # Households | Household Size |
| Married-Couple | 444 (58.0%) | 2.47 |
| Single Male/Father | 74 (9.7%) | 2.53 |
| Single Female/Mother | 65 (8.5%) | 2.94 |
| Non-family | 182 (23.8%) | 1.16 |
| Total Households | 765 (100.0%) | 2.21 |
Household Size by Marriage Status in Higganum
Out of a total of 765 households in Higganum, 583 (76.2%) are family households, while 182 (23.8%) are nonfamily households. The most numerous type of family households are 2-person households, comprising 359, and the most common type of nonfamily households are 1-person households, comprising 153.
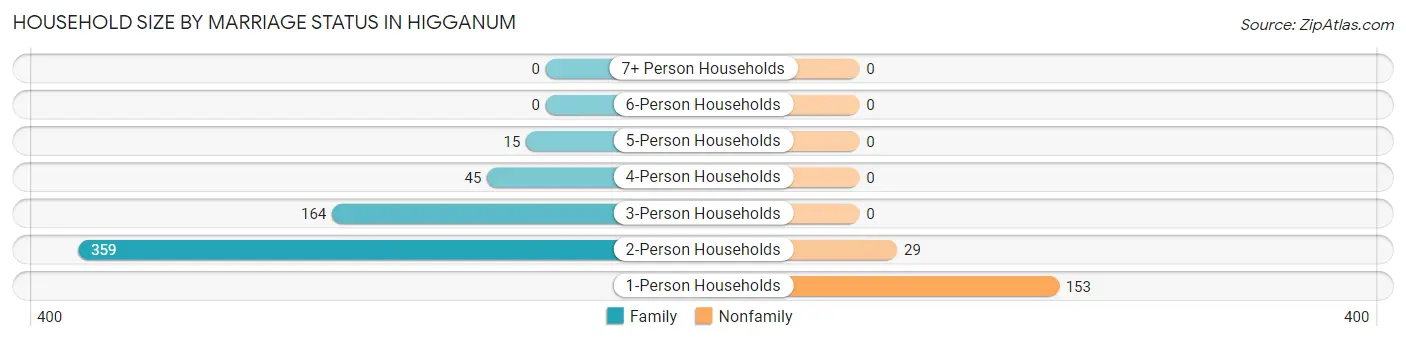
| Household Size | Family Households | Nonfamily Households |
| 1-Person Households | - | 153 (20.0%) |
| 2-Person Households | 359 (46.9%) | 29 (3.8%) |
| 3-Person Households | 164 (21.4%) | 0 (0.0%) |
| 4-Person Households | 45 (5.9%) | 0 (0.0%) |
| 5-Person Households | 15 (2.0%) | 0 (0.0%) |
| 6-Person Households | 0 (0.0%) | 0 (0.0%) |
| 7+ Person Households | 0 (0.0%) | 0 (0.0%) |
| Total | 583 (76.2%) | 182 (23.8%) |
Female Fertility in Higganum
Fertility by Age in Higganum
| Age Bracket | Women with Births | Births / 1,000 Women |
| 15 to 19 years | 0 (0.0%) | 0.0 |
| 20 to 34 years | 0 (0.0%) | 0.0 |
| 35 to 50 years | 0 (0.0%) | 0.0 |
| Total | 0 (0.0%) | 0.0 |
Fertility by Age by Marriage Status in Higganum
| Age Bracket | Married | Unmarried |
| 15 to 19 years | 0 (0.0%) | 0 (0.0%) |
| 20 to 34 years | 0 (0.0%) | 0 (0.0%) |
| 35 to 50 years | 0 (0.0%) | 0 (0.0%) |
| Total | 0 (0.0%) | 0 (0.0%) |
Fertility by Education in Higganum
| Educational Attainment | Women with Births | Births / 1,000 Women |
| Less than High School | 0 (0.0%) | 0.0 |
| High School Diploma | 0 (0.0%) | 0.0 |
| College or Associate's Degree | 0 (0.0%) | 0.0 |
| Bachelor's Degree | 0 (0.0%) | 0.0 |
| Graduate Degree | 0 (0.0%) | 0.0 |
| Total | 0 (0.0%) | 0.0 |
Fertility by Education by Marriage Status in Higganum
| Educational Attainment | Married | Unmarried |
| Less than High School | 0 (0.0%) | 0 (0.0%) |
| High School Diploma | 0 (0.0%) | 0 (0.0%) |
| College or Associate's Degree | 0 (0.0%) | 0 (0.0%) |
| Bachelor's Degree | 0 (0.0%) | 0 (0.0%) |
| Graduate Degree | 0 (0.0%) | 0 (0.0%) |
| Total | 0 (0.0%) | 0 (0.0%) |
Employment Characteristics in Higganum
Employment by Class of Employer in Higganum
Among the 921 employed individuals in Higganum, private company employees (513 | 55.7%), state government employees (135 | 14.7%), and local government employees (81 | 8.8%) make up the most common classes of employment.
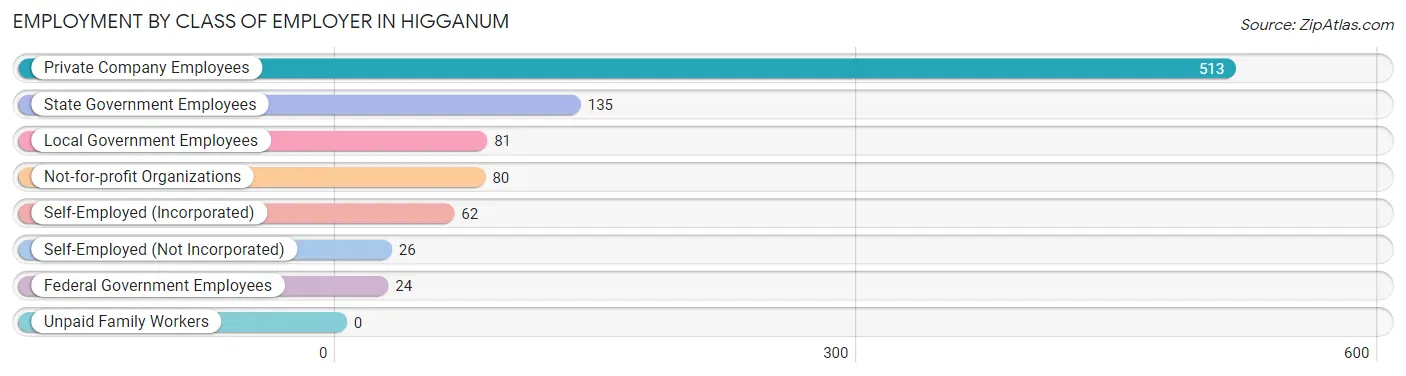
| Employer Class | # Employees | % Employees |
| Private Company Employees | 513 | 55.7% |
| Self-Employed (Incorporated) | 62 | 6.7% |
| Self-Employed (Not Incorporated) | 26 | 2.8% |
| Not-for-profit Organizations | 80 | 8.7% |
| Local Government Employees | 81 | 8.8% |
| State Government Employees | 135 | 14.7% |
| Federal Government Employees | 24 | 2.6% |
| Unpaid Family Workers | 0 | 0.0% |
| Total | 921 | 100.0% |
Employment Status by Age in Higganum
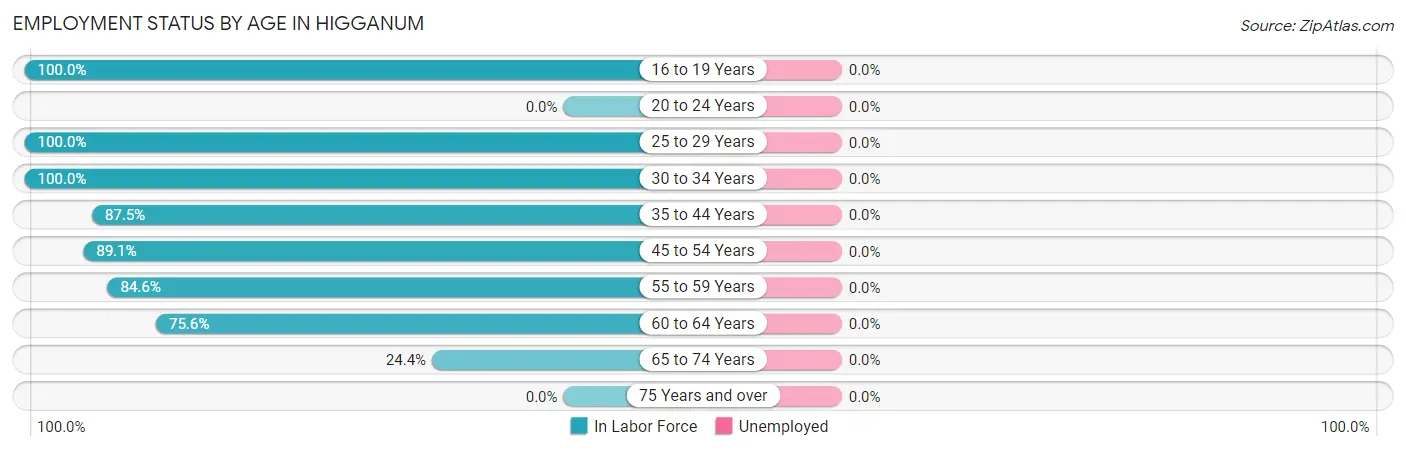
| Age Bracket | In Labor Force | Unemployed |
| 16 to 19 Years | 19 (100.0%) | 0 (0.0%) |
| 20 to 24 Years | 0 (0.0%) | 0 (0.0%) |
| 25 to 29 Years | 52 (100.0%) | 0 (0.0%) |
| 30 to 34 Years | 123 (100.0%) | 0 (0.0%) |
| 35 to 44 Years | 307 (87.5%) | 0 (0.0%) |
| 45 to 54 Years | 171 (89.1%) | 0 (0.0%) |
| 55 to 59 Years | 88 (84.6%) | 0 (0.0%) |
| 60 to 64 Years | 99 (75.6%) | 0 (0.0%) |
| 65 to 74 Years | 73 (24.4%) | 0 (0.0%) |
| 75 Years and over | 0 (0.0%) | 0 (0.0%) |
| Total | 932 (69.0%) | 0 (0.0%) |
Employment Status by Educational Attainment in Higganum
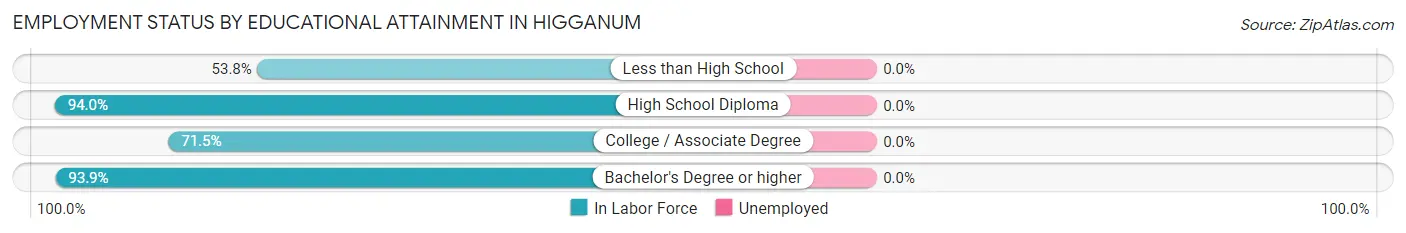
| Educational Attainment | In Labor Force | Unemployed |
| Less than High School | 7 (53.8%) | 0 (0.0%) |
| High School Diploma | 125 (94.0%) | 0 (0.0%) |
| College / Associate Degree | 158 (71.5%) | 0 (0.0%) |
| Bachelor's Degree or higher | 550 (93.9%) | 0 (0.0%) |
| Total | 840 (88.1%) | 0 (0.0%) |
Employment Occupations by Sex in Higganum
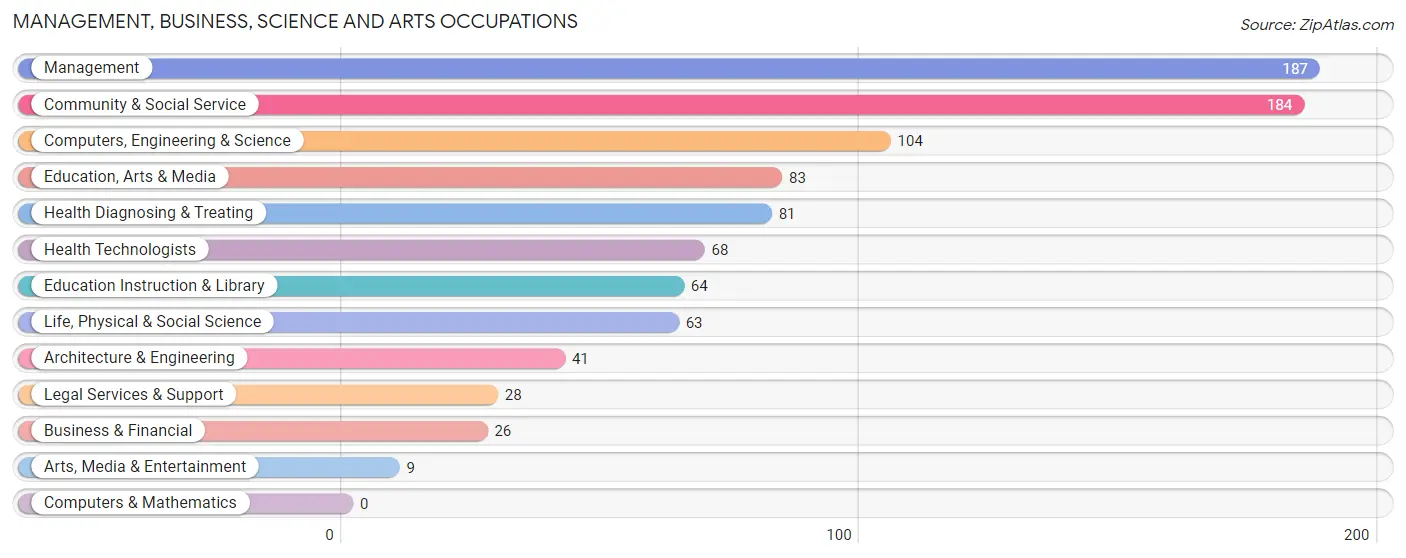
Management, Business, Science and Arts Occupations
The most common Management, Business, Science and Arts occupations in Higganum are Management (187 | 20.1%), Community & Social Service (184 | 19.7%), Computers, Engineering & Science (104 | 11.2%), Education, Arts & Media (83 | 8.9%), and Health Diagnosing & Treating (81 | 8.7%).
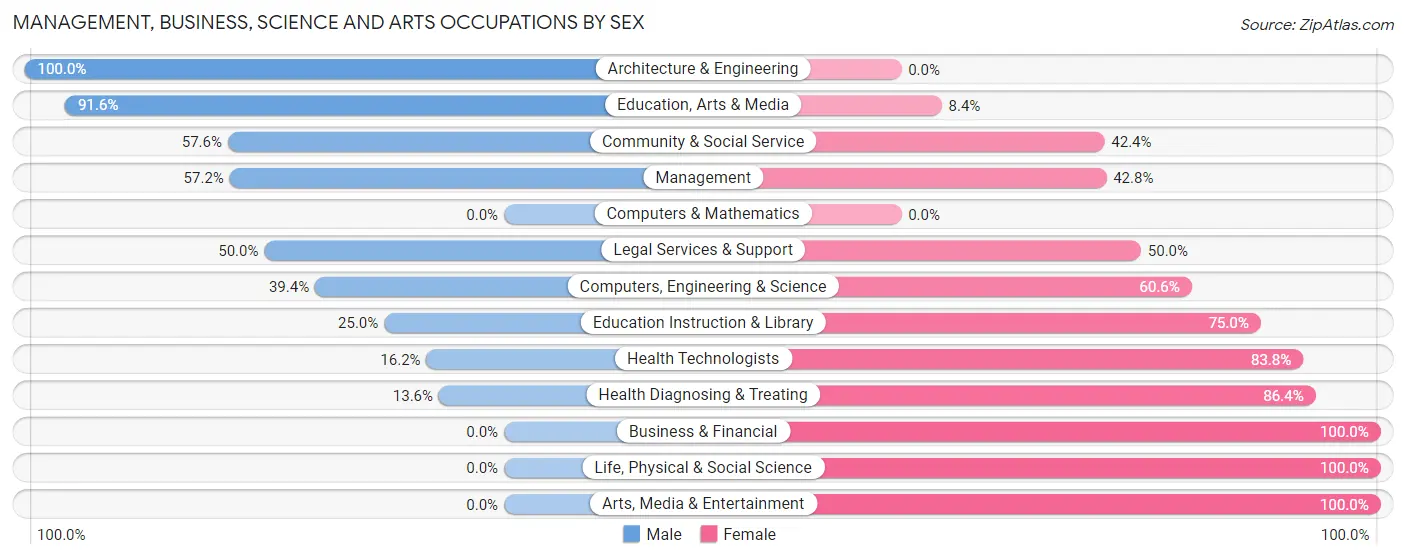
Management, Business, Science and Arts Occupations by Sex
Within the Management, Business, Science and Arts occupations in Higganum, the most male-oriented occupations are Architecture & Engineering (100.0%), Education, Arts & Media (91.6%), and Community & Social Service (57.6%), while the most female-oriented occupations are Business & Financial (100.0%), Life, Physical & Social Science (100.0%), and Arts, Media & Entertainment (100.0%).
| Occupation | Male | Female |
| Management | 107 (57.2%) | 80 (42.8%) |
| Business & Financial | 0 (0.0%) | 26 (100.0%) |
| Computers, Engineering & Science | 41 (39.4%) | 63 (60.6%) |
| Computers & Mathematics | 0 (0.0%) | 0 (0.0%) |
| Architecture & Engineering | 41 (100.0%) | 0 (0.0%) |
| Life, Physical & Social Science | 0 (0.0%) | 63 (100.0%) |
| Community & Social Service | 106 (57.6%) | 78 (42.4%) |
| Education, Arts & Media | 76 (91.6%) | 7 (8.4%) |
| Legal Services & Support | 14 (50.0%) | 14 (50.0%) |
| Education Instruction & Library | 16 (25.0%) | 48 (75.0%) |
| Arts, Media & Entertainment | 0 (0.0%) | 9 (100.0%) |
| Health Diagnosing & Treating | 11 (13.6%) | 70 (86.4%) |
| Health Technologists | 11 (16.2%) | 57 (83.8%) |
| Total (Category) | 265 (45.5%) | 317 (54.5%) |
| Total (Overall) | 524 (56.2%) | 408 (43.8%) |
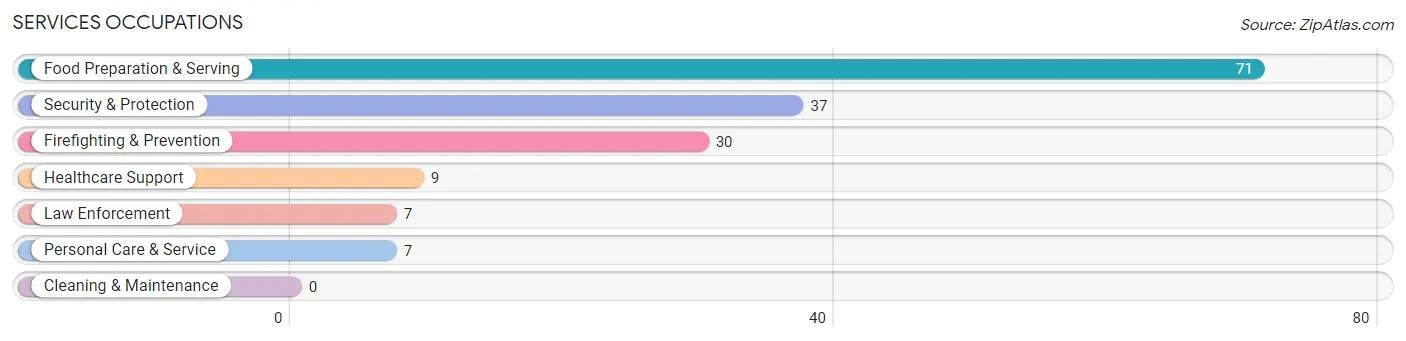
Services Occupations
The most common Services occupations in Higganum are Food Preparation & Serving (71 | 7.6%), Security & Protection (37 | 4.0%), Firefighting & Prevention (30 | 3.2%), Healthcare Support (9 | 1.0%), and Law Enforcement (7 | 0.7%).
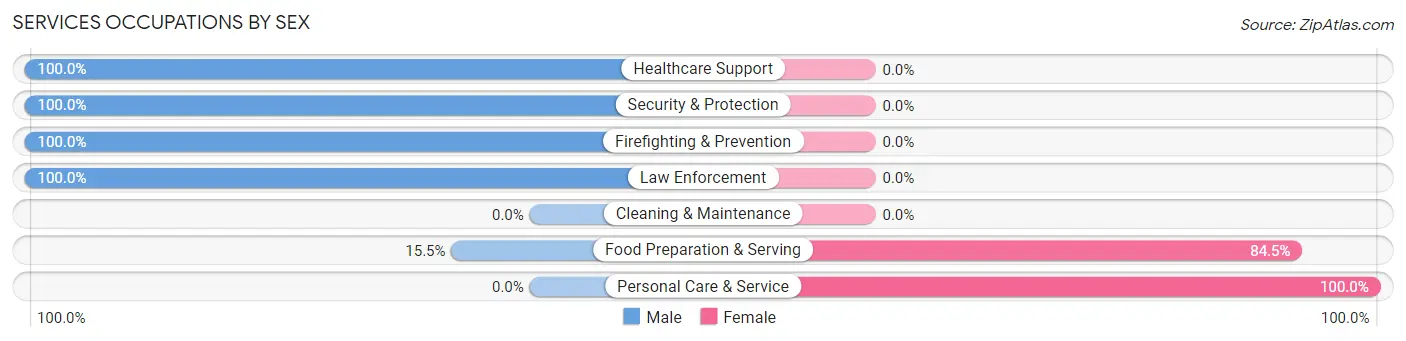
Services Occupations by Sex
Within the Services occupations in Higganum, the most male-oriented occupations are Healthcare Support (100.0%), Security & Protection (100.0%), and Firefighting & Prevention (100.0%), while the most female-oriented occupations are Personal Care & Service (100.0%), and Food Preparation & Serving (84.5%).
| Occupation | Male | Female |
| Healthcare Support | 9 (100.0%) | 0 (0.0%) |
| Security & Protection | 37 (100.0%) | 0 (0.0%) |
| Firefighting & Prevention | 30 (100.0%) | 0 (0.0%) |
| Law Enforcement | 7 (100.0%) | 0 (0.0%) |
| Food Preparation & Serving | 11 (15.5%) | 60 (84.5%) |
| Cleaning & Maintenance | 0 (0.0%) | 0 (0.0%) |
| Personal Care & Service | 0 (0.0%) | 7 (100.0%) |
| Total (Category) | 57 (46.0%) | 67 (54.0%) |
| Total (Overall) | 524 (56.2%) | 408 (43.8%) |
Sales and Office Occupations
The most common Sales and Office occupations in Higganum are Sales & Related (71 | 7.6%), and Office & Administration (33 | 3.5%).
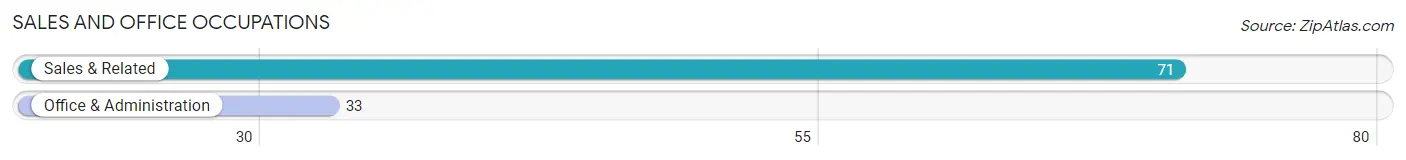
Sales and Office Occupations by Sex
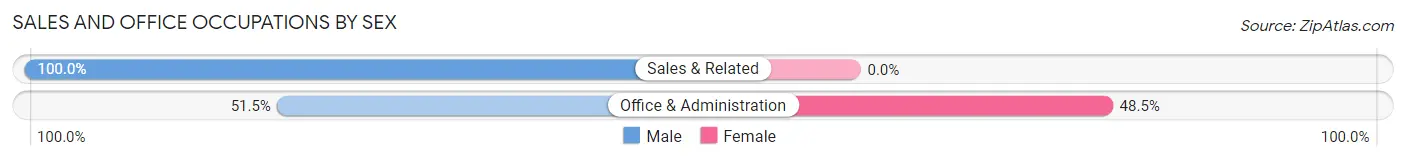
| Occupation | Male | Female |
| Sales & Related | 71 (100.0%) | 0 (0.0%) |
| Office & Administration | 17 (51.5%) | 16 (48.5%) |
| Total (Category) | 88 (84.6%) | 16 (15.4%) |
| Total (Overall) | 524 (56.2%) | 408 (43.8%) |
Natural Resources, Construction and Maintenance Occupations
The most common Natural Resources, Construction and Maintenance occupations in Higganum are Construction & Extraction (38 | 4.1%), Installation, Maintenance & Repair (28 | 3.0%), and Farming, Fishing & Forestry (8 | 0.9%).
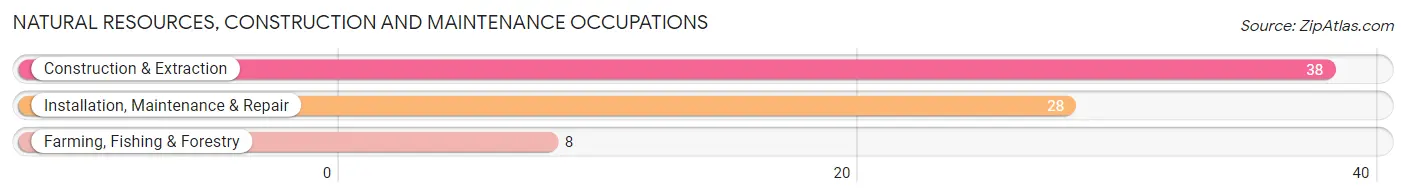
Natural Resources, Construction and Maintenance Occupations by Sex
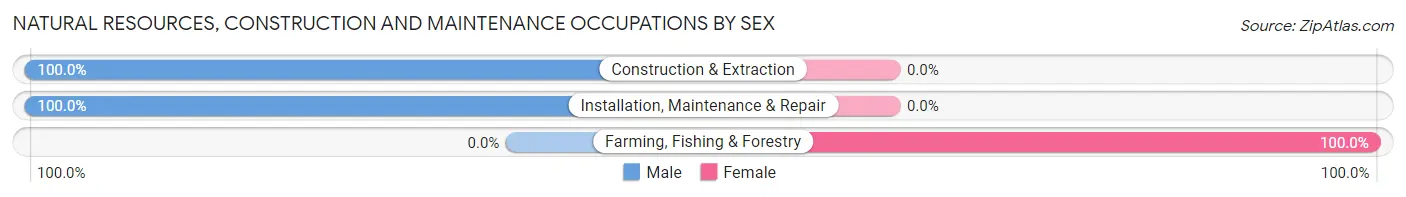
| Occupation | Male | Female |
| Farming, Fishing & Forestry | 0 (0.0%) | 8 (100.0%) |
| Construction & Extraction | 38 (100.0%) | 0 (0.0%) |
| Installation, Maintenance & Repair | 28 (100.0%) | 0 (0.0%) |
| Total (Category) | 66 (89.2%) | 8 (10.8%) |
| Total (Overall) | 524 (56.2%) | 408 (43.8%) |
Production, Transportation and Moving Occupations
The most common Production, Transportation and Moving occupations in Higganum are Transportation (26 | 2.8%), and Production (22 | 2.4%).
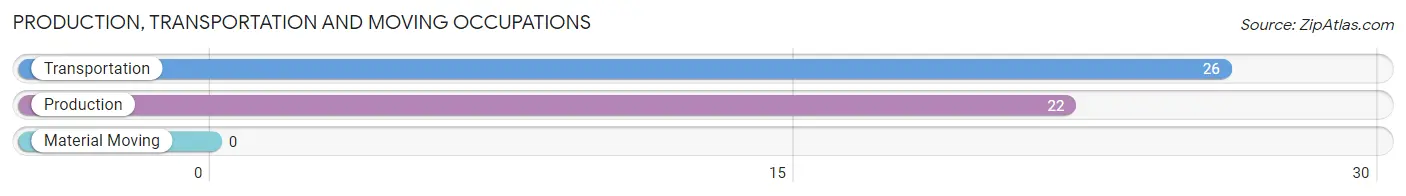
Production, Transportation and Moving Occupations by Sex
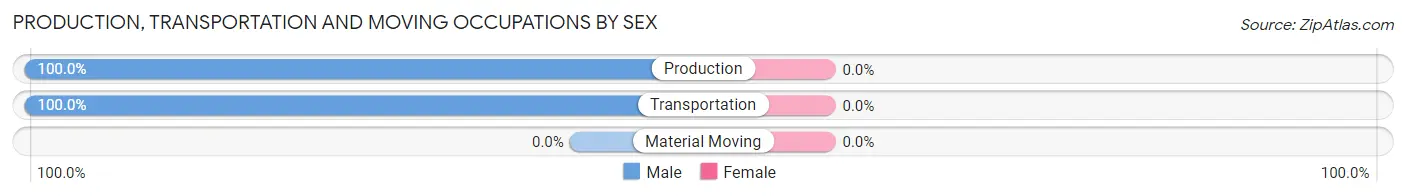
| Occupation | Male | Female |
| Production | 22 (100.0%) | 0 (0.0%) |
| Transportation | 26 (100.0%) | 0 (0.0%) |
| Material Moving | 0 (0.0%) | 0 (0.0%) |
| Total (Category) | 48 (100.0%) | 0 (0.0%) |
| Total (Overall) | 524 (56.2%) | 408 (43.8%) |
Employment Industries by Sex in Higganum
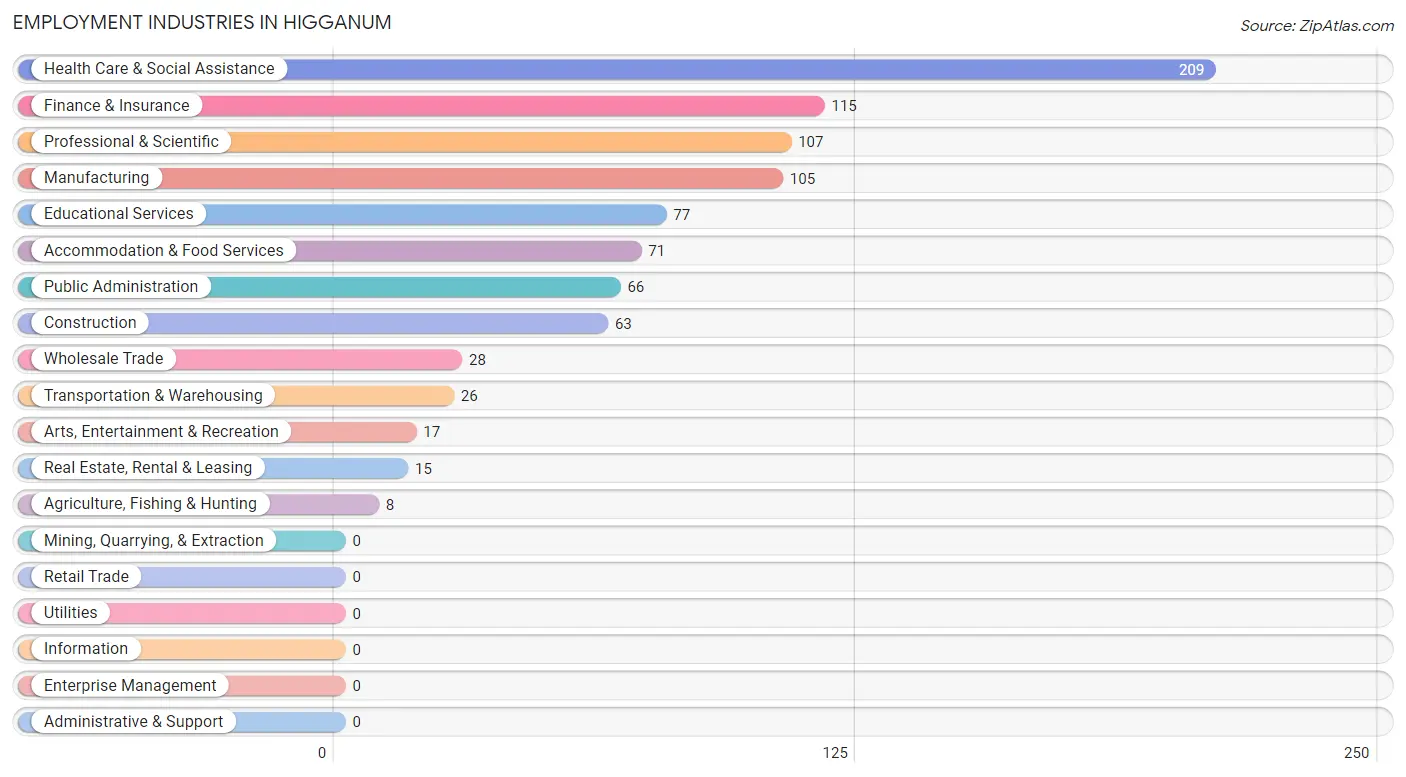
Employment Industries in Higganum
The major employment industries in Higganum include Health Care & Social Assistance (209 | 22.4%), Finance & Insurance (115 | 12.3%), Professional & Scientific (107 | 11.5%), Manufacturing (105 | 11.3%), and Educational Services (77 | 8.3%).
Employment Industries by Sex in Higganum
The Higganum industries that see more men than women are Construction (100.0%), Transportation & Warehousing (100.0%), and Real Estate, Rental & Leasing (100.0%), whereas the industries that tend to have a higher number of women are Agriculture, Fishing & Hunting (100.0%), Accommodation & Food Services (84.5%), and Educational Services (74.0%).
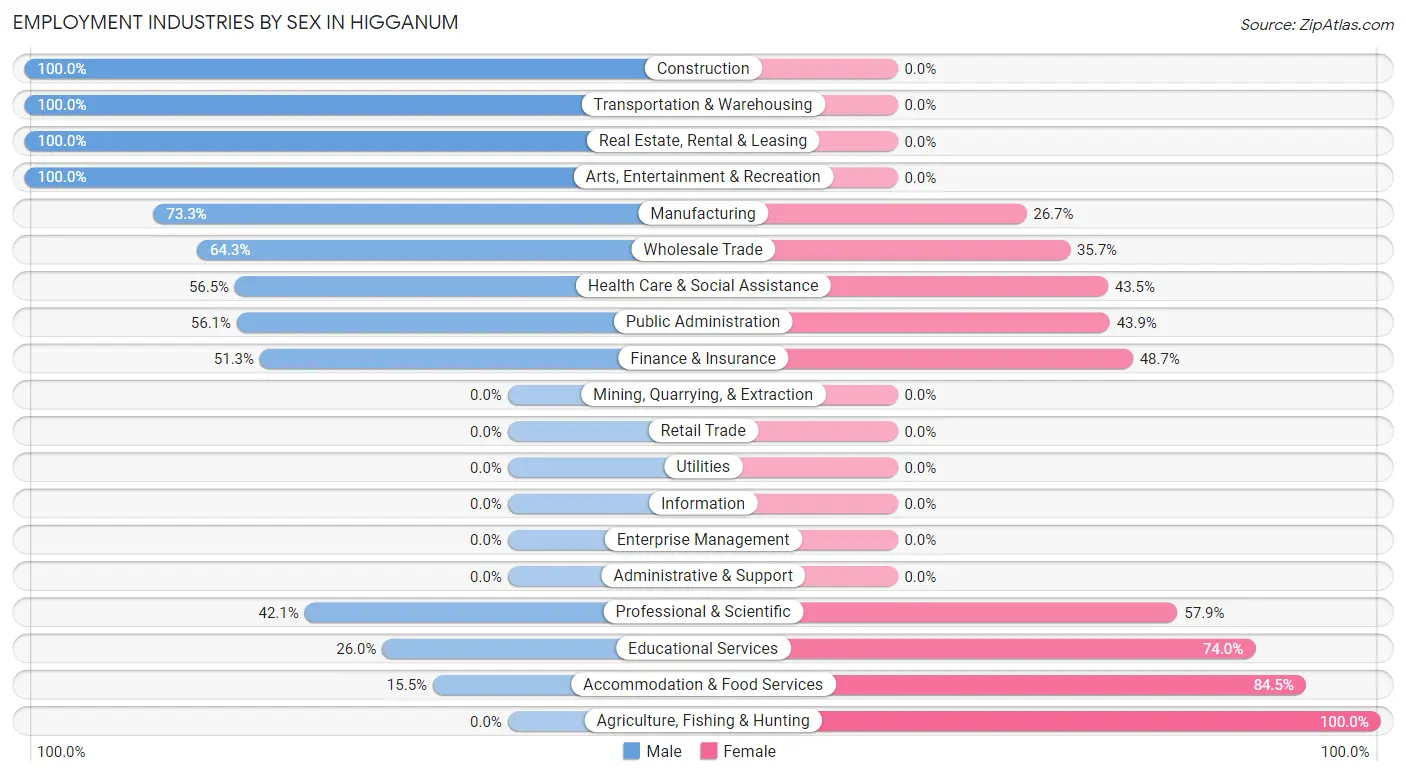
| Industry | Male | Female |
| Agriculture, Fishing & Hunting | 0 (0.0%) | 8 (100.0%) |
| Mining, Quarrying, & Extraction | 0 (0.0%) | 0 (0.0%) |
| Construction | 63 (100.0%) | 0 (0.0%) |
| Manufacturing | 77 (73.3%) | 28 (26.7%) |
| Wholesale Trade | 18 (64.3%) | 10 (35.7%) |
| Retail Trade | 0 (0.0%) | 0 (0.0%) |
| Transportation & Warehousing | 26 (100.0%) | 0 (0.0%) |
| Utilities | 0 (0.0%) | 0 (0.0%) |
| Information | 0 (0.0%) | 0 (0.0%) |
| Finance & Insurance | 59 (51.3%) | 56 (48.7%) |
| Real Estate, Rental & Leasing | 15 (100.0%) | 0 (0.0%) |
| Professional & Scientific | 45 (42.1%) | 62 (57.9%) |
| Enterprise Management | 0 (0.0%) | 0 (0.0%) |
| Administrative & Support | 0 (0.0%) | 0 (0.0%) |
| Educational Services | 20 (26.0%) | 57 (74.0%) |
| Health Care & Social Assistance | 118 (56.5%) | 91 (43.5%) |
| Arts, Entertainment & Recreation | 17 (100.0%) | 0 (0.0%) |
| Accommodation & Food Services | 11 (15.5%) | 60 (84.5%) |
| Public Administration | 37 (56.1%) | 29 (43.9%) |
| Total | 524 (56.2%) | 408 (43.8%) |
Education in Higganum
School Enrollment in Higganum
The most common levels of schooling among the 416 students in Higganum are elementary school (188 | 45.2%), middle school (78 | 18.8%), and high school (68 | 16.4%).
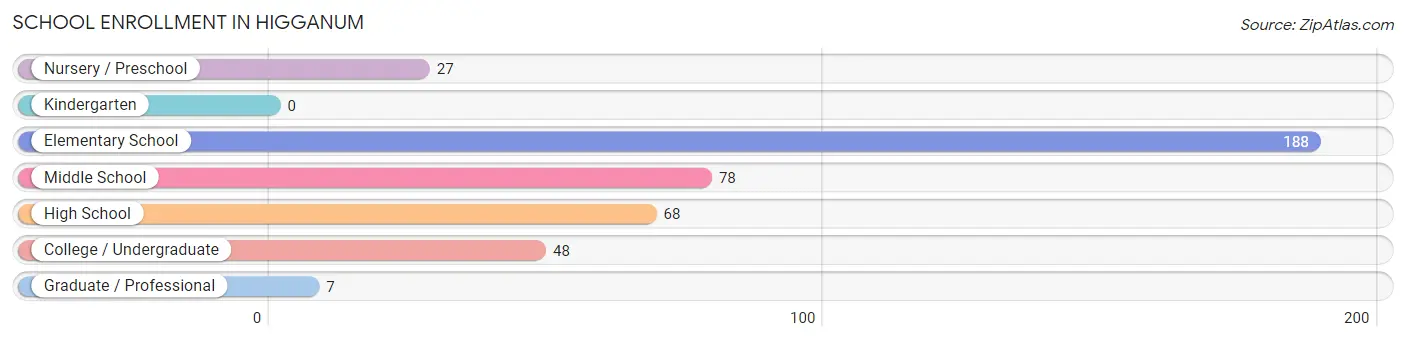
| School Level | # Students | % Students |
| Nursery / Preschool | 27 | 6.5% |
| Kindergarten | 0 | 0.0% |
| Elementary School | 188 | 45.2% |
| Middle School | 78 | 18.8% |
| High School | 68 | 16.4% |
| College / Undergraduate | 48 | 11.5% |
| Graduate / Professional | 7 | 1.7% |
| Total | 416 | 100.0% |
School Enrollment by Age by Funding Source in Higganum
Out of a total of 416 students who are enrolled in schools in Higganum, 31 (7.5%) attend a private institution, while the remaining 385 (92.5%) are enrolled in public schools. The age group of 35 years and over has the highest likelihood of being enrolled in private schools, with 18 (100.0% in the age bracket) enrolled. Conversely, the age group of 5 to 9 year old has the lowest likelihood of being enrolled in a private school, with 188 (100.0% in the age bracket) attending a public institution.
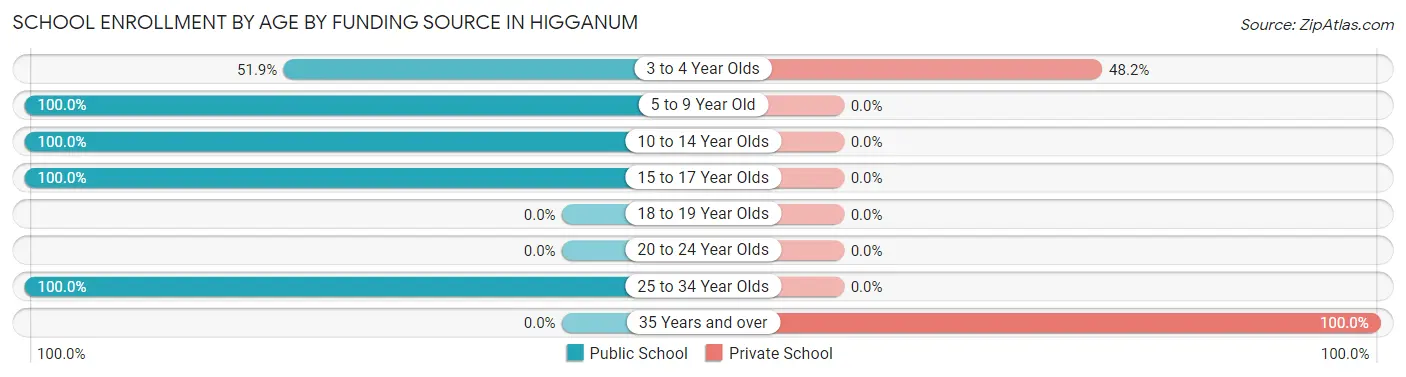
| Age Bracket | Public School | Private School |
| 3 to 4 Year Olds | 14 (51.8%) | 13 (48.1%) |
| 5 to 9 Year Old | 188 (100.0%) | 0 (0.0%) |
| 10 to 14 Year Olds | 127 (100.0%) | 0 (0.0%) |
| 15 to 17 Year Olds | 19 (100.0%) | 0 (0.0%) |
| 18 to 19 Year Olds | 0 (0.0%) | 0 (0.0%) |
| 20 to 24 Year Olds | 0 (0.0%) | 0 (0.0%) |
| 25 to 34 Year Olds | 37 (100.0%) | 0 (0.0%) |
| 35 Years and over | 0 (0.0%) | 18 (100.0%) |
| Total | 385 (92.5%) | 31 (7.5%) |
Educational Attainment by Field of Study in Higganum
Psychology (120 | 14.3%), arts & humanities (110 | 13.1%), bio, nature & agricultural (104 | 12.4%), business (94 | 11.2%), and literature & languages (81 | 9.7%) are the most common fields of study among 838 individuals in Higganum who have obtained a bachelor's degree or higher.
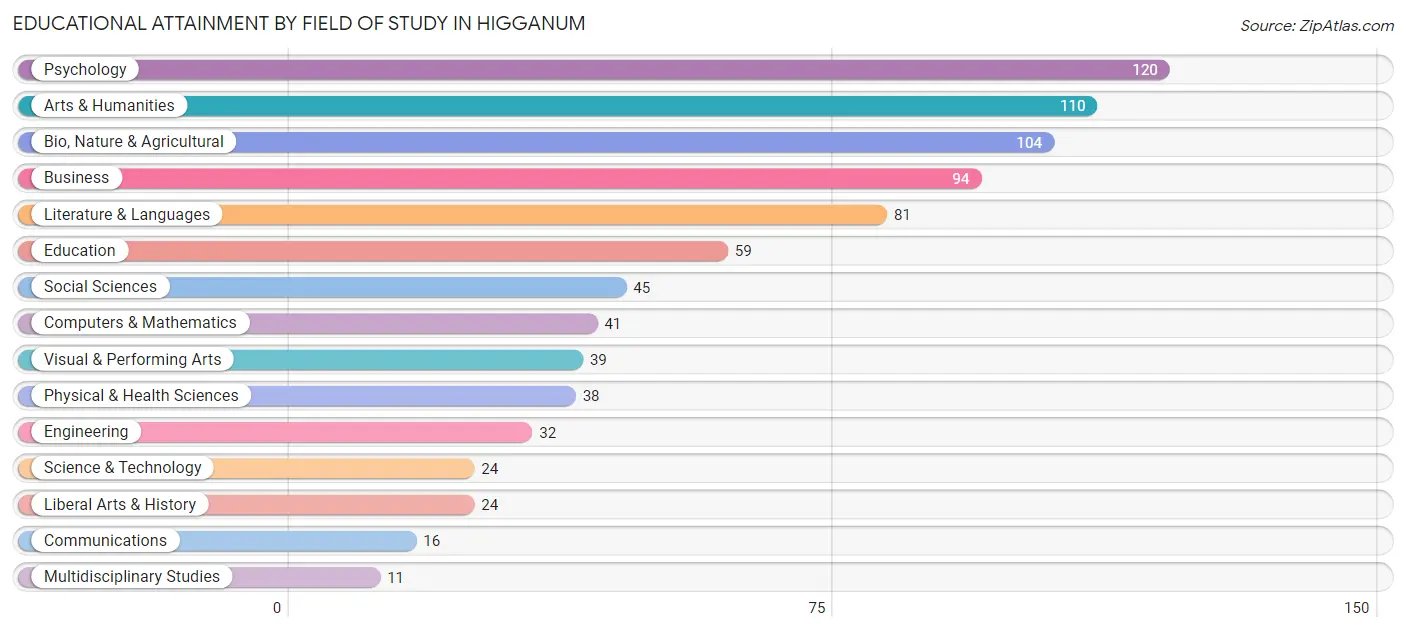
| Field of Study | # Graduates | % Graduates |
| Computers & Mathematics | 41 | 4.9% |
| Bio, Nature & Agricultural | 104 | 12.4% |
| Physical & Health Sciences | 38 | 4.5% |
| Psychology | 120 | 14.3% |
| Social Sciences | 45 | 5.4% |
| Engineering | 32 | 3.8% |
| Multidisciplinary Studies | 11 | 1.3% |
| Science & Technology | 24 | 2.9% |
| Business | 94 | 11.2% |
| Education | 59 | 7.0% |
| Literature & Languages | 81 | 9.7% |
| Liberal Arts & History | 24 | 2.9% |
| Visual & Performing Arts | 39 | 4.6% |
| Communications | 16 | 1.9% |
| Arts & Humanities | 110 | 13.1% |
| Total | 838 | 100.0% |
Transportation & Commute in Higganum
Vehicle Availability by Sex in Higganum
The most prevalent vehicle ownership categories in Higganum are males with 2 vehicles (185, accounting for 36.5%) and females with 2 vehicles (218, making up 45.3%).
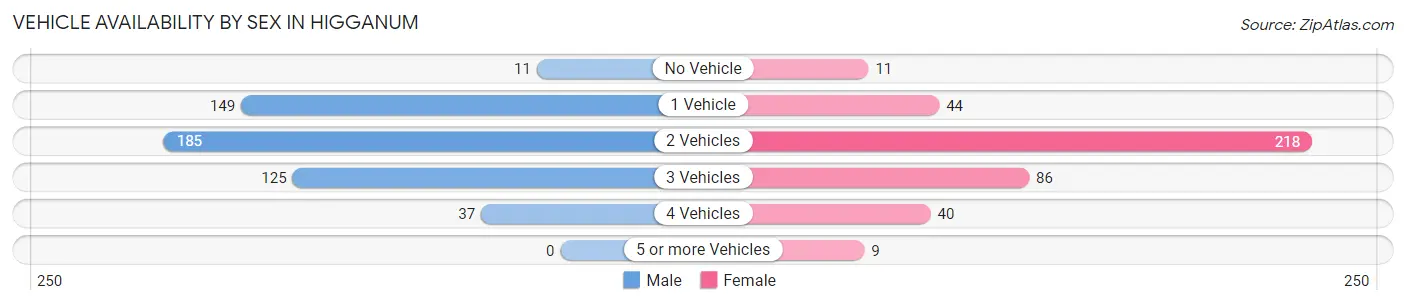
| Vehicles Available | Male | Female |
| No Vehicle | 11 (2.2%) | 11 (2.7%) |
| 1 Vehicle | 149 (29.4%) | 44 (10.8%) |
| 2 Vehicles | 185 (36.5%) | 218 (53.4%) |
| 3 Vehicles | 125 (24.6%) | 86 (21.1%) |
| 4 Vehicles | 37 (7.3%) | 40 (9.8%) |
| 5 or more Vehicles | 0 (0.0%) | 9 (2.2%) |
| Total | 507 (100.0%) | 408 (100.0%) |
Commute Time in Higganum
The most frequently occuring commute durations in Higganum are 15 to 19 minutes (165 commuters, 20.8%), 30 to 34 minutes (153 commuters, 19.3%), and 60 to 89 minutes (93 commuters, 11.7%).
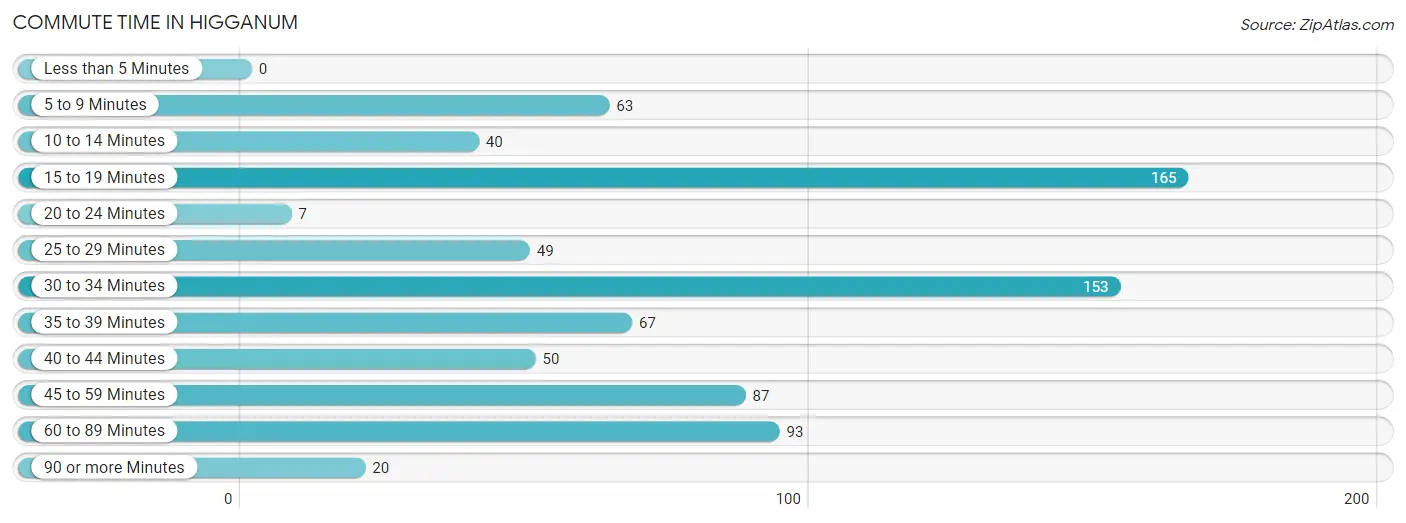
| Commute Time | # Commuters | % Commuters |
| Less than 5 Minutes | 0 | 0.0% |
| 5 to 9 Minutes | 63 | 7.9% |
| 10 to 14 Minutes | 40 | 5.0% |
| 15 to 19 Minutes | 165 | 20.8% |
| 20 to 24 Minutes | 7 | 0.9% |
| 25 to 29 Minutes | 49 | 6.2% |
| 30 to 34 Minutes | 153 | 19.3% |
| 35 to 39 Minutes | 67 | 8.4% |
| 40 to 44 Minutes | 50 | 6.3% |
| 45 to 59 Minutes | 87 | 11.0% |
| 60 to 89 Minutes | 93 | 11.7% |
| 90 or more Minutes | 20 | 2.5% |
Commute Time by Sex in Higganum
The most common commute times in Higganum are 30 to 34 minutes (95 commuters, 23.3%) for males and 15 to 19 minutes (81 commuters, 21.0%) for females.
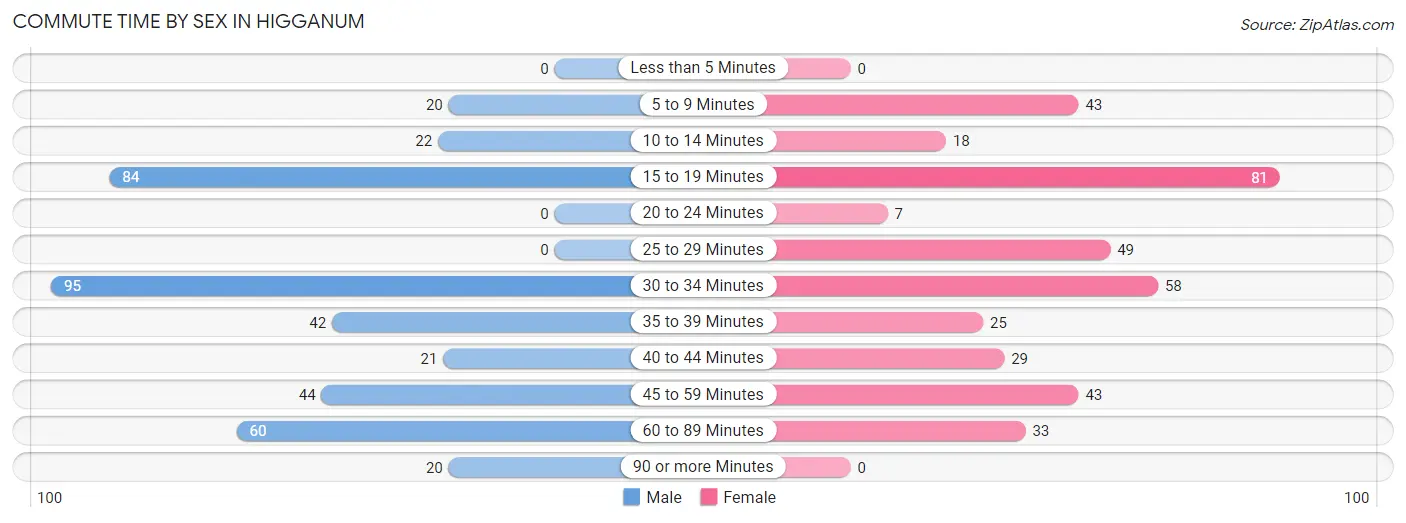
| Commute Time | Male | Female |
| Less than 5 Minutes | 0 (0.0%) | 0 (0.0%) |
| 5 to 9 Minutes | 20 (4.9%) | 43 (11.1%) |
| 10 to 14 Minutes | 22 (5.4%) | 18 (4.7%) |
| 15 to 19 Minutes | 84 (20.6%) | 81 (21.0%) |
| 20 to 24 Minutes | 0 (0.0%) | 7 (1.8%) |
| 25 to 29 Minutes | 0 (0.0%) | 49 (12.7%) |
| 30 to 34 Minutes | 95 (23.3%) | 58 (15.0%) |
| 35 to 39 Minutes | 42 (10.3%) | 25 (6.5%) |
| 40 to 44 Minutes | 21 (5.1%) | 29 (7.5%) |
| 45 to 59 Minutes | 44 (10.8%) | 43 (11.1%) |
| 60 to 89 Minutes | 60 (14.7%) | 33 (8.6%) |
| 90 or more Minutes | 20 (4.9%) | 0 (0.0%) |
Time of Departure to Work by Sex in Higganum
The most frequent times of departure to work in Higganum are 7:30 AM to 7:59 AM (108, 26.5%) for males and 6:00 AM to 6:29 AM (80, 20.7%) for females.
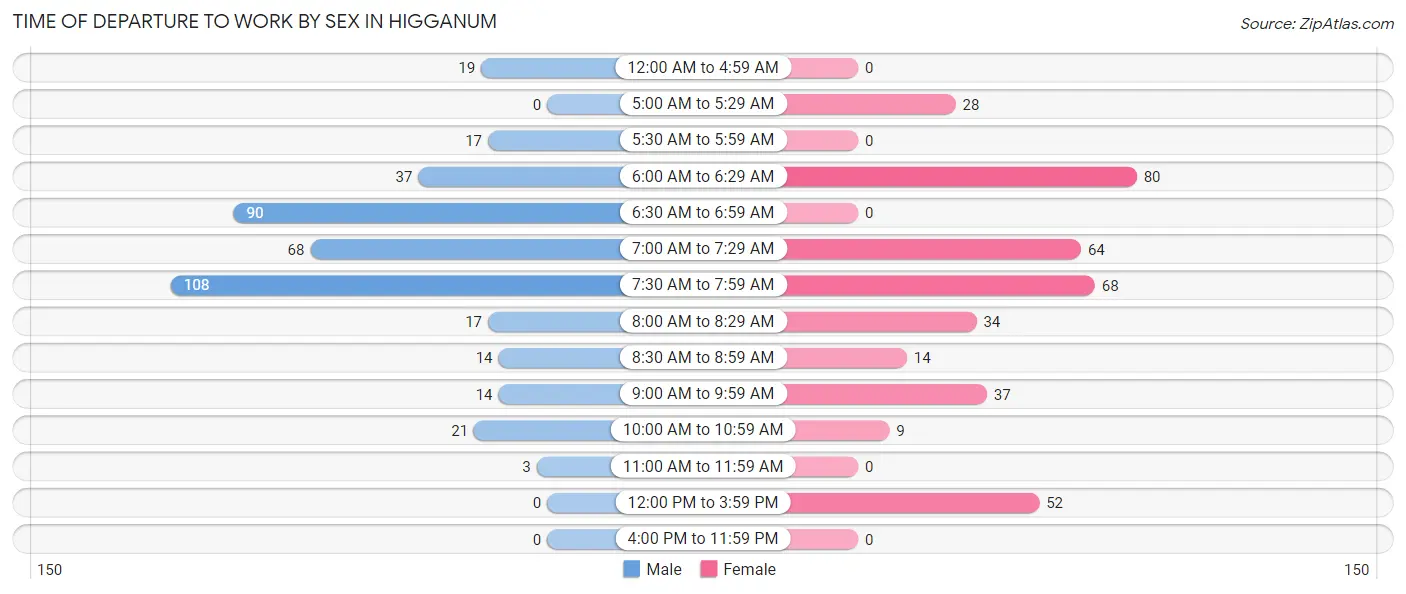
| Time of Departure | Male | Female |
| 12:00 AM to 4:59 AM | 19 (4.7%) | 0 (0.0%) |
| 5:00 AM to 5:29 AM | 0 (0.0%) | 28 (7.2%) |
| 5:30 AM to 5:59 AM | 17 (4.2%) | 0 (0.0%) |
| 6:00 AM to 6:29 AM | 37 (9.1%) | 80 (20.7%) |
| 6:30 AM to 6:59 AM | 90 (22.1%) | 0 (0.0%) |
| 7:00 AM to 7:29 AM | 68 (16.7%) | 64 (16.6%) |
| 7:30 AM to 7:59 AM | 108 (26.5%) | 68 (17.6%) |
| 8:00 AM to 8:29 AM | 17 (4.2%) | 34 (8.8%) |
| 8:30 AM to 8:59 AM | 14 (3.4%) | 14 (3.6%) |
| 9:00 AM to 9:59 AM | 14 (3.4%) | 37 (9.6%) |
| 10:00 AM to 10:59 AM | 21 (5.1%) | 9 (2.3%) |
| 11:00 AM to 11:59 AM | 3 (0.7%) | 0 (0.0%) |
| 12:00 PM to 3:59 PM | 0 (0.0%) | 52 (13.5%) |
| 4:00 PM to 11:59 PM | 0 (0.0%) | 0 (0.0%) |
| Total | 408 (100.0%) | 386 (100.0%) |
Housing Occupancy in Higganum
Occupancy by Ownership in Higganum
Of the total 765 dwellings in Higganum, owner-occupied units account for 677 (88.5%), while renter-occupied units make up 88 (11.5%).
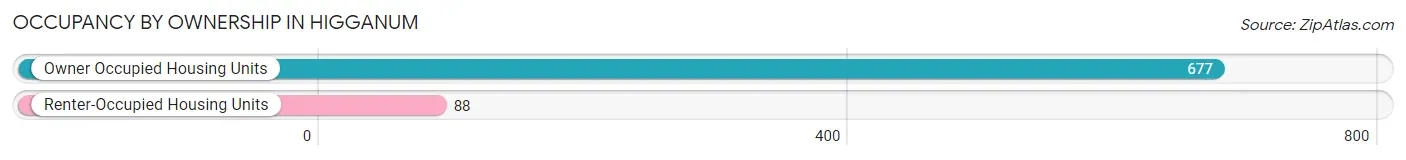
| Occupancy | # Housing Units | % Housing Units |
| Owner Occupied Housing Units | 677 | 88.5% |
| Renter-Occupied Housing Units | 88 | 11.5% |
| Total Occupied Housing Units | 765 | 100.0% |
Occupancy by Household Size in Higganum
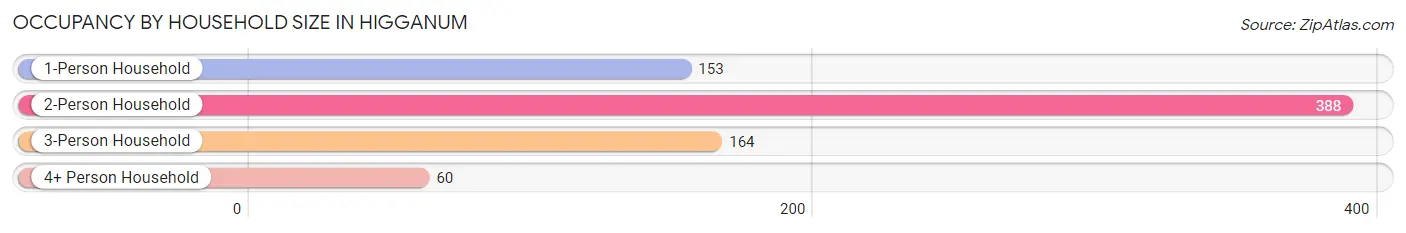
| Household Size | # Housing Units | % Housing Units |
| 1-Person Household | 153 | 20.0% |
| 2-Person Household | 388 | 50.7% |
| 3-Person Household | 164 | 21.4% |
| 4+ Person Household | 60 | 7.8% |
| Total Housing Units | 765 | 100.0% |
Occupancy by Ownership by Household Size in Higganum
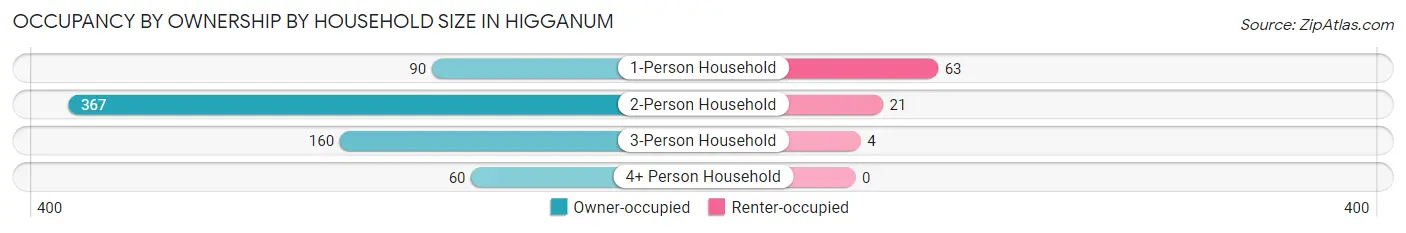
| Household Size | Owner-occupied | Renter-occupied |
| 1-Person Household | 90 (58.8%) | 63 (41.2%) |
| 2-Person Household | 367 (94.6%) | 21 (5.4%) |
| 3-Person Household | 160 (97.6%) | 4 (2.4%) |
| 4+ Person Household | 60 (100.0%) | 0 (0.0%) |
| Total Housing Units | 677 (88.5%) | 88 (11.5%) |
Occupancy by Educational Attainment in Higganum
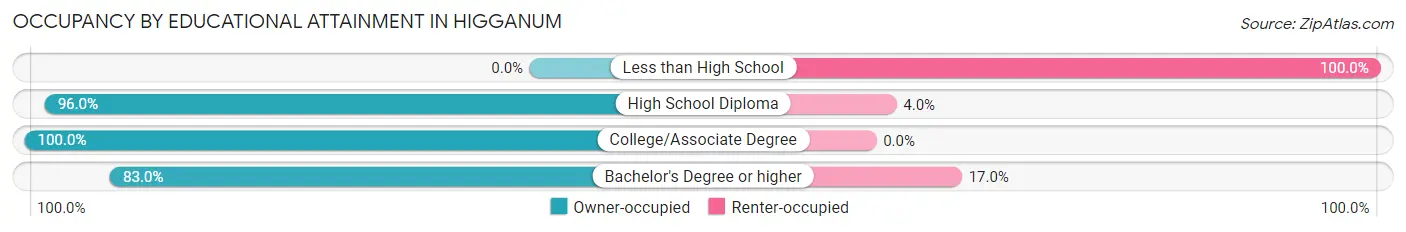
| Household Size | Owner-occupied | Renter-occupied |
| Less than High School | 0 (0.0%) | 6 (100.0%) |
| High School Diploma | 96 (96.0%) | 4 (4.0%) |
| College/Associate Degree | 199 (100.0%) | 0 (0.0%) |
| Bachelor's Degree or higher | 382 (83.0%) | 78 (17.0%) |
Occupancy by Age of Householder in Higganum
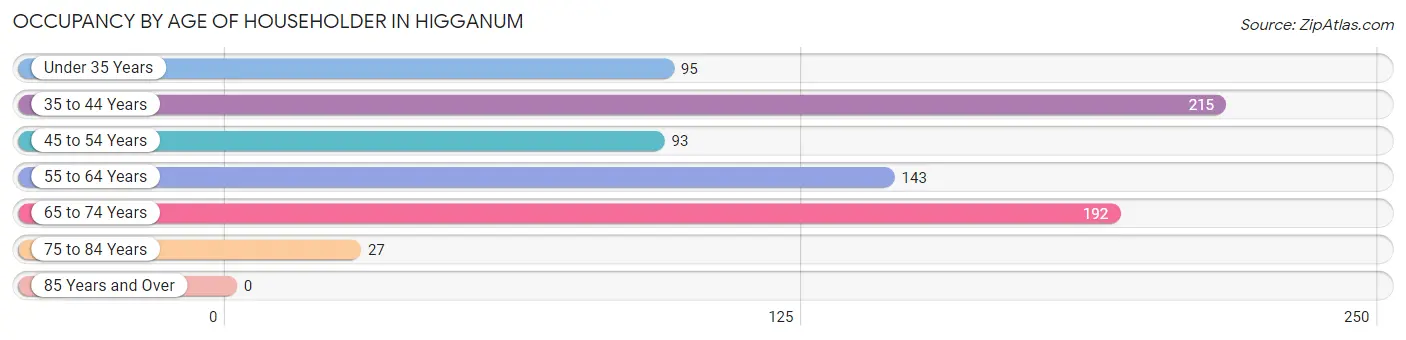
| Age Bracket | # Households | % Households |
| Under 35 Years | 95 | 12.4% |
| 35 to 44 Years | 215 | 28.1% |
| 45 to 54 Years | 93 | 12.2% |
| 55 to 64 Years | 143 | 18.7% |
| 65 to 74 Years | 192 | 25.1% |
| 75 to 84 Years | 27 | 3.5% |
| 85 Years and Over | 0 | 0.0% |
| Total | 765 | 100.0% |
Housing Finances in Higganum
Median Income by Occupancy in Higganum
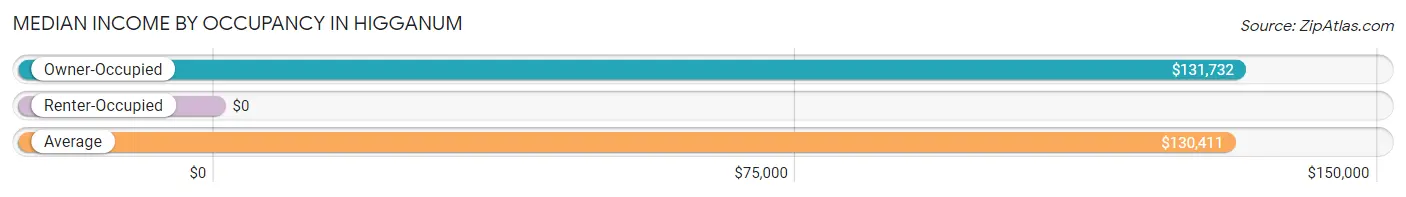
| Occupancy Type | # Households | Median Income |
| Owner-Occupied | 677 (88.5%) | $131,732 |
| Renter-Occupied | 88 (11.5%) | $0 |
| Average | 765 (100.0%) | $130,411 |
Occupancy by Householder Income Bracket in Higganum
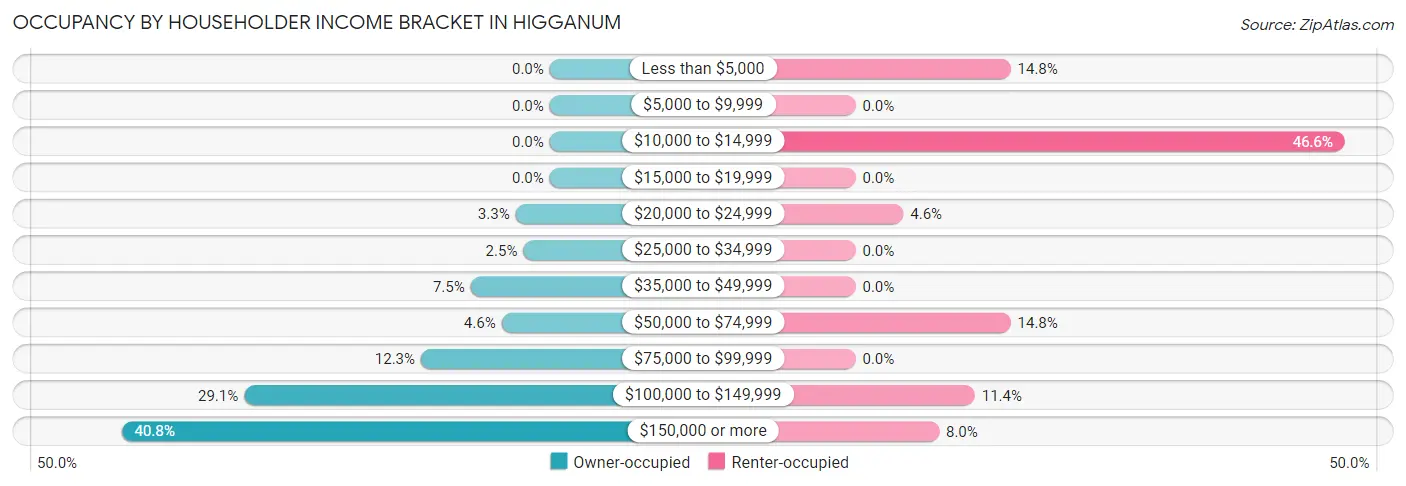
| Income Bracket | Owner-occupied | Renter-occupied |
| Less than $5,000 | 0 (0.0%) | 13 (14.8%) |
| $5,000 to $9,999 | 0 (0.0%) | 0 (0.0%) |
| $10,000 to $14,999 | 0 (0.0%) | 41 (46.6%) |
| $15,000 to $19,999 | 0 (0.0%) | 0 (0.0%) |
| $20,000 to $24,999 | 22 (3.3%) | 4 (4.5%) |
| $25,000 to $34,999 | 17 (2.5%) | 0 (0.0%) |
| $35,000 to $49,999 | 51 (7.5%) | 0 (0.0%) |
| $50,000 to $74,999 | 31 (4.6%) | 13 (14.8%) |
| $75,000 to $99,999 | 83 (12.3%) | 0 (0.0%) |
| $100,000 to $149,999 | 197 (29.1%) | 10 (11.4%) |
| $150,000 or more | 276 (40.8%) | 7 (8.0%) |
| Total | 677 (100.0%) | 88 (100.0%) |
Monthly Housing Cost Tiers in Higganum
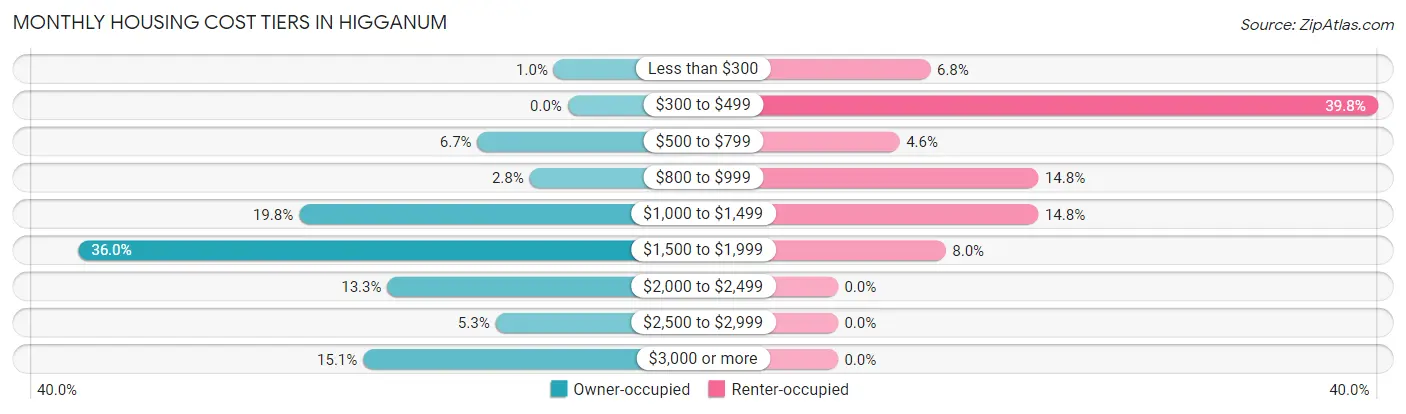
| Monthly Cost | Owner-occupied | Renter-occupied |
| Less than $300 | 7 (1.0%) | 6 (6.8%) |
| $300 to $499 | 0 (0.0%) | 35 (39.8%) |
| $500 to $799 | 45 (6.7%) | 4 (4.5%) |
| $800 to $999 | 19 (2.8%) | 13 (14.8%) |
| $1,000 to $1,499 | 134 (19.8%) | 13 (14.8%) |
| $1,500 to $1,999 | 244 (36.0%) | 7 (8.0%) |
| $2,000 to $2,499 | 90 (13.3%) | 0 (0.0%) |
| $2,500 to $2,999 | 36 (5.3%) | 0 (0.0%) |
| $3,000 or more | 102 (15.1%) | 0 (0.0%) |
| Total | 677 (100.0%) | 88 (100.0%) |
Physical Housing Characteristics in Higganum
Housing Structures in Higganum
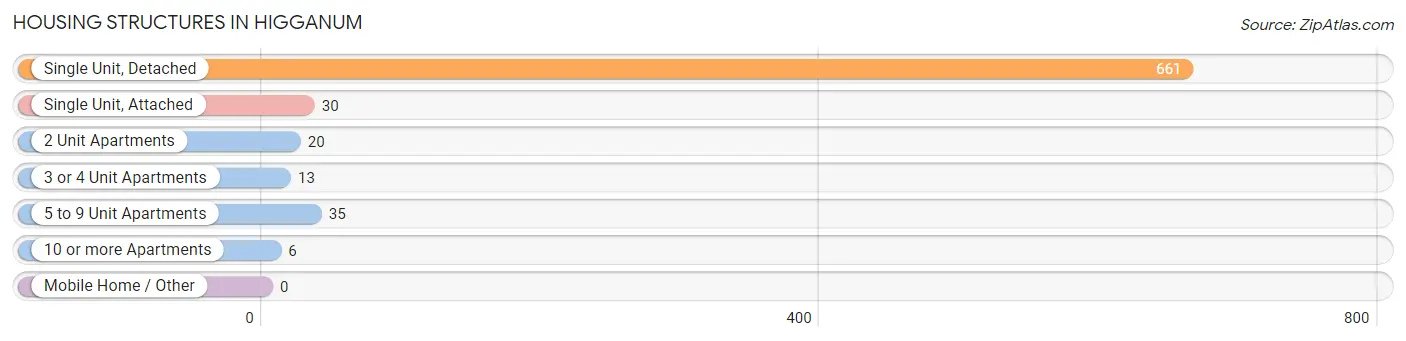
| Structure Type | # Housing Units | % Housing Units |
| Single Unit, Detached | 661 | 86.4% |
| Single Unit, Attached | 30 | 3.9% |
| 2 Unit Apartments | 20 | 2.6% |
| 3 or 4 Unit Apartments | 13 | 1.7% |
| 5 to 9 Unit Apartments | 35 | 4.6% |
| 10 or more Apartments | 6 | 0.8% |
| Mobile Home / Other | 0 | 0.0% |
| Total | 765 | 100.0% |
Housing Structures by Occupancy in Higganum

| Structure Type | Owner-occupied | Renter-occupied |
| Single Unit, Detached | 651 (98.5%) | 10 (1.5%) |
| Single Unit, Attached | 26 (86.7%) | 4 (13.3%) |
| 2 Unit Apartments | 0 (0.0%) | 20 (100.0%) |
| 3 or 4 Unit Apartments | 0 (0.0%) | 13 (100.0%) |
| 5 to 9 Unit Apartments | 0 (0.0%) | 35 (100.0%) |
| 10 or more Apartments | 0 (0.0%) | 6 (100.0%) |
| Mobile Home / Other | 0 (0.0%) | 0 (0.0%) |
| Total | 677 (88.5%) | 88 (11.5%) |
Housing Structures by Number of Rooms in Higganum
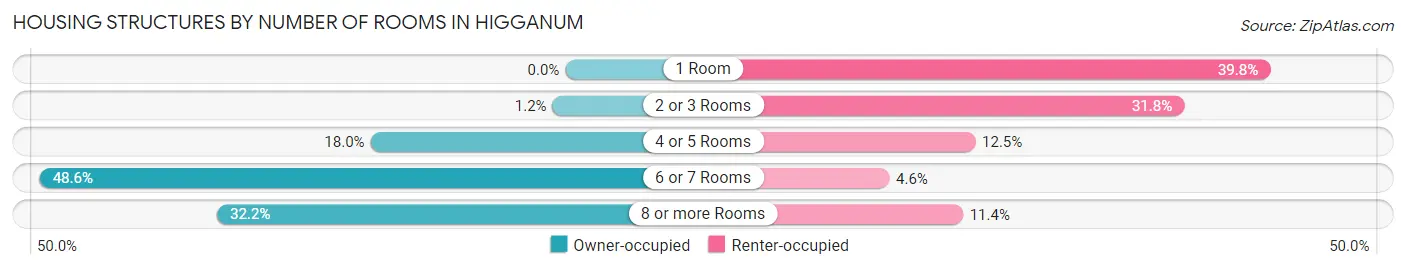
| Number of Rooms | Owner-occupied | Renter-occupied |
| 1 Room | 0 (0.0%) | 35 (39.8%) |
| 2 or 3 Rooms | 8 (1.2%) | 28 (31.8%) |
| 4 or 5 Rooms | 122 (18.0%) | 11 (12.5%) |
| 6 or 7 Rooms | 329 (48.6%) | 4 (4.5%) |
| 8 or more Rooms | 218 (32.2%) | 10 (11.4%) |
| Total | 677 (100.0%) | 88 (100.0%) |
Housing Structure by Heating Type in Higganum
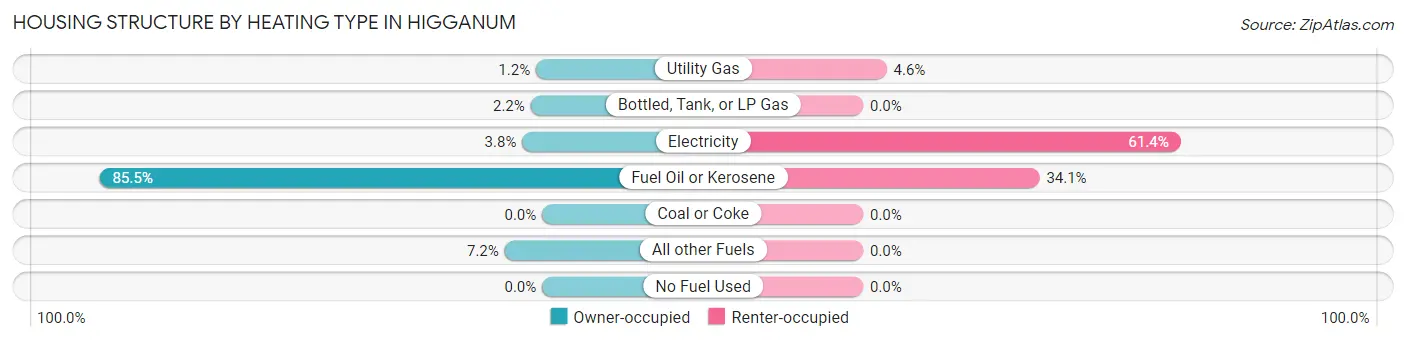
| Heating Type | Owner-occupied | Renter-occupied |
| Utility Gas | 8 (1.2%) | 4 (4.5%) |
| Bottled, Tank, or LP Gas | 15 (2.2%) | 0 (0.0%) |
| Electricity | 26 (3.8%) | 54 (61.4%) |
| Fuel Oil or Kerosene | 579 (85.5%) | 30 (34.1%) |
| Coal or Coke | 0 (0.0%) | 0 (0.0%) |
| All other Fuels | 49 (7.2%) | 0 (0.0%) |
| No Fuel Used | 0 (0.0%) | 0 (0.0%) |
| Total | 677 (100.0%) | 88 (100.0%) |
Household Vehicle Usage in Higganum
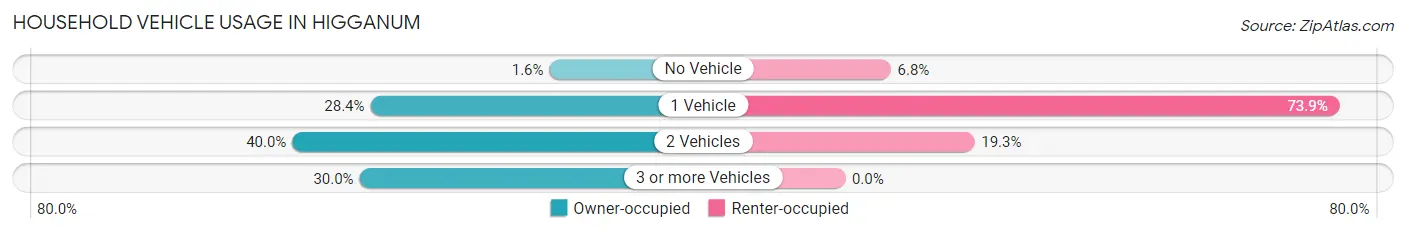
| Vehicles per Household | Owner-occupied | Renter-occupied |
| No Vehicle | 11 (1.6%) | 6 (6.8%) |
| 1 Vehicle | 192 (28.4%) | 65 (73.9%) |
| 2 Vehicles | 271 (40.0%) | 17 (19.3%) |
| 3 or more Vehicles | 203 (30.0%) | 0 (0.0%) |
| Total | 677 (100.0%) | 88 (100.0%) |
Real Estate & Mortgages in Higganum
Real Estate and Mortgage Overview in Higganum
| Characteristic | Without Mortgage | With Mortgage |
| Housing Units | 198 | 479 |
| Median Property Value | $476,000 | $353,100 |
| Median Household Income | $119,722 | $217 |
| Monthly Housing Costs | $1,139 | $102 |
| Real Estate Taxes | $8,056 | $0 |
Property Value by Mortgage Status in Higganum
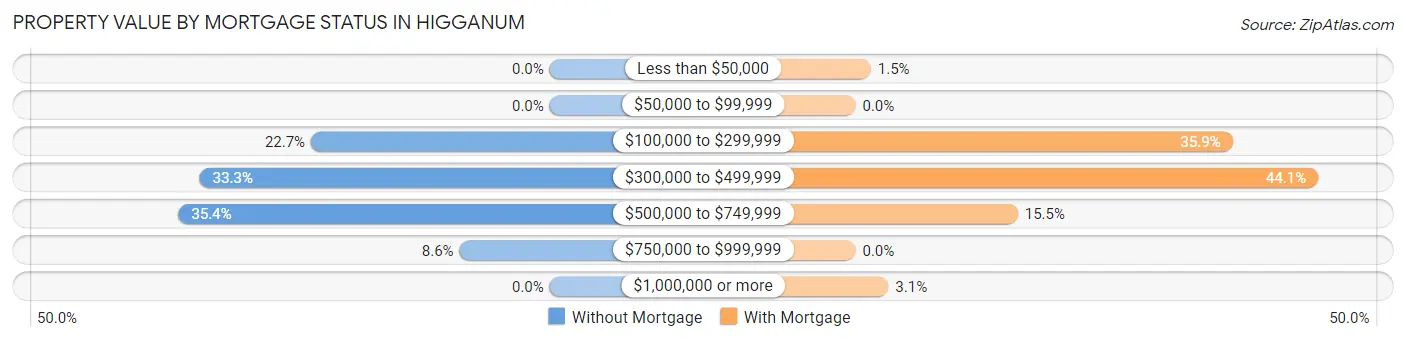
| Property Value | Without Mortgage | With Mortgage |
| Less than $50,000 | 0 (0.0%) | 7 (1.5%) |
| $50,000 to $99,999 | 0 (0.0%) | 0 (0.0%) |
| $100,000 to $299,999 | 45 (22.7%) | 172 (35.9%) |
| $300,000 to $499,999 | 66 (33.3%) | 211 (44.1%) |
| $500,000 to $749,999 | 70 (35.3%) | 74 (15.4%) |
| $750,000 to $999,999 | 17 (8.6%) | 0 (0.0%) |
| $1,000,000 or more | 0 (0.0%) | 15 (3.1%) |
| Total | 198 (100.0%) | 479 (100.0%) |
Household Income by Mortgage Status in Higganum
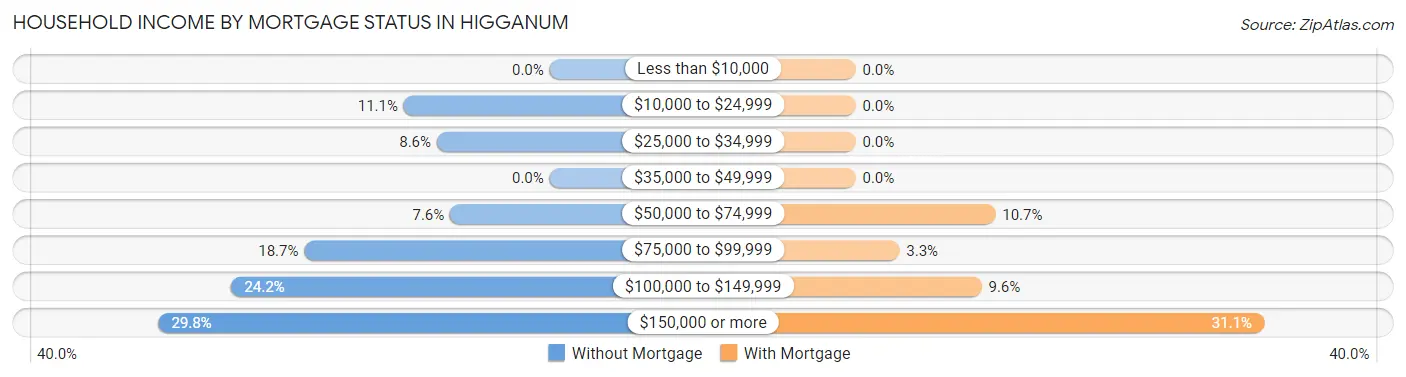
| Household Income | Without Mortgage | With Mortgage |
| Less than $10,000 | 0 (0.0%) | 0 (0.0%) |
| $10,000 to $24,999 | 22 (11.1%) | 0 (0.0%) |
| $25,000 to $34,999 | 17 (8.6%) | 0 (0.0%) |
| $35,000 to $49,999 | 0 (0.0%) | 0 (0.0%) |
| $50,000 to $74,999 | 15 (7.6%) | 51 (10.6%) |
| $75,000 to $99,999 | 37 (18.7%) | 16 (3.3%) |
| $100,000 to $149,999 | 48 (24.2%) | 46 (9.6%) |
| $150,000 or more | 59 (29.8%) | 149 (31.1%) |
| Total | 198 (100.0%) | 479 (100.0%) |
Property Value to Household Income Ratio in Higganum
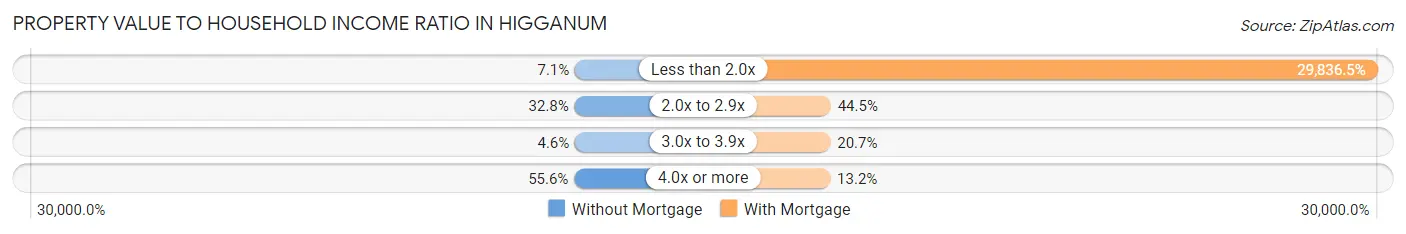
| Value-to-Income Ratio | Without Mortgage | With Mortgage |
| Less than 2.0x | 14 (7.1%) | 142,917 (29,836.5%) |
| 2.0x to 2.9x | 65 (32.8%) | 213 (44.5%) |
| 3.0x to 3.9x | 9 (4.5%) | 99 (20.7%) |
| 4.0x or more | 110 (55.6%) | 63 (13.2%) |
| Total | 198 (100.0%) | 479 (100.0%) |
Real Estate Taxes by Mortgage Status in Higganum
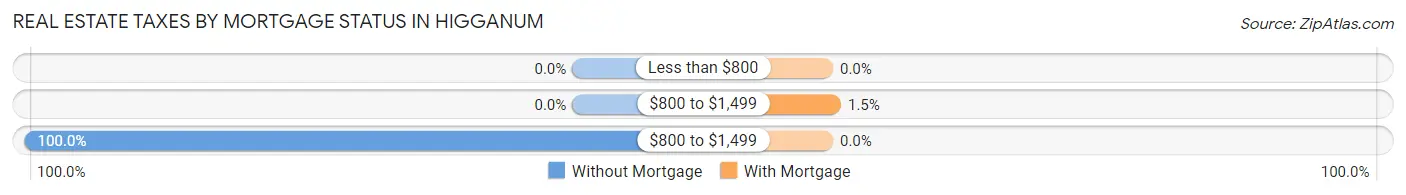
| Property Taxes | Without Mortgage | With Mortgage |
| Less than $800 | 0 (0.0%) | 0 (0.0%) |
| $800 to $1,499 | 0 (0.0%) | 7 (1.5%) |
| $800 to $1,499 | 198 (100.0%) | 0 (0.0%) |
| Total | 198 (100.0%) | 479 (100.0%) |
Health & Disability in Higganum
Health Insurance Coverage by Age in Higganum
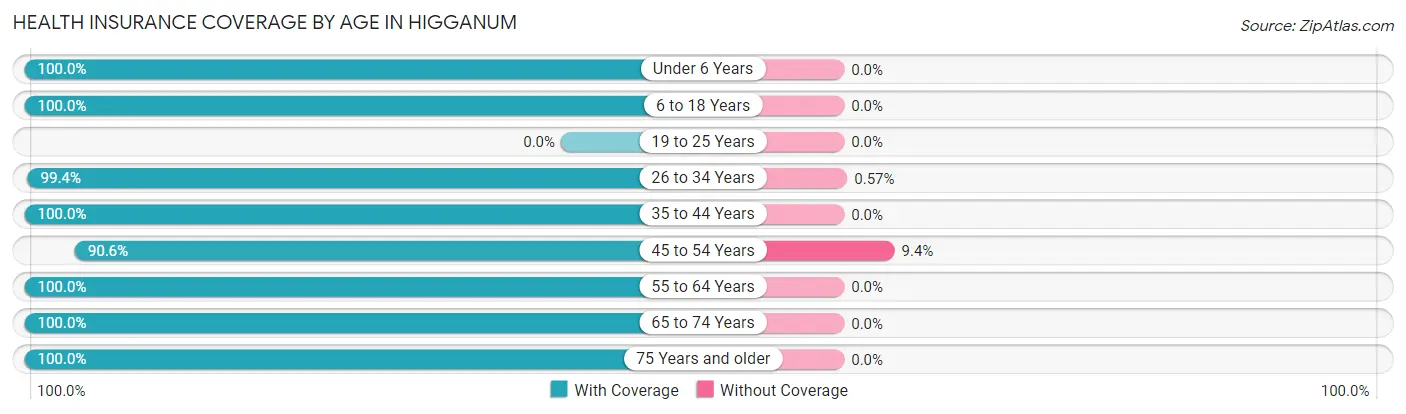
| Age Bracket | With Coverage | Without Coverage |
| Under 6 Years | 27 (100.0%) | 0 (0.0%) |
| 6 to 18 Years | 334 (100.0%) | 0 (0.0%) |
| 19 to 25 Years | 0 (0.0%) | 0 (0.0%) |
| 26 to 34 Years | 174 (99.4%) | 1 (0.6%) |
| 35 to 44 Years | 351 (100.0%) | 0 (0.0%) |
| 45 to 54 Years | 174 (90.6%) | 18 (9.4%) |
| 55 to 64 Years | 235 (100.0%) | 0 (0.0%) |
| 65 to 74 Years | 299 (100.0%) | 0 (0.0%) |
| 75 Years and older | 80 (100.0%) | 0 (0.0%) |
| Total | 1,674 (98.9%) | 19 (1.1%) |
Health Insurance Coverage by Citizenship Status in Higganum
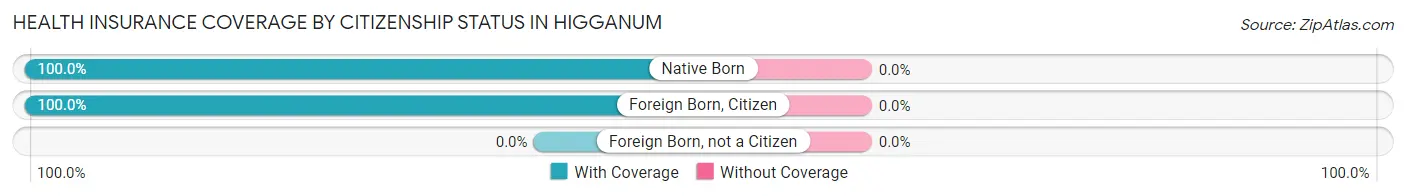
| Citizenship Status | With Coverage | Without Coverage |
| Native Born | 27 (100.0%) | 0 (0.0%) |
| Foreign Born, Citizen | 334 (100.0%) | 0 (0.0%) |
| Foreign Born, not a Citizen | 0 (0.0%) | 0 (0.0%) |
Health Insurance Coverage by Household Income in Higganum
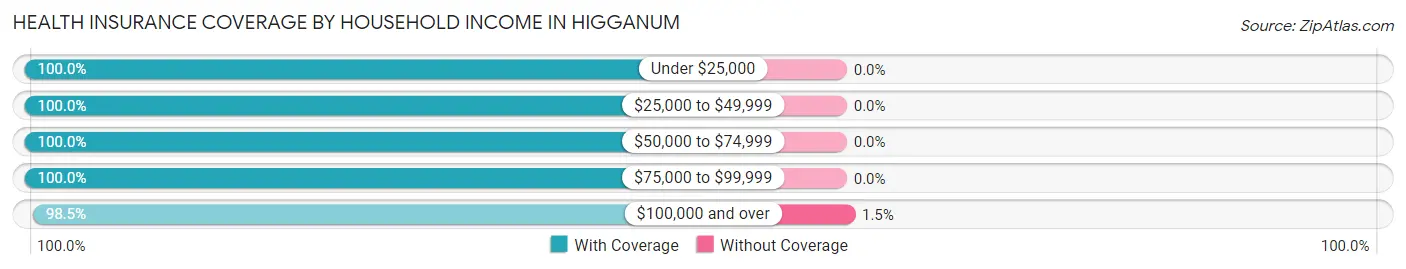
| Household Income | With Coverage | Without Coverage |
| Under $25,000 | 86 (100.0%) | 0 (0.0%) |
| $25,000 to $49,999 | 163 (100.0%) | 0 (0.0%) |
| $50,000 to $74,999 | 66 (100.0%) | 0 (0.0%) |
| $75,000 to $99,999 | 200 (100.0%) | 0 (0.0%) |
| $100,000 and over | 1,154 (98.5%) | 18 (1.5%) |
Public vs Private Health Insurance Coverage by Age in Higganum
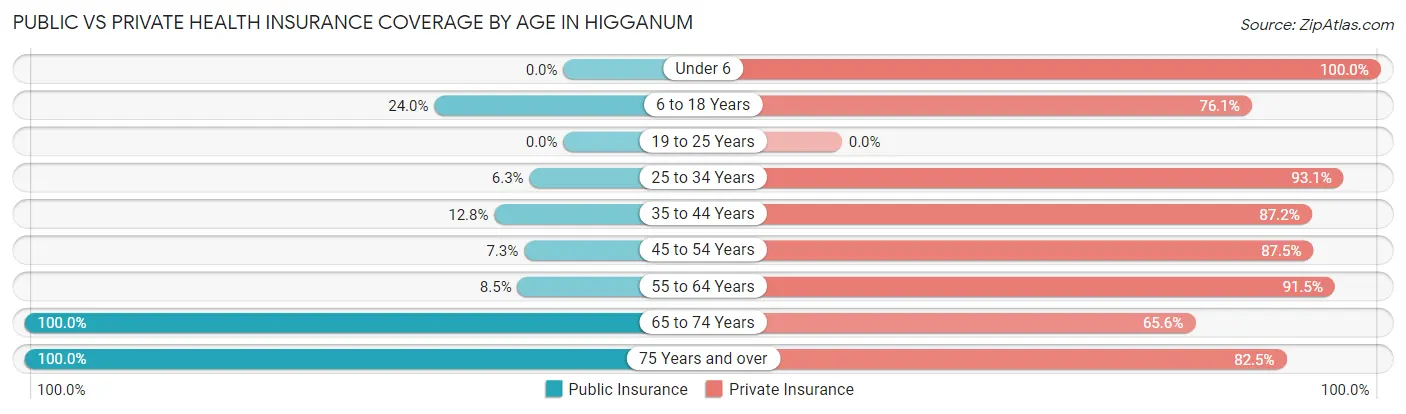
| Age Bracket | Public Insurance | Private Insurance |
| Under 6 | 0 (0.0%) | 27 (100.0%) |
| 6 to 18 Years | 80 (23.9%) | 254 (76.0%) |
| 19 to 25 Years | 0 (0.0%) | 0 (0.0%) |
| 25 to 34 Years | 11 (6.3%) | 163 (93.1%) |
| 35 to 44 Years | 45 (12.8%) | 306 (87.2%) |
| 45 to 54 Years | 14 (7.3%) | 168 (87.5%) |
| 55 to 64 Years | 20 (8.5%) | 215 (91.5%) |
| 65 to 74 Years | 299 (100.0%) | 196 (65.5%) |
| 75 Years and over | 80 (100.0%) | 66 (82.5%) |
| Total | 549 (32.4%) | 1,395 (82.4%) |
Disability Status by Sex by Age in Higganum
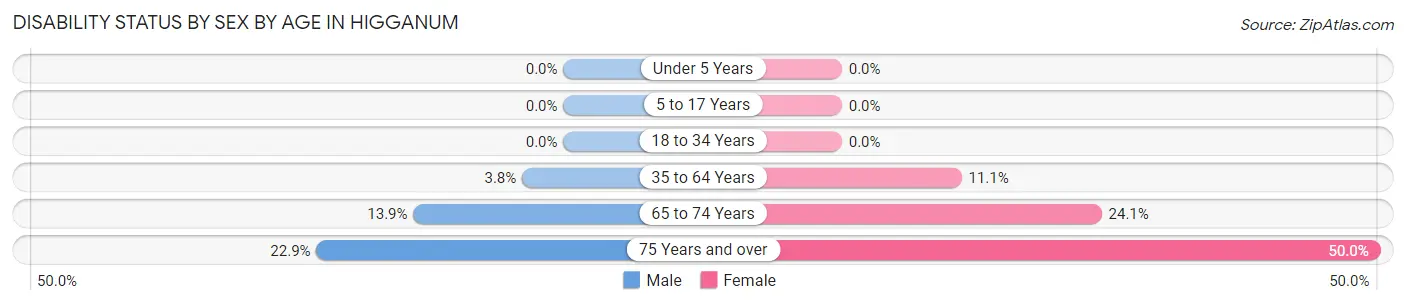
| Age Bracket | Male | Female |
| Under 5 Years | 0 (0.0%) | 0 (0.0%) |
| 5 to 17 Years | 0 (0.0%) | 0 (0.0%) |
| 18 to 34 Years | 0 (0.0%) | 0 (0.0%) |
| 35 to 64 Years | 16 (3.8%) | 40 (11.1%) |
| 65 to 74 Years | 22 (13.9%) | 34 (24.1%) |
| 75 Years and over | 11 (22.9%) | 16 (50.0%) |
Disability Class by Sex by Age in Higganum
Disability Class: Hearing Difficulty
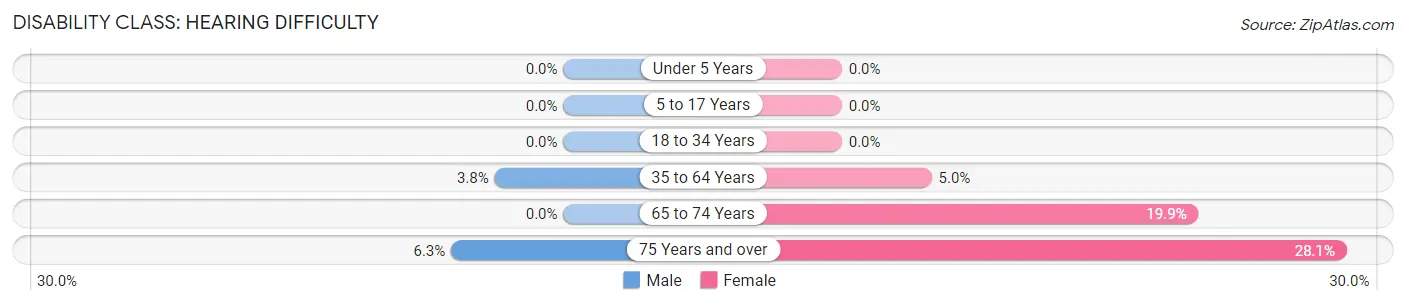
| Age Bracket | Male | Female |
| Under 5 Years | 0 (0.0%) | 0 (0.0%) |
| 5 to 17 Years | 0 (0.0%) | 0 (0.0%) |
| 18 to 34 Years | 0 (0.0%) | 0 (0.0%) |
| 35 to 64 Years | 16 (3.8%) | 18 (5.0%) |
| 65 to 74 Years | 0 (0.0%) | 28 (19.9%) |
| 75 Years and over | 3 (6.2%) | 9 (28.1%) |
Disability Class: Vision Difficulty
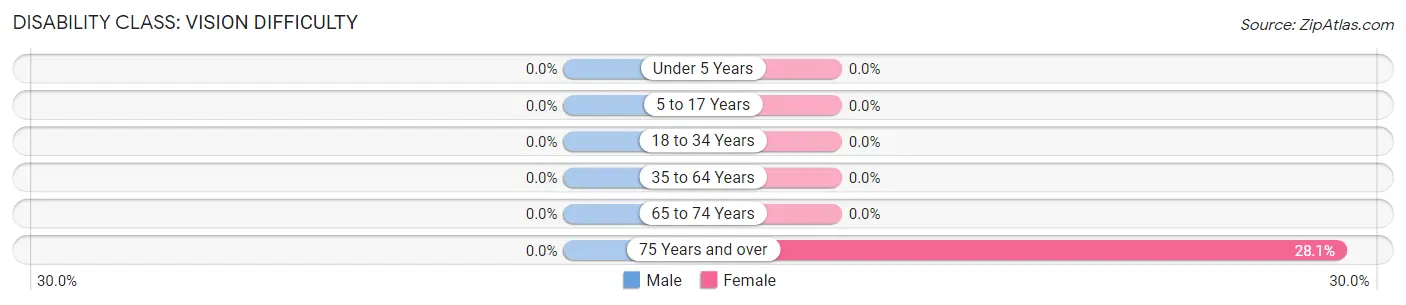
| Age Bracket | Male | Female |
| Under 5 Years | 0 (0.0%) | 0 (0.0%) |
| 5 to 17 Years | 0 (0.0%) | 0 (0.0%) |
| 18 to 34 Years | 0 (0.0%) | 0 (0.0%) |
| 35 to 64 Years | 0 (0.0%) | 0 (0.0%) |
| 65 to 74 Years | 0 (0.0%) | 0 (0.0%) |
| 75 Years and over | 0 (0.0%) | 9 (28.1%) |
Disability Class: Cognitive Difficulty
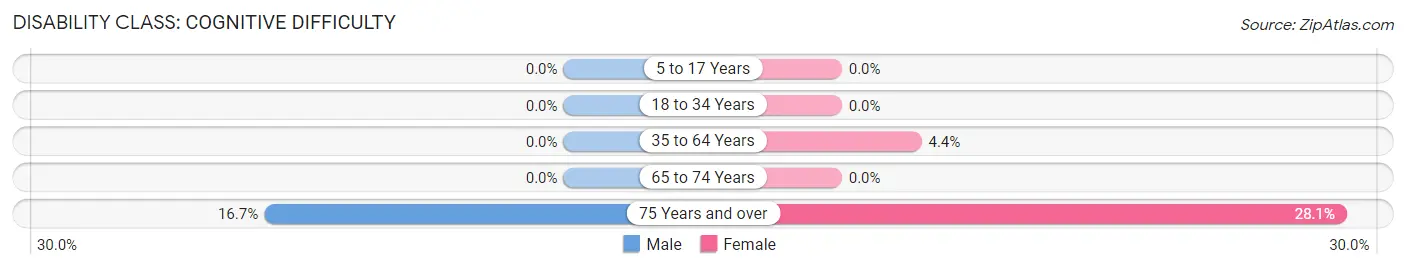
| Age Bracket | Male | Female |
| 5 to 17 Years | 0 (0.0%) | 0 (0.0%) |
| 18 to 34 Years | 0 (0.0%) | 0 (0.0%) |
| 35 to 64 Years | 0 (0.0%) | 16 (4.4%) |
| 65 to 74 Years | 0 (0.0%) | 0 (0.0%) |
| 75 Years and over | 8 (16.7%) | 9 (28.1%) |
Disability Class: Ambulatory Difficulty
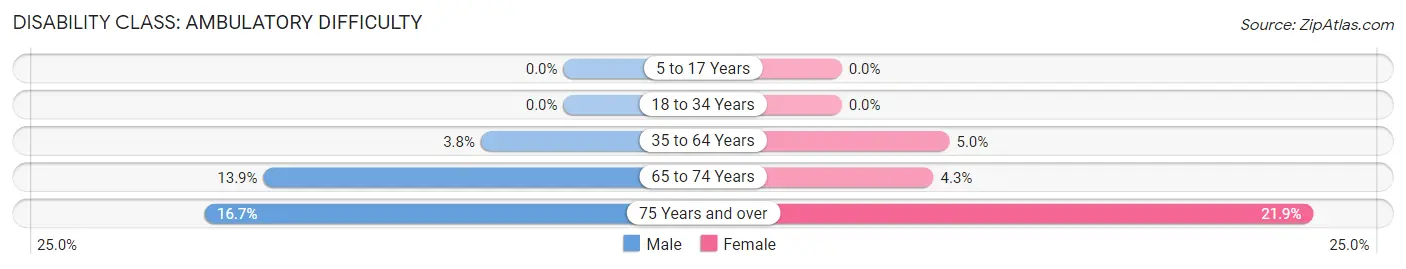
| Age Bracket | Male | Female |
| 5 to 17 Years | 0 (0.0%) | 0 (0.0%) |
| 18 to 34 Years | 0 (0.0%) | 0 (0.0%) |
| 35 to 64 Years | 16 (3.8%) | 18 (5.0%) |
| 65 to 74 Years | 22 (13.9%) | 6 (4.3%) |
| 75 Years and over | 8 (16.7%) | 7 (21.9%) |
Disability Class: Self-Care Difficulty
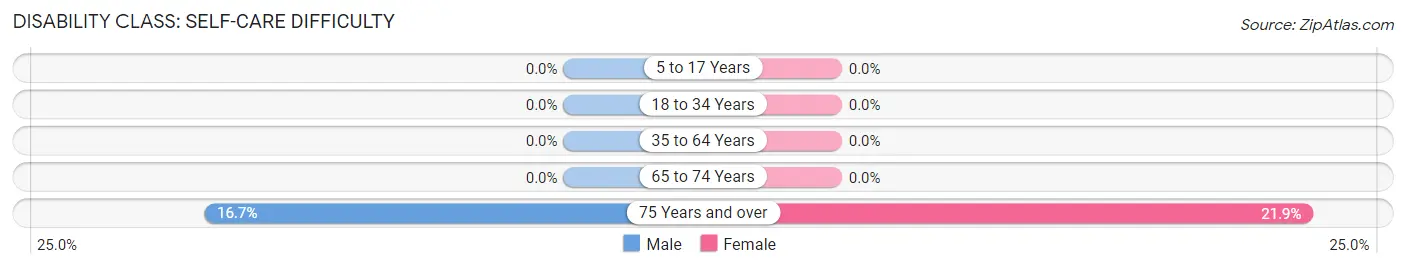
| Age Bracket | Male | Female |
| 5 to 17 Years | 0 (0.0%) | 0 (0.0%) |
| 18 to 34 Years | 0 (0.0%) | 0 (0.0%) |
| 35 to 64 Years | 0 (0.0%) | 0 (0.0%) |
| 65 to 74 Years | 0 (0.0%) | 0 (0.0%) |
| 75 Years and over | 8 (16.7%) | 7 (21.9%) |
Technology Access in Higganum
Computing Device Access in Higganum
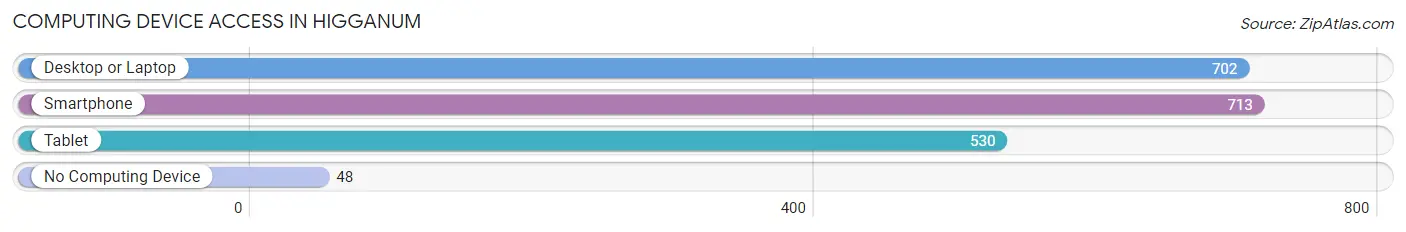
| Device Type | # Households | % Households |
| Desktop or Laptop | 702 | 91.8% |
| Smartphone | 713 | 93.2% |
| Tablet | 530 | 69.3% |
| No Computing Device | 48 | 6.3% |
| Total | 765 | 100.0% |
Internet Access in Higganum
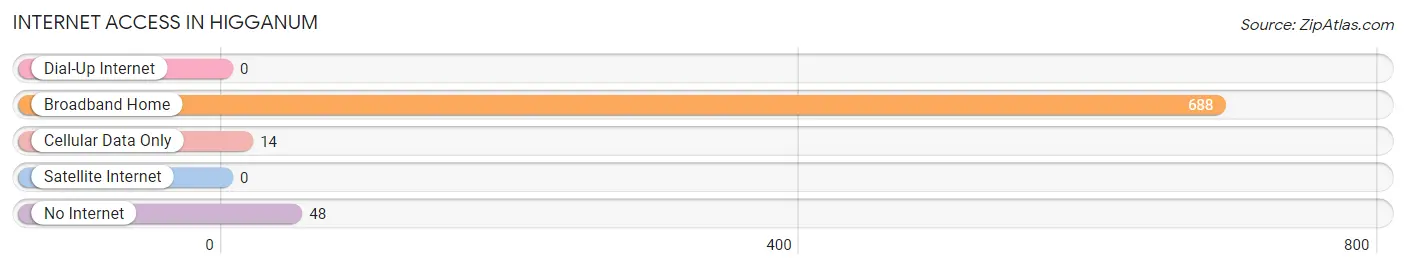
| Internet Type | # Households | % Households |
| Dial-Up Internet | 0 | 0.0% |
| Broadband Home | 688 | 89.9% |
| Cellular Data Only | 14 | 1.8% |
| Satellite Internet | 0 | 0.0% |
| No Internet | 48 | 6.3% |
| Total | 765 | 100.0% |
Higganum Summary
HIGGANUM CONNECTICUT
History
The town of Higganum, Connecticut is located in the southeastern corner of the state, in Middlesex County. It is bordered by the towns of Haddam, Killingworth, and East Hampton. The town was originally part of Haddam, and was known as “Haddam Quarter” until it was incorporated as its own town in 1721. The town was named after the Higganum River, which runs through the town.
The town was originally a farming community, and the main crops were corn, wheat, and hay. The town also had a number of sawmills, gristmills, and tanneries. The town was also home to a number of small industries, including a paper mill, a blacksmith shop, and a carriage shop.
The town was also home to a number of prominent citizens, including Revolutionary War hero General Israel Putnam, who was born in the town in 1718. The town was also home to the first female doctor in the United States, Dr. Elizabeth Blackwell, who was born in the town in 1821.
Geography
The town of Higganum is located in the southeastern corner of Connecticut, in Middlesex County. It is bordered by the towns of Haddam, Killingworth, and East Hampton. The town covers an area of approximately 16.5 square miles, and is located in the Connecticut River Valley.
The town is located in a hilly region, with the highest point in the town being the summit of Higganum Hill, which is located at an elevation of 590 feet. The town is also home to several small lakes, including Higganum Pond, which is the largest lake in the town.
The town is located in a temperate climate, with hot, humid summers and cold, snowy winters. The average annual temperature is around 50 degrees Fahrenheit, and the average annual precipitation is around 40 inches.
Economy
The economy of Higganum is largely based on agriculture and tourism. The town is home to several farms, which produce a variety of crops, including corn, wheat, hay, and vegetables. The town is also home to several wineries, which produce a variety of wines.
The town is also home to several small businesses, including restaurants, retail stores, and professional services. The town is also home to a number of manufacturing companies, which produce a variety of products, including furniture, clothing, and electronics.
Demographics
As of the 2010 census, the town of Higganum had a population of 4,719. The population is largely white (94.3%), with small percentages of African American (2.2%), Asian (1.2%), and Hispanic (1.3%) residents. The median household income is $76,944, and the median home value is $269,400.
The town is served by the Higganum Public Schools, which includes two elementary schools, one middle school, and one high school. The town is also home to a number of private schools, including the Higganum Academy of Arts and Sciences.
Conclusion
The town of Higganum, Connecticut is a small, rural town located in the southeastern corner of the state. The town is largely agricultural, with a number of small businesses and industries. The town is also home to a number of prominent citizens, including Revolutionary War hero General Israel Putnam and the first female doctor in the United States, Dr. Elizabeth Blackwell. The town is served by the Higganum Public Schools, and is home to a number of private schools. The town has a population of 4,719, and the median household income is $76,944.
Common Questions
What is Per Capita Income in Higganum?
Per Capita income in Higganum is $66,044.
What is the Median Family Income in Higganum?
Median Family Income in Higganum is $143,565.
What is the Median Household income in Higganum?
Median Household Income in Higganum is $130,411.
What is Income or Wage Gap in Higganum?
Income or Wage Gap in Higganum is 26.7%.
Women in Higganum earn 73.3 cents for every dollar earned by a man.
What is Inequality or Gini Index in Higganum?
Inequality or Gini Index in Higganum is 0.38.
What is the Total Population of Higganum?
Total Population of Higganum is 1,693.
What is the Total Male Population of Higganum?
Total Male Population of Higganum is 963.
What is the Total Female Population of Higganum?
Total Female Population of Higganum is 730.
What is the Ratio of Males per 100 Females in Higganum?
There are 131.92 Males per 100 Females in Higganum.
What is the Ratio of Females per 100 Males in Higganum?
There are 75.80 Females per 100 Males in Higganum.
What is the Median Population Age in Higganum?
Median Population Age in Higganum is 43.2 Years.
What is the Average Family Size in Higganum
Average Family Size in Higganum is 2.5 People.
What is the Average Household Size in Higganum
Average Household Size in Higganum is 2.2 People.
How Large is the Labor Force in Higganum?
There are 932 People in the Labor Forcein in Higganum.
What is the Percentage of People in the Labor Force in Higganum?
69.0% of People are in the Labor Force in Higganum.