Bristol, CT Map & Demographics
Bristol Map
Bristol Overview
$40,984
PER CAPITA INCOME
$102,677
AVG FAMILY INCOME
$82,094
AVG HOUSEHOLD INCOME
26.1%
WAGE / INCOME GAP [ % ]
73.9¢/ $1
WAGE / INCOME GAP [ $ ]
$11,531
FAMILY INCOME DEFICIT
0.41
INEQUALITY / GINI INDEX
61,052
TOTAL POPULATION
30,245
MALE POPULATION
30,807
FEMALE POPULATION
98.18
MALES / 100 FEMALES
101.86
FEMALES / 100 MALES
37.5
MEDIAN AGE
3.1
AVG FAMILY SIZE
2.5
AVG HOUSEHOLD SIZE
35,283
LABOR FORCE [ PEOPLE ]
71.0%
PERCENT IN LABOR FORCE
6.6%
UNEMPLOYMENT RATE
Bristol Zip Codes
Bristol Area Codes
Income in Bristol
Income Overview in Bristol
Per Capita Income in Bristol is $40,984, while median incomes of families and households are $102,677 and $82,094 respectively.
| Characteristic | Number | Measure |
| Per Capita Income | 61,052 | $40,984 |
| Median Family Income | 15,221 | $102,677 |
| Mean Family Income | 15,221 | $117,638 |
| Median Household Income | 24,076 | $82,094 |
| Mean Household Income | 24,076 | $99,057 |
| Income Deficit | 15,221 | $11,531 |
| Wage / Income Gap (%) | 61,052 | 26.08% |
| Wage / Income Gap ($) | 61,052 | 73.92¢ per $1 |
| Gini / Inequality Index | 61,052 | 0.41 |
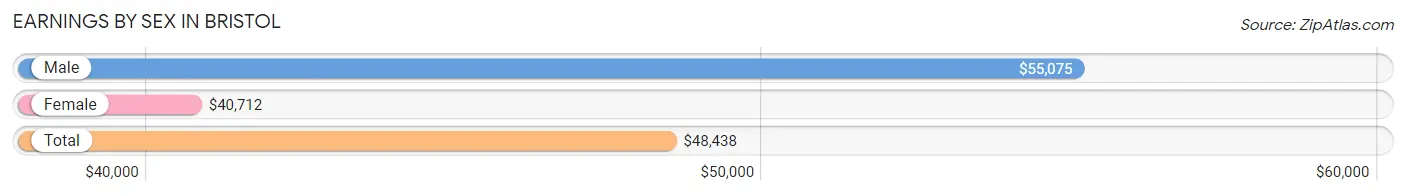
Earnings by Sex in Bristol
Average Earnings in Bristol are $48,438, $55,075 for men and $40,712 for women, a difference of 26.1%.
| Sex | Number | Average Earnings |
| Male | 18,584 (52.2%) | $55,075 |
| Female | 17,047 (47.8%) | $40,712 |
| Total | 35,631 (100.0%) | $48,438 |
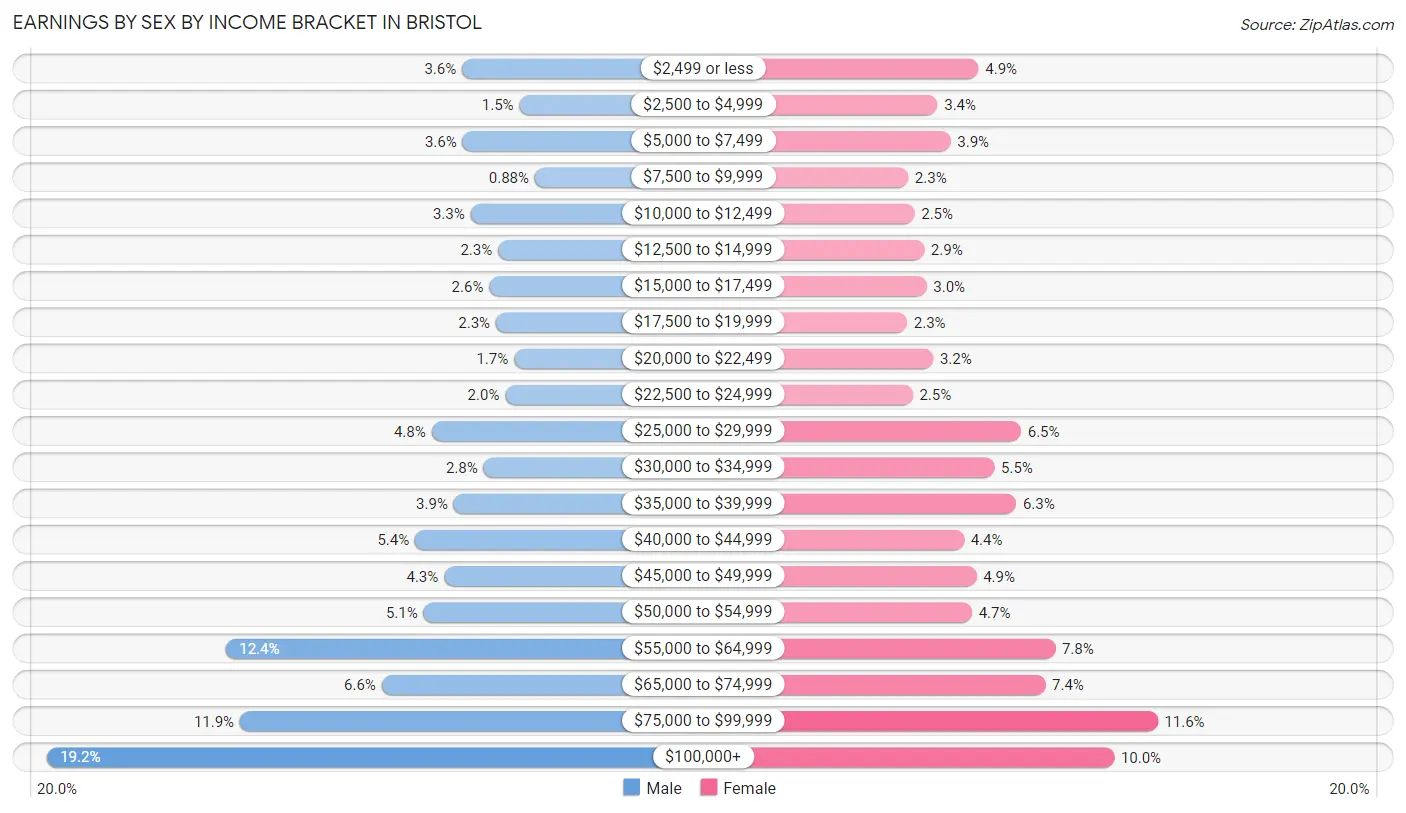
Earnings by Sex by Income Bracket in Bristol
The most common earnings brackets in Bristol are $100,000+ for men (3,558 | 19.2%) and $75,000 to $99,999 for women (1,985 | 11.6%).
| Income | Male | Female |
| $2,499 or less | 670 (3.6%) | 841 (4.9%) |
| $2,500 to $4,999 | 272 (1.5%) | 578 (3.4%) |
| $5,000 to $7,499 | 667 (3.6%) | 661 (3.9%) |
| $7,500 to $9,999 | 164 (0.9%) | 390 (2.3%) |
| $10,000 to $12,499 | 611 (3.3%) | 432 (2.5%) |
| $12,500 to $14,999 | 420 (2.3%) | 493 (2.9%) |
| $15,000 to $17,499 | 482 (2.6%) | 508 (3.0%) |
| $17,500 to $19,999 | 434 (2.3%) | 383 (2.2%) |
| $20,000 to $22,499 | 309 (1.7%) | 551 (3.2%) |
| $22,500 to $24,999 | 370 (2.0%) | 420 (2.5%) |
| $25,000 to $29,999 | 883 (4.8%) | 1,112 (6.5%) |
| $30,000 to $34,999 | 521 (2.8%) | 941 (5.5%) |
| $35,000 to $39,999 | 729 (3.9%) | 1,080 (6.3%) |
| $40,000 to $44,999 | 998 (5.4%) | 746 (4.4%) |
| $45,000 to $49,999 | 796 (4.3%) | 826 (4.9%) |
| $50,000 to $54,999 | 939 (5.1%) | 798 (4.7%) |
| $55,000 to $64,999 | 2,312 (12.4%) | 1,329 (7.8%) |
| $65,000 to $74,999 | 1,231 (6.6%) | 1,266 (7.4%) |
| $75,000 to $99,999 | 2,218 (11.9%) | 1,985 (11.6%) |
| $100,000+ | 3,558 (19.2%) | 1,707 (10.0%) |
| Total | 18,584 (100.0%) | 17,047 (100.0%) |
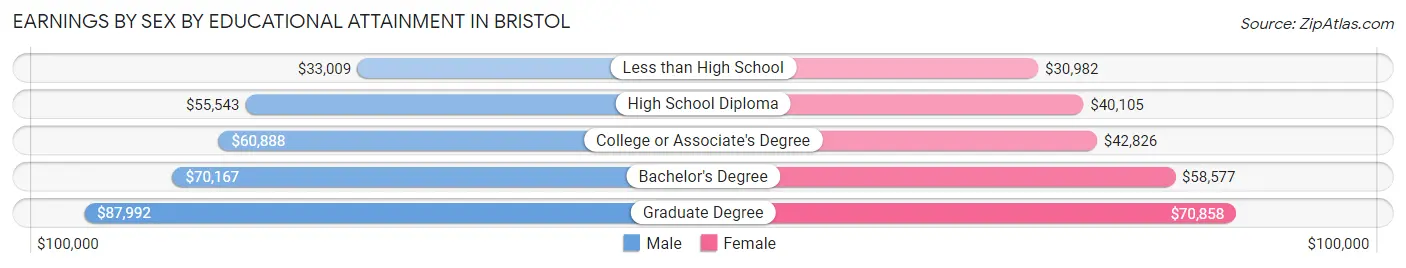
Earnings by Sex by Educational Attainment in Bristol
Average earnings in Bristol are $59,291 for men and $48,295 for women, a difference of 18.5%. Men with an educational attainment of graduate degree enjoy the highest average annual earnings of $87,992, while those with less than high school education earn the least with $33,009. Women with an educational attainment of graduate degree earn the most with the average annual earnings of $70,858, while those with less than high school education have the smallest earnings of $30,982.
| Educational Attainment | Male Income | Female Income |
| Less than High School | $33,009 | $30,982 |
| High School Diploma | $55,543 | $40,105 |
| College or Associate's Degree | $60,888 | $42,826 |
| Bachelor's Degree | $70,167 | $58,577 |
| Graduate Degree | $87,992 | $70,858 |
| Total | $59,291 | $48,295 |
Family Income in Bristol
Family Income Brackets in Bristol
According to the Bristol family income data, there are 3,790 families falling into the $100,000 to $149,999 income range, which is the most common income bracket and makes up 24.9% of all families. Conversely, the $10,000 to $14,999 income bracket is the least frequent group with only 107 families (0.7%) belonging to this category.
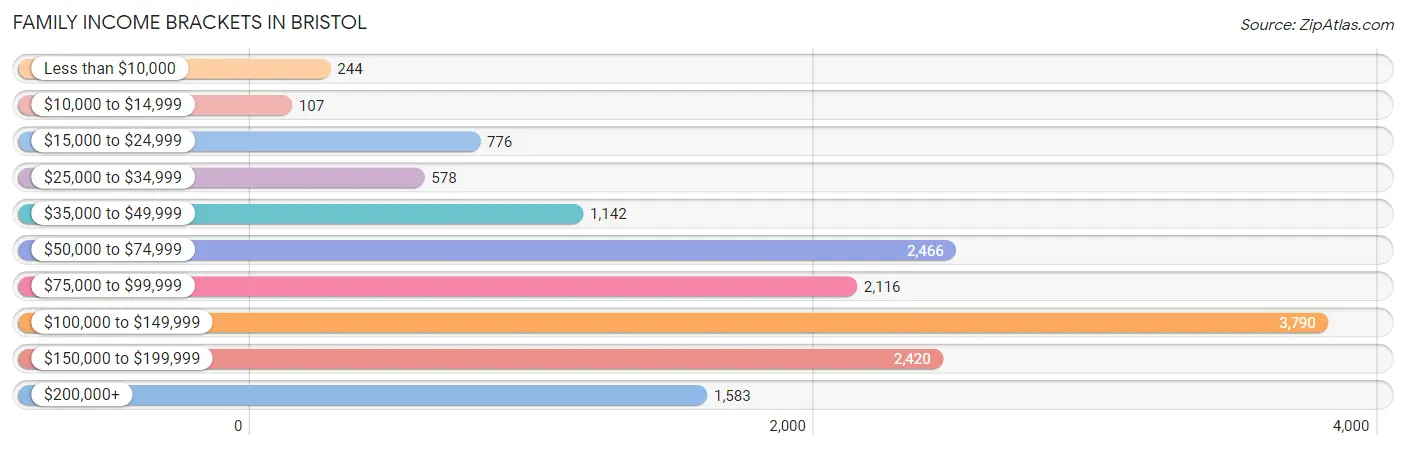
| Income Bracket | # Families | % Families |
| Less than $10,000 | 244 | 1.6% |
| $10,000 to $14,999 | 107 | 0.7% |
| $15,000 to $24,999 | 776 | 5.1% |
| $25,000 to $34,999 | 578 | 3.8% |
| $35,000 to $49,999 | 1,142 | 7.5% |
| $50,000 to $74,999 | 2,466 | 16.2% |
| $75,000 to $99,999 | 2,116 | 13.9% |
| $100,000 to $149,999 | 3,790 | 24.9% |
| $150,000 to $199,999 | 2,420 | 15.9% |
| $200,000+ | 1,583 | 10.4% |
Family Income by Famaliy Size in Bristol
6-person families (195 | 1.3%) account for the highest median family income in Bristol with $160,898 per family, while 2-person families (6,932 | 45.5%) have the highest median income of $42,236 per family member.
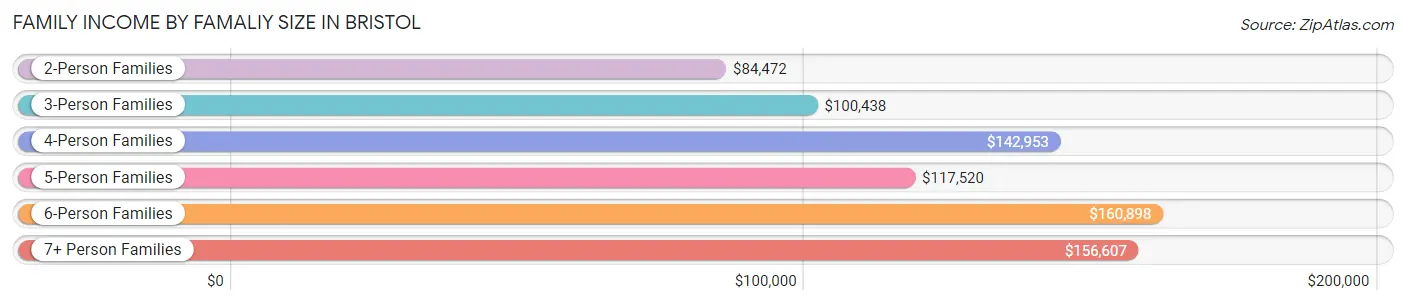
| Income Bracket | # Families | Median Income |
| 2-Person Families | 6,932 (45.5%) | $84,472 |
| 3-Person Families | 3,574 (23.5%) | $100,438 |
| 4-Person Families | 3,503 (23.0%) | $142,953 |
| 5-Person Families | 883 (5.8%) | $117,520 |
| 6-Person Families | 195 (1.3%) | $160,898 |
| 7+ Person Families | 134 (0.9%) | $156,607 |
| Total | 15,221 (100.0%) | $102,677 |
Family Income by Number of Earners in Bristol
The median family income in Bristol is $102,677, with families comprising 3+ earners (2,139) having the highest median family income of $155,056, while families with no earners (1,876) have the lowest median family income of $49,563, accounting for 14.1% and 12.3% of families, respectively.
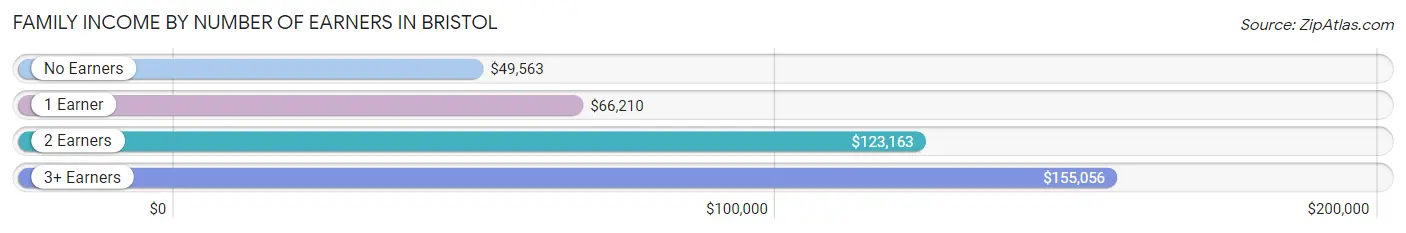
| Number of Earners | # Families | Median Income |
| No Earners | 1,876 (12.3%) | $49,563 |
| 1 Earner | 3,848 (25.3%) | $66,210 |
| 2 Earners | 7,358 (48.3%) | $123,163 |
| 3+ Earners | 2,139 (14.1%) | $155,056 |
| Total | 15,221 (100.0%) | $102,677 |
Household Income in Bristol
Household Income Brackets in Bristol
With 4,815 households falling in the category, the $100,000 to $149,999 income range is the most frequent in Bristol, accounting for 20.0% of all households. In contrast, only 795 households (3.3%) fall into the $10,000 to $14,999 income bracket, making it the least populous group.
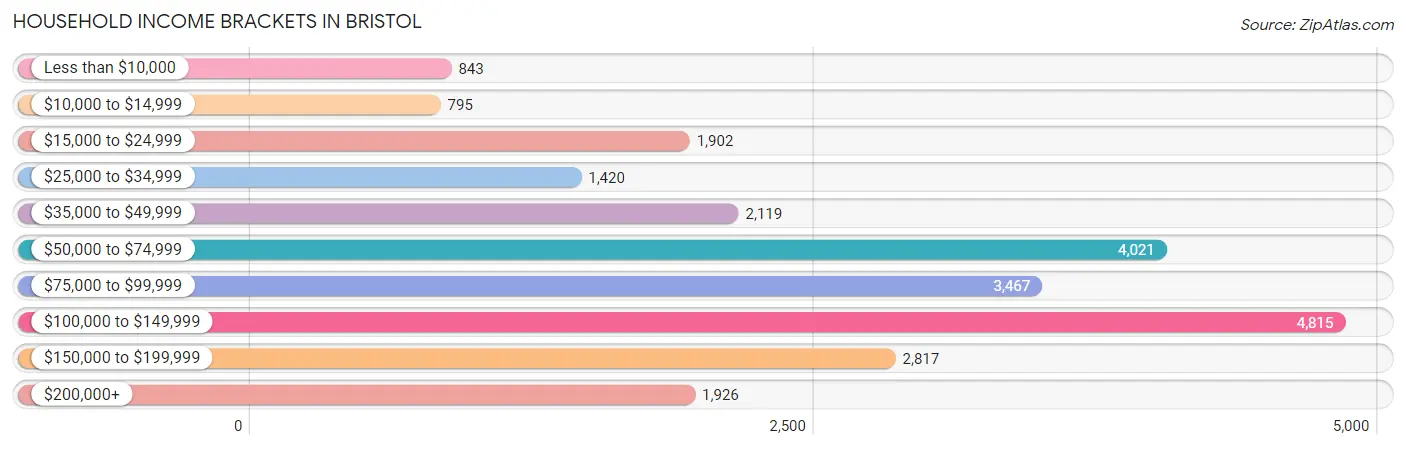
| Income Bracket | # Households | % Households |
| Less than $10,000 | 843 | 3.5% |
| $10,000 to $14,999 | 795 | 3.3% |
| $15,000 to $24,999 | 1,902 | 7.9% |
| $25,000 to $34,999 | 1,420 | 5.9% |
| $35,000 to $49,999 | 2,119 | 8.8% |
| $50,000 to $74,999 | 4,021 | 16.7% |
| $75,000 to $99,999 | 3,467 | 14.4% |
| $100,000 to $149,999 | 4,815 | 20.0% |
| $150,000 to $199,999 | 2,817 | 11.7% |
| $200,000+ | 1,926 | 8.0% |
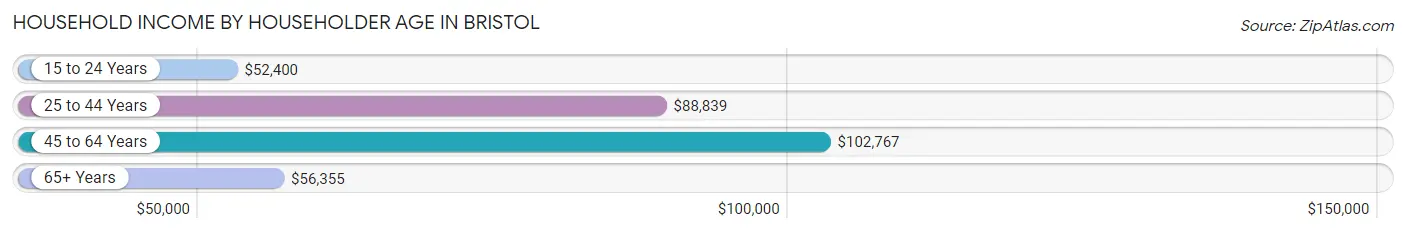
Household Income by Householder Age in Bristol
The median household income in Bristol is $82,094, with the highest median household income of $102,767 found in the 45 to 64 years age bracket for the primary householder. A total of 8,847 households (36.7%) fall into this category. Meanwhile, the 15 to 24 years age bracket for the primary householder has the lowest median household income of $52,400, with 608 households (2.5%) in this group.
| Income Bracket | # Households | Median Income |
| 15 to 24 Years | 608 (2.5%) | $52,400 |
| 25 to 44 Years | 8,771 (36.4%) | $88,839 |
| 45 to 64 Years | 8,847 (36.7%) | $102,767 |
| 65+ Years | 5,850 (24.3%) | $56,355 |
| Total | 24,076 (100.0%) | $82,094 |
Poverty in Bristol
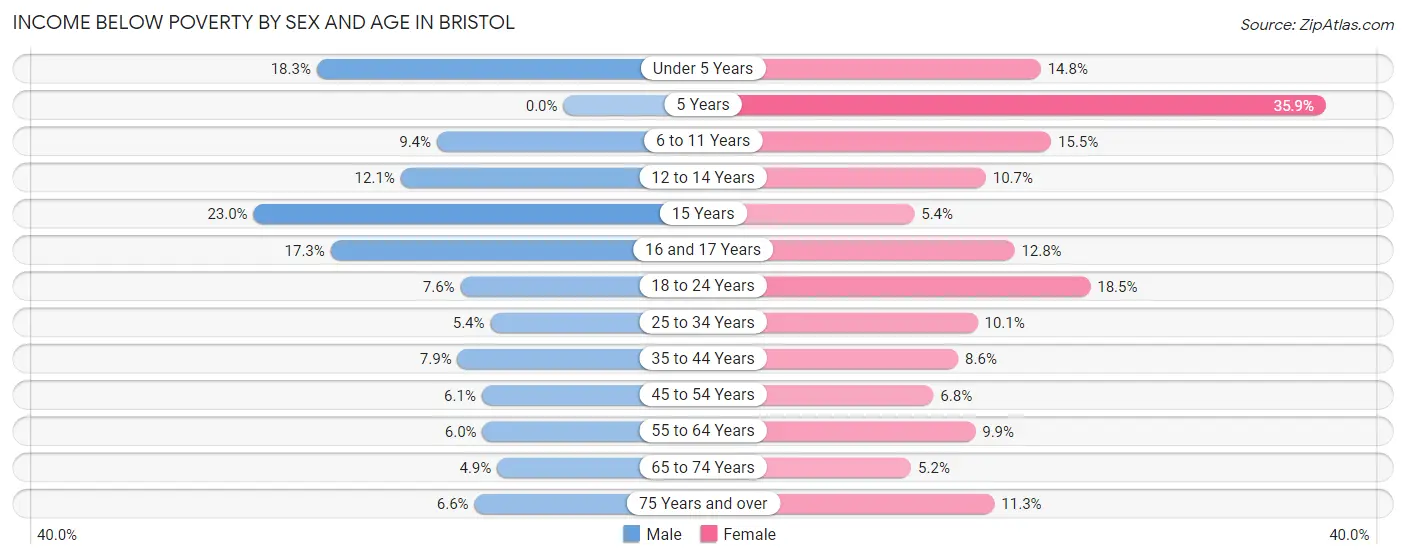
Income Below Poverty by Sex and Age in Bristol
With 8.0% poverty level for males and 10.8% for females among the residents of Bristol, 15 year old males and 5 year old females are the most vulnerable to poverty, with 110 males (23.0%) and 175 females (35.9%) in their respective age groups living below the poverty level.
| Age Bracket | Male | Female |
| Under 5 Years | 262 (18.3%) | 220 (14.8%) |
| 5 Years | 0 (0.0%) | 175 (35.9%) |
| 6 to 11 Years | 173 (9.4%) | 346 (15.5%) |
| 12 to 14 Years | 171 (12.1%) | 138 (10.7%) |
| 15 Years | 110 (23.0%) | 17 (5.4%) |
| 16 and 17 Years | 154 (17.3%) | 96 (12.8%) |
| 18 to 24 Years | 235 (7.6%) | 423 (18.4%) |
| 25 to 34 Years | 249 (5.4%) | 477 (10.1%) |
| 35 to 44 Years | 354 (7.9%) | 330 (8.6%) |
| 45 to 54 Years | 254 (6.1%) | 273 (6.8%) |
| 55 to 64 Years | 208 (6.0%) | 383 (9.9%) |
| 65 to 74 Years | 111 (4.9%) | 151 (5.1%) |
| 75 Years and over | 108 (6.6%) | 247 (11.3%) |
| Total | 2,389 (8.0%) | 3,276 (10.8%) |
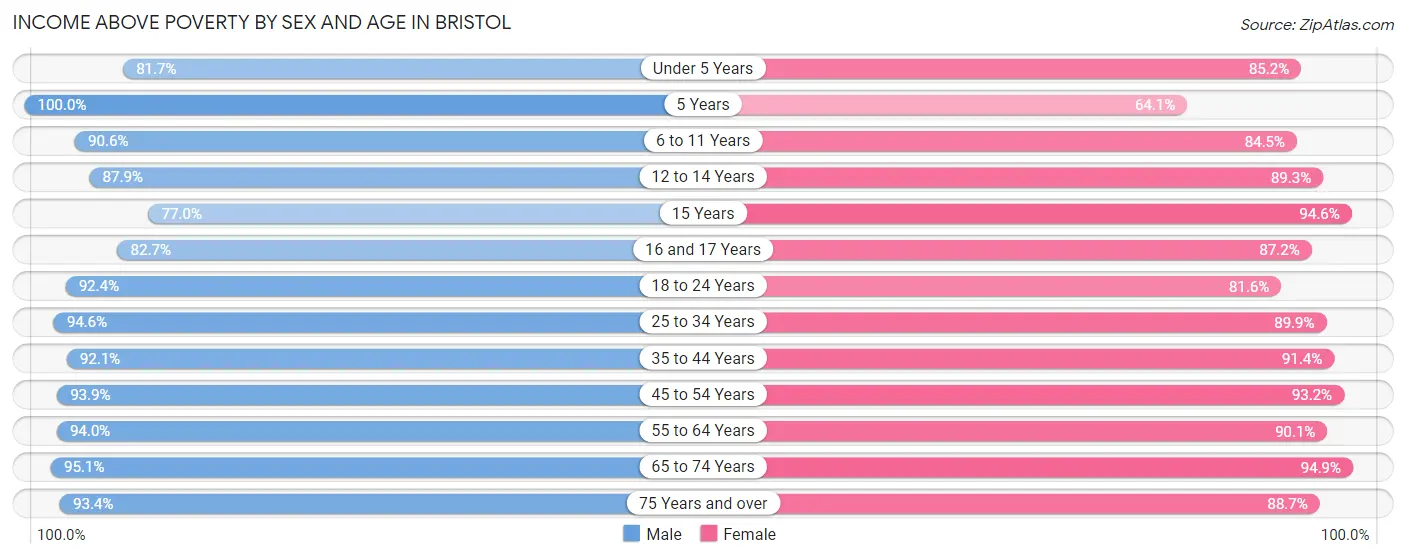
Income Above Poverty by Sex and Age in Bristol
According to the poverty statistics in Bristol, males aged 5 years and females aged 65 to 74 years are the age groups that are most secure financially, with 100.0% of males and 94.9% of females in these age groups living above the poverty line.
| Age Bracket | Male | Female |
| Under 5 Years | 1,169 (81.7%) | 1,270 (85.2%) |
| 5 Years | 146 (100.0%) | 312 (64.1%) |
| 6 to 11 Years | 1,670 (90.6%) | 1,881 (84.5%) |
| 12 to 14 Years | 1,245 (87.9%) | 1,153 (89.3%) |
| 15 Years | 368 (77.0%) | 299 (94.6%) |
| 16 and 17 Years | 737 (82.7%) | 653 (87.2%) |
| 18 to 24 Years | 2,841 (92.4%) | 1,870 (81.6%) |
| 25 to 34 Years | 4,343 (94.6%) | 4,253 (89.9%) |
| 35 to 44 Years | 4,149 (92.1%) | 3,490 (91.4%) |
| 45 to 54 Years | 3,934 (93.9%) | 3,739 (93.2%) |
| 55 to 64 Years | 3,251 (94.0%) | 3,482 (90.1%) |
| 65 to 74 Years | 2,144 (95.1%) | 2,782 (94.9%) |
| 75 Years and over | 1,529 (93.4%) | 1,933 (88.7%) |
| Total | 27,526 (92.0%) | 27,117 (89.2%) |
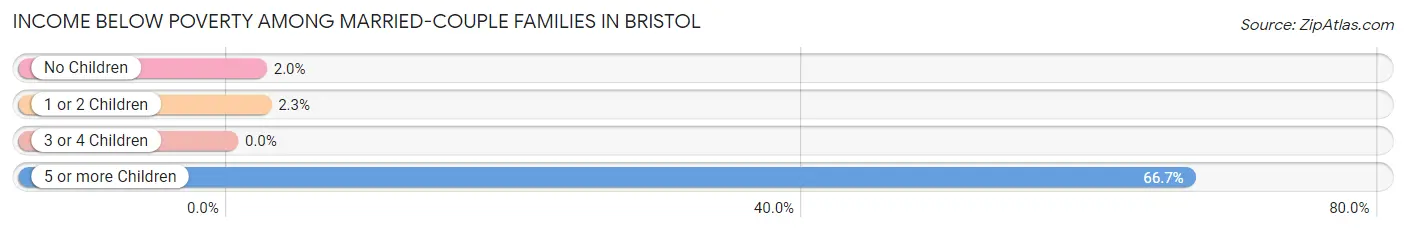
Income Below Poverty Among Married-Couple Families in Bristol
The poverty statistics for married-couple families in Bristol show that 2.3% or 239 of the total 10,468 families live below the poverty line. Families with 5 or more children have the highest poverty rate of 66.7%, comprising of 28 families. On the other hand, families with 3 or 4 children have the lowest poverty rate of 0.0%, which includes 0 families.
| Children | Above Poverty | Below Poverty |
| No Children | 5,922 (98.0%) | 121 (2.0%) |
| 1 or 2 Children | 3,802 (97.7%) | 90 (2.3%) |
| 3 or 4 Children | 491 (100.0%) | 0 (0.0%) |
| 5 or more Children | 14 (33.3%) | 28 (66.7%) |
| Total | 10,229 (97.7%) | 239 (2.3%) |
Income Below Poverty Among Single-Parent Households in Bristol
According to the poverty data in Bristol, 3.5% or 52 single-father households and 17.4% or 569 single-mother households are living below the poverty line. Among single-father households, those with 1 or 2 children have the highest poverty rate, with 32 households (4.0%) experiencing poverty. Likewise, among single-mother households, those with 3 or 4 children have the highest poverty rate, with 256 households (83.4%) falling below the poverty line.
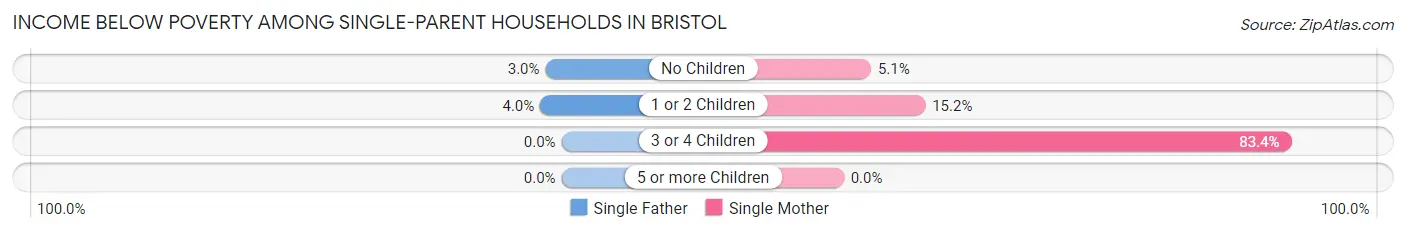
| Children | Single Father | Single Mother |
| No Children | 20 (3.0%) | 69 (5.1%) |
| 1 or 2 Children | 32 (4.0%) | 244 (15.2%) |
| 3 or 4 Children | 0 (0.0%) | 256 (83.4%) |
| 5 or more Children | 0 (0.0%) | 0 (0.0%) |
| Total | 52 (3.5%) | 569 (17.4%) |
Income Below Poverty Among Married-Couple vs Single-Parent Households in Bristol
The poverty data for Bristol shows that 239 of the married-couple family households (2.3%) and 621 of the single-parent households (13.1%) are living below the poverty level. Within the married-couple family households, those with 5 or more children have the highest poverty rate, with 28 households (66.7%) falling below the poverty line. Among the single-parent households, those with 3 or 4 children have the highest poverty rate, with 256 household (80.5%) living below poverty.
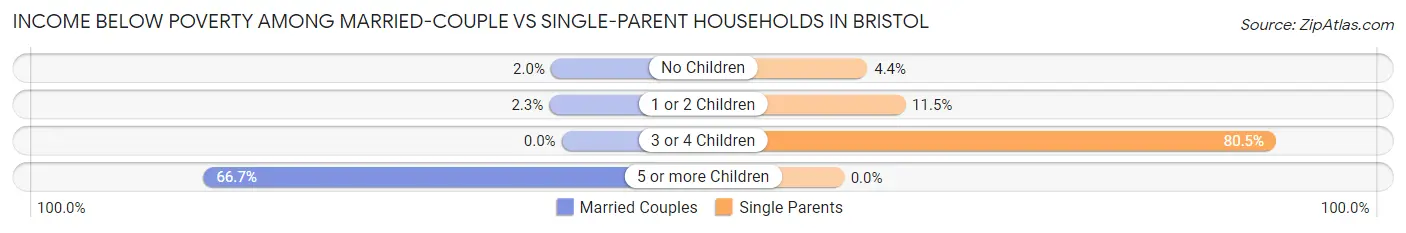
| Children | Married-Couple Families | Single-Parent Households |
| No Children | 121 (2.0%) | 89 (4.4%) |
| 1 or 2 Children | 90 (2.3%) | 276 (11.5%) |
| 3 or 4 Children | 0 (0.0%) | 256 (80.5%) |
| 5 or more Children | 28 (66.7%) | 0 (0.0%) |
| Total | 239 (2.3%) | 621 (13.1%) |
Race in Bristol
The most populous races in Bristol are White / Caucasian (43,246 | 70.8%), Hispanic or Latino (12,373 | 20.3%), and Two or more Races (7,101 | 11.6%).
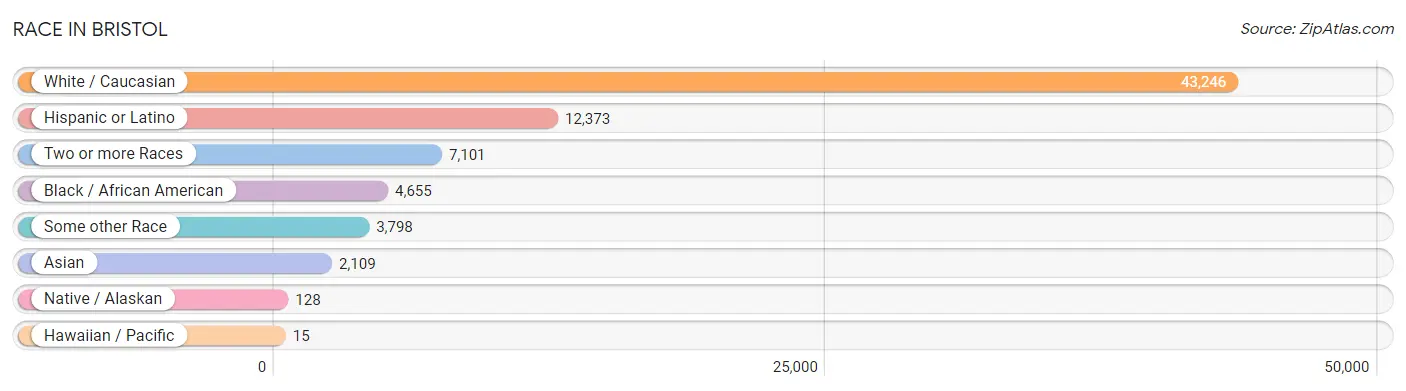
| Race | # Population | % Population |
| Asian | 2,109 | 3.5% |
| Black / African American | 4,655 | 7.6% |
| Hawaiian / Pacific | 15 | 0.0% |
| Hispanic or Latino | 12,373 | 20.3% |
| Native / Alaskan | 128 | 0.2% |
| White / Caucasian | 43,246 | 70.8% |
| Two or more Races | 7,101 | 11.6% |
| Some other Race | 3,798 | 6.2% |
| Total | 61,052 | 100.0% |
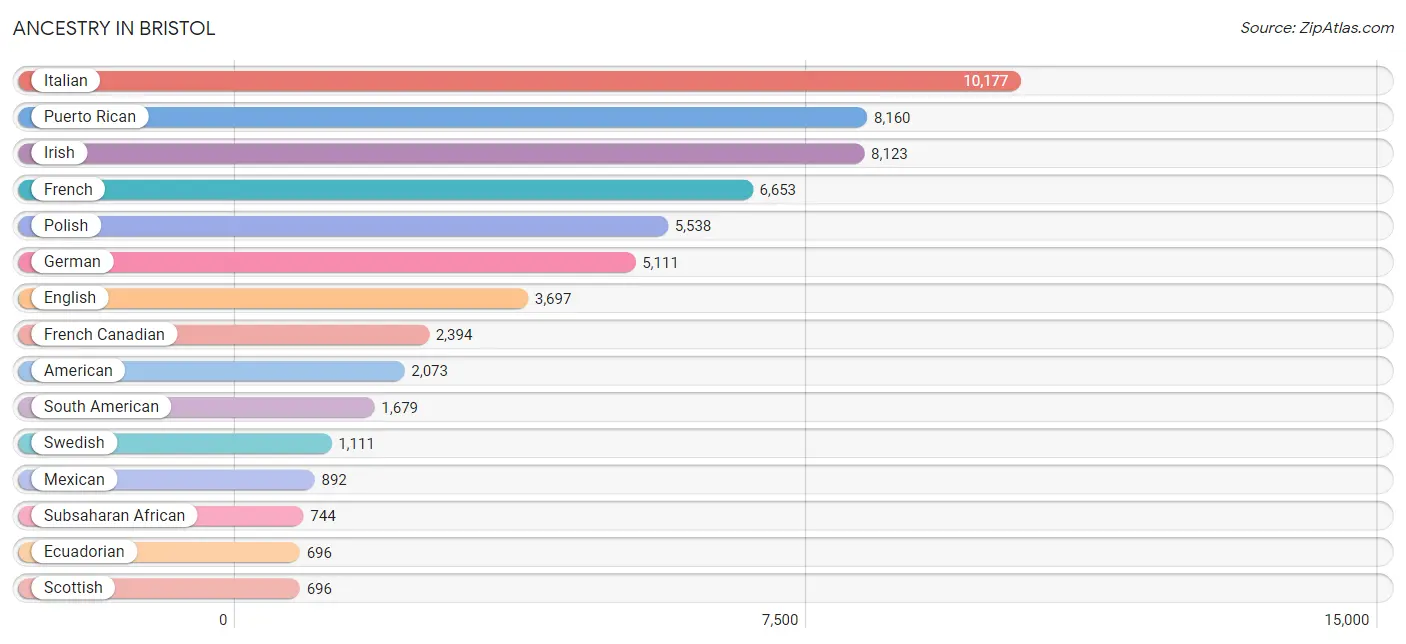
Ancestry in Bristol
The most populous ancestries reported in Bristol are Italian (10,177 | 16.7%), Puerto Rican (8,160 | 13.4%), Irish (8,123 | 13.3%), French (6,653 | 10.9%), and Polish (5,538 | 9.1%), together accounting for 63.3% of all Bristol residents.
| Ancestry | # Population | % Population |
| African | 607 | 1.0% |
| Alaska Native | 10 | 0.0% |
| Albanian | 206 | 0.3% |
| American | 2,073 | 3.4% |
| Arab | 195 | 0.3% |
| Armenian | 21 | 0.0% |
| Austrian | 196 | 0.3% |
| Barbadian | 191 | 0.3% |
| Belgian | 37 | 0.1% |
| Bhutanese | 180 | 0.3% |
| Blackfeet | 9 | 0.0% |
| Bolivian | 59 | 0.1% |
| Brazilian | 191 | 0.3% |
| British | 289 | 0.5% |
| British West Indian | 67 | 0.1% |
| Bulgarian | 11 | 0.0% |
| Burmese | 41 | 0.1% |
| Canadian | 330 | 0.5% |
| Cape Verdean | 35 | 0.1% |
| Celtic | 14 | 0.0% |
| Central American | 597 | 1.0% |
| Central American Indian | 277 | 0.4% |
| Cherokee | 171 | 0.3% |
| Colombian | 365 | 0.6% |
| Cuban | 116 | 0.2% |
| Czech | 44 | 0.1% |
| Czechoslovakian | 119 | 0.2% |
| Danish | 91 | 0.2% |
| Dominican | 619 | 1.0% |
| Dutch | 423 | 0.7% |
| Eastern European | 71 | 0.1% |
| Ecuadorian | 696 | 1.1% |
| English | 3,697 | 6.1% |
| European | 279 | 0.5% |
| Finnish | 115 | 0.2% |
| French | 6,653 | 10.9% |
| French American Indian | 13 | 0.0% |
| French Canadian | 2,394 | 3.9% |
| German | 5,111 | 8.4% |
| Ghanaian | 29 | 0.1% |
| Greek | 222 | 0.4% |
| Guatemalan | 40 | 0.1% |
| Haitian | 19 | 0.0% |
| Honduran | 417 | 0.7% |
| Hungarian | 406 | 0.7% |
| Indian (Asian) | 367 | 0.6% |
| Iranian | 37 | 0.1% |
| Irish | 8,123 | 13.3% |
| Iroquois | 8 | 0.0% |
| Italian | 10,177 | 16.7% |
| Jamaican | 594 | 1.0% |
| Japanese | 378 | 0.6% |
| Korean | 611 | 1.0% |
| Lebanese | 86 | 0.1% |
| Lithuanian | 490 | 0.8% |
| Mexican | 892 | 1.5% |
| Mexican American Indian | 77 | 0.1% |
| Mongolian | 83 | 0.1% |
| Moroccan | 29 | 0.1% |
| Native Hawaiian | 27 | 0.0% |
| Navajo | 52 | 0.1% |
| Nicaraguan | 27 | 0.0% |
| Nigerian | 73 | 0.1% |
| Norwegian | 196 | 0.3% |
| Pakistani | 30 | 0.1% |
| Peruvian | 305 | 0.5% |
| Polish | 5,538 | 9.1% |
| Portuguese | 298 | 0.5% |
| Puerto Rican | 8,160 | 13.4% |
| Romanian | 14 | 0.0% |
| Russian | 246 | 0.4% |
| Scandinavian | 99 | 0.2% |
| Scotch-Irish | 195 | 0.3% |
| Scottish | 696 | 1.1% |
| Slovak | 73 | 0.1% |
| South American | 1,679 | 2.8% |
| South American Indian | 2 | 0.0% |
| Spaniard | 81 | 0.1% |
| Spanish | 107 | 0.2% |
| Spanish American | 53 | 0.1% |
| Sri Lankan | 507 | 0.8% |
| Subsaharan African | 744 | 1.2% |
| Swedish | 1,111 | 1.8% |
| Swiss | 77 | 0.1% |
| Thai | 507 | 0.8% |
| Trinidadian and Tobagonian | 107 | 0.2% |
| Turkish | 23 | 0.0% |
| U.S. Virgin Islander | 1 | 0.0% |
| Ukrainian | 451 | 0.7% |
| Venezuelan | 63 | 0.1% |
| Welsh | 230 | 0.4% |
| West Indian | 39 | 0.1% |
| Yugoslavian | 10 | 0.0% | View All 93 Rows |
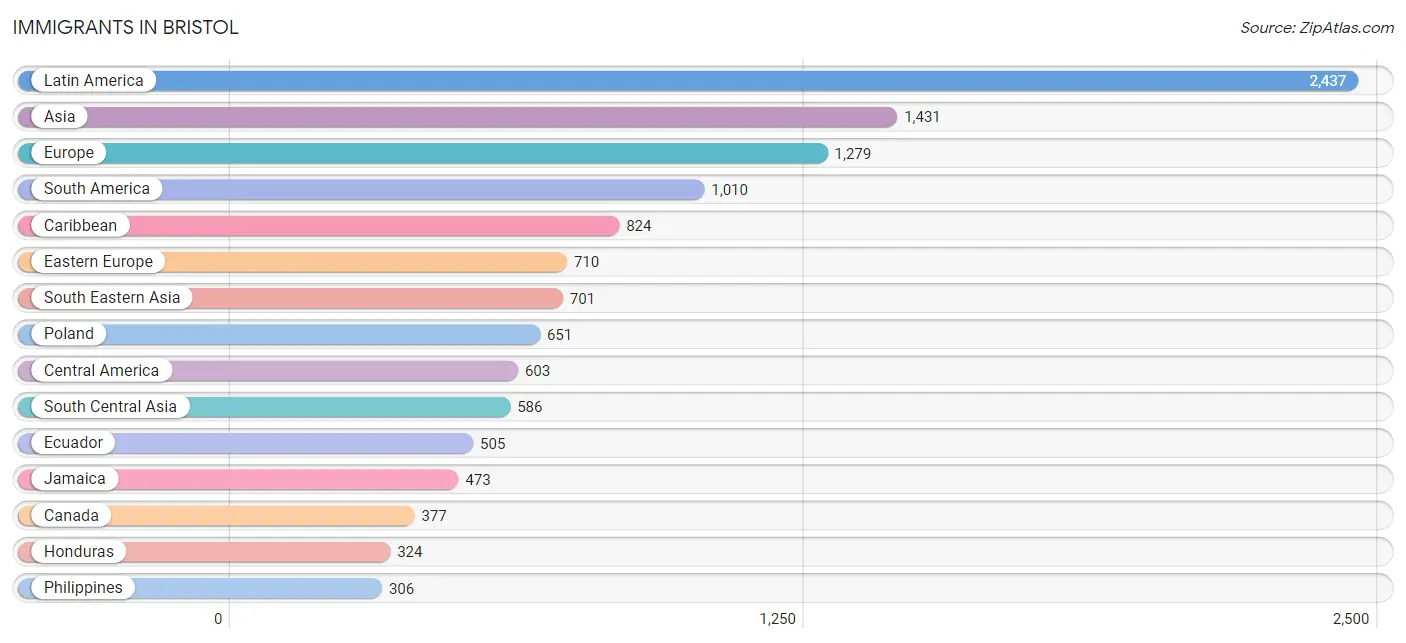
Immigrants in Bristol
The most numerous immigrant groups reported in Bristol came from Latin America (2,437 | 4.0%), Asia (1,431 | 2.3%), Europe (1,279 | 2.1%), South America (1,010 | 1.7%), and Caribbean (824 | 1.3%), together accounting for 11.4% of all Bristol residents.
| Immigration Origin | # Population | % Population |
| Africa | 186 | 0.3% |
| Albania | 36 | 0.1% |
| Asia | 1,431 | 2.3% |
| Austria | 4 | 0.0% |
| Bahamas | 99 | 0.2% |
| Belgium | 16 | 0.0% |
| Bosnia and Herzegovina | 5 | 0.0% |
| Brazil | 178 | 0.3% |
| Bulgaria | 6 | 0.0% |
| Cambodia | 164 | 0.3% |
| Canada | 377 | 0.6% |
| Caribbean | 824 | 1.3% |
| Central America | 603 | 1.0% |
| China | 38 | 0.1% |
| Colombia | 169 | 0.3% |
| Costa Rica | 21 | 0.0% |
| Cuba | 9 | 0.0% |
| Dominican Republic | 211 | 0.4% |
| Eastern Asia | 96 | 0.2% |
| Eastern Europe | 710 | 1.2% |
| Ecuador | 505 | 0.8% |
| England | 203 | 0.3% |
| Europe | 1,279 | 2.1% |
| France | 11 | 0.0% |
| Germany | 69 | 0.1% |
| Ghana | 51 | 0.1% |
| Greece | 15 | 0.0% |
| Guatemala | 40 | 0.1% |
| Haiti | 6 | 0.0% |
| Honduras | 324 | 0.5% |
| India | 240 | 0.4% |
| Iran | 31 | 0.1% |
| Ireland | 13 | 0.0% |
| Italy | 160 | 0.3% |
| Jamaica | 473 | 0.8% |
| Japan | 41 | 0.1% |
| Jordan | 24 | 0.0% |
| Korea | 17 | 0.0% |
| Latin America | 2,437 | 4.0% |
| Lithuania | 7 | 0.0% |
| Malaysia | 24 | 0.0% |
| Mexico | 173 | 0.3% |
| Morocco | 19 | 0.0% |
| Nicaragua | 27 | 0.0% |
| Nigeria | 8 | 0.0% |
| Northern Africa | 127 | 0.2% |
| Northern Europe | 223 | 0.4% |
| Pakistan | 299 | 0.5% |
| Panama | 18 | 0.0% |
| Peru | 95 | 0.2% |
| Philippines | 306 | 0.5% |
| Poland | 651 | 1.1% |
| Portugal | 71 | 0.1% |
| Scotland | 7 | 0.0% |
| Singapore | 24 | 0.0% |
| South America | 1,010 | 1.7% |
| South Central Asia | 586 | 1.0% |
| South Eastern Asia | 701 | 1.1% |
| Southern Europe | 246 | 0.4% |
| Sri Lanka | 16 | 0.0% |
| Thailand | 22 | 0.0% |
| Trinidad and Tobago | 22 | 0.0% |
| Ukraine | 5 | 0.0% |
| Venezuela | 63 | 0.1% |
| Vietnam | 161 | 0.3% |
| Western Africa | 59 | 0.1% |
| Western Asia | 24 | 0.0% |
| Western Europe | 100 | 0.2% | View All 68 Rows |
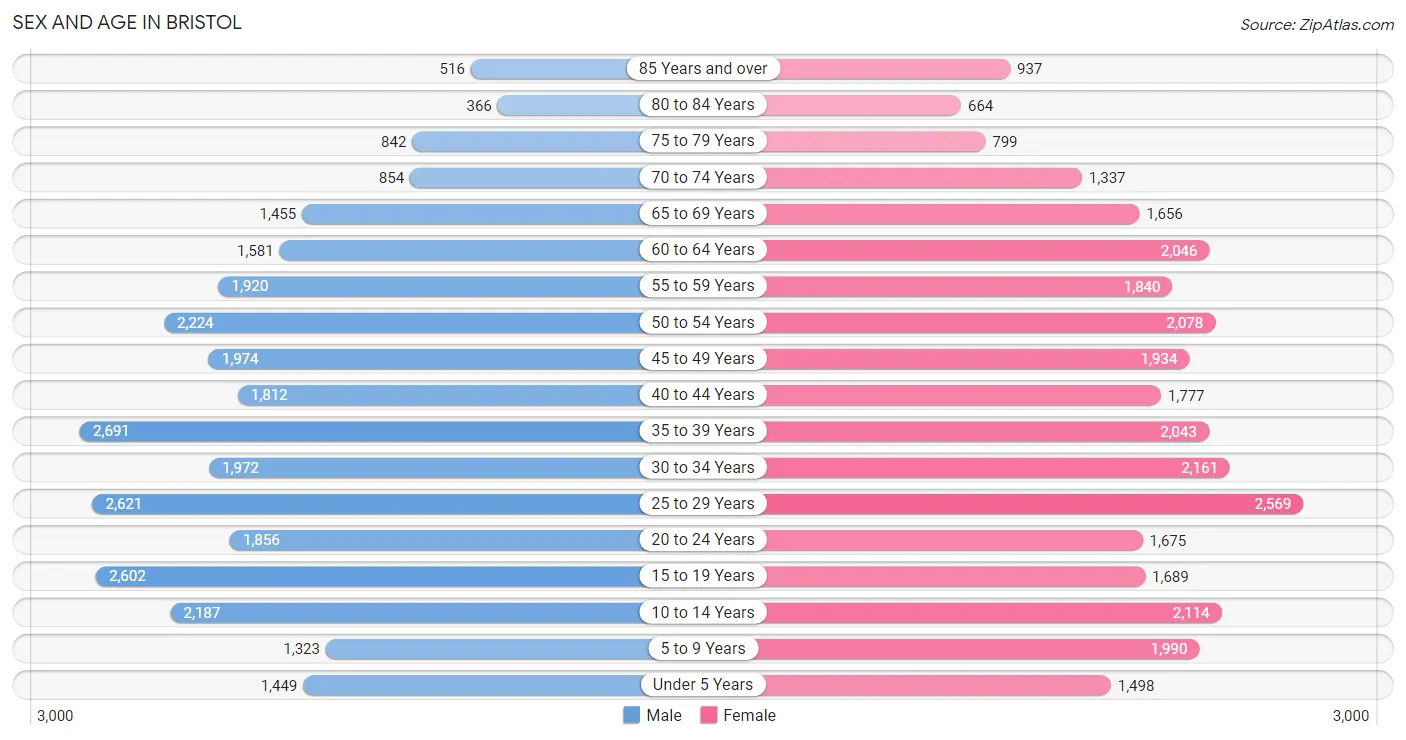
Sex and Age in Bristol
Sex and Age in Bristol
The most populous age groups in Bristol are 35 to 39 Years (2,691 | 8.9%) for men and 25 to 29 Years (2,569 | 8.3%) for women.
| Age Bracket | Male | Female |
| Under 5 Years | 1,449 (4.8%) | 1,498 (4.9%) |
| 5 to 9 Years | 1,323 (4.4%) | 1,990 (6.5%) |
| 10 to 14 Years | 2,187 (7.2%) | 2,114 (6.9%) |
| 15 to 19 Years | 2,602 (8.6%) | 1,689 (5.5%) |
| 20 to 24 Years | 1,856 (6.1%) | 1,675 (5.4%) |
| 25 to 29 Years | 2,621 (8.7%) | 2,569 (8.3%) |
| 30 to 34 Years | 1,972 (6.5%) | 2,161 (7.0%) |
| 35 to 39 Years | 2,691 (8.9%) | 2,043 (6.6%) |
| 40 to 44 Years | 1,812 (6.0%) | 1,777 (5.8%) |
| 45 to 49 Years | 1,974 (6.5%) | 1,934 (6.3%) |
| 50 to 54 Years | 2,224 (7.3%) | 2,078 (6.8%) |
| 55 to 59 Years | 1,920 (6.4%) | 1,840 (6.0%) |
| 60 to 64 Years | 1,581 (5.2%) | 2,046 (6.6%) |
| 65 to 69 Years | 1,455 (4.8%) | 1,656 (5.4%) |
| 70 to 74 Years | 854 (2.8%) | 1,337 (4.3%) |
| 75 to 79 Years | 842 (2.8%) | 799 (2.6%) |
| 80 to 84 Years | 366 (1.2%) | 664 (2.2%) |
| 85 Years and over | 516 (1.7%) | 937 (3.0%) |
| Total | 30,245 (100.0%) | 30,807 (100.0%) |
Families and Households in Bristol
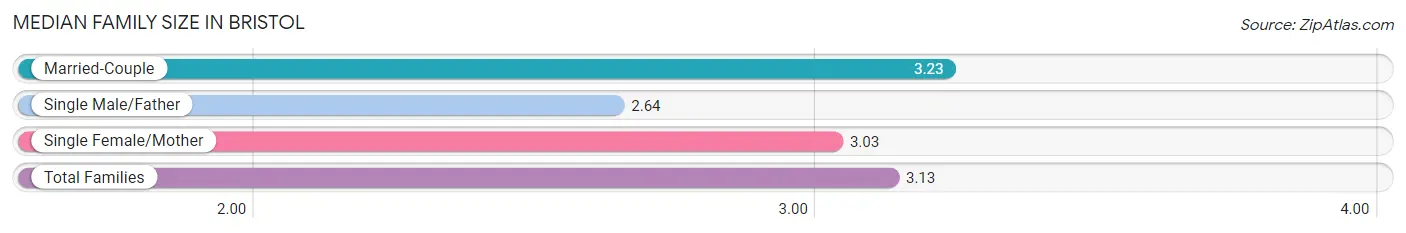
Median Family Size in Bristol
The median family size in Bristol is 3.13 persons per family, with married-couple families (10,468 | 68.8%) accounting for the largest median family size of 3.23 persons per family. On the other hand, single male/father families (1,481 | 9.7%) represent the smallest median family size with 2.64 persons per family.
| Family Type | # Families | Family Size |
| Married-Couple | 10,468 (68.8%) | 3.23 |
| Single Male/Father | 1,481 (9.7%) | 2.64 |
| Single Female/Mother | 3,272 (21.5%) | 3.03 |
| Total Families | 15,221 (100.0%) | 3.13 |
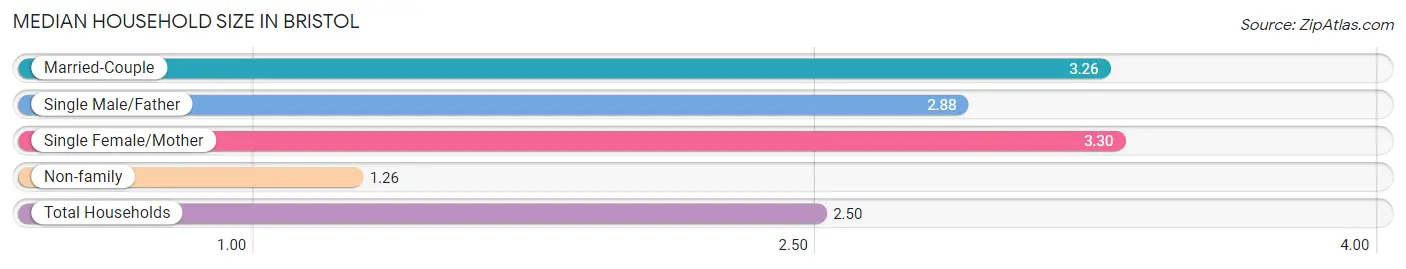
Median Household Size in Bristol
The median household size in Bristol is 2.50 persons per household, with single female/mother households (3,272 | 13.6%) accounting for the largest median household size of 3.3 persons per household. non-family households (8,855 | 36.8%) represent the smallest median household size with 1.26 persons per household.
| Household Type | # Households | Household Size |
| Married-Couple | 10,468 (43.5%) | 3.26 |
| Single Male/Father | 1,481 (6.1%) | 2.88 |
| Single Female/Mother | 3,272 (13.6%) | 3.30 |
| Non-family | 8,855 (36.8%) | 1.26 |
| Total Households | 24,076 (100.0%) | 2.50 |
Household Size by Marriage Status in Bristol
Out of a total of 24,076 households in Bristol, 15,221 (63.2%) are family households, while 8,855 (36.8%) are nonfamily households. The most numerous type of family households are 2-person households, comprising 6,469, and the most common type of nonfamily households are 1-person households, comprising 6,897.
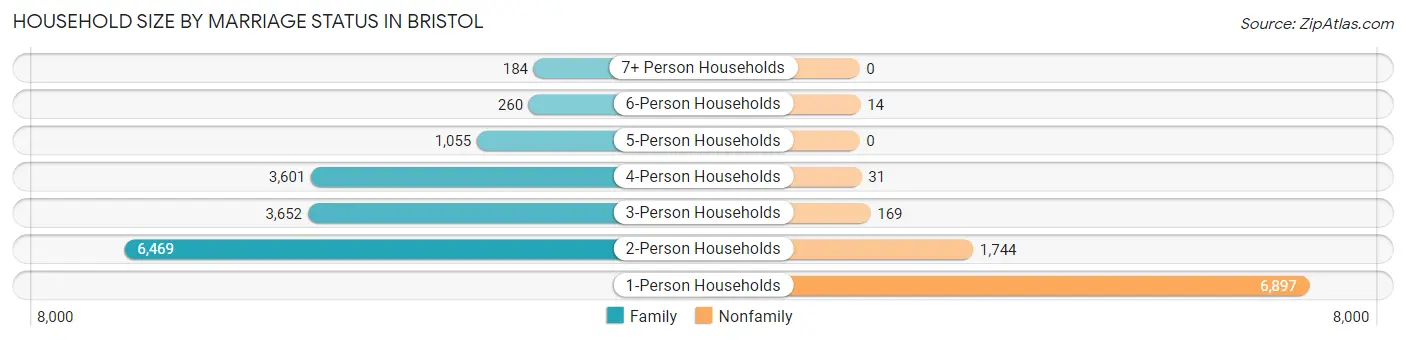
| Household Size | Family Households | Nonfamily Households |
| 1-Person Households | - | 6,897 (28.6%) |
| 2-Person Households | 6,469 (26.9%) | 1,744 (7.2%) |
| 3-Person Households | 3,652 (15.2%) | 169 (0.7%) |
| 4-Person Households | 3,601 (15.0%) | 31 (0.1%) |
| 5-Person Households | 1,055 (4.4%) | 0 (0.0%) |
| 6-Person Households | 260 (1.1%) | 14 (0.1%) |
| 7+ Person Households | 184 (0.8%) | 0 (0.0%) |
| Total | 15,221 (63.2%) | 8,855 (36.8%) |
Female Fertility in Bristol
Fertility by Age in Bristol
Average fertility rate in Bristol is 36.0 births per 1,000 women. Women in the age bracket of 20 to 34 years have the highest fertility rate with 55.0 births per 1,000 women. Women in the age bracket of 20 to 34 years acount for 69.0% of all women with births.
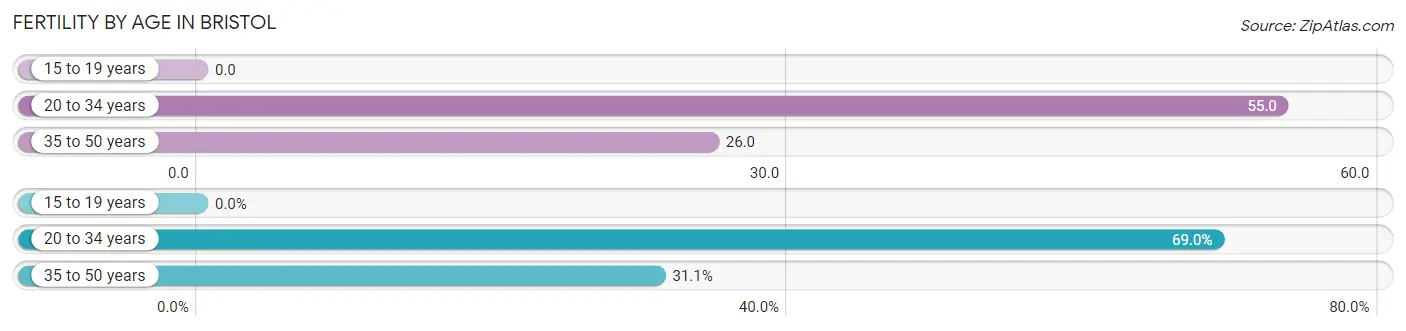
| Age Bracket | Women with Births | Births / 1,000 Women |
| 15 to 19 years | 0 (0.0%) | 0.0 |
| 20 to 34 years | 353 (69.0%) | 55.0 |
| 35 to 50 years | 159 (31.0%) | 26.0 |
| Total | 512 (100.0%) | 36.0 |
Fertility by Age by Marriage Status in Bristol
74.6% of women with births (512) in Bristol are married. The highest percentage of unmarried women with births falls into 20 to 34 years age bracket with 30.0% of them unmarried at the time of birth, while the lowest percentage of unmarried women with births belong to 35 to 50 years age bracket with 15.1% of them unmarried.
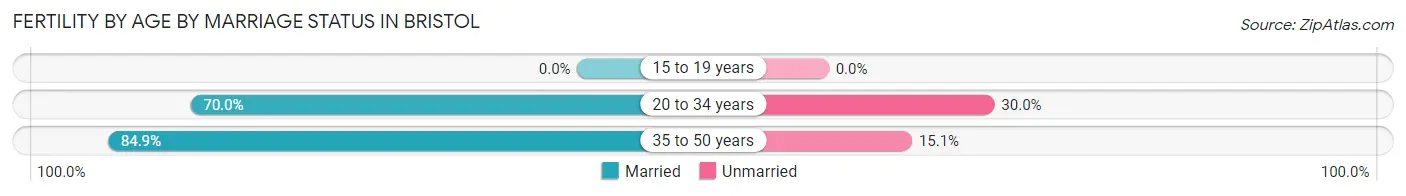
| Age Bracket | Married | Unmarried |
| 15 to 19 years | 0 (0.0%) | 0 (0.0%) |
| 20 to 34 years | 247 (70.0%) | 106 (30.0%) |
| 35 to 50 years | 135 (84.9%) | 24 (15.1%) |
| Total | 382 (74.6%) | 130 (25.4%) |
Fertility by Education in Bristol
Average fertility rate in Bristol is 36.0 births per 1,000 women. Women with the education attainment of bachelor's degree have the highest fertility rate of 53.0 births per 1,000 women, while women with the education attainment of less than high school have the lowest fertility at 10.0 births per 1,000 women. Women with the education attainment of bachelor's degree represent 33.2% of all women with births.
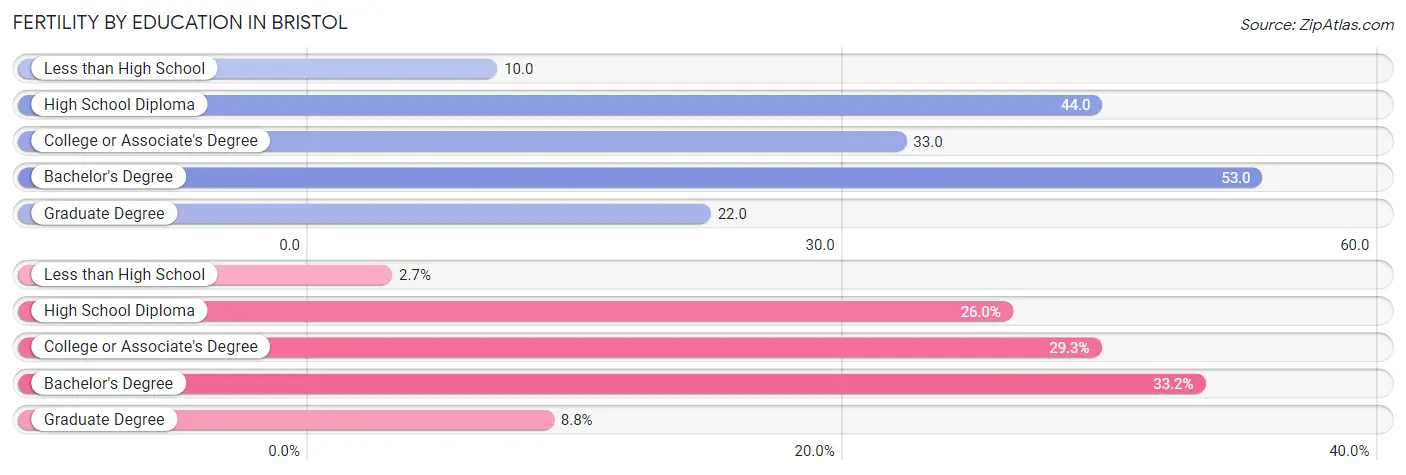
| Educational Attainment | Women with Births | Births / 1,000 Women |
| Less than High School | 14 (2.7%) | 10.0 |
| High School Diploma | 133 (26.0%) | 44.0 |
| College or Associate's Degree | 150 (29.3%) | 33.0 |
| Bachelor's Degree | 170 (33.2%) | 53.0 |
| Graduate Degree | 45 (8.8%) | 22.0 |
| Total | 512 (100.0%) | 36.0 |
Fertility by Education by Marriage Status in Bristol
25.4% of women with births in Bristol are unmarried. Women with the educational attainment of less than high school are most likely to be married with 100.0% of them married at childbirth, while women with the educational attainment of high school diploma are least likely to be married with 72.9% of them unmarried at childbirth.
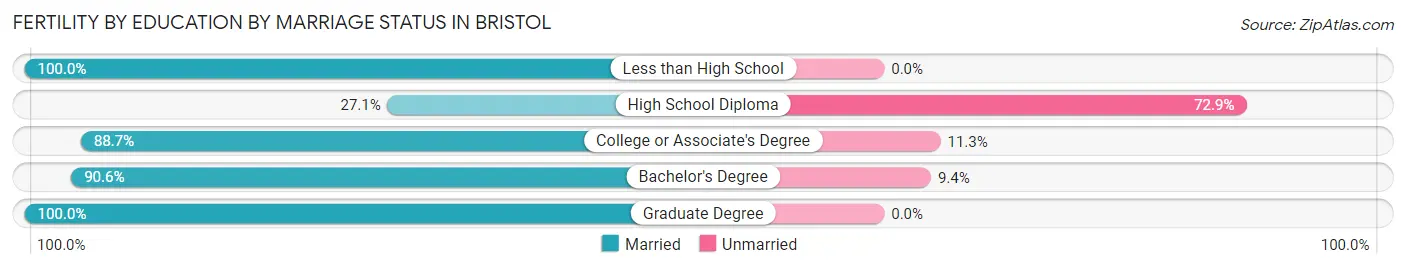
| Educational Attainment | Married | Unmarried |
| Less than High School | 14 (100.0%) | 0 (0.0%) |
| High School Diploma | 36 (27.1%) | 97 (72.9%) |
| College or Associate's Degree | 133 (88.7%) | 17 (11.3%) |
| Bachelor's Degree | 154 (90.6%) | 16 (9.4%) |
| Graduate Degree | 45 (100.0%) | 0 (0.0%) |
| Total | 382 (74.6%) | 130 (25.4%) |
Employment Characteristics in Bristol
Employment by Class of Employer in Bristol
Among the 32,250 employed individuals in Bristol, private company employees (22,931 | 71.1%), local government employees (2,406 | 7.5%), and not-for-profit organizations (2,116 | 6.6%) make up the most common classes of employment.
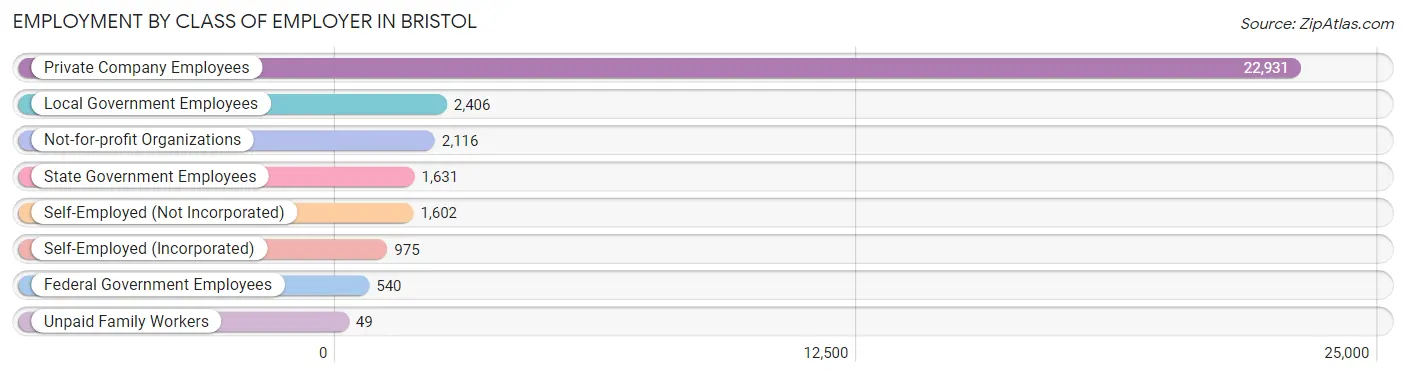
| Employer Class | # Employees | % Employees |
| Private Company Employees | 22,931 | 71.1% |
| Self-Employed (Incorporated) | 975 | 3.0% |
| Self-Employed (Not Incorporated) | 1,602 | 5.0% |
| Not-for-profit Organizations | 2,116 | 6.6% |
| Local Government Employees | 2,406 | 7.5% |
| State Government Employees | 1,631 | 5.1% |
| Federal Government Employees | 540 | 1.7% |
| Unpaid Family Workers | 49 | 0.2% |
| Total | 32,250 | 100.0% |
Employment Status by Age in Bristol
According to the labor force statistics for Bristol, out of the total population over 16 years of age (49,695), 71.0% or 35,283 individuals are in the labor force, with 6.6% or 2,329 of them unemployed. The age group with the highest labor force participation rate is 25 to 29 years, with 91.8% or 4,764 individuals in the labor force. Within the labor force, the 16 to 19 years age range has the highest percentage of unemployed individuals, with 13.4% or 275 of them being unemployed.
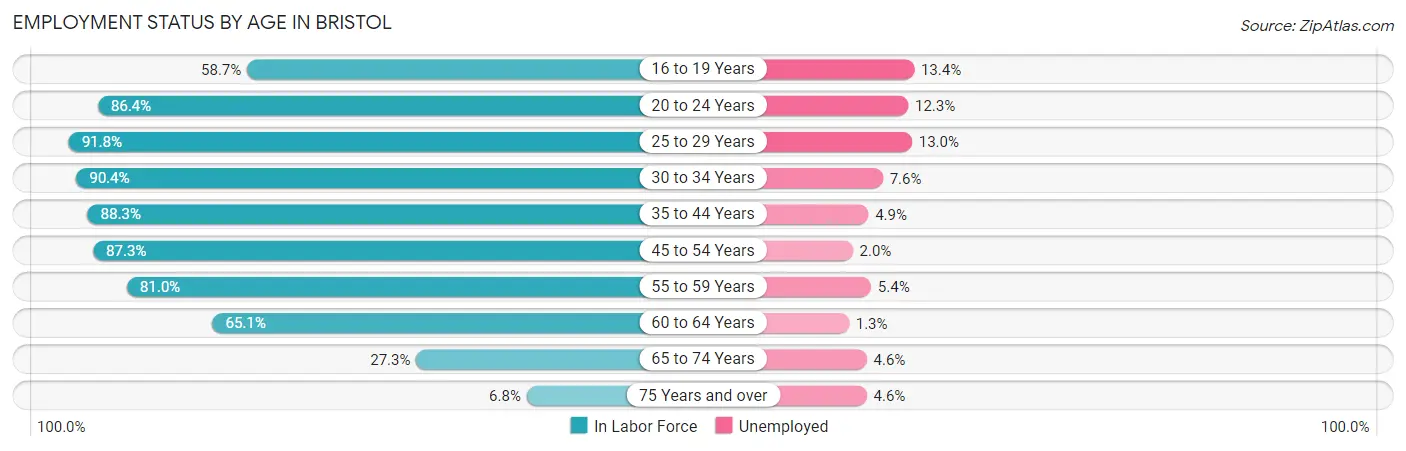
| Age Bracket | In Labor Force | Unemployed |
| 16 to 19 Years | 2,052 (58.7%) | 275 (13.4%) |
| 20 to 24 Years | 3,051 (86.4%) | 375 (12.3%) |
| 25 to 29 Years | 4,764 (91.8%) | 619 (13.0%) |
| 30 to 34 Years | 3,736 (90.4%) | 284 (7.6%) |
| 35 to 44 Years | 7,349 (88.3%) | 360 (4.9%) |
| 45 to 54 Years | 7,167 (87.3%) | 143 (2.0%) |
| 55 to 59 Years | 3,046 (81.0%) | 164 (5.4%) |
| 60 to 64 Years | 2,361 (65.1%) | 31 (1.3%) |
| 65 to 74 Years | 1,447 (27.3%) | 67 (4.6%) |
| 75 Years and over | 280 (6.8%) | 13 (4.6%) |
| Total | 35,283 (71.0%) | 2,329 (6.6%) |
Employment Status by Educational Attainment in Bristol
According to labor force statistics for Bristol, 85.5% of individuals (28,423) out of the total population between 25 and 64 years of age (33,243) are in the labor force, with 5.6% or 1,592 of them being unemployed. The group with the highest labor force participation rate are those with the educational attainment of bachelor's degree or higher, with 91.8% or 9,922 individuals in the labor force. Within the labor force, individuals with less than high school education have the highest percentage of unemployment, with 11.2% or 125 of them being unemployed.
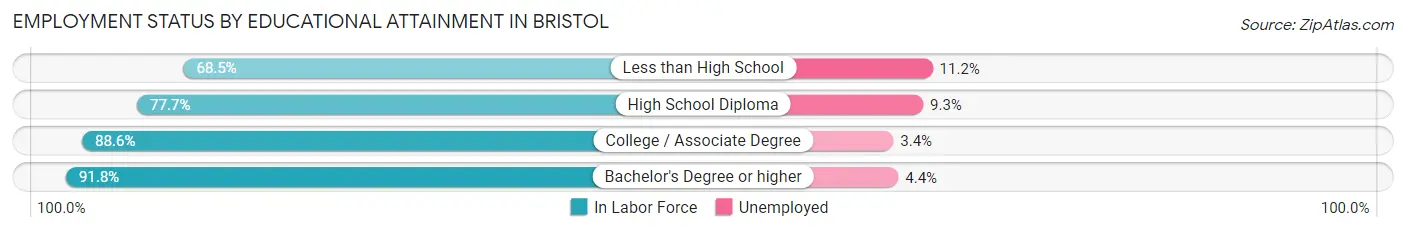
| Educational Attainment | In Labor Force | Unemployed |
| Less than High School | 1,112 (68.5%) | 182 (11.2%) |
| High School Diploma | 7,445 (77.7%) | 891 (9.3%) |
| College / Associate Degree | 9,949 (88.6%) | 382 (3.4%) |
| Bachelor's Degree or higher | 9,922 (91.8%) | 476 (4.4%) |
| Total | 28,423 (85.5%) | 1,862 (5.6%) |
Employment Occupations by Sex in Bristol
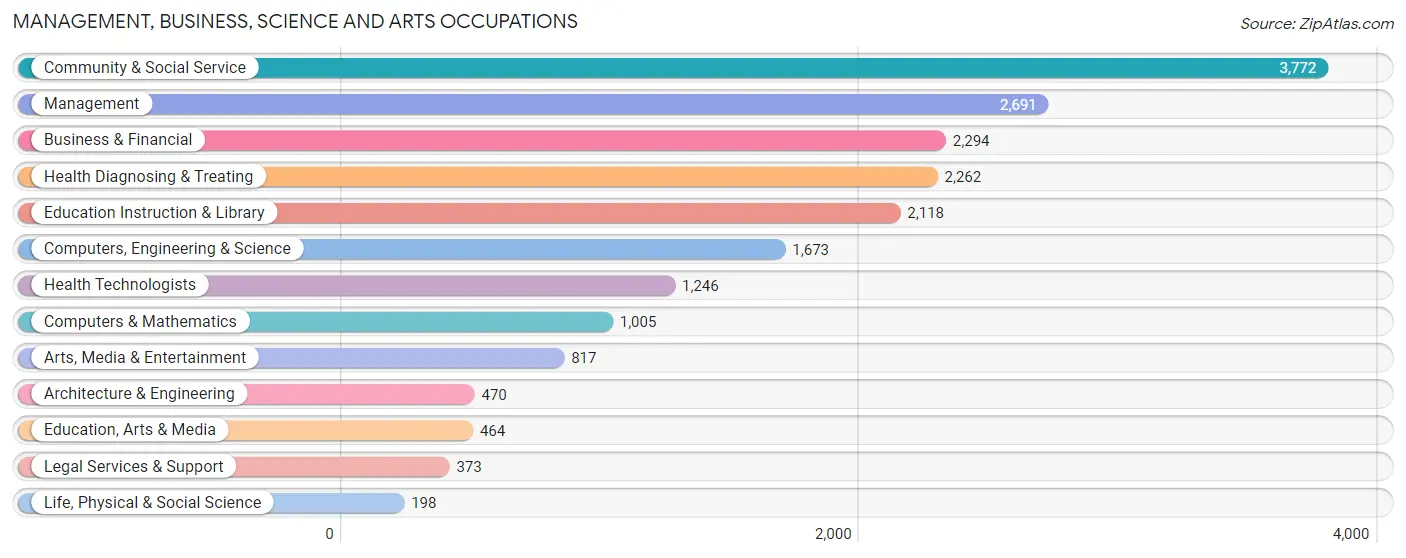
Management, Business, Science and Arts Occupations
The most common Management, Business, Science and Arts occupations in Bristol are Community & Social Service (3,772 | 11.5%), Management (2,691 | 8.2%), Business & Financial (2,294 | 7.0%), Health Diagnosing & Treating (2,262 | 6.9%), and Education Instruction & Library (2,118 | 6.5%).
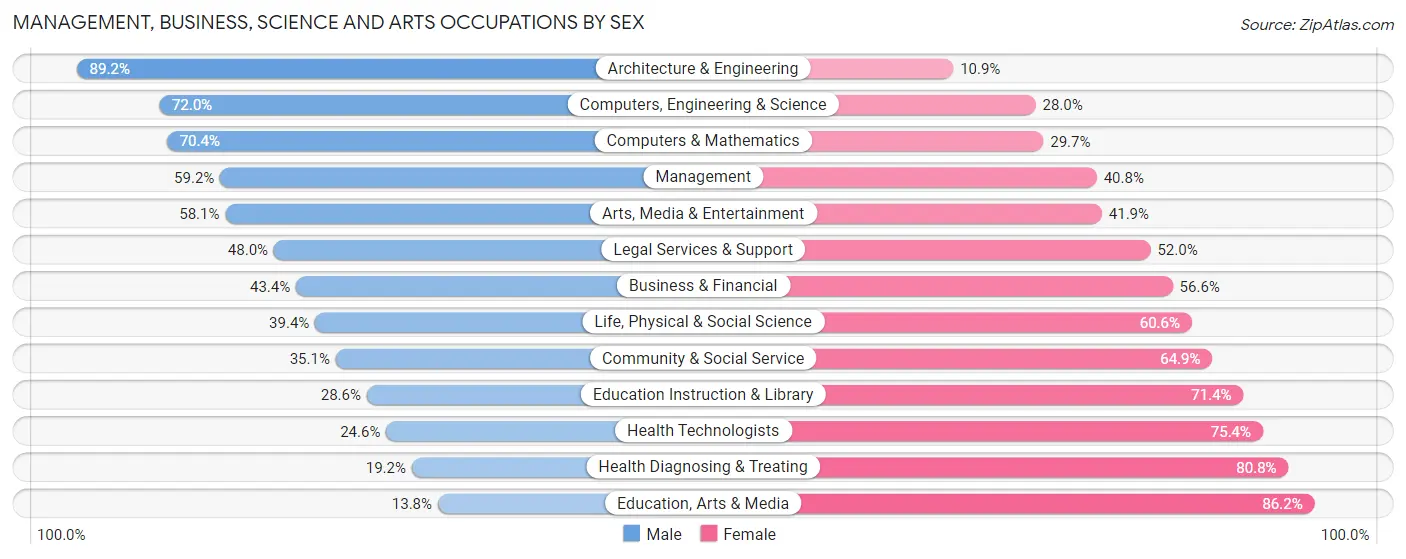
Management, Business, Science and Arts Occupations by Sex
Within the Management, Business, Science and Arts occupations in Bristol, the most male-oriented occupations are Architecture & Engineering (89.1%), Computers, Engineering & Science (72.0%), and Computers & Mathematics (70.4%), while the most female-oriented occupations are Education, Arts & Media (86.2%), Health Diagnosing & Treating (80.8%), and Health Technologists (75.4%).
| Occupation | Male | Female |
| Management | 1,593 (59.2%) | 1,098 (40.8%) |
| Business & Financial | 995 (43.4%) | 1,299 (56.6%) |
| Computers, Engineering & Science | 1,204 (72.0%) | 469 (28.0%) |
| Computers & Mathematics | 707 (70.4%) | 298 (29.6%) |
| Architecture & Engineering | 419 (89.1%) | 51 (10.8%) |
| Life, Physical & Social Science | 78 (39.4%) | 120 (60.6%) |
| Community & Social Service | 1,324 (35.1%) | 2,448 (64.9%) |
| Education, Arts & Media | 64 (13.8%) | 400 (86.2%) |
| Legal Services & Support | 179 (48.0%) | 194 (52.0%) |
| Education Instruction & Library | 606 (28.6%) | 1,512 (71.4%) |
| Arts, Media & Entertainment | 475 (58.1%) | 342 (41.9%) |
| Health Diagnosing & Treating | 435 (19.2%) | 1,827 (80.8%) |
| Health Technologists | 306 (24.6%) | 940 (75.4%) |
| Total (Category) | 5,551 (43.7%) | 7,141 (56.3%) |
| Total (Overall) | 16,940 (51.5%) | 15,920 (48.4%) |
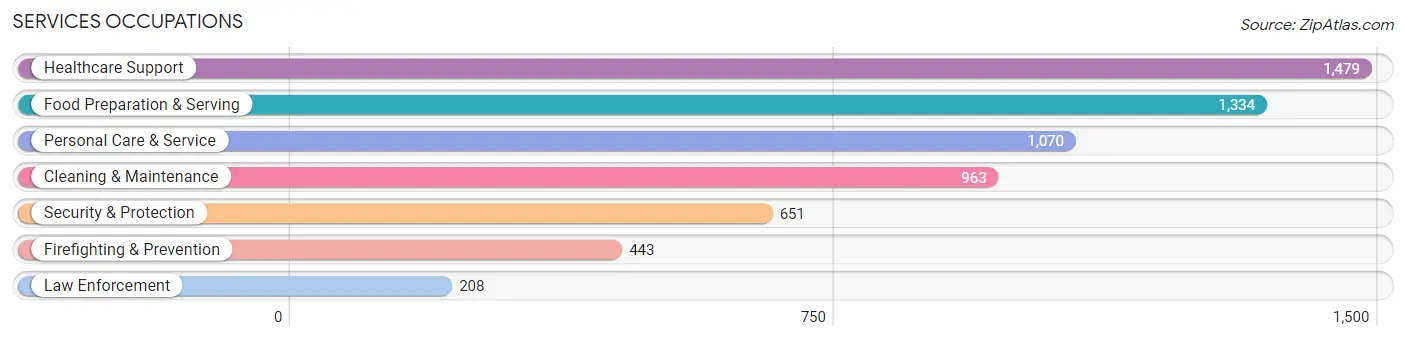
Services Occupations
The most common Services occupations in Bristol are Healthcare Support (1,479 | 4.5%), Food Preparation & Serving (1,334 | 4.1%), Personal Care & Service (1,070 | 3.3%), Cleaning & Maintenance (963 | 2.9%), and Security & Protection (651 | 2.0%).
Services Occupations by Sex
Within the Services occupations in Bristol, the most male-oriented occupations are Firefighting & Prevention (77.0%), Cleaning & Maintenance (75.3%), and Security & Protection (74.8%), while the most female-oriented occupations are Healthcare Support (85.9%), Personal Care & Service (75.2%), and Food Preparation & Serving (52.3%).

| Occupation | Male | Female |
| Healthcare Support | 209 (14.1%) | 1,270 (85.9%) |
| Security & Protection | 487 (74.8%) | 164 (25.2%) |
| Firefighting & Prevention | 341 (77.0%) | 102 (23.0%) |
| Law Enforcement | 146 (70.2%) | 62 (29.8%) |
| Food Preparation & Serving | 636 (47.7%) | 698 (52.3%) |
| Cleaning & Maintenance | 725 (75.3%) | 238 (24.7%) |
| Personal Care & Service | 265 (24.8%) | 805 (75.2%) |
| Total (Category) | 2,322 (42.2%) | 3,175 (57.8%) |
| Total (Overall) | 16,940 (51.5%) | 15,920 (48.4%) |
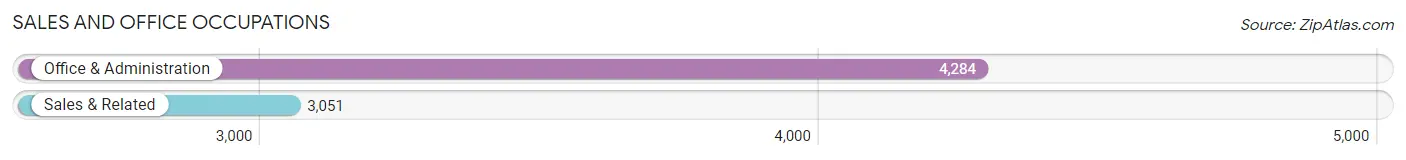
Sales and Office Occupations
The most common Sales and Office occupations in Bristol are Office & Administration (4,284 | 13.0%), and Sales & Related (3,051 | 9.3%).
Sales and Office Occupations by Sex
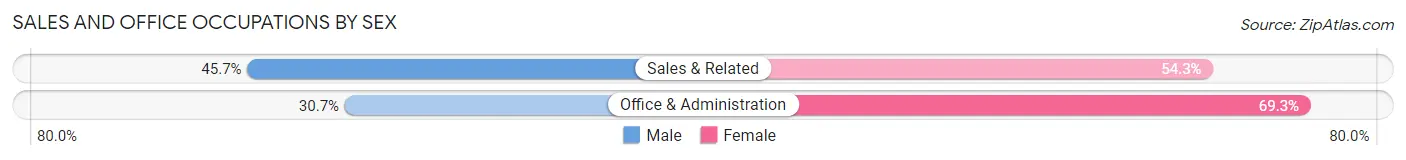
| Occupation | Male | Female |
| Sales & Related | 1,395 (45.7%) | 1,656 (54.3%) |
| Office & Administration | 1,316 (30.7%) | 2,968 (69.3%) |
| Total (Category) | 2,711 (37.0%) | 4,624 (63.0%) |
| Total (Overall) | 16,940 (51.5%) | 15,920 (48.4%) |
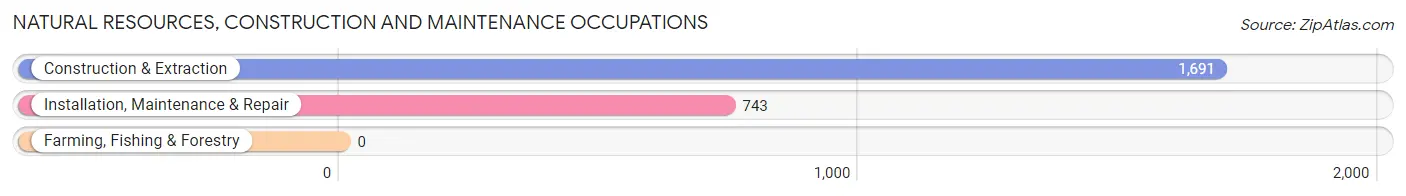
Natural Resources, Construction and Maintenance Occupations
The most common Natural Resources, Construction and Maintenance occupations in Bristol are Construction & Extraction (1,691 | 5.1%), and Installation, Maintenance & Repair (743 | 2.3%).
Natural Resources, Construction and Maintenance Occupations by Sex
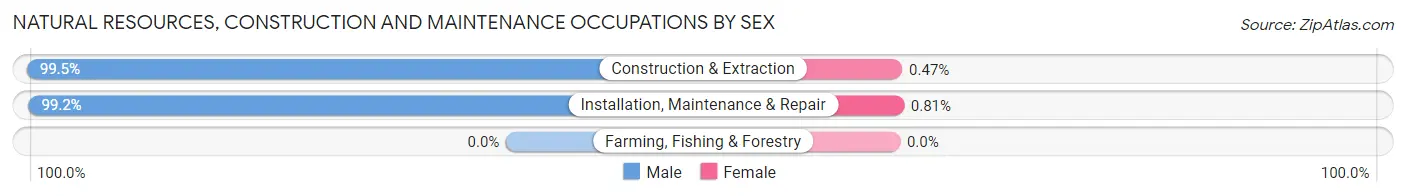
| Occupation | Male | Female |
| Farming, Fishing & Forestry | 0 (0.0%) | 0 (0.0%) |
| Construction & Extraction | 1,683 (99.5%) | 8 (0.5%) |
| Installation, Maintenance & Repair | 737 (99.2%) | 6 (0.8%) |
| Total (Category) | 2,420 (99.4%) | 14 (0.6%) |
| Total (Overall) | 16,940 (51.5%) | 15,920 (48.4%) |
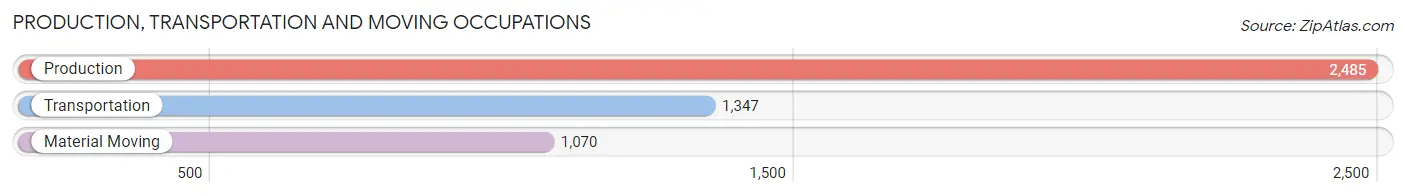
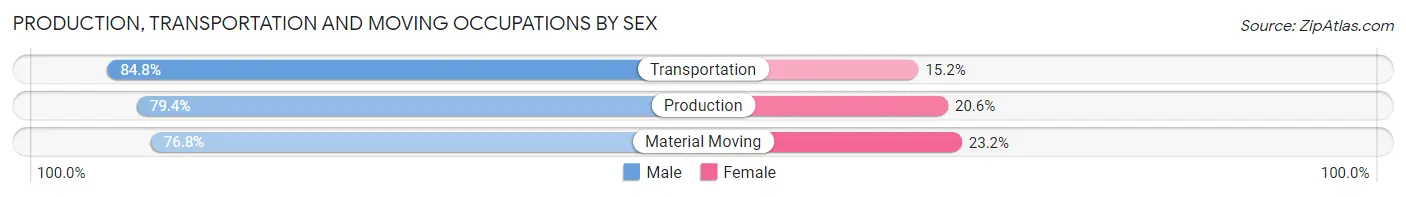
Production, Transportation and Moving Occupations
The most common Production, Transportation and Moving occupations in Bristol are Production (2,485 | 7.6%), Transportation (1,347 | 4.1%), and Material Moving (1,070 | 3.3%).
Production, Transportation and Moving Occupations by Sex
| Occupation | Male | Female |
| Production | 1,972 (79.4%) | 513 (20.6%) |
| Transportation | 1,142 (84.8%) | 205 (15.2%) |
| Material Moving | 822 (76.8%) | 248 (23.2%) |
| Total (Category) | 3,936 (80.3%) | 966 (19.7%) |
| Total (Overall) | 16,940 (51.5%) | 15,920 (48.4%) |
Employment Industries by Sex in Bristol
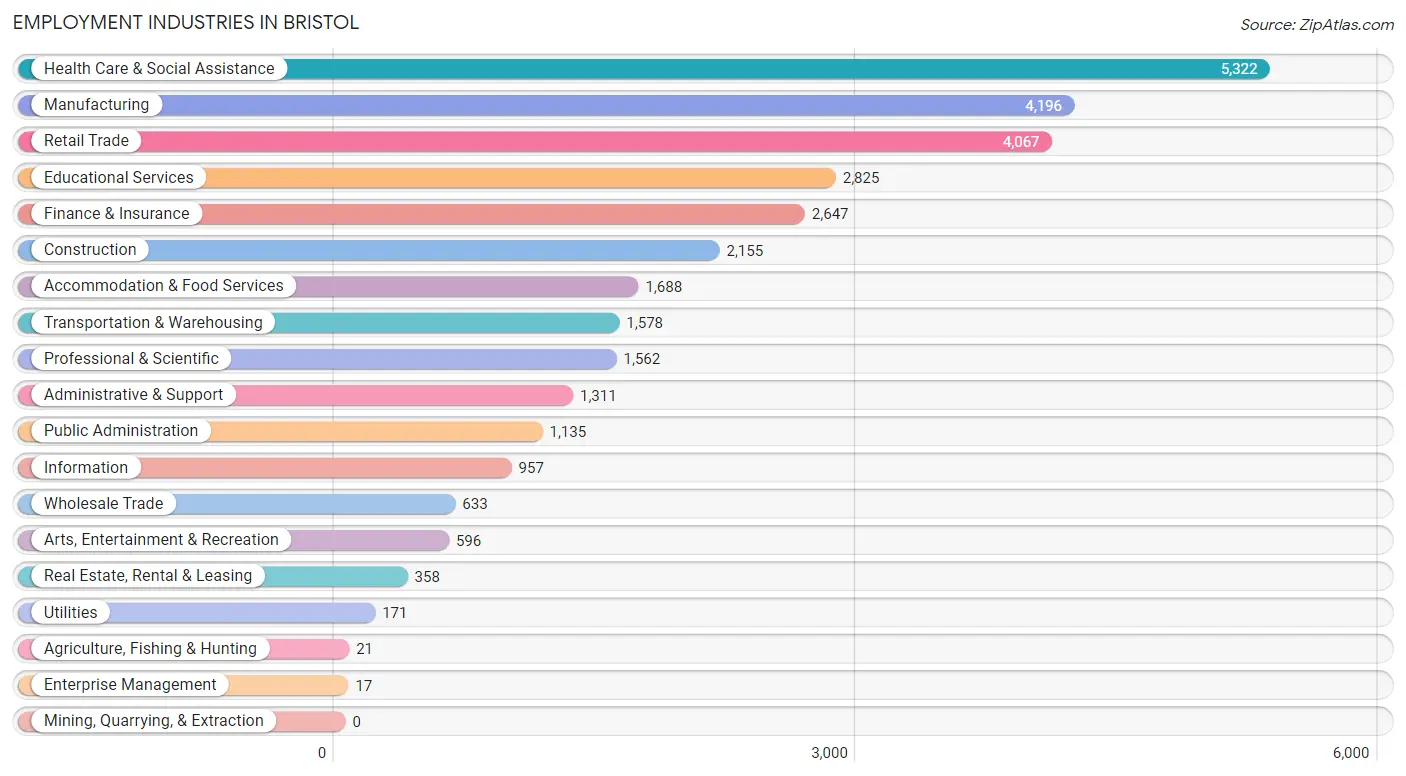
Employment Industries in Bristol
The major employment industries in Bristol include Health Care & Social Assistance (5,322 | 16.2%), Manufacturing (4,196 | 12.8%), Retail Trade (4,067 | 12.4%), Educational Services (2,825 | 8.6%), and Finance & Insurance (2,647 | 8.1%).
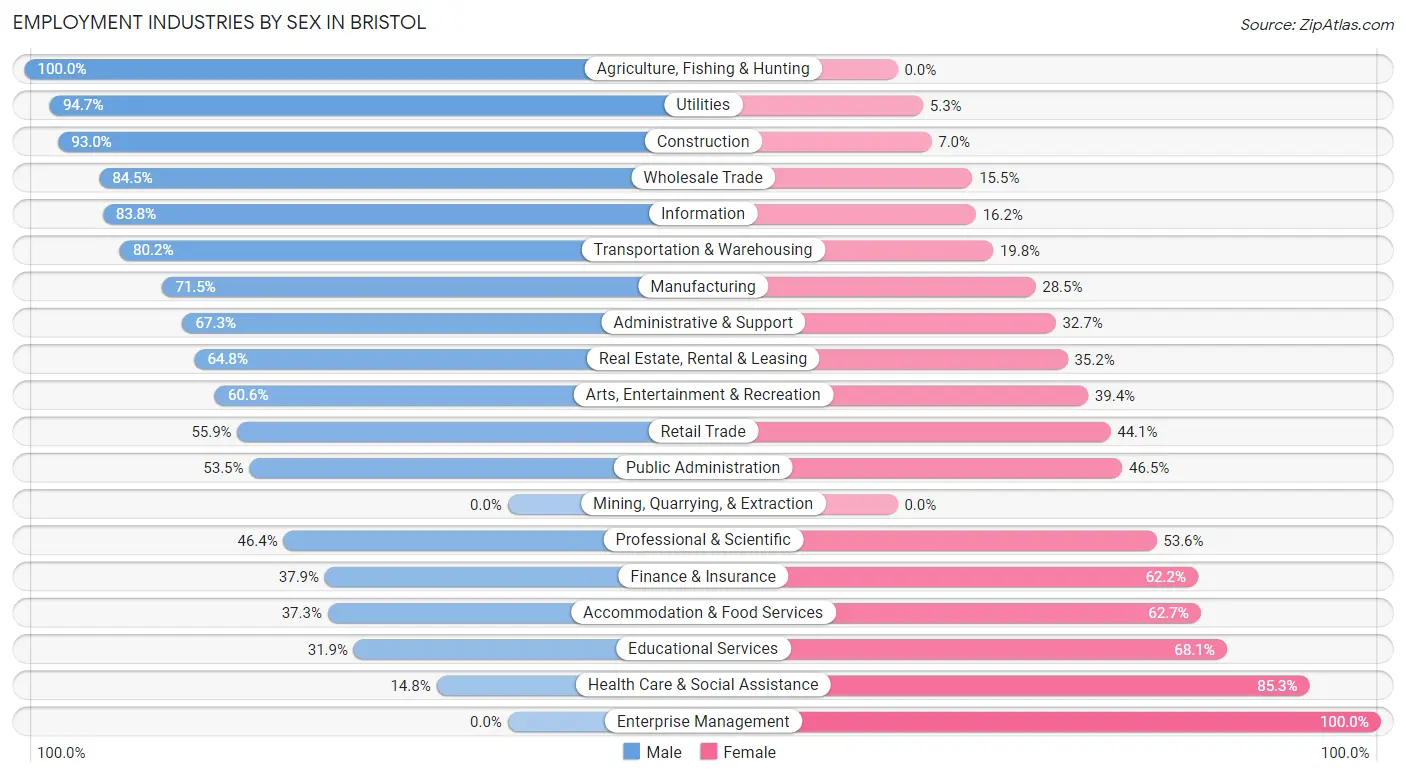
Employment Industries by Sex in Bristol
The Bristol industries that see more men than women are Agriculture, Fishing & Hunting (100.0%), Utilities (94.7%), and Construction (93.0%), whereas the industries that tend to have a higher number of women are Enterprise Management (100.0%), Health Care & Social Assistance (85.3%), and Educational Services (68.1%).
| Industry | Male | Female |
| Agriculture, Fishing & Hunting | 21 (100.0%) | 0 (0.0%) |
| Mining, Quarrying, & Extraction | 0 (0.0%) | 0 (0.0%) |
| Construction | 2,004 (93.0%) | 151 (7.0%) |
| Manufacturing | 2,999 (71.5%) | 1,197 (28.5%) |
| Wholesale Trade | 535 (84.5%) | 98 (15.5%) |
| Retail Trade | 2,275 (55.9%) | 1,792 (44.1%) |
| Transportation & Warehousing | 1,266 (80.2%) | 312 (19.8%) |
| Utilities | 162 (94.7%) | 9 (5.3%) |
| Information | 802 (83.8%) | 155 (16.2%) |
| Finance & Insurance | 1,002 (37.9%) | 1,645 (62.2%) |
| Real Estate, Rental & Leasing | 232 (64.8%) | 126 (35.2%) |
| Professional & Scientific | 725 (46.4%) | 837 (53.6%) |
| Enterprise Management | 0 (0.0%) | 17 (100.0%) |
| Administrative & Support | 882 (67.3%) | 429 (32.7%) |
| Educational Services | 900 (31.9%) | 1,925 (68.1%) |
| Health Care & Social Assistance | 785 (14.7%) | 4,537 (85.3%) |
| Arts, Entertainment & Recreation | 361 (60.6%) | 235 (39.4%) |
| Accommodation & Food Services | 629 (37.3%) | 1,059 (62.7%) |
| Public Administration | 607 (53.5%) | 528 (46.5%) |
| Total | 16,940 (51.5%) | 15,920 (48.4%) |
Education in Bristol
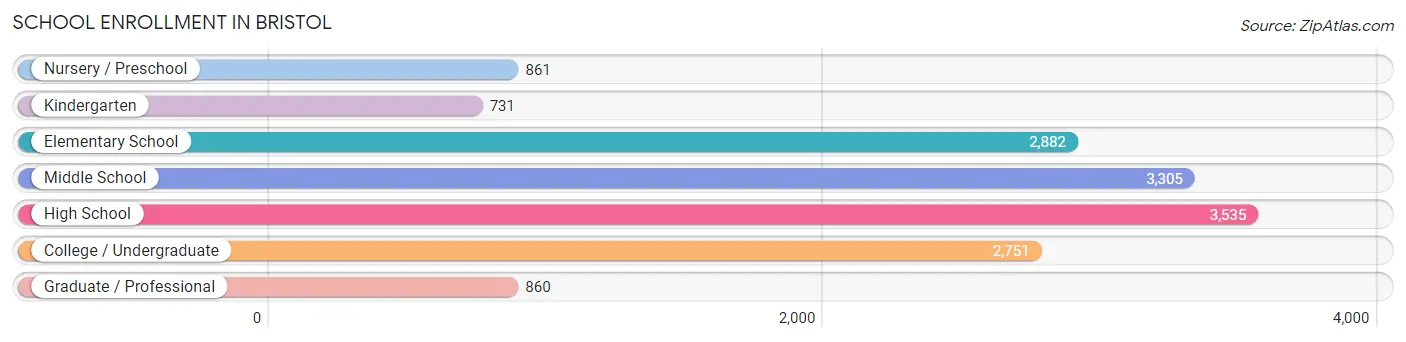
School Enrollment in Bristol
The most common levels of schooling among the 14,925 students in Bristol are high school (3,535 | 23.7%), middle school (3,305 | 22.1%), and elementary school (2,882 | 19.3%).
| School Level | # Students | % Students |
| Nursery / Preschool | 861 | 5.8% |
| Kindergarten | 731 | 4.9% |
| Elementary School | 2,882 | 19.3% |
| Middle School | 3,305 | 22.1% |
| High School | 3,535 | 23.7% |
| College / Undergraduate | 2,751 | 18.4% |
| Graduate / Professional | 860 | 5.8% |
| Total | 14,925 | 100.0% |
School Enrollment by Age by Funding Source in Bristol
Out of a total of 14,925 students who are enrolled in schools in Bristol, 2,209 (14.8%) attend a private institution, while the remaining 12,716 (85.2%) are enrolled in public schools. The age group of 35 years and over has the highest likelihood of being enrolled in private schools, with 396 (53.7% in the age bracket) enrolled. Conversely, the age group of 5 to 9 year old has the lowest likelihood of being enrolled in a private school, with 3,061 (93.9% in the age bracket) attending a public institution.
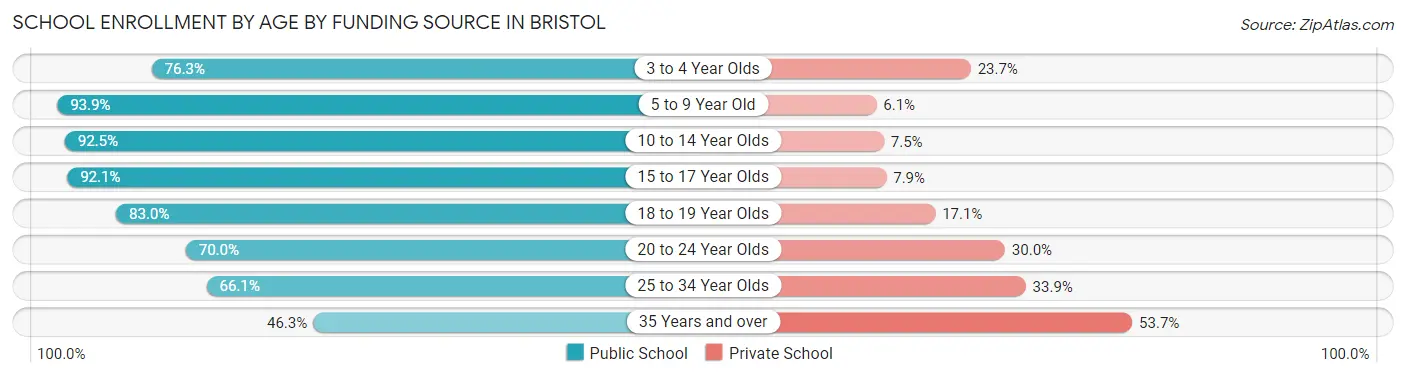
| Age Bracket | Public School | Private School |
| 3 to 4 Year Olds | 671 (76.3%) | 208 (23.7%) |
| 5 to 9 Year Old | 3,061 (93.9%) | 198 (6.1%) |
| 10 to 14 Year Olds | 3,940 (92.5%) | 319 (7.5%) |
| 15 to 17 Year Olds | 2,179 (92.1%) | 188 (7.9%) |
| 18 to 19 Year Olds | 1,041 (83.0%) | 214 (17.1%) |
| 20 to 24 Year Olds | 783 (70.0%) | 336 (30.0%) |
| 25 to 34 Year Olds | 694 (66.1%) | 356 (33.9%) |
| 35 Years and over | 341 (46.3%) | 396 (53.7%) |
| Total | 12,716 (85.2%) | 2,209 (14.8%) |
Educational Attainment by Field of Study in Bristol
Business (2,951 | 21.6%), science & technology (1,630 | 11.9%), education (1,318 | 9.7%), arts & humanities (1,138 | 8.3%), and literature & languages (952 | 7.0%) are the most common fields of study among 13,653 individuals in Bristol who have obtained a bachelor's degree or higher.
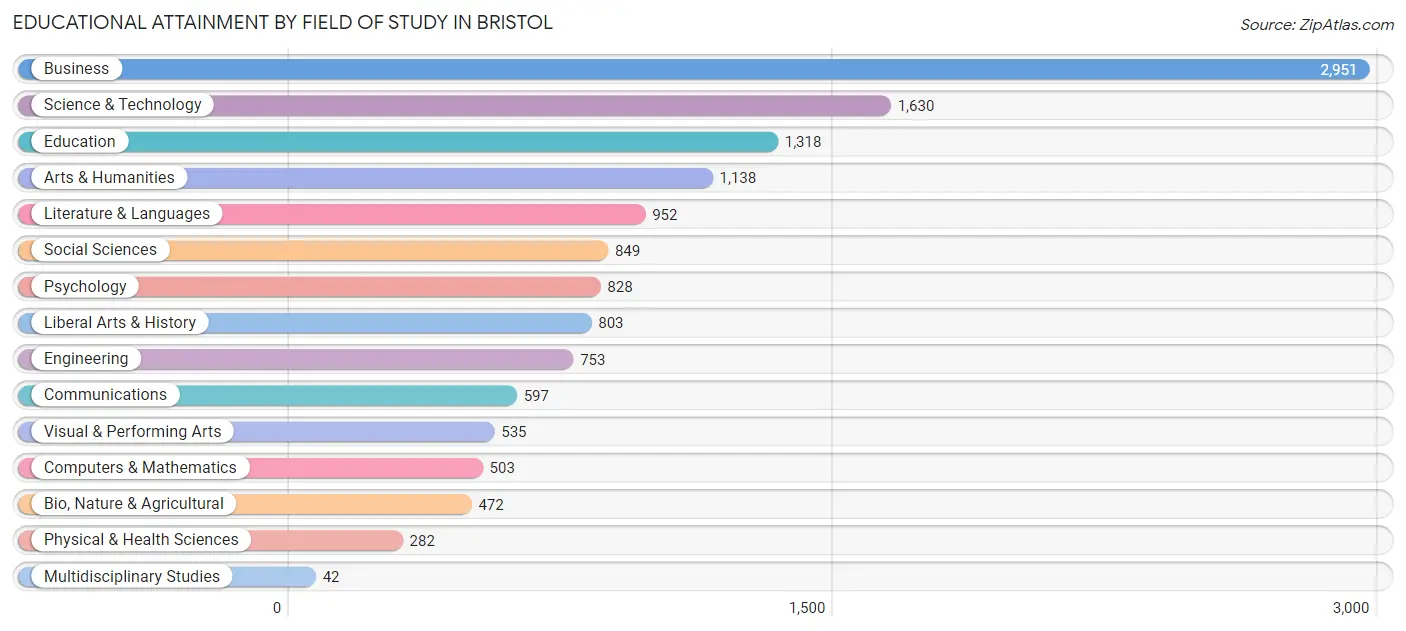
| Field of Study | # Graduates | % Graduates |
| Computers & Mathematics | 503 | 3.7% |
| Bio, Nature & Agricultural | 472 | 3.5% |
| Physical & Health Sciences | 282 | 2.1% |
| Psychology | 828 | 6.1% |
| Social Sciences | 849 | 6.2% |
| Engineering | 753 | 5.5% |
| Multidisciplinary Studies | 42 | 0.3% |
| Science & Technology | 1,630 | 11.9% |
| Business | 2,951 | 21.6% |
| Education | 1,318 | 9.7% |
| Literature & Languages | 952 | 7.0% |
| Liberal Arts & History | 803 | 5.9% |
| Visual & Performing Arts | 535 | 3.9% |
| Communications | 597 | 4.4% |
| Arts & Humanities | 1,138 | 8.3% |
| Total | 13,653 | 100.0% |
Transportation & Commute in Bristol
Vehicle Availability by Sex in Bristol
The most prevalent vehicle ownership categories in Bristol are males with 2 vehicles (7,094, accounting for 42.2%) and females with 2 vehicles (6,538, making up 45.9%).
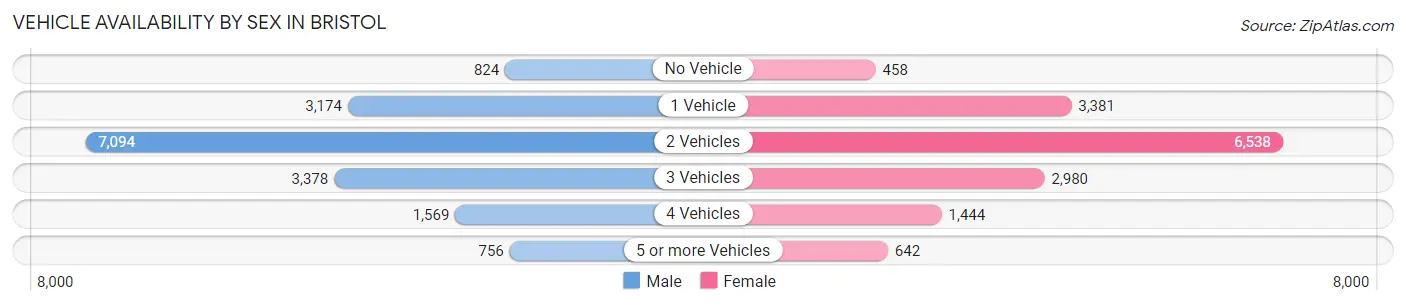
| Vehicles Available | Male | Female |
| No Vehicle | 824 (4.9%) | 458 (3.0%) |
| 1 Vehicle | 3,174 (18.9%) | 3,381 (21.9%) |
| 2 Vehicles | 7,094 (42.2%) | 6,538 (42.3%) |
| 3 Vehicles | 3,378 (20.1%) | 2,980 (19.3%) |
| 4 Vehicles | 1,569 (9.3%) | 1,444 (9.3%) |
| 5 or more Vehicles | 756 (4.5%) | 642 (4.2%) |
| Total | 16,795 (100.0%) | 15,443 (100.0%) |
Commute Time in Bristol
The most frequently occuring commute durations in Bristol are 20 to 24 minutes (4,442 commuters, 15.3%), 10 to 14 minutes (4,409 commuters, 15.1%), and 15 to 19 minutes (4,257 commuters, 14.6%).
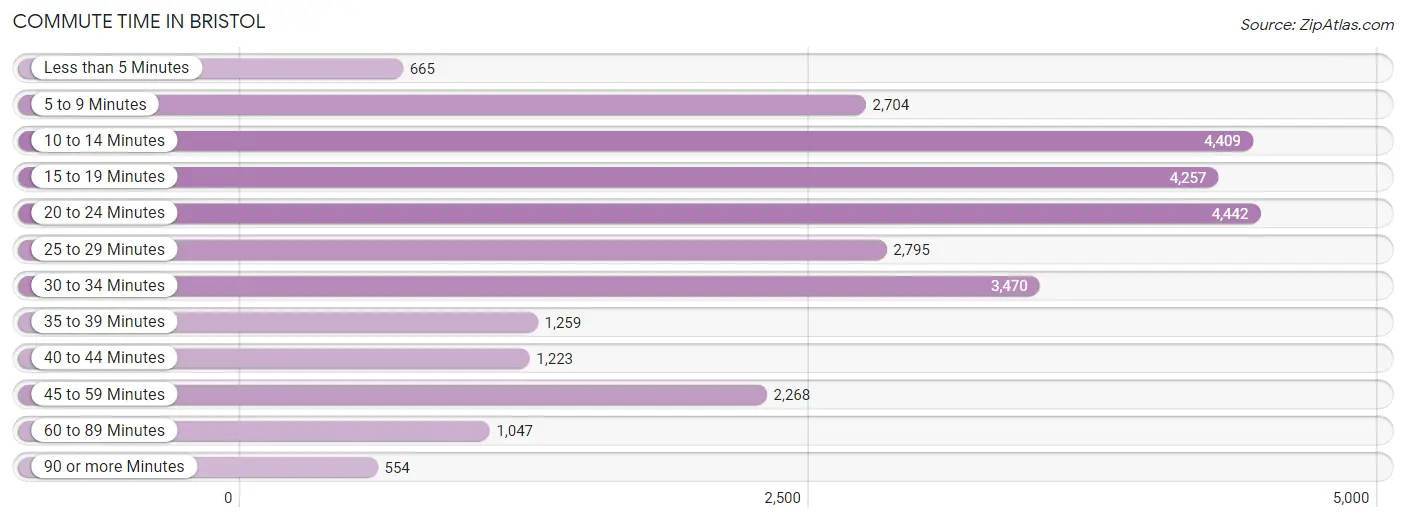
| Commute Time | # Commuters | % Commuters |
| Less than 5 Minutes | 665 | 2.3% |
| 5 to 9 Minutes | 2,704 | 9.3% |
| 10 to 14 Minutes | 4,409 | 15.1% |
| 15 to 19 Minutes | 4,257 | 14.6% |
| 20 to 24 Minutes | 4,442 | 15.3% |
| 25 to 29 Minutes | 2,795 | 9.6% |
| 30 to 34 Minutes | 3,470 | 11.9% |
| 35 to 39 Minutes | 1,259 | 4.3% |
| 40 to 44 Minutes | 1,223 | 4.2% |
| 45 to 59 Minutes | 2,268 | 7.8% |
| 60 to 89 Minutes | 1,047 | 3.6% |
| 90 or more Minutes | 554 | 1.9% |
Commute Time by Sex in Bristol
The most common commute times in Bristol are 20 to 24 minutes (2,690 commuters, 17.1%) for males and 15 to 19 minutes (2,326 commuters, 17.5%) for females.
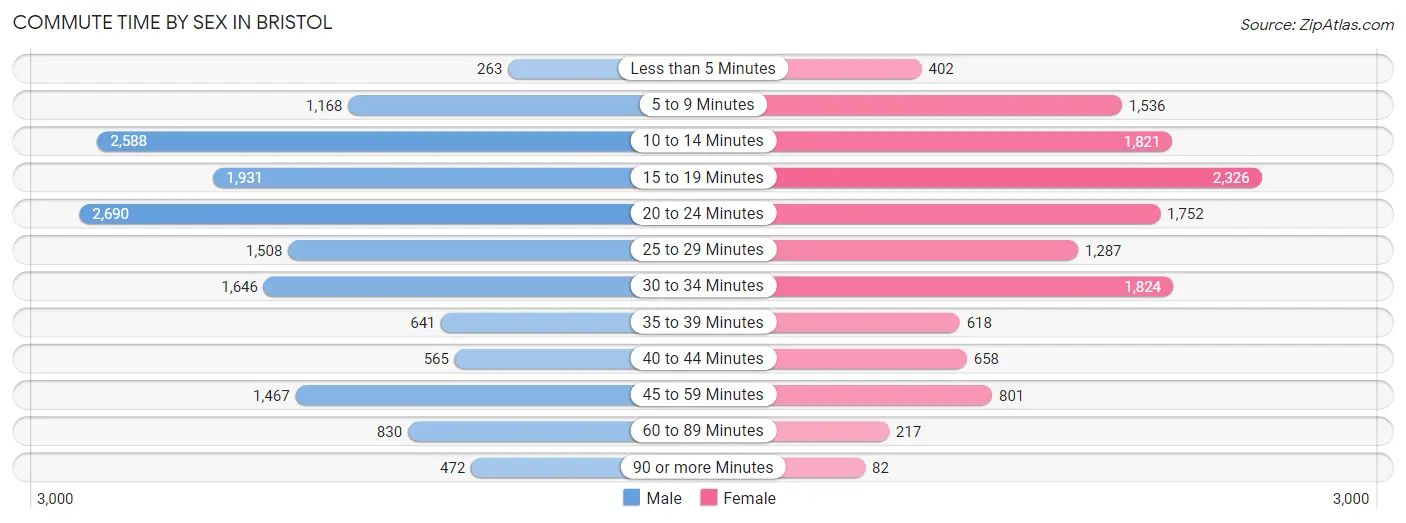
| Commute Time | Male | Female |
| Less than 5 Minutes | 263 (1.7%) | 402 (3.0%) |
| 5 to 9 Minutes | 1,168 (7.4%) | 1,536 (11.5%) |
| 10 to 14 Minutes | 2,588 (16.4%) | 1,821 (13.7%) |
| 15 to 19 Minutes | 1,931 (12.2%) | 2,326 (17.5%) |
| 20 to 24 Minutes | 2,690 (17.1%) | 1,752 (13.2%) |
| 25 to 29 Minutes | 1,508 (9.6%) | 1,287 (9.7%) |
| 30 to 34 Minutes | 1,646 (10.4%) | 1,824 (13.7%) |
| 35 to 39 Minutes | 641 (4.1%) | 618 (4.6%) |
| 40 to 44 Minutes | 565 (3.6%) | 658 (4.9%) |
| 45 to 59 Minutes | 1,467 (9.3%) | 801 (6.0%) |
| 60 to 89 Minutes | 830 (5.3%) | 217 (1.6%) |
| 90 or more Minutes | 472 (3.0%) | 82 (0.6%) |
Time of Departure to Work by Sex in Bristol
The most frequent times of departure to work in Bristol are 7:00 AM to 7:29 AM (2,007, 12.7%) for males and 7:00 AM to 7:29 AM (2,214, 16.6%) for females.
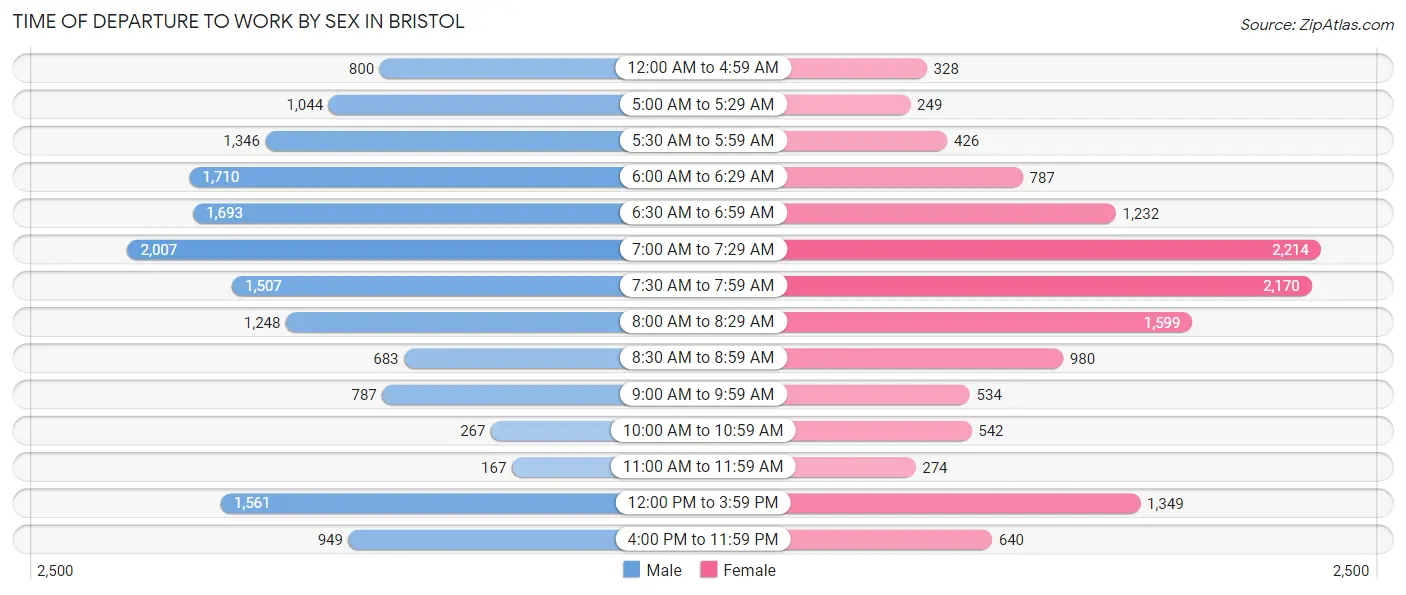
| Time of Departure | Male | Female |
| 12:00 AM to 4:59 AM | 800 (5.1%) | 328 (2.5%) |
| 5:00 AM to 5:29 AM | 1,044 (6.6%) | 249 (1.9%) |
| 5:30 AM to 5:59 AM | 1,346 (8.5%) | 426 (3.2%) |
| 6:00 AM to 6:29 AM | 1,710 (10.8%) | 787 (5.9%) |
| 6:30 AM to 6:59 AM | 1,693 (10.7%) | 1,232 (9.2%) |
| 7:00 AM to 7:29 AM | 2,007 (12.7%) | 2,214 (16.6%) |
| 7:30 AM to 7:59 AM | 1,507 (9.6%) | 2,170 (16.3%) |
| 8:00 AM to 8:29 AM | 1,248 (7.9%) | 1,599 (12.0%) |
| 8:30 AM to 8:59 AM | 683 (4.3%) | 980 (7.4%) |
| 9:00 AM to 9:59 AM | 787 (5.0%) | 534 (4.0%) |
| 10:00 AM to 10:59 AM | 267 (1.7%) | 542 (4.1%) |
| 11:00 AM to 11:59 AM | 167 (1.1%) | 274 (2.1%) |
| 12:00 PM to 3:59 PM | 1,561 (9.9%) | 1,349 (10.1%) |
| 4:00 PM to 11:59 PM | 949 (6.0%) | 640 (4.8%) |
| Total | 15,769 (100.0%) | 13,324 (100.0%) |
Housing Occupancy in Bristol
Occupancy by Ownership in Bristol
Of the total 24,076 dwellings in Bristol, owner-occupied units account for 15,659 (65.0%), while renter-occupied units make up 8,417 (35.0%).
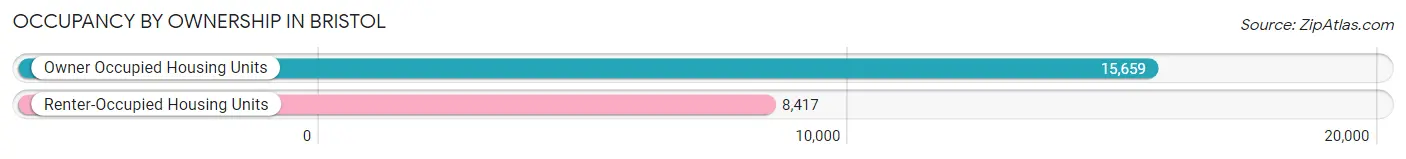
| Occupancy | # Housing Units | % Housing Units |
| Owner Occupied Housing Units | 15,659 | 65.0% |
| Renter-Occupied Housing Units | 8,417 | 35.0% |
| Total Occupied Housing Units | 24,076 | 100.0% |
Occupancy by Household Size in Bristol
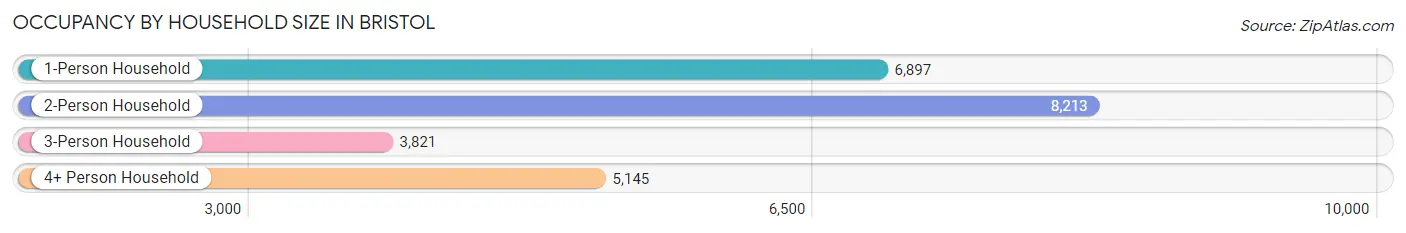
| Household Size | # Housing Units | % Housing Units |
| 1-Person Household | 6,897 | 28.6% |
| 2-Person Household | 8,213 | 34.1% |
| 3-Person Household | 3,821 | 15.9% |
| 4+ Person Household | 5,145 | 21.4% |
| Total Housing Units | 24,076 | 100.0% |
Occupancy by Ownership by Household Size in Bristol
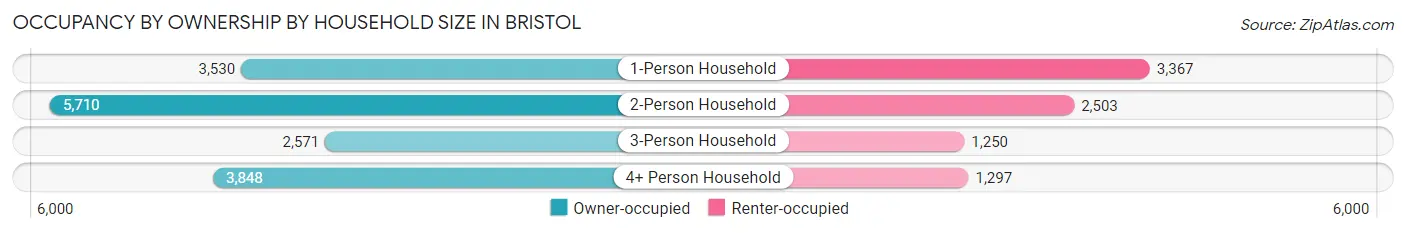
| Household Size | Owner-occupied | Renter-occupied |
| 1-Person Household | 3,530 (51.2%) | 3,367 (48.8%) |
| 2-Person Household | 5,710 (69.5%) | 2,503 (30.5%) |
| 3-Person Household | 2,571 (67.3%) | 1,250 (32.7%) |
| 4+ Person Household | 3,848 (74.8%) | 1,297 (25.2%) |
| Total Housing Units | 15,659 (65.0%) | 8,417 (35.0%) |
Occupancy by Educational Attainment in Bristol
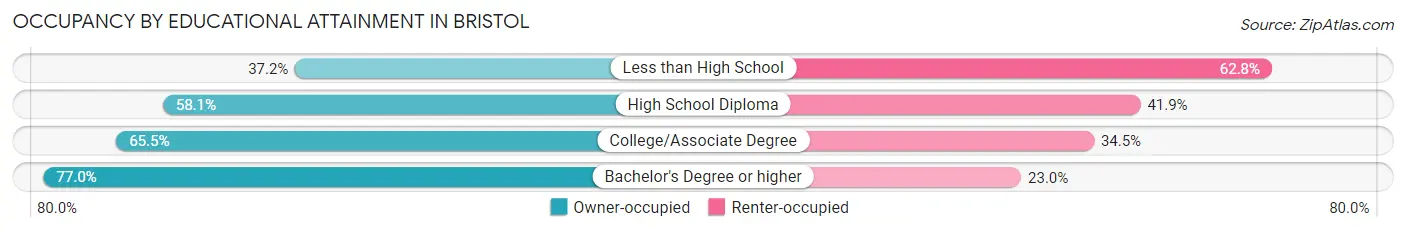
| Household Size | Owner-occupied | Renter-occupied |
| Less than High School | 581 (37.2%) | 979 (62.8%) |
| High School Diploma | 4,162 (58.1%) | 3,004 (41.9%) |
| College/Associate Degree | 5,130 (65.5%) | 2,707 (34.5%) |
| Bachelor's Degree or higher | 5,786 (77.0%) | 1,727 (23.0%) |
Occupancy by Age of Householder in Bristol
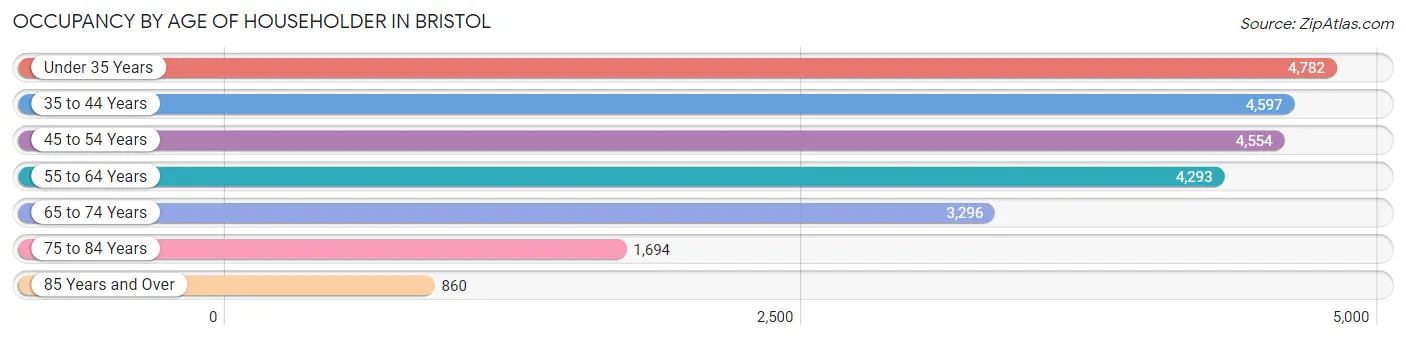
| Age Bracket | # Households | % Households |
| Under 35 Years | 4,782 | 19.9% |
| 35 to 44 Years | 4,597 | 19.1% |
| 45 to 54 Years | 4,554 | 18.9% |
| 55 to 64 Years | 4,293 | 17.8% |
| 65 to 74 Years | 3,296 | 13.7% |
| 75 to 84 Years | 1,694 | 7.0% |
| 85 Years and Over | 860 | 3.6% |
| Total | 24,076 | 100.0% |
Housing Finances in Bristol
Median Income by Occupancy in Bristol
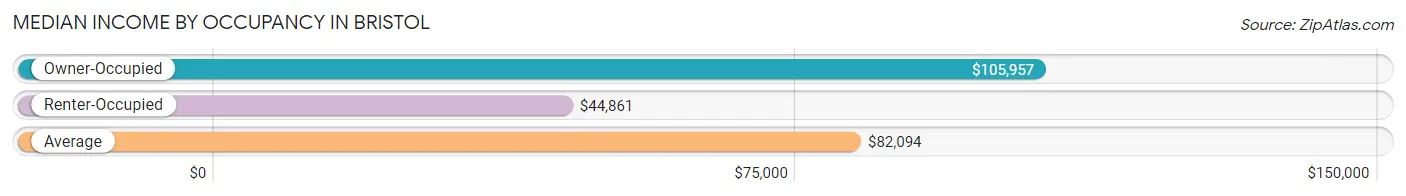
| Occupancy Type | # Households | Median Income |
| Owner-Occupied | 15,659 (65.0%) | $105,957 |
| Renter-Occupied | 8,417 (35.0%) | $44,861 |
| Average | 24,076 (100.0%) | $82,094 |
Occupancy by Householder Income Bracket in Bristol
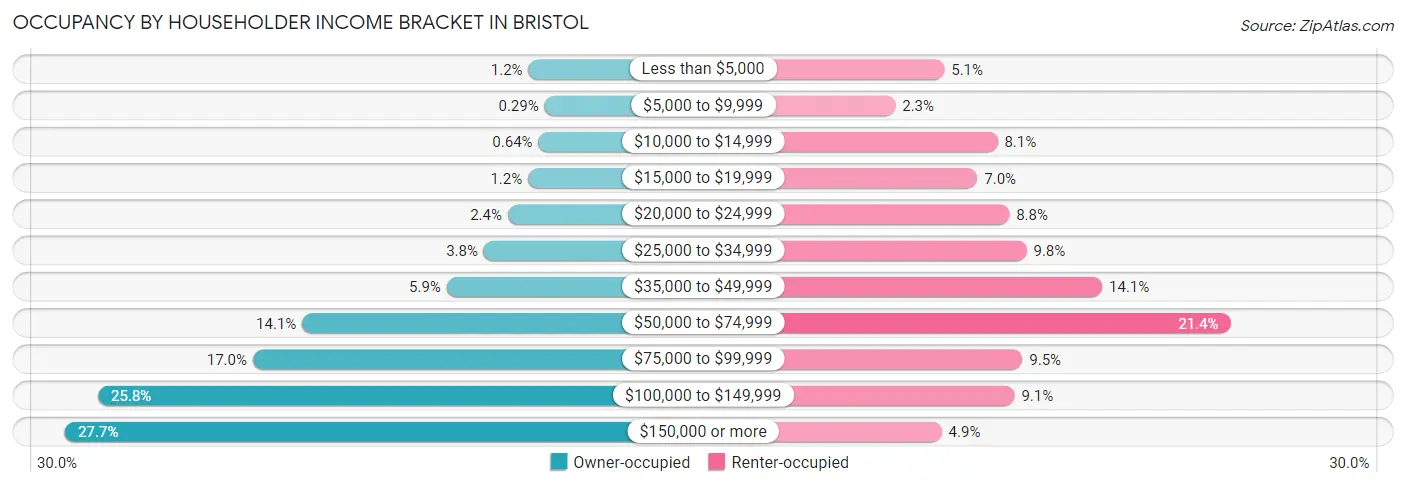
| Income Bracket | Owner-occupied | Renter-occupied |
| Less than $5,000 | 189 (1.2%) | 427 (5.1%) |
| $5,000 to $9,999 | 46 (0.3%) | 191 (2.3%) |
| $10,000 to $14,999 | 100 (0.6%) | 683 (8.1%) |
| $15,000 to $19,999 | 193 (1.2%) | 586 (7.0%) |
| $20,000 to $24,999 | 374 (2.4%) | 739 (8.8%) |
| $25,000 to $34,999 | 589 (3.8%) | 822 (9.8%) |
| $35,000 to $49,999 | 921 (5.9%) | 1,186 (14.1%) |
| $50,000 to $74,999 | 2,214 (14.1%) | 1,803 (21.4%) |
| $75,000 to $99,999 | 2,655 (17.0%) | 802 (9.5%) |
| $100,000 to $149,999 | 4,042 (25.8%) | 764 (9.1%) |
| $150,000 or more | 4,336 (27.7%) | 414 (4.9%) |
| Total | 15,659 (100.0%) | 8,417 (100.0%) |
Monthly Housing Cost Tiers in Bristol
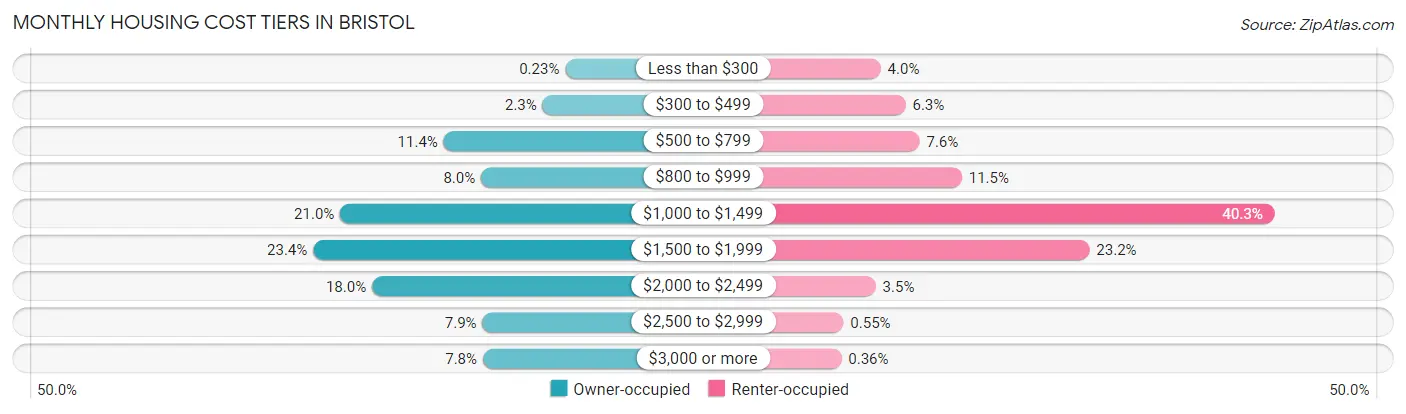
| Monthly Cost | Owner-occupied | Renter-occupied |
| Less than $300 | 36 (0.2%) | 335 (4.0%) |
| $300 to $499 | 361 (2.3%) | 528 (6.3%) |
| $500 to $799 | 1,788 (11.4%) | 636 (7.6%) |
| $800 to $999 | 1,250 (8.0%) | 964 (11.5%) |
| $1,000 to $1,499 | 3,280 (20.9%) | 3,388 (40.3%) |
| $1,500 to $1,999 | 3,671 (23.4%) | 1,953 (23.2%) |
| $2,000 to $2,499 | 2,821 (18.0%) | 296 (3.5%) |
| $2,500 to $2,999 | 1,229 (7.9%) | 46 (0.5%) |
| $3,000 or more | 1,223 (7.8%) | 30 (0.4%) |
| Total | 15,659 (100.0%) | 8,417 (100.0%) |
Physical Housing Characteristics in Bristol
Housing Structures in Bristol
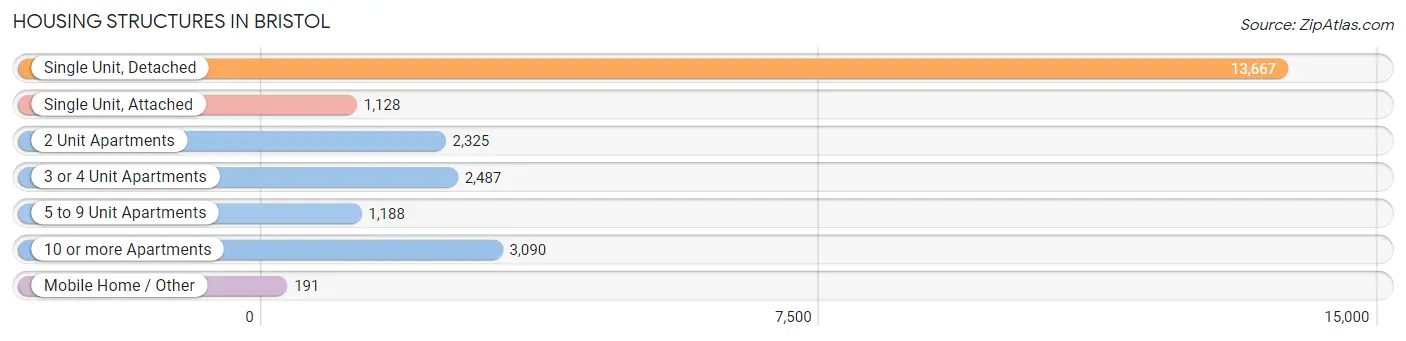
| Structure Type | # Housing Units | % Housing Units |
| Single Unit, Detached | 13,667 | 56.8% |
| Single Unit, Attached | 1,128 | 4.7% |
| 2 Unit Apartments | 2,325 | 9.7% |
| 3 or 4 Unit Apartments | 2,487 | 10.3% |
| 5 to 9 Unit Apartments | 1,188 | 4.9% |
| 10 or more Apartments | 3,090 | 12.8% |
| Mobile Home / Other | 191 | 0.8% |
| Total | 24,076 | 100.0% |
Housing Structures by Occupancy in Bristol
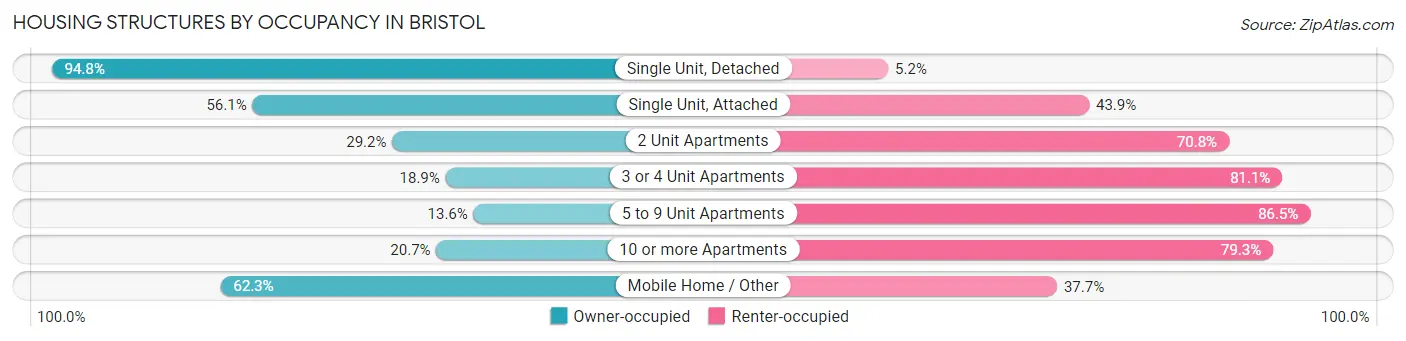
| Structure Type | Owner-occupied | Renter-occupied |
| Single Unit, Detached | 12,956 (94.8%) | 711 (5.2%) |
| Single Unit, Attached | 633 (56.1%) | 495 (43.9%) |
| 2 Unit Apartments | 679 (29.2%) | 1,646 (70.8%) |
| 3 or 4 Unit Apartments | 471 (18.9%) | 2,016 (81.1%) |
| 5 to 9 Unit Apartments | 161 (13.6%) | 1,027 (86.5%) |
| 10 or more Apartments | 640 (20.7%) | 2,450 (79.3%) |
| Mobile Home / Other | 119 (62.3%) | 72 (37.7%) |
| Total | 15,659 (65.0%) | 8,417 (35.0%) |
Housing Structures by Number of Rooms in Bristol
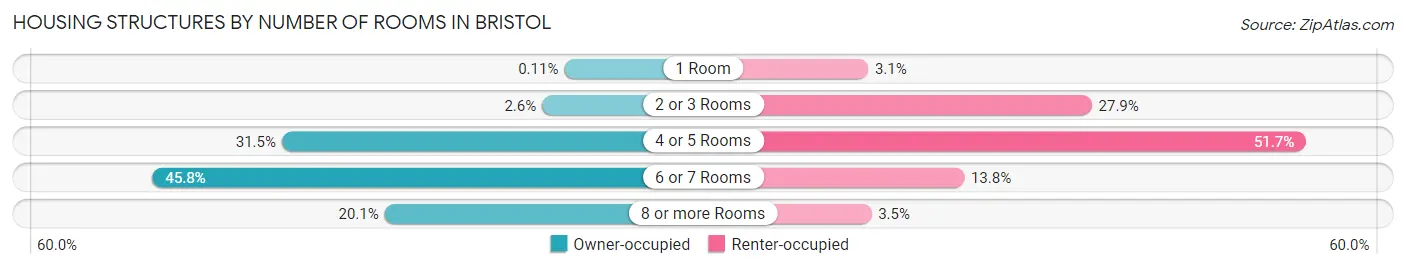
| Number of Rooms | Owner-occupied | Renter-occupied |
| 1 Room | 17 (0.1%) | 262 (3.1%) |
| 2 or 3 Rooms | 402 (2.6%) | 2,351 (27.9%) |
| 4 or 5 Rooms | 4,927 (31.5%) | 4,353 (51.7%) |
| 6 or 7 Rooms | 7,173 (45.8%) | 1,159 (13.8%) |
| 8 or more Rooms | 3,140 (20.1%) | 292 (3.5%) |
| Total | 15,659 (100.0%) | 8,417 (100.0%) |
Housing Structure by Heating Type in Bristol
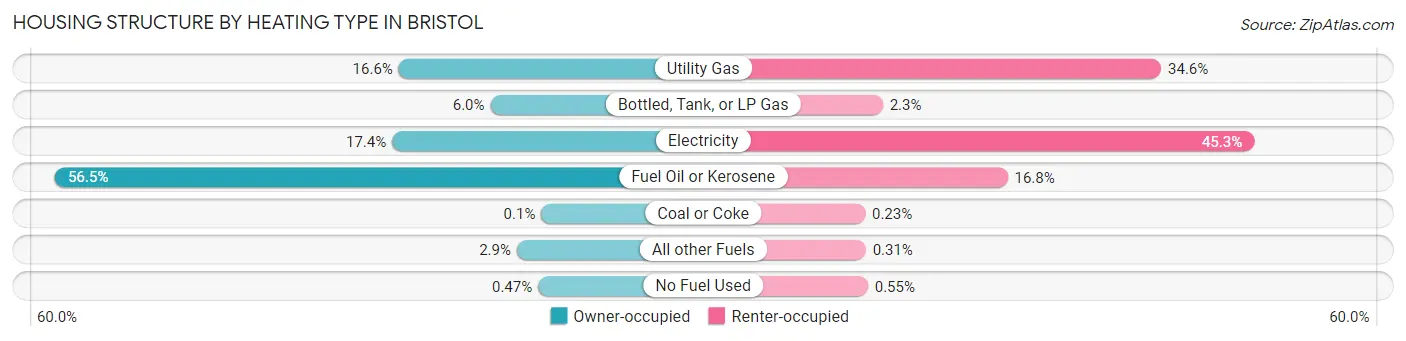
| Heating Type | Owner-occupied | Renter-occupied |
| Utility Gas | 2,604 (16.6%) | 2,909 (34.6%) |
| Bottled, Tank, or LP Gas | 940 (6.0%) | 192 (2.3%) |
| Electricity | 2,724 (17.4%) | 3,815 (45.3%) |
| Fuel Oil or Kerosene | 8,843 (56.5%) | 1,410 (16.8%) |
| Coal or Coke | 16 (0.1%) | 19 (0.2%) |
| All other Fuels | 459 (2.9%) | 26 (0.3%) |
| No Fuel Used | 73 (0.5%) | 46 (0.5%) |
| Total | 15,659 (100.0%) | 8,417 (100.0%) |
Household Vehicle Usage in Bristol
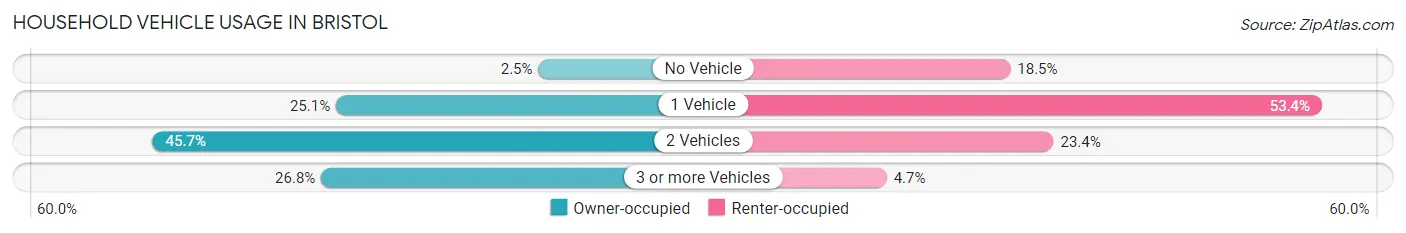
| Vehicles per Household | Owner-occupied | Renter-occupied |
| No Vehicle | 384 (2.5%) | 1,560 (18.5%) |
| 1 Vehicle | 3,934 (25.1%) | 4,496 (53.4%) |
| 2 Vehicles | 7,148 (45.7%) | 1,967 (23.4%) |
| 3 or more Vehicles | 4,193 (26.8%) | 394 (4.7%) |
| Total | 15,659 (100.0%) | 8,417 (100.0%) |
Real Estate & Mortgages in Bristol
Real Estate and Mortgage Overview in Bristol
| Characteristic | Without Mortgage | With Mortgage |
| Housing Units | 4,424 | 11,235 |
| Median Property Value | $221,700 | $240,400 |
| Median Household Income | $86,354 | $3,481 |
| Monthly Housing Costs | $826 | $1,210 |
| Real Estate Taxes | $4,906 | $189 |
Property Value by Mortgage Status in Bristol
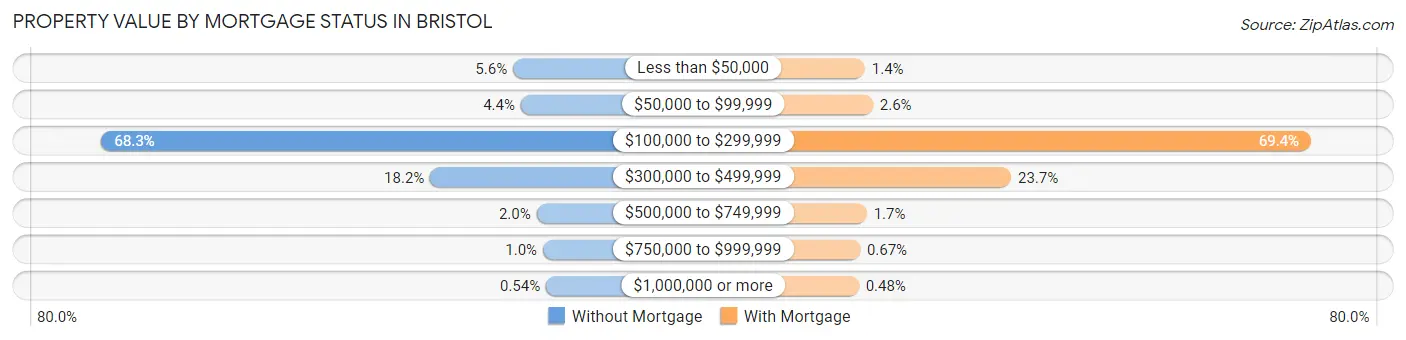
| Property Value | Without Mortgage | With Mortgage |
| Less than $50,000 | 247 (5.6%) | 159 (1.4%) |
| $50,000 to $99,999 | 194 (4.4%) | 297 (2.6%) |
| $100,000 to $299,999 | 3,021 (68.3%) | 7,796 (69.4%) |
| $300,000 to $499,999 | 805 (18.2%) | 2,663 (23.7%) |
| $500,000 to $749,999 | 88 (2.0%) | 191 (1.7%) |
| $750,000 to $999,999 | 45 (1.0%) | 75 (0.7%) |
| $1,000,000 or more | 24 (0.5%) | 54 (0.5%) |
| Total | 4,424 (100.0%) | 11,235 (100.0%) |
Household Income by Mortgage Status in Bristol
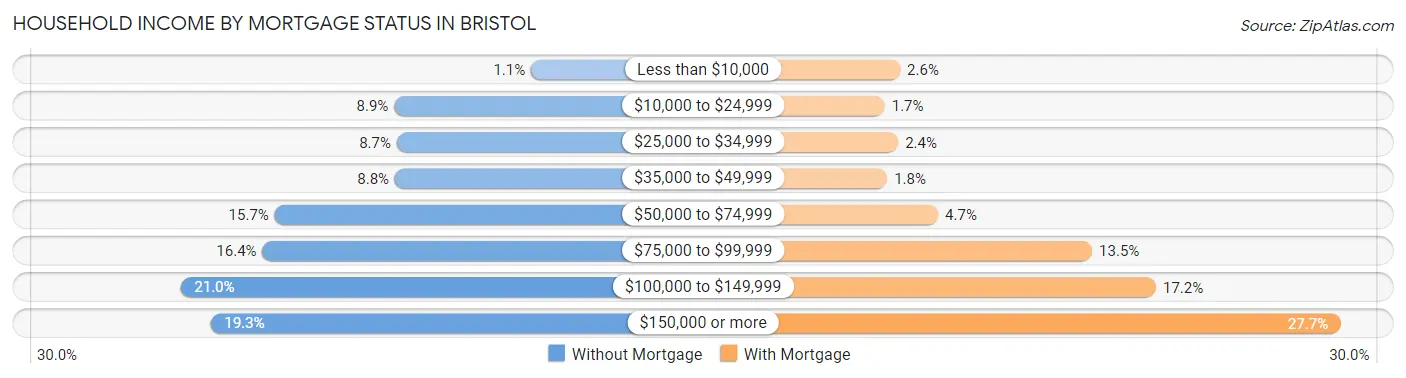
| Household Income | Without Mortgage | With Mortgage |
| Less than $10,000 | 47 (1.1%) | 286 (2.5%) |
| $10,000 to $24,999 | 393 (8.9%) | 188 (1.7%) |
| $25,000 to $34,999 | 386 (8.7%) | 274 (2.4%) |
| $35,000 to $49,999 | 391 (8.8%) | 203 (1.8%) |
| $50,000 to $74,999 | 695 (15.7%) | 530 (4.7%) |
| $75,000 to $99,999 | 726 (16.4%) | 1,519 (13.5%) |
| $100,000 to $149,999 | 931 (21.0%) | 1,929 (17.2%) |
| $150,000 or more | 855 (19.3%) | 3,111 (27.7%) |
| Total | 4,424 (100.0%) | 11,235 (100.0%) |
Property Value to Household Income Ratio in Bristol
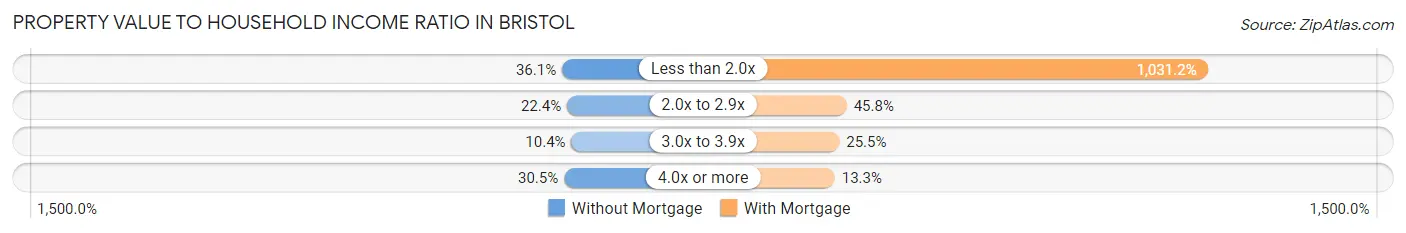
| Value-to-Income Ratio | Without Mortgage | With Mortgage |
| Less than 2.0x | 1,598 (36.1%) | 115,858 (1,031.2%) |
| 2.0x to 2.9x | 991 (22.4%) | 5,150 (45.8%) |
| 3.0x to 3.9x | 461 (10.4%) | 2,865 (25.5%) |
| 4.0x or more | 1,351 (30.5%) | 1,491 (13.3%) |
| Total | 4,424 (100.0%) | 11,235 (100.0%) |
Real Estate Taxes by Mortgage Status in Bristol
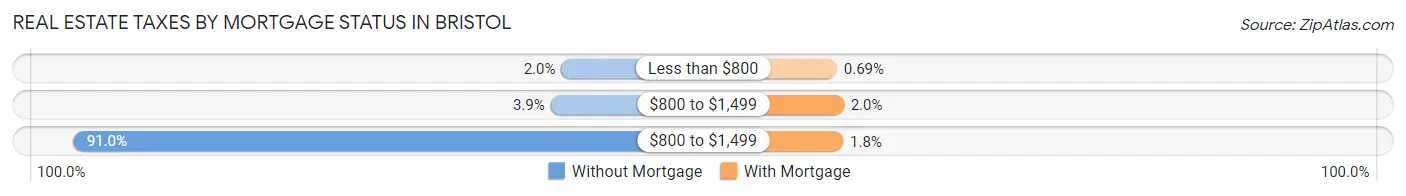
| Property Taxes | Without Mortgage | With Mortgage |
| Less than $800 | 87 (2.0%) | 77 (0.7%) |
| $800 to $1,499 | 174 (3.9%) | 219 (1.9%) |
| $800 to $1,499 | 4,026 (91.0%) | 207 (1.8%) |
| Total | 4,424 (100.0%) | 11,235 (100.0%) |
Health & Disability in Bristol
Health Insurance Coverage by Age in Bristol
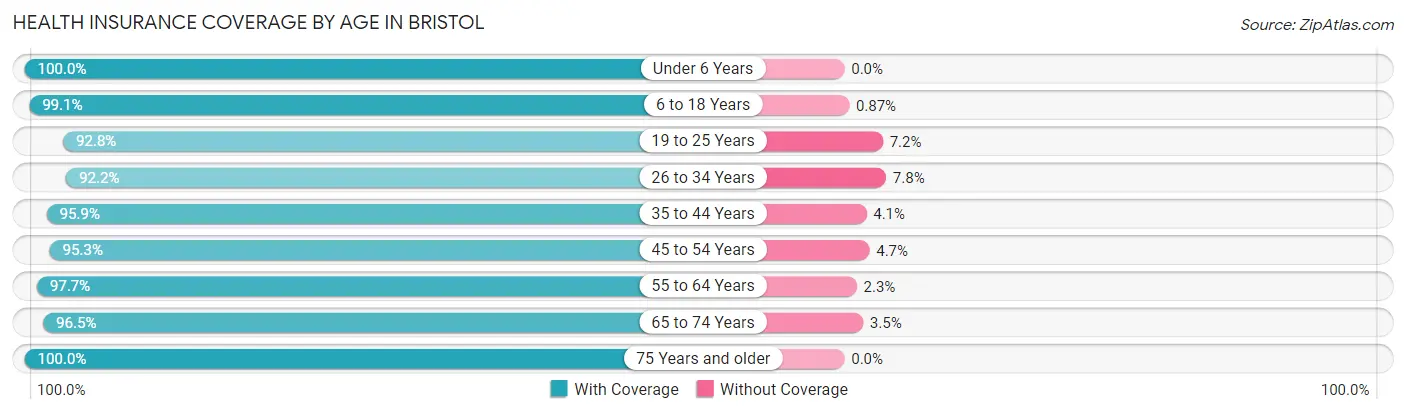
| Age Bracket | With Coverage | Without Coverage |
| Under 6 Years | 3,580 (100.0%) | 0 (0.0%) |
| 6 to 18 Years | 10,574 (99.1%) | 93 (0.9%) |
| 19 to 25 Years | 4,786 (92.8%) | 369 (7.2%) |
| 26 to 34 Years | 7,609 (92.2%) | 640 (7.8%) |
| 35 to 44 Years | 7,947 (95.9%) | 340 (4.1%) |
| 45 to 54 Years | 7,818 (95.3%) | 382 (4.7%) |
| 55 to 64 Years | 7,156 (97.7%) | 168 (2.3%) |
| 65 to 74 Years | 5,008 (96.5%) | 180 (3.5%) |
| 75 Years and older | 3,817 (100.0%) | 0 (0.0%) |
| Total | 58,295 (96.4%) | 2,172 (3.6%) |
Health Insurance Coverage by Citizenship Status in Bristol
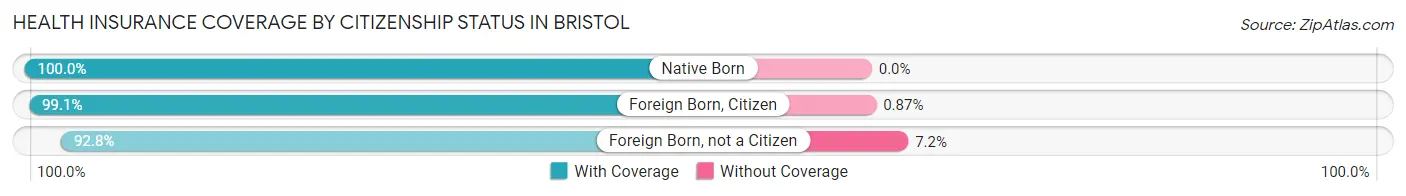
| Citizenship Status | With Coverage | Without Coverage |
| Native Born | 3,580 (100.0%) | 0 (0.0%) |
| Foreign Born, Citizen | 10,574 (99.1%) | 93 (0.9%) |
| Foreign Born, not a Citizen | 4,786 (92.8%) | 369 (7.2%) |
Health Insurance Coverage by Household Income in Bristol
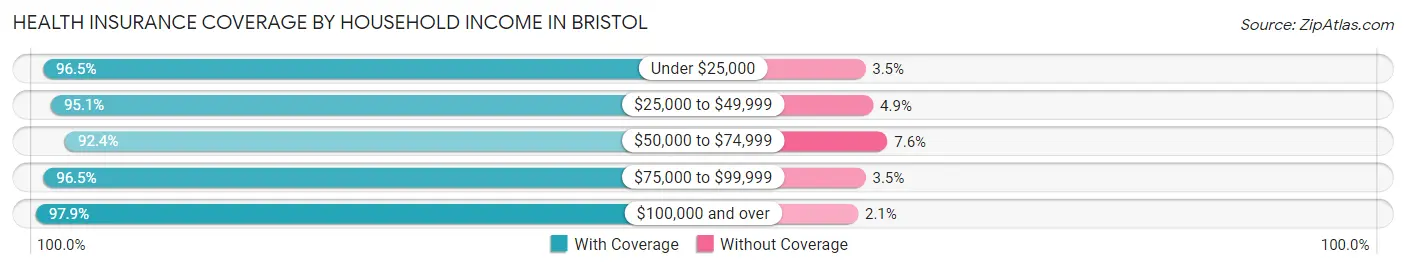
| Household Income | With Coverage | Without Coverage |
| Under $25,000 | 5,383 (96.5%) | 193 (3.5%) |
| $25,000 to $49,999 | 6,563 (95.1%) | 341 (4.9%) |
| $50,000 to $74,999 | 8,536 (92.4%) | 702 (7.6%) |
| $75,000 to $99,999 | 7,966 (96.5%) | 290 (3.5%) |
| $100,000 and over | 29,595 (97.9%) | 637 (2.1%) |
Public vs Private Health Insurance Coverage by Age in Bristol
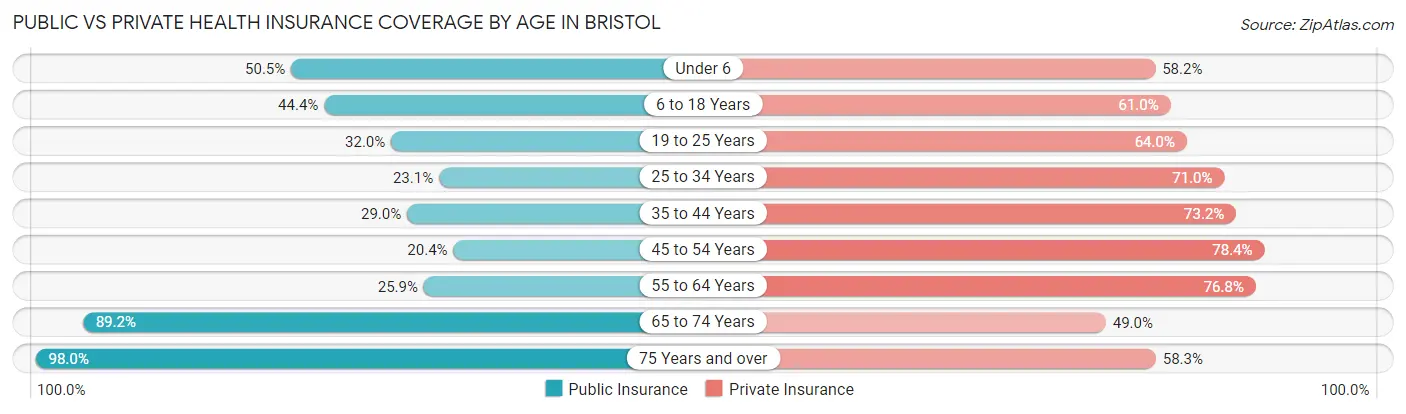
| Age Bracket | Public Insurance | Private Insurance |
| Under 6 | 1,809 (50.5%) | 2,083 (58.2%) |
| 6 to 18 Years | 4,736 (44.4%) | 6,509 (61.0%) |
| 19 to 25 Years | 1,648 (32.0%) | 3,300 (64.0%) |
| 25 to 34 Years | 1,904 (23.1%) | 5,857 (71.0%) |
| 35 to 44 Years | 2,404 (29.0%) | 6,065 (73.2%) |
| 45 to 54 Years | 1,674 (20.4%) | 6,432 (78.4%) |
| 55 to 64 Years | 1,897 (25.9%) | 5,627 (76.8%) |
| 65 to 74 Years | 4,628 (89.2%) | 2,542 (49.0%) |
| 75 Years and over | 3,739 (98.0%) | 2,225 (58.3%) |
| Total | 24,439 (40.4%) | 40,640 (67.2%) |
Disability Status by Sex by Age in Bristol
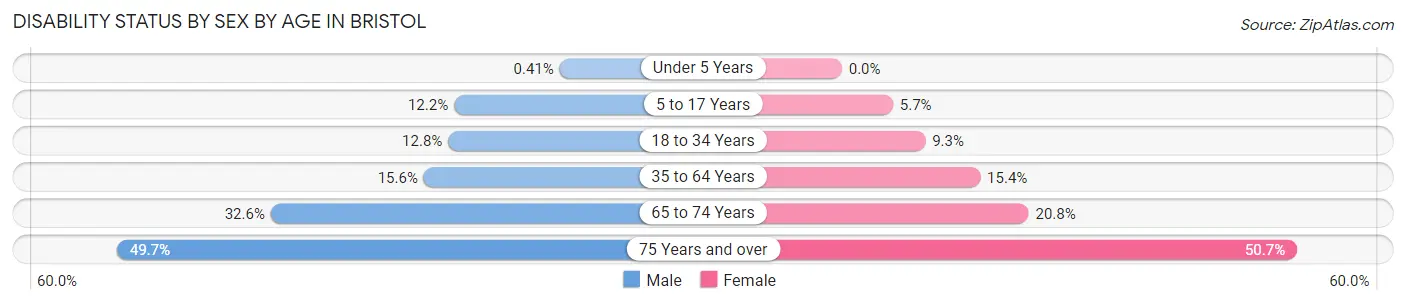
| Age Bracket | Male | Female |
| Under 5 Years | 6 (0.4%) | 0 (0.0%) |
| 5 to 17 Years | 594 (12.2%) | 294 (5.7%) |
| 18 to 34 Years | 979 (12.8%) | 653 (9.3%) |
| 35 to 64 Years | 1,884 (15.5%) | 1,803 (15.4%) |
| 65 to 74 Years | 735 (32.6%) | 610 (20.8%) |
| 75 Years and over | 814 (49.7%) | 1,105 (50.7%) |
Disability Class by Sex by Age in Bristol
Disability Class: Hearing Difficulty
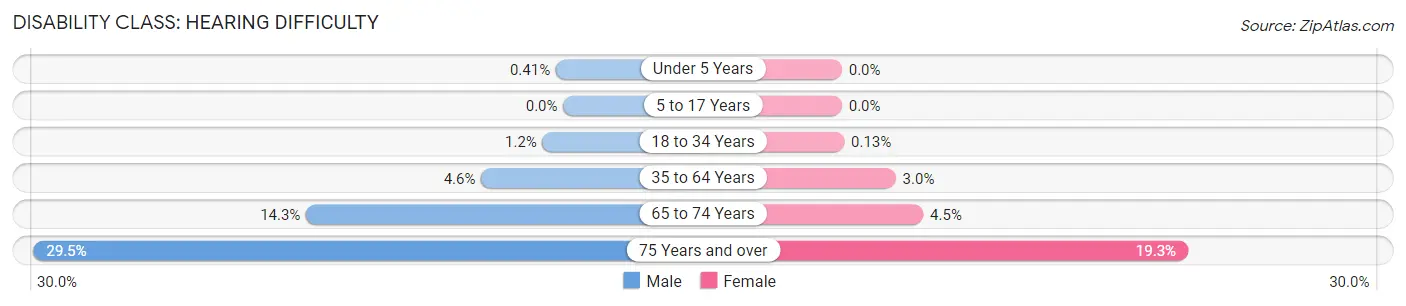
| Age Bracket | Male | Female |
| Under 5 Years | 6 (0.4%) | 0 (0.0%) |
| 5 to 17 Years | 0 (0.0%) | 0 (0.0%) |
| 18 to 34 Years | 88 (1.1%) | 9 (0.1%) |
| 35 to 64 Years | 554 (4.6%) | 351 (3.0%) |
| 65 to 74 Years | 323 (14.3%) | 133 (4.5%) |
| 75 Years and over | 483 (29.5%) | 420 (19.3%) |
Disability Class: Vision Difficulty
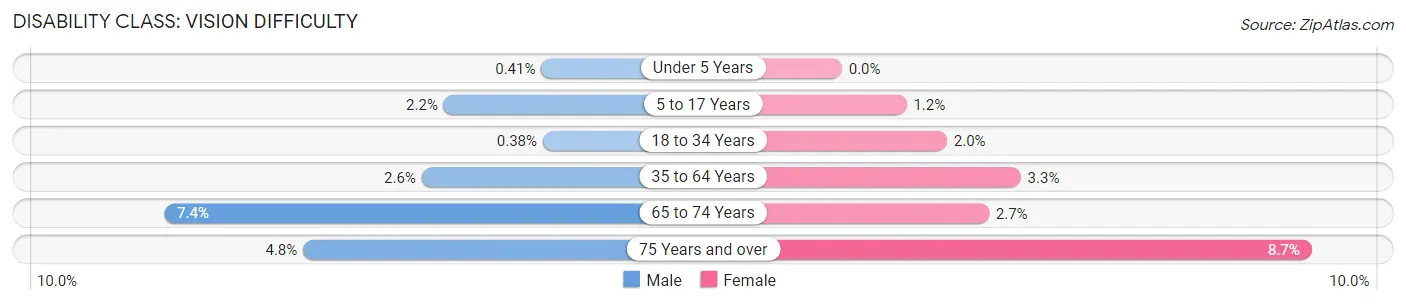
| Age Bracket | Male | Female |
| Under 5 Years | 6 (0.4%) | 0 (0.0%) |
| 5 to 17 Years | 108 (2.2%) | 62 (1.2%) |
| 18 to 34 Years | 29 (0.4%) | 137 (1.9%) |
| 35 to 64 Years | 319 (2.6%) | 388 (3.3%) |
| 65 to 74 Years | 167 (7.4%) | 80 (2.7%) |
| 75 Years and over | 79 (4.8%) | 190 (8.7%) |
Disability Class: Cognitive Difficulty
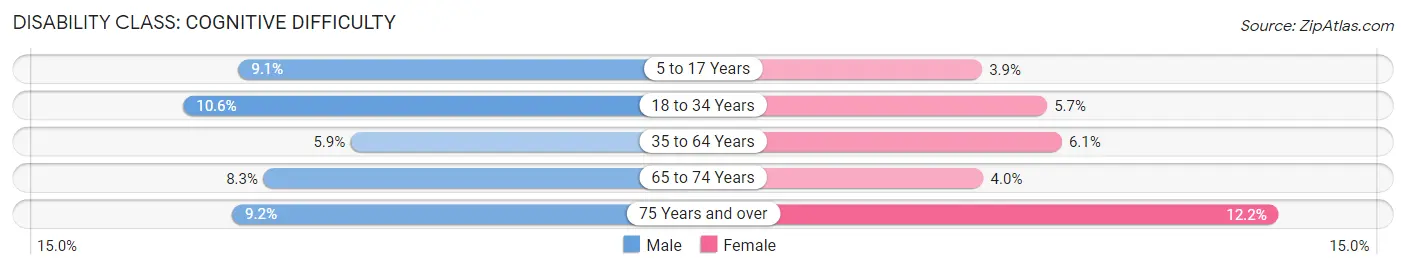
| Age Bracket | Male | Female |
| 5 to 17 Years | 441 (9.0%) | 202 (3.9%) |
| 18 to 34 Years | 807 (10.6%) | 402 (5.7%) |
| 35 to 64 Years | 716 (5.9%) | 717 (6.1%) |
| 65 to 74 Years | 188 (8.3%) | 116 (4.0%) |
| 75 Years and over | 151 (9.2%) | 265 (12.2%) |
Disability Class: Ambulatory Difficulty
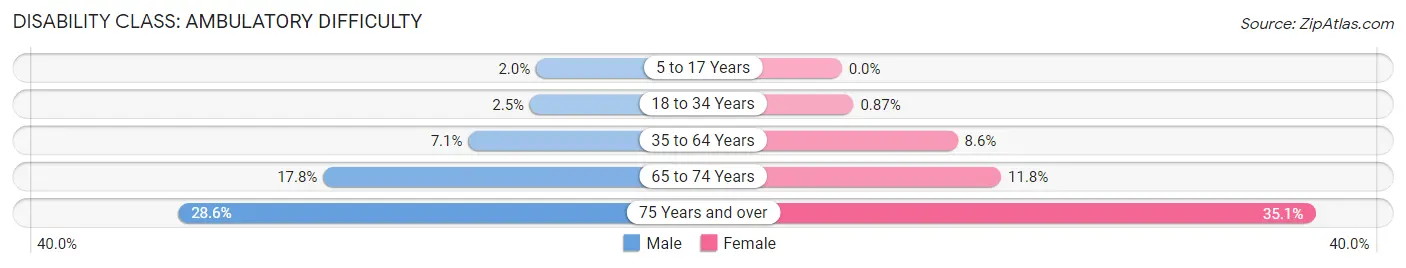
| Age Bracket | Male | Female |
| 5 to 17 Years | 99 (2.0%) | 0 (0.0%) |
| 18 to 34 Years | 189 (2.5%) | 61 (0.9%) |
| 35 to 64 Years | 855 (7.1%) | 1,006 (8.6%) |
| 65 to 74 Years | 402 (17.8%) | 347 (11.8%) |
| 75 Years and over | 468 (28.6%) | 766 (35.1%) |
Disability Class: Self-Care Difficulty
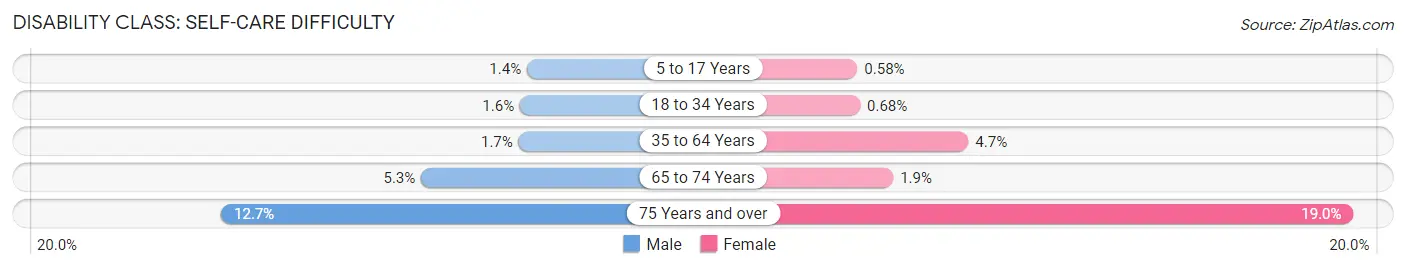
| Age Bracket | Male | Female |
| 5 to 17 Years | 66 (1.3%) | 30 (0.6%) |
| 18 to 34 Years | 123 (1.6%) | 48 (0.7%) |
| 35 to 64 Years | 201 (1.7%) | 550 (4.7%) |
| 65 to 74 Years | 119 (5.3%) | 56 (1.9%) |
| 75 Years and over | 208 (12.7%) | 414 (19.0%) |
Technology Access in Bristol
Computing Device Access in Bristol
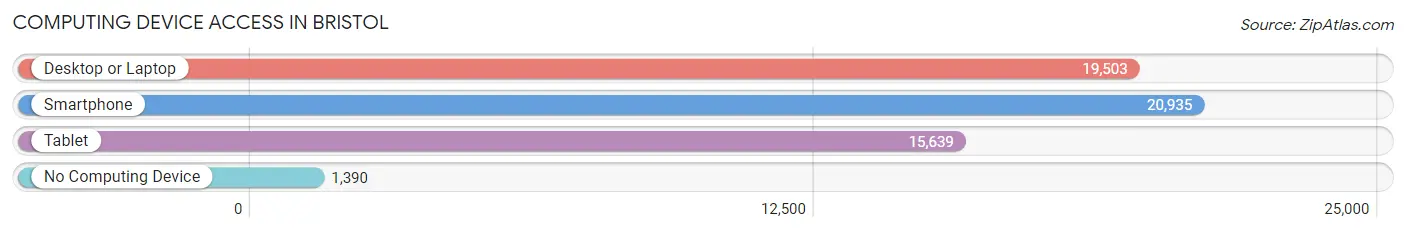
| Device Type | # Households | % Households |
| Desktop or Laptop | 19,503 | 81.0% |
| Smartphone | 20,935 | 87.0% |
| Tablet | 15,639 | 65.0% |
| No Computing Device | 1,390 | 5.8% |
| Total | 24,076 | 100.0% |
Internet Access in Bristol
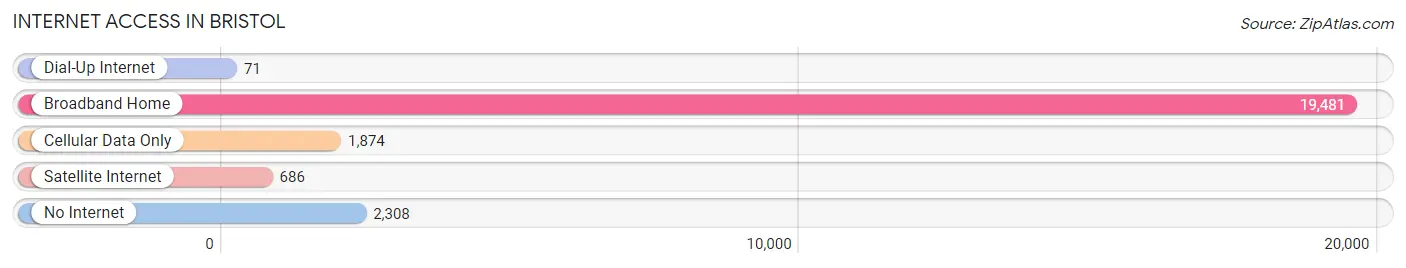
| Internet Type | # Households | % Households |
| Dial-Up Internet | 71 | 0.3% |
| Broadband Home | 19,481 | 80.9% |
| Cellular Data Only | 1,874 | 7.8% |
| Satellite Internet | 686 | 2.9% |
| No Internet | 2,308 | 9.6% |
| Total | 24,076 | 100.0% |
Bristol Summary
Bristol, Connecticut is a city located in Hartford County, Connecticut, United States. It is located approximately 20 miles southwest of Hartford, the state capital. As of the 2010 census, the population of Bristol was 60,477, making it the ninth largest city in the state.
History
Bristol was first settled in 1654 by settlers from Plymouth, Massachusetts. The town was named after Bristol, England, and was incorporated in 1785. During the Revolutionary War, Bristol was the site of a major battle between the British and American forces. The city was also the home of the American Clock & Watch Company, which was founded in 1853 and was the largest clock manufacturer in the world at the time.
Geography
Bristol is located in central Connecticut, approximately 20 miles southwest of Hartford. It is bordered by the towns of Burlington, Plainville, Plymouth, Southington, and Wolcott. The city is situated on the banks of the Pequabuck River, which flows through the city and empties into the nearby Lake Compounce. The city has a total area of 26.3 square miles, of which 25.9 square miles is land and 0.4 square miles is water.
Economy
Bristol is home to several major employers, including ESPN, which is headquartered in the city. Other major employers include the Bristol-Myers Squibb Company, the Barnes Group, and the American Clock & Watch Company. The city also has a thriving tourism industry, with attractions such as Lake Compounce, the New England Carousel Museum, and the American Clock & Watch Museum.
Demographics
As of the 2010 census, the population of Bristol was 60,477, with a population density of 2,310 people per square mile. The median age of the population was 40.7 years, and the median household income was $60,945. The racial makeup of the city was 87.2% White, 5.3% African American, 0.5% Native American, 2.7% Asian, 0.1% Pacific Islander, and 3.2% from other races. The largest ancestry groups in Bristol were Italian (17.2%), Irish (15.7%), and German (13.2%).
Bristol is served by the Bristol Public Schools system, which consists of seven elementary schools, two middle schools, and two high schools. The city is also home to several private schools, including St. Paul Catholic High School and Bristol Central High School.
Common Questions
What is Per Capita Income in Bristol?
Per Capita income in Bristol is $40,984.
What is the Median Family Income in Bristol?
Median Family Income in Bristol is $102,677.
What is the Median Household income in Bristol?
Median Household Income in Bristol is $82,094.
What is Income or Wage Gap in Bristol?
Income or Wage Gap in Bristol is 26.1%.
Women in Bristol earn 73.9 cents for every dollar earned by a man.
What is Family Income Deficit in Bristol?
Family Income Deficit in Bristol is $11,531.
Families that are below poverty line in Bristol earn $11,531 less on average than the poverty threshold level.
What is Inequality or Gini Index in Bristol?
Inequality or Gini Index in Bristol is 0.41.
What is the Total Population of Bristol?
Total Population of Bristol is 61,052.
What is the Total Male Population of Bristol?
Total Male Population of Bristol is 30,245.
What is the Total Female Population of Bristol?
Total Female Population of Bristol is 30,807.
What is the Ratio of Males per 100 Females in Bristol?
There are 98.18 Males per 100 Females in Bristol.
What is the Ratio of Females per 100 Males in Bristol?
There are 101.86 Females per 100 Males in Bristol.
What is the Median Population Age in Bristol?
Median Population Age in Bristol is 37.5 Years.
What is the Average Family Size in Bristol
Average Family Size in Bristol is 3.1 People.
What is the Average Household Size in Bristol
Average Household Size in Bristol is 2.5 People.
How Large is the Labor Force in Bristol?
There are 35,283 People in the Labor Forcein in Bristol.
What is the Percentage of People in the Labor Force in Bristol?
71.0% of People are in the Labor Force in Bristol.
What is the Unemployment Rate in Bristol?
Unemployment Rate in Bristol is 6.6%.