Cities with the Lowest Wage/Income Gap (%) in Connecticut
RELATED REPORTS & OPTIONS
Lowest Wage/Income Gap (%)
Connecticut
Compare Cities
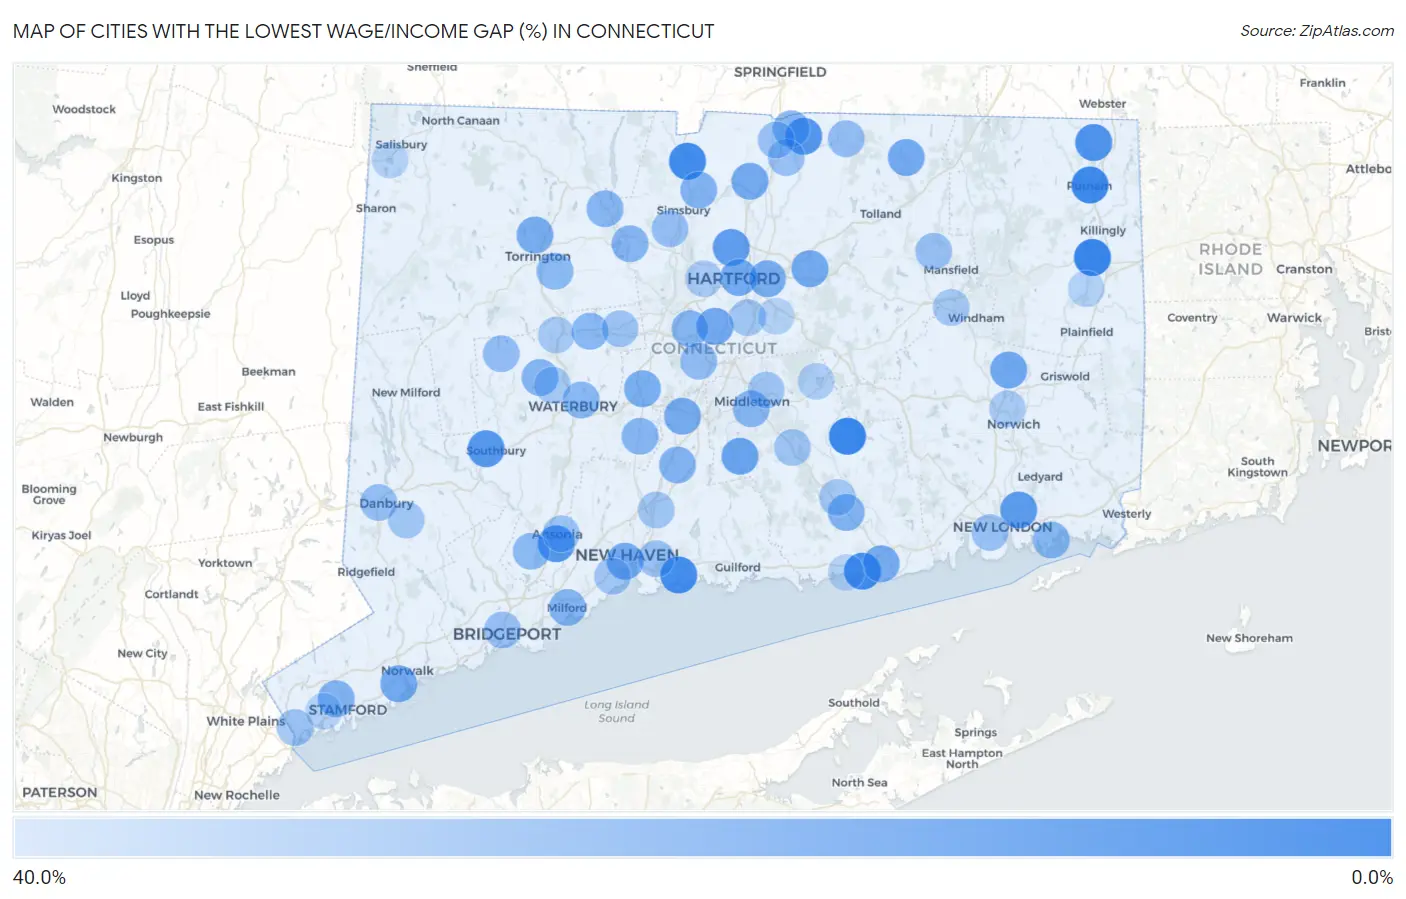
Map of Cities with the Lowest Wage/Income Gap (%) in Connecticut
40.0%
0.0%
Cities with the Lowest Wage/Income Gap (%) in Connecticut
| City | Wage/Income Gap (%) | vs State | vs National | |
| 1. | East Brooklyn | 0.44% | 27.8%(-0.274)#1 | 28.0%(-0.275)#99 |
| 2. | Lake Bungee | 0.86% | 27.8%(-0.270)#2 | 28.0%(-0.271)#209 |
| 3. | Moodus | 1.0% | 27.8%(-0.268)#3 | 28.0%(-0.270)#260 |
| 4. | Putnam | 2.2% | 27.8%(-0.256)#4 | 28.0%(-0.258)#555 |
| 5. | Salmon Brook | 2.9% | 27.8%(-0.249)#5 | 28.0%(-0.251)#739 |
| 6. | Stepney | 3.2% | 27.8%(-0.246)#6 | 28.0%(-0.247)#809 |
| 7. | Branford Center | 3.6% | 27.8%(-0.242)#7 | 28.0%(-0.244)#898 |
| 8. | Saybrook Manor | 4.1% | 27.8%(-0.237)#8 | 28.0%(-0.239)#1,032 |
| 9. | Lake Chaffee | 4.6% | 27.8%(-0.232)#9 | 28.0%(-0.234)#1,160 |
| 10. | Oronoque | 5.5% | 27.8%(-0.223)#10 | 28.0%(-0.225)#1,415 |
| 11. | Stratford Downtown | 5.9% | 27.8%(-0.220)#11 | 28.0%(-0.221)#1,494 |
| 12. | Litchfield Borough | 6.0% | 27.8%(-0.218)#12 | 28.0%(-0.220)#1,536 |
| 13. | North Grosvenor Dale | 6.4% | 27.8%(-0.214)#13 | 28.0%(-0.216)#1,631 |
| 14. | Hazardville | 7.8% | 27.8%(-0.200)#14 | 28.0%(-0.201)#2,050 |
| 15. | Derby | 8.3% | 27.8%(-0.195)#15 | 28.0%(-0.196)#2,206 |
| 16. | Heritage Village | 8.5% | 27.8%(-0.193)#16 | 28.0%(-0.195)#2,250 |
| 17. | Newtown Borough | 8.6% | 27.8%(-0.192)#17 | 28.0%(-0.194)#2,290 |
| 18. | Conning Towers Nautilus Park | 10.2% | 27.8%(-0.176)#18 | 28.0%(-0.177)#2,782 |
| 19. | Blue Hills | 10.6% | 27.8%(-0.172)#19 | 28.0%(-0.174)#2,883 |
| 20. | Jewett City Borough | 13.4% | 27.8%(-0.144)#20 | 28.0%(-0.145)#3,834 |
| 21. | Durham | 13.5% | 27.8%(-0.143)#21 | 28.0%(-0.145)#3,849 |
| 22. | Lordship | 13.7% | 27.8%(-0.141)#22 | 28.0%(-0.143)#3,938 |
| 23. | Stonington Borough | 15.1% | 27.8%(-0.127)#23 | 28.0%(-0.129)#4,407 |
| 24. | Baltic | 15.1% | 27.8%(-0.127)#24 | 28.0%(-0.129)#4,420 |
| 25. | Newington | 15.2% | 27.8%(-0.127)#25 | 28.0%(-0.128)#4,434 |
| 26. | Hartford | 15.5% | 27.8%(-0.123)#26 | 28.0%(-0.125)#4,556 |
| 27. | Manchester | 15.6% | 27.8%(-0.122)#27 | 28.0%(-0.124)#4,581 |
| 28. | New Haven | 15.9% | 27.8%(-0.119)#28 | 28.0%(-0.121)#4,736 |
| 29. | Windsor Locks | 16.0% | 27.8%(-0.118)#29 | 28.0%(-0.120)#4,764 |
| 30. | Stafford Springs | 16.1% | 27.8%(-0.117)#30 | 28.0%(-0.119)#4,804 |
| 31. | Norwalk | 16.2% | 27.8%(-0.116)#31 | 28.0%(-0.118)#4,854 |
| 32. | Old Saybrook Center | 16.3% | 27.8%(-0.115)#32 | 28.0%(-0.117)#4,914 |
| 33. | Meriden | 16.7% | 27.8%(-0.111)#33 | 28.0%(-0.113)#5,078 |
| 34. | East Hartford | 17.0% | 27.8%(-0.108)#34 | 28.0%(-0.110)#5,193 |
| 35. | Torrington | 17.1% | 27.8%(-0.107)#35 | 28.0%(-0.108)#5,244 |
| 36. | Plantsville | 17.6% | 27.8%(-0.102)#36 | 28.0%(-0.104)#5,459 |
| 37. | New Canaan | 18.1% | 27.8%(-0.097)#37 | 28.0%(-0.099)#5,638 |
| 38. | Weston | 18.1% | 27.8%(-0.097)#38 | 28.0%(-0.098)#5,665 |
| 39. | Stamford | 19.1% | 27.8%(-0.087)#39 | 28.0%(-0.089)#6,072 |
| 40. | Wallingford Center | 19.5% | 27.8%(-0.084)#40 | 28.0%(-0.085)#6,224 |
| 41. | Tariffville | 19.5% | 27.8%(-0.083)#41 | 28.0%(-0.085)#6,250 |
| 42. | Quinnipiac University | 19.8% | 27.8%(-0.080)#42 | 28.0%(-0.082)#6,388 |
| 43. | Deep River Center | 20.0% | 27.8%(-0.079)#43 | 28.0%(-0.080)#6,469 |
| 44. | New Britain | 20.0% | 27.8%(-0.078)#44 | 28.0%(-0.079)#6,500 |
| 45. | Milford City Balance | 20.3% | 27.8%(-0.075)#45 | 28.0%(-0.077)#6,662 |
| 46. | Watertown | 20.4% | 27.8%(-0.074)#46 | 28.0%(-0.075)#6,722 |
| 47. | Middletown | 20.6% | 27.8%(-0.072)#47 | 28.0%(-0.074)#6,788 |
| 48. | Collinsville | 20.6% | 27.8%(-0.072)#48 | 28.0%(-0.074)#6,791 |
| 49. | New Hartford Center | 20.7% | 27.8%(-0.071)#49 | 28.0%(-0.072)#6,861 |
| 50. | Cheshire Village | 21.0% | 27.8%(-0.068)#50 | 28.0%(-0.070)#6,996 |
| 51. | Sherwood Manor | 21.0% | 27.8%(-0.068)#51 | 28.0%(-0.070)#7,003 |
| 52. | Waterbury | 21.2% | 27.8%(-0.066)#52 | 28.0%(-0.068)#7,057 |
| 53. | Noank | 21.2% | 27.8%(-0.066)#53 | 28.0%(-0.068)#7,064 |
| 54. | Terryville | 21.6% | 27.8%(-0.062)#54 | 28.0%(-0.064)#7,274 |
| 55. | Shelton | 21.6% | 27.8%(-0.062)#55 | 28.0%(-0.064)#7,277 |
| 56. | Northwest Harwinton | 22.1% | 27.8%(-0.057)#56 | 28.0%(-0.059)#7,543 |
| 57. | Kensington | 23.3% | 27.8%(-0.045)#57 | 28.0%(-0.047)#8,097 |
| 58. | Bethlehem Village | 23.8% | 27.8%(-0.040)#58 | 28.0%(-0.042)#8,374 |
| 59. | Somers | 24.0% | 27.8%(-0.038)#59 | 28.0%(-0.040)#8,490 |
| 60. | Danbury | 24.4% | 27.8%(-0.034)#60 | 28.0%(-0.035)#8,694 |
| 61. | Weatogue | 24.7% | 27.8%(-0.031)#61 | 28.0%(-0.033)#8,829 |
| 62. | Southwood Acres | 24.9% | 27.8%(-0.029)#62 | 28.0%(-0.031)#8,950 |
| 63. | Ball Pond | 25.0% | 27.8%(-0.028)#63 | 28.0%(-0.030)#9,023 |
| 64. | Quasset Lake | 25.1% | 27.8%(-0.027)#64 | 28.0%(-0.029)#9,060 |
| 65. | Bridgeport | 25.2% | 27.8%(-0.026)#65 | 28.0%(-0.028)#9,106 |
| 66. | Storrs | 25.2% | 27.8%(-0.026)#66 | 28.0%(-0.028)#9,123 |
| 67. | Waterford | 25.4% | 27.8%(-0.024)#67 | 28.0%(-0.026)#9,204 |
| 68. | East Haven | 25.4% | 27.8%(-0.024)#68 | 28.0%(-0.026)#9,217 |
| 69. | Pemberwick | 25.6% | 27.8%(-0.022)#69 | 28.0%(-0.024)#9,304 |
| 70. | Sacred Heart University | 25.7% | 27.8%(-0.021)#70 | 28.0%(-0.023)#9,387 |
| 71. | Thompsonville | 25.9% | 27.8%(-0.020)#71 | 28.0%(-0.021)#9,490 |
| 72. | Ansonia | 26.1% | 27.8%(-0.018)#72 | 28.0%(-0.019)#9,596 |
| 73. | Bristol | 26.1% | 27.8%(-0.017)#73 | 28.0%(-0.019)#9,605 |
| 74. | Danielson Borough | 26.2% | 27.8%(-0.017)#74 | 28.0%(-0.018)#9,641 |
| 75. | Higganum | 26.7% | 27.8%(-0.011)#75 | 28.0%(-0.013)#9,958 |
| 76. | Noroton Heights | 26.9% | 27.8%(-0.009)#76 | 28.0%(-0.011)#10,047 |
| 77. | West Haven | 27.2% | 27.8%(-0.006)#77 | 28.0%(-0.008)#10,201 |
| 78. | North Haven | 27.2% | 27.8%(-0.006)#78 | 28.0%(-0.008)#10,209 |
| 79. | Portland | 27.3% | 27.8%(-0.005)#79 | 28.0%(-0.007)#10,252 |
| 80. | Naugatuck Borough | 27.5% | 27.8%(-0.004)#80 | 28.0%(-0.005)#10,349 |
| 81. | Wethersfield | 27.6% | 27.8%(-0.002)#81 | 28.0%(-0.004)#10,436 |
| 82. | Bethel | 28.0% | 27.8%(+0.002)#82 | 28.0%(+0.000)#10,658 |
| 83. | Trumbull Center | 28.2% | 27.8%(+0.003)#83 | 28.0%(+0.002)#10,744 |
| 84. | Chester Center | 28.5% | 27.8%(+0.007)#84 | 28.0%(+0.005)#10,908 |
| 85. | Woodmont Borough | 28.6% | 27.8%(+0.008)#85 | 28.0%(+0.007)#10,990 |
| 86. | Willimantic | 28.7% | 27.8%(+0.008)#86 | 28.0%(+0.007)#10,994 |
| 87. | Bridgewater | 28.7% | 27.8%(+0.009)#87 | 28.0%(+0.007)#11,032 |
| 88. | Oakville | 28.8% | 27.8%(+0.010)#88 | 28.0%(+0.009)#11,122 |
| 89. | Thomaston | 28.9% | 27.8%(+0.011)#89 | 28.0%(+0.009)#11,146 |
| 90. | West Hartford | 29.6% | 27.8%(+0.018)#90 | 28.0%(+0.016)#11,545 |
| 91. | Sandy Hook | 30.0% | 27.8%(+0.022)#91 | 28.0%(+0.021)#11,811 |
| 92. | Norwich | 30.1% | 27.8%(+0.023)#92 | 28.0%(+0.021)#11,844 |
| 93. | Lake Pocotopaug | 30.5% | 27.8%(+0.027)#93 | 28.0%(+0.026)#12,105 |
| 94. | Northford | 30.8% | 27.8%(+0.030)#94 | 28.0%(+0.029)#12,247 |
| 95. | East | 31.6% | 27.8%(+0.038)#95 | 28.0%(+0.036)#12,622 |
| 96. | Lakeville | 31.8% | 27.8%(+0.040)#96 | 28.0%(+0.038)#12,745 |
| 97. | Glastonbury Center | 31.8% | 27.8%(+0.040)#97 | 28.0%(+0.039)#12,777 |
| 98. | Cos Cob | 31.8% | 27.8%(+0.040)#98 | 28.0%(+0.039)#12,779 |
| 99. | Wauregan | 31.9% | 27.8%(+0.041)#99 | 28.0%(+0.039)#12,803 |
| 100. | Westbrook Center | 32.6% | 27.8%(+0.047)#100 | 28.0%(+0.046)#13,166 |
1
2Common Questions
What are the Top 10 Cities with the Lowest Wage/Income Gap (%) in Connecticut?
Top 10 Cities with the Lowest Wage/Income Gap (%) in Connecticut are:
#1
0.44%
#2
1.0%
#3
2.2%
#4
2.9%
#5
3.6%
#6
4.1%
#7
6.4%
#8
7.8%
#9
8.3%
#10
8.5%
What city has the Lowest Wage/Income Gap (%) in Connecticut?
East Brooklyn has the Lowest Wage/Income Gap (%) in Connecticut with 0.44%.
What is the Wage / Income Gap in Percentage Terms in the State of Connecticut?
Wage / Income Gap in Percentage Terms in Connecticut is 27.8%.
What is the Wage / Income Gap in Percentage Terms in the United States?
Wage / Income Gap in Percentage Terms in the United States is 28.0%.