Essex Village, CT Map & Demographics
Essex Village Map
Essex Village Overview
$73,947
PER CAPITA INCOME
$194,563
AVG FAMILY INCOME
$98,611
AVG HOUSEHOLD INCOME
69.5%
WAGE / INCOME GAP [ % ]
30.5¢/ $1
WAGE / INCOME GAP [ $ ]
0.49
INEQUALITY / GINI INDEX
2,725
TOTAL POPULATION
1,223
MALE POPULATION
1,502
FEMALE POPULATION
81.42
MALES / 100 FEMALES
122.81
FEMALES / 100 MALES
58.6
MEDIAN AGE
2.8
AVG FAMILY SIZE
2.3
AVG HOUSEHOLD SIZE
1,511
LABOR FORCE [ PEOPLE ]
64.7%
PERCENT IN LABOR FORCE
Income in Essex Village
Income Overview in Essex Village
Per Capita Income in Essex Village is $73,947, while median incomes of families and households are $194,563 and $98,611 respectively.
| Characteristic | Number | Measure |
| Per Capita Income | 2,725 | $73,947 |
| Median Family Income | 805 | $194,563 |
| Mean Family Income | 805 | $219,095 |
| Median Household Income | 1,204 | $98,611 |
| Mean Household Income | 1,204 | $164,973 |
| Income Deficit | 805 | $0 |
| Wage / Income Gap (%) | 2,725 | 69.50% |
| Wage / Income Gap ($) | 2,725 | 30.50¢ per $1 |
| Gini / Inequality Index | 2,725 | 0.49 |
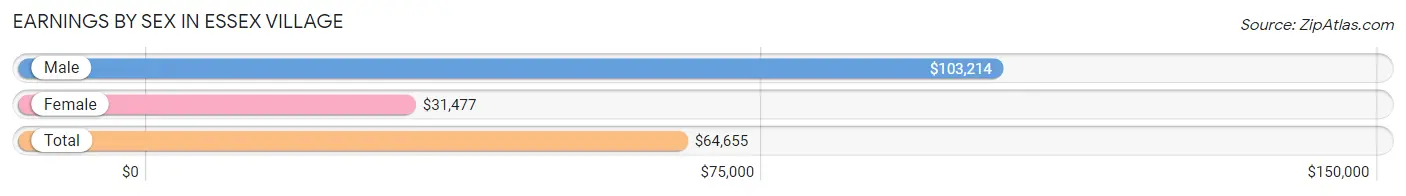
Earnings by Sex in Essex Village
Average Earnings in Essex Village are $64,655, $103,214 for men and $31,477 for women, a difference of 69.5%.
| Sex | Number | Average Earnings |
| Male | 780 (49.2%) | $103,214 |
| Female | 804 (50.8%) | $31,477 |
| Total | 1,584 (100.0%) | $64,655 |
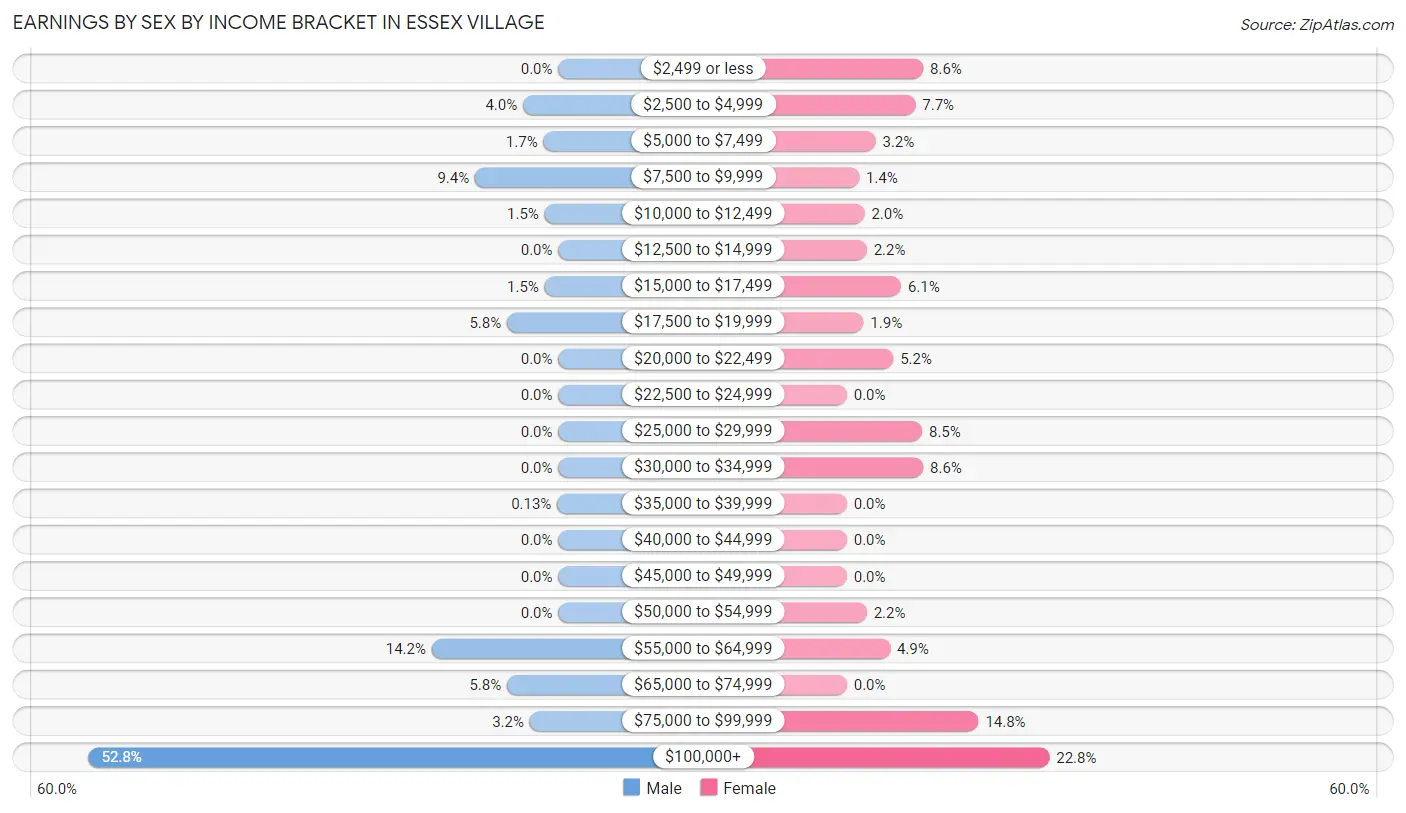
Earnings by Sex by Income Bracket in Essex Village
The most common earnings brackets in Essex Village are $100,000+ for men (412 | 52.8%) and $100,000+ for women (183 | 22.8%).
| Income | Male | Female |
| $2,499 or less | 0 (0.0%) | 69 (8.6%) |
| $2,500 to $4,999 | 31 (4.0%) | 62 (7.7%) |
| $5,000 to $7,499 | 13 (1.7%) | 26 (3.2%) |
| $7,500 to $9,999 | 73 (9.4%) | 11 (1.4%) |
| $10,000 to $12,499 | 12 (1.5%) | 16 (2.0%) |
| $12,500 to $14,999 | 0 (0.0%) | 18 (2.2%) |
| $15,000 to $17,499 | 12 (1.5%) | 49 (6.1%) |
| $17,500 to $19,999 | 45 (5.8%) | 15 (1.9%) |
| $20,000 to $22,499 | 0 (0.0%) | 42 (5.2%) |
| $22,500 to $24,999 | 0 (0.0%) | 0 (0.0%) |
| $25,000 to $29,999 | 0 (0.0%) | 68 (8.5%) |
| $30,000 to $34,999 | 0 (0.0%) | 69 (8.6%) |
| $35,000 to $39,999 | 1 (0.1%) | 0 (0.0%) |
| $40,000 to $44,999 | 0 (0.0%) | 0 (0.0%) |
| $45,000 to $49,999 | 0 (0.0%) | 0 (0.0%) |
| $50,000 to $54,999 | 0 (0.0%) | 18 (2.2%) |
| $55,000 to $64,999 | 111 (14.2%) | 39 (4.9%) |
| $65,000 to $74,999 | 45 (5.8%) | 0 (0.0%) |
| $75,000 to $99,999 | 25 (3.2%) | 119 (14.8%) |
| $100,000+ | 412 (52.8%) | 183 (22.8%) |
| Total | 780 (100.0%) | 804 (100.0%) |
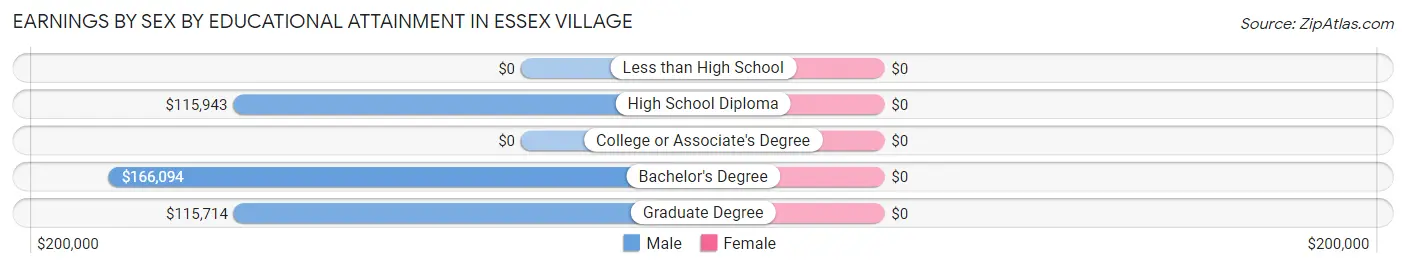
Earnings by Sex by Educational Attainment in Essex Village
| Educational Attainment | Male Income | Female Income |
| Less than High School | - | - |
| High School Diploma | $115,943 | $0 |
| College or Associate's Degree | - | - |
| Bachelor's Degree | $166,094 | $0 |
| Graduate Degree | $115,714 | $0 |
| Total | $115,355 | $0 |
Family Income in Essex Village
Family Income Brackets in Essex Village
According to the Essex Village family income data, there are 383 families falling into the $200,000+ income range, which is the most common income bracket and makes up 47.6% of all families.
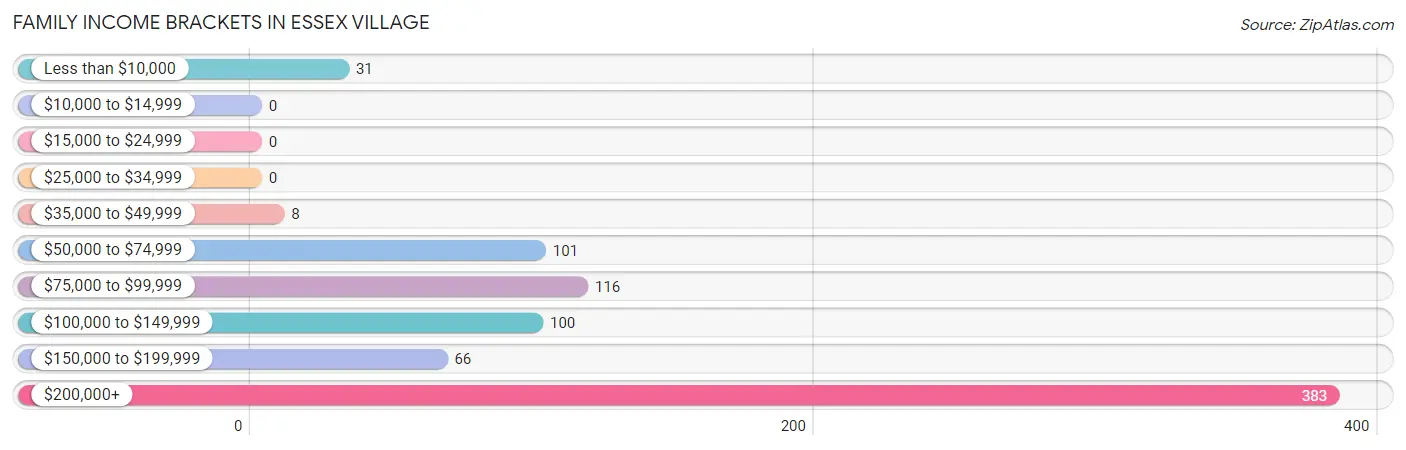
| Income Bracket | # Families | % Families |
| Less than $10,000 | 31 | 3.9% |
| $10,000 to $14,999 | 0 | 0.0% |
| $15,000 to $24,999 | 0 | 0.0% |
| $25,000 to $34,999 | 0 | 0.0% |
| $35,000 to $49,999 | 8 | 1.0% |
| $50,000 to $74,999 | 101 | 12.5% |
| $75,000 to $99,999 | 116 | 14.4% |
| $100,000 to $149,999 | 100 | 12.4% |
| $150,000 to $199,999 | 66 | 8.2% |
| $200,000+ | 383 | 47.6% |
Family Income by Famaliy Size in Essex Village
3-person families (140 | 17.4%) account for the highest median family income in Essex Village with $250,001 per family, while 3-person families (140 | 17.4%) have the highest median income of $83,334 per family member.
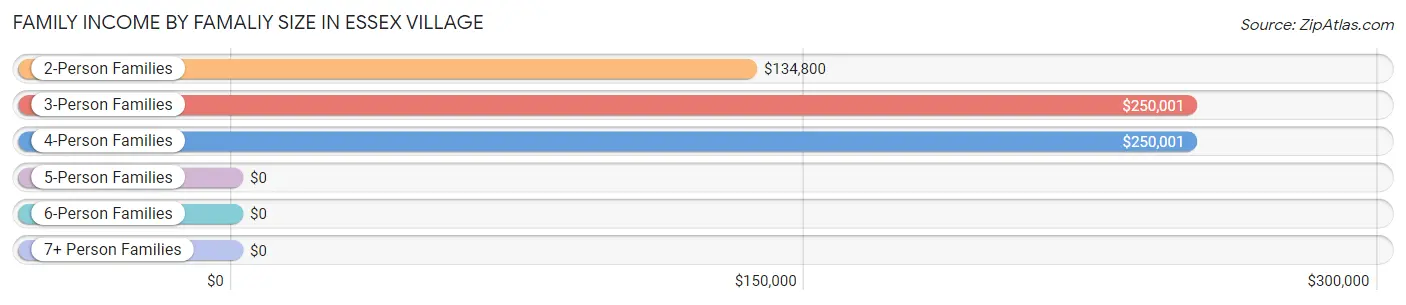
| Income Bracket | # Families | Median Income |
| 2-Person Families | 520 (64.6%) | $134,800 |
| 3-Person Families | 140 (17.4%) | $250,001 |
| 4-Person Families | 99 (12.3%) | $250,001 |
| 5-Person Families | 46 (5.7%) | $0 |
| 6-Person Families | 0 (0.0%) | $0 |
| 7+ Person Families | 0 (0.0%) | $0 |
| Total | 805 (100.0%) | $194,563 |
Family Income by Number of Earners in Essex Village
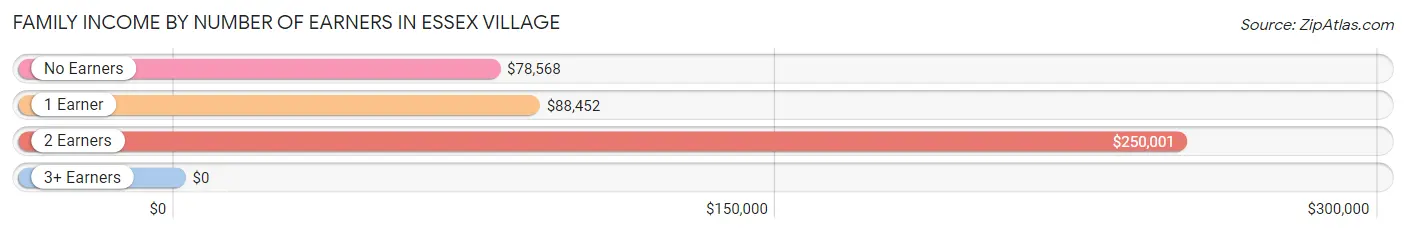
| Number of Earners | # Families | Median Income |
| No Earners | 159 (19.8%) | $78,568 |
| 1 Earner | 196 (24.3%) | $88,452 |
| 2 Earners | 393 (48.8%) | $250,001 |
| 3+ Earners | 57 (7.1%) | $0 |
| Total | 805 (100.0%) | $194,563 |
Household Income in Essex Village
Household Income Brackets in Essex Village
With 415 households falling in the category, the $200,000+ income range is the most frequent in Essex Village, accounting for 34.5% of all households. In contrast, only 18 households (1.5%) fall into the $10,000 to $14,999 income bracket, making it the least populous group.
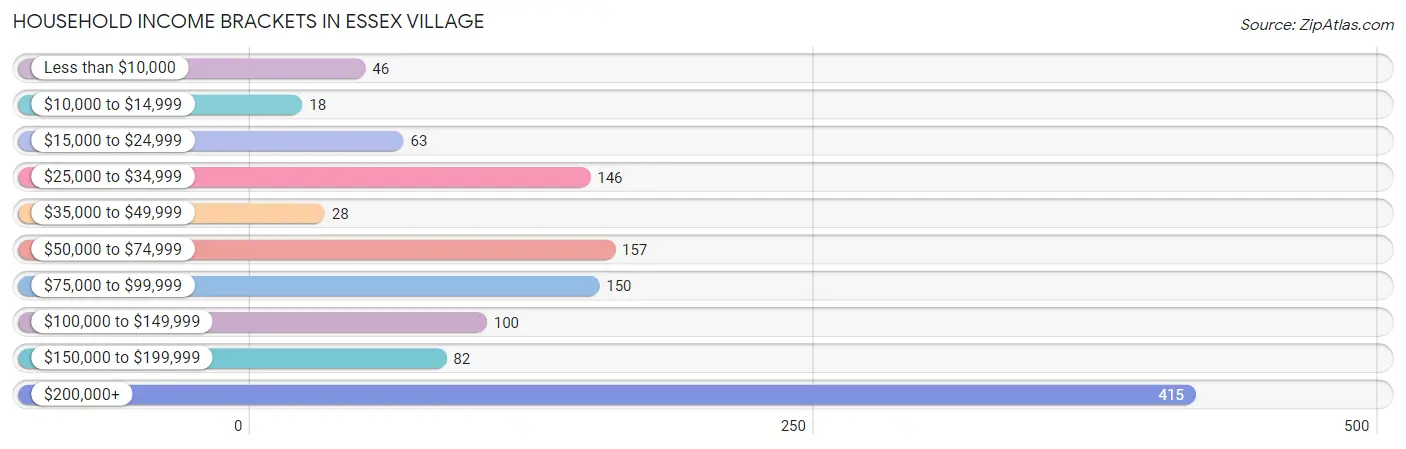
| Income Bracket | # Households | % Households |
| Less than $10,000 | 46 | 3.8% |
| $10,000 to $14,999 | 18 | 1.5% |
| $15,000 to $24,999 | 63 | 5.2% |
| $25,000 to $34,999 | 146 | 12.1% |
| $35,000 to $49,999 | 28 | 2.3% |
| $50,000 to $74,999 | 157 | 13.0% |
| $75,000 to $99,999 | 150 | 12.5% |
| $100,000 to $149,999 | 100 | 8.3% |
| $150,000 to $199,999 | 82 | 6.8% |
| $200,000+ | 415 | 34.5% |
Household Income by Householder Age in Essex Village
The median household income in Essex Village is $98,611, with the highest median household income of $250,001 found in the 25 to 44 years age bracket for the primary householder. A total of 119 households (9.9%) fall into this category.
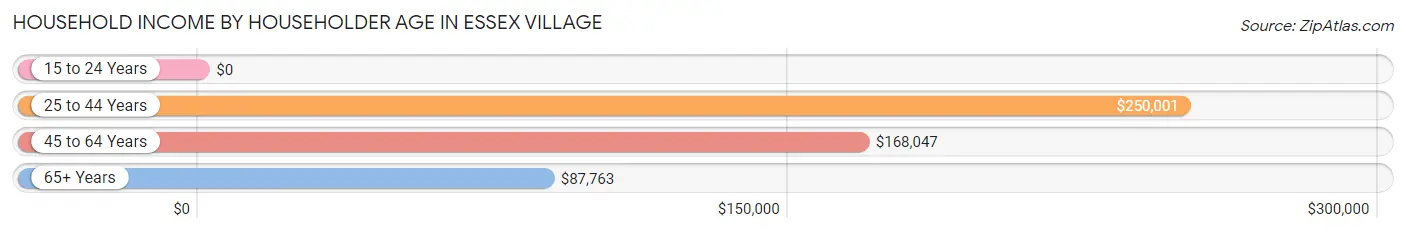
| Income Bracket | # Households | Median Income |
| 15 to 24 Years | 0 (0.0%) | $0 |
| 25 to 44 Years | 119 (9.9%) | $250,001 |
| 45 to 64 Years | 591 (49.1%) | $168,047 |
| 65+ Years | 494 (41.0%) | $87,763 |
| Total | 1,204 (100.0%) | $98,611 |
Poverty in Essex Village
Income Below Poverty by Sex and Age in Essex Village
With 6.6% poverty level for males and 8.9% for females among the residents of Essex Village, 25 to 34 year old males and under 5 year old females are the most vulnerable to poverty, with 31 males (64.6%) and 28 females (33.7%) in their respective age groups living below the poverty level.
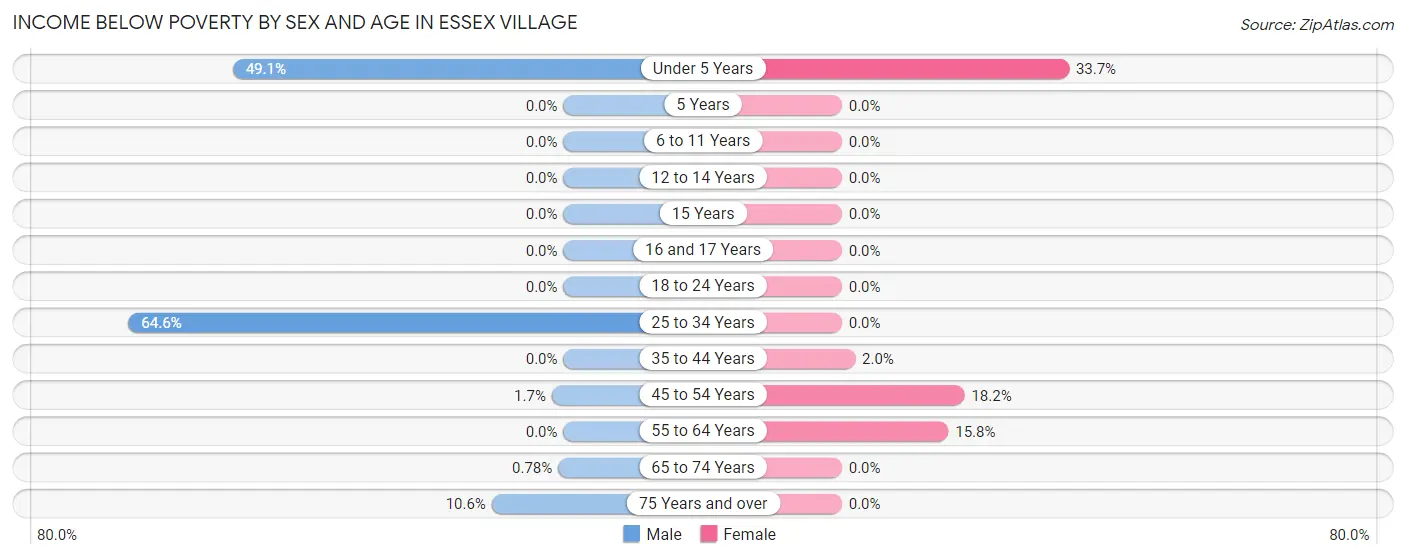
| Age Bracket | Male | Female |
| Under 5 Years | 27 (49.1%) | 28 (33.7%) |
| 5 Years | 0 (0.0%) | 0 (0.0%) |
| 6 to 11 Years | 0 (0.0%) | 0 (0.0%) |
| 12 to 14 Years | 0 (0.0%) | 0 (0.0%) |
| 15 Years | 0 (0.0%) | 0 (0.0%) |
| 16 and 17 Years | 0 (0.0%) | 0 (0.0%) |
| 18 to 24 Years | 0 (0.0%) | 0 (0.0%) |
| 25 to 34 Years | 31 (64.6%) | 0 (0.0%) |
| 35 to 44 Years | 0 (0.0%) | 2 (2.0%) |
| 45 to 54 Years | 1 (1.7%) | 39 (18.2%) |
| 55 to 64 Years | 0 (0.0%) | 65 (15.8%) |
| 65 to 74 Years | 2 (0.8%) | 0 (0.0%) |
| 75 Years and over | 20 (10.6%) | 0 (0.0%) |
| Total | 81 (6.6%) | 134 (8.9%) |
Income Above Poverty by Sex and Age in Essex Village
According to the poverty statistics in Essex Village, males aged 6 to 11 years and females aged 5 years are the age groups that are most secure financially, with 100.0% of males and 100.0% of females in these age groups living above the poverty line.
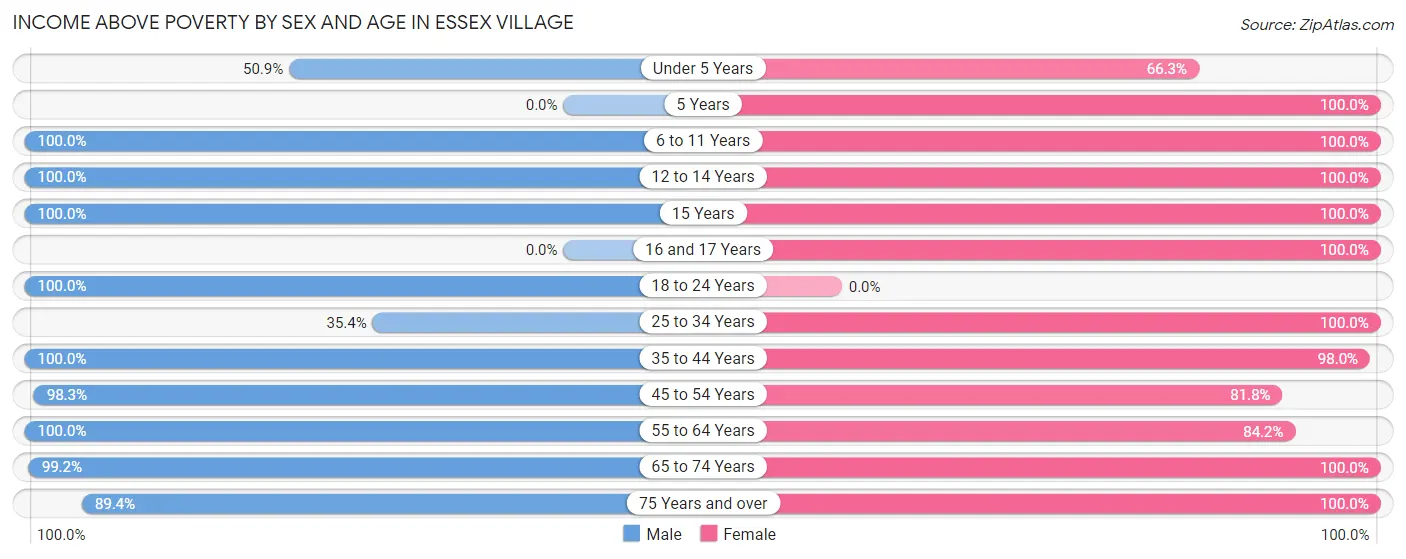
| Age Bracket | Male | Female |
| Under 5 Years | 28 (50.9%) | 55 (66.3%) |
| 5 Years | 0 (0.0%) | 29 (100.0%) |
| 6 to 11 Years | 34 (100.0%) | 31 (100.0%) |
| 12 to 14 Years | 35 (100.0%) | 31 (100.0%) |
| 15 Years | 49 (100.0%) | 41 (100.0%) |
| 16 and 17 Years | 0 (0.0%) | 41 (100.0%) |
| 18 to 24 Years | 115 (100.0%) | 0 (0.0%) |
| 25 to 34 Years | 17 (35.4%) | 48 (100.0%) |
| 35 to 44 Years | 106 (100.0%) | 99 (98.0%) |
| 45 to 54 Years | 57 (98.3%) | 175 (81.8%) |
| 55 to 64 Years | 277 (100.0%) | 346 (84.2%) |
| 65 to 74 Years | 255 (99.2%) | 256 (100.0%) |
| 75 Years and over | 168 (89.4%) | 216 (100.0%) |
| Total | 1,141 (93.4%) | 1,368 (91.1%) |
Income Below Poverty Among Married-Couple Families in Essex Village
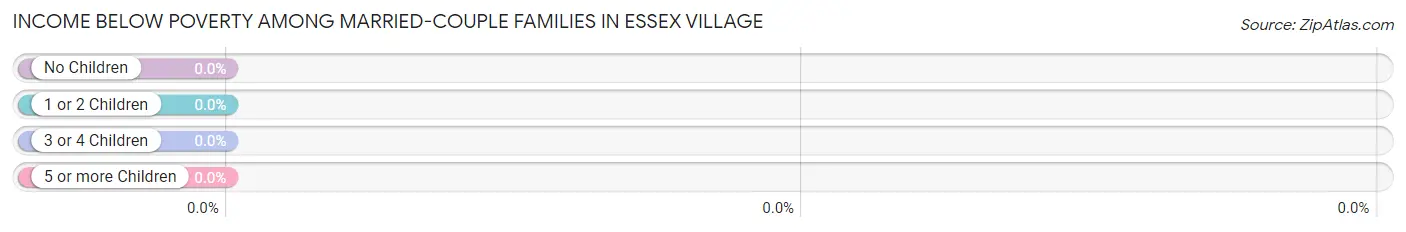
| Children | Above Poverty | Below Poverty |
| No Children | 638 (100.0%) | 0 (0.0%) |
| 1 or 2 Children | 105 (100.0%) | 0 (0.0%) |
| 3 or 4 Children | 31 (100.0%) | 0 (0.0%) |
| 5 or more Children | 0 (0.0%) | 0 (0.0%) |
| Total | 774 (100.0%) | 0 (0.0%) |
Income Below Poverty Among Single-Parent Households in Essex Village
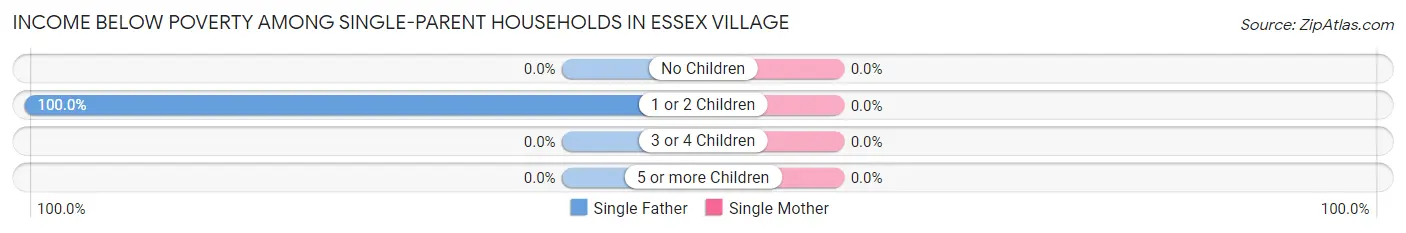
| Children | Single Father | Single Mother |
| No Children | 0 (0.0%) | 0 (0.0%) |
| 1 or 2 Children | 31 (100.0%) | 0 (0.0%) |
| 3 or 4 Children | 0 (0.0%) | 0 (0.0%) |
| 5 or more Children | 0 (0.0%) | 0 (0.0%) |
| Total | 31 (100.0%) | 0 (0.0%) |
Income Below Poverty Among Married-Couple vs Single-Parent Households in Essex Village
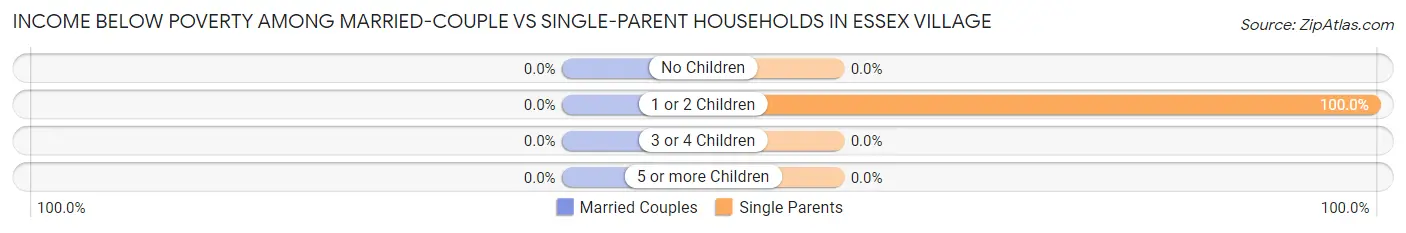
| Children | Married-Couple Families | Single-Parent Households |
| No Children | 0 (0.0%) | 0 (0.0%) |
| 1 or 2 Children | 0 (0.0%) | 31 (100.0%) |
| 3 or 4 Children | 0 (0.0%) | 0 (0.0%) |
| 5 or more Children | 0 (0.0%) | 0 (0.0%) |
| Total | 0 (0.0%) | 31 (100.0%) |
Race in Essex Village
The most populous races in Essex Village are White / Caucasian (2,496 | 91.6%), Two or more Races (147 | 5.4%), and Asian (82 | 3.0%).
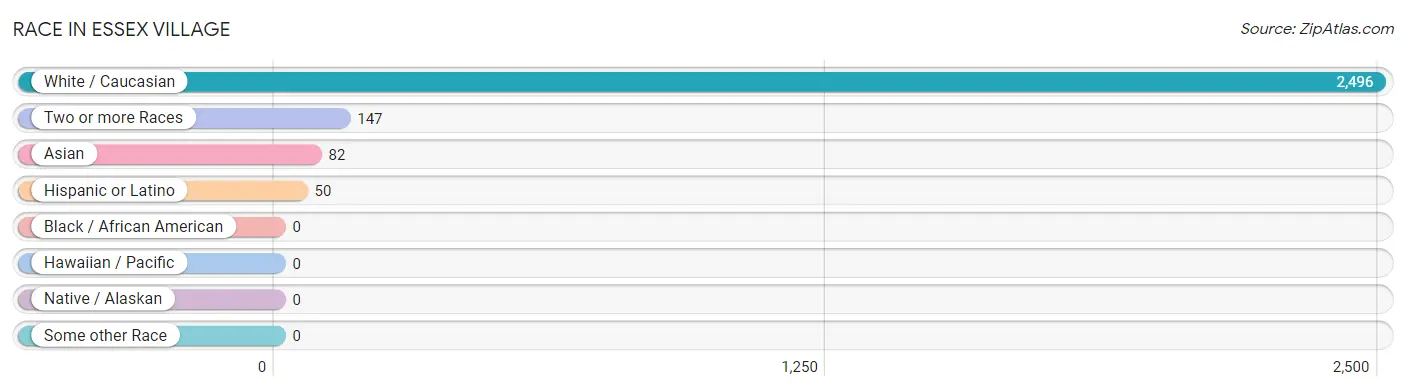
| Race | # Population | % Population |
| Asian | 82 | 3.0% |
| Black / African American | 0 | 0.0% |
| Hawaiian / Pacific | 0 | 0.0% |
| Hispanic or Latino | 50 | 1.8% |
| Native / Alaskan | 0 | 0.0% |
| White / Caucasian | 2,496 | 91.6% |
| Two or more Races | 147 | 5.4% |
| Some other Race | 0 | 0.0% |
| Total | 2,725 | 100.0% |
Ancestry in Essex Village
The most populous ancestries reported in Essex Village are Irish (625 | 22.9%), Italian (495 | 18.2%), English (474 | 17.4%), Polish (248 | 9.1%), and American (169 | 6.2%), together accounting for 73.8% of all Essex Village residents.
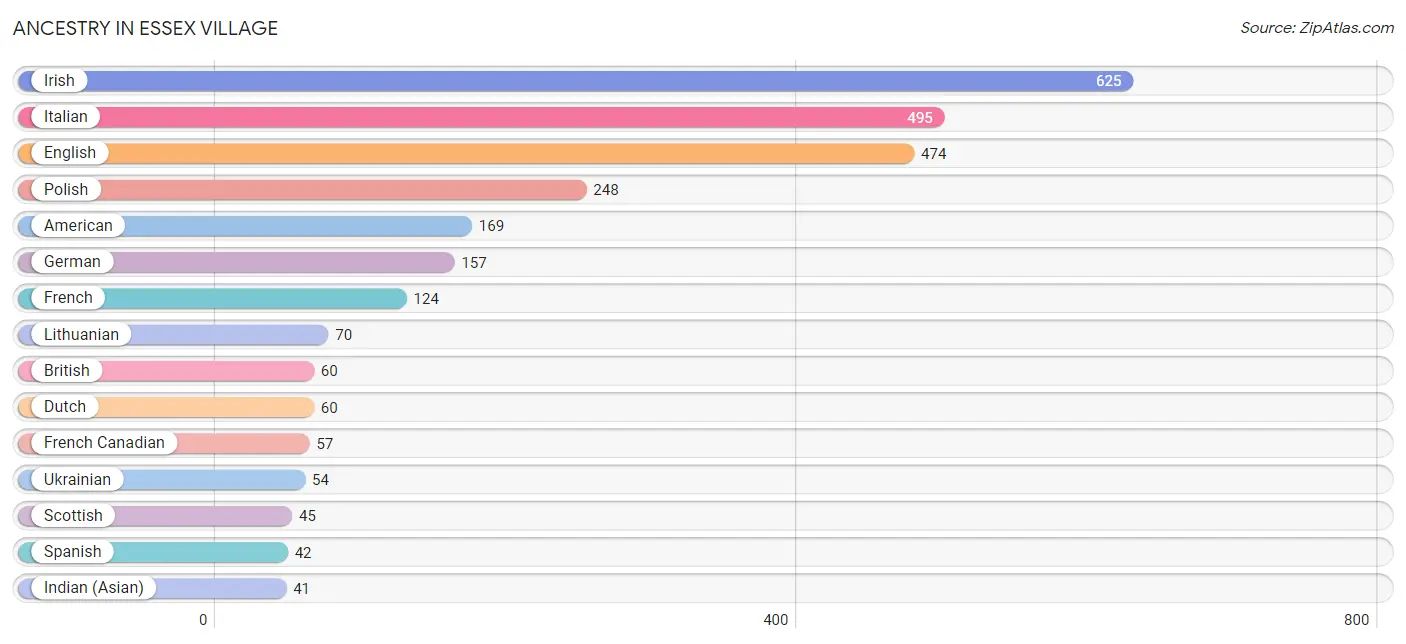
| Ancestry | # Population | % Population |
| American | 169 | 6.2% |
| Austrian | 39 | 1.4% |
| Brazilian | 28 | 1.0% |
| British | 60 | 2.2% |
| Danish | 7 | 0.3% |
| Dutch | 60 | 2.2% |
| Eastern European | 11 | 0.4% |
| English | 474 | 17.4% |
| French | 124 | 4.5% |
| French Canadian | 57 | 2.1% |
| German | 157 | 5.8% |
| Hungarian | 40 | 1.5% |
| Indian (Asian) | 41 | 1.5% |
| Irish | 625 | 22.9% |
| Italian | 495 | 18.2% |
| Latvian | 26 | 0.9% |
| Lithuanian | 70 | 2.6% |
| Norwegian | 2 | 0.1% |
| Polish | 248 | 9.1% |
| Portuguese | 28 | 1.0% |
| Romanian | 17 | 0.6% |
| Russian | 7 | 0.3% |
| Scottish | 45 | 1.7% |
| Spaniard | 8 | 0.3% |
| Spanish | 42 | 1.5% |
| Sri Lankan | 41 | 1.5% |
| Swedish | 20 | 0.7% |
| Swiss | 1 | 0.0% |
| Ukrainian | 54 | 2.0% | View All 29 Rows |
Immigrants in Essex Village
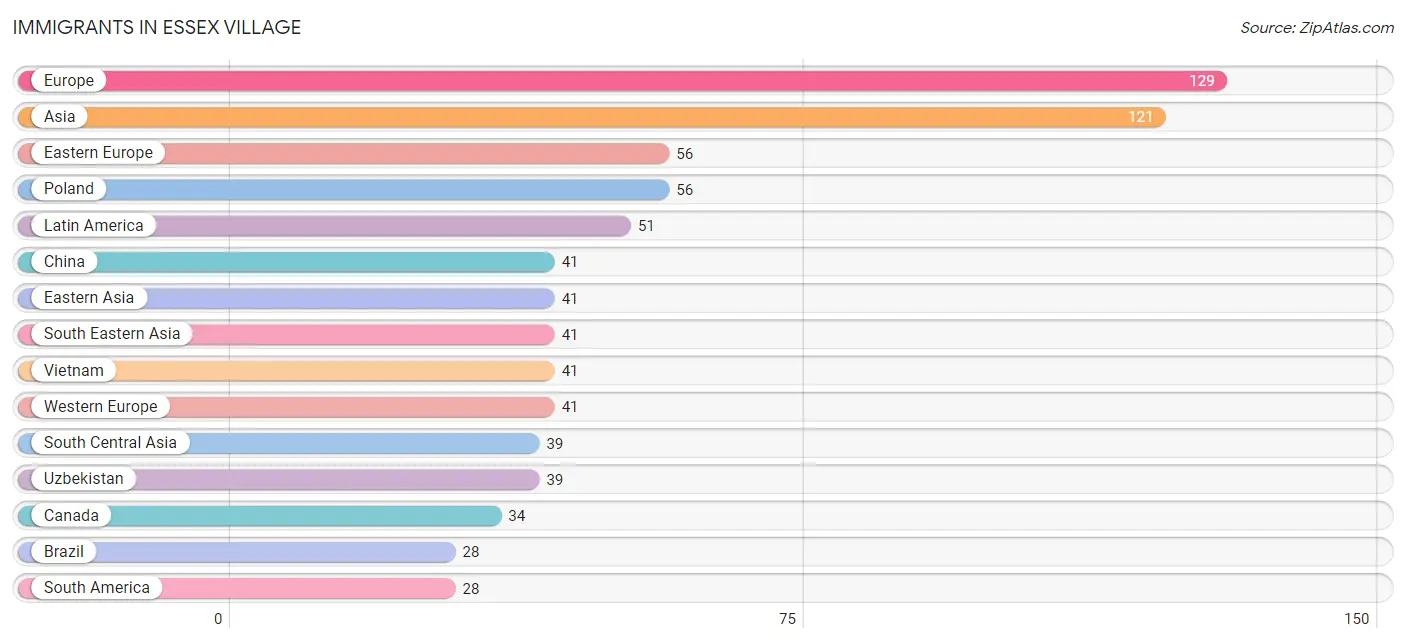
The most numerous immigrant groups reported in Essex Village came from Europe (129 | 4.7%), Asia (121 | 4.4%), Eastern Europe (56 | 2.1%), Poland (56 | 2.1%), and Latin America (51 | 1.9%), together accounting for 15.2% of all Essex Village residents.
| Immigration Origin | # Population | % Population |
| Asia | 121 | 4.4% |
| Brazil | 28 | 1.0% |
| Canada | 34 | 1.3% |
| Central America | 23 | 0.8% |
| China | 41 | 1.5% |
| Eastern Asia | 41 | 1.5% |
| Eastern Europe | 56 | 2.1% |
| England | 13 | 0.5% |
| Europe | 129 | 4.7% |
| France | 18 | 0.7% |
| Germany | 23 | 0.8% |
| Latin America | 51 | 1.9% |
| Mexico | 23 | 0.8% |
| Northern Europe | 24 | 0.9% |
| Poland | 56 | 2.1% |
| South America | 28 | 1.0% |
| South Central Asia | 39 | 1.4% |
| South Eastern Asia | 41 | 1.5% |
| Southern Europe | 8 | 0.3% |
| Spain | 8 | 0.3% |
| Uzbekistan | 39 | 1.4% |
| Vietnam | 41 | 1.5% |
| Western Europe | 41 | 1.5% | View All 23 Rows |
Sex and Age in Essex Village
Sex and Age in Essex Village
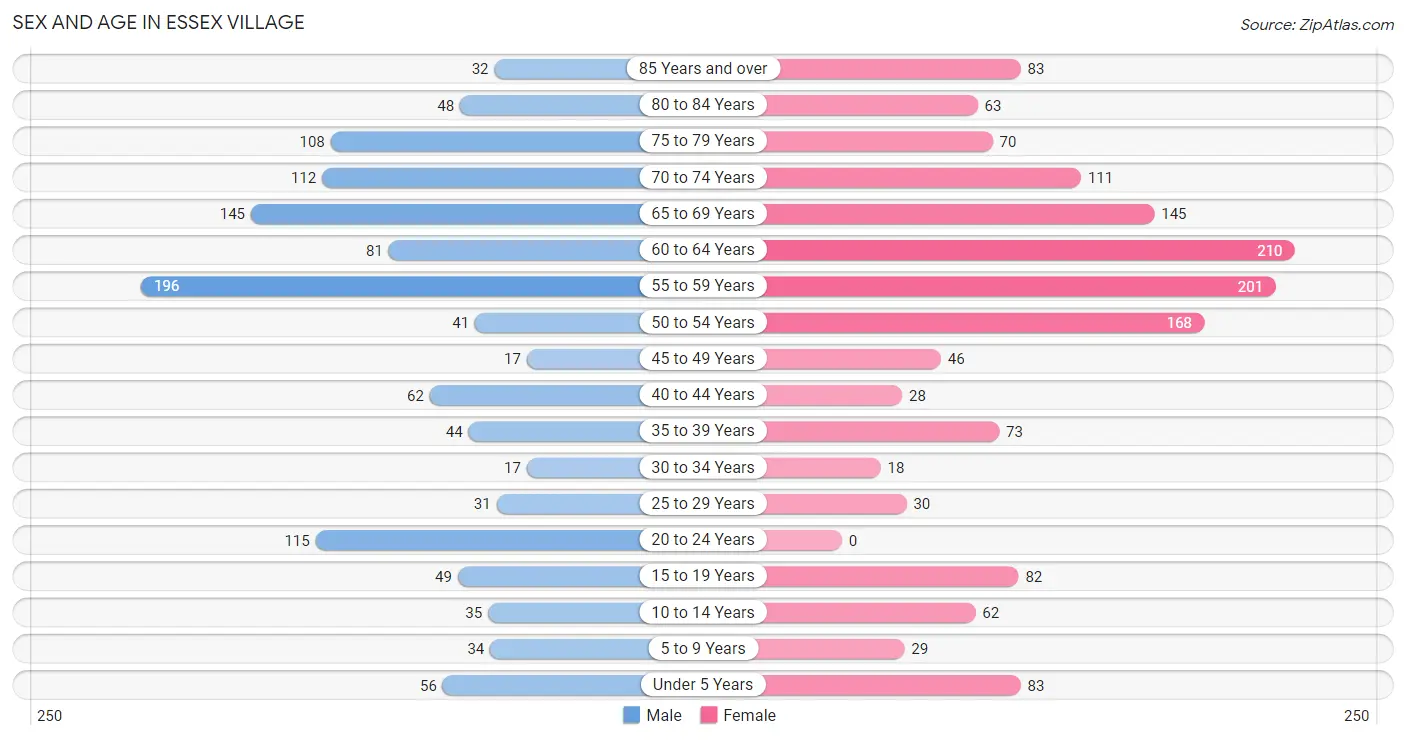
The most populous age groups in Essex Village are 55 to 59 Years (196 | 16.0%) for men and 60 to 64 Years (210 | 14.0%) for women.
| Age Bracket | Male | Female |
| Under 5 Years | 56 (4.6%) | 83 (5.5%) |
| 5 to 9 Years | 34 (2.8%) | 29 (1.9%) |
| 10 to 14 Years | 35 (2.9%) | 62 (4.1%) |
| 15 to 19 Years | 49 (4.0%) | 82 (5.5%) |
| 20 to 24 Years | 115 (9.4%) | 0 (0.0%) |
| 25 to 29 Years | 31 (2.5%) | 30 (2.0%) |
| 30 to 34 Years | 17 (1.4%) | 18 (1.2%) |
| 35 to 39 Years | 44 (3.6%) | 73 (4.9%) |
| 40 to 44 Years | 62 (5.1%) | 28 (1.9%) |
| 45 to 49 Years | 17 (1.4%) | 46 (3.1%) |
| 50 to 54 Years | 41 (3.4%) | 168 (11.2%) |
| 55 to 59 Years | 196 (16.0%) | 201 (13.4%) |
| 60 to 64 Years | 81 (6.6%) | 210 (14.0%) |
| 65 to 69 Years | 145 (11.9%) | 145 (9.7%) |
| 70 to 74 Years | 112 (9.2%) | 111 (7.4%) |
| 75 to 79 Years | 108 (8.8%) | 70 (4.7%) |
| 80 to 84 Years | 48 (3.9%) | 63 (4.2%) |
| 85 Years and over | 32 (2.6%) | 83 (5.5%) |
| Total | 1,223 (100.0%) | 1,502 (100.0%) |
Families and Households in Essex Village
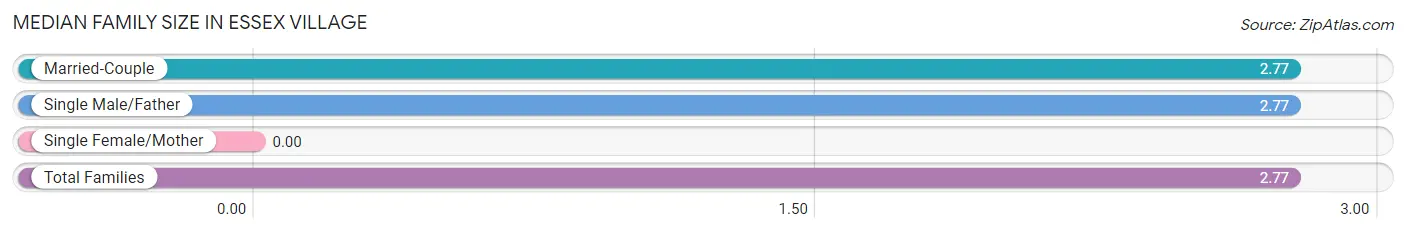
Median Family Size in Essex Village
| Family Type | # Families | Family Size |
| Married-Couple | 774 (96.2%) | 2.77 |
| Single Male/Father | 31 (3.8%) | 2.77 |
| Single Female/Mother | 0 (0.0%) | - |
| Total Families | 805 (100.0%) | 2.77 |
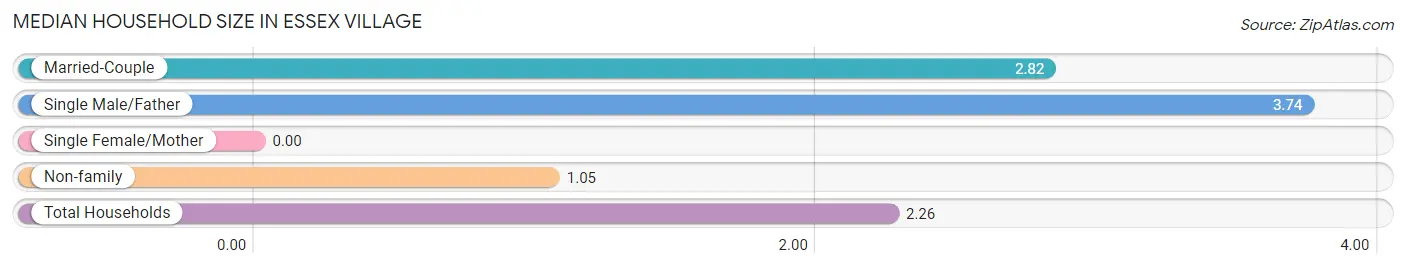
Median Household Size in Essex Village
| Household Type | # Households | Household Size |
| Married-Couple | 774 (64.3%) | 2.82 |
| Single Male/Father | 31 (2.6%) | 3.74 |
| Single Female/Mother | 0 (0.0%) | - |
| Non-family | 399 (33.1%) | 1.05 |
| Total Households | 1,204 (100.0%) | 2.26 |
Household Size by Marriage Status in Essex Village
Out of a total of 1,204 households in Essex Village, 805 (66.9%) are family households, while 399 (33.1%) are nonfamily households. The most numerous type of family households are 2-person households, comprising 472, and the most common type of nonfamily households are 1-person households, comprising 381.
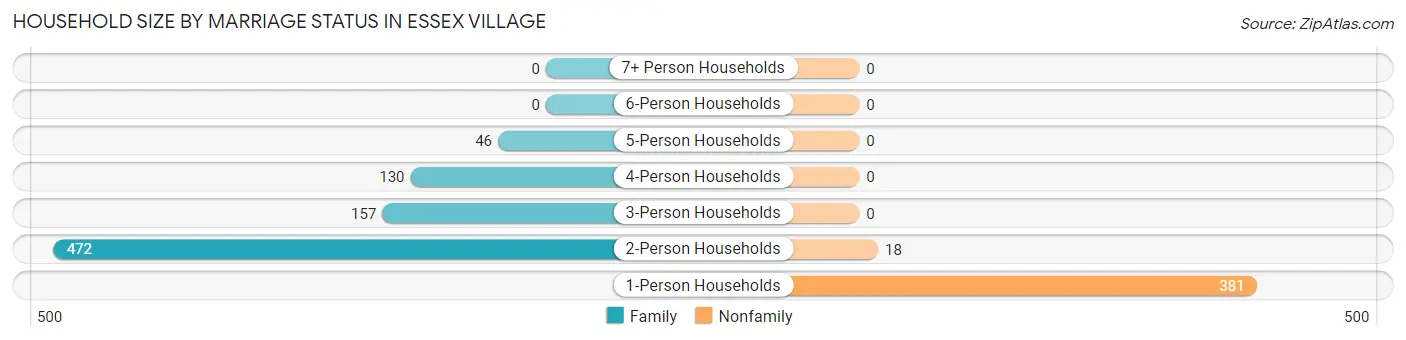
| Household Size | Family Households | Nonfamily Households |
| 1-Person Households | - | 381 (31.6%) |
| 2-Person Households | 472 (39.2%) | 18 (1.5%) |
| 3-Person Households | 157 (13.0%) | 0 (0.0%) |
| 4-Person Households | 130 (10.8%) | 0 (0.0%) |
| 5-Person Households | 46 (3.8%) | 0 (0.0%) |
| 6-Person Households | 0 (0.0%) | 0 (0.0%) |
| 7+ Person Households | 0 (0.0%) | 0 (0.0%) |
| Total | 805 (66.9%) | 399 (33.1%) |
Female Fertility in Essex Village
Fertility by Age in Essex Village
| Age Bracket | Women with Births | Births / 1,000 Women |
| 15 to 19 years | 0 (0.0%) | 0.0 |
| 20 to 34 years | 0 (0.0%) | 0.0 |
| 35 to 50 years | 0 (0.0%) | 0.0 |
| Total | 0 (0.0%) | 0.0 |
Fertility by Age by Marriage Status in Essex Village
| Age Bracket | Married | Unmarried |
| 15 to 19 years | 0 (0.0%) | 0 (0.0%) |
| 20 to 34 years | 0 (0.0%) | 0 (0.0%) |
| 35 to 50 years | 0 (0.0%) | 0 (0.0%) |
| Total | 0 (0.0%) | 0 (0.0%) |
Fertility by Education in Essex Village
| Educational Attainment | Women with Births | Births / 1,000 Women |
| Less than High School | 0 (0.0%) | 0.0 |
| High School Diploma | 0 (0.0%) | 0.0 |
| College or Associate's Degree | 0 (0.0%) | 0.0 |
| Bachelor's Degree | 0 (0.0%) | 0.0 |
| Graduate Degree | 0 (0.0%) | 0.0 |
| Total | 0 (0.0%) | 0.0 |
Fertility by Education by Marriage Status in Essex Village
| Educational Attainment | Married | Unmarried |
| Less than High School | 0 (0.0%) | 0 (0.0%) |
| High School Diploma | 0 (0.0%) | 0 (0.0%) |
| College or Associate's Degree | 0 (0.0%) | 0 (0.0%) |
| Bachelor's Degree | 0 (0.0%) | 0 (0.0%) |
| Graduate Degree | 0 (0.0%) | 0 (0.0%) |
| Total | 0 (0.0%) | 0 (0.0%) |
Employment Characteristics in Essex Village
Employment by Class of Employer in Essex Village
Among the 1,473 employed individuals in Essex Village, private company employees (803 | 54.5%), self-employed (not incorporated) (259 | 17.6%), and local government employees (189 | 12.8%) make up the most common classes of employment.
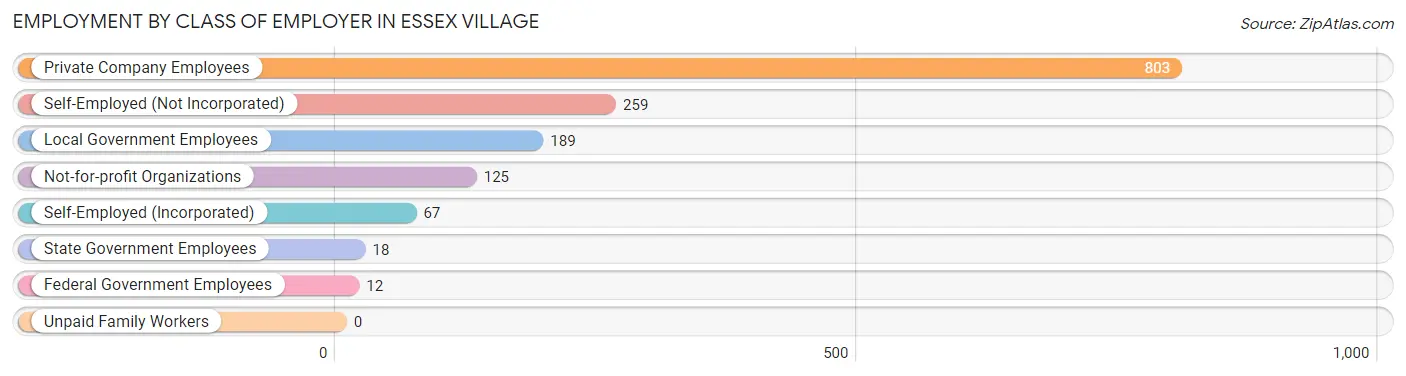
| Employer Class | # Employees | % Employees |
| Private Company Employees | 803 | 54.5% |
| Self-Employed (Incorporated) | 67 | 4.5% |
| Self-Employed (Not Incorporated) | 259 | 17.6% |
| Not-for-profit Organizations | 125 | 8.5% |
| Local Government Employees | 189 | 12.8% |
| State Government Employees | 18 | 1.2% |
| Federal Government Employees | 12 | 0.8% |
| Unpaid Family Workers | 0 | 0.0% |
| Total | 1,473 | 100.0% |
Employment Status by Age in Essex Village
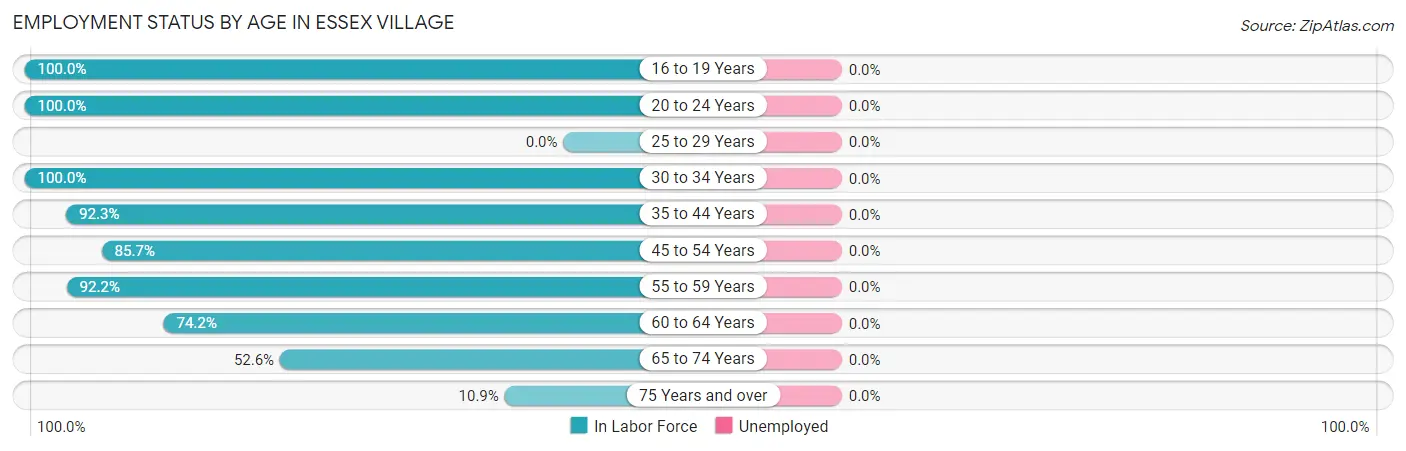
| Age Bracket | In Labor Force | Unemployed |
| 16 to 19 Years | 41 (100.0%) | 0 (0.0%) |
| 20 to 24 Years | 115 (100.0%) | 0 (0.0%) |
| 25 to 29 Years | 0 (0.0%) | 0 (0.0%) |
| 30 to 34 Years | 35 (100.0%) | 0 (0.0%) |
| 35 to 44 Years | 191 (92.3%) | 0 (0.0%) |
| 45 to 54 Years | 233 (85.7%) | 0 (0.0%) |
| 55 to 59 Years | 366 (92.2%) | 0 (0.0%) |
| 60 to 64 Years | 216 (74.2%) | 0 (0.0%) |
| 65 to 74 Years | 270 (52.6%) | 0 (0.0%) |
| 75 Years and over | 44 (10.9%) | 0 (0.0%) |
| Total | 1,511 (64.7%) | 0 (0.0%) |
Employment Status by Educational Attainment in Essex Village
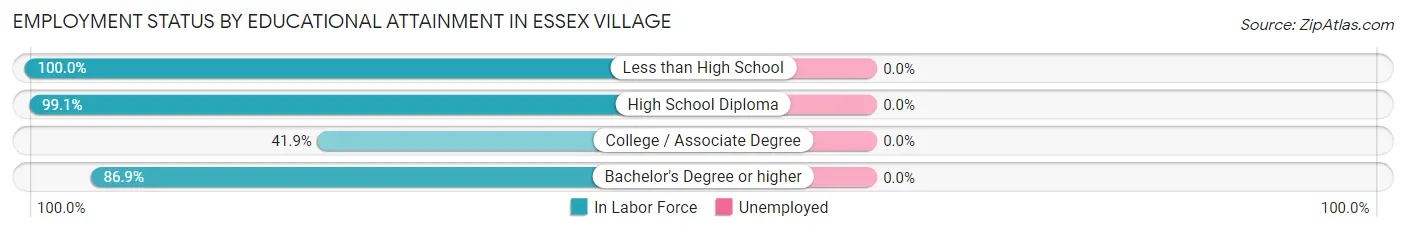
| Educational Attainment | In Labor Force | Unemployed |
| Less than High School | 12 (100.0%) | 0 (0.0%) |
| High School Diploma | 112 (99.1%) | 0 (0.0%) |
| College / Associate Degree | 67 (41.9%) | 0 (0.0%) |
| Bachelor's Degree or higher | 850 (86.9%) | 0 (0.0%) |
| Total | 1,041 (82.4%) | 0 (0.0%) |
Employment Occupations by Sex in Essex Village
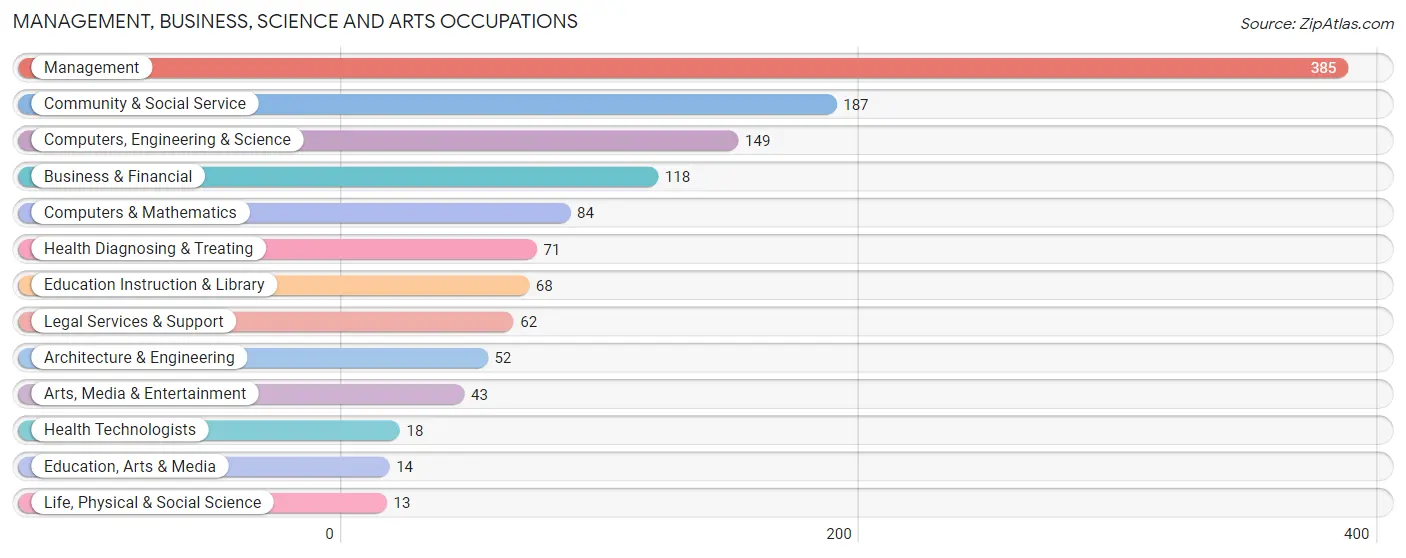
Management, Business, Science and Arts Occupations
The most common Management, Business, Science and Arts occupations in Essex Village are Management (385 | 25.5%), Community & Social Service (187 | 12.4%), Computers, Engineering & Science (149 | 9.9%), Business & Financial (118 | 7.8%), and Computers & Mathematics (84 | 5.6%).
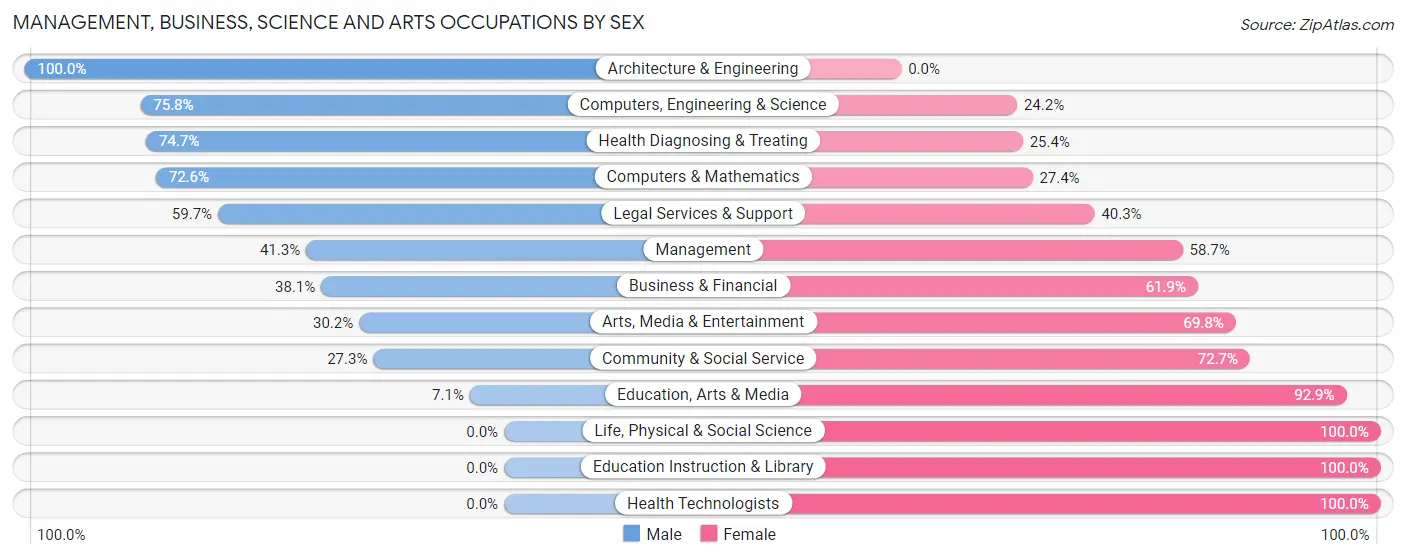
Management, Business, Science and Arts Occupations by Sex
Within the Management, Business, Science and Arts occupations in Essex Village, the most male-oriented occupations are Architecture & Engineering (100.0%), Computers, Engineering & Science (75.8%), and Health Diagnosing & Treating (74.7%), while the most female-oriented occupations are Life, Physical & Social Science (100.0%), Education Instruction & Library (100.0%), and Health Technologists (100.0%).
| Occupation | Male | Female |
| Management | 159 (41.3%) | 226 (58.7%) |
| Business & Financial | 45 (38.1%) | 73 (61.9%) |
| Computers, Engineering & Science | 113 (75.8%) | 36 (24.2%) |
| Computers & Mathematics | 61 (72.6%) | 23 (27.4%) |
| Architecture & Engineering | 52 (100.0%) | 0 (0.0%) |
| Life, Physical & Social Science | 0 (0.0%) | 13 (100.0%) |
| Community & Social Service | 51 (27.3%) | 136 (72.7%) |
| Education, Arts & Media | 1 (7.1%) | 13 (92.9%) |
| Legal Services & Support | 37 (59.7%) | 25 (40.3%) |
| Education Instruction & Library | 0 (0.0%) | 68 (100.0%) |
| Arts, Media & Entertainment | 13 (30.2%) | 30 (69.8%) |
| Health Diagnosing & Treating | 53 (74.7%) | 18 (25.4%) |
| Health Technologists | 0 (0.0%) | 18 (100.0%) |
| Total (Category) | 421 (46.3%) | 489 (53.7%) |
| Total (Overall) | 737 (48.8%) | 774 (51.2%) |
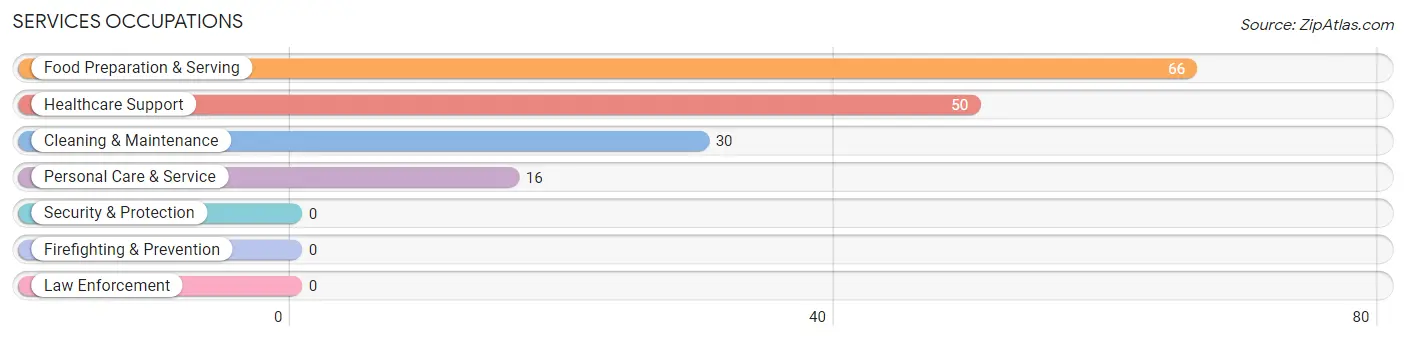
Services Occupations
The most common Services occupations in Essex Village are Food Preparation & Serving (66 | 4.4%), Healthcare Support (50 | 3.3%), Cleaning & Maintenance (30 | 2.0%), and Personal Care & Service (16 | 1.1%).
Services Occupations by Sex
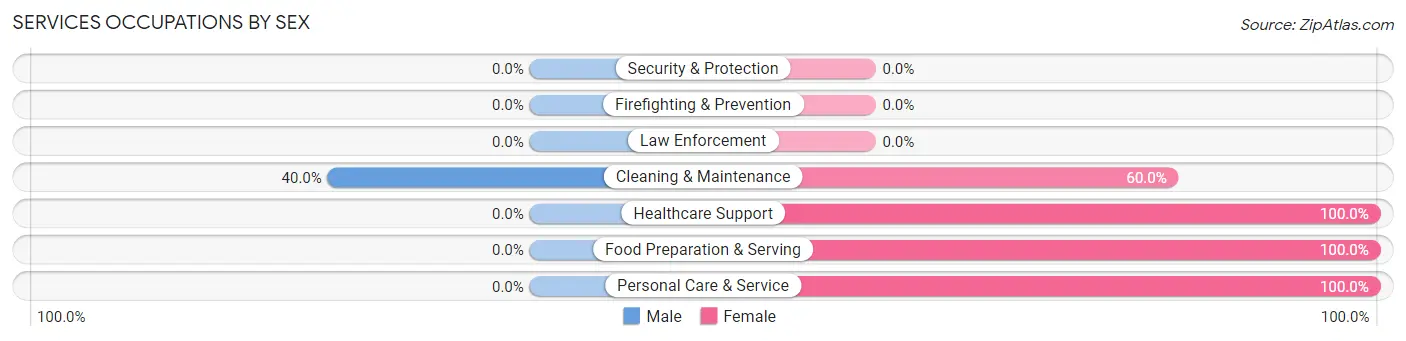
| Occupation | Male | Female |
| Healthcare Support | 0 (0.0%) | 50 (100.0%) |
| Security & Protection | 0 (0.0%) | 0 (0.0%) |
| Firefighting & Prevention | 0 (0.0%) | 0 (0.0%) |
| Law Enforcement | 0 (0.0%) | 0 (0.0%) |
| Food Preparation & Serving | 0 (0.0%) | 66 (100.0%) |
| Cleaning & Maintenance | 12 (40.0%) | 18 (60.0%) |
| Personal Care & Service | 0 (0.0%) | 16 (100.0%) |
| Total (Category) | 12 (7.4%) | 150 (92.6%) |
| Total (Overall) | 737 (48.8%) | 774 (51.2%) |
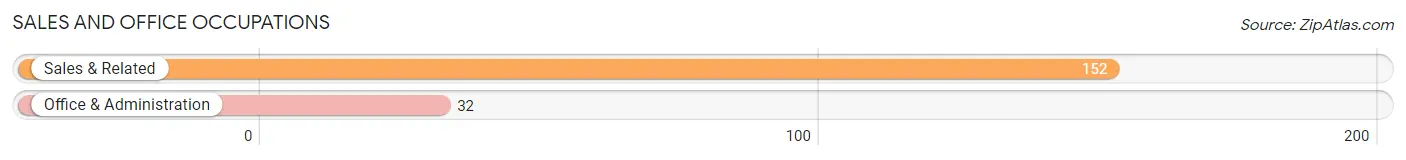
Sales and Office Occupations
The most common Sales and Office occupations in Essex Village are Sales & Related (152 | 10.1%), and Office & Administration (32 | 2.1%).
Sales and Office Occupations by Sex
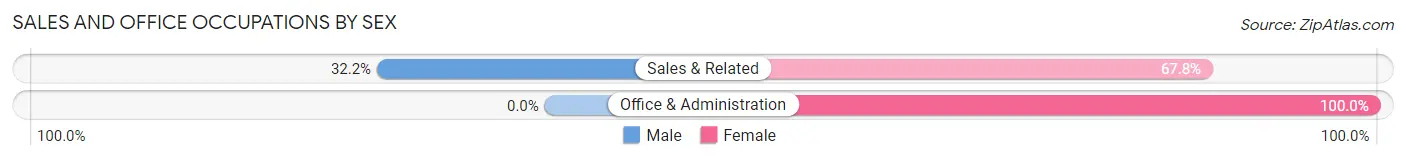
| Occupation | Male | Female |
| Sales & Related | 49 (32.2%) | 103 (67.8%) |
| Office & Administration | 0 (0.0%) | 32 (100.0%) |
| Total (Category) | 49 (26.6%) | 135 (73.4%) |
| Total (Overall) | 737 (48.8%) | 774 (51.2%) |
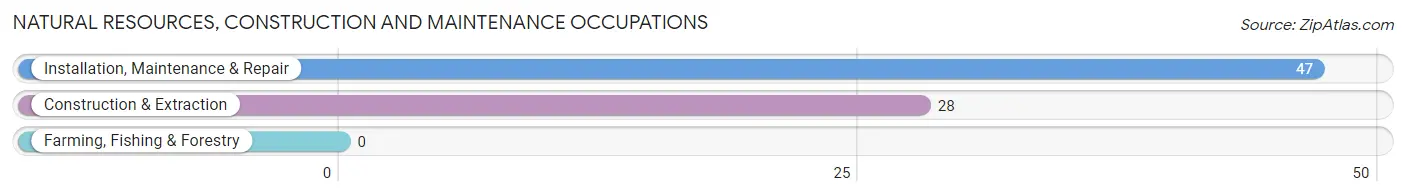
Natural Resources, Construction and Maintenance Occupations
The most common Natural Resources, Construction and Maintenance occupations in Essex Village are Installation, Maintenance & Repair (47 | 3.1%), and Construction & Extraction (28 | 1.8%).
Natural Resources, Construction and Maintenance Occupations by Sex
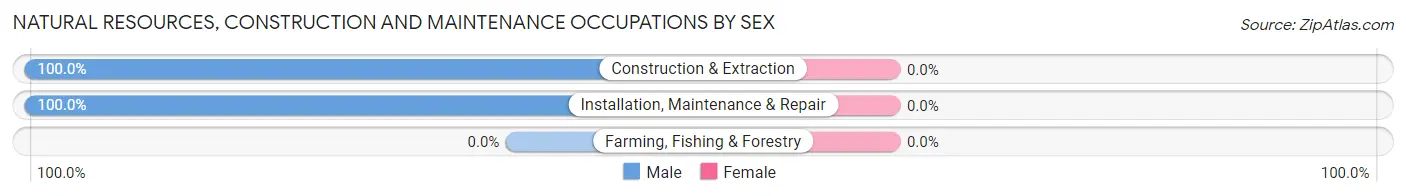
| Occupation | Male | Female |
| Farming, Fishing & Forestry | 0 (0.0%) | 0 (0.0%) |
| Construction & Extraction | 28 (100.0%) | 0 (0.0%) |
| Installation, Maintenance & Repair | 47 (100.0%) | 0 (0.0%) |
| Total (Category) | 75 (100.0%) | 0 (0.0%) |
| Total (Overall) | 737 (48.8%) | 774 (51.2%) |
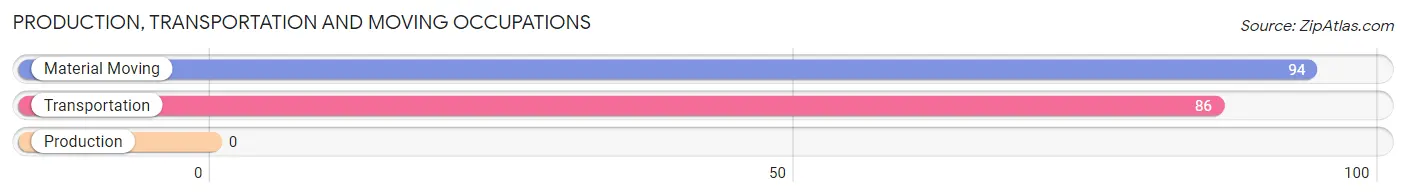
Production, Transportation and Moving Occupations
The most common Production, Transportation and Moving occupations in Essex Village are Material Moving (94 | 6.2%), and Transportation (86 | 5.7%).
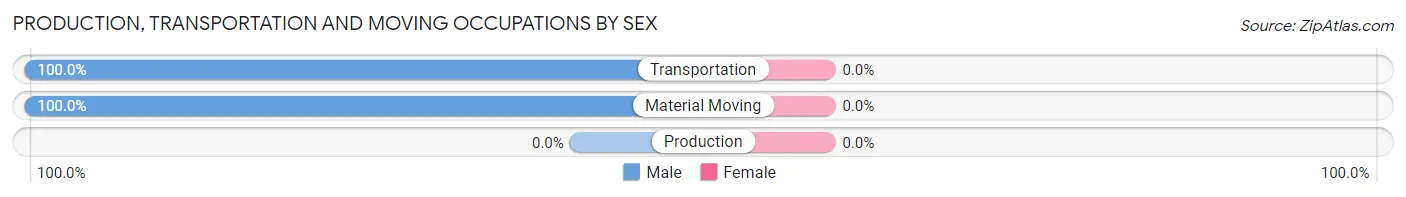
Production, Transportation and Moving Occupations by Sex
| Occupation | Male | Female |
| Production | 0 (0.0%) | 0 (0.0%) |
| Transportation | 86 (100.0%) | 0 (0.0%) |
| Material Moving | 94 (100.0%) | 0 (0.0%) |
| Total (Category) | 180 (100.0%) | 0 (0.0%) |
| Total (Overall) | 737 (48.8%) | 774 (51.2%) |
Employment Industries by Sex in Essex Village
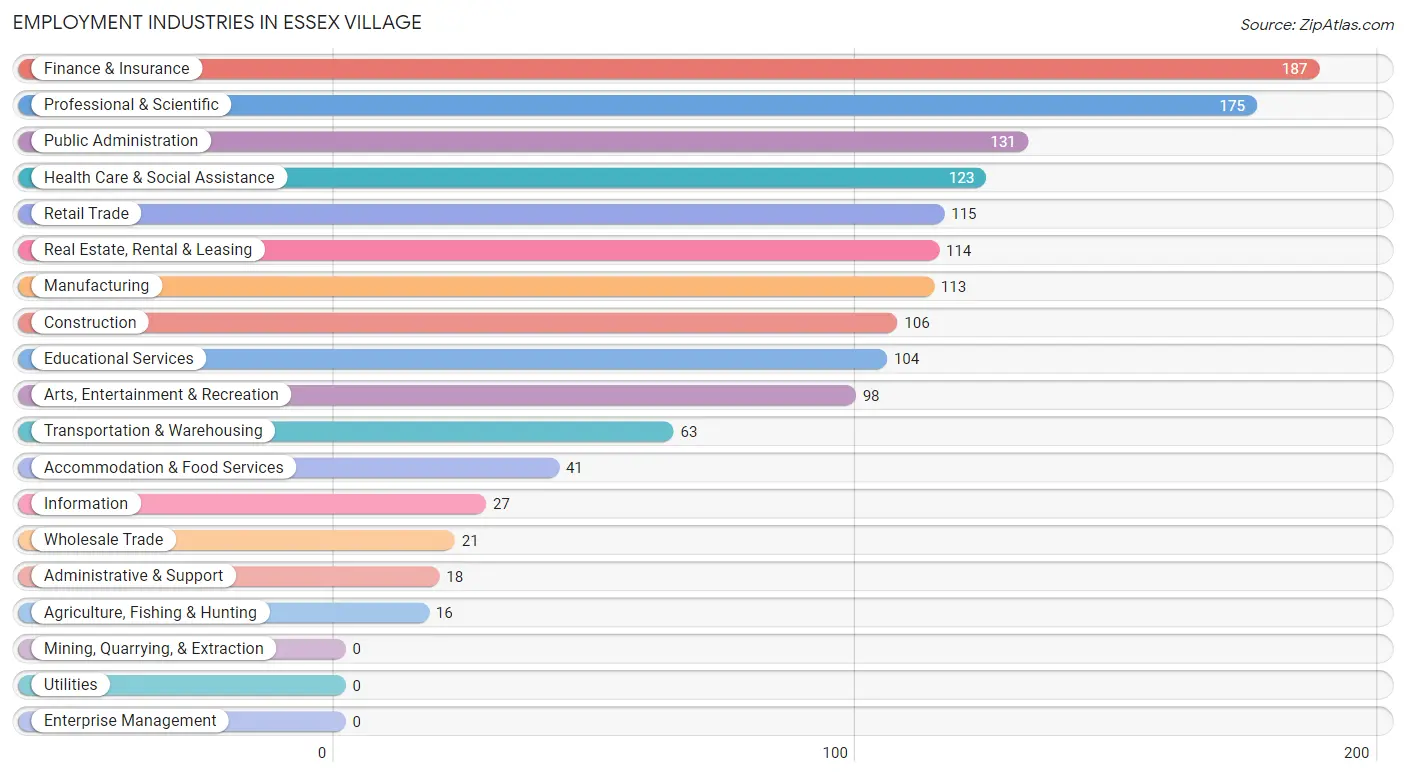
Employment Industries in Essex Village
The major employment industries in Essex Village include Finance & Insurance (187 | 12.4%), Professional & Scientific (175 | 11.6%), Public Administration (131 | 8.7%), Health Care & Social Assistance (123 | 8.1%), and Retail Trade (115 | 7.6%).
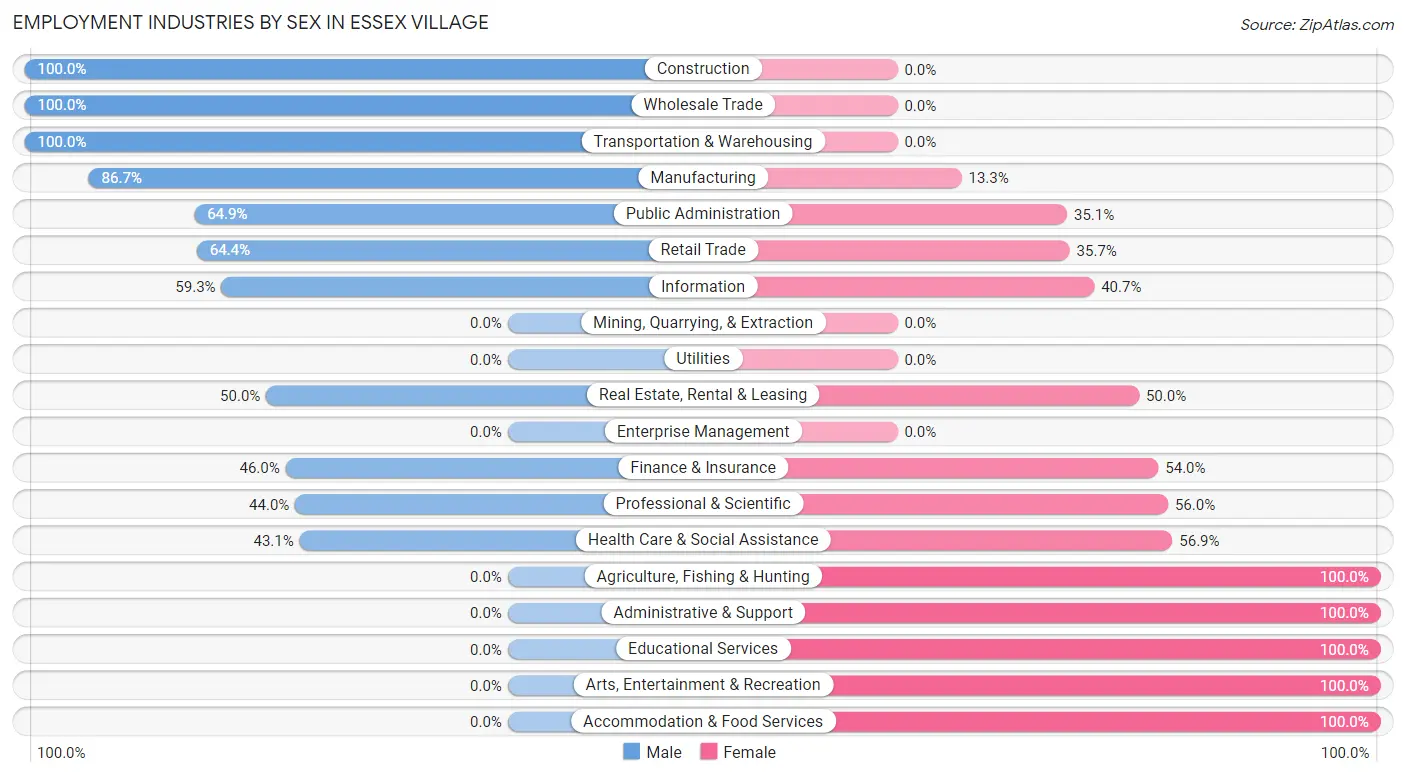
Employment Industries by Sex in Essex Village
The Essex Village industries that see more men than women are Construction (100.0%), Wholesale Trade (100.0%), and Transportation & Warehousing (100.0%), whereas the industries that tend to have a higher number of women are Agriculture, Fishing & Hunting (100.0%), Administrative & Support (100.0%), and Educational Services (100.0%).
| Industry | Male | Female |
| Agriculture, Fishing & Hunting | 0 (0.0%) | 16 (100.0%) |
| Mining, Quarrying, & Extraction | 0 (0.0%) | 0 (0.0%) |
| Construction | 106 (100.0%) | 0 (0.0%) |
| Manufacturing | 98 (86.7%) | 15 (13.3%) |
| Wholesale Trade | 21 (100.0%) | 0 (0.0%) |
| Retail Trade | 74 (64.3%) | 41 (35.6%) |
| Transportation & Warehousing | 63 (100.0%) | 0 (0.0%) |
| Utilities | 0 (0.0%) | 0 (0.0%) |
| Information | 16 (59.3%) | 11 (40.7%) |
| Finance & Insurance | 86 (46.0%) | 101 (54.0%) |
| Real Estate, Rental & Leasing | 57 (50.0%) | 57 (50.0%) |
| Professional & Scientific | 77 (44.0%) | 98 (56.0%) |
| Enterprise Management | 0 (0.0%) | 0 (0.0%) |
| Administrative & Support | 0 (0.0%) | 18 (100.0%) |
| Educational Services | 0 (0.0%) | 104 (100.0%) |
| Health Care & Social Assistance | 53 (43.1%) | 70 (56.9%) |
| Arts, Entertainment & Recreation | 0 (0.0%) | 98 (100.0%) |
| Accommodation & Food Services | 0 (0.0%) | 41 (100.0%) |
| Public Administration | 85 (64.9%) | 46 (35.1%) |
| Total | 737 (48.8%) | 774 (51.2%) |
Education in Essex Village
School Enrollment in Essex Village
The most common levels of schooling among the 575 students in Essex Village are college / undergraduate (134 | 23.3%), high school (131 | 22.8%), and nursery / preschool (83 | 14.4%).
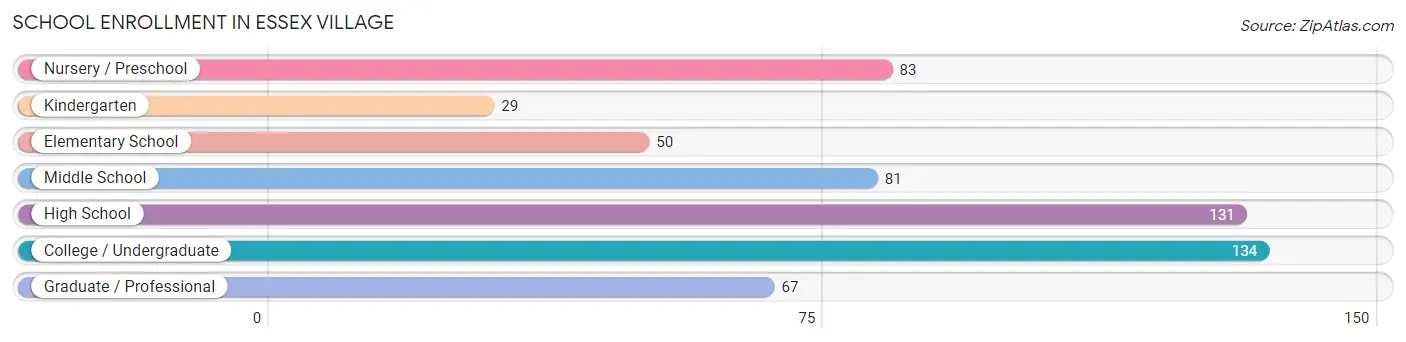
| School Level | # Students | % Students |
| Nursery / Preschool | 83 | 14.4% |
| Kindergarten | 29 | 5.0% |
| Elementary School | 50 | 8.7% |
| Middle School | 81 | 14.1% |
| High School | 131 | 22.8% |
| College / Undergraduate | 134 | 23.3% |
| Graduate / Professional | 67 | 11.7% |
| Total | 575 | 100.0% |
School Enrollment by Age by Funding Source in Essex Village
Out of a total of 575 students who are enrolled in schools in Essex Village, 59 (10.3%) attend a private institution, while the remaining 516 (89.7%) are enrolled in public schools. The age group of 15 to 17 year olds has the highest likelihood of being enrolled in private schools, with 41 (31.3% in the age bracket) enrolled. Conversely, the age group of 3 to 4 year olds has the lowest likelihood of being enrolled in a private school, with 83 (100.0% in the age bracket) attending a public institution.
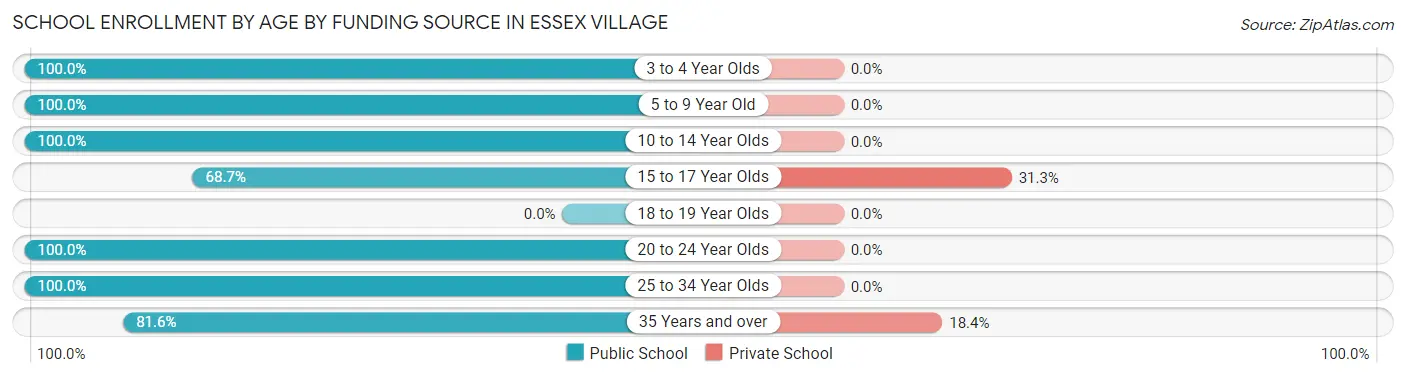
| Age Bracket | Public School | Private School |
| 3 to 4 Year Olds | 83 (100.0%) | 0 (0.0%) |
| 5 to 9 Year Old | 63 (100.0%) | 0 (0.0%) |
| 10 to 14 Year Olds | 97 (100.0%) | 0 (0.0%) |
| 15 to 17 Year Olds | 90 (68.7%) | 41 (31.3%) |
| 18 to 19 Year Olds | 0 (0.0%) | 0 (0.0%) |
| 20 to 24 Year Olds | 73 (100.0%) | 0 (0.0%) |
| 25 to 34 Year Olds | 30 (100.0%) | 0 (0.0%) |
| 35 Years and over | 80 (81.6%) | 18 (18.4%) |
| Total | 516 (89.7%) | 59 (10.3%) |
Educational Attainment by Field of Study in Essex Village
Engineering (258 | 15.5%), literature & languages (258 | 15.5%), social sciences (256 | 15.4%), business (206 | 12.4%), and education (200 | 12.0%) are the most common fields of study among 1,661 individuals in Essex Village who have obtained a bachelor's degree or higher.
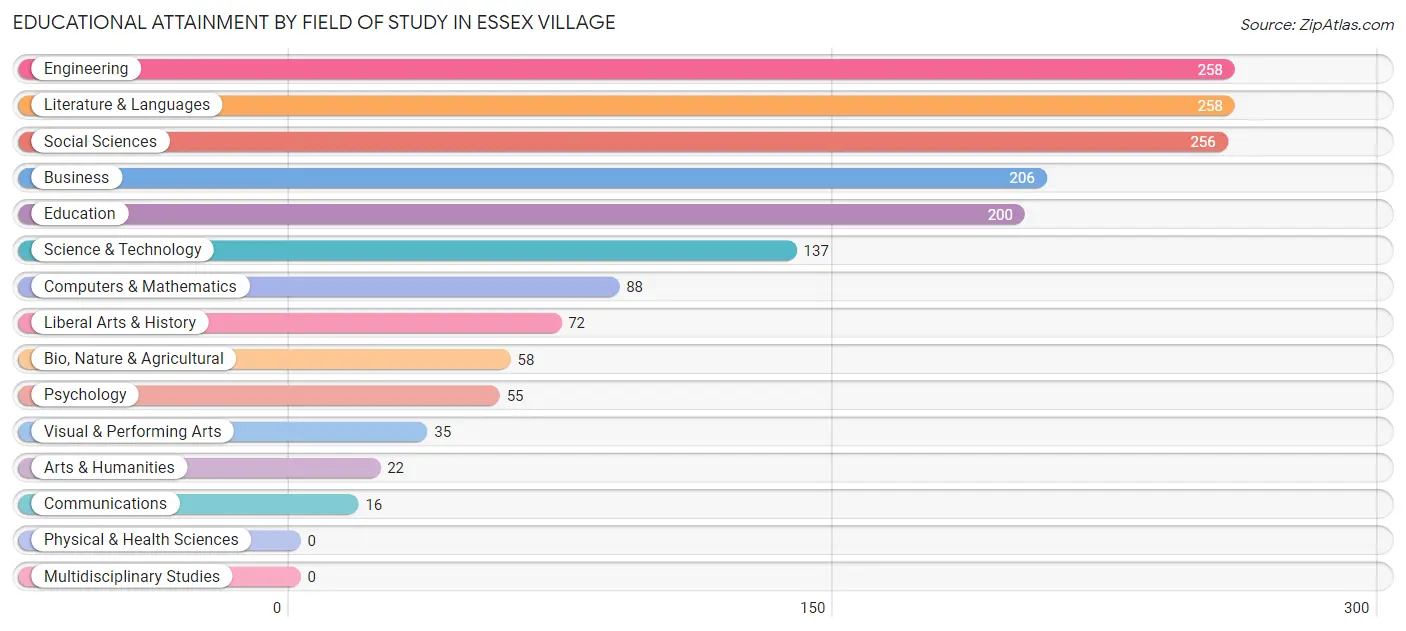
| Field of Study | # Graduates | % Graduates |
| Computers & Mathematics | 88 | 5.3% |
| Bio, Nature & Agricultural | 58 | 3.5% |
| Physical & Health Sciences | 0 | 0.0% |
| Psychology | 55 | 3.3% |
| Social Sciences | 256 | 15.4% |
| Engineering | 258 | 15.5% |
| Multidisciplinary Studies | 0 | 0.0% |
| Science & Technology | 137 | 8.3% |
| Business | 206 | 12.4% |
| Education | 200 | 12.0% |
| Literature & Languages | 258 | 15.5% |
| Liberal Arts & History | 72 | 4.3% |
| Visual & Performing Arts | 35 | 2.1% |
| Communications | 16 | 1.0% |
| Arts & Humanities | 22 | 1.3% |
| Total | 1,661 | 100.0% |
Transportation & Commute in Essex Village
Vehicle Availability by Sex in Essex Village
The most prevalent vehicle ownership categories in Essex Village are males with 3 vehicles (324, accounting for 44.8%) and females with 3 vehicles (200, making up 43.3%).
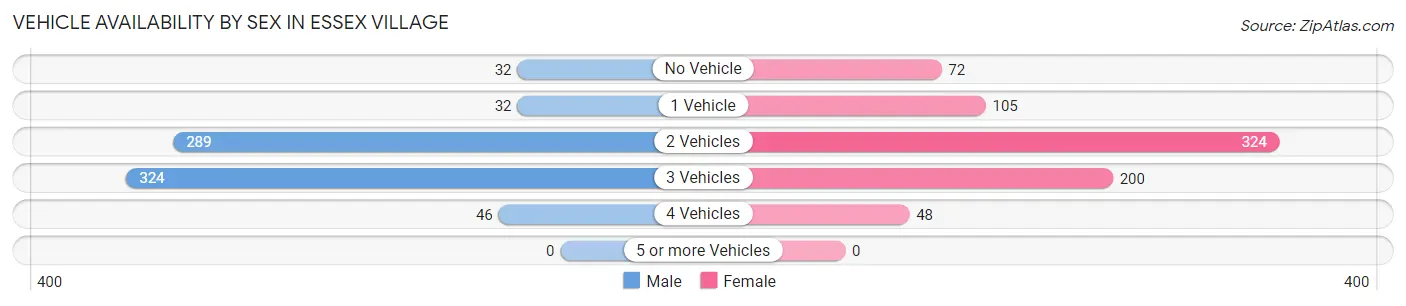
| Vehicles Available | Male | Female |
| No Vehicle | 32 (4.4%) | 72 (9.6%) |
| 1 Vehicle | 32 (4.4%) | 105 (14.0%) |
| 2 Vehicles | 289 (40.0%) | 324 (43.3%) |
| 3 Vehicles | 324 (44.8%) | 200 (26.7%) |
| 4 Vehicles | 46 (6.4%) | 48 (6.4%) |
| 5 or more Vehicles | 0 (0.0%) | 0 (0.0%) |
| Total | 723 (100.0%) | 749 (100.0%) |
Commute Time in Essex Village
The most frequently occuring commute durations in Essex Village are 10 to 14 minutes (177 commuters, 16.0%), 5 to 9 minutes (173 commuters, 15.6%), and less than 5 minutes (149 commuters, 13.5%).
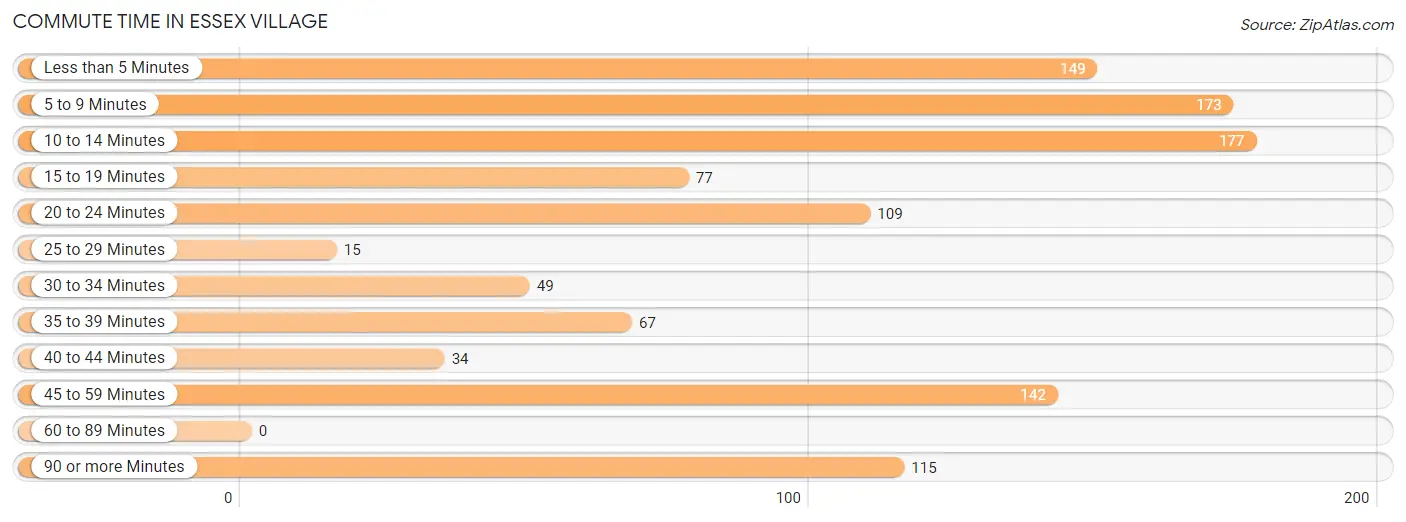
| Commute Time | # Commuters | % Commuters |
| Less than 5 Minutes | 149 | 13.5% |
| 5 to 9 Minutes | 173 | 15.6% |
| 10 to 14 Minutes | 177 | 16.0% |
| 15 to 19 Minutes | 77 | 7.0% |
| 20 to 24 Minutes | 109 | 9.9% |
| 25 to 29 Minutes | 15 | 1.4% |
| 30 to 34 Minutes | 49 | 4.4% |
| 35 to 39 Minutes | 67 | 6.0% |
| 40 to 44 Minutes | 34 | 3.1% |
| 45 to 59 Minutes | 142 | 12.8% |
| 60 to 89 Minutes | 0 | 0.0% |
| 90 or more Minutes | 115 | 10.4% |
Commute Time by Sex in Essex Village
The most common commute times in Essex Village are 5 to 9 minutes (132 commuters, 23.0%) for males and 10 to 14 minutes (177 commuters, 33.2%) for females.
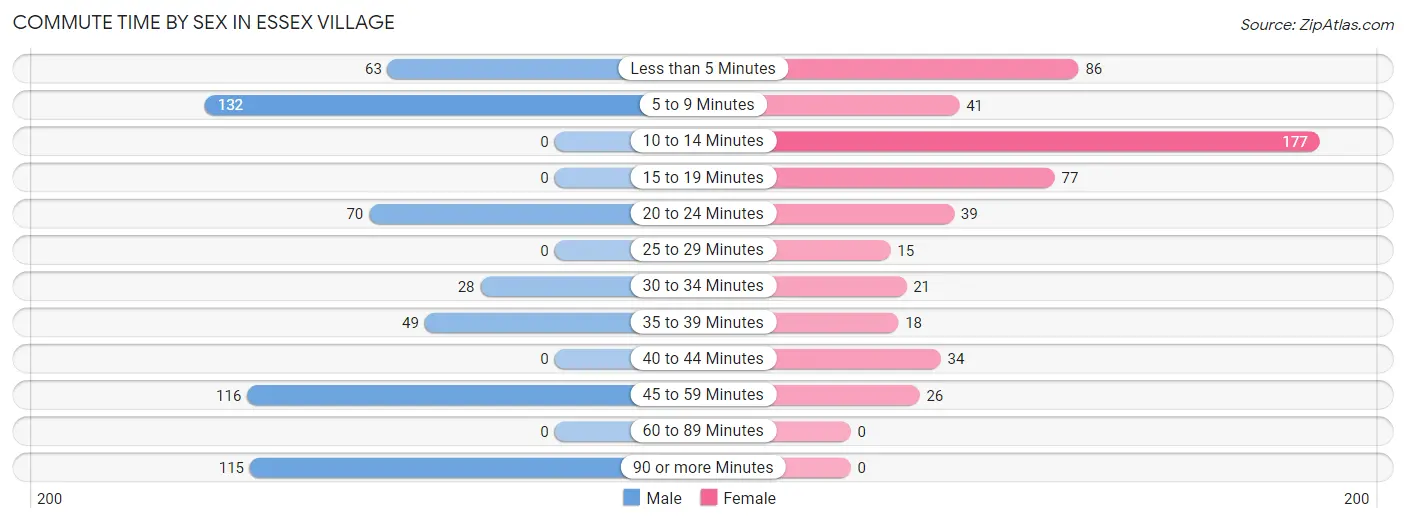
| Commute Time | Male | Female |
| Less than 5 Minutes | 63 (11.0%) | 86 (16.1%) |
| 5 to 9 Minutes | 132 (23.0%) | 41 (7.7%) |
| 10 to 14 Minutes | 0 (0.0%) | 177 (33.2%) |
| 15 to 19 Minutes | 0 (0.0%) | 77 (14.4%) |
| 20 to 24 Minutes | 70 (12.2%) | 39 (7.3%) |
| 25 to 29 Minutes | 0 (0.0%) | 15 (2.8%) |
| 30 to 34 Minutes | 28 (4.9%) | 21 (3.9%) |
| 35 to 39 Minutes | 49 (8.6%) | 18 (3.4%) |
| 40 to 44 Minutes | 0 (0.0%) | 34 (6.4%) |
| 45 to 59 Minutes | 116 (20.2%) | 26 (4.9%) |
| 60 to 89 Minutes | 0 (0.0%) | 0 (0.0%) |
| 90 or more Minutes | 115 (20.1%) | 0 (0.0%) |
Time of Departure to Work by Sex in Essex Village
The most frequent times of departure to work in Essex Village are 8:30 AM to 8:59 AM (142, 24.8%) for males and 9:00 AM to 9:59 AM (91, 17.0%) for females.
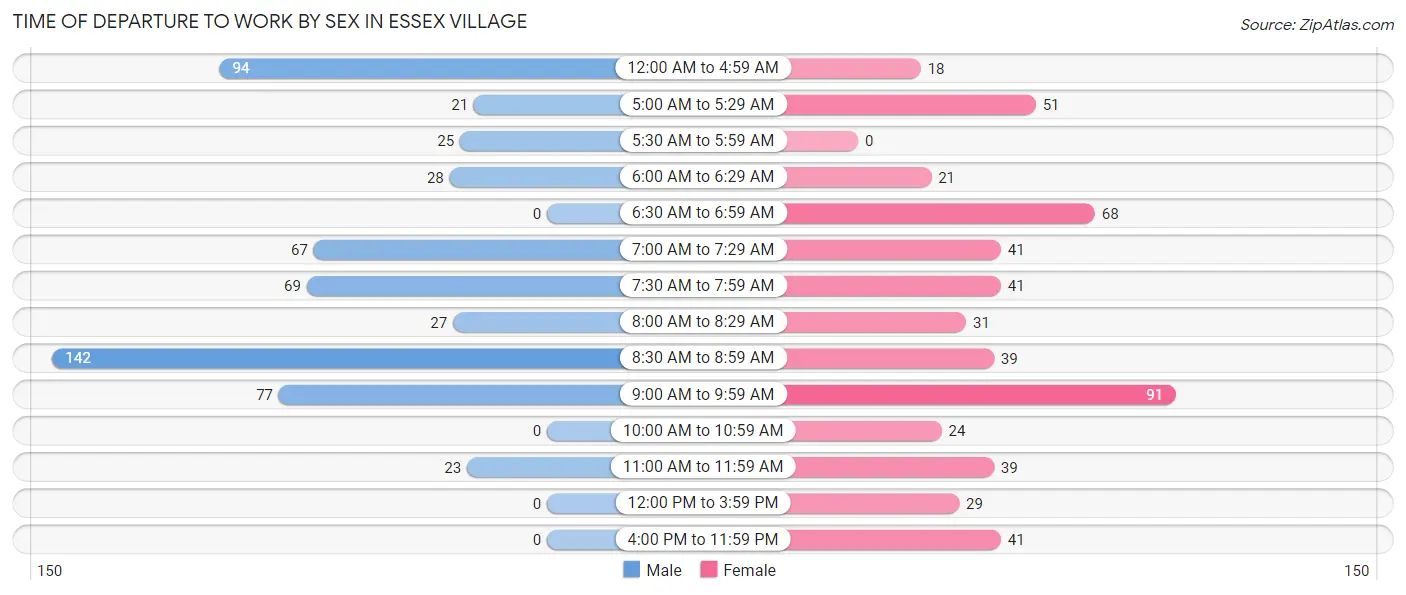
| Time of Departure | Male | Female |
| 12:00 AM to 4:59 AM | 94 (16.4%) | 18 (3.4%) |
| 5:00 AM to 5:29 AM | 21 (3.7%) | 51 (9.6%) |
| 5:30 AM to 5:59 AM | 25 (4.4%) | 0 (0.0%) |
| 6:00 AM to 6:29 AM | 28 (4.9%) | 21 (3.9%) |
| 6:30 AM to 6:59 AM | 0 (0.0%) | 68 (12.7%) |
| 7:00 AM to 7:29 AM | 67 (11.7%) | 41 (7.7%) |
| 7:30 AM to 7:59 AM | 69 (12.0%) | 41 (7.7%) |
| 8:00 AM to 8:29 AM | 27 (4.7%) | 31 (5.8%) |
| 8:30 AM to 8:59 AM | 142 (24.8%) | 39 (7.3%) |
| 9:00 AM to 9:59 AM | 77 (13.4%) | 91 (17.0%) |
| 10:00 AM to 10:59 AM | 0 (0.0%) | 24 (4.5%) |
| 11:00 AM to 11:59 AM | 23 (4.0%) | 39 (7.3%) |
| 12:00 PM to 3:59 PM | 0 (0.0%) | 29 (5.4%) |
| 4:00 PM to 11:59 PM | 0 (0.0%) | 41 (7.7%) |
| Total | 573 (100.0%) | 534 (100.0%) |
Housing Occupancy in Essex Village
Occupancy by Ownership in Essex Village
Of the total 1,204 dwellings in Essex Village, owner-occupied units account for 1,022 (84.9%), while renter-occupied units make up 182 (15.1%).
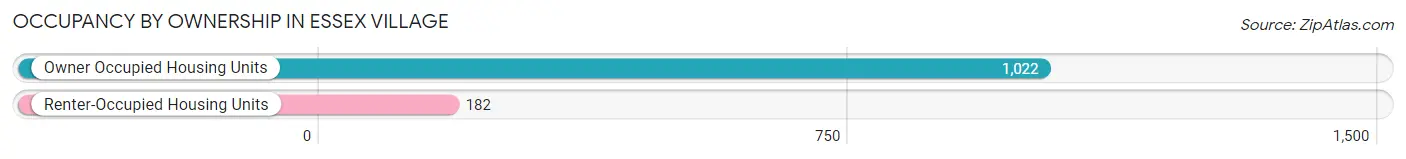
| Occupancy | # Housing Units | % Housing Units |
| Owner Occupied Housing Units | 1,022 | 84.9% |
| Renter-Occupied Housing Units | 182 | 15.1% |
| Total Occupied Housing Units | 1,204 | 100.0% |
Occupancy by Household Size in Essex Village
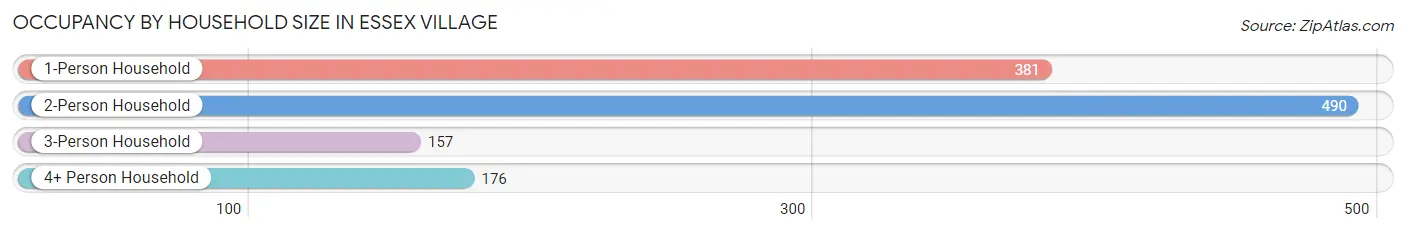
| Household Size | # Housing Units | % Housing Units |
| 1-Person Household | 381 | 31.6% |
| 2-Person Household | 490 | 40.7% |
| 3-Person Household | 157 | 13.0% |
| 4+ Person Household | 176 | 14.6% |
| Total Housing Units | 1,204 | 100.0% |
Occupancy by Ownership by Household Size in Essex Village
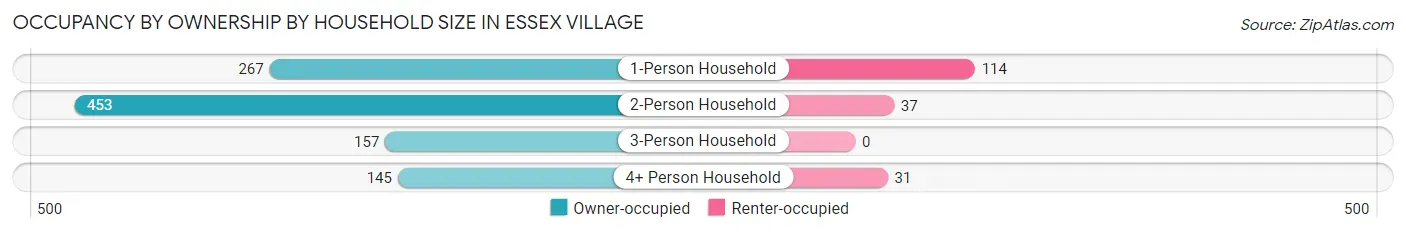
| Household Size | Owner-occupied | Renter-occupied |
| 1-Person Household | 267 (70.1%) | 114 (29.9%) |
| 2-Person Household | 453 (92.4%) | 37 (7.5%) |
| 3-Person Household | 157 (100.0%) | 0 (0.0%) |
| 4+ Person Household | 145 (82.4%) | 31 (17.6%) |
| Total Housing Units | 1,022 (84.9%) | 182 (15.1%) |
Occupancy by Educational Attainment in Essex Village
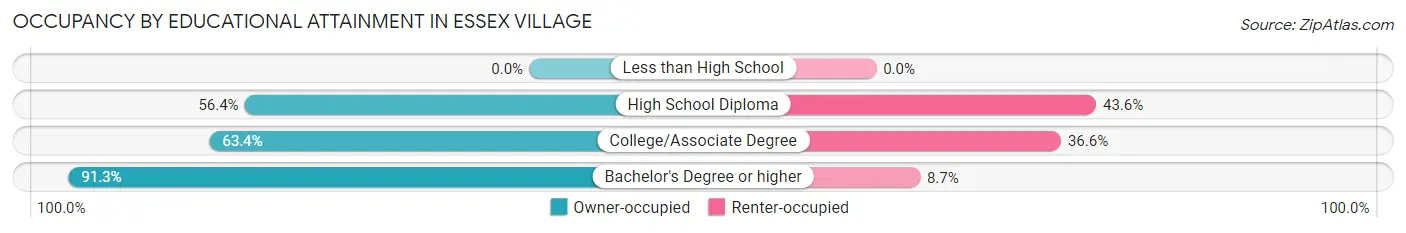
| Household Size | Owner-occupied | Renter-occupied |
| Less than High School | 0 (0.0%) | 0 (0.0%) |
| High School Diploma | 66 (56.4%) | 51 (43.6%) |
| College/Associate Degree | 83 (63.4%) | 48 (36.6%) |
| Bachelor's Degree or higher | 873 (91.3%) | 83 (8.7%) |
Occupancy by Age of Householder in Essex Village
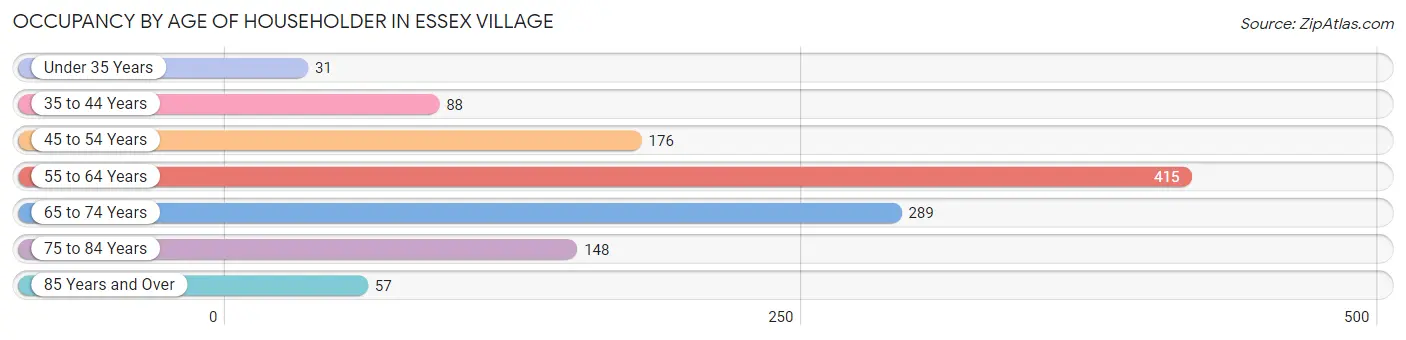
| Age Bracket | # Households | % Households |
| Under 35 Years | 31 | 2.6% |
| 35 to 44 Years | 88 | 7.3% |
| 45 to 54 Years | 176 | 14.6% |
| 55 to 64 Years | 415 | 34.5% |
| 65 to 74 Years | 289 | 24.0% |
| 75 to 84 Years | 148 | 12.3% |
| 85 Years and Over | 57 | 4.7% |
| Total | 1,204 | 100.0% |
Housing Finances in Essex Village
Median Income by Occupancy in Essex Village
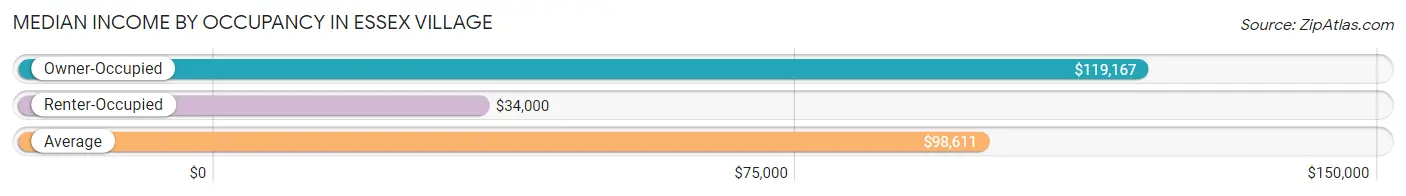
| Occupancy Type | # Households | Median Income |
| Owner-Occupied | 1,022 (84.9%) | $119,167 |
| Renter-Occupied | 182 (15.1%) | $34,000 |
| Average | 1,204 (100.0%) | $98,611 |
Occupancy by Householder Income Bracket in Essex Village
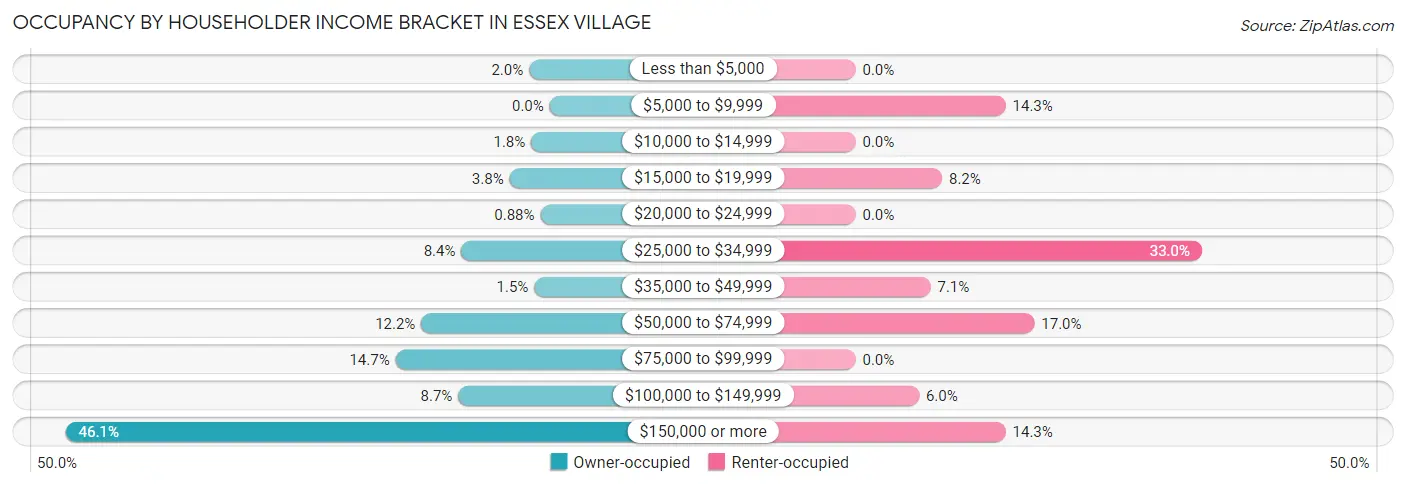
| Income Bracket | Owner-occupied | Renter-occupied |
| Less than $5,000 | 20 (2.0%) | 0 (0.0%) |
| $5,000 to $9,999 | 0 (0.0%) | 26 (14.3%) |
| $10,000 to $14,999 | 18 (1.8%) | 0 (0.0%) |
| $15,000 to $19,999 | 39 (3.8%) | 15 (8.2%) |
| $20,000 to $24,999 | 9 (0.9%) | 0 (0.0%) |
| $25,000 to $34,999 | 86 (8.4%) | 60 (33.0%) |
| $35,000 to $49,999 | 15 (1.5%) | 13 (7.1%) |
| $50,000 to $74,999 | 125 (12.2%) | 31 (17.0%) |
| $75,000 to $99,999 | 150 (14.7%) | 0 (0.0%) |
| $100,000 to $149,999 | 89 (8.7%) | 11 (6.0%) |
| $150,000 or more | 471 (46.1%) | 26 (14.3%) |
| Total | 1,022 (100.0%) | 182 (100.0%) |
Monthly Housing Cost Tiers in Essex Village
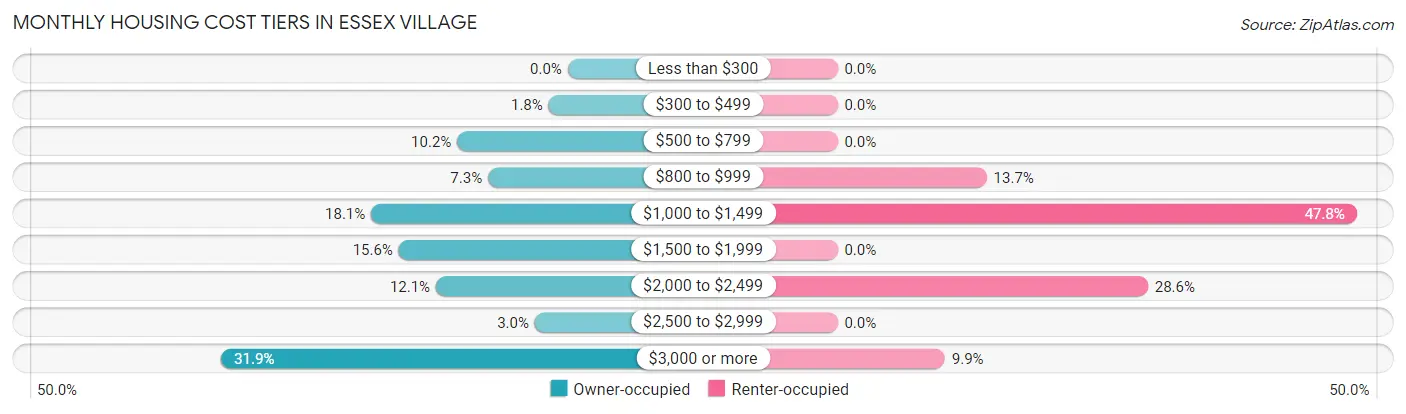
| Monthly Cost | Owner-occupied | Renter-occupied |
| Less than $300 | 0 (0.0%) | 0 (0.0%) |
| $300 to $499 | 18 (1.8%) | 0 (0.0%) |
| $500 to $799 | 104 (10.2%) | 0 (0.0%) |
| $800 to $999 | 75 (7.3%) | 25 (13.7%) |
| $1,000 to $1,499 | 185 (18.1%) | 87 (47.8%) |
| $1,500 to $1,999 | 159 (15.6%) | 0 (0.0%) |
| $2,000 to $2,499 | 124 (12.1%) | 52 (28.6%) |
| $2,500 to $2,999 | 31 (3.0%) | 0 (0.0%) |
| $3,000 or more | 326 (31.9%) | 18 (9.9%) |
| Total | 1,022 (100.0%) | 182 (100.0%) |
Physical Housing Characteristics in Essex Village
Housing Structures in Essex Village
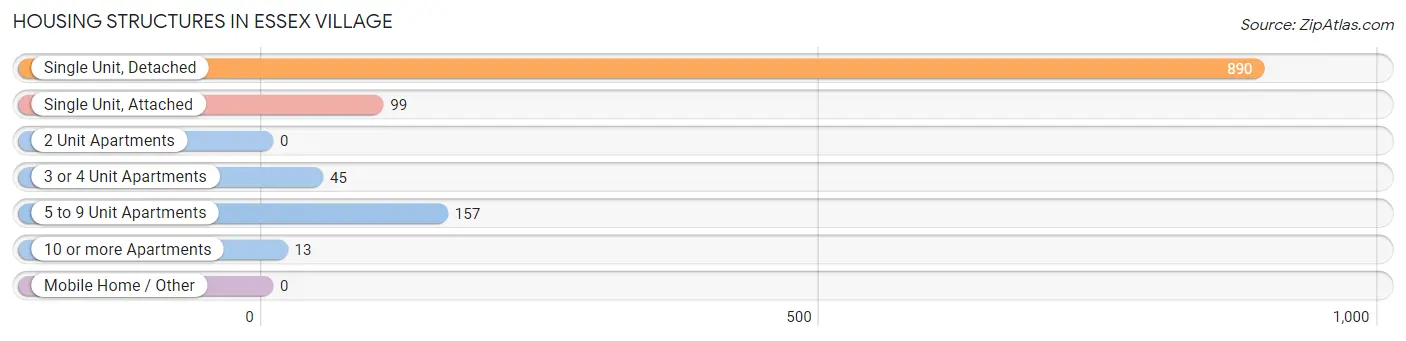
| Structure Type | # Housing Units | % Housing Units |
| Single Unit, Detached | 890 | 73.9% |
| Single Unit, Attached | 99 | 8.2% |
| 2 Unit Apartments | 0 | 0.0% |
| 3 or 4 Unit Apartments | 45 | 3.7% |
| 5 to 9 Unit Apartments | 157 | 13.0% |
| 10 or more Apartments | 13 | 1.1% |
| Mobile Home / Other | 0 | 0.0% |
| Total | 1,204 | 100.0% |
Housing Structures by Occupancy in Essex Village
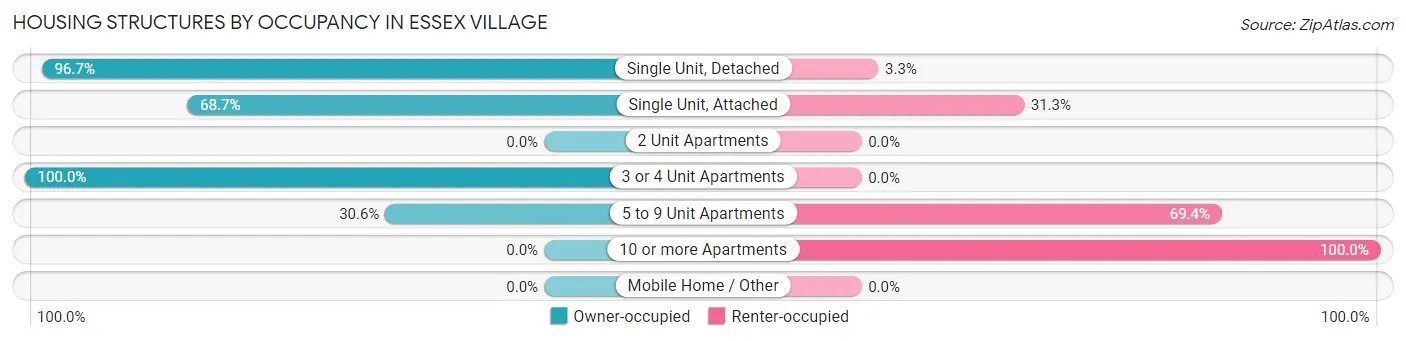
| Structure Type | Owner-occupied | Renter-occupied |
| Single Unit, Detached | 861 (96.7%) | 29 (3.3%) |
| Single Unit, Attached | 68 (68.7%) | 31 (31.3%) |
| 2 Unit Apartments | 0 (0.0%) | 0 (0.0%) |
| 3 or 4 Unit Apartments | 45 (100.0%) | 0 (0.0%) |
| 5 to 9 Unit Apartments | 48 (30.6%) | 109 (69.4%) |
| 10 or more Apartments | 0 (0.0%) | 13 (100.0%) |
| Mobile Home / Other | 0 (0.0%) | 0 (0.0%) |
| Total | 1,022 (84.9%) | 182 (15.1%) |
Housing Structures by Number of Rooms in Essex Village
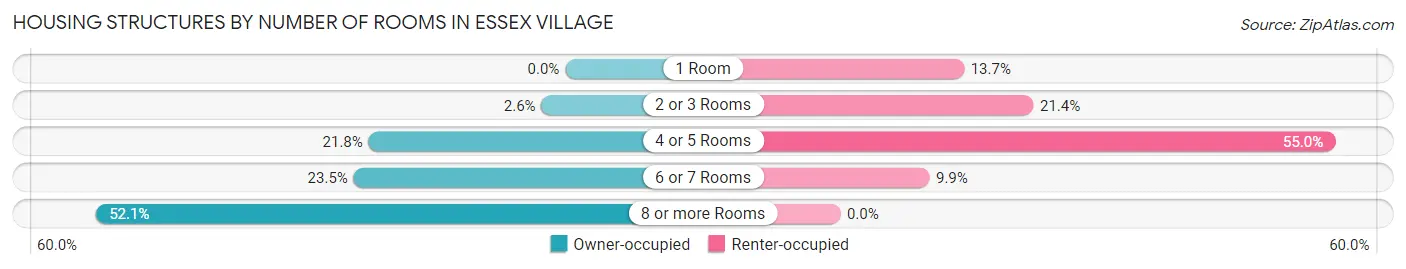
| Number of Rooms | Owner-occupied | Renter-occupied |
| 1 Room | 0 (0.0%) | 25 (13.7%) |
| 2 or 3 Rooms | 27 (2.6%) | 39 (21.4%) |
| 4 or 5 Rooms | 223 (21.8%) | 100 (54.9%) |
| 6 or 7 Rooms | 240 (23.5%) | 18 (9.9%) |
| 8 or more Rooms | 532 (52.0%) | 0 (0.0%) |
| Total | 1,022 (100.0%) | 182 (100.0%) |
Housing Structure by Heating Type in Essex Village
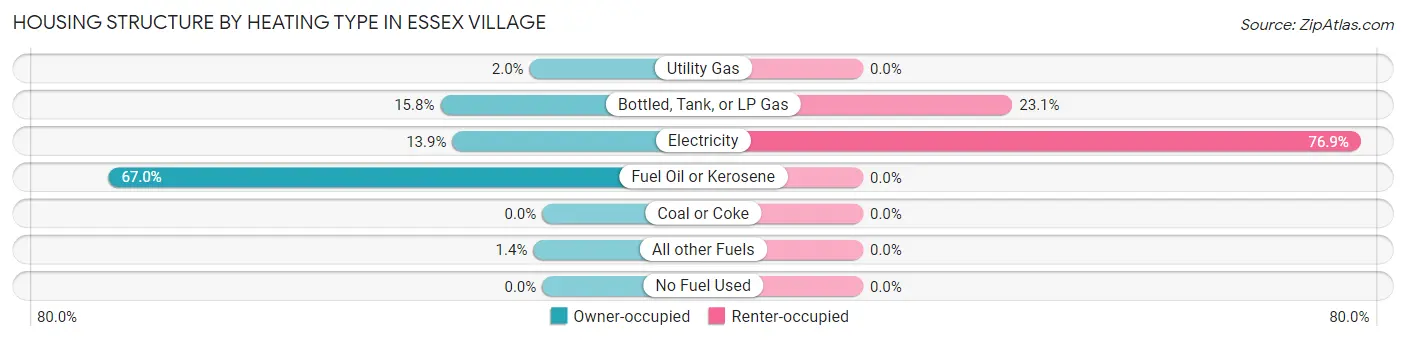
| Heating Type | Owner-occupied | Renter-occupied |
| Utility Gas | 20 (2.0%) | 0 (0.0%) |
| Bottled, Tank, or LP Gas | 161 (15.8%) | 42 (23.1%) |
| Electricity | 142 (13.9%) | 140 (76.9%) |
| Fuel Oil or Kerosene | 685 (67.0%) | 0 (0.0%) |
| Coal or Coke | 0 (0.0%) | 0 (0.0%) |
| All other Fuels | 14 (1.4%) | 0 (0.0%) |
| No Fuel Used | 0 (0.0%) | 0 (0.0%) |
| Total | 1,022 (100.0%) | 182 (100.0%) |
Household Vehicle Usage in Essex Village
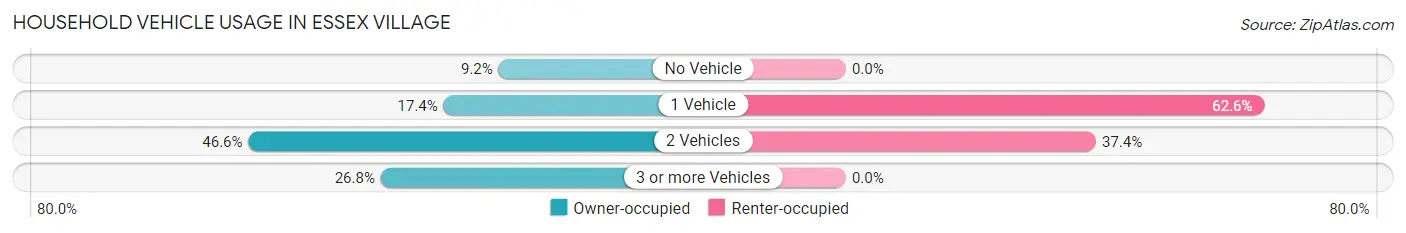
| Vehicles per Household | Owner-occupied | Renter-occupied |
| No Vehicle | 94 (9.2%) | 0 (0.0%) |
| 1 Vehicle | 178 (17.4%) | 114 (62.6%) |
| 2 Vehicles | 476 (46.6%) | 68 (37.4%) |
| 3 or more Vehicles | 274 (26.8%) | 0 (0.0%) |
| Total | 1,022 (100.0%) | 182 (100.0%) |
Real Estate & Mortgages in Essex Village
Real Estate and Mortgage Overview in Essex Village
| Characteristic | Without Mortgage | With Mortgage |
| Housing Units | 489 | 533 |
| Median Property Value | $716,600 | $749,300 |
| Median Household Income | $66,250 | $386 |
| Monthly Housing Costs | $1,138 | $294 |
| Real Estate Taxes | $6,887 | $0 |
Property Value by Mortgage Status in Essex Village
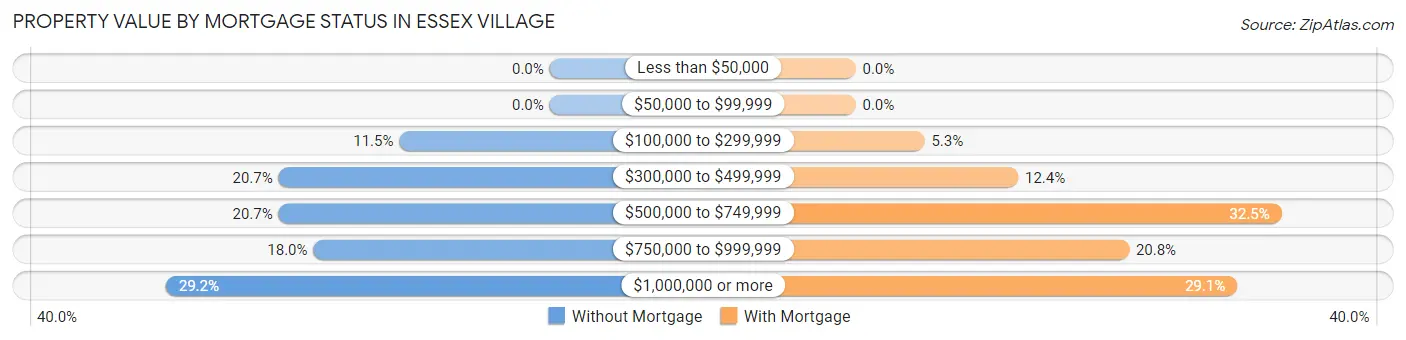
| Property Value | Without Mortgage | With Mortgage |
| Less than $50,000 | 0 (0.0%) | 0 (0.0%) |
| $50,000 to $99,999 | 0 (0.0%) | 0 (0.0%) |
| $100,000 to $299,999 | 56 (11.5%) | 28 (5.2%) |
| $300,000 to $499,999 | 101 (20.6%) | 66 (12.4%) |
| $500,000 to $749,999 | 101 (20.6%) | 173 (32.5%) |
| $750,000 to $999,999 | 88 (18.0%) | 111 (20.8%) |
| $1,000,000 or more | 143 (29.2%) | 155 (29.1%) |
| Total | 489 (100.0%) | 533 (100.0%) |
Household Income by Mortgage Status in Essex Village
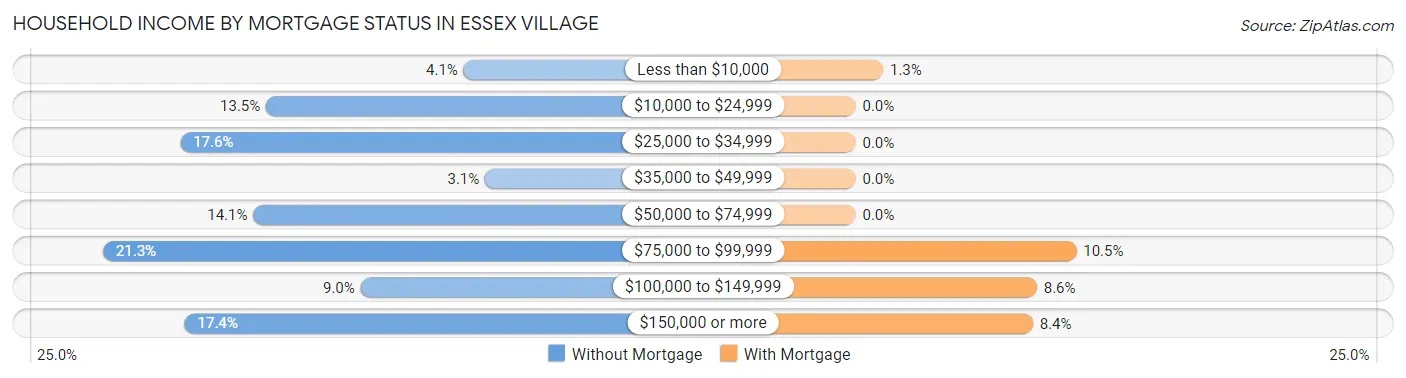
| Household Income | Without Mortgage | With Mortgage |
| Less than $10,000 | 20 (4.1%) | 7 (1.3%) |
| $10,000 to $24,999 | 66 (13.5%) | 0 (0.0%) |
| $25,000 to $34,999 | 86 (17.6%) | 0 (0.0%) |
| $35,000 to $49,999 | 15 (3.1%) | 0 (0.0%) |
| $50,000 to $74,999 | 69 (14.1%) | 0 (0.0%) |
| $75,000 to $99,999 | 104 (21.3%) | 56 (10.5%) |
| $100,000 to $149,999 | 44 (9.0%) | 46 (8.6%) |
| $150,000 or more | 85 (17.4%) | 45 (8.4%) |
| Total | 489 (100.0%) | 533 (100.0%) |
Property Value to Household Income Ratio in Essex Village
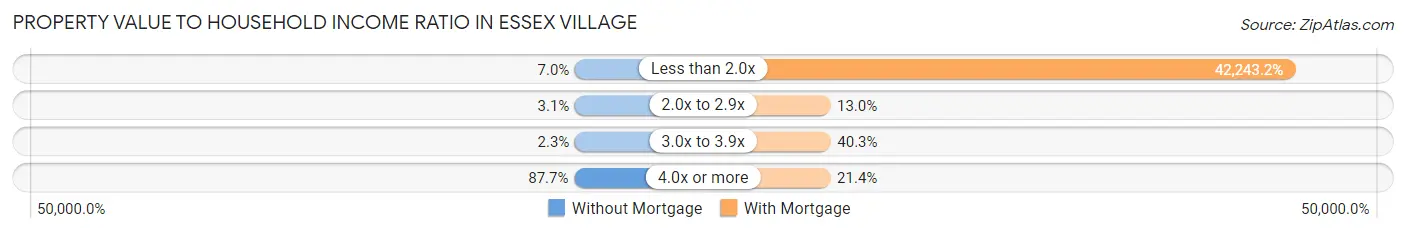
| Value-to-Income Ratio | Without Mortgage | With Mortgage |
| Less than 2.0x | 34 (7.0%) | 225,156 (42,243.2%) |
| 2.0x to 2.9x | 15 (3.1%) | 69 (13.0%) |
| 3.0x to 3.9x | 11 (2.2%) | 215 (40.3%) |
| 4.0x or more | 429 (87.7%) | 114 (21.4%) |
| Total | 489 (100.0%) | 533 (100.0%) |
Real Estate Taxes by Mortgage Status in Essex Village
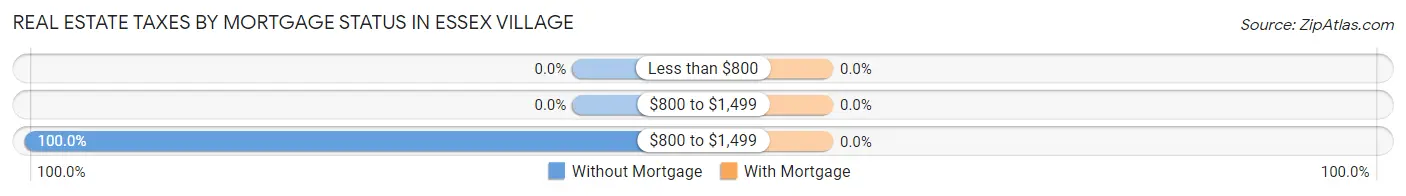
| Property Taxes | Without Mortgage | With Mortgage |
| Less than $800 | 0 (0.0%) | 0 (0.0%) |
| $800 to $1,499 | 0 (0.0%) | 0 (0.0%) |
| $800 to $1,499 | 489 (100.0%) | 0 (0.0%) |
| Total | 489 (100.0%) | 533 (100.0%) |
Health & Disability in Essex Village
Health Insurance Coverage by Age in Essex Village
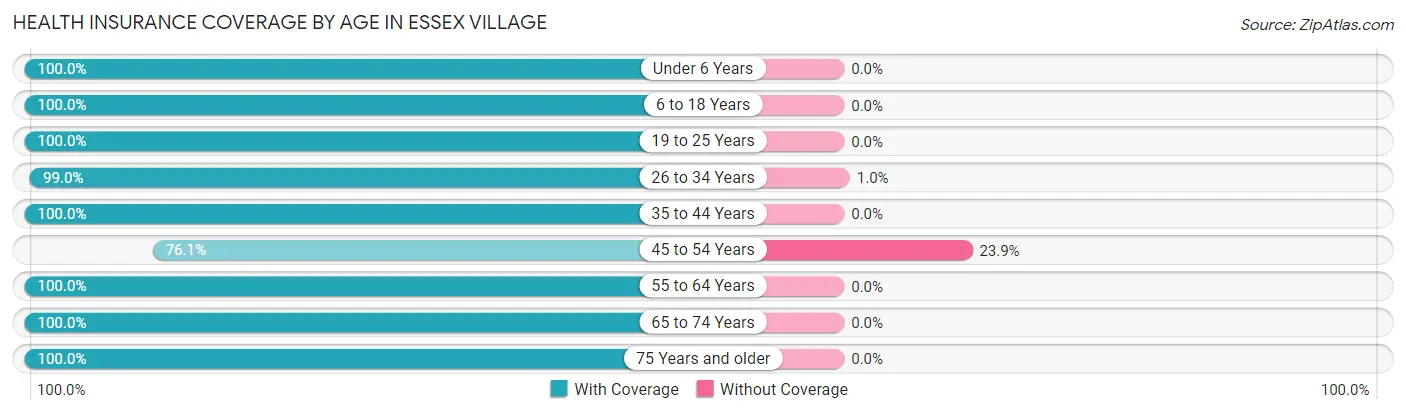
| Age Bracket | With Coverage | Without Coverage |
| Under 6 Years | 168 (100.0%) | 0 (0.0%) |
| 6 to 18 Years | 262 (100.0%) | 0 (0.0%) |
| 19 to 25 Years | 115 (100.0%) | 0 (0.0%) |
| 26 to 34 Years | 95 (99.0%) | 1 (1.0%) |
| 35 to 44 Years | 207 (100.0%) | 0 (0.0%) |
| 45 to 54 Years | 207 (76.1%) | 65 (23.9%) |
| 55 to 64 Years | 688 (100.0%) | 0 (0.0%) |
| 65 to 74 Years | 513 (100.0%) | 0 (0.0%) |
| 75 Years and older | 404 (100.0%) | 0 (0.0%) |
| Total | 2,659 (97.6%) | 66 (2.4%) |
Health Insurance Coverage by Citizenship Status in Essex Village
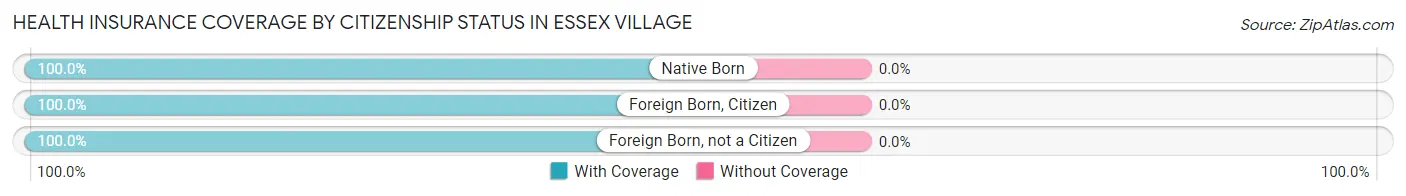
| Citizenship Status | With Coverage | Without Coverage |
| Native Born | 168 (100.0%) | 0 (0.0%) |
| Foreign Born, Citizen | 262 (100.0%) | 0 (0.0%) |
| Foreign Born, not a Citizen | 115 (100.0%) | 0 (0.0%) |
Health Insurance Coverage by Household Income in Essex Village
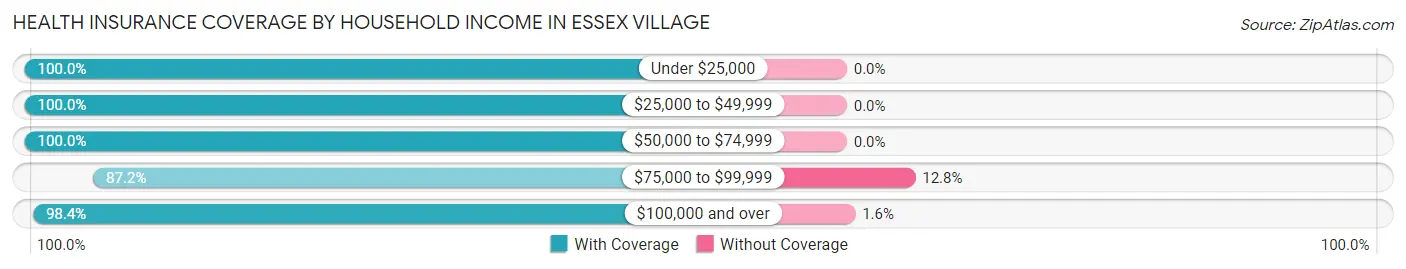
| Household Income | With Coverage | Without Coverage |
| Under $25,000 | 127 (100.0%) | 0 (0.0%) |
| $25,000 to $49,999 | 203 (100.0%) | 0 (0.0%) |
| $50,000 to $74,999 | 433 (100.0%) | 0 (0.0%) |
| $75,000 to $99,999 | 265 (87.2%) | 39 (12.8%) |
| $100,000 and over | 1,625 (98.4%) | 26 (1.6%) |
Public vs Private Health Insurance Coverage by Age in Essex Village
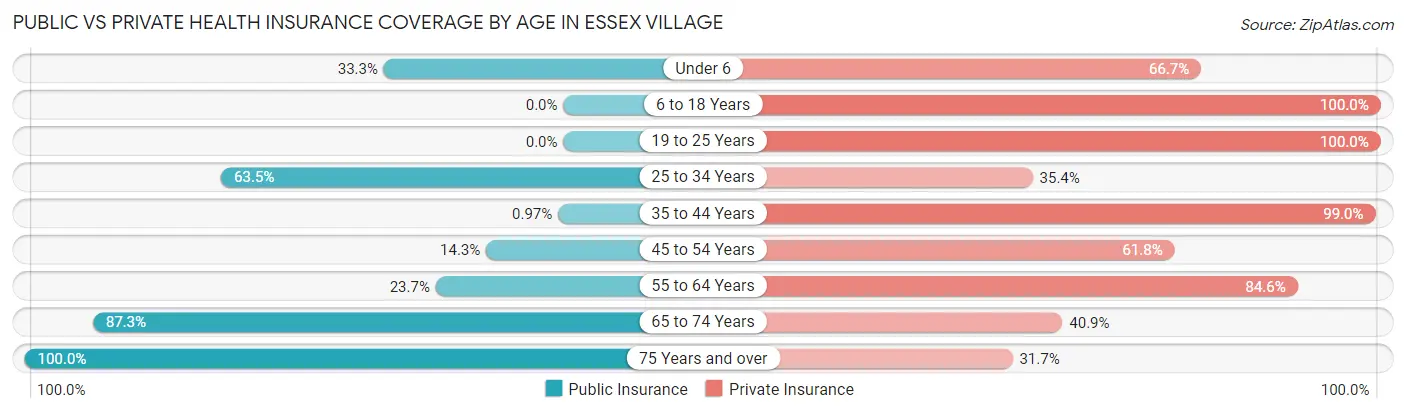
| Age Bracket | Public Insurance | Private Insurance |
| Under 6 | 56 (33.3%) | 112 (66.7%) |
| 6 to 18 Years | 0 (0.0%) | 262 (100.0%) |
| 19 to 25 Years | 0 (0.0%) | 115 (100.0%) |
| 25 to 34 Years | 61 (63.5%) | 34 (35.4%) |
| 35 to 44 Years | 2 (1.0%) | 205 (99.0%) |
| 45 to 54 Years | 39 (14.3%) | 168 (61.8%) |
| 55 to 64 Years | 163 (23.7%) | 582 (84.6%) |
| 65 to 74 Years | 448 (87.3%) | 210 (40.9%) |
| 75 Years and over | 404 (100.0%) | 128 (31.7%) |
| Total | 1,173 (43.0%) | 1,816 (66.6%) |
Disability Status by Sex by Age in Essex Village
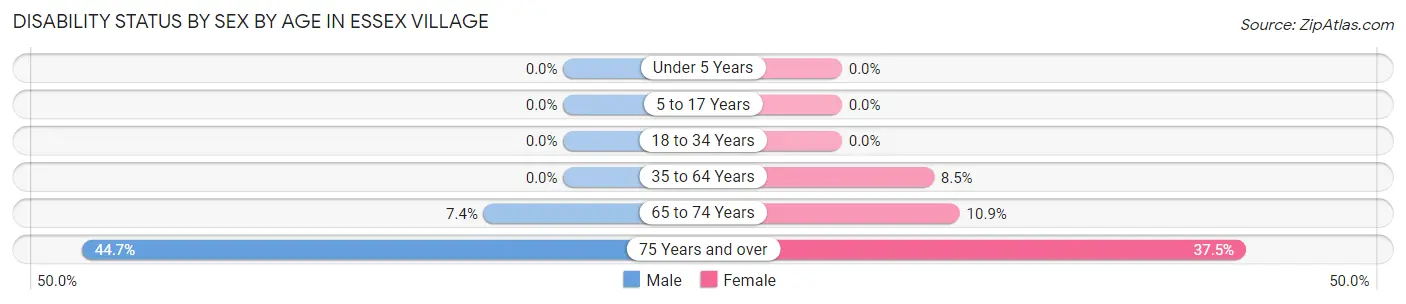
| Age Bracket | Male | Female |
| Under 5 Years | 0 (0.0%) | 0 (0.0%) |
| 5 to 17 Years | 0 (0.0%) | 0 (0.0%) |
| 18 to 34 Years | 0 (0.0%) | 0 (0.0%) |
| 35 to 64 Years | 0 (0.0%) | 62 (8.5%) |
| 65 to 74 Years | 19 (7.4%) | 28 (10.9%) |
| 75 Years and over | 84 (44.7%) | 81 (37.5%) |
Disability Class by Sex by Age in Essex Village
Disability Class: Hearing Difficulty
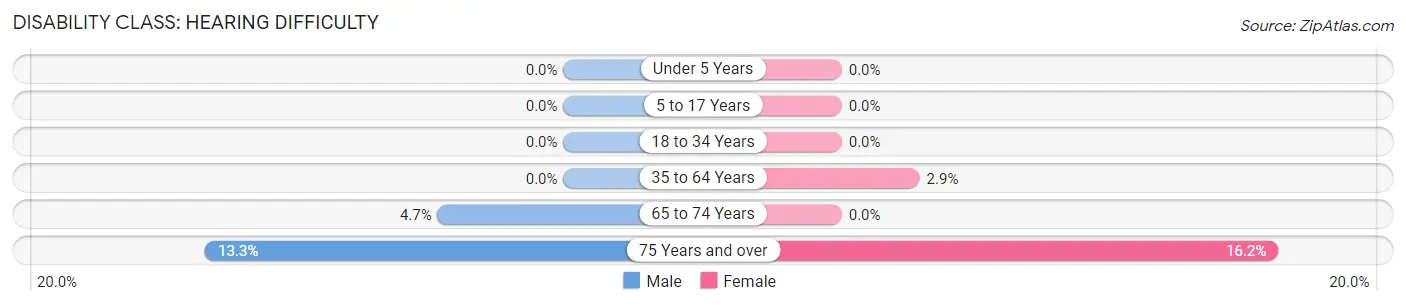
| Age Bracket | Male | Female |
| Under 5 Years | 0 (0.0%) | 0 (0.0%) |
| 5 to 17 Years | 0 (0.0%) | 0 (0.0%) |
| 18 to 34 Years | 0 (0.0%) | 0 (0.0%) |
| 35 to 64 Years | 0 (0.0%) | 21 (2.9%) |
| 65 to 74 Years | 12 (4.7%) | 0 (0.0%) |
| 75 Years and over | 25 (13.3%) | 35 (16.2%) |
Disability Class: Vision Difficulty
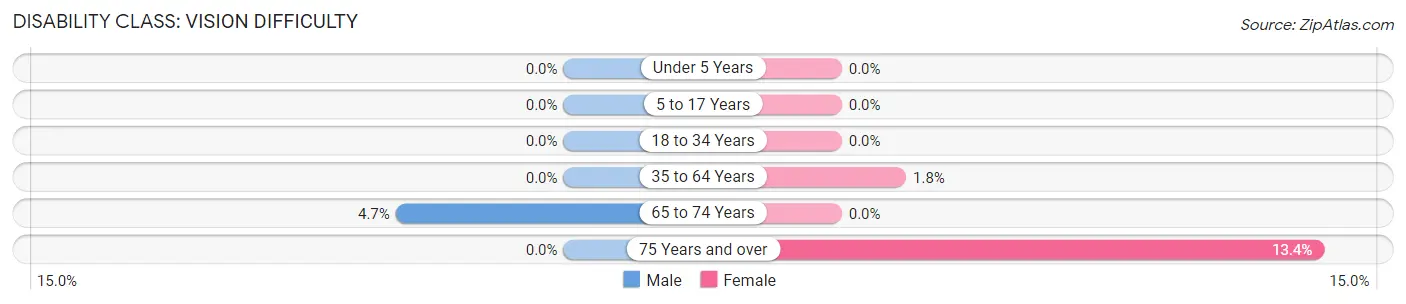
| Age Bracket | Male | Female |
| Under 5 Years | 0 (0.0%) | 0 (0.0%) |
| 5 to 17 Years | 0 (0.0%) | 0 (0.0%) |
| 18 to 34 Years | 0 (0.0%) | 0 (0.0%) |
| 35 to 64 Years | 0 (0.0%) | 13 (1.8%) |
| 65 to 74 Years | 12 (4.7%) | 0 (0.0%) |
| 75 Years and over | 0 (0.0%) | 29 (13.4%) |
Disability Class: Cognitive Difficulty
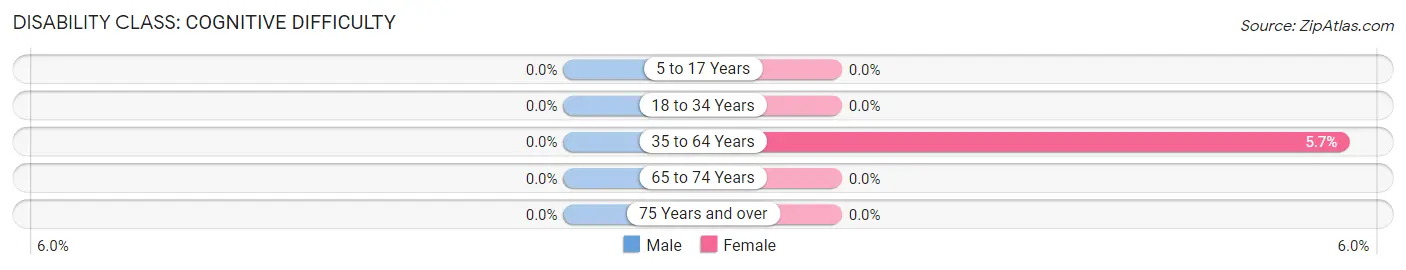
| Age Bracket | Male | Female |
| 5 to 17 Years | 0 (0.0%) | 0 (0.0%) |
| 18 to 34 Years | 0 (0.0%) | 0 (0.0%) |
| 35 to 64 Years | 0 (0.0%) | 41 (5.7%) |
| 65 to 74 Years | 0 (0.0%) | 0 (0.0%) |
| 75 Years and over | 0 (0.0%) | 0 (0.0%) |
Disability Class: Ambulatory Difficulty
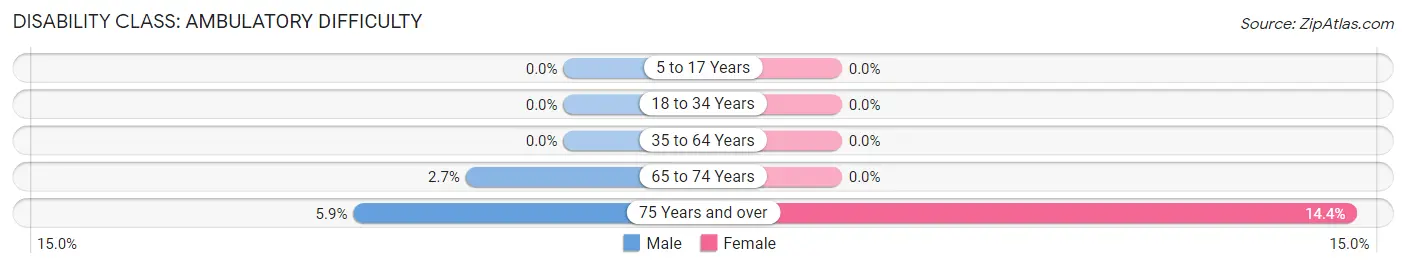
| Age Bracket | Male | Female |
| 5 to 17 Years | 0 (0.0%) | 0 (0.0%) |
| 18 to 34 Years | 0 (0.0%) | 0 (0.0%) |
| 35 to 64 Years | 0 (0.0%) | 0 (0.0%) |
| 65 to 74 Years | 7 (2.7%) | 0 (0.0%) |
| 75 Years and over | 11 (5.9%) | 31 (14.3%) |
Disability Class: Self-Care Difficulty
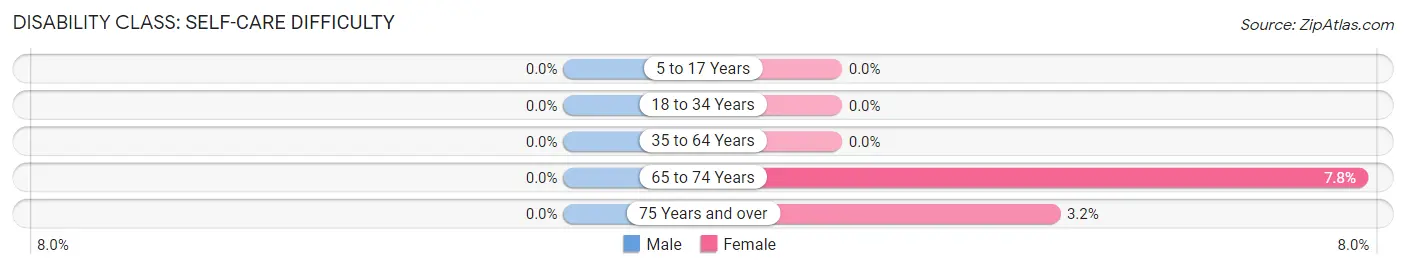
| Age Bracket | Male | Female |
| 5 to 17 Years | 0 (0.0%) | 0 (0.0%) |
| 18 to 34 Years | 0 (0.0%) | 0 (0.0%) |
| 35 to 64 Years | 0 (0.0%) | 0 (0.0%) |
| 65 to 74 Years | 0 (0.0%) | 20 (7.8%) |
| 75 Years and over | 0 (0.0%) | 7 (3.2%) |
Technology Access in Essex Village
Computing Device Access in Essex Village
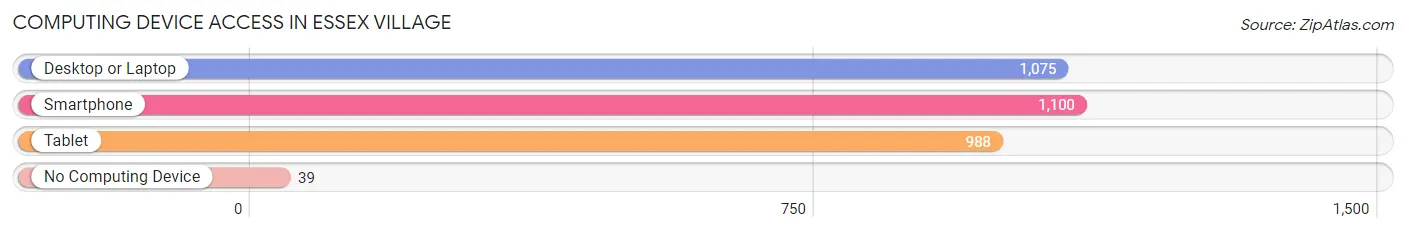
| Device Type | # Households | % Households |
| Desktop or Laptop | 1,075 | 89.3% |
| Smartphone | 1,100 | 91.4% |
| Tablet | 988 | 82.1% |
| No Computing Device | 39 | 3.2% |
| Total | 1,204 | 100.0% |
Internet Access in Essex Village
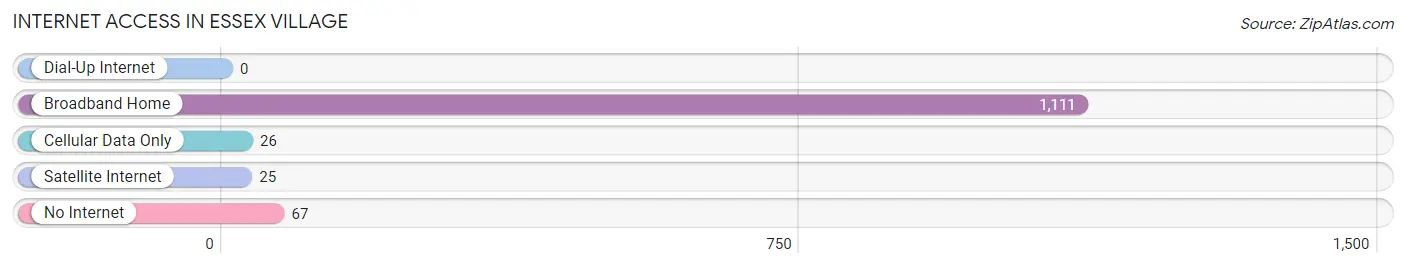
| Internet Type | # Households | % Households |
| Dial-Up Internet | 0 | 0.0% |
| Broadband Home | 1,111 | 92.3% |
| Cellular Data Only | 26 | 2.2% |
| Satellite Internet | 25 | 2.1% |
| No Internet | 67 | 5.6% |
| Total | 1,204 | 100.0% |
Essex Village Summary
Essex Village, Connecticut is a small village located in Middlesex County, Connecticut. It is situated on the Connecticut River, and is part of the town of Essex. The village has a population of approximately 2,500 people, and is a popular tourist destination due to its historic architecture and quaint atmosphere.
Geography
Essex Village is located in the southeastern corner of Middlesex County, Connecticut. It is situated on the Connecticut River, and is bordered by the towns of Deep River, Chester, and Old Saybrook. The village is approximately 8 miles from the Long Island Sound, and is located in the Connecticut River Valley. The village is situated on a hill, and is surrounded by rolling hills and forests.
The climate in Essex Village is humid continental, with hot, humid summers and cold, snowy winters. The average temperature in the summer is around 75 degrees Fahrenheit, and the average temperature in the winter is around 25 degrees Fahrenheit. The average annual precipitation is around 45 inches.
Economy
Essex Village has a strong economy based on tourism, retail, and services. The village is home to several historic buildings, including the Griswold Inn, which is a popular tourist destination. The village also has several antique shops, art galleries, and restaurants.
The village is also home to several small businesses, including a boatyard, a marina, and a boat repair shop. The village is also home to several small manufacturing companies, including a furniture maker and a metal fabricator.
Demographics
As of the 2010 census, the population of Essex Village was 2,500. The racial makeup of the village was 95.2% White, 1.2% African American, 0.4% Native American, 0.8% Asian, 0.2% Pacific Islander, 0.6% from other races, and 1.6% from two or more races. Hispanic or Latino of any race were 2.2% of the population.
The median income for a household in the village was $60,000, and the median income for a family was $68,000. The per capita income for the village was $30,000. About 4.2% of families and 5.2% of the population were below the poverty line, including 6.2% of those under age 18 and 4.2% of those age 65 or over.
History
Essex Village was first settled in 1635 by settlers from the Massachusetts Bay Colony. The village was originally known as Potapaug, and was part of the town of Saybrook. In 1645, the village was renamed Essex, after the Earl of Essex.
In the late 1700s, the village became a popular tourist destination due to its picturesque setting and historic architecture. The village was home to several prominent families, including the Griswolds, who built the Griswold Inn in 1776.
The village was incorporated in 1852, and in the late 1800s, the village became a popular summer resort destination. The village was home to several large hotels, including the Essex House and the Essex Inn.
In the early 1900s, the village began to decline in popularity as a tourist destination, and the village's economy shifted to focus on manufacturing and services. The village was home to several small manufacturing companies, including a furniture maker and a metal fabricator.
Today, Essex Village is a popular tourist destination due to its historic architecture and quaint atmosphere. The village is home to several antique shops, art galleries, and restaurants. The village is also home to several small businesses, including a boatyard, a marina, and a boat repair shop.
Common Questions
What is Per Capita Income in Essex Village?
Per Capita income in Essex Village is $73,947.
What is the Median Family Income in Essex Village?
Median Family Income in Essex Village is $194,563.
What is the Median Household income in Essex Village?
Median Household Income in Essex Village is $98,611.
What is Income or Wage Gap in Essex Village?
Income or Wage Gap in Essex Village is 69.5%.
Women in Essex Village earn 30.5 cents for every dollar earned by a man.
What is Inequality or Gini Index in Essex Village?
Inequality or Gini Index in Essex Village is 0.49.
What is the Total Population of Essex Village?
Total Population of Essex Village is 2,725.
What is the Total Male Population of Essex Village?
Total Male Population of Essex Village is 1,223.
What is the Total Female Population of Essex Village?
Total Female Population of Essex Village is 1,502.
What is the Ratio of Males per 100 Females in Essex Village?
There are 81.42 Males per 100 Females in Essex Village.
What is the Ratio of Females per 100 Males in Essex Village?
There are 122.81 Females per 100 Males in Essex Village.
What is the Median Population Age in Essex Village?
Median Population Age in Essex Village is 58.6 Years.
What is the Average Family Size in Essex Village
Average Family Size in Essex Village is 2.8 People.
What is the Average Household Size in Essex Village
Average Household Size in Essex Village is 2.3 People.
How Large is the Labor Force in Essex Village?
There are 1,511 People in the Labor Forcein in Essex Village.
What is the Percentage of People in the Labor Force in Essex Village?
64.7% of People are in the Labor Force in Essex Village.