Norwich, CT Map & Demographics
Norwich Map
Norwich Overview
$36,075
PER CAPITA INCOME
$79,630
AVG FAMILY INCOME
$62,713
AVG HOUSEHOLD INCOME
30.1%
WAGE / INCOME GAP [ % ]
69.9¢/ $1
WAGE / INCOME GAP [ $ ]
$11,317
FAMILY INCOME DEFICIT
0.46
INEQUALITY / GINI INDEX
40,054
TOTAL POPULATION
19,930
MALE POPULATION
20,124
FEMALE POPULATION
99.04
MALES / 100 FEMALES
100.97
FEMALES / 100 MALES
40.2
MEDIAN AGE
2.9
AVG FAMILY SIZE
2.3
AVG HOUSEHOLD SIZE
20,897
LABOR FORCE [ PEOPLE ]
63.8%
PERCENT IN LABOR FORCE
7.0%
UNEMPLOYMENT RATE
Norwich Zip Codes
Norwich Area Codes
Income in Norwich
Income Overview in Norwich
Per Capita Income in Norwich is $36,075, while median incomes of families and households are $79,630 and $62,713 respectively.
| Characteristic | Number | Measure |
| Per Capita Income | 40,054 | $36,075 |
| Median Family Income | 9,950 | $79,630 |
| Mean Family Income | 9,950 | $100,817 |
| Median Household Income | 17,165 | $62,713 |
| Mean Household Income | 17,165 | $82,763 |
| Income Deficit | 9,950 | $11,317 |
| Wage / Income Gap (%) | 40,054 | 30.09% |
| Wage / Income Gap ($) | 40,054 | 69.91¢ per $1 |
| Gini / Inequality Index | 40,054 | 0.46 |
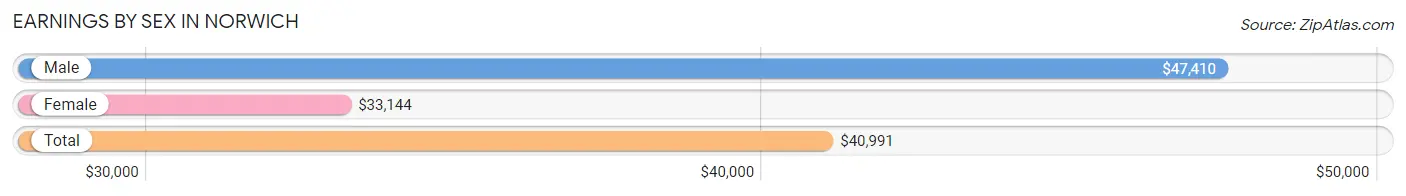
Earnings by Sex in Norwich
Average Earnings in Norwich are $40,991, $47,410 for men and $33,144 for women, a difference of 30.1%.
| Sex | Number | Average Earnings |
| Male | 11,047 (52.8%) | $47,410 |
| Female | 9,874 (47.2%) | $33,144 |
| Total | 20,921 (100.0%) | $40,991 |
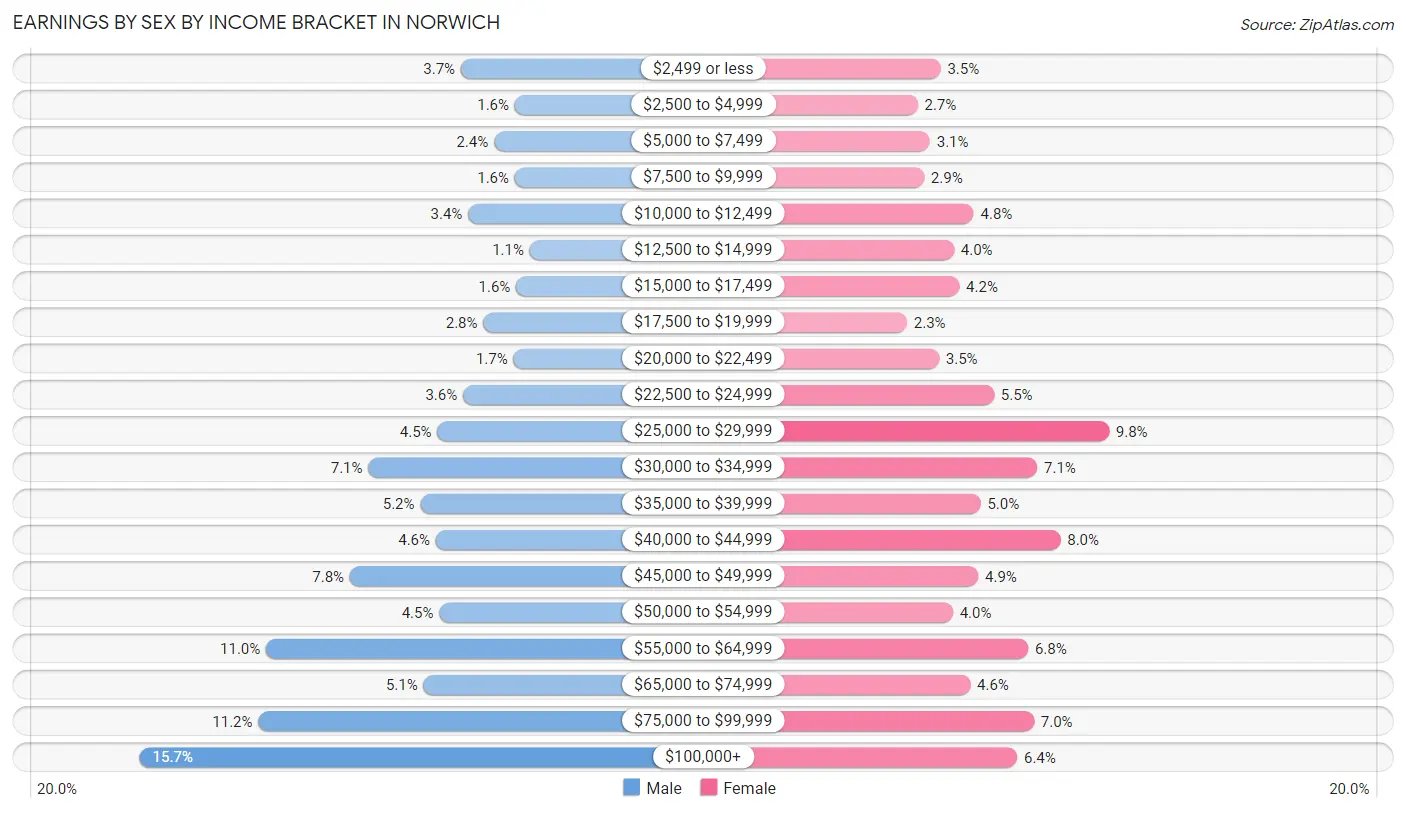
Earnings by Sex by Income Bracket in Norwich
The most common earnings brackets in Norwich are $100,000+ for men (1,733 | 15.7%) and $25,000 to $29,999 for women (970 | 9.8%).
| Income | Male | Female |
| $2,499 or less | 403 (3.6%) | 347 (3.5%) |
| $2,500 to $4,999 | 180 (1.6%) | 262 (2.6%) |
| $5,000 to $7,499 | 266 (2.4%) | 307 (3.1%) |
| $7,500 to $9,999 | 180 (1.6%) | 285 (2.9%) |
| $10,000 to $12,499 | 373 (3.4%) | 469 (4.8%) |
| $12,500 to $14,999 | 118 (1.1%) | 396 (4.0%) |
| $15,000 to $17,499 | 174 (1.6%) | 416 (4.2%) |
| $17,500 to $19,999 | 310 (2.8%) | 222 (2.2%) |
| $20,000 to $22,499 | 186 (1.7%) | 341 (3.5%) |
| $22,500 to $24,999 | 394 (3.6%) | 544 (5.5%) |
| $25,000 to $29,999 | 500 (4.5%) | 970 (9.8%) |
| $30,000 to $34,999 | 786 (7.1%) | 704 (7.1%) |
| $35,000 to $39,999 | 571 (5.2%) | 495 (5.0%) |
| $40,000 to $44,999 | 507 (4.6%) | 790 (8.0%) |
| $45,000 to $49,999 | 863 (7.8%) | 486 (4.9%) |
| $50,000 to $54,999 | 493 (4.5%) | 392 (4.0%) |
| $55,000 to $64,999 | 1,210 (11.0%) | 670 (6.8%) |
| $65,000 to $74,999 | 558 (5.1%) | 456 (4.6%) |
| $75,000 to $99,999 | 1,242 (11.2%) | 692 (7.0%) |
| $100,000+ | 1,733 (15.7%) | 630 (6.4%) |
| Total | 11,047 (100.0%) | 9,874 (100.0%) |
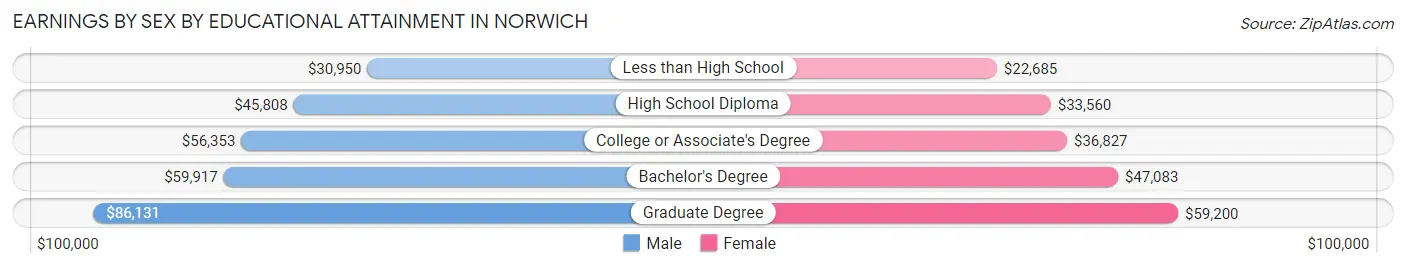
Earnings by Sex by Educational Attainment in Norwich
Average earnings in Norwich are $51,519 for men and $36,838 for women, a difference of 28.5%. Men with an educational attainment of graduate degree enjoy the highest average annual earnings of $86,131, while those with less than high school education earn the least with $30,950. Women with an educational attainment of graduate degree earn the most with the average annual earnings of $59,200, while those with less than high school education have the smallest earnings of $22,685.
| Educational Attainment | Male Income | Female Income |
| Less than High School | $30,950 | $22,685 |
| High School Diploma | $45,808 | $33,560 |
| College or Associate's Degree | $56,353 | $36,827 |
| Bachelor's Degree | $59,917 | $47,083 |
| Graduate Degree | $86,131 | $59,200 |
| Total | $51,519 | $36,838 |
Family Income in Norwich
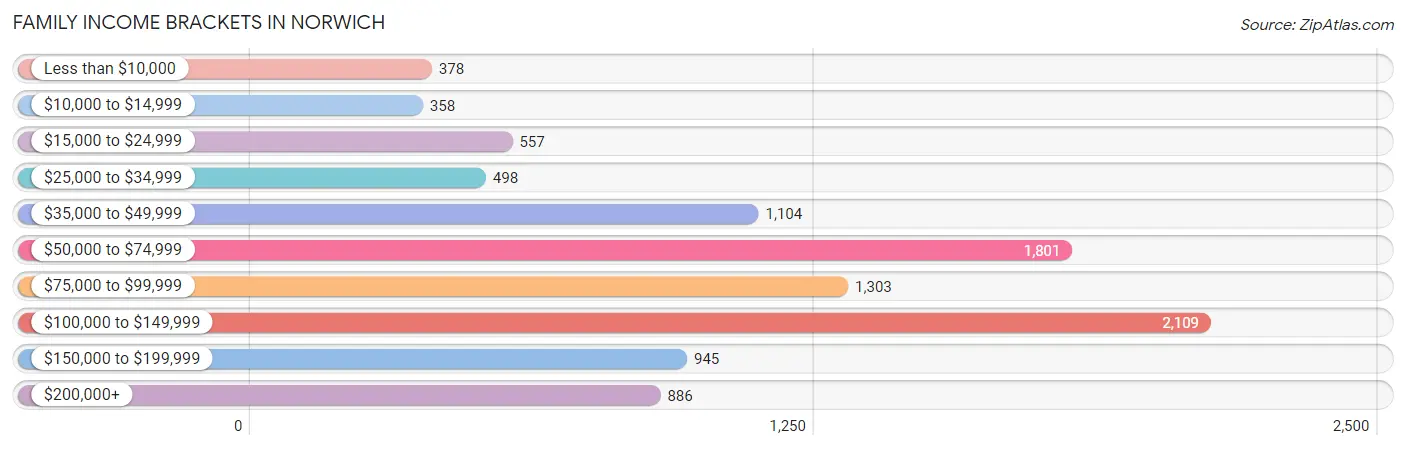
Family Income Brackets in Norwich
According to the Norwich family income data, there are 2,109 families falling into the $100,000 to $149,999 income range, which is the most common income bracket and makes up 21.2% of all families. Conversely, the $10,000 to $14,999 income bracket is the least frequent group with only 358 families (3.6%) belonging to this category.
| Income Bracket | # Families | % Families |
| Less than $10,000 | 378 | 3.8% |
| $10,000 to $14,999 | 358 | 3.6% |
| $15,000 to $24,999 | 557 | 5.6% |
| $25,000 to $34,999 | 498 | 5.0% |
| $35,000 to $49,999 | 1,104 | 11.1% |
| $50,000 to $74,999 | 1,801 | 18.1% |
| $75,000 to $99,999 | 1,303 | 13.1% |
| $100,000 to $149,999 | 2,109 | 21.2% |
| $150,000 to $199,999 | 945 | 9.5% |
| $200,000+ | 886 | 8.9% |
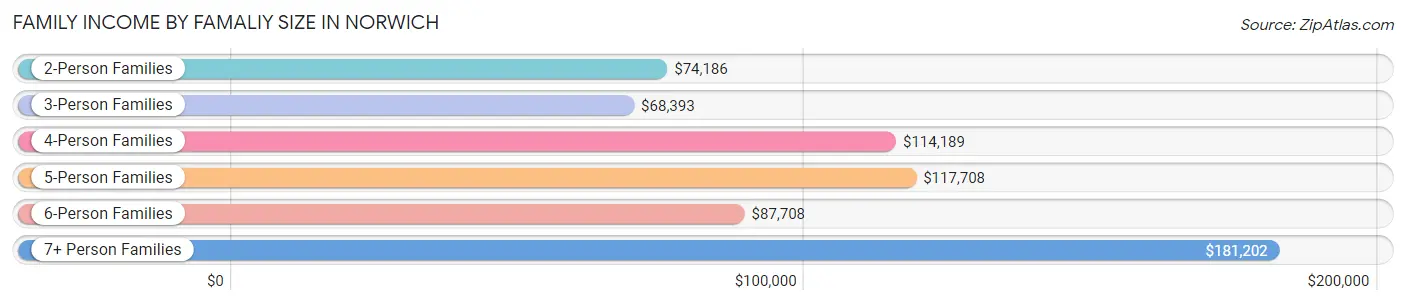
Family Income by Famaliy Size in Norwich
7+ person families (111 | 1.1%) account for the highest median family income in Norwich with $181,202 per family, while 2-person families (5,207 | 52.3%) have the highest median income of $37,093 per family member.
| Income Bracket | # Families | Median Income |
| 2-Person Families | 5,207 (52.3%) | $74,186 |
| 3-Person Families | 2,545 (25.6%) | $68,393 |
| 4-Person Families | 1,358 (13.7%) | $114,189 |
| 5-Person Families | 615 (6.2%) | $117,708 |
| 6-Person Families | 114 (1.1%) | $87,708 |
| 7+ Person Families | 111 (1.1%) | $181,202 |
| Total | 9,950 (100.0%) | $79,630 |
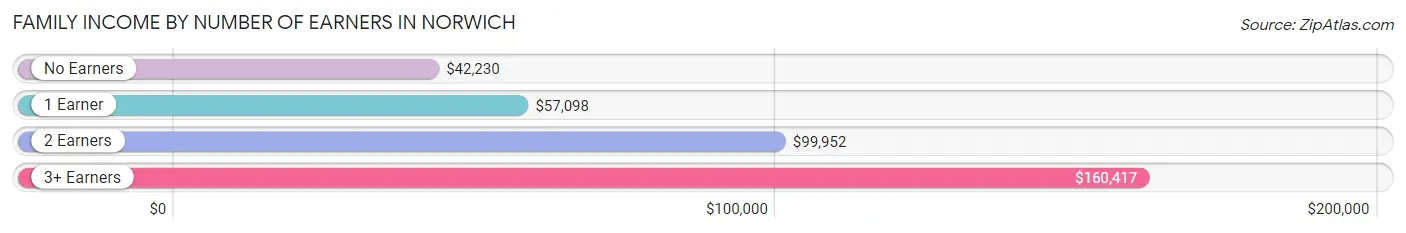
Family Income by Number of Earners in Norwich
The median family income in Norwich is $79,630, with families comprising 3+ earners (1,140) having the highest median family income of $160,417, while families with no earners (1,639) have the lowest median family income of $42,230, accounting for 11.5% and 16.5% of families, respectively.
| Number of Earners | # Families | Median Income |
| No Earners | 1,639 (16.5%) | $42,230 |
| 1 Earner | 3,596 (36.1%) | $57,098 |
| 2 Earners | 3,575 (35.9%) | $99,952 |
| 3+ Earners | 1,140 (11.5%) | $160,417 |
| Total | 9,950 (100.0%) | $79,630 |
Household Income in Norwich
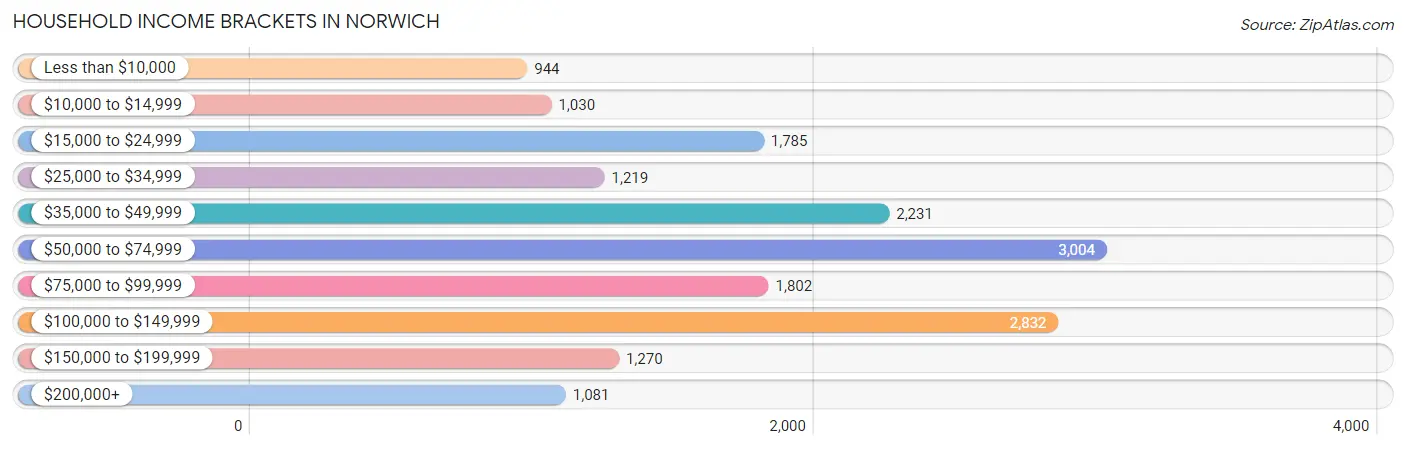
Household Income Brackets in Norwich
With 3,004 households falling in the category, the $50,000 to $74,999 income range is the most frequent in Norwich, accounting for 17.5% of all households. In contrast, only 944 households (5.5%) fall into the less than $10,000 income bracket, making it the least populous group.
| Income Bracket | # Households | % Households |
| Less than $10,000 | 944 | 5.5% |
| $10,000 to $14,999 | 1,030 | 6.0% |
| $15,000 to $24,999 | 1,785 | 10.4% |
| $25,000 to $34,999 | 1,219 | 7.1% |
| $35,000 to $49,999 | 2,231 | 13.0% |
| $50,000 to $74,999 | 3,004 | 17.5% |
| $75,000 to $99,999 | 1,802 | 10.5% |
| $100,000 to $149,999 | 2,832 | 16.5% |
| $150,000 to $199,999 | 1,270 | 7.4% |
| $200,000+ | 1,081 | 6.3% |
Household Income by Householder Age in Norwich
The median household income in Norwich is $62,713, with the highest median household income of $68,480 found in the 25 to 44 years age bracket for the primary householder. A total of 5,491 households (32.0%) fall into this category. Meanwhile, the 15 to 24 years age bracket for the primary householder has the lowest median household income of $38,353, with 683 households (4.0%) in this group.
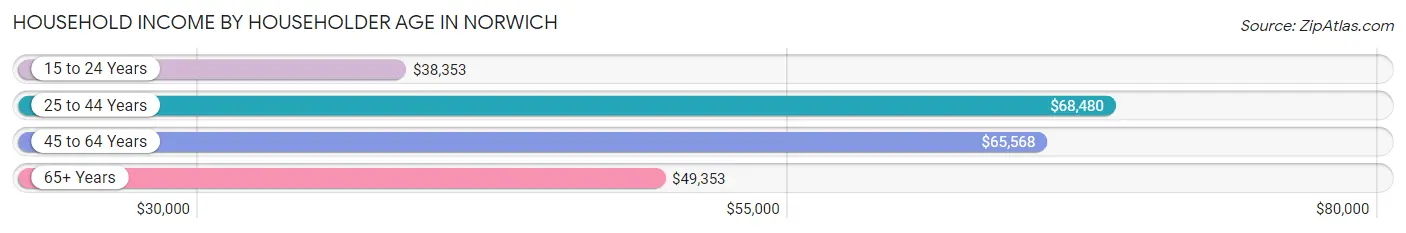
| Income Bracket | # Households | Median Income |
| 15 to 24 Years | 683 (4.0%) | $38,353 |
| 25 to 44 Years | 5,491 (32.0%) | $68,480 |
| 45 to 64 Years | 6,014 (35.0%) | $65,568 |
| 65+ Years | 4,977 (29.0%) | $49,353 |
| Total | 17,165 (100.0%) | $62,713 |
Poverty in Norwich
Income Below Poverty by Sex and Age in Norwich
With 11.5% poverty level for males and 14.6% for females among the residents of Norwich, 15 year old males and 16 and 17 year old females are the most vulnerable to poverty, with 150 males (38.9%) and 177 females (42.1%) in their respective age groups living below the poverty level.
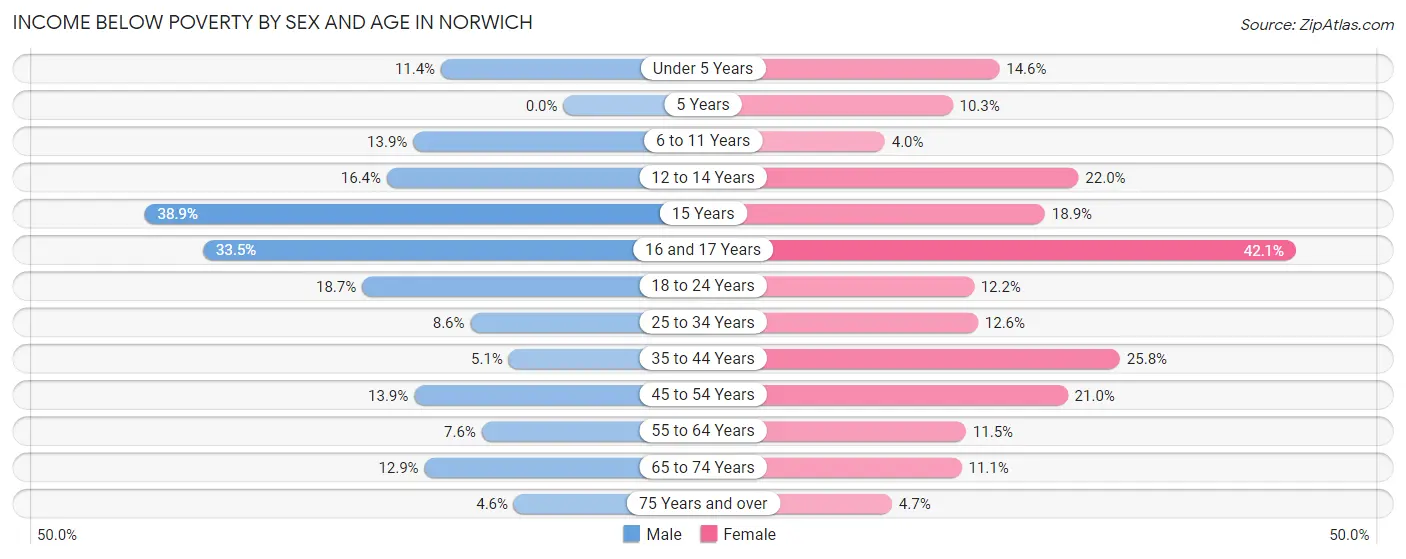
| Age Bracket | Male | Female |
| Under 5 Years | 120 (11.4%) | 133 (14.6%) |
| 5 Years | 0 (0.0%) | 11 (10.3%) |
| 6 to 11 Years | 146 (13.9%) | 54 (4.0%) |
| 12 to 14 Years | 174 (16.4%) | 168 (22.0%) |
| 15 Years | 150 (38.9%) | 36 (18.9%) |
| 16 and 17 Years | 93 (33.5%) | 177 (42.1%) |
| 18 to 24 Years | 314 (18.7%) | 184 (12.2%) |
| 25 to 34 Years | 268 (8.6%) | 380 (12.6%) |
| 35 to 44 Years | 124 (5.1%) | 638 (25.8%) |
| 45 to 54 Years | 316 (13.9%) | 465 (21.0%) |
| 55 to 64 Years | 212 (7.6%) | 316 (11.5%) |
| 65 to 74 Years | 316 (12.9%) | 251 (11.1%) |
| 75 Years and over | 45 (4.6%) | 89 (4.6%) |
| Total | 2,278 (11.5%) | 2,902 (14.6%) |
Income Above Poverty by Sex and Age in Norwich
According to the poverty statistics in Norwich, males aged 5 years and females aged 6 to 11 years are the age groups that are most secure financially, with 100.0% of males and 96.0% of females in these age groups living above the poverty line.
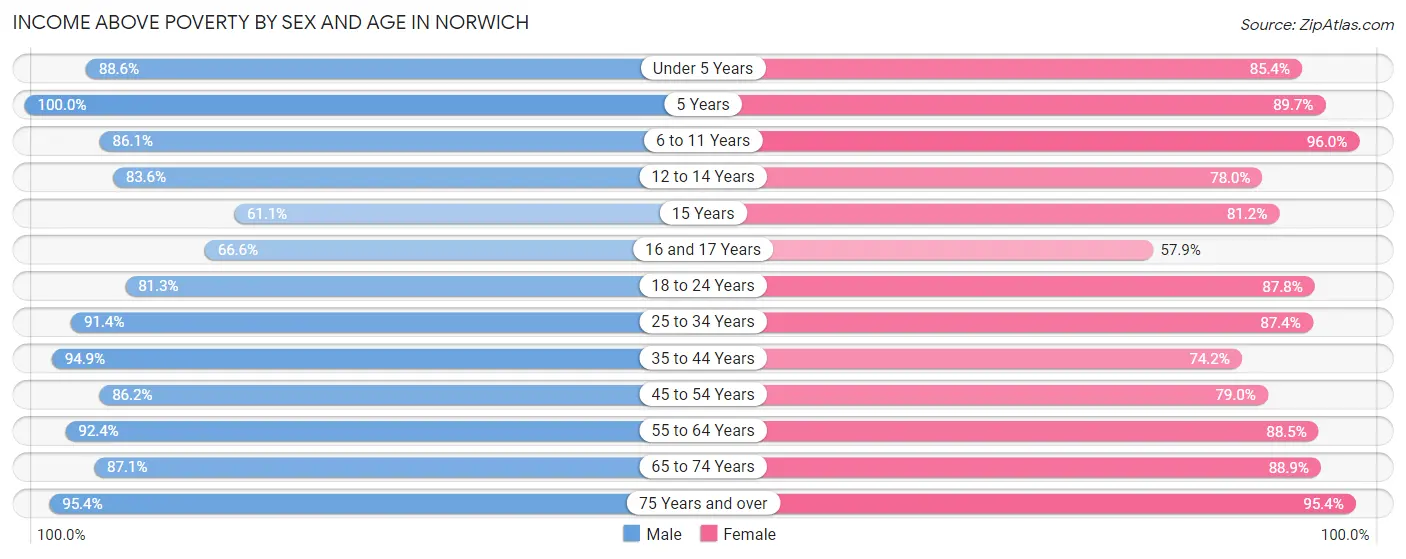
| Age Bracket | Male | Female |
| Under 5 Years | 936 (88.6%) | 777 (85.4%) |
| 5 Years | 212 (100.0%) | 96 (89.7%) |
| 6 to 11 Years | 901 (86.1%) | 1,298 (96.0%) |
| 12 to 14 Years | 888 (83.6%) | 597 (78.0%) |
| 15 Years | 236 (61.1%) | 155 (81.1%) |
| 16 and 17 Years | 185 (66.5%) | 243 (57.9%) |
| 18 to 24 Years | 1,367 (81.3%) | 1,319 (87.8%) |
| 25 to 34 Years | 2,838 (91.4%) | 2,628 (87.4%) |
| 35 to 44 Years | 2,322 (94.9%) | 1,834 (74.2%) |
| 45 to 54 Years | 1,966 (86.2%) | 1,753 (79.0%) |
| 55 to 64 Years | 2,583 (92.4%) | 2,428 (88.5%) |
| 65 to 74 Years | 2,135 (87.1%) | 2,008 (88.9%) |
| 75 Years and over | 935 (95.4%) | 1,826 (95.4%) |
| Total | 17,504 (88.5%) | 16,962 (85.4%) |
Income Below Poverty Among Married-Couple Families in Norwich
The poverty statistics for married-couple families in Norwich show that 2.4% or 141 of the total 5,793 families live below the poverty line. Families with 1 or 2 children have the highest poverty rate of 2.8%, comprising of 46 families. On the other hand, families with 3 or 4 children have the lowest poverty rate of 0.0%, which includes 0 families.
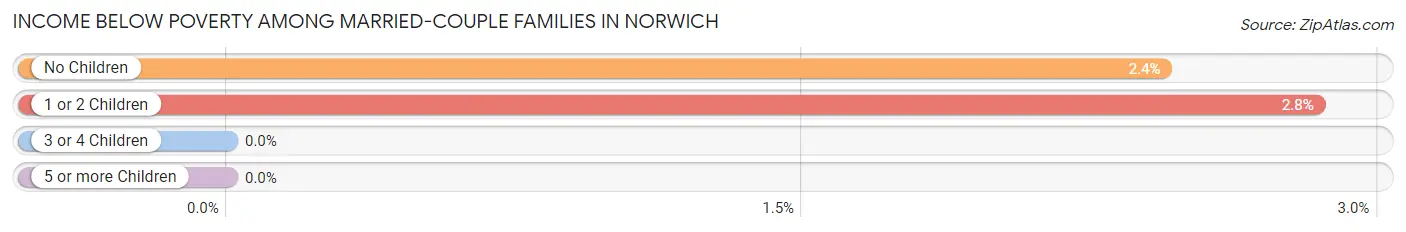
| Children | Above Poverty | Below Poverty |
| No Children | 3,795 (97.6%) | 95 (2.4%) |
| 1 or 2 Children | 1,575 (97.2%) | 46 (2.8%) |
| 3 or 4 Children | 246 (100.0%) | 0 (0.0%) |
| 5 or more Children | 36 (100.0%) | 0 (0.0%) |
| Total | 5,652 (97.6%) | 141 (2.4%) |
Income Below Poverty Among Single-Parent Households in Norwich
According to the poverty data in Norwich, 11.0% or 178 single-father households and 28.7% or 730 single-mother households are living below the poverty line. Among single-father households, those with 1 or 2 children have the highest poverty rate, with 156 households (18.4%) experiencing poverty. Likewise, among single-mother households, those with 3 or 4 children have the highest poverty rate, with 13 households (41.9%) falling below the poverty line.
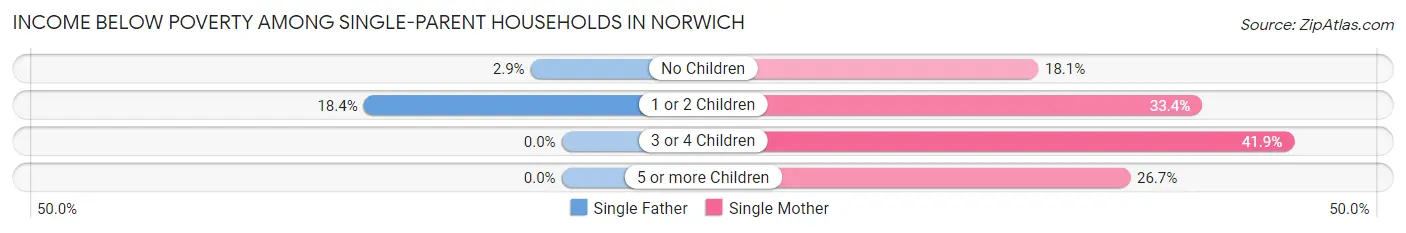
| Children | Single Father | Single Mother |
| No Children | 22 (2.9%) | 139 (18.1%) |
| 1 or 2 Children | 156 (18.4%) | 566 (33.4%) |
| 3 or 4 Children | 0 (0.0%) | 13 (41.9%) |
| 5 or more Children | 0 (0.0%) | 12 (26.7%) |
| Total | 178 (11.0%) | 730 (28.7%) |
Income Below Poverty Among Married-Couple vs Single-Parent Households in Norwich
The poverty data for Norwich shows that 141 of the married-couple family households (2.4%) and 908 of the single-parent households (21.8%) are living below the poverty level. Within the married-couple family households, those with 1 or 2 children have the highest poverty rate, with 46 households (2.8%) falling below the poverty line. Among the single-parent households, those with 3 or 4 children have the highest poverty rate, with 13 household (31.7%) living below poverty.
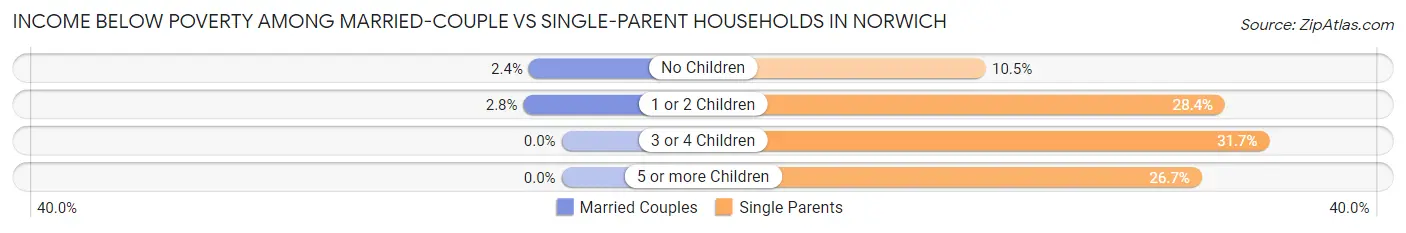
| Children | Married-Couple Families | Single-Parent Households |
| No Children | 95 (2.4%) | 161 (10.5%) |
| 1 or 2 Children | 46 (2.8%) | 722 (28.4%) |
| 3 or 4 Children | 0 (0.0%) | 13 (31.7%) |
| 5 or more Children | 0 (0.0%) | 12 (26.7%) |
| Total | 141 (2.4%) | 908 (21.8%) |
Race in Norwich
The most populous races in Norwich are White / Caucasian (27,373 | 68.3%), Hispanic or Latino (6,021 | 15.0%), and Black / African American (4,324 | 10.8%).
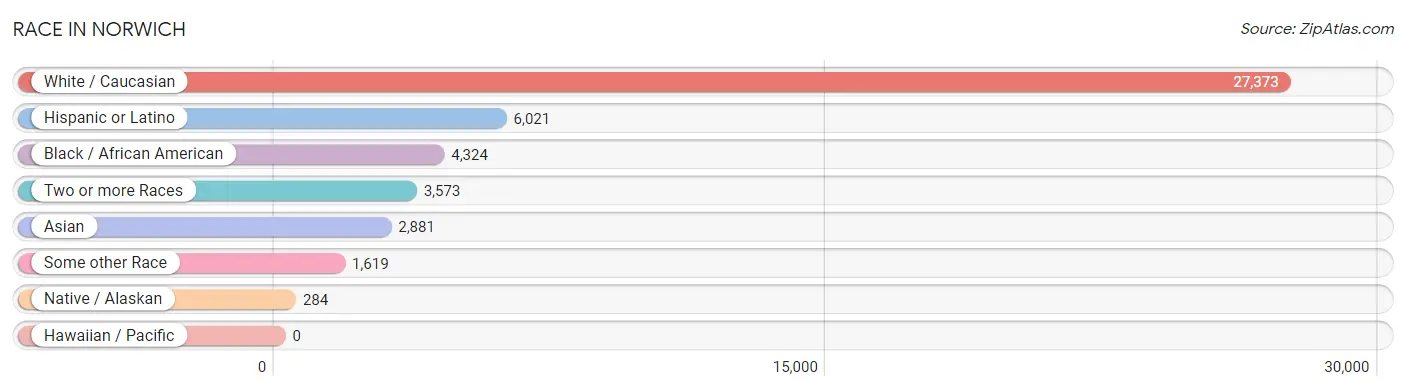
| Race | # Population | % Population |
| Asian | 2,881 | 7.2% |
| Black / African American | 4,324 | 10.8% |
| Hawaiian / Pacific | 0 | 0.0% |
| Hispanic or Latino | 6,021 | 15.0% |
| Native / Alaskan | 284 | 0.7% |
| White / Caucasian | 27,373 | 68.3% |
| Two or more Races | 3,573 | 8.9% |
| Some other Race | 1,619 | 4.0% |
| Total | 40,054 | 100.0% |
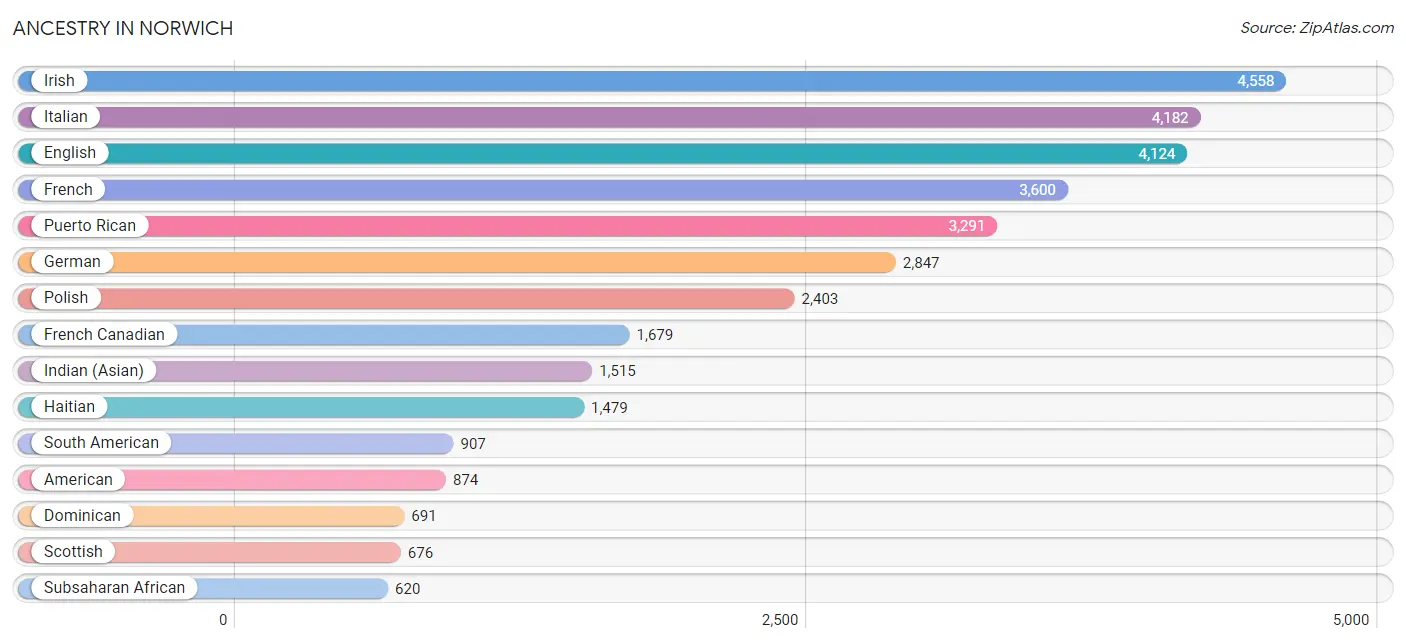
Ancestry in Norwich
The most populous ancestries reported in Norwich are Irish (4,558 | 11.4%), Italian (4,182 | 10.4%), English (4,124 | 10.3%), French (3,600 | 9.0%), and Puerto Rican (3,291 | 8.2%), together accounting for 49.3% of all Norwich residents.
| Ancestry | # Population | % Population |
| African | 381 | 0.9% |
| Albanian | 14 | 0.0% |
| American | 874 | 2.2% |
| Arab | 129 | 0.3% |
| Argentinean | 80 | 0.2% |
| Austrian | 66 | 0.2% |
| Barbadian | 10 | 0.0% |
| Belgian | 63 | 0.2% |
| Bhutanese | 23 | 0.1% |
| Blackfeet | 127 | 0.3% |
| Burmese | 309 | 0.8% |
| Canadian | 220 | 0.5% |
| Cape Verdean | 136 | 0.3% |
| Carpatho Rusyn | 4 | 0.0% |
| Central American | 182 | 0.4% |
| Central American Indian | 523 | 1.3% |
| Cherokee | 28 | 0.1% |
| Chilean | 11 | 0.0% |
| Chippewa | 10 | 0.0% |
| Colombian | 178 | 0.4% |
| Cuban | 119 | 0.3% |
| Czech | 36 | 0.1% |
| Danish | 58 | 0.1% |
| Dominican | 691 | 1.7% |
| Dutch | 237 | 0.6% |
| Eastern European | 260 | 0.6% |
| Ecuadorian | 47 | 0.1% |
| Egyptian | 11 | 0.0% |
| English | 4,124 | 10.3% |
| Ethiopian | 31 | 0.1% |
| European | 179 | 0.4% |
| Filipino | 17 | 0.0% |
| Finnish | 83 | 0.2% |
| French | 3,600 | 9.0% |
| French American Indian | 6 | 0.0% |
| French Canadian | 1,679 | 4.2% |
| German | 2,847 | 7.1% |
| Greek | 165 | 0.4% |
| Guatemalan | 51 | 0.1% |
| Guyanese | 2 | 0.0% |
| Haitian | 1,479 | 3.7% |
| Hungarian | 171 | 0.4% |
| Indian (Asian) | 1,515 | 3.8% |
| Irish | 4,558 | 11.4% |
| Iroquois | 100 | 0.3% |
| Italian | 4,182 | 10.4% |
| Jamaican | 189 | 0.5% |
| Japanese | 38 | 0.1% |
| Korean | 408 | 1.0% |
| Laotian | 17 | 0.0% |
| Lebanese | 79 | 0.2% |
| Lithuanian | 228 | 0.6% |
| Malaysian | 24 | 0.1% |
| Mexican | 562 | 1.4% |
| Mexican American Indian | 27 | 0.1% |
| Moroccan | 15 | 0.0% |
| Nigerian | 8 | 0.0% |
| Norwegian | 124 | 0.3% |
| Pakistani | 32 | 0.1% |
| Palestinian | 17 | 0.0% |
| Panamanian | 93 | 0.2% |
| Pennsylvania German | 70 | 0.2% |
| Peruvian | 560 | 1.4% |
| Polish | 2,403 | 6.0% |
| Portuguese | 138 | 0.3% |
| Puerto Rican | 3,291 | 8.2% |
| Romanian | 72 | 0.2% |
| Russian | 410 | 1.0% |
| Salvadoran | 38 | 0.1% |
| Scandinavian | 10 | 0.0% |
| Scotch-Irish | 362 | 0.9% |
| Scottish | 676 | 1.7% |
| Serbian | 22 | 0.1% |
| Slovak | 3 | 0.0% |
| South American | 907 | 2.3% |
| South American Indian | 13 | 0.0% |
| Sri Lankan | 66 | 0.2% |
| Subsaharan African | 620 | 1.5% |
| Swedish | 517 | 1.3% |
| Swiss | 18 | 0.0% |
| Syrian | 16 | 0.0% |
| Thai | 449 | 1.1% |
| Trinidadian and Tobagonian | 70 | 0.2% |
| U.S. Virgin Islander | 24 | 0.1% |
| Ukrainian | 177 | 0.4% |
| Uruguayan | 30 | 0.1% |
| Welsh | 109 | 0.3% |
| West Indian | 26 | 0.1% |
| Yugoslavian | 68 | 0.2% | View All 89 Rows |
Immigrants in Norwich
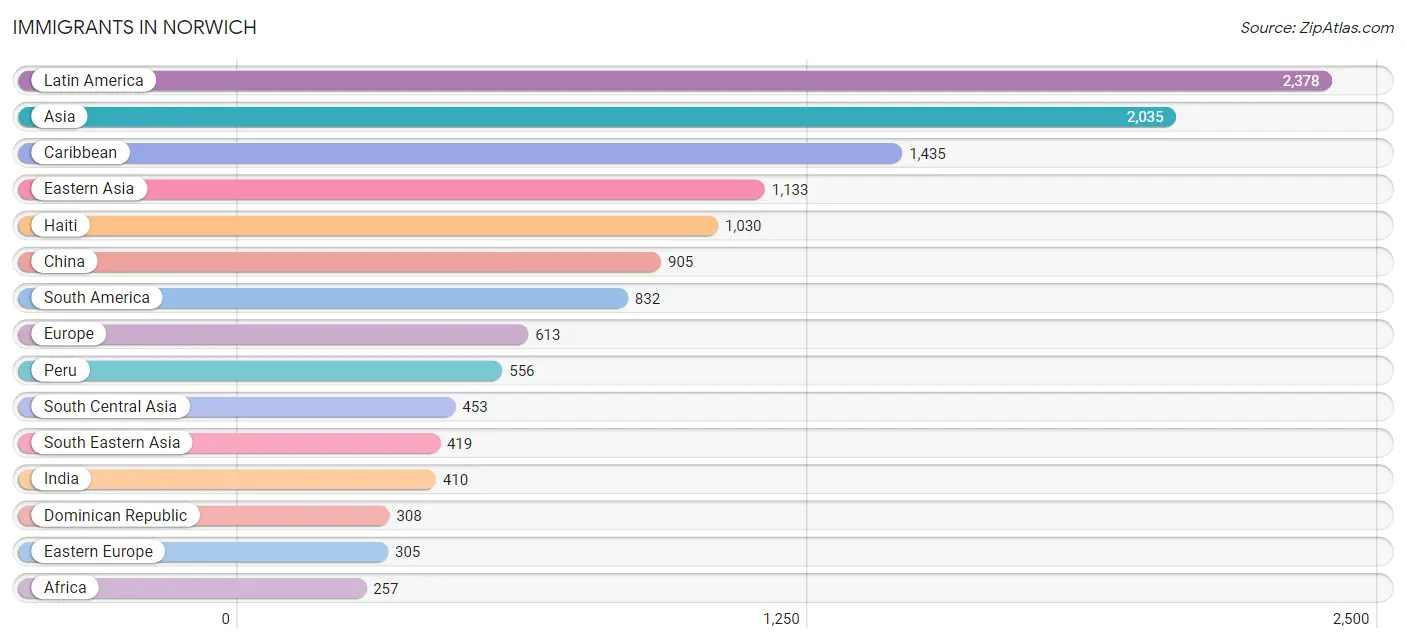
The most numerous immigrant groups reported in Norwich came from Latin America (2,378 | 5.9%), Asia (2,035 | 5.1%), Caribbean (1,435 | 3.6%), Eastern Asia (1,133 | 2.8%), and Haiti (1,030 | 2.6%), together accounting for 20.0% of all Norwich residents.
| Immigration Origin | # Population | % Population |
| Africa | 257 | 0.6% |
| Argentina | 38 | 0.1% |
| Asia | 2,035 | 5.1% |
| Barbados | 10 | 0.0% |
| Belarus | 42 | 0.1% |
| Brazil | 50 | 0.1% |
| Cabo Verde | 109 | 0.3% |
| Cambodia | 22 | 0.1% |
| Canada | 50 | 0.1% |
| Caribbean | 1,435 | 3.6% |
| Central America | 111 | 0.3% |
| China | 905 | 2.3% |
| Colombia | 139 | 0.4% |
| Dominica | 23 | 0.1% |
| Dominican Republic | 308 | 0.8% |
| Eastern Africa | 31 | 0.1% |
| Eastern Asia | 1,133 | 2.8% |
| Eastern Europe | 305 | 0.8% |
| Ecuador | 47 | 0.1% |
| Egypt | 21 | 0.1% |
| El Salvador | 38 | 0.1% |
| England | 55 | 0.1% |
| Ethiopia | 31 | 0.1% |
| Europe | 613 | 1.5% |
| Germany | 124 | 0.3% |
| Greece | 18 | 0.0% |
| Guatemala | 27 | 0.1% |
| Guyana | 2 | 0.0% |
| Haiti | 1,030 | 2.6% |
| Hong Kong | 31 | 0.1% |
| Hungary | 67 | 0.2% |
| India | 410 | 1.0% |
| Indonesia | 17 | 0.0% |
| Ireland | 37 | 0.1% |
| Italy | 23 | 0.1% |
| Jamaica | 17 | 0.0% |
| Korea | 228 | 0.6% |
| Laos | 84 | 0.2% |
| Latin America | 2,378 | 5.9% |
| Lithuania | 113 | 0.3% |
| Malaysia | 11 | 0.0% |
| Mexico | 46 | 0.1% |
| Morocco | 15 | 0.0% |
| Nigeria | 81 | 0.2% |
| Northern Africa | 36 | 0.1% |
| Northern Europe | 136 | 0.3% |
| Oceania | 11 | 0.0% |
| Peru | 556 | 1.4% |
| Philippines | 228 | 0.6% |
| Poland | 52 | 0.1% |
| Russia | 3 | 0.0% |
| Scotland | 8 | 0.0% |
| South America | 832 | 2.1% |
| South Central Asia | 453 | 1.1% |
| South Eastern Asia | 419 | 1.1% |
| Southern Europe | 48 | 0.1% |
| Spain | 7 | 0.0% |
| Sri Lanka | 43 | 0.1% |
| Sweden | 23 | 0.1% |
| Syria | 17 | 0.0% |
| Thailand | 10 | 0.0% |
| Trinidad and Tobago | 47 | 0.1% |
| Ukraine | 28 | 0.1% |
| Vietnam | 47 | 0.1% |
| Western Africa | 190 | 0.5% |
| Western Asia | 30 | 0.1% |
| Western Europe | 124 | 0.3% | View All 67 Rows |
Sex and Age in Norwich
Sex and Age in Norwich
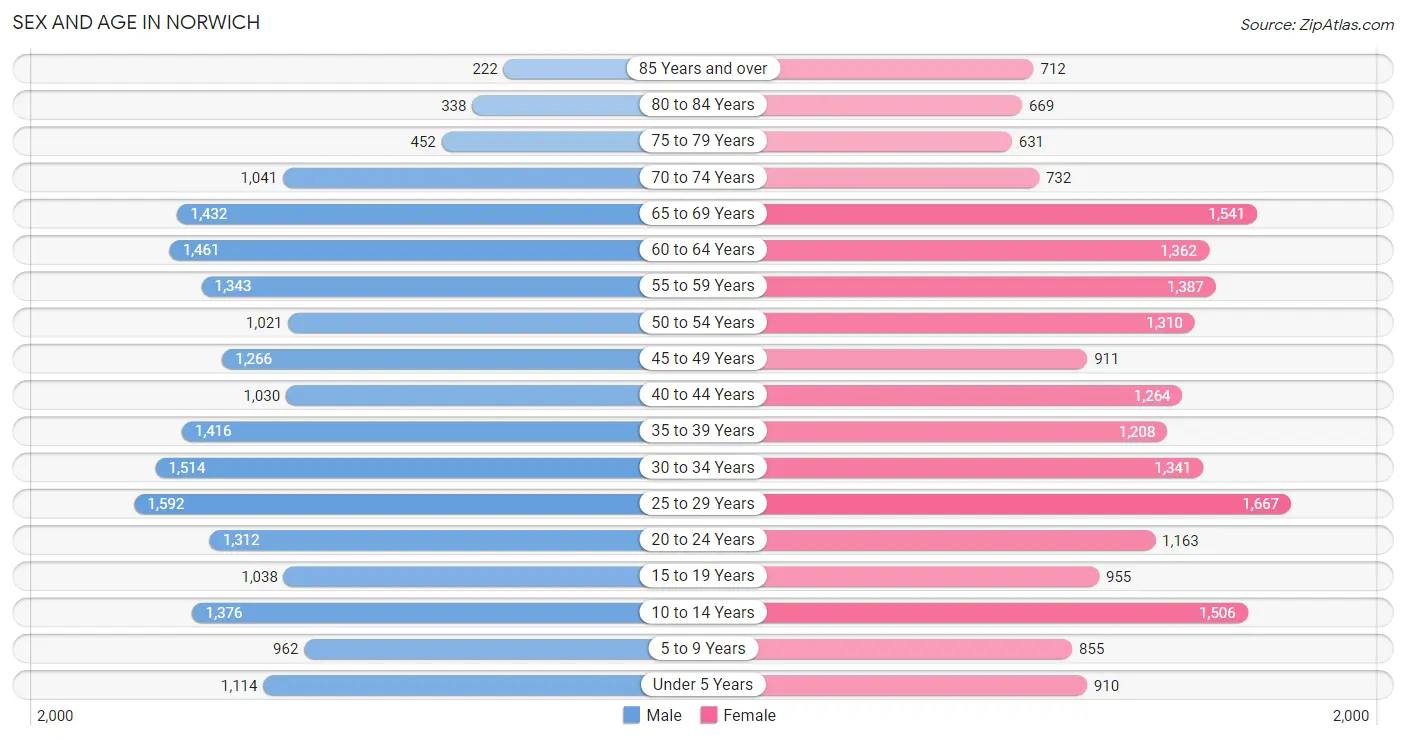
The most populous age groups in Norwich are 25 to 29 Years (1,592 | 8.0%) for men and 25 to 29 Years (1,667 | 8.3%) for women.
| Age Bracket | Male | Female |
| Under 5 Years | 1,114 (5.6%) | 910 (4.5%) |
| 5 to 9 Years | 962 (4.8%) | 855 (4.3%) |
| 10 to 14 Years | 1,376 (6.9%) | 1,506 (7.5%) |
| 15 to 19 Years | 1,038 (5.2%) | 955 (4.8%) |
| 20 to 24 Years | 1,312 (6.6%) | 1,163 (5.8%) |
| 25 to 29 Years | 1,592 (8.0%) | 1,667 (8.3%) |
| 30 to 34 Years | 1,514 (7.6%) | 1,341 (6.7%) |
| 35 to 39 Years | 1,416 (7.1%) | 1,208 (6.0%) |
| 40 to 44 Years | 1,030 (5.2%) | 1,264 (6.3%) |
| 45 to 49 Years | 1,266 (6.4%) | 911 (4.5%) |
| 50 to 54 Years | 1,021 (5.1%) | 1,310 (6.5%) |
| 55 to 59 Years | 1,343 (6.7%) | 1,387 (6.9%) |
| 60 to 64 Years | 1,461 (7.3%) | 1,362 (6.8%) |
| 65 to 69 Years | 1,432 (7.2%) | 1,541 (7.7%) |
| 70 to 74 Years | 1,041 (5.2%) | 732 (3.6%) |
| 75 to 79 Years | 452 (2.3%) | 631 (3.1%) |
| 80 to 84 Years | 338 (1.7%) | 669 (3.3%) |
| 85 Years and over | 222 (1.1%) | 712 (3.5%) |
| Total | 19,930 (100.0%) | 20,124 (100.0%) |
Families and Households in Norwich
Median Family Size in Norwich
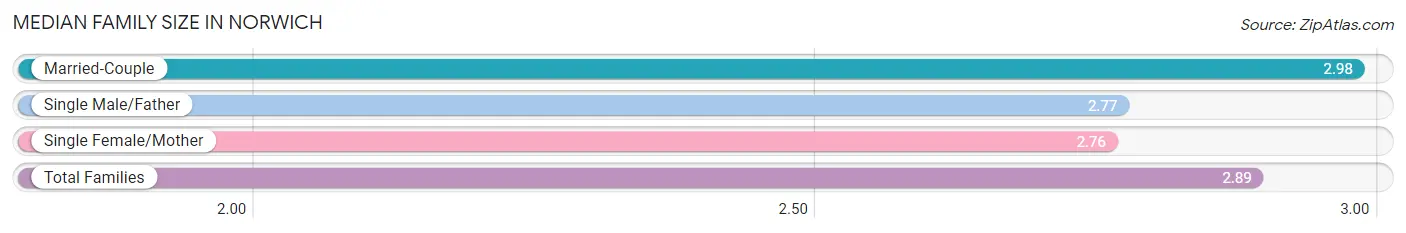
The median family size in Norwich is 2.89 persons per family, with married-couple families (5,793 | 58.2%) accounting for the largest median family size of 2.98 persons per family. On the other hand, single female/mother families (2,540 | 25.5%) represent the smallest median family size with 2.76 persons per family.
| Family Type | # Families | Family Size |
| Married-Couple | 5,793 (58.2%) | 2.98 |
| Single Male/Father | 1,617 (16.3%) | 2.77 |
| Single Female/Mother | 2,540 (25.5%) | 2.76 |
| Total Families | 9,950 (100.0%) | 2.89 |
Median Household Size in Norwich
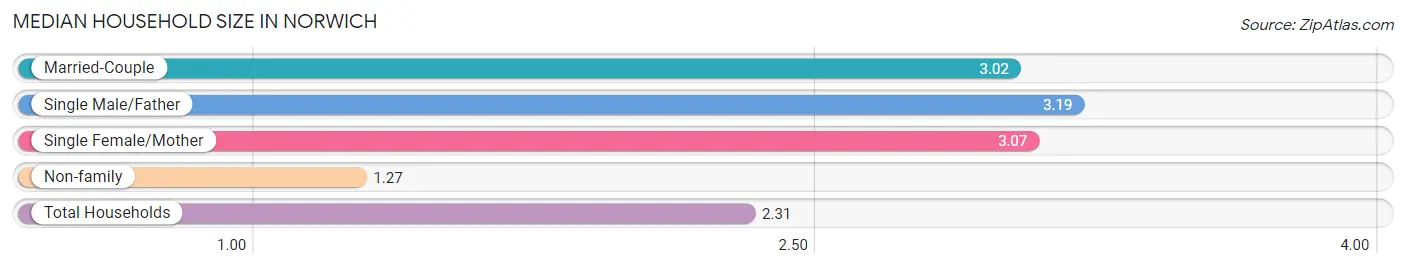
The median household size in Norwich is 2.31 persons per household, with single male/father households (1,617 | 9.4%) accounting for the largest median household size of 3.19 persons per household. non-family households (7,215 | 42.0%) represent the smallest median household size with 1.27 persons per household.
| Household Type | # Households | Household Size |
| Married-Couple | 5,793 (33.8%) | 3.02 |
| Single Male/Father | 1,617 (9.4%) | 3.19 |
| Single Female/Mother | 2,540 (14.8%) | 3.07 |
| Non-family | 7,215 (42.0%) | 1.27 |
| Total Households | 17,165 (100.0%) | 2.31 |
Household Size by Marriage Status in Norwich
Out of a total of 17,165 households in Norwich, 9,950 (58.0%) are family households, while 7,215 (42.0%) are nonfamily households. The most numerous type of family households are 2-person households, comprising 4,683, and the most common type of nonfamily households are 1-person households, comprising 5,895.
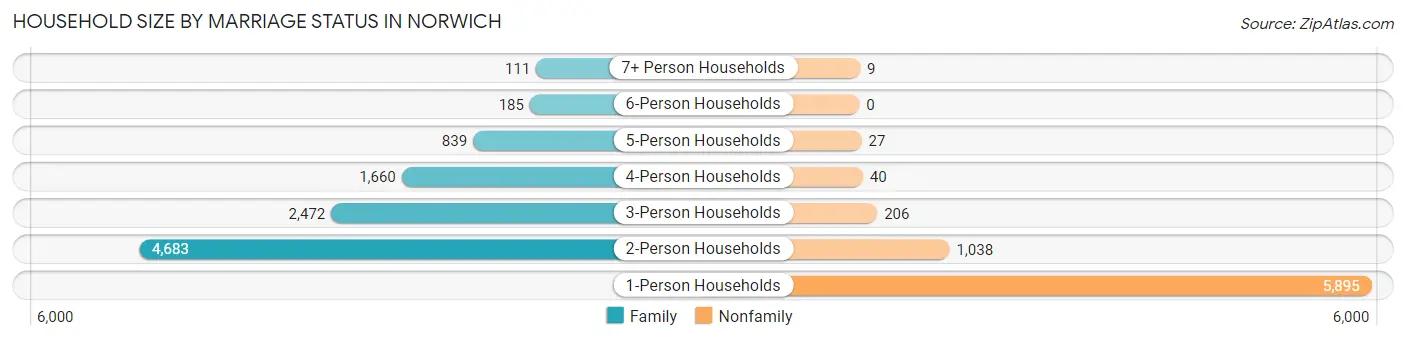
| Household Size | Family Households | Nonfamily Households |
| 1-Person Households | - | 5,895 (34.3%) |
| 2-Person Households | 4,683 (27.3%) | 1,038 (6.0%) |
| 3-Person Households | 2,472 (14.4%) | 206 (1.2%) |
| 4-Person Households | 1,660 (9.7%) | 40 (0.2%) |
| 5-Person Households | 839 (4.9%) | 27 (0.2%) |
| 6-Person Households | 185 (1.1%) | 0 (0.0%) |
| 7+ Person Households | 111 (0.6%) | 9 (0.1%) |
| Total | 9,950 (58.0%) | 7,215 (42.0%) |
Female Fertility in Norwich
Fertility by Age in Norwich
Average fertility rate in Norwich is 43.0 births per 1,000 women. Women in the age bracket of 20 to 34 years have the highest fertility rate with 74.0 births per 1,000 women. Women in the age bracket of 20 to 34 years acount for 83.5% of all women with births.
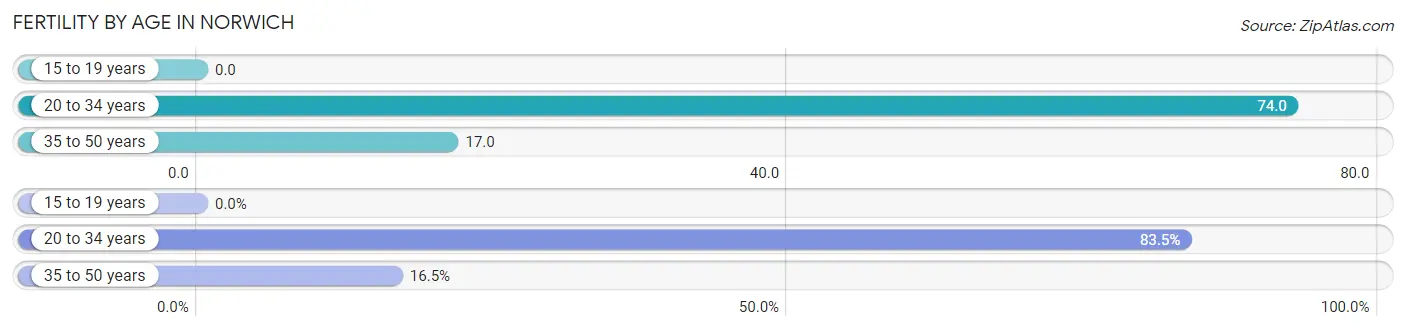
| Age Bracket | Women with Births | Births / 1,000 Women |
| 15 to 19 years | 0 (0.0%) | 0.0 |
| 20 to 34 years | 308 (83.5%) | 74.0 |
| 35 to 50 years | 61 (16.5%) | 17.0 |
| Total | 369 (100.0%) | 43.0 |
Fertility by Age by Marriage Status in Norwich
81.8% of women with births (369) in Norwich are married. The highest percentage of unmarried women with births falls into 20 to 34 years age bracket with 18.8% of them unmarried at the time of birth, while the lowest percentage of unmarried women with births belong to 35 to 50 years age bracket with 14.7% of them unmarried.
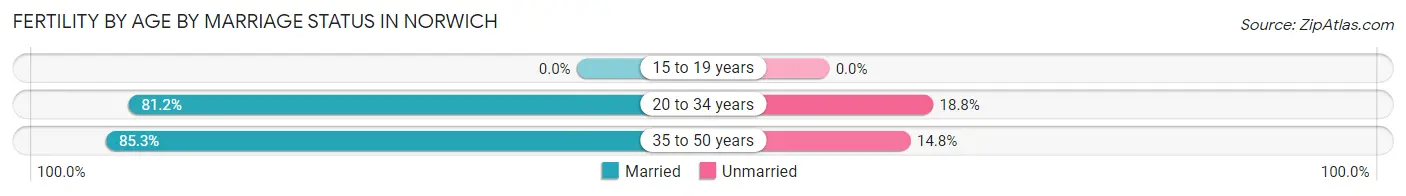
| Age Bracket | Married | Unmarried |
| 15 to 19 years | 0 (0.0%) | 0 (0.0%) |
| 20 to 34 years | 250 (81.2%) | 58 (18.8%) |
| 35 to 50 years | 52 (85.3%) | 9 (14.7%) |
| Total | 302 (81.8%) | 67 (18.2%) |
Fertility by Education in Norwich
Average fertility rate in Norwich is 43.0 births per 1,000 women. Women with the education attainment of high school diploma have the highest fertility rate of 70.0 births per 1,000 women, while women with the education attainment of college or associate's degree have the lowest fertility at 30.0 births per 1,000 women. Women with the education attainment of high school diploma represent 42.3% of all women with births.
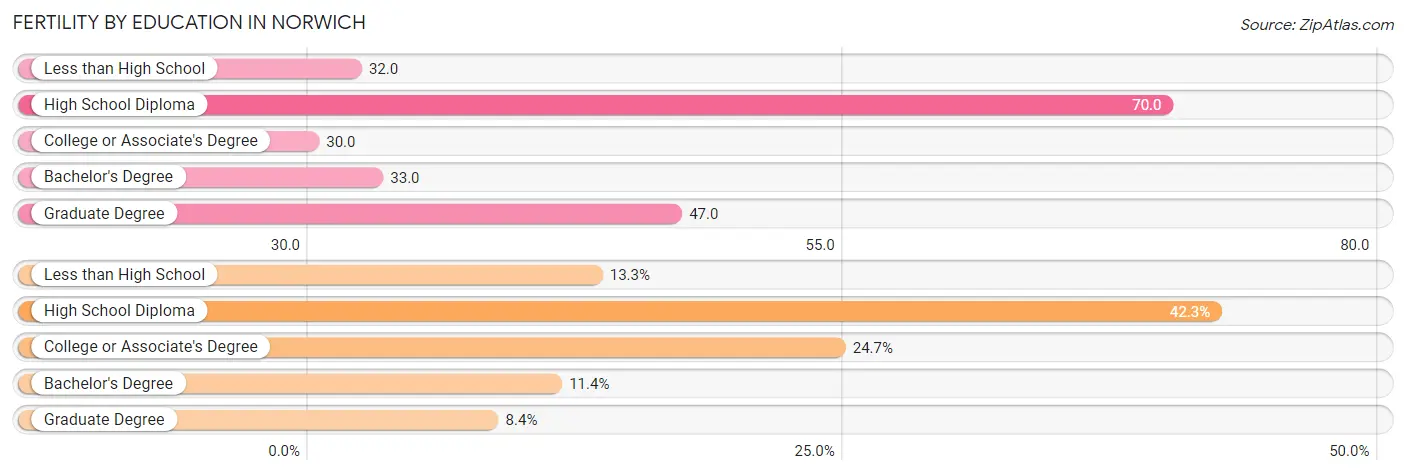
| Educational Attainment | Women with Births | Births / 1,000 Women |
| Less than High School | 49 (13.3%) | 32.0 |
| High School Diploma | 156 (42.3%) | 70.0 |
| College or Associate's Degree | 91 (24.7%) | 30.0 |
| Bachelor's Degree | 42 (11.4%) | 33.0 |
| Graduate Degree | 31 (8.4%) | 47.0 |
| Total | 369 (100.0%) | 43.0 |
Fertility by Education by Marriage Status in Norwich
18.2% of women with births in Norwich are unmarried. Women with the educational attainment of high school diploma are most likely to be married with 100.0% of them married at childbirth, while women with the educational attainment of less than high school are least likely to be married with 100.0% of them unmarried at childbirth.
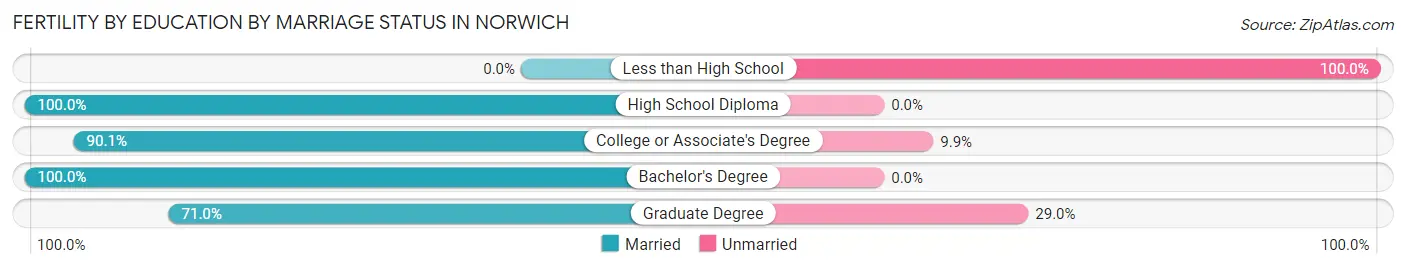
| Educational Attainment | Married | Unmarried |
| Less than High School | 0 (0.0%) | 49 (100.0%) |
| High School Diploma | 156 (100.0%) | 0 (0.0%) |
| College or Associate's Degree | 82 (90.1%) | 9 (9.9%) |
| Bachelor's Degree | 42 (100.0%) | 0 (0.0%) |
| Graduate Degree | 22 (71.0%) | 9 (29.0%) |
| Total | 302 (81.8%) | 67 (18.2%) |
Employment Characteristics in Norwich
Employment by Class of Employer in Norwich
Among the 18,642 employed individuals in Norwich, private company employees (13,202 | 70.8%), local government employees (1,639 | 8.8%), and not-for-profit organizations (1,489 | 8.0%) make up the most common classes of employment.
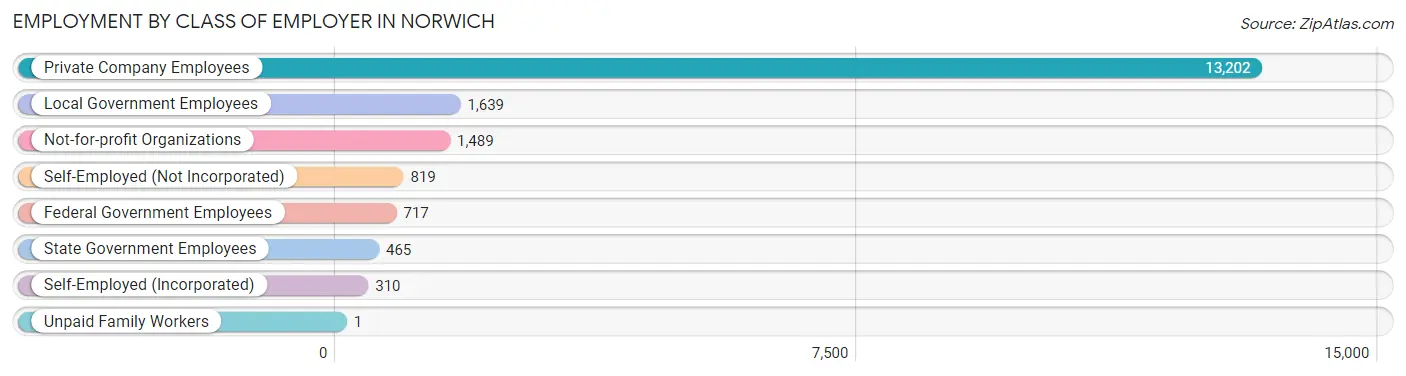
| Employer Class | # Employees | % Employees |
| Private Company Employees | 13,202 | 70.8% |
| Self-Employed (Incorporated) | 310 | 1.7% |
| Self-Employed (Not Incorporated) | 819 | 4.4% |
| Not-for-profit Organizations | 1,489 | 8.0% |
| Local Government Employees | 1,639 | 8.8% |
| State Government Employees | 465 | 2.5% |
| Federal Government Employees | 717 | 3.8% |
| Unpaid Family Workers | 1 | 0.0% |
| Total | 18,642 | 100.0% |
Employment Status by Age in Norwich
According to the labor force statistics for Norwich, out of the total population over 16 years of age (32,754), 63.8% or 20,897 individuals are in the labor force, with 7.0% or 1,463 of them unemployed. The age group with the highest labor force participation rate is 35 to 44 years, with 88.0% or 4,328 individuals in the labor force. Within the labor force, the 20 to 24 years age range has the highest percentage of unemployed individuals, with 11.6% or 241 of them being unemployed.
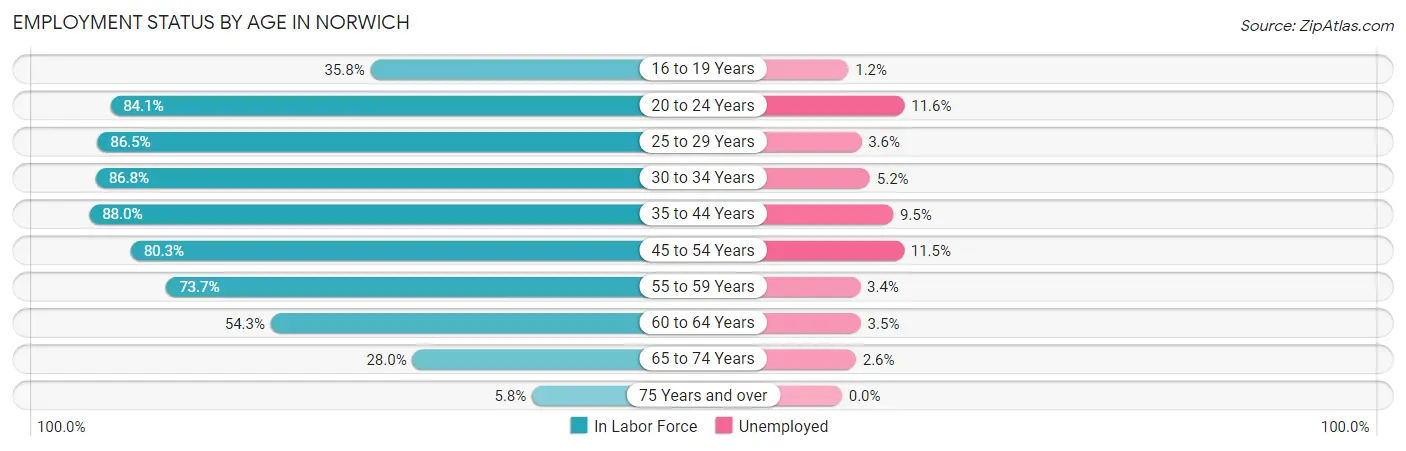
| Age Bracket | In Labor Force | Unemployed |
| 16 to 19 Years | 507 (35.8%) | 6 (1.2%) |
| 20 to 24 Years | 2,081 (84.1%) | 241 (11.6%) |
| 25 to 29 Years | 2,819 (86.5%) | 101 (3.6%) |
| 30 to 34 Years | 2,478 (86.8%) | 129 (5.2%) |
| 35 to 44 Years | 4,328 (88.0%) | 411 (9.5%) |
| 45 to 54 Years | 3,620 (80.3%) | 416 (11.5%) |
| 55 to 59 Years | 2,012 (73.7%) | 68 (3.4%) |
| 60 to 64 Years | 1,533 (54.3%) | 54 (3.5%) |
| 65 to 74 Years | 1,329 (28.0%) | 35 (2.6%) |
| 75 Years and over | 175 (5.8%) | 0 (0.0%) |
| Total | 20,897 (63.8%) | 1,463 (7.0%) |
Employment Status by Educational Attainment in Norwich
According to labor force statistics for Norwich, 79.6% of individuals (16,790) out of the total population between 25 and 64 years of age (21,093) are in the labor force, with 7.1% or 1,192 of them being unemployed. The group with the highest labor force participation rate are those with the educational attainment of bachelor's degree or higher, with 83.8% or 4,123 individuals in the labor force. Within the labor force, individuals with less than high school education have the highest percentage of unemployment, with 18.3% or 311 of them being unemployed.
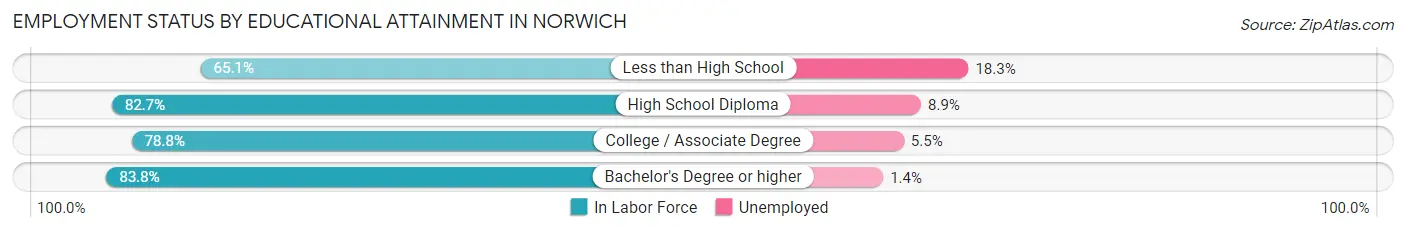
| Educational Attainment | In Labor Force | Unemployed |
| Less than High School | 1,702 (65.1%) | 478 (18.3%) |
| High School Diploma | 6,044 (82.7%) | 650 (8.9%) |
| College / Associate Degree | 4,926 (78.8%) | 344 (5.5%) |
| Bachelor's Degree or higher | 4,123 (83.8%) | 69 (1.4%) |
| Total | 16,790 (79.6%) | 1,498 (7.1%) |
Employment Occupations by Sex in Norwich
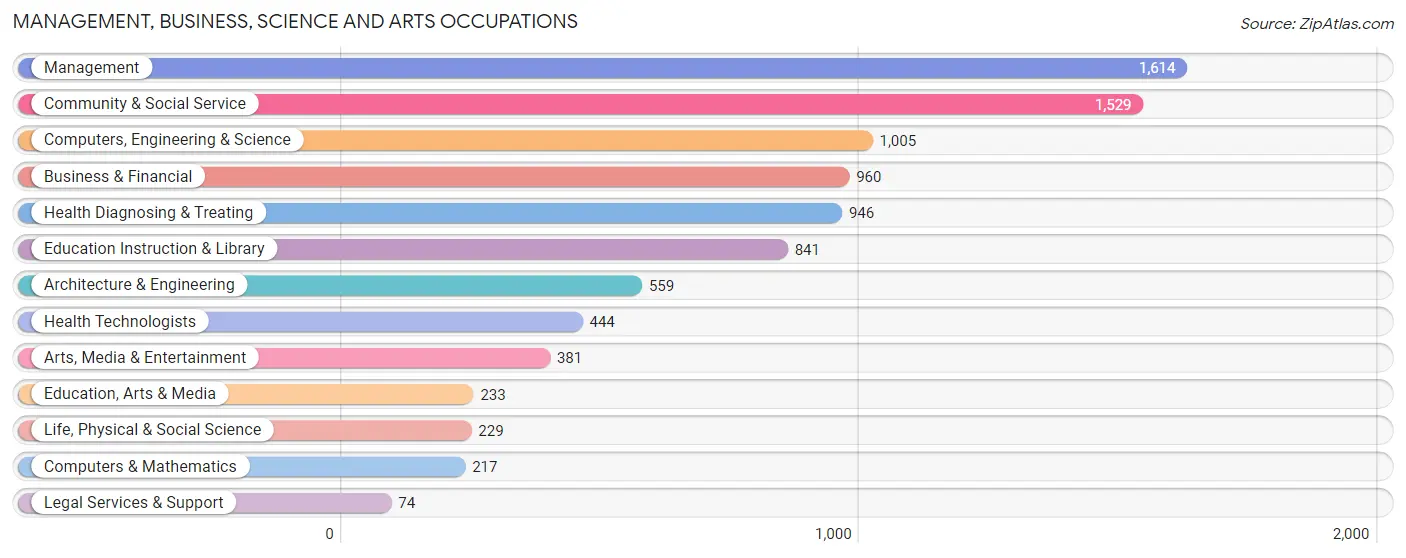
Management, Business, Science and Arts Occupations
The most common Management, Business, Science and Arts occupations in Norwich are Management (1,614 | 8.4%), Community & Social Service (1,529 | 8.0%), Computers, Engineering & Science (1,005 | 5.2%), Business & Financial (960 | 5.0%), and Health Diagnosing & Treating (946 | 4.9%).
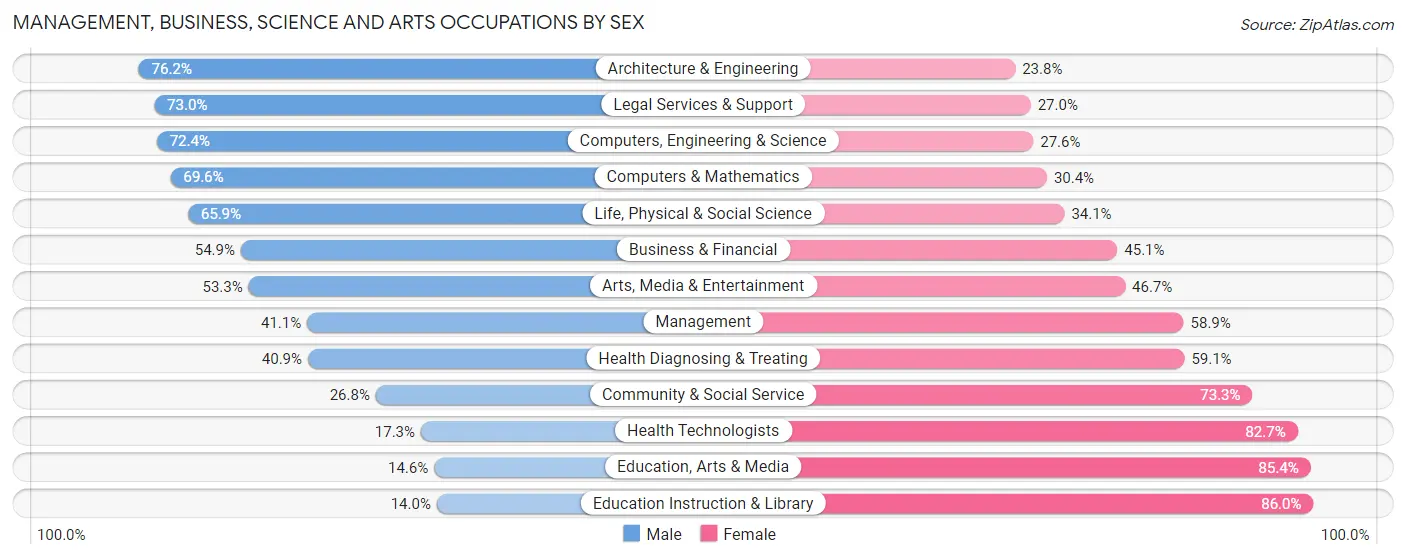
Management, Business, Science and Arts Occupations by Sex
Within the Management, Business, Science and Arts occupations in Norwich, the most male-oriented occupations are Architecture & Engineering (76.2%), Legal Services & Support (73.0%), and Computers, Engineering & Science (72.4%), while the most female-oriented occupations are Education Instruction & Library (86.0%), Education, Arts & Media (85.4%), and Health Technologists (82.7%).
| Occupation | Male | Female |
| Management | 663 (41.1%) | 951 (58.9%) |
| Business & Financial | 527 (54.9%) | 433 (45.1%) |
| Computers, Engineering & Science | 728 (72.4%) | 277 (27.6%) |
| Computers & Mathematics | 151 (69.6%) | 66 (30.4%) |
| Architecture & Engineering | 426 (76.2%) | 133 (23.8%) |
| Life, Physical & Social Science | 151 (65.9%) | 78 (34.1%) |
| Community & Social Service | 409 (26.8%) | 1,120 (73.3%) |
| Education, Arts & Media | 34 (14.6%) | 199 (85.4%) |
| Legal Services & Support | 54 (73.0%) | 20 (27.0%) |
| Education Instruction & Library | 118 (14.0%) | 723 (86.0%) |
| Arts, Media & Entertainment | 203 (53.3%) | 178 (46.7%) |
| Health Diagnosing & Treating | 387 (40.9%) | 559 (59.1%) |
| Health Technologists | 77 (17.3%) | 367 (82.7%) |
| Total (Category) | 2,714 (44.8%) | 3,340 (55.2%) |
| Total (Overall) | 9,918 (51.8%) | 9,222 (48.2%) |
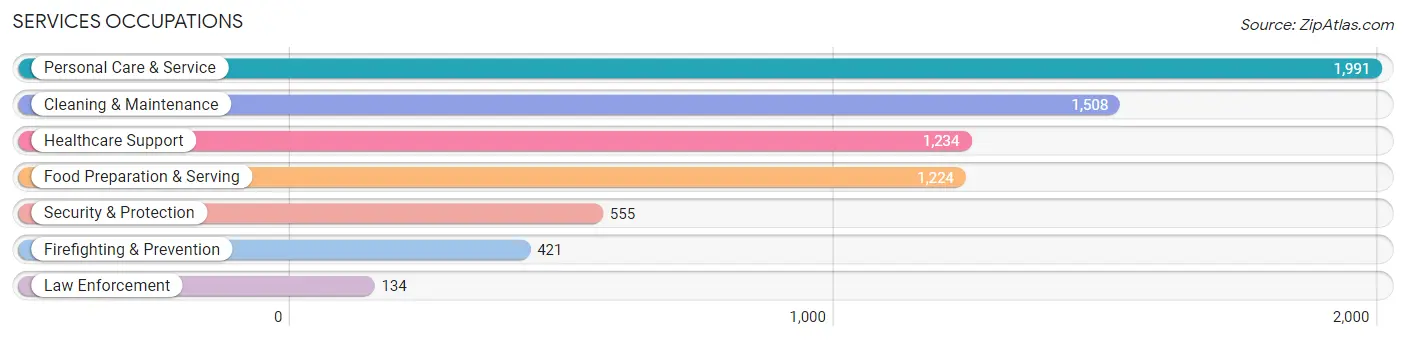
Services Occupations
The most common Services occupations in Norwich are Personal Care & Service (1,991 | 10.4%), Cleaning & Maintenance (1,508 | 7.9%), Healthcare Support (1,234 | 6.5%), Food Preparation & Serving (1,224 | 6.4%), and Security & Protection (555 | 2.9%).
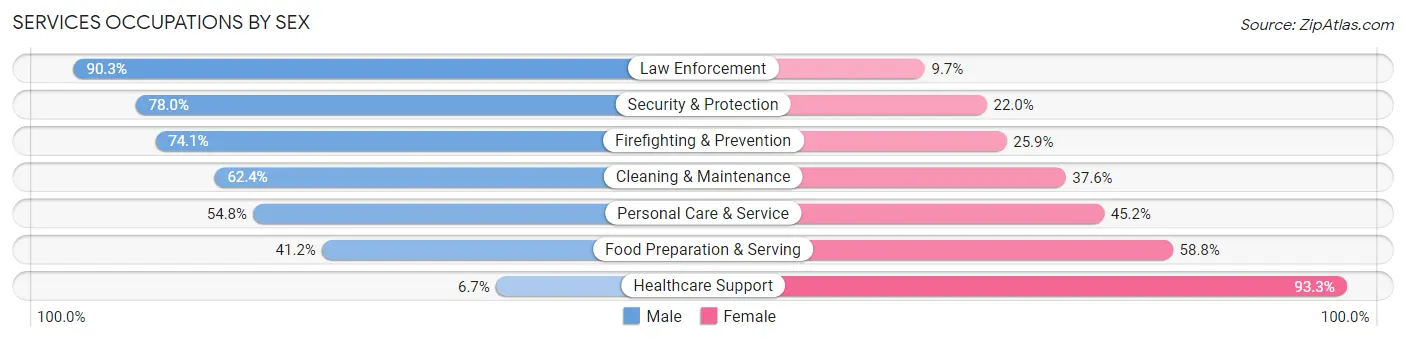
Services Occupations by Sex
Within the Services occupations in Norwich, the most male-oriented occupations are Law Enforcement (90.3%), Security & Protection (78.0%), and Firefighting & Prevention (74.1%), while the most female-oriented occupations are Healthcare Support (93.3%), Food Preparation & Serving (58.8%), and Personal Care & Service (45.2%).
| Occupation | Male | Female |
| Healthcare Support | 83 (6.7%) | 1,151 (93.3%) |
| Security & Protection | 433 (78.0%) | 122 (22.0%) |
| Firefighting & Prevention | 312 (74.1%) | 109 (25.9%) |
| Law Enforcement | 121 (90.3%) | 13 (9.7%) |
| Food Preparation & Serving | 504 (41.2%) | 720 (58.8%) |
| Cleaning & Maintenance | 941 (62.4%) | 567 (37.6%) |
| Personal Care & Service | 1,091 (54.8%) | 900 (45.2%) |
| Total (Category) | 3,052 (46.9%) | 3,460 (53.1%) |
| Total (Overall) | 9,918 (51.8%) | 9,222 (48.2%) |
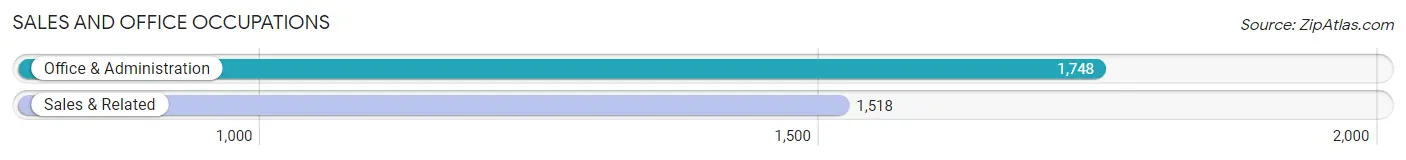
Sales and Office Occupations
The most common Sales and Office occupations in Norwich are Office & Administration (1,748 | 9.1%), and Sales & Related (1,518 | 7.9%).
Sales and Office Occupations by Sex
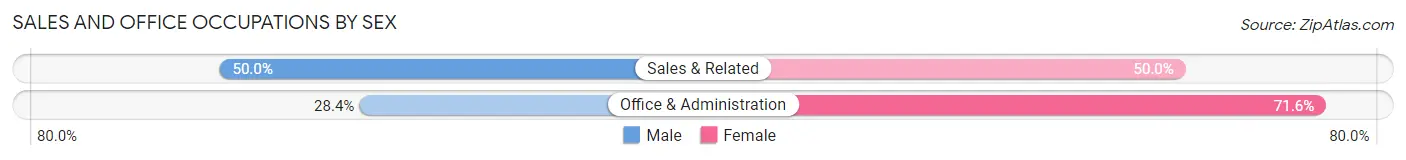
| Occupation | Male | Female |
| Sales & Related | 759 (50.0%) | 759 (50.0%) |
| Office & Administration | 496 (28.4%) | 1,252 (71.6%) |
| Total (Category) | 1,255 (38.4%) | 2,011 (61.6%) |
| Total (Overall) | 9,918 (51.8%) | 9,222 (48.2%) |
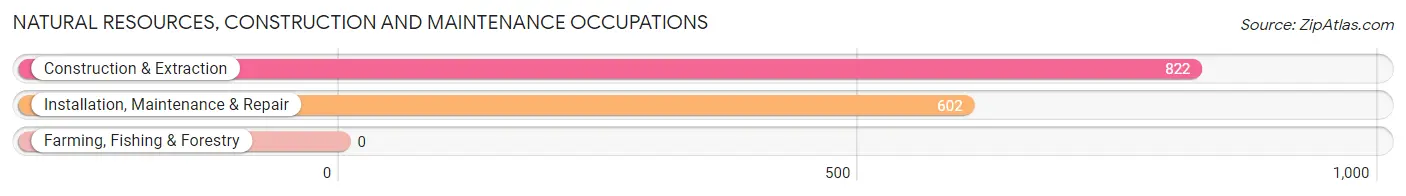
Natural Resources, Construction and Maintenance Occupations
The most common Natural Resources, Construction and Maintenance occupations in Norwich are Construction & Extraction (822 | 4.3%), and Installation, Maintenance & Repair (602 | 3.2%).
Natural Resources, Construction and Maintenance Occupations by Sex
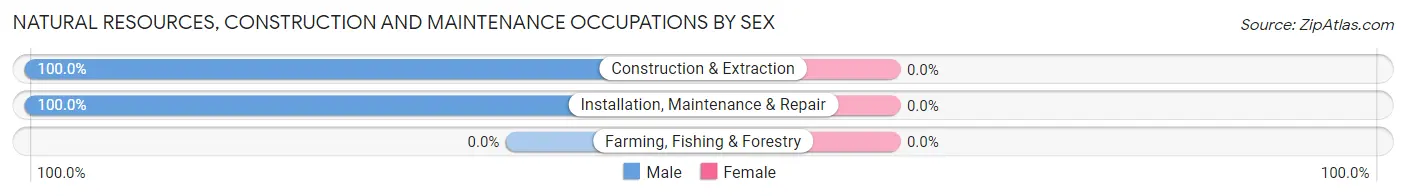
| Occupation | Male | Female |
| Farming, Fishing & Forestry | 0 (0.0%) | 0 (0.0%) |
| Construction & Extraction | 822 (100.0%) | 0 (0.0%) |
| Installation, Maintenance & Repair | 602 (100.0%) | 0 (0.0%) |
| Total (Category) | 1,424 (100.0%) | 0 (0.0%) |
| Total (Overall) | 9,918 (51.8%) | 9,222 (48.2%) |
Production, Transportation and Moving Occupations
The most common Production, Transportation and Moving occupations in Norwich are Production (747 | 3.9%), Material Moving (575 | 3.0%), and Transportation (562 | 2.9%).
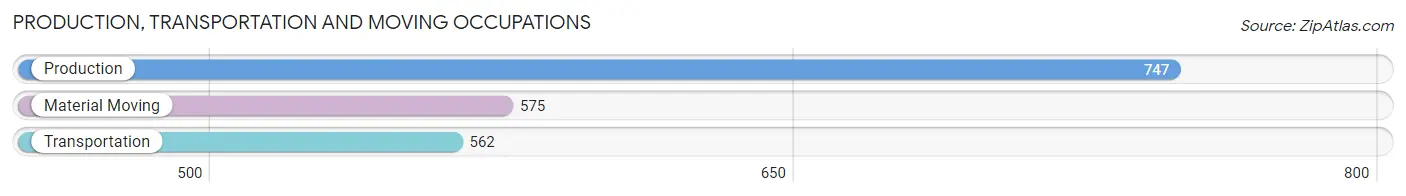
Production, Transportation and Moving Occupations by Sex
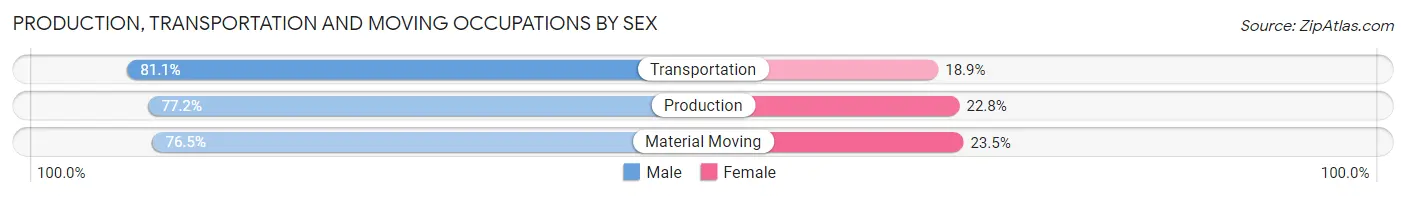
| Occupation | Male | Female |
| Production | 577 (77.2%) | 170 (22.8%) |
| Transportation | 456 (81.1%) | 106 (18.9%) |
| Material Moving | 440 (76.5%) | 135 (23.5%) |
| Total (Category) | 1,473 (78.2%) | 411 (21.8%) |
| Total (Overall) | 9,918 (51.8%) | 9,222 (48.2%) |
Employment Industries by Sex in Norwich
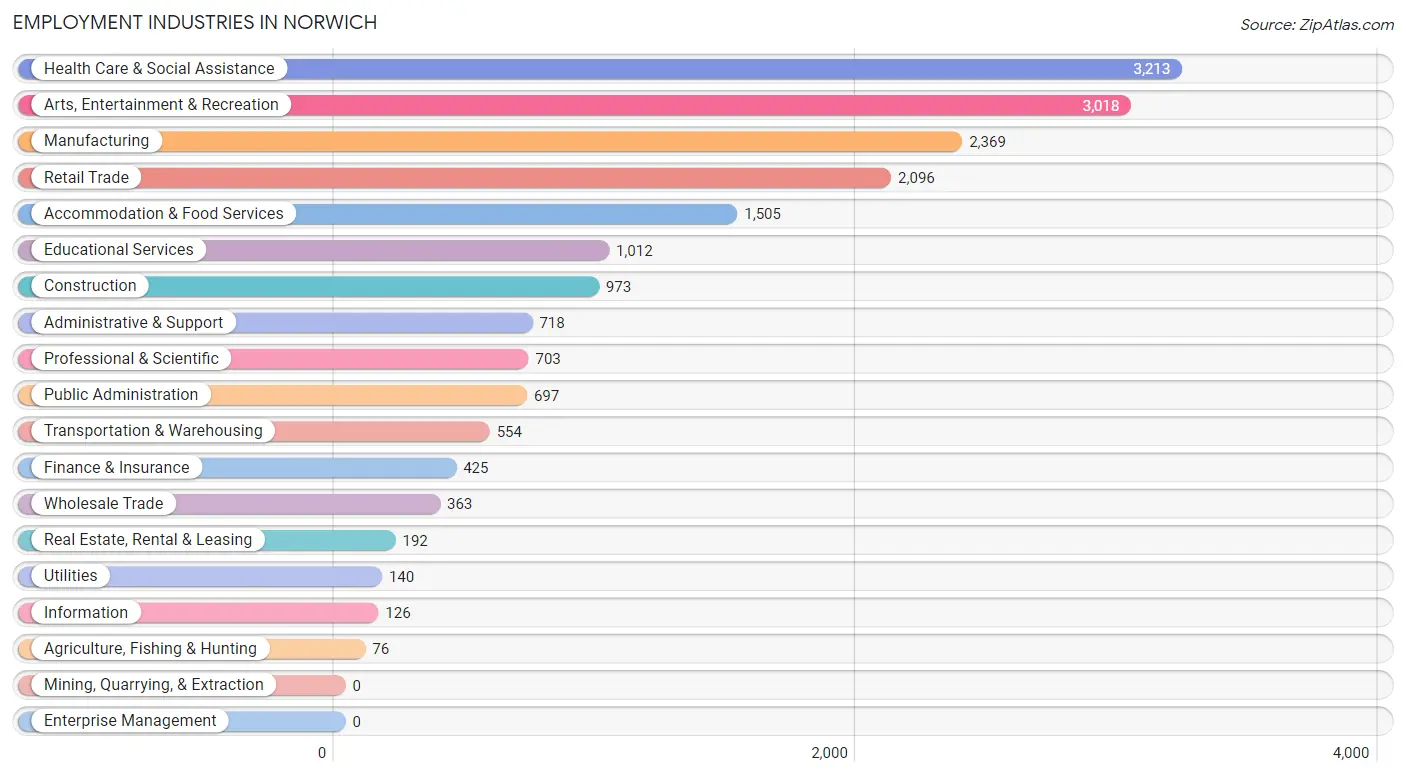
Employment Industries in Norwich
The major employment industries in Norwich include Health Care & Social Assistance (3,213 | 16.8%), Arts, Entertainment & Recreation (3,018 | 15.8%), Manufacturing (2,369 | 12.4%), Retail Trade (2,096 | 11.0%), and Accommodation & Food Services (1,505 | 7.9%).
Employment Industries by Sex in Norwich
The Norwich industries that see more men than women are Utilities (100.0%), Construction (93.5%), and Administrative & Support (78.5%), whereas the industries that tend to have a higher number of women are Health Care & Social Assistance (78.4%), Educational Services (77.6%), and Information (67.5%).
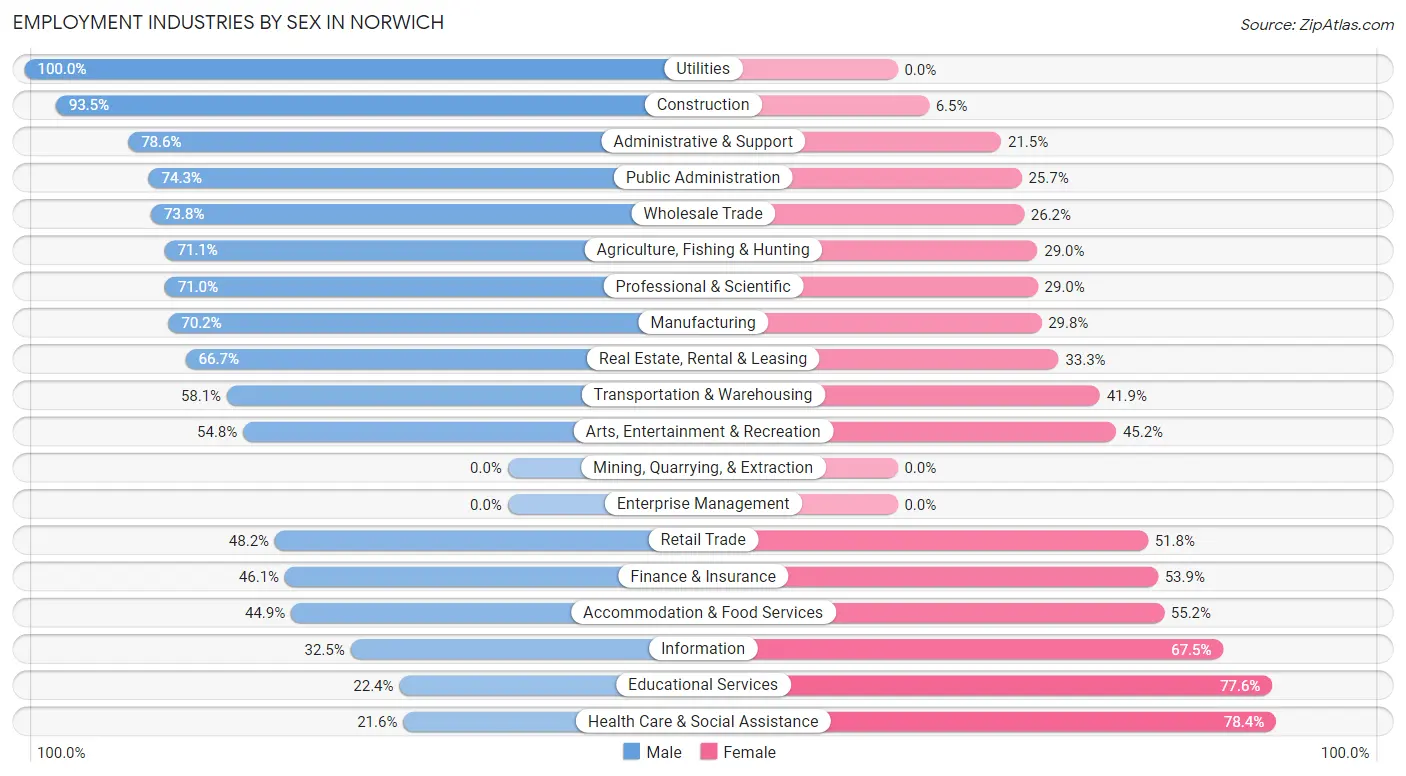
| Industry | Male | Female |
| Agriculture, Fishing & Hunting | 54 (71.1%) | 22 (28.9%) |
| Mining, Quarrying, & Extraction | 0 (0.0%) | 0 (0.0%) |
| Construction | 910 (93.5%) | 63 (6.5%) |
| Manufacturing | 1,664 (70.2%) | 705 (29.8%) |
| Wholesale Trade | 268 (73.8%) | 95 (26.2%) |
| Retail Trade | 1,010 (48.2%) | 1,086 (51.8%) |
| Transportation & Warehousing | 322 (58.1%) | 232 (41.9%) |
| Utilities | 140 (100.0%) | 0 (0.0%) |
| Information | 41 (32.5%) | 85 (67.5%) |
| Finance & Insurance | 196 (46.1%) | 229 (53.9%) |
| Real Estate, Rental & Leasing | 128 (66.7%) | 64 (33.3%) |
| Professional & Scientific | 499 (71.0%) | 204 (29.0%) |
| Enterprise Management | 0 (0.0%) | 0 (0.0%) |
| Administrative & Support | 564 (78.5%) | 154 (21.4%) |
| Educational Services | 227 (22.4%) | 785 (77.6%) |
| Health Care & Social Assistance | 695 (21.6%) | 2,518 (78.4%) |
| Arts, Entertainment & Recreation | 1,653 (54.8%) | 1,365 (45.2%) |
| Accommodation & Food Services | 675 (44.9%) | 830 (55.1%) |
| Public Administration | 518 (74.3%) | 179 (25.7%) |
| Total | 9,918 (51.8%) | 9,222 (48.2%) |
Education in Norwich
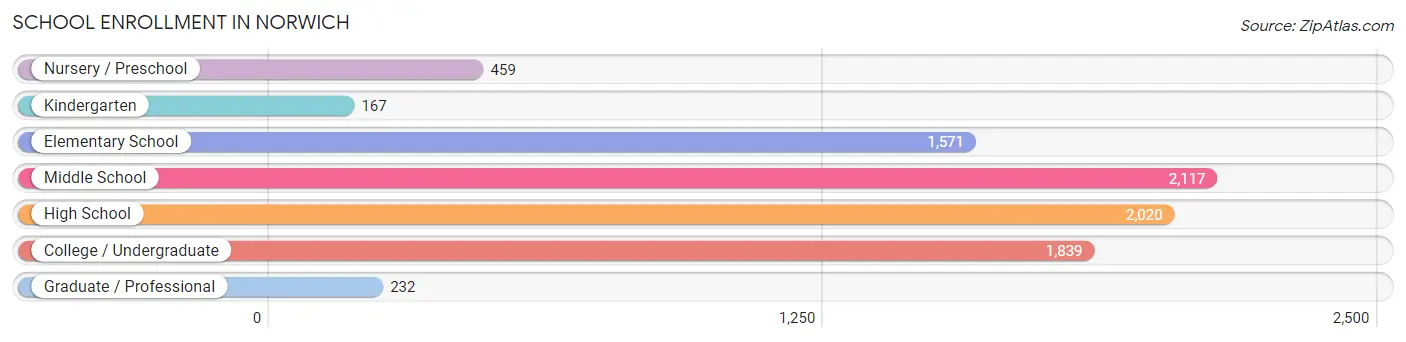
School Enrollment in Norwich
The most common levels of schooling among the 8,405 students in Norwich are middle school (2,117 | 25.2%), high school (2,020 | 24.0%), and college / undergraduate (1,839 | 21.9%).
| School Level | # Students | % Students |
| Nursery / Preschool | 459 | 5.5% |
| Kindergarten | 167 | 2.0% |
| Elementary School | 1,571 | 18.7% |
| Middle School | 2,117 | 25.2% |
| High School | 2,020 | 24.0% |
| College / Undergraduate | 1,839 | 21.9% |
| Graduate / Professional | 232 | 2.8% |
| Total | 8,405 | 100.0% |
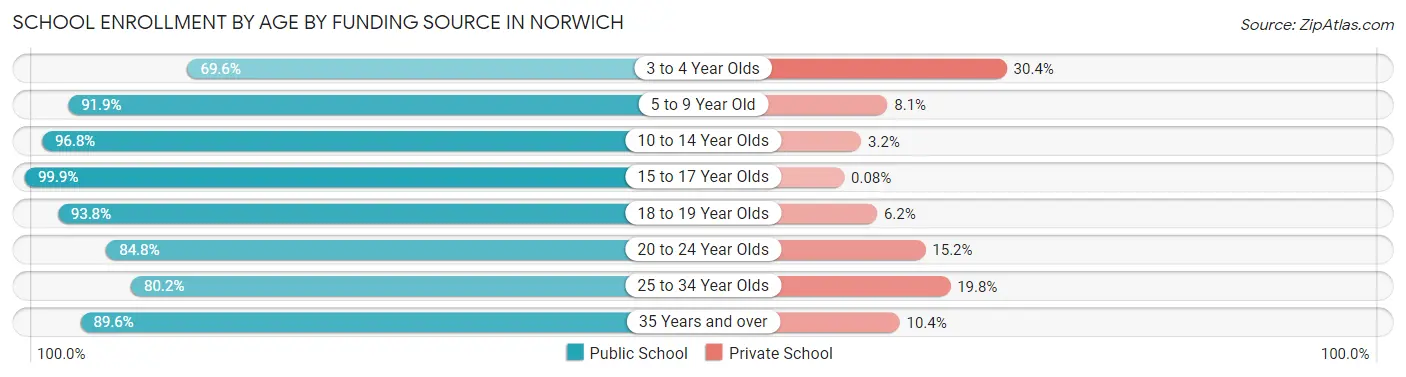
School Enrollment by Age by Funding Source in Norwich
Out of a total of 8,405 students who are enrolled in schools in Norwich, 647 (7.7%) attend a private institution, while the remaining 7,758 (92.3%) are enrolled in public schools. The age group of 3 to 4 year olds has the highest likelihood of being enrolled in private schools, with 92 (30.4% in the age bracket) enrolled. Conversely, the age group of 15 to 17 year olds has the lowest likelihood of being enrolled in a private school, with 1,228 (99.9% in the age bracket) attending a public institution.
| Age Bracket | Public School | Private School |
| 3 to 4 Year Olds | 211 (69.6%) | 92 (30.4%) |
| 5 to 9 Year Old | 1,594 (91.9%) | 141 (8.1%) |
| 10 to 14 Year Olds | 2,744 (96.8%) | 92 (3.2%) |
| 15 to 17 Year Olds | 1,228 (99.9%) | 1 (0.1%) |
| 18 to 19 Year Olds | 484 (93.8%) | 32 (6.2%) |
| 20 to 24 Year Olds | 596 (84.8%) | 107 (15.2%) |
| 25 to 34 Year Olds | 614 (80.2%) | 152 (19.8%) |
| 35 Years and over | 284 (89.6%) | 33 (10.4%) |
| Total | 7,758 (92.3%) | 647 (7.7%) |
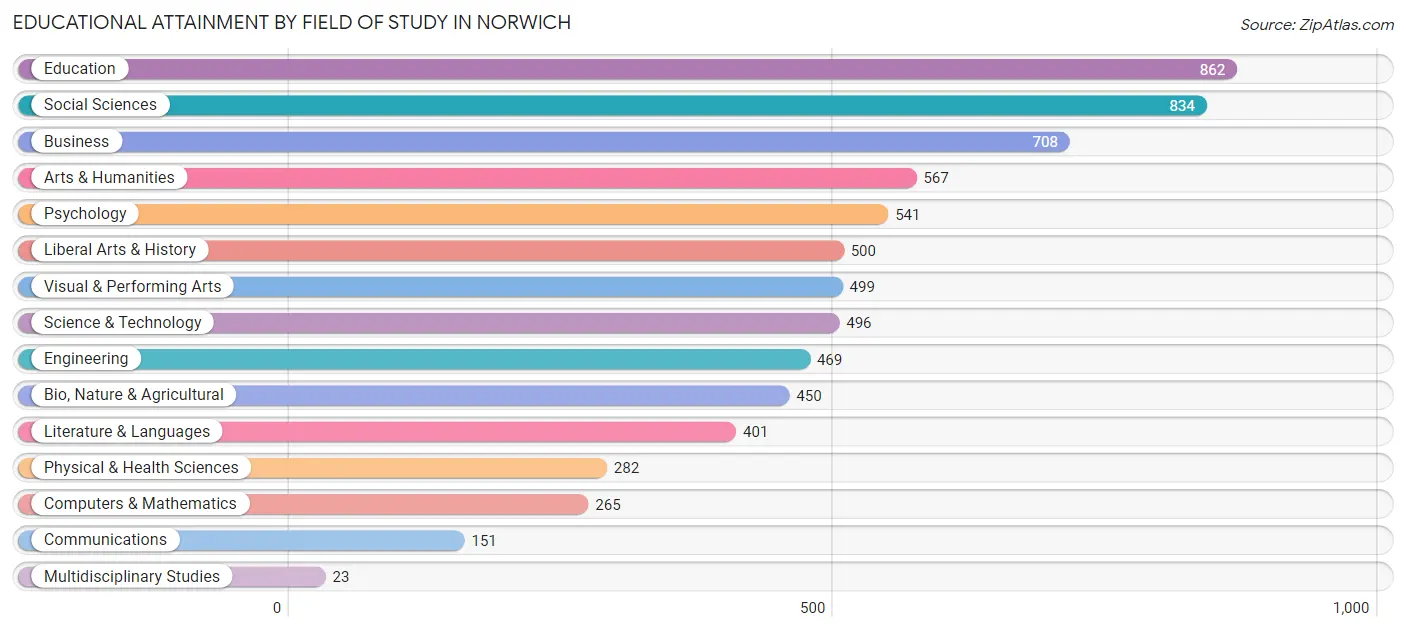
Educational Attainment by Field of Study in Norwich
Education (862 | 12.2%), social sciences (834 | 11.8%), business (708 | 10.1%), arts & humanities (567 | 8.0%), and psychology (541 | 7.7%) are the most common fields of study among 7,048 individuals in Norwich who have obtained a bachelor's degree or higher.
| Field of Study | # Graduates | % Graduates |
| Computers & Mathematics | 265 | 3.8% |
| Bio, Nature & Agricultural | 450 | 6.4% |
| Physical & Health Sciences | 282 | 4.0% |
| Psychology | 541 | 7.7% |
| Social Sciences | 834 | 11.8% |
| Engineering | 469 | 6.7% |
| Multidisciplinary Studies | 23 | 0.3% |
| Science & Technology | 496 | 7.0% |
| Business | 708 | 10.1% |
| Education | 862 | 12.2% |
| Literature & Languages | 401 | 5.7% |
| Liberal Arts & History | 500 | 7.1% |
| Visual & Performing Arts | 499 | 7.1% |
| Communications | 151 | 2.1% |
| Arts & Humanities | 567 | 8.0% |
| Total | 7,048 | 100.0% |
Transportation & Commute in Norwich
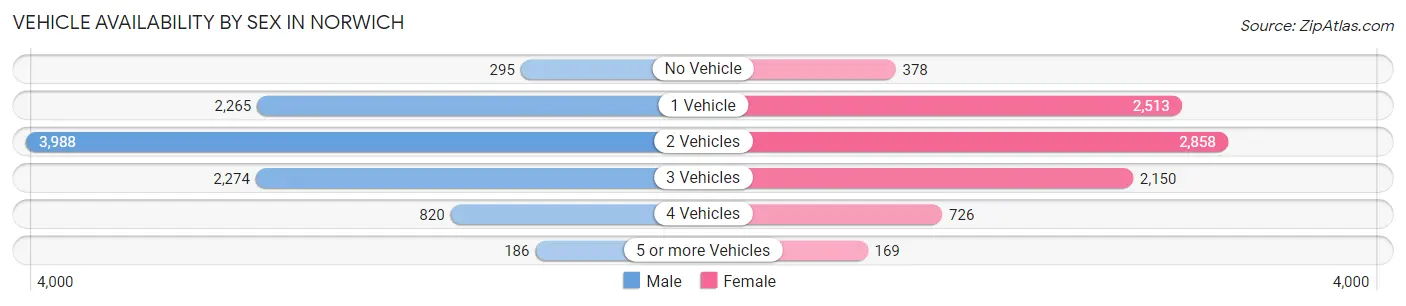
Vehicle Availability by Sex in Norwich
The most prevalent vehicle ownership categories in Norwich are males with 2 vehicles (3,988, accounting for 40.6%) and females with 2 vehicles (2,858, making up 45.4%).
| Vehicles Available | Male | Female |
| No Vehicle | 295 (3.0%) | 378 (4.3%) |
| 1 Vehicle | 2,265 (23.1%) | 2,513 (28.6%) |
| 2 Vehicles | 3,988 (40.6%) | 2,858 (32.5%) |
| 3 Vehicles | 2,274 (23.1%) | 2,150 (24.4%) |
| 4 Vehicles | 820 (8.3%) | 726 (8.3%) |
| 5 or more Vehicles | 186 (1.9%) | 169 (1.9%) |
| Total | 9,828 (100.0%) | 8,794 (100.0%) |
Commute Time in Norwich
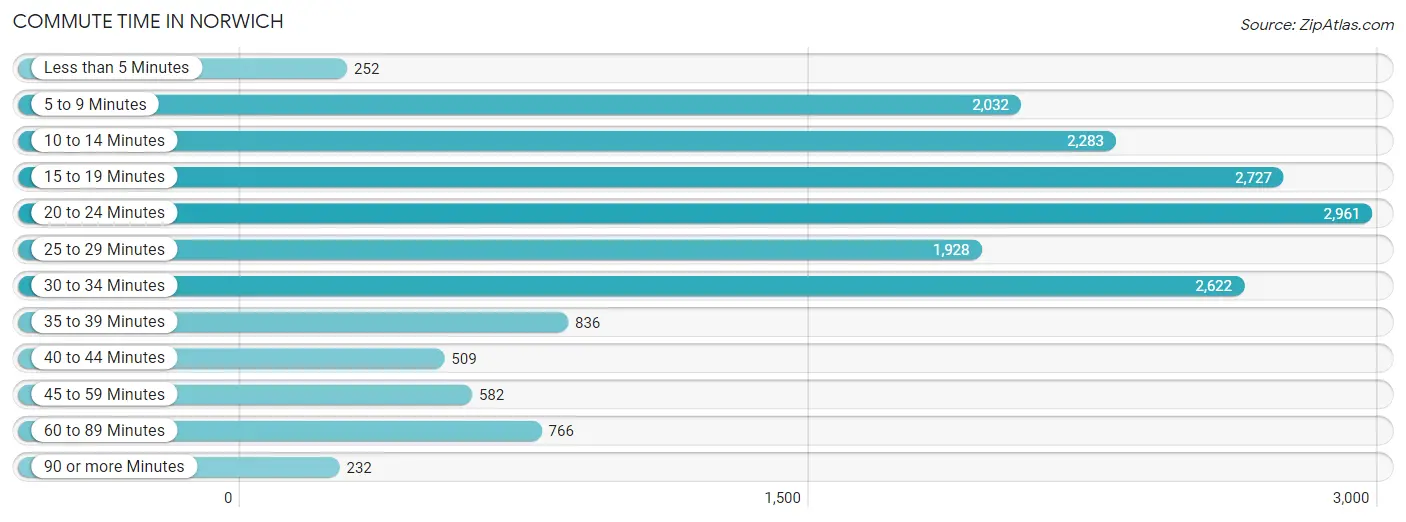
The most frequently occuring commute durations in Norwich are 20 to 24 minutes (2,961 commuters, 16.7%), 15 to 19 minutes (2,727 commuters, 15.4%), and 30 to 34 minutes (2,622 commuters, 14.8%).
| Commute Time | # Commuters | % Commuters |
| Less than 5 Minutes | 252 | 1.4% |
| 5 to 9 Minutes | 2,032 | 11.5% |
| 10 to 14 Minutes | 2,283 | 12.9% |
| 15 to 19 Minutes | 2,727 | 15.4% |
| 20 to 24 Minutes | 2,961 | 16.7% |
| 25 to 29 Minutes | 1,928 | 10.9% |
| 30 to 34 Minutes | 2,622 | 14.8% |
| 35 to 39 Minutes | 836 | 4.7% |
| 40 to 44 Minutes | 509 | 2.9% |
| 45 to 59 Minutes | 582 | 3.3% |
| 60 to 89 Minutes | 766 | 4.3% |
| 90 or more Minutes | 232 | 1.3% |
Commute Time by Sex in Norwich
The most common commute times in Norwich are 15 to 19 minutes (1,619 commuters, 17.2%) for males and 20 to 24 minutes (1,557 commuters, 18.7%) for females.
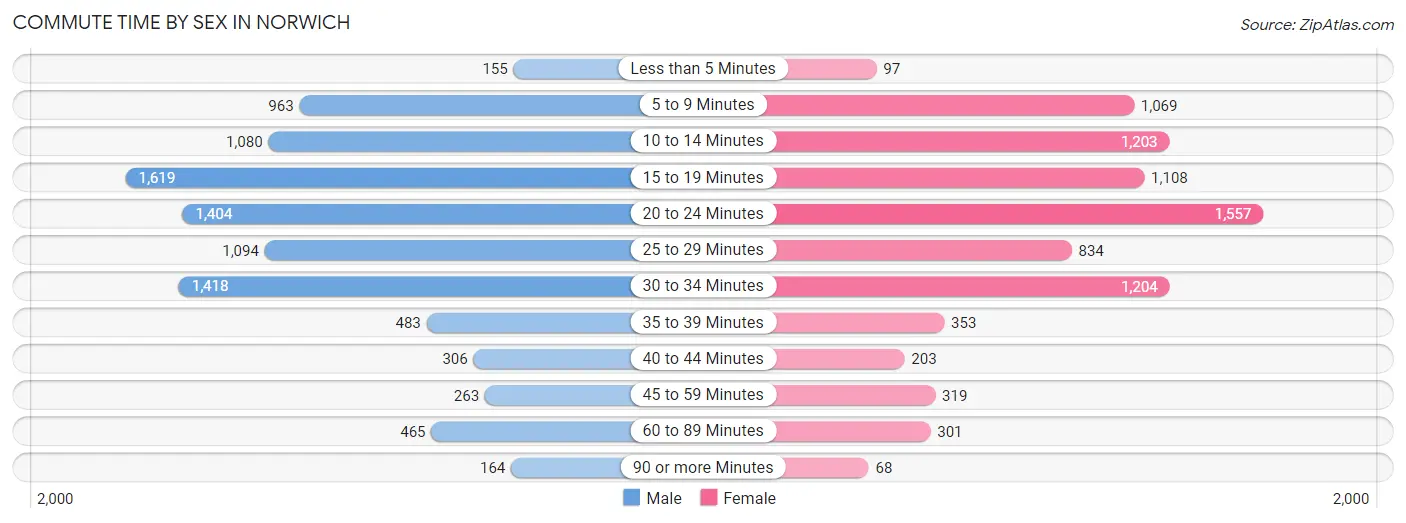
| Commute Time | Male | Female |
| Less than 5 Minutes | 155 (1.7%) | 97 (1.2%) |
| 5 to 9 Minutes | 963 (10.2%) | 1,069 (12.9%) |
| 10 to 14 Minutes | 1,080 (11.5%) | 1,203 (14.5%) |
| 15 to 19 Minutes | 1,619 (17.2%) | 1,108 (13.3%) |
| 20 to 24 Minutes | 1,404 (14.9%) | 1,557 (18.7%) |
| 25 to 29 Minutes | 1,094 (11.6%) | 834 (10.0%) |
| 30 to 34 Minutes | 1,418 (15.1%) | 1,204 (14.5%) |
| 35 to 39 Minutes | 483 (5.1%) | 353 (4.2%) |
| 40 to 44 Minutes | 306 (3.3%) | 203 (2.4%) |
| 45 to 59 Minutes | 263 (2.8%) | 319 (3.8%) |
| 60 to 89 Minutes | 465 (4.9%) | 301 (3.6%) |
| 90 or more Minutes | 164 (1.7%) | 68 (0.8%) |
Time of Departure to Work by Sex in Norwich
The most frequent times of departure to work in Norwich are 4:00 PM to 11:59 PM (1,156, 12.3%) for males and 12:00 PM to 3:59 PM (1,357, 16.3%) for females.
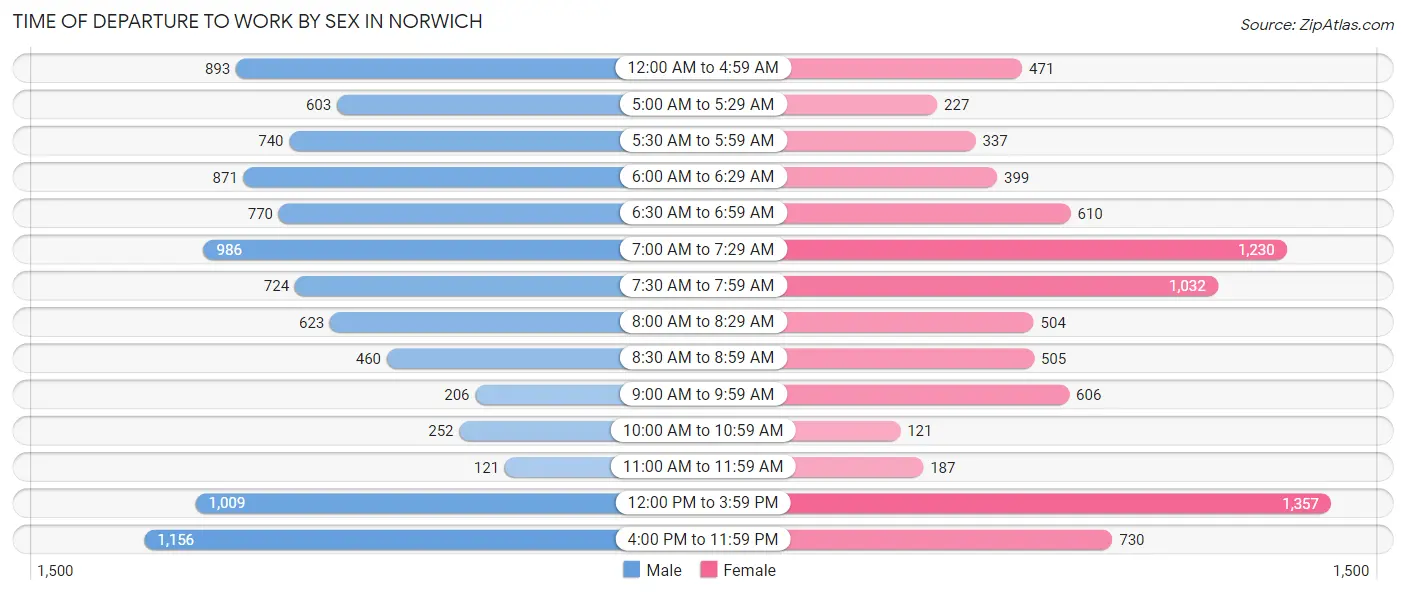
| Time of Departure | Male | Female |
| 12:00 AM to 4:59 AM | 893 (9.5%) | 471 (5.7%) |
| 5:00 AM to 5:29 AM | 603 (6.4%) | 227 (2.7%) |
| 5:30 AM to 5:59 AM | 740 (7.9%) | 337 (4.1%) |
| 6:00 AM to 6:29 AM | 871 (9.2%) | 399 (4.8%) |
| 6:30 AM to 6:59 AM | 770 (8.2%) | 610 (7.3%) |
| 7:00 AM to 7:29 AM | 986 (10.5%) | 1,230 (14.8%) |
| 7:30 AM to 7:59 AM | 724 (7.7%) | 1,032 (12.4%) |
| 8:00 AM to 8:29 AM | 623 (6.6%) | 504 (6.1%) |
| 8:30 AM to 8:59 AM | 460 (4.9%) | 505 (6.1%) |
| 9:00 AM to 9:59 AM | 206 (2.2%) | 606 (7.3%) |
| 10:00 AM to 10:59 AM | 252 (2.7%) | 121 (1.5%) |
| 11:00 AM to 11:59 AM | 121 (1.3%) | 187 (2.2%) |
| 12:00 PM to 3:59 PM | 1,009 (10.7%) | 1,357 (16.3%) |
| 4:00 PM to 11:59 PM | 1,156 (12.3%) | 730 (8.8%) |
| Total | 9,414 (100.0%) | 8,316 (100.0%) |
Housing Occupancy in Norwich
Occupancy by Ownership in Norwich
Of the total 17,165 dwellings in Norwich, owner-occupied units account for 9,329 (54.3%), while renter-occupied units make up 7,836 (45.7%).
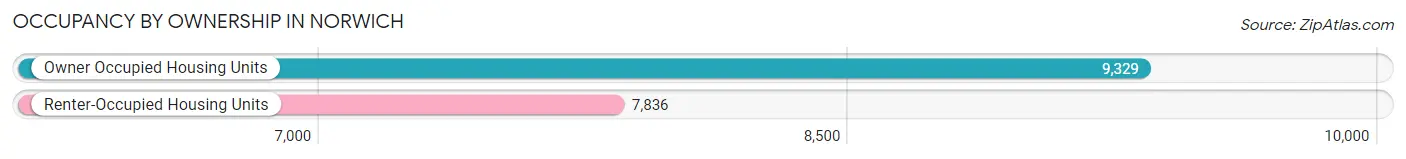
| Occupancy | # Housing Units | % Housing Units |
| Owner Occupied Housing Units | 9,329 | 54.3% |
| Renter-Occupied Housing Units | 7,836 | 45.7% |
| Total Occupied Housing Units | 17,165 | 100.0% |
Occupancy by Household Size in Norwich
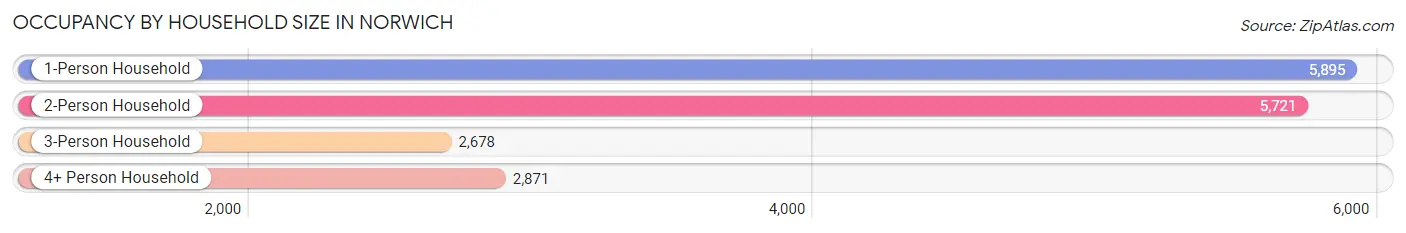
| Household Size | # Housing Units | % Housing Units |
| 1-Person Household | 5,895 | 34.3% |
| 2-Person Household | 5,721 | 33.3% |
| 3-Person Household | 2,678 | 15.6% |
| 4+ Person Household | 2,871 | 16.7% |
| Total Housing Units | 17,165 | 100.0% |
Occupancy by Ownership by Household Size in Norwich
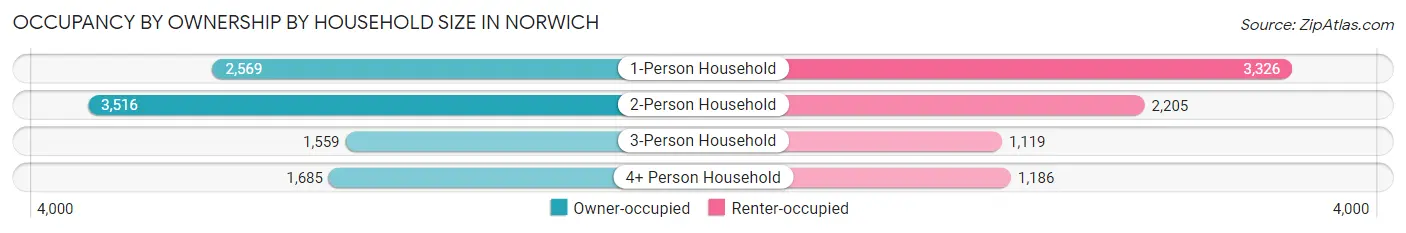
| Household Size | Owner-occupied | Renter-occupied |
| 1-Person Household | 2,569 (43.6%) | 3,326 (56.4%) |
| 2-Person Household | 3,516 (61.5%) | 2,205 (38.5%) |
| 3-Person Household | 1,559 (58.2%) | 1,119 (41.8%) |
| 4+ Person Household | 1,685 (58.7%) | 1,186 (41.3%) |
| Total Housing Units | 9,329 (54.3%) | 7,836 (45.7%) |
Occupancy by Educational Attainment in Norwich
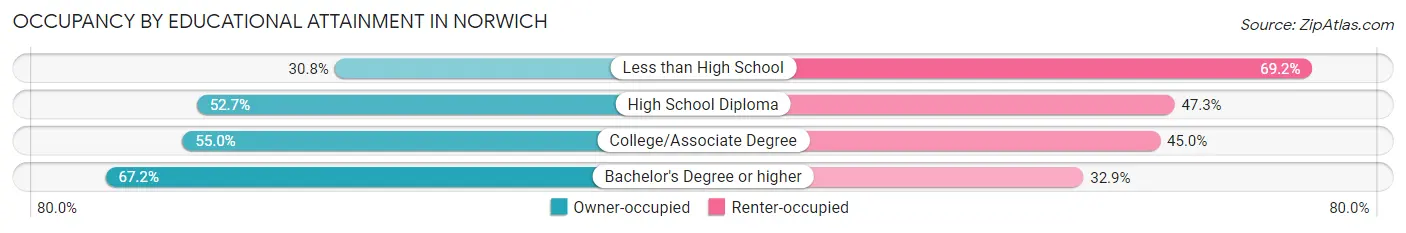
| Household Size | Owner-occupied | Renter-occupied |
| Less than High School | 610 (30.8%) | 1,369 (69.2%) |
| High School Diploma | 3,217 (52.7%) | 2,888 (47.3%) |
| College/Associate Degree | 2,687 (55.0%) | 2,202 (45.0%) |
| Bachelor's Degree or higher | 2,815 (67.1%) | 1,377 (32.9%) |
Occupancy by Age of Householder in Norwich
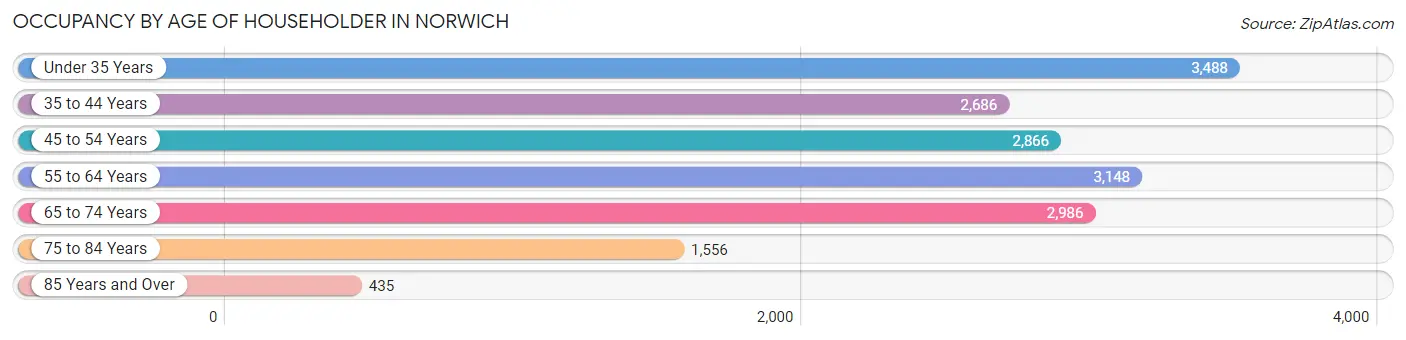
| Age Bracket | # Households | % Households |
| Under 35 Years | 3,488 | 20.3% |
| 35 to 44 Years | 2,686 | 15.7% |
| 45 to 54 Years | 2,866 | 16.7% |
| 55 to 64 Years | 3,148 | 18.3% |
| 65 to 74 Years | 2,986 | 17.4% |
| 75 to 84 Years | 1,556 | 9.1% |
| 85 Years and Over | 435 | 2.5% |
| Total | 17,165 | 100.0% |
Housing Finances in Norwich
Median Income by Occupancy in Norwich
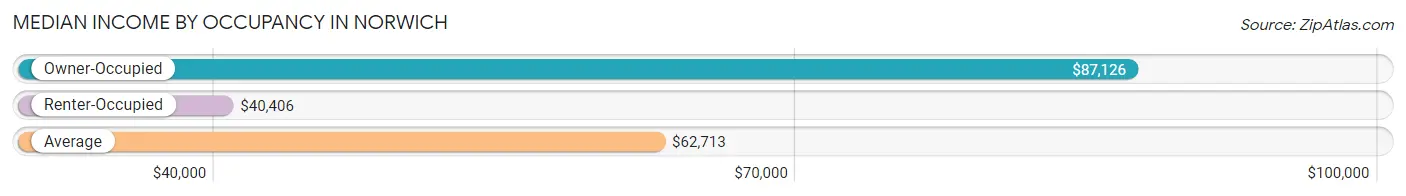
| Occupancy Type | # Households | Median Income |
| Owner-Occupied | 9,329 (54.3%) | $87,126 |
| Renter-Occupied | 7,836 (45.7%) | $40,406 |
| Average | 17,165 (100.0%) | $62,713 |
Occupancy by Householder Income Bracket in Norwich
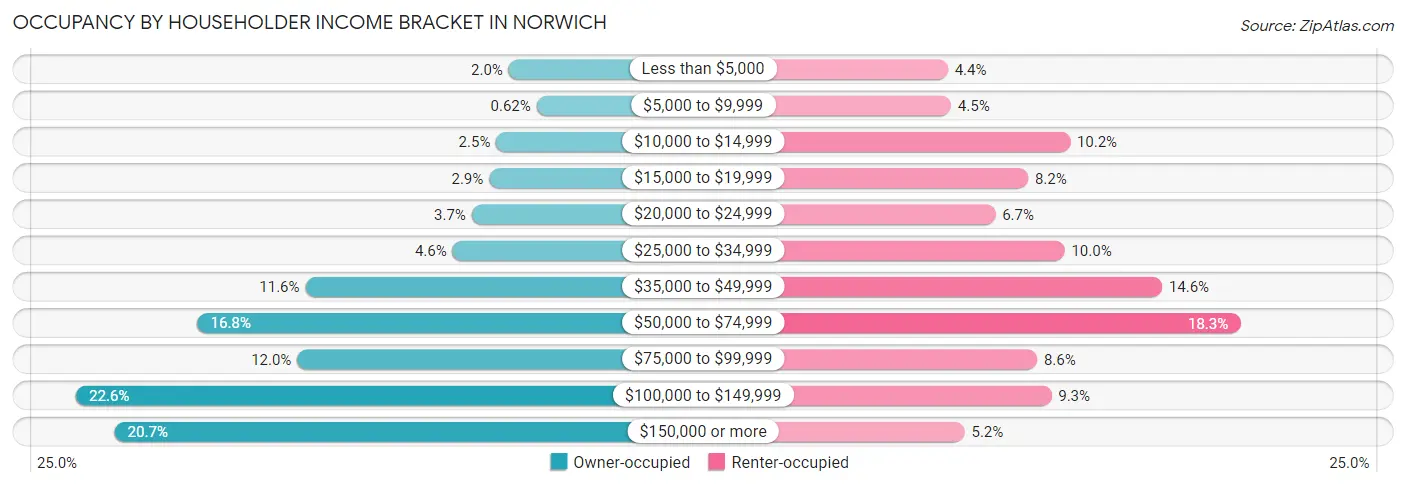
| Income Bracket | Owner-occupied | Renter-occupied |
| Less than $5,000 | 182 (1.9%) | 344 (4.4%) |
| $5,000 to $9,999 | 58 (0.6%) | 356 (4.5%) |
| $10,000 to $14,999 | 237 (2.5%) | 800 (10.2%) |
| $15,000 to $19,999 | 269 (2.9%) | 643 (8.2%) |
| $20,000 to $24,999 | 346 (3.7%) | 521 (6.7%) |
| $25,000 to $34,999 | 431 (4.6%) | 780 (10.0%) |
| $35,000 to $49,999 | 1,085 (11.6%) | 1,143 (14.6%) |
| $50,000 to $74,999 | 1,564 (16.8%) | 1,435 (18.3%) |
| $75,000 to $99,999 | 1,121 (12.0%) | 677 (8.6%) |
| $100,000 to $149,999 | 2,104 (22.6%) | 730 (9.3%) |
| $150,000 or more | 1,932 (20.7%) | 407 (5.2%) |
| Total | 9,329 (100.0%) | 7,836 (100.0%) |
Monthly Housing Cost Tiers in Norwich
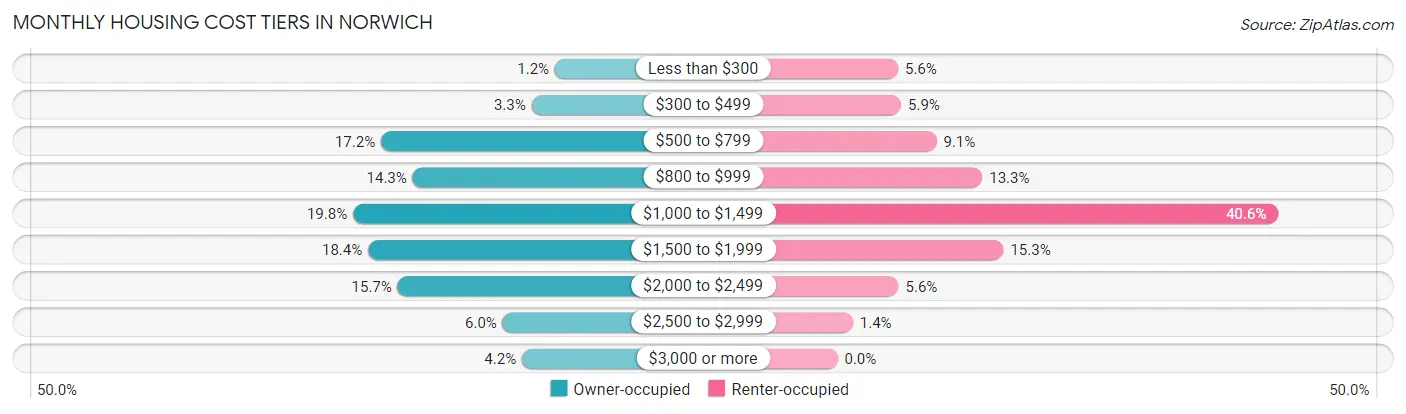
| Monthly Cost | Owner-occupied | Renter-occupied |
| Less than $300 | 110 (1.2%) | 437 (5.6%) |
| $300 to $499 | 311 (3.3%) | 459 (5.9%) |
| $500 to $799 | 1,604 (17.2%) | 715 (9.1%) |
| $800 to $999 | 1,332 (14.3%) | 1,045 (13.3%) |
| $1,000 to $1,499 | 1,844 (19.8%) | 3,180 (40.6%) |
| $1,500 to $1,999 | 1,715 (18.4%) | 1,198 (15.3%) |
| $2,000 to $2,499 | 1,461 (15.7%) | 441 (5.6%) |
| $2,500 to $2,999 | 559 (6.0%) | 111 (1.4%) |
| $3,000 or more | 393 (4.2%) | 0 (0.0%) |
| Total | 9,329 (100.0%) | 7,836 (100.0%) |
Physical Housing Characteristics in Norwich
Housing Structures in Norwich
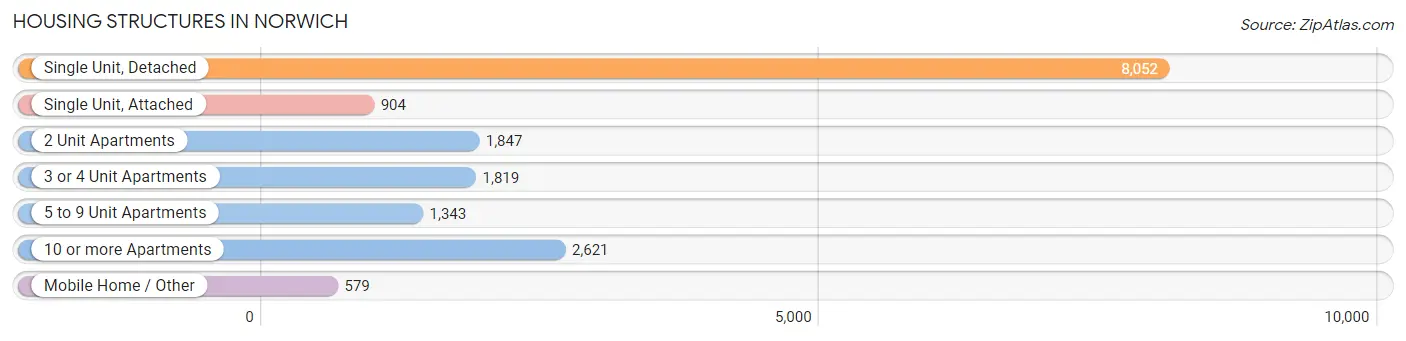
| Structure Type | # Housing Units | % Housing Units |
| Single Unit, Detached | 8,052 | 46.9% |
| Single Unit, Attached | 904 | 5.3% |
| 2 Unit Apartments | 1,847 | 10.8% |
| 3 or 4 Unit Apartments | 1,819 | 10.6% |
| 5 to 9 Unit Apartments | 1,343 | 7.8% |
| 10 or more Apartments | 2,621 | 15.3% |
| Mobile Home / Other | 579 | 3.4% |
| Total | 17,165 | 100.0% |
Housing Structures by Occupancy in Norwich
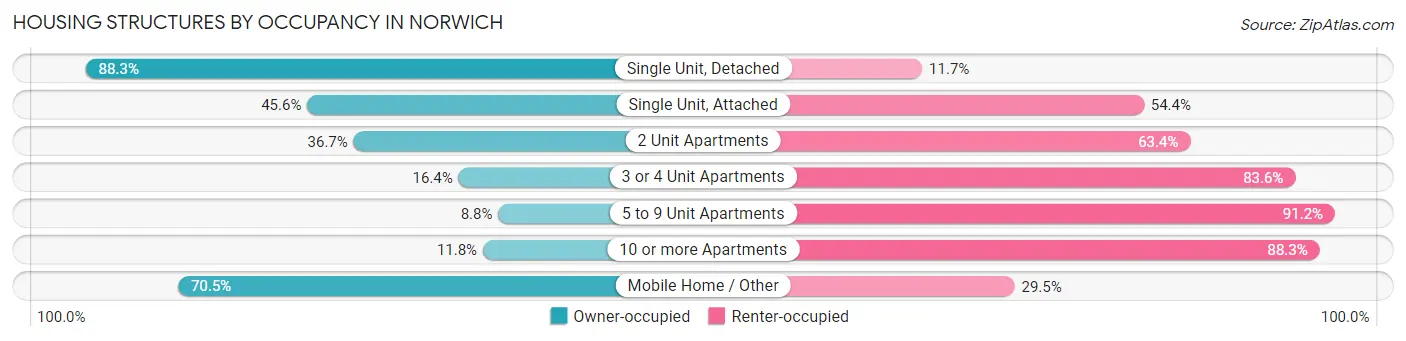
| Structure Type | Owner-occupied | Renter-occupied |
| Single Unit, Detached | 7,107 (88.3%) | 945 (11.7%) |
| Single Unit, Attached | 412 (45.6%) | 492 (54.4%) |
| 2 Unit Apartments | 677 (36.6%) | 1,170 (63.3%) |
| 3 or 4 Unit Apartments | 299 (16.4%) | 1,520 (83.6%) |
| 5 to 9 Unit Apartments | 118 (8.8%) | 1,225 (91.2%) |
| 10 or more Apartments | 308 (11.7%) | 2,313 (88.2%) |
| Mobile Home / Other | 408 (70.5%) | 171 (29.5%) |
| Total | 9,329 (54.3%) | 7,836 (45.7%) |
Housing Structures by Number of Rooms in Norwich
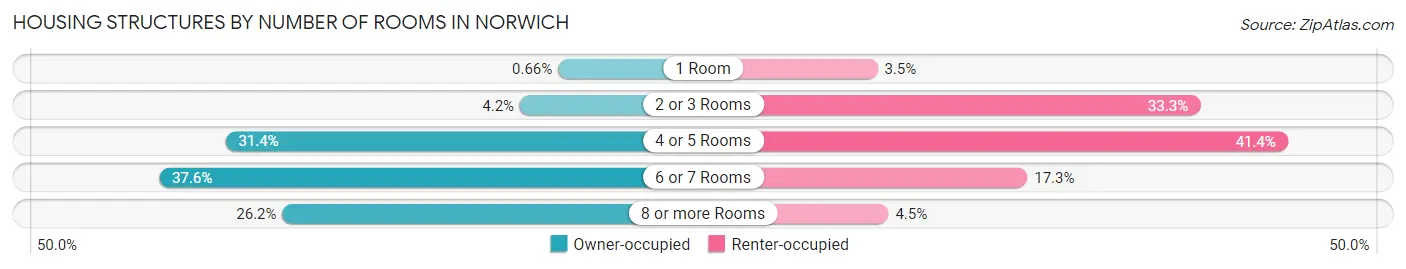
| Number of Rooms | Owner-occupied | Renter-occupied |
| 1 Room | 62 (0.7%) | 272 (3.5%) |
| 2 or 3 Rooms | 391 (4.2%) | 2,609 (33.3%) |
| 4 or 5 Rooms | 2,931 (31.4%) | 3,245 (41.4%) |
| 6 or 7 Rooms | 3,505 (37.6%) | 1,358 (17.3%) |
| 8 or more Rooms | 2,440 (26.2%) | 352 (4.5%) |
| Total | 9,329 (100.0%) | 7,836 (100.0%) |
Housing Structure by Heating Type in Norwich
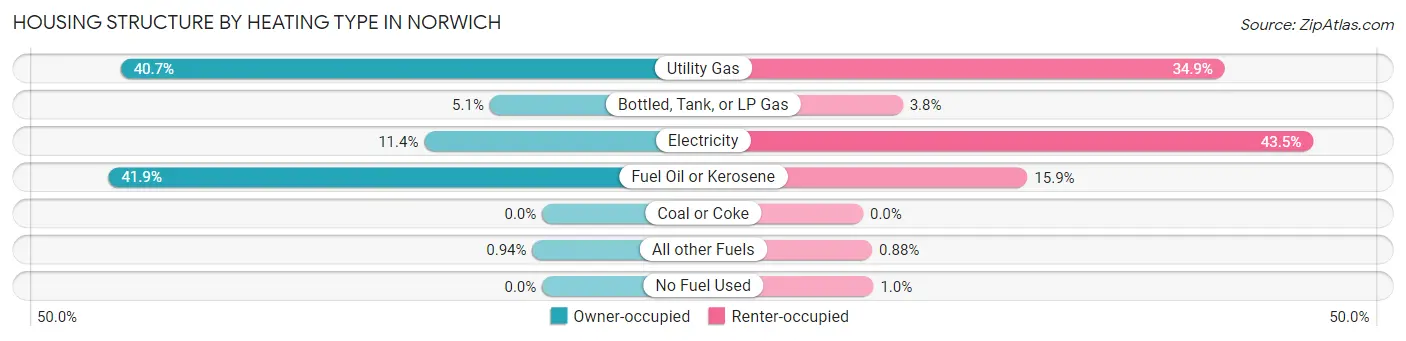
| Heating Type | Owner-occupied | Renter-occupied |
| Utility Gas | 3,798 (40.7%) | 2,738 (34.9%) |
| Bottled, Tank, or LP Gas | 472 (5.1%) | 300 (3.8%) |
| Electricity | 1,063 (11.4%) | 3,406 (43.5%) |
| Fuel Oil or Kerosene | 3,908 (41.9%) | 1,244 (15.9%) |
| Coal or Coke | 0 (0.0%) | 0 (0.0%) |
| All other Fuels | 88 (0.9%) | 69 (0.9%) |
| No Fuel Used | 0 (0.0%) | 79 (1.0%) |
| Total | 9,329 (100.0%) | 7,836 (100.0%) |
Household Vehicle Usage in Norwich
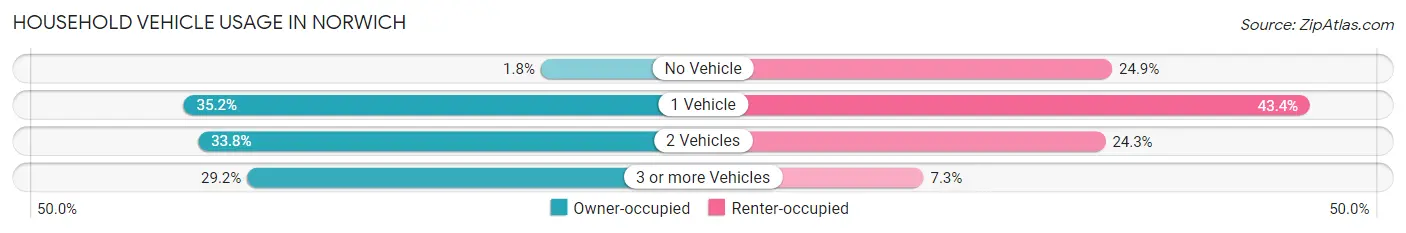
| Vehicles per Household | Owner-occupied | Renter-occupied |
| No Vehicle | 170 (1.8%) | 1,954 (24.9%) |
| 1 Vehicle | 3,279 (35.1%) | 3,401 (43.4%) |
| 2 Vehicles | 3,153 (33.8%) | 1,906 (24.3%) |
| 3 or more Vehicles | 2,727 (29.2%) | 575 (7.3%) |
| Total | 9,329 (100.0%) | 7,836 (100.0%) |
Real Estate & Mortgages in Norwich
Real Estate and Mortgage Overview in Norwich
| Characteristic | Without Mortgage | With Mortgage |
| Housing Units | 4,117 | 5,212 |
| Median Property Value | $192,800 | $205,500 |
| Median Household Income | $64,138 | $1,384 |
| Monthly Housing Costs | $836 | $334 |
| Real Estate Taxes | $4,579 | $130 |
Property Value by Mortgage Status in Norwich
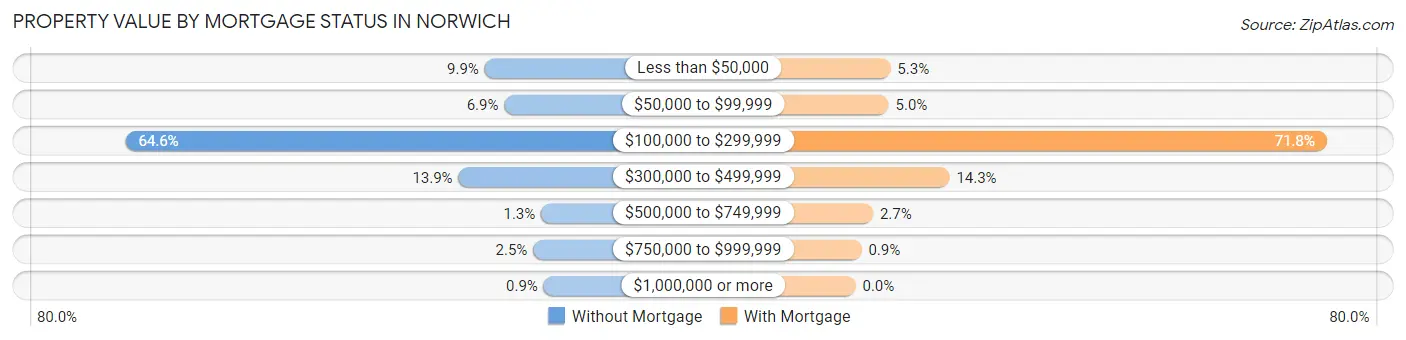
| Property Value | Without Mortgage | With Mortgage |
| Less than $50,000 | 407 (9.9%) | 277 (5.3%) |
| $50,000 to $99,999 | 284 (6.9%) | 262 (5.0%) |
| $100,000 to $299,999 | 2,661 (64.6%) | 3,742 (71.8%) |
| $300,000 to $499,999 | 572 (13.9%) | 746 (14.3%) |
| $500,000 to $749,999 | 53 (1.3%) | 138 (2.6%) |
| $750,000 to $999,999 | 103 (2.5%) | 47 (0.9%) |
| $1,000,000 or more | 37 (0.9%) | 0 (0.0%) |
| Total | 4,117 (100.0%) | 5,212 (100.0%) |
Household Income by Mortgage Status in Norwich
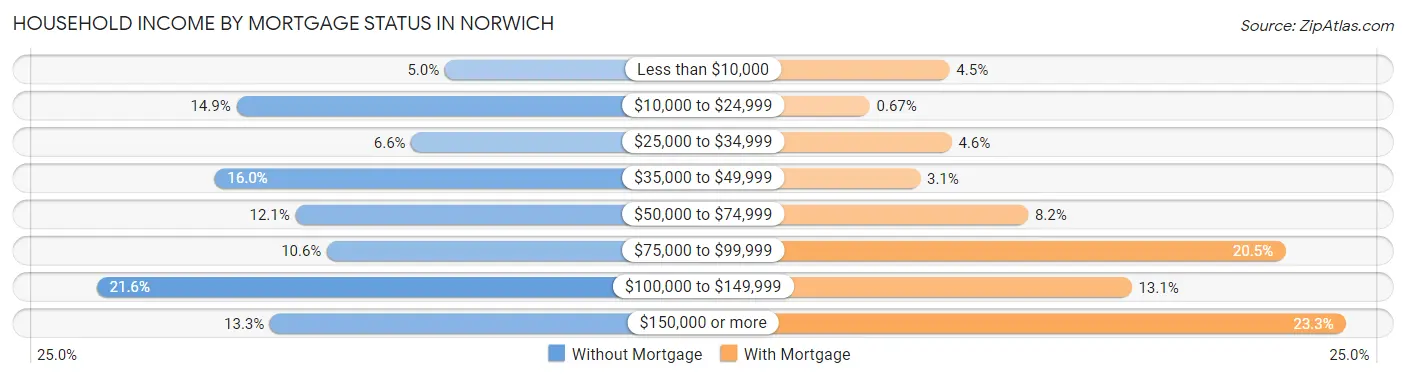
| Household Income | Without Mortgage | With Mortgage |
| Less than $10,000 | 205 (5.0%) | 233 (4.5%) |
| $10,000 to $24,999 | 614 (14.9%) | 35 (0.7%) |
| $25,000 to $34,999 | 271 (6.6%) | 238 (4.6%) |
| $35,000 to $49,999 | 657 (16.0%) | 160 (3.1%) |
| $50,000 to $74,999 | 498 (12.1%) | 428 (8.2%) |
| $75,000 to $99,999 | 436 (10.6%) | 1,066 (20.4%) |
| $100,000 to $149,999 | 888 (21.6%) | 685 (13.1%) |
| $150,000 or more | 548 (13.3%) | 1,216 (23.3%) |
| Total | 4,117 (100.0%) | 5,212 (100.0%) |
Property Value to Household Income Ratio in Norwich
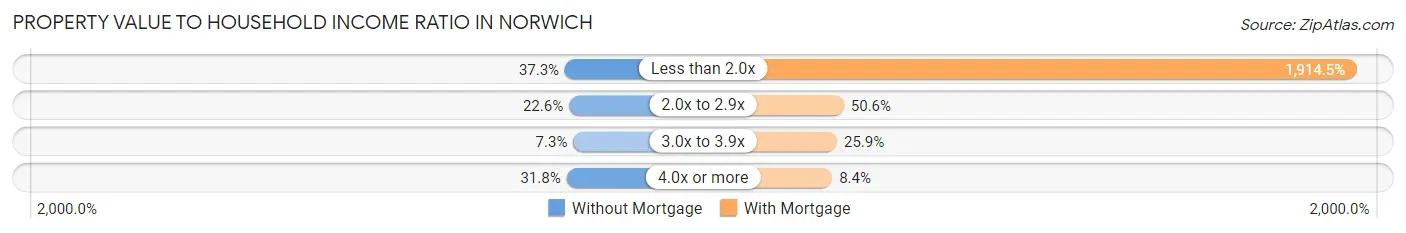
| Value-to-Income Ratio | Without Mortgage | With Mortgage |
| Less than 2.0x | 1,535 (37.3%) | 99,786 (1,914.5%) |
| 2.0x to 2.9x | 931 (22.6%) | 2,638 (50.6%) |
| 3.0x to 3.9x | 300 (7.3%) | 1,349 (25.9%) |
| 4.0x or more | 1,310 (31.8%) | 439 (8.4%) |
| Total | 4,117 (100.0%) | 5,212 (100.0%) |
Real Estate Taxes by Mortgage Status in Norwich
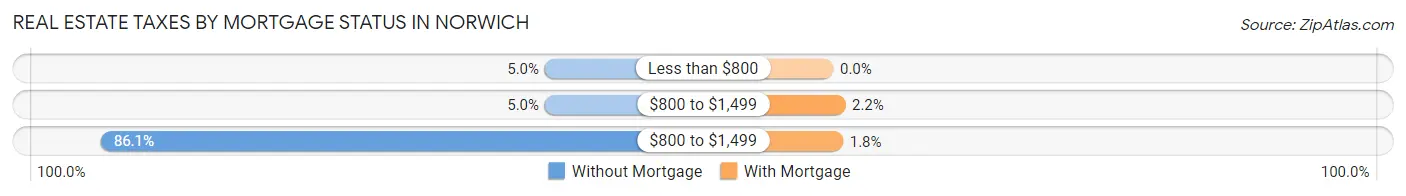
| Property Taxes | Without Mortgage | With Mortgage |
| Less than $800 | 205 (5.0%) | 0 (0.0%) |
| $800 to $1,499 | 205 (5.0%) | 114 (2.2%) |
| $800 to $1,499 | 3,544 (86.1%) | 93 (1.8%) |
| Total | 4,117 (100.0%) | 5,212 (100.0%) |
Health & Disability in Norwich
Health Insurance Coverage by Age in Norwich
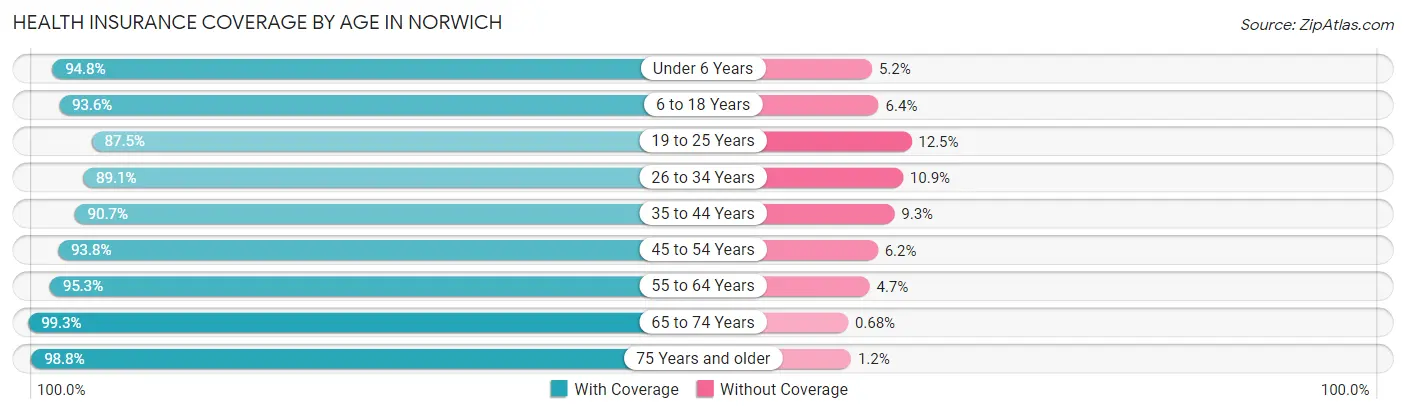
| Age Bracket | With Coverage | Without Coverage |
| Under 6 Years | 2,222 (94.8%) | 121 (5.2%) |
| 6 to 18 Years | 5,666 (93.6%) | 388 (6.4%) |
| 19 to 25 Years | 2,735 (87.5%) | 391 (12.5%) |
| 26 to 34 Years | 4,887 (89.1%) | 600 (10.9%) |
| 35 to 44 Years | 4,450 (90.7%) | 458 (9.3%) |
| 45 to 54 Years | 4,215 (93.8%) | 280 (6.2%) |
| 55 to 64 Years | 5,278 (95.3%) | 261 (4.7%) |
| 65 to 74 Years | 4,678 (99.3%) | 32 (0.7%) |
| 75 Years and older | 2,859 (98.8%) | 36 (1.2%) |
| Total | 36,990 (93.5%) | 2,567 (6.5%) |
Health Insurance Coverage by Citizenship Status in Norwich
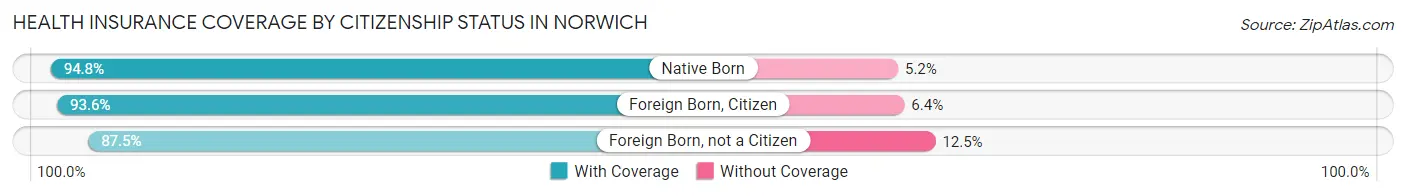
| Citizenship Status | With Coverage | Without Coverage |
| Native Born | 2,222 (94.8%) | 121 (5.2%) |
| Foreign Born, Citizen | 5,666 (93.6%) | 388 (6.4%) |
| Foreign Born, not a Citizen | 2,735 (87.5%) | 391 (12.5%) |
Health Insurance Coverage by Household Income in Norwich
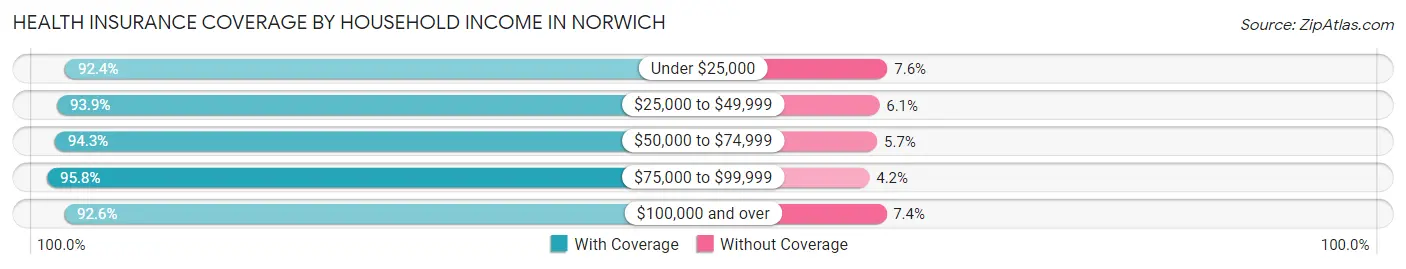
| Household Income | With Coverage | Without Coverage |
| Under $25,000 | 5,134 (92.4%) | 422 (7.6%) |
| $25,000 to $49,999 | 6,204 (93.9%) | 402 (6.1%) |
| $50,000 to $74,999 | 6,761 (94.3%) | 407 (5.7%) |
| $75,000 to $99,999 | 4,305 (95.8%) | 189 (4.2%) |
| $100,000 and over | 14,379 (92.6%) | 1,147 (7.4%) |
Public vs Private Health Insurance Coverage by Age in Norwich
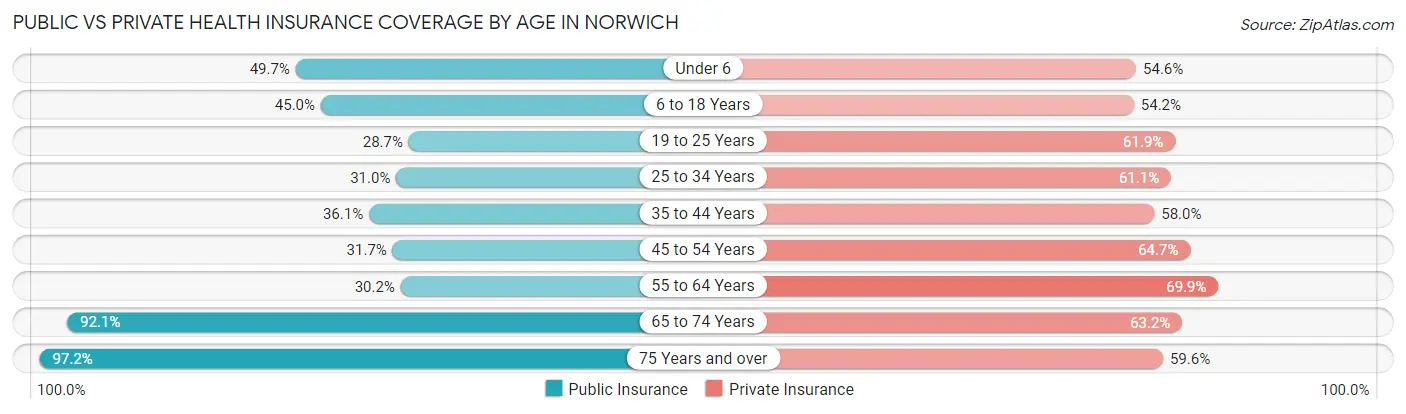
| Age Bracket | Public Insurance | Private Insurance |
| Under 6 | 1,164 (49.7%) | 1,280 (54.6%) |
| 6 to 18 Years | 2,725 (45.0%) | 3,282 (54.2%) |
| 19 to 25 Years | 897 (28.7%) | 1,934 (61.9%) |
| 25 to 34 Years | 1,702 (31.0%) | 3,353 (61.1%) |
| 35 to 44 Years | 1,771 (36.1%) | 2,847 (58.0%) |
| 45 to 54 Years | 1,424 (31.7%) | 2,907 (64.7%) |
| 55 to 64 Years | 1,672 (30.2%) | 3,871 (69.9%) |
| 65 to 74 Years | 4,338 (92.1%) | 2,976 (63.2%) |
| 75 Years and over | 2,815 (97.2%) | 1,726 (59.6%) |
| Total | 18,508 (46.8%) | 24,176 (61.1%) |
Disability Status by Sex by Age in Norwich
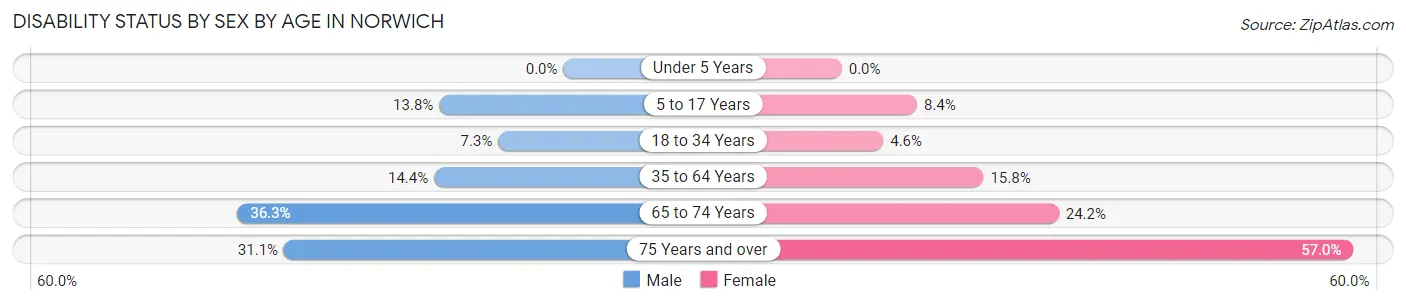
| Age Bracket | Male | Female |
| Under 5 Years | 0 (0.0%) | 0 (0.0%) |
| 5 to 17 Years | 415 (13.8%) | 249 (8.4%) |
| 18 to 34 Years | 327 (7.2%) | 208 (4.6%) |
| 35 to 64 Years | 1,081 (14.4%) | 1,173 (15.8%) |
| 65 to 74 Years | 890 (36.3%) | 546 (24.2%) |
| 75 Years and over | 305 (31.1%) | 1,091 (57.0%) |
Disability Class by Sex by Age in Norwich
Disability Class: Hearing Difficulty
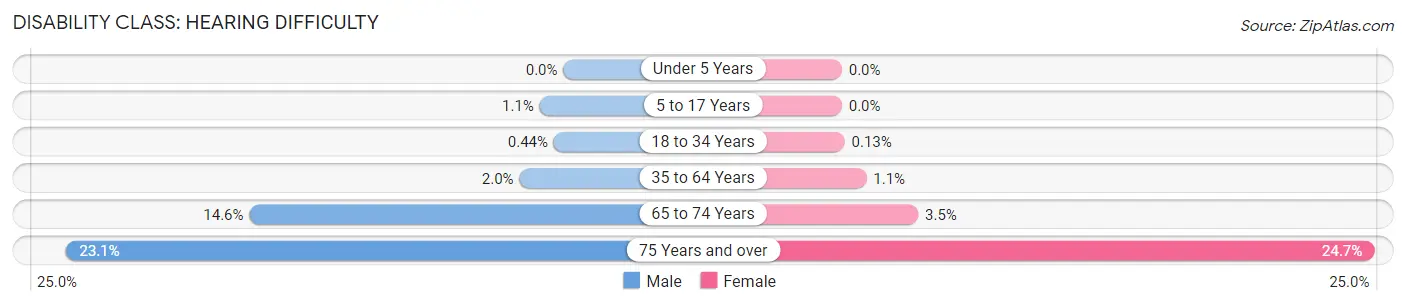
| Age Bracket | Male | Female |
| Under 5 Years | 0 (0.0%) | 0 (0.0%) |
| 5 to 17 Years | 33 (1.1%) | 0 (0.0%) |
| 18 to 34 Years | 20 (0.4%) | 6 (0.1%) |
| 35 to 64 Years | 153 (2.0%) | 85 (1.1%) |
| 65 to 74 Years | 357 (14.6%) | 80 (3.5%) |
| 75 Years and over | 226 (23.1%) | 473 (24.7%) |
Disability Class: Vision Difficulty
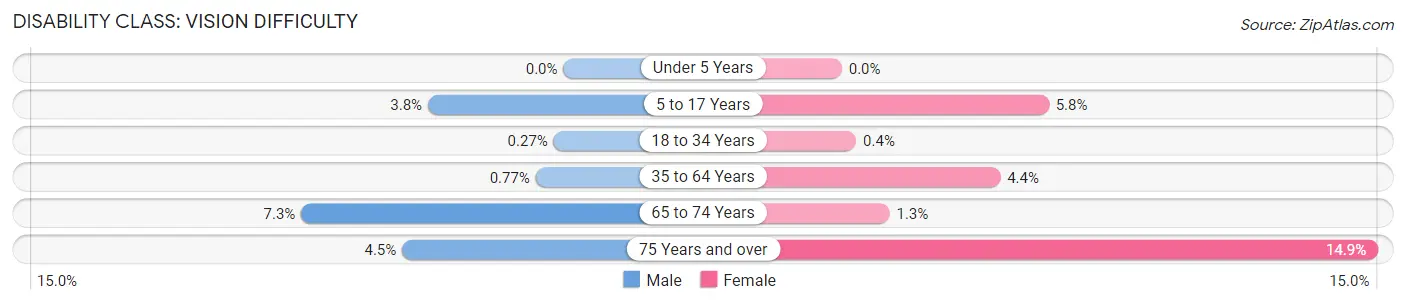
| Age Bracket | Male | Female |
| Under 5 Years | 0 (0.0%) | 0 (0.0%) |
| 5 to 17 Years | 113 (3.8%) | 171 (5.8%) |
| 18 to 34 Years | 12 (0.3%) | 18 (0.4%) |
| 35 to 64 Years | 58 (0.8%) | 328 (4.4%) |
| 65 to 74 Years | 179 (7.3%) | 30 (1.3%) |
| 75 Years and over | 44 (4.5%) | 286 (14.9%) |
Disability Class: Cognitive Difficulty
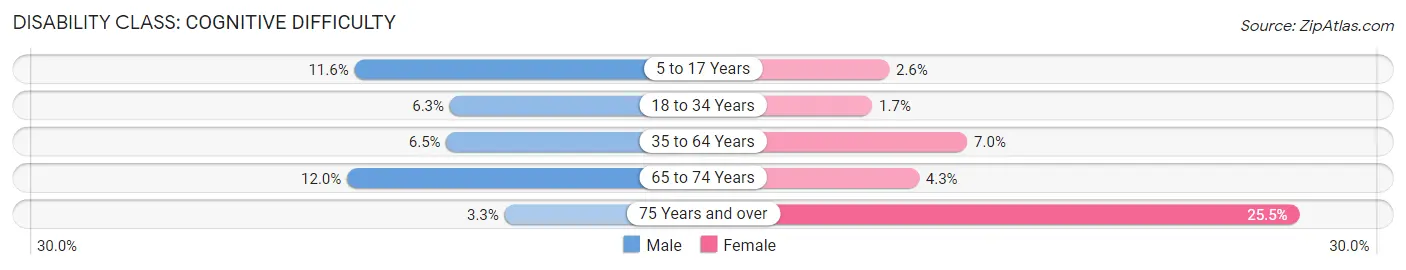
| Age Bracket | Male | Female |
| 5 to 17 Years | 349 (11.6%) | 78 (2.6%) |
| 18 to 34 Years | 285 (6.3%) | 76 (1.7%) |
| 35 to 64 Years | 489 (6.5%) | 519 (7.0%) |
| 65 to 74 Years | 295 (12.0%) | 97 (4.3%) |
| 75 Years and over | 32 (3.3%) | 488 (25.5%) |
Disability Class: Ambulatory Difficulty
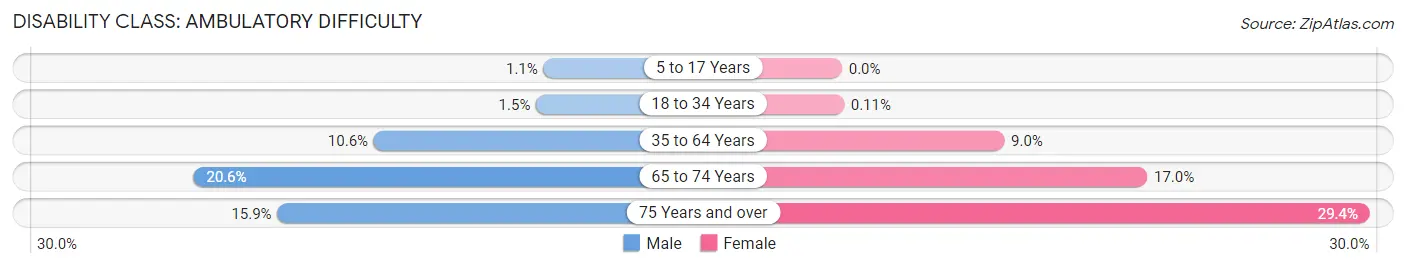
| Age Bracket | Male | Female |
| 5 to 17 Years | 33 (1.1%) | 0 (0.0%) |
| 18 to 34 Years | 68 (1.5%) | 5 (0.1%) |
| 35 to 64 Years | 792 (10.5%) | 672 (9.0%) |
| 65 to 74 Years | 505 (20.6%) | 384 (17.0%) |
| 75 Years and over | 156 (15.9%) | 563 (29.4%) |
Disability Class: Self-Care Difficulty
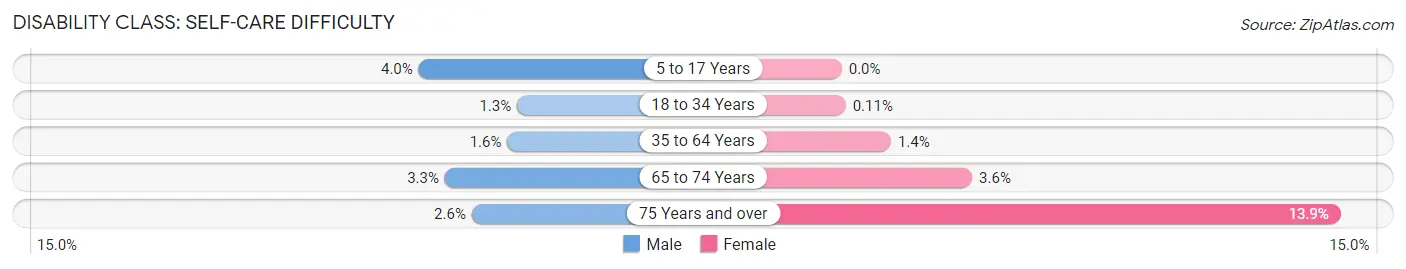
| Age Bracket | Male | Female |
| 5 to 17 Years | 121 (4.0%) | 0 (0.0%) |
| 18 to 34 Years | 58 (1.3%) | 5 (0.1%) |
| 35 to 64 Years | 117 (1.6%) | 102 (1.4%) |
| 65 to 74 Years | 81 (3.3%) | 82 (3.6%) |
| 75 Years and over | 25 (2.5%) | 266 (13.9%) |
Technology Access in Norwich
Computing Device Access in Norwich
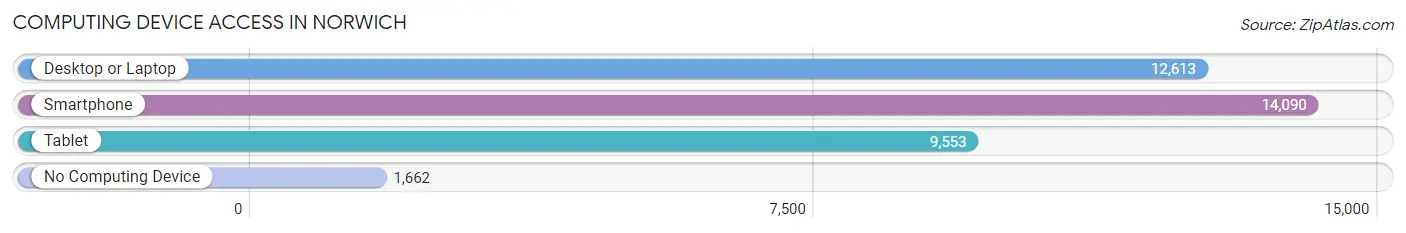
| Device Type | # Households | % Households |
| Desktop or Laptop | 12,613 | 73.5% |
| Smartphone | 14,090 | 82.1% |
| Tablet | 9,553 | 55.6% |
| No Computing Device | 1,662 | 9.7% |
| Total | 17,165 | 100.0% |
Internet Access in Norwich
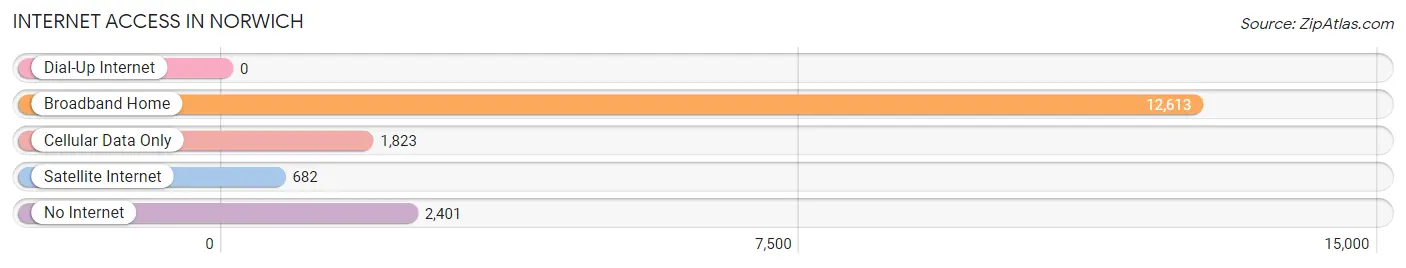
| Internet Type | # Households | % Households |
| Dial-Up Internet | 0 | 0.0% |
| Broadband Home | 12,613 | 73.5% |
| Cellular Data Only | 1,823 | 10.6% |
| Satellite Internet | 682 | 4.0% |
| No Internet | 2,401 | 14.0% |
| Total | 17,165 | 100.0% |
Norwich Summary
Norwich, Connecticut is a city located in New London County, in the southeastern corner of the state. It is situated on the Thames River, and is the county seat of New London County. The city has a population of 40,493, according to the 2010 census, making it the second largest city in Connecticut.
History
The area that is now Norwich was originally inhabited by the Mohegan and Pequot Native American tribes. The first European settlers arrived in the area in 1659, and the town was officially incorporated in 1668. The town was named after Norwich, England, and was one of the first four towns established in Connecticut.
During the Revolutionary War, Norwich was a major center of activity, and was the site of several battles. After the war, the city became an important port and manufacturing center. The city was also the birthplace of the first submarine, the Turtle, which was designed by David Bushnell in 1775.
In the 19th century, Norwich was an important center of the textile industry, and was home to several large mills. The city was also the site of the first cotton mill in the United States, which was established in 1793.
Geography
Norwich is located in southeastern Connecticut, in New London County. It is situated on the Thames River, and is bordered by the towns of Bozrah, Franklin, Lisbon, Preston, Sprague, and Voluntown. The city has a total area of 24.2 square miles, of which 22.7 square miles is land and 1.5 square miles is water.
The city is located in the Thames River Valley, and is surrounded by rolling hills and forests. The city is located in the humid continental climate zone, and has warm, humid summers and cold, snowy winters.
Economy
Norwich has a diverse economy, with a mix of manufacturing, retail, and service industries. The city is home to several large employers, including the Mohegan Sun Casino, the Norwich Public Schools, and the United States Coast Guard Academy.
The city is also home to several large manufacturing companies, including Electric Boat, which produces submarines for the United States Navy, and the Norwich Pharmaceuticals, which produces generic drugs.
Demographics
As of the 2010 census, the population of Norwich was 40,493. The racial makeup of the city was 79.2% White, 8.3% African American, 0.5% Native American, 2.2% Asian, 0.1% Pacific Islander, 6.2% from other races, and 3.5% from two or more races. Hispanic or Latino of any race were 14.3% of the population.
The median household income in Norwich was $45,945, and the median family income was $54,945. The per capita income in the city was $22,945. About 11.3% of the population was below the poverty line.
The city is served by the Norwich Public Schools, which includes seven elementary schools, two middle schools, and one high school. The city is also home to the United States Coast Guard Academy, which is a four-year college that offers bachelor's degrees in a variety of fields.
Common Questions
What is Per Capita Income in Norwich?
Per Capita income in Norwich is $36,075.
What is the Median Family Income in Norwich?
Median Family Income in Norwich is $79,630.
What is the Median Household income in Norwich?
Median Household Income in Norwich is $62,713.
What is Income or Wage Gap in Norwich?
Income or Wage Gap in Norwich is 30.1%.
Women in Norwich earn 69.9 cents for every dollar earned by a man.
What is Family Income Deficit in Norwich?
Family Income Deficit in Norwich is $11,317.
Families that are below poverty line in Norwich earn $11,317 less on average than the poverty threshold level.
What is Inequality or Gini Index in Norwich?
Inequality or Gini Index in Norwich is 0.46.
What is the Total Population of Norwich?
Total Population of Norwich is 40,054.
What is the Total Male Population of Norwich?
Total Male Population of Norwich is 19,930.
What is the Total Female Population of Norwich?
Total Female Population of Norwich is 20,124.
What is the Ratio of Males per 100 Females in Norwich?
There are 99.04 Males per 100 Females in Norwich.
What is the Ratio of Females per 100 Males in Norwich?
There are 100.97 Females per 100 Males in Norwich.
What is the Median Population Age in Norwich?
Median Population Age in Norwich is 40.2 Years.
What is the Average Family Size in Norwich
Average Family Size in Norwich is 2.9 People.
What is the Average Household Size in Norwich
Average Household Size in Norwich is 2.3 People.
How Large is the Labor Force in Norwich?
There are 20,897 People in the Labor Forcein in Norwich.
What is the Percentage of People in the Labor Force in Norwich?
63.8% of People are in the Labor Force in Norwich.
What is the Unemployment Rate in Norwich?
Unemployment Rate in Norwich is 7.0%.