Cities with the Highest Percentage of French Population in Connecticut
RELATED REPORTS & OPTIONS
French
Connecticut
Compare Cities
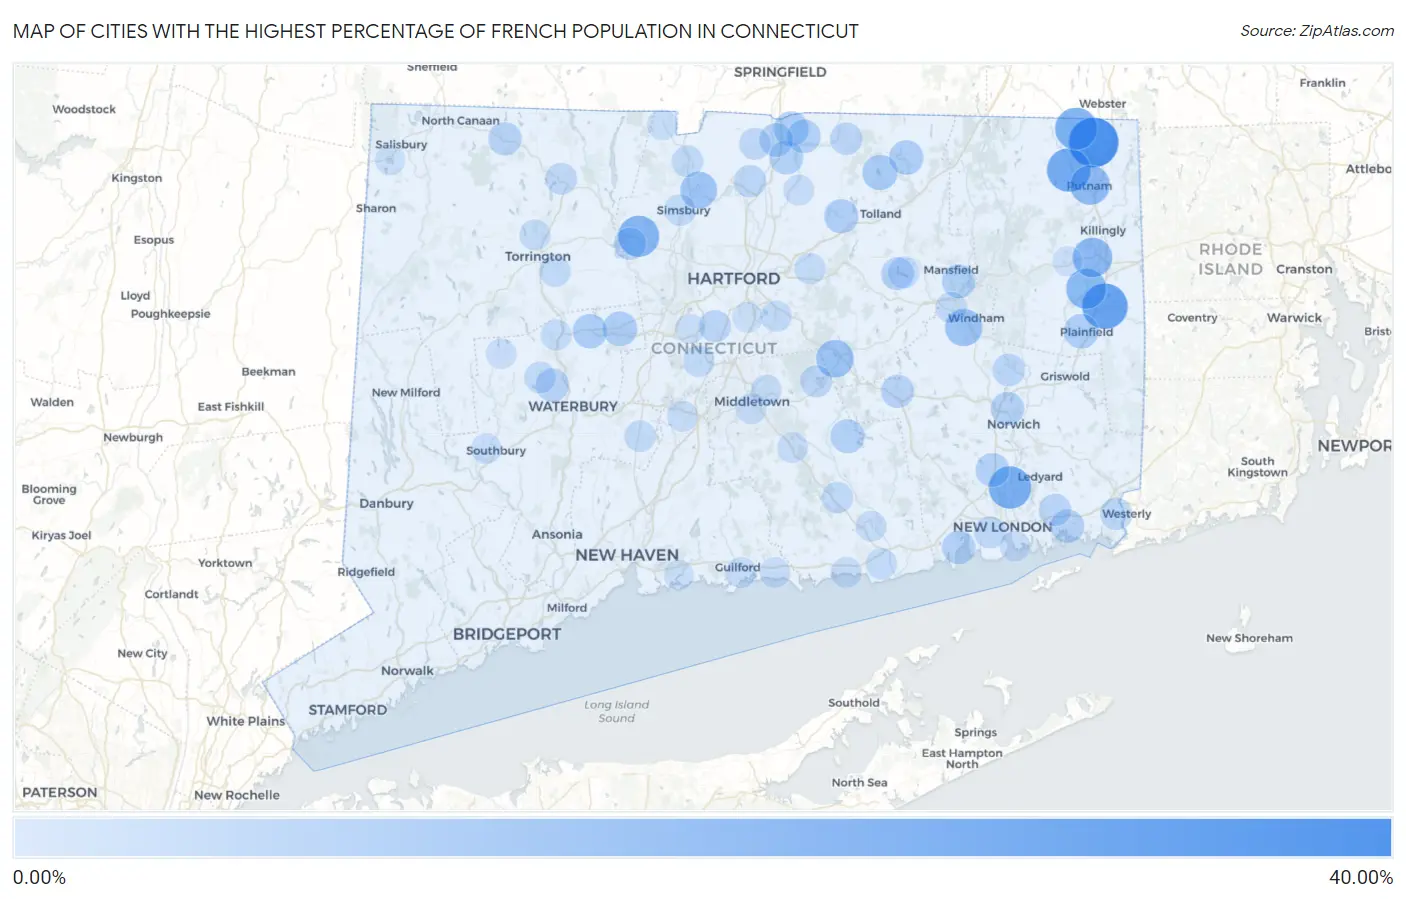
Map of Cities with the Highest Percentage of French Population in Connecticut
0.00%
40.00%
Cities with the Highest Percentage of French Population in Connecticut
| City | French | vs State | vs National | |
| 1. | North Grosvenor Dale | 36.53% | 4.18%(+32.4)#1 | 2.07%(+34.5)#57 |
| 2. | Moosup | 29.48% | 4.18%(+25.3)#2 | 2.07%(+27.4)#107 |
| 3. | South Woodstock | 26.02% | 4.18%(+21.8)#3 | 2.07%(+24.0)#165 |
| 4. | Gales Ferry | 24.26% | 4.18%(+20.1)#4 | 2.07%(+22.2)#192 |
| 5. | Quinebaug | 23.78% | 4.18%(+19.6)#5 | 2.07%(+21.7)#208 |
| 6. | Canton Valley | 21.90% | 4.18%(+17.7)#6 | 2.07%(+19.8)#259 |
| 7. | Wauregan | 20.27% | 4.18%(+16.1)#7 | 2.07%(+18.2)#319 |
| 8. | East Brooklyn | 19.36% | 4.18%(+15.2)#8 | 2.07%(+17.3)#347 |
| 9. | Putnam | 19.18% | 4.18%(+15.0)#9 | 2.07%(+17.1)#354 |
| 10. | Mechanicsville | 18.63% | 4.18%(+14.5)#10 | 2.07%(+16.6)#374 |
| 11. | Pleasant Valley | 17.26% | 4.18%(+13.1)#11 | 2.07%(+15.2)#445 |
| 12. | Brookfield Center | 17.06% | 4.18%(+12.9)#12 | 2.07%(+15.0)#458 |
| 13. | Terramuggus | 15.81% | 4.18%(+11.6)#13 | 2.07%(+13.7)#544 |
| 14. | Dodgingtown | 15.73% | 4.18%(+11.6)#14 | 2.07%(+13.7)#546 |
| 15. | South Windham | 15.23% | 4.18%(+11.0)#15 | 2.07%(+13.2)#585 |
| 16. | Tariffville | 14.59% | 4.18%(+10.4)#16 | 2.07%(+12.5)#627 |
| 17. | Dayville | 13.79% | 4.18%(+9.61)#17 | 2.07%(+11.7)#690 |
| 18. | Jewett City Borough | 13.35% | 4.18%(+9.17)#18 | 2.07%(+11.3)#730 |
| 19. | Sail Harbor | 12.59% | 4.18%(+8.41)#19 | 2.07%(+10.5)#812 |
| 20. | Lake Chaffee | 11.96% | 4.18%(+7.78)#20 | 2.07%(+9.89)#882 |
| 21. | Crystal Lake | 11.83% | 4.18%(+7.65)#21 | 2.07%(+9.76)#896 |
| 22. | Redding Center | 11.24% | 4.18%(+7.06)#22 | 2.07%(+9.17)#964 |
| 23. | Sherwood Manor | 11.15% | 4.18%(+6.97)#23 | 2.07%(+9.08)#972 |
| 24. | Plainfield Village | 10.97% | 4.18%(+6.79)#24 | 2.07%(+8.90)#1,007 |
| 25. | Bristol | 10.90% | 4.18%(+6.72)#25 | 2.07%(+8.83)#1,021 |
| 26. | Stafford Springs | 10.63% | 4.18%(+6.45)#26 | 2.07%(+8.57)#1,063 |
| 27. | Terryville | 10.58% | 4.18%(+6.40)#27 | 2.07%(+8.52)#1,073 |
| 28. | Rockville | 10.23% | 4.18%(+6.05)#28 | 2.07%(+8.16)#1,131 |
| 29. | Moodus | 9.90% | 4.18%(+5.72)#29 | 2.07%(+7.84)#1,186 |
| 30. | Stratford Downtown | 9.80% | 4.18%(+5.62)#30 | 2.07%(+7.73)#1,200 |
| 31. | Southwood Acres | 9.57% | 4.18%(+5.39)#31 | 2.07%(+7.51)#1,236 |
| 32. | Hazardville | 9.55% | 4.18%(+5.37)#32 | 2.07%(+7.49)#1,240 |
| 33. | Oxoboxo River | 9.55% | 4.18%(+5.37)#33 | 2.07%(+7.48)#1,241 |
| 34. | Taylor Corners | 9.54% | 4.18%(+5.36)#34 | 2.07%(+7.47)#1,247 |
| 35. | Mansfield Center | 9.52% | 4.18%(+5.34)#35 | 2.07%(+7.46)#1,250 |
| 36. | Thompsonville | 9.24% | 4.18%(+5.06)#36 | 2.07%(+7.17)#1,317 |
| 37. | Mystic | 9.21% | 4.18%(+5.03)#37 | 2.07%(+7.15)#1,323 |
| 38. | Niantic | 9.04% | 4.18%(+4.86)#38 | 2.07%(+6.97)#1,370 |
| 39. | Norwich | 8.99% | 4.18%(+4.81)#39 | 2.07%(+6.92)#1,380 |
| 40. | Norfolk | 8.74% | 4.18%(+4.56)#40 | 2.07%(+6.68)#1,432 |
| 41. | Oakville | 8.45% | 4.18%(+4.27)#41 | 2.07%(+6.38)#1,499 |
| 42. | Colchester | 8.34% | 4.18%(+4.16)#42 | 2.07%(+6.27)#1,532 |
| 43. | Bantam Borough | 8.18% | 4.18%(+4.00)#43 | 2.07%(+6.11)#1,583 |
| 44. | Coventry Lake | 7.94% | 4.18%(+3.76)#44 | 2.07%(+5.87)#1,657 |
| 45. | Danielson Borough | 7.71% | 4.18%(+3.53)#45 | 2.07%(+5.65)#1,718 |
| 46. | Baltic | 7.65% | 4.18%(+3.47)#46 | 2.07%(+5.59)#1,739 |
| 47. | Old Mystic | 7.33% | 4.18%(+3.15)#47 | 2.07%(+5.26)#1,829 |
| 48. | Pawcatuck | 7.31% | 4.18%(+3.13)#48 | 2.07%(+5.24)#1,839 |
| 49. | Collinsville | 7.31% | 4.18%(+3.13)#49 | 2.07%(+5.24)#1,840 |
| 50. | Knollcrest | 7.28% | 4.18%(+3.11)#50 | 2.07%(+5.22)#1,852 |
| 51. | Windsor Locks | 7.27% | 4.18%(+3.09)#51 | 2.07%(+5.20)#1,858 |
| 52. | Somers | 7.22% | 4.18%(+3.04)#52 | 2.07%(+5.15)#1,872 |
| 53. | Lake Bungee | 7.18% | 4.18%(+3.00)#53 | 2.07%(+5.12)#1,892 |
| 54. | Newington | 6.83% | 4.18%(+2.65)#54 | 2.07%(+4.76)#2,036 |
| 55. | Lake Pocotopaug | 6.68% | 4.18%(+2.50)#55 | 2.07%(+4.61)#2,105 |
| 56. | Suffield Depot | 6.42% | 4.18%(+2.24)#56 | 2.07%(+4.35)#2,246 |
| 57. | Poplar Plains | 6.36% | 4.18%(+2.18)#57 | 2.07%(+4.29)#2,280 |
| 58. | Waterford | 6.29% | 4.18%(+2.11)#58 | 2.07%(+4.22)#2,320 |
| 59. | Stonington Borough | 6.26% | 4.18%(+2.08)#59 | 2.07%(+4.20)#2,336 |
| 60. | Winsted | 6.25% | 4.18%(+2.07)#60 | 2.07%(+4.18)#2,338 |
| 61. | Watertown | 6.08% | 4.18%(+1.90)#61 | 2.07%(+4.02)#2,435 |
| 62. | Salmon Brook | 5.95% | 4.18%(+1.77)#62 | 2.07%(+3.89)#2,510 |
| 63. | Kensington | 5.86% | 4.18%(+1.68)#63 | 2.07%(+3.79)#2,565 |
| 64. | South Coventry | 5.79% | 4.18%(+1.61)#64 | 2.07%(+3.72)#2,609 |
| 65. | Simsbury Center | 5.78% | 4.18%(+1.60)#65 | 2.07%(+3.71)#2,623 |
| 66. | Northwest Harwinton | 5.75% | 4.18%(+1.57)#66 | 2.07%(+3.68)#2,640 |
| 67. | Chester Center | 5.61% | 4.18%(+1.43)#67 | 2.07%(+3.54)#2,736 |
| 68. | Cheshire Village | 5.60% | 4.18%(+1.42)#68 | 2.07%(+3.53)#2,742 |
| 69. | Willimantic | 5.48% | 4.18%(+1.30)#69 | 2.07%(+3.42)#2,802 |
| 70. | Manchester | 5.39% | 4.18%(+1.21)#70 | 2.07%(+3.32)#2,869 |
| 71. | Old Saybrook Center | 5.35% | 4.18%(+1.17)#71 | 2.07%(+3.29)#2,899 |
| 72. | Inglenook | 5.18% | 4.18%(+0.996)#72 | 2.07%(+3.11)#3,037 |
| 73. | Thomaston | 5.08% | 4.18%(+0.899)#73 | 2.07%(+3.01)#3,127 |
| 74. | Newtown Borough | 5.05% | 4.18%(+0.874)#74 | 2.07%(+2.99)#3,152 |
| 75. | Glastonbury Center | 5.05% | 4.18%(+0.871)#75 | 2.07%(+2.98)#3,155 |
| 76. | Torrington | 5.01% | 4.18%(+0.827)#76 | 2.07%(+2.94)#3,190 |
| 77. | Meriden | 4.93% | 4.18%(+0.751)#77 | 2.07%(+2.86)#3,280 |
| 78. | Middletown | 4.88% | 4.18%(+0.699)#78 | 2.07%(+2.81)#3,324 |
| 79. | Cornwall | 4.82% | 4.18%(+0.640)#79 | 2.07%(+2.75)#3,383 |
| 80. | Sandy Hook | 4.80% | 4.18%(+0.620)#80 | 2.07%(+2.73)#3,393 |
| 81. | Westbrook Center | 4.75% | 4.18%(+0.568)#81 | 2.07%(+2.68)#3,442 |
| 82. | Woodmont Borough | 4.63% | 4.18%(+0.453)#82 | 2.07%(+2.57)#3,569 |
| 83. | Portland | 4.58% | 4.18%(+0.402)#83 | 2.07%(+2.52)#3,630 |
| 84. | Essex Village | 4.55% | 4.18%(+0.371)#84 | 2.07%(+2.48)#3,663 |
| 85. | Higganum | 4.55% | 4.18%(+0.368)#85 | 2.07%(+2.48)#3,665 |
| 86. | Broad Brook | 4.54% | 4.18%(+0.363)#86 | 2.07%(+2.48)#3,681 |
| 87. | Guilford Center | 4.53% | 4.18%(+0.346)#87 | 2.07%(+2.46)#3,702 |
| 88. | Madison Center | 4.43% | 4.18%(+0.247)#88 | 2.07%(+2.36)#3,828 |
| 89. | Stepney | 4.38% | 4.18%(+0.202)#89 | 2.07%(+2.32)#3,880 |
| 90. | North Granby | 4.24% | 4.18%(+0.062)#90 | 2.07%(+2.18)#4,042 |
| 91. | Heritage Village | 4.24% | 4.18%(+0.060)#91 | 2.07%(+2.17)#4,044 |
| 92. | Naugatuck Borough | 4.19% | 4.18%(+0.006)#92 | 2.07%(+2.12)#4,116 |
| 93. | Bethlehem Village | 4.18% | 4.18%(+0.005)#93 | 2.07%(+2.12)#4,119 |
| 94. | New Canaan | 4.18% | 4.18%(+0.002)#94 | 2.07%(+2.12)#4,124 |
| 95. | Groton | 3.96% | 4.18%(-0.218)#95 | 2.07%(+1.90)#4,475 |
| 96. | Wethersfield | 3.86% | 4.18%(-0.318)#96 | 2.07%(+1.79)#4,622 |
| 97. | Branford Center | 3.77% | 4.18%(-0.406)#97 | 2.07%(+1.71)#4,780 |
| 98. | New Britain | 3.70% | 4.18%(-0.475)#98 | 2.07%(+1.64)#4,903 |
| 99. | Lakeville | 3.61% | 4.18%(-0.568)#99 | 2.07%(+1.55)#5,096 |
| 100. | Brooklyn | 3.61% | 4.18%(-0.568)#100 | 2.07%(+1.55)#5,097 |
Common Questions
What are the Top 10 Cities with the Highest Percentage of French Population in Connecticut?
Top 10 Cities with the Highest Percentage of French Population in Connecticut are:
#1
36.53%
#2
29.48%
#3
26.02%
#4
24.26%
#5
23.78%
#6
21.90%
#7
20.27%
#8
19.36%
#9
19.18%
#10
15.81%
What city has the Highest Percentage of French Population in Connecticut?
North Grosvenor Dale has the Highest Percentage of French Population in Connecticut with 36.53%.
What is the Percentage of French Population in the State of Connecticut?
Percentage of French Population in Connecticut is 4.18%.
What is the Percentage of French Population in the United States?
Percentage of French Population in the United States is 2.07%.