Groton, CT Map & Demographics
Groton Map
Groton Overview
$40,702
PER CAPITA INCOME
$83,472
AVG FAMILY INCOME
$64,611
AVG HOUSEHOLD INCOME
38.2%
WAGE / INCOME GAP [ % ]
61.8¢/ $1
WAGE / INCOME GAP [ $ ]
0.46
INEQUALITY / GINI INDEX
9,364
TOTAL POPULATION
5,015
MALE POPULATION
4,349
FEMALE POPULATION
115.31
MALES / 100 FEMALES
86.72
FEMALES / 100 MALES
38.0
MEDIAN AGE
2.7
AVG FAMILY SIZE
2.0
AVG HOUSEHOLD SIZE
5,719
LABOR FORCE [ PEOPLE ]
72.0%
PERCENT IN LABOR FORCE
6.1%
UNEMPLOYMENT RATE
Groton Zip Codes
Groton Area Codes
Income in Groton
Income Overview in Groton
Per Capita Income in Groton is $40,702, while median incomes of families and households are $83,472 and $64,611 respectively.
| Characteristic | Number | Measure |
| Per Capita Income | 9,364 | $40,702 |
| Median Family Income | 2,407 | $83,472 |
| Mean Family Income | 2,407 | $97,286 |
| Median Household Income | 4,690 | $64,611 |
| Mean Household Income | 4,690 | $80,810 |
| Income Deficit | 2,407 | $0 |
| Wage / Income Gap (%) | 9,364 | 38.22% |
| Wage / Income Gap ($) | 9,364 | 61.78¢ per $1 |
| Gini / Inequality Index | 9,364 | 0.46 |
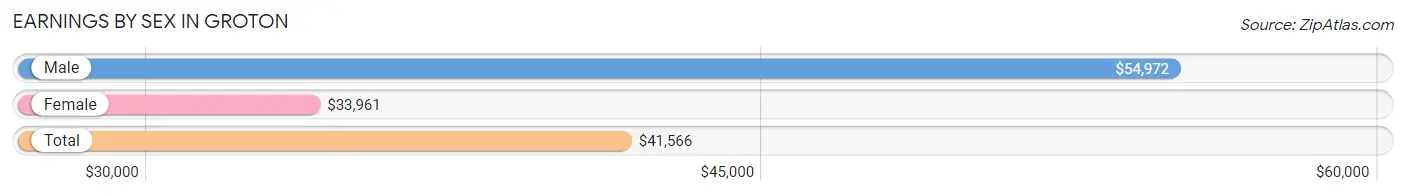
Earnings by Sex in Groton
Average Earnings in Groton are $41,566, $54,972 for men and $33,961 for women, a difference of 38.2%.
| Sex | Number | Average Earnings |
| Male | 3,178 (55.0%) | $54,972 |
| Female | 2,601 (45.0%) | $33,961 |
| Total | 5,779 (100.0%) | $41,566 |
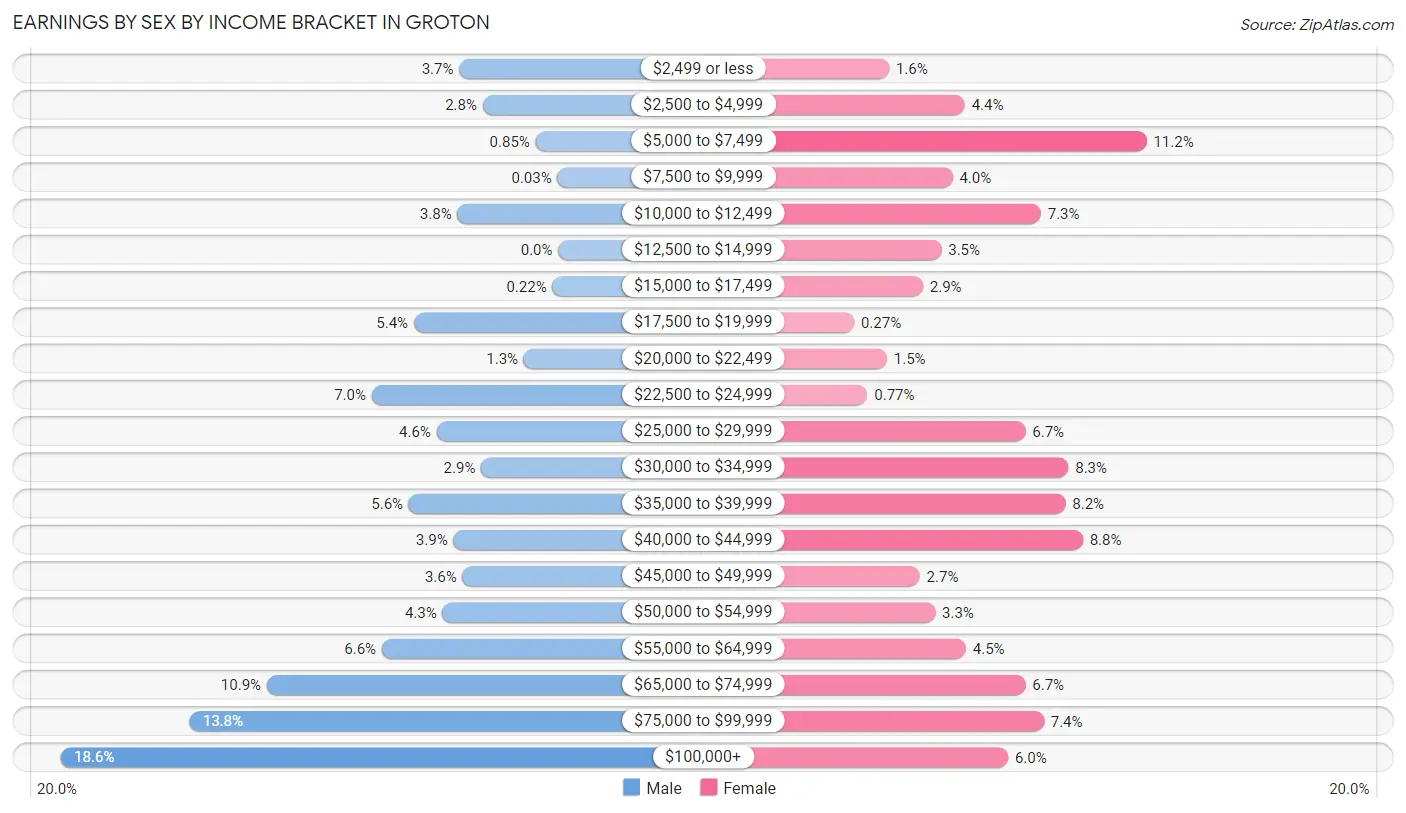
Earnings by Sex by Income Bracket in Groton
The most common earnings brackets in Groton are $100,000+ for men (592 | 18.6%) and $5,000 to $7,499 for women (292 | 11.2%).
| Income | Male | Female |
| $2,499 or less | 118 (3.7%) | 41 (1.6%) |
| $2,500 to $4,999 | 90 (2.8%) | 115 (4.4%) |
| $5,000 to $7,499 | 27 (0.9%) | 292 (11.2%) |
| $7,500 to $9,999 | 1 (0.0%) | 103 (4.0%) |
| $10,000 to $12,499 | 120 (3.8%) | 189 (7.3%) |
| $12,500 to $14,999 | 0 (0.0%) | 92 (3.5%) |
| $15,000 to $17,499 | 7 (0.2%) | 74 (2.9%) |
| $17,500 to $19,999 | 172 (5.4%) | 7 (0.3%) |
| $20,000 to $22,499 | 41 (1.3%) | 39 (1.5%) |
| $22,500 to $24,999 | 222 (7.0%) | 20 (0.8%) |
| $25,000 to $29,999 | 145 (4.6%) | 174 (6.7%) |
| $30,000 to $34,999 | 92 (2.9%) | 216 (8.3%) |
| $35,000 to $39,999 | 178 (5.6%) | 213 (8.2%) |
| $40,000 to $44,999 | 125 (3.9%) | 230 (8.8%) |
| $45,000 to $49,999 | 114 (3.6%) | 71 (2.7%) |
| $50,000 to $54,999 | 138 (4.3%) | 86 (3.3%) |
| $55,000 to $64,999 | 210 (6.6%) | 116 (4.5%) |
| $65,000 to $74,999 | 347 (10.9%) | 174 (6.7%) |
| $75,000 to $99,999 | 439 (13.8%) | 192 (7.4%) |
| $100,000+ | 592 (18.6%) | 157 (6.0%) |
| Total | 3,178 (100.0%) | 2,601 (100.0%) |
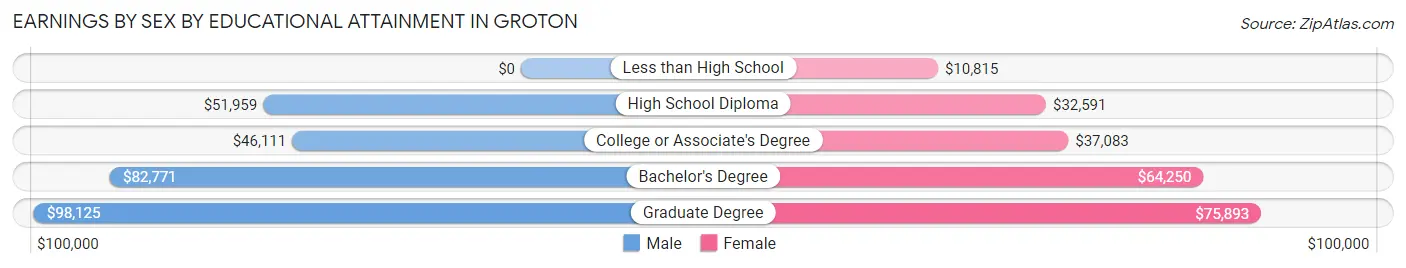
Earnings by Sex by Educational Attainment in Groton
Average earnings in Groton are $64,342 for men and $35,819 for women, a difference of 44.3%. Men with an educational attainment of graduate degree enjoy the highest average annual earnings of $98,125, while those with college or associate's degree education earn the least with $46,111. Women with an educational attainment of graduate degree earn the most with the average annual earnings of $75,893, while those with less than high school education have the smallest earnings of $10,815.
| Educational Attainment | Male Income | Female Income |
| Less than High School | - | - |
| High School Diploma | $51,959 | $32,591 |
| College or Associate's Degree | $46,111 | $37,083 |
| Bachelor's Degree | $82,771 | $64,250 |
| Graduate Degree | $98,125 | $75,893 |
| Total | $64,342 | $35,819 |
Family Income in Groton
Family Income Brackets in Groton
According to the Groton family income data, there are 424 families falling into the $100,000 to $149,999 income range, which is the most common income bracket and makes up 17.6% of all families. Conversely, the less than $10,000 income bracket is the least frequent group with only 94 families (3.9%) belonging to this category.
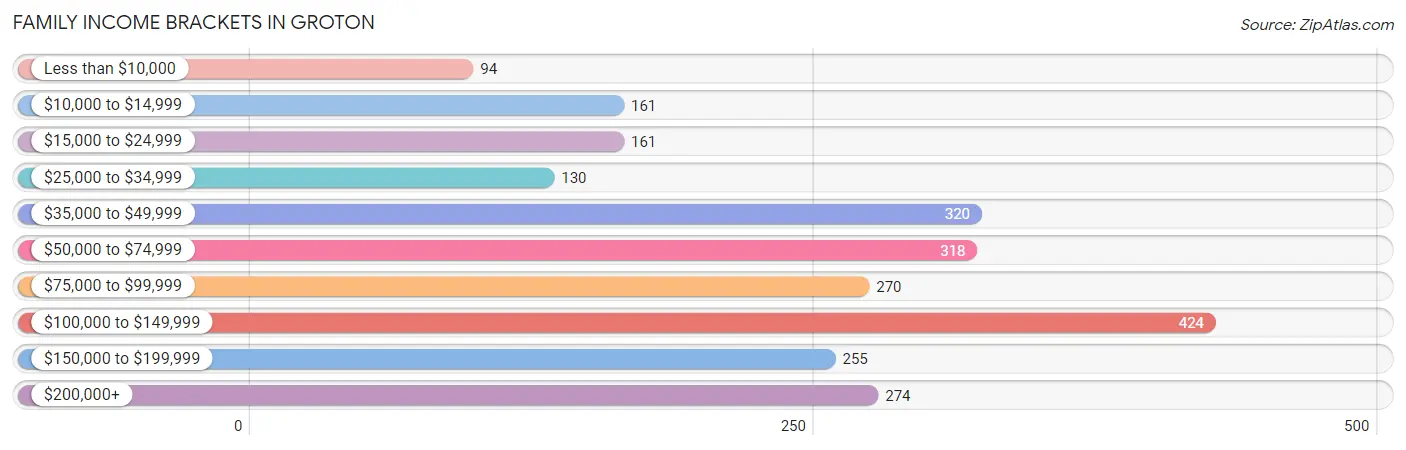
| Income Bracket | # Families | % Families |
| Less than $10,000 | 94 | 3.9% |
| $10,000 to $14,999 | 161 | 6.7% |
| $15,000 to $24,999 | 161 | 6.7% |
| $25,000 to $34,999 | 130 | 5.4% |
| $35,000 to $49,999 | 320 | 13.3% |
| $50,000 to $74,999 | 318 | 13.2% |
| $75,000 to $99,999 | 270 | 11.2% |
| $100,000 to $149,999 | 424 | 17.6% |
| $150,000 to $199,999 | 255 | 10.6% |
| $200,000+ | 274 | 11.4% |
Family Income by Famaliy Size in Groton
6-person families (41 | 1.7%) account for the highest median family income in Groton with $193,750 per family, while 3-person families (511 | 21.2%) have the highest median income of $32,479 per family member.
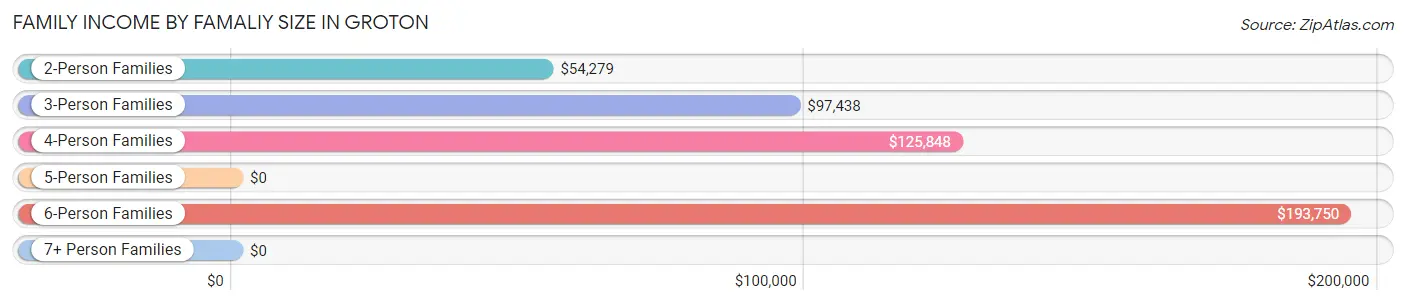
| Income Bracket | # Families | Median Income |
| 2-Person Families | 1,433 (59.5%) | $54,279 |
| 3-Person Families | 511 (21.2%) | $97,438 |
| 4-Person Families | 283 (11.8%) | $125,848 |
| 5-Person Families | 139 (5.8%) | $0 |
| 6-Person Families | 41 (1.7%) | $193,750 |
| 7+ Person Families | 0 (0.0%) | $0 |
| Total | 2,407 (100.0%) | $83,472 |
Family Income by Number of Earners in Groton
The median family income in Groton is $83,472, with families comprising 3+ earners (341) having the highest median family income of $193,565, while families with 1 earner (808) have the lowest median family income of $40,606, accounting for 14.2% and 33.6% of families, respectively.
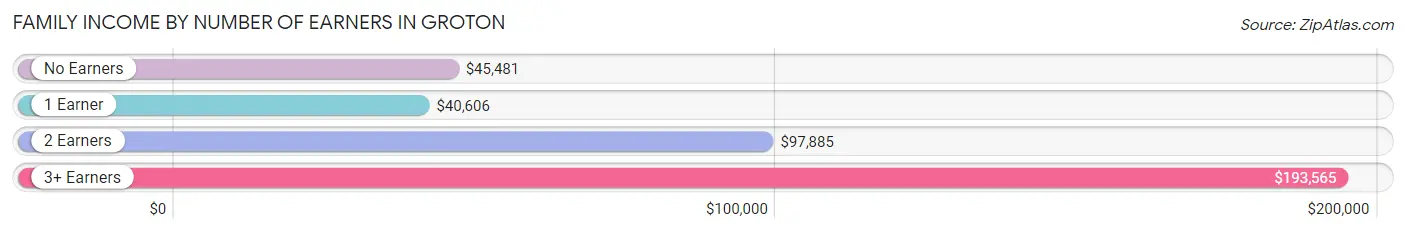
| Number of Earners | # Families | Median Income |
| No Earners | 364 (15.1%) | $45,481 |
| 1 Earner | 808 (33.6%) | $40,606 |
| 2 Earners | 894 (37.1%) | $97,885 |
| 3+ Earners | 341 (14.2%) | $193,565 |
| Total | 2,407 (100.0%) | $83,472 |
Household Income in Groton
Household Income Brackets in Groton
With 779 households falling in the category, the $75,000 to $99,999 income range is the most frequent in Groton, accounting for 16.6% of all households. In contrast, only 263 households (5.6%) fall into the $10,000 to $14,999 income bracket, making it the least populous group.
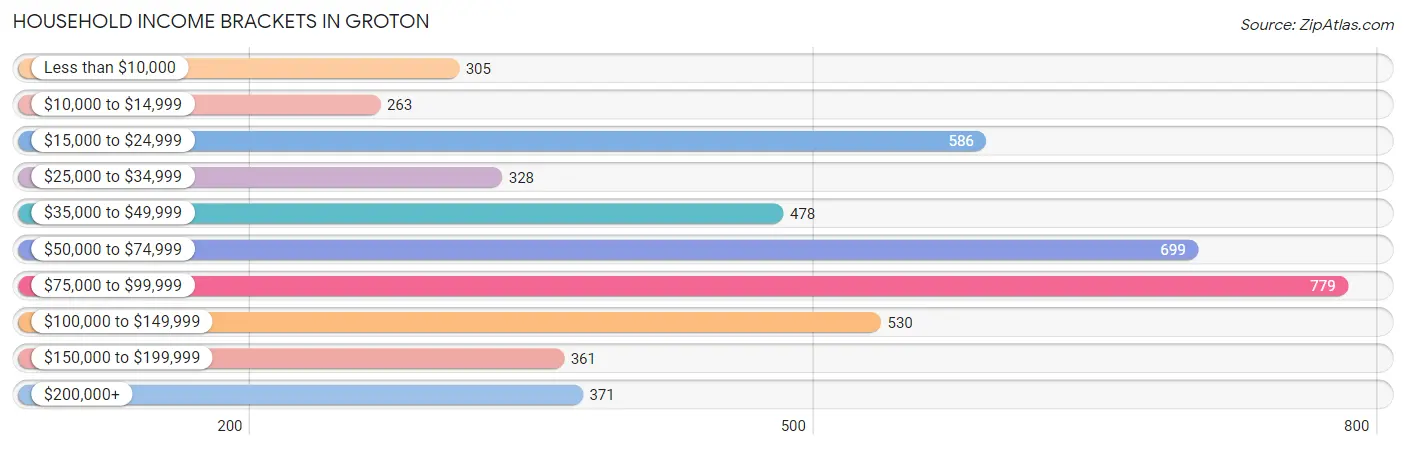
| Income Bracket | # Households | % Households |
| Less than $10,000 | 305 | 6.5% |
| $10,000 to $14,999 | 263 | 5.6% |
| $15,000 to $24,999 | 586 | 12.5% |
| $25,000 to $34,999 | 328 | 7.0% |
| $35,000 to $49,999 | 478 | 10.2% |
| $50,000 to $74,999 | 699 | 14.9% |
| $75,000 to $99,999 | 779 | 16.6% |
| $100,000 to $149,999 | 530 | 11.3% |
| $150,000 to $199,999 | 361 | 7.7% |
| $200,000+ | 371 | 7.9% |
Household Income by Householder Age in Groton
The median household income in Groton is $64,611, with the highest median household income of $78,457 found in the 45 to 64 years age bracket for the primary householder. A total of 1,790 households (38.2%) fall into this category. Meanwhile, the 15 to 24 years age bracket for the primary householder has the lowest median household income of $0, with 308 households (6.6%) in this group.
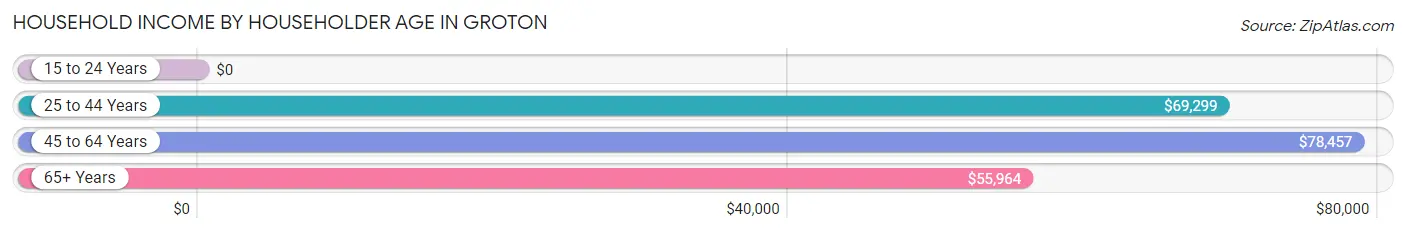
| Income Bracket | # Households | Median Income |
| 15 to 24 Years | 308 (6.6%) | $0 |
| 25 to 44 Years | 1,607 (34.3%) | $69,299 |
| 45 to 64 Years | 1,790 (38.2%) | $78,457 |
| 65+ Years | 985 (21.0%) | $55,964 |
| Total | 4,690 (100.0%) | $64,611 |
Poverty in Groton
Income Below Poverty by Sex and Age in Groton
With 15.3% poverty level for males and 17.1% for females among the residents of Groton, 6 to 11 year old males and 12 to 14 year old females are the most vulnerable to poverty, with 135 males (51.1%) and 120 females (71.4%) in their respective age groups living below the poverty level.
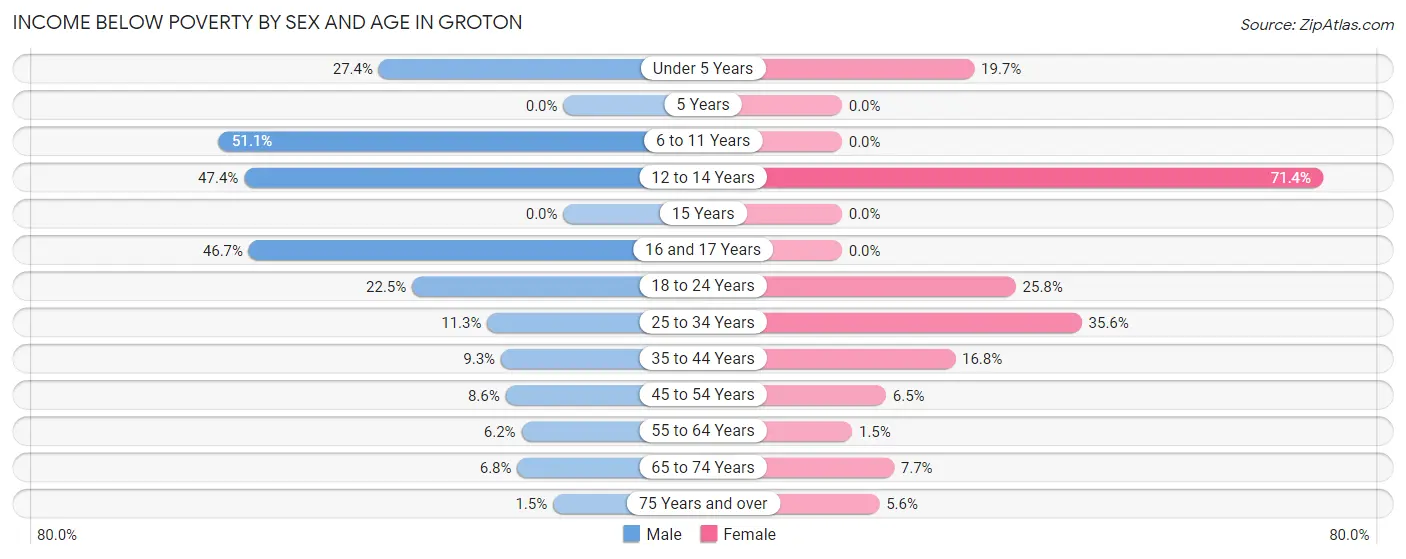
| Age Bracket | Male | Female |
| Under 5 Years | 71 (27.4%) | 34 (19.7%) |
| 5 Years | 0 (0.0%) | 0 (0.0%) |
| 6 to 11 Years | 135 (51.1%) | 0 (0.0%) |
| 12 to 14 Years | 82 (47.4%) | 120 (71.4%) |
| 15 Years | 0 (0.0%) | 0 (0.0%) |
| 16 and 17 Years | 85 (46.7%) | 0 (0.0%) |
| 18 to 24 Years | 106 (22.5%) | 120 (25.8%) |
| 25 to 34 Years | 106 (11.3%) | 297 (35.6%) |
| 35 to 44 Years | 48 (9.3%) | 73 (16.8%) |
| 45 to 54 Years | 46 (8.6%) | 35 (6.5%) |
| 55 to 64 Years | 62 (6.2%) | 10 (1.5%) |
| 65 to 74 Years | 19 (6.8%) | 34 (7.7%) |
| 75 Years and over | 4 (1.5%) | 20 (5.6%) |
| Total | 764 (15.3%) | 743 (17.1%) |
Income Above Poverty by Sex and Age in Groton
According to the poverty statistics in Groton, males aged 5 years and females aged 5 years are the age groups that are most secure financially, with 100.0% of males and 100.0% of females in these age groups living above the poverty line.
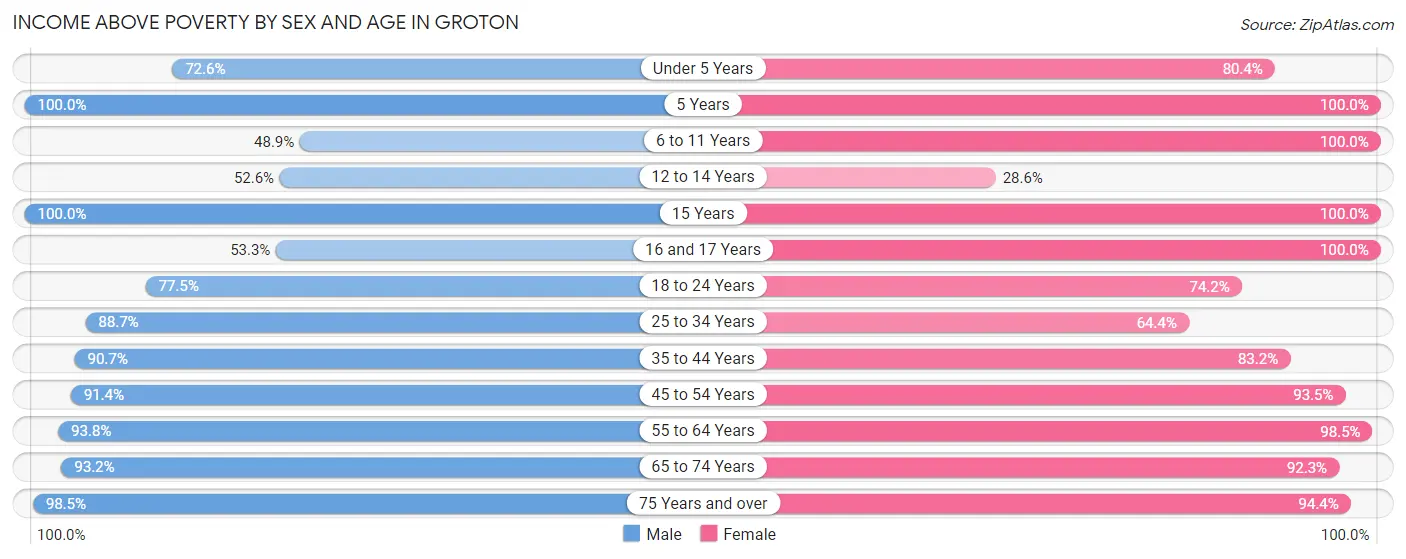
| Age Bracket | Male | Female |
| Under 5 Years | 188 (72.6%) | 139 (80.3%) |
| 5 Years | 86 (100.0%) | 69 (100.0%) |
| 6 to 11 Years | 129 (48.9%) | 145 (100.0%) |
| 12 to 14 Years | 91 (52.6%) | 48 (28.6%) |
| 15 Years | 31 (100.0%) | 29 (100.0%) |
| 16 and 17 Years | 97 (53.3%) | 28 (100.0%) |
| 18 to 24 Years | 366 (77.5%) | 345 (74.2%) |
| 25 to 34 Years | 833 (88.7%) | 537 (64.4%) |
| 35 to 44 Years | 470 (90.7%) | 361 (83.2%) |
| 45 to 54 Years | 490 (91.4%) | 500 (93.5%) |
| 55 to 64 Years | 935 (93.8%) | 647 (98.5%) |
| 65 to 74 Years | 259 (93.2%) | 406 (92.3%) |
| 75 Years and over | 258 (98.5%) | 340 (94.4%) |
| Total | 4,233 (84.7%) | 3,594 (82.9%) |
Income Below Poverty Among Married-Couple Families in Groton
The poverty statistics for married-couple families in Groton show that 1.9% or 25 of the total 1,298 families live below the poverty line. Families with no children have the highest poverty rate of 2.8%, comprising of 25 families. On the other hand, families with 1 or 2 children have the lowest poverty rate of 0.0%, which includes 0 families.
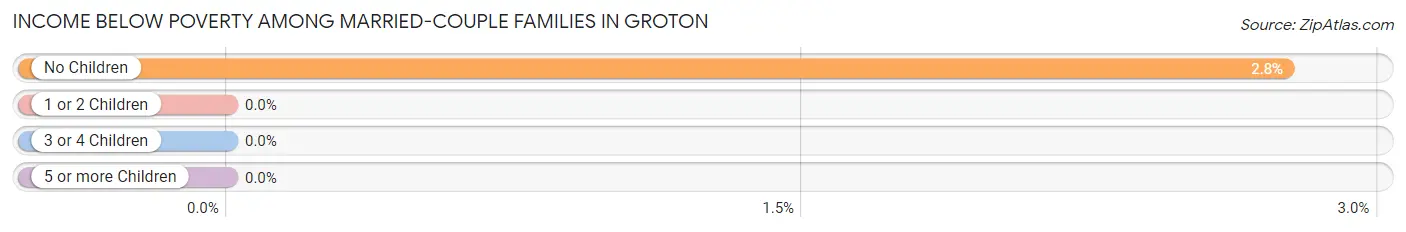
| Children | Above Poverty | Below Poverty |
| No Children | 880 (97.2%) | 25 (2.8%) |
| 1 or 2 Children | 328 (100.0%) | 0 (0.0%) |
| 3 or 4 Children | 65 (100.0%) | 0 (0.0%) |
| 5 or more Children | 0 (0.0%) | 0 (0.0%) |
| Total | 1,273 (98.1%) | 25 (1.9%) |
Income Below Poverty Among Single-Parent Households in Groton
According to the poverty data in Groton, 10.9% or 32 single-father households and 39.3% or 321 single-mother households are living below the poverty line. Among single-father households, those with 1 or 2 children have the highest poverty rate, with 32 households (34.8%) experiencing poverty. Likewise, among single-mother households, those with 3 or 4 children have the highest poverty rate, with 70 households (100.0%) falling below the poverty line.
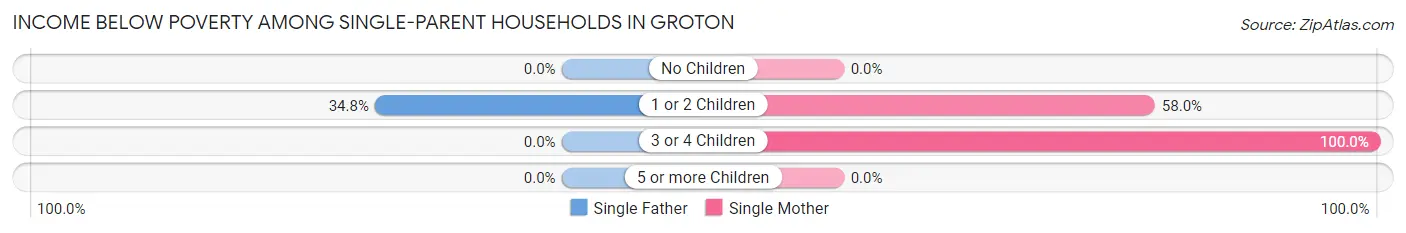
| Children | Single Father | Single Mother |
| No Children | 0 (0.0%) | 0 (0.0%) |
| 1 or 2 Children | 32 (34.8%) | 251 (58.0%) |
| 3 or 4 Children | 0 (0.0%) | 70 (100.0%) |
| 5 or more Children | 0 (0.0%) | 0 (0.0%) |
| Total | 32 (10.9%) | 321 (39.3%) |
Income Below Poverty Among Married-Couple vs Single-Parent Households in Groton
The poverty data for Groton shows that 25 of the married-couple family households (1.9%) and 353 of the single-parent households (31.8%) are living below the poverty level. Within the married-couple family households, those with no children have the highest poverty rate, with 25 households (2.8%) falling below the poverty line. Among the single-parent households, those with 3 or 4 children have the highest poverty rate, with 70 household (100.0%) living below poverty.
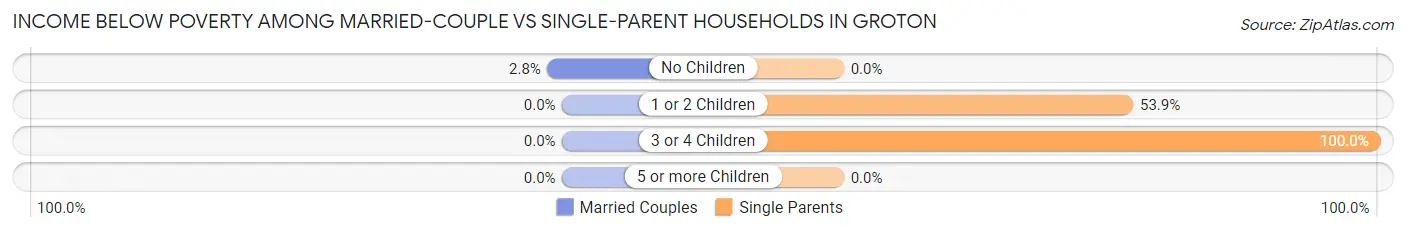
| Children | Married-Couple Families | Single-Parent Households |
| No Children | 25 (2.8%) | 0 (0.0%) |
| 1 or 2 Children | 0 (0.0%) | 283 (53.9%) |
| 3 or 4 Children | 0 (0.0%) | 70 (100.0%) |
| 5 or more Children | 0 (0.0%) | 0 (0.0%) |
| Total | 25 (1.9%) | 353 (31.8%) |
Race in Groton
The most populous races in Groton are White / Caucasian (6,616 | 70.7%), Hispanic or Latino (1,241 | 13.3%), and Two or more Races (1,066 | 11.4%).
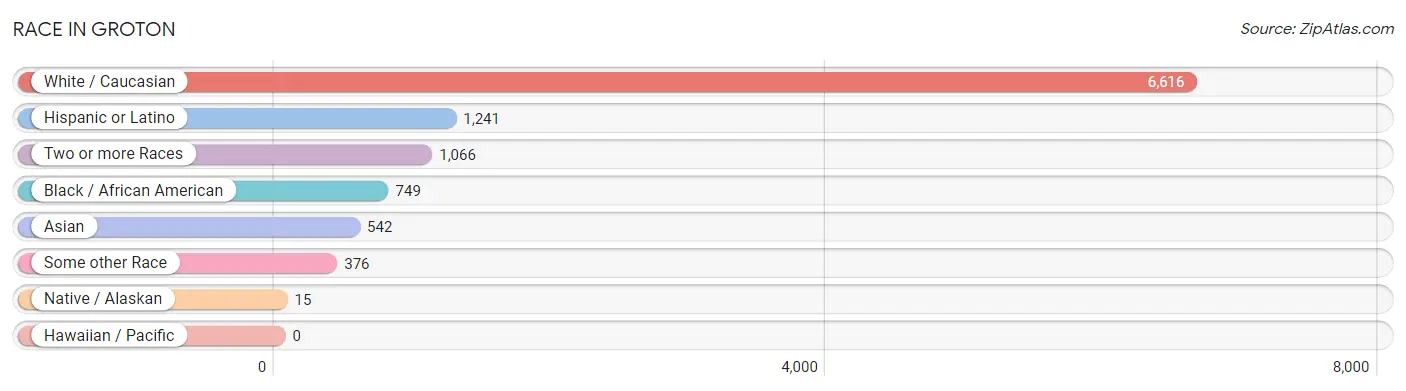
| Race | # Population | % Population |
| Asian | 542 | 5.8% |
| Black / African American | 749 | 8.0% |
| Hawaiian / Pacific | 0 | 0.0% |
| Hispanic or Latino | 1,241 | 13.3% |
| Native / Alaskan | 15 | 0.2% |
| White / Caucasian | 6,616 | 70.7% |
| Two or more Races | 1,066 | 11.4% |
| Some other Race | 376 | 4.0% |
| Total | 9,364 | 100.0% |
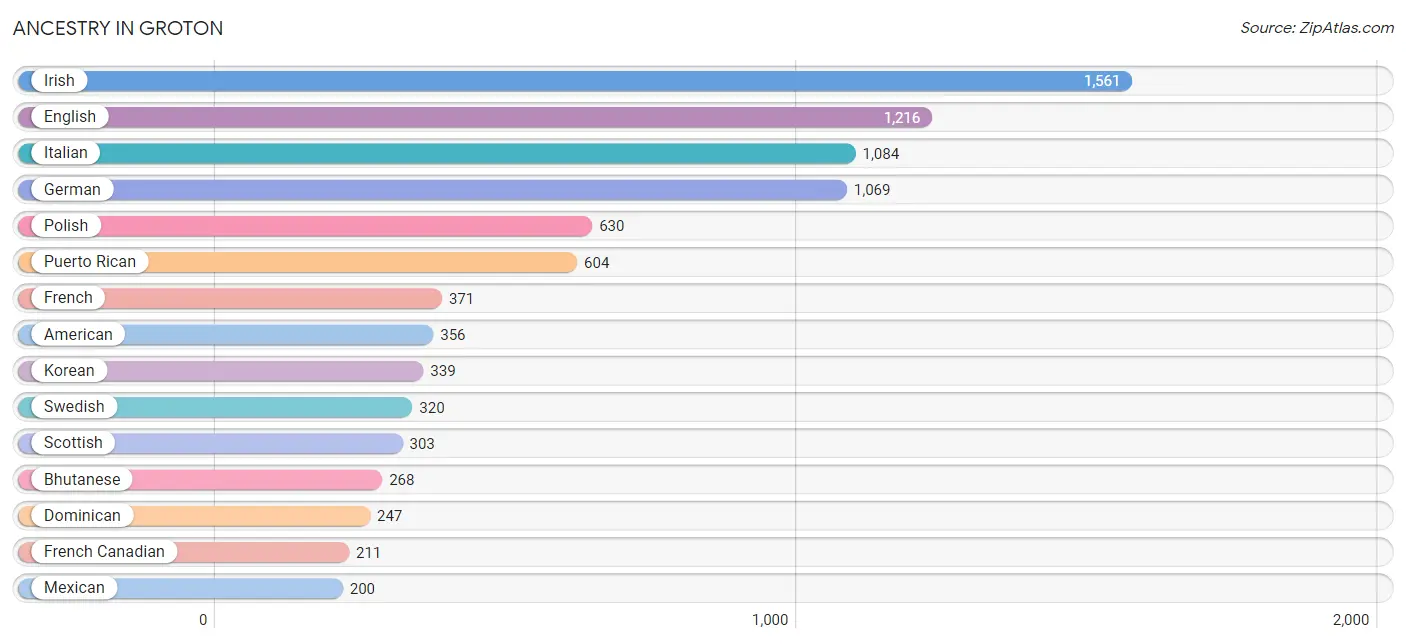
Ancestry in Groton
The most populous ancestries reported in Groton are Irish (1,561 | 16.7%), English (1,216 | 13.0%), Italian (1,084 | 11.6%), German (1,069 | 11.4%), and Polish (630 | 6.7%), together accounting for 59.4% of all Groton residents.
| Ancestry | # Population | % Population |
| African | 20 | 0.2% |
| American | 356 | 3.8% |
| Arab | 34 | 0.4% |
| Austrian | 24 | 0.3% |
| Bhutanese | 268 | 2.9% |
| Brazilian | 128 | 1.4% |
| British | 15 | 0.2% |
| Burmese | 10 | 0.1% |
| Cape Verdean | 14 | 0.2% |
| Central American | 45 | 0.5% |
| Chilean | 25 | 0.3% |
| Colombian | 16 | 0.2% |
| Cuban | 8 | 0.1% |
| Czech | 51 | 0.5% |
| Danish | 3 | 0.0% |
| Dominican | 247 | 2.6% |
| Dutch | 25 | 0.3% |
| Eastern European | 14 | 0.2% |
| Ecuadorian | 46 | 0.5% |
| English | 1,216 | 13.0% |
| Estonian | 9 | 0.1% |
| European | 34 | 0.4% |
| French | 371 | 4.0% |
| French Canadian | 211 | 2.2% |
| German | 1,069 | 11.4% |
| Greek | 41 | 0.4% |
| Guatemalan | 19 | 0.2% |
| Haitian | 33 | 0.4% |
| Hungarian | 53 | 0.6% |
| Indian (Asian) | 88 | 0.9% |
| Iranian | 27 | 0.3% |
| Irish | 1,561 | 16.7% |
| Italian | 1,084 | 11.6% |
| Jamaican | 78 | 0.8% |
| Korean | 339 | 3.6% |
| Lebanese | 10 | 0.1% |
| Lithuanian | 5 | 0.1% |
| Mexican | 200 | 2.1% |
| Northern European | 8 | 0.1% |
| Norwegian | 108 | 1.1% |
| Panamanian | 26 | 0.3% |
| Peruvian | 36 | 0.4% |
| Polish | 630 | 6.7% |
| Portuguese | 193 | 2.1% |
| Puerto Rican | 604 | 6.5% |
| Russian | 14 | 0.2% |
| Scandinavian | 4 | 0.0% |
| Scotch-Irish | 45 | 0.5% |
| Scottish | 303 | 3.2% |
| South American | 123 | 1.3% |
| Spaniard | 13 | 0.1% |
| Sri Lankan | 55 | 0.6% |
| Subsaharan African | 34 | 0.4% |
| Swedish | 320 | 3.4% |
| Swiss | 7 | 0.1% |
| Syrian | 24 | 0.3% |
| Thai | 121 | 1.3% |
| Ukrainian | 36 | 0.4% |
| Welsh | 54 | 0.6% | View All 59 Rows |
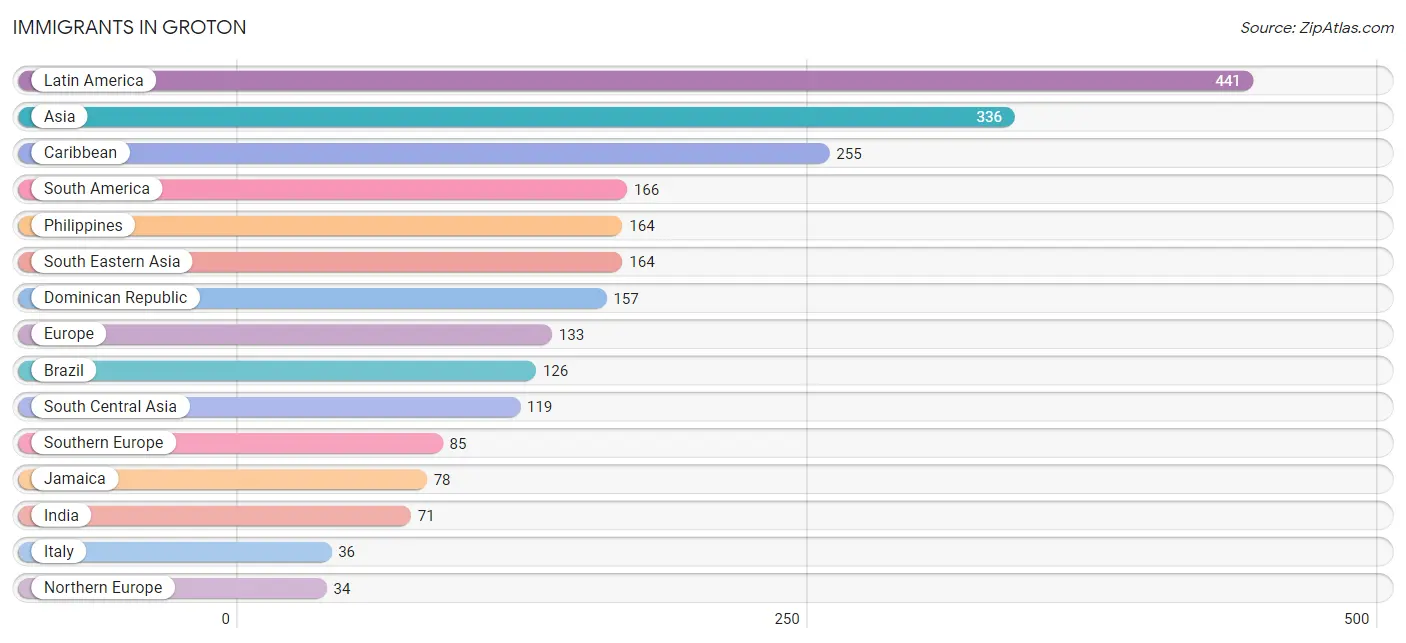
Immigrants in Groton
The most numerous immigrant groups reported in Groton came from Latin America (441 | 4.7%), Asia (336 | 3.6%), Caribbean (255 | 2.7%), South America (166 | 1.8%), and Philippines (164 | 1.8%), together accounting for 14.5% of all Groton residents.
| Immigration Origin | # Population | % Population |
| Africa | 7 | 0.1% |
| Asia | 336 | 3.6% |
| Brazil | 126 | 1.3% |
| Canada | 10 | 0.1% |
| Caribbean | 255 | 2.7% |
| Central America | 20 | 0.2% |
| Chile | 25 | 0.3% |
| China | 19 | 0.2% |
| Colombia | 3 | 0.0% |
| Dominican Republic | 157 | 1.7% |
| Eastern Asia | 29 | 0.3% |
| Eastern Europe | 14 | 0.2% |
| England | 6 | 0.1% |
| Europe | 133 | 1.4% |
| Greece | 10 | 0.1% |
| Guatemala | 5 | 0.1% |
| Haiti | 20 | 0.2% |
| Hong Kong | 9 | 0.1% |
| India | 71 | 0.8% |
| Iran | 27 | 0.3% |
| Ireland | 28 | 0.3% |
| Italy | 36 | 0.4% |
| Jamaica | 78 | 0.8% |
| Japan | 4 | 0.0% |
| Kazakhstan | 14 | 0.2% |
| Korea | 6 | 0.1% |
| Latin America | 441 | 4.7% |
| Northern Europe | 34 | 0.4% |
| Pakistan | 7 | 0.1% |
| Panama | 15 | 0.2% |
| Peru | 12 | 0.1% |
| Philippines | 164 | 1.8% |
| Poland | 14 | 0.2% |
| Portugal | 33 | 0.4% |
| South Africa | 7 | 0.1% |
| South America | 166 | 1.8% |
| South Central Asia | 119 | 1.3% |
| South Eastern Asia | 164 | 1.8% |
| Southern Europe | 85 | 0.9% |
| Spain | 6 | 0.1% |
| Syria | 24 | 0.3% |
| Western Asia | 24 | 0.3% | View All 42 Rows |
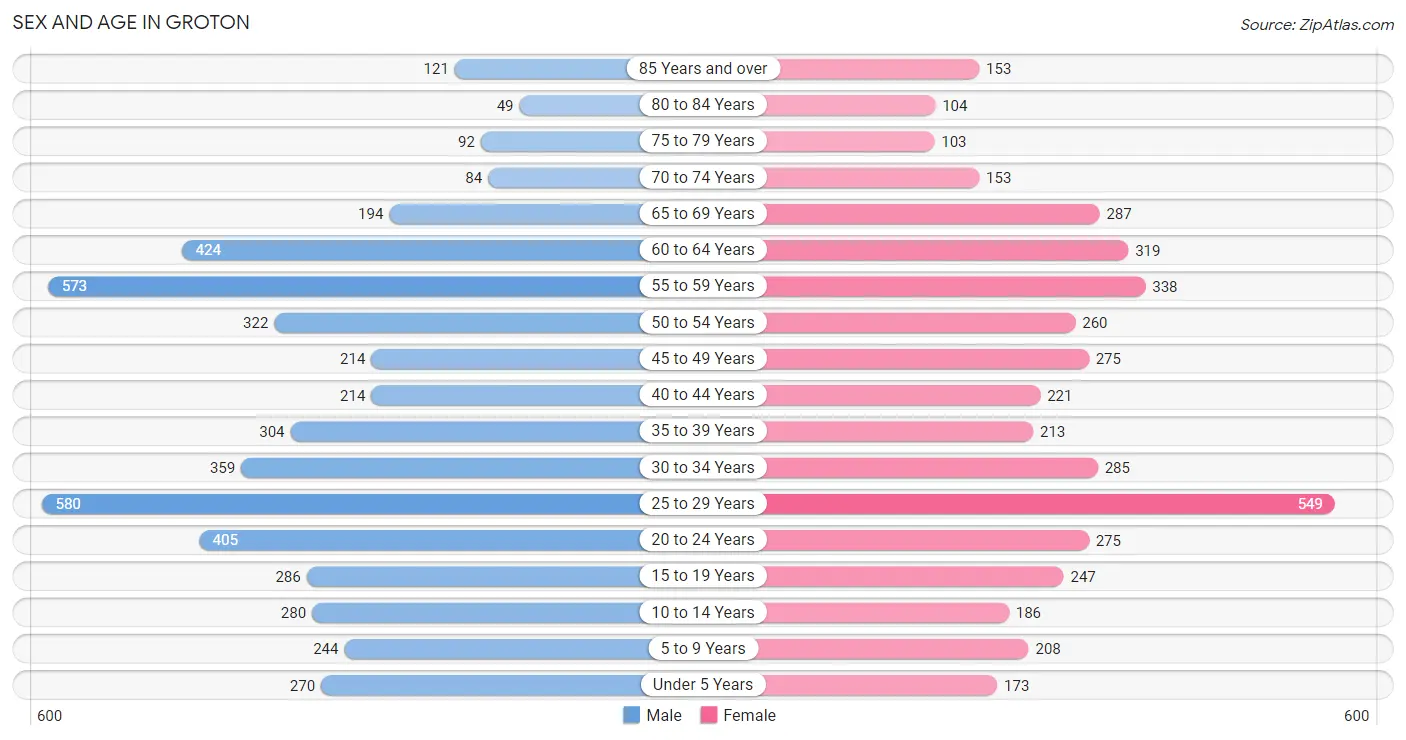
Sex and Age in Groton
Sex and Age in Groton
The most populous age groups in Groton are 25 to 29 Years (580 | 11.6%) for men and 25 to 29 Years (549 | 12.6%) for women.
| Age Bracket | Male | Female |
| Under 5 Years | 270 (5.4%) | 173 (4.0%) |
| 5 to 9 Years | 244 (4.9%) | 208 (4.8%) |
| 10 to 14 Years | 280 (5.6%) | 186 (4.3%) |
| 15 to 19 Years | 286 (5.7%) | 247 (5.7%) |
| 20 to 24 Years | 405 (8.1%) | 275 (6.3%) |
| 25 to 29 Years | 580 (11.6%) | 549 (12.6%) |
| 30 to 34 Years | 359 (7.2%) | 285 (6.6%) |
| 35 to 39 Years | 304 (6.1%) | 213 (4.9%) |
| 40 to 44 Years | 214 (4.3%) | 221 (5.1%) |
| 45 to 49 Years | 214 (4.3%) | 275 (6.3%) |
| 50 to 54 Years | 322 (6.4%) | 260 (6.0%) |
| 55 to 59 Years | 573 (11.4%) | 338 (7.8%) |
| 60 to 64 Years | 424 (8.5%) | 319 (7.3%) |
| 65 to 69 Years | 194 (3.9%) | 287 (6.6%) |
| 70 to 74 Years | 84 (1.7%) | 153 (3.5%) |
| 75 to 79 Years | 92 (1.8%) | 103 (2.4%) |
| 80 to 84 Years | 49 (1.0%) | 104 (2.4%) |
| 85 Years and over | 121 (2.4%) | 153 (3.5%) |
| Total | 5,015 (100.0%) | 4,349 (100.0%) |
Families and Households in Groton
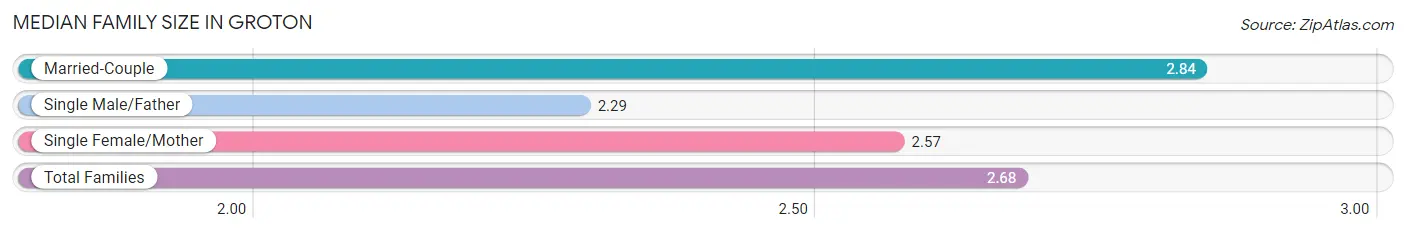
Median Family Size in Groton
The median family size in Groton is 2.68 persons per family, with married-couple families (1,298 | 53.9%) accounting for the largest median family size of 2.84 persons per family. On the other hand, single male/father families (293 | 12.2%) represent the smallest median family size with 2.29 persons per family.
| Family Type | # Families | Family Size |
| Married-Couple | 1,298 (53.9%) | 2.84 |
| Single Male/Father | 293 (12.2%) | 2.29 |
| Single Female/Mother | 816 (33.9%) | 2.57 |
| Total Families | 2,407 (100.0%) | 2.68 |
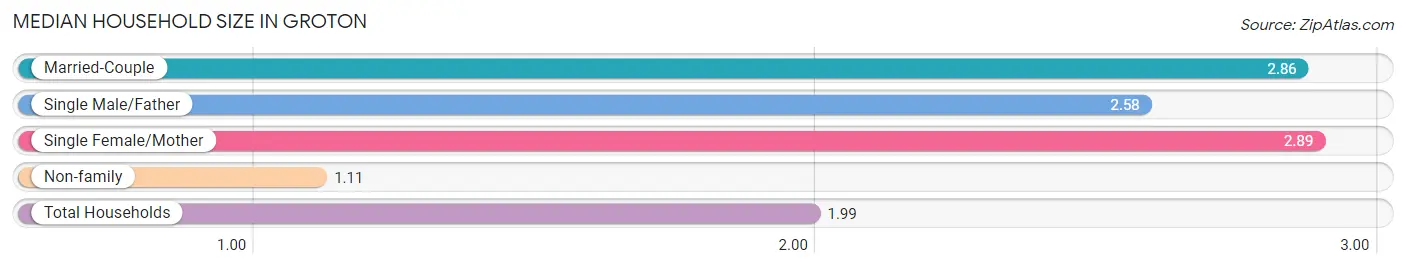
Median Household Size in Groton
The median household size in Groton is 1.99 persons per household, with single female/mother households (816 | 17.4%) accounting for the largest median household size of 2.89 persons per household. non-family households (2,283 | 48.7%) represent the smallest median household size with 1.11 persons per household.
| Household Type | # Households | Household Size |
| Married-Couple | 1,298 (27.7%) | 2.86 |
| Single Male/Father | 293 (6.2%) | 2.58 |
| Single Female/Mother | 816 (17.4%) | 2.89 |
| Non-family | 2,283 (48.7%) | 1.11 |
| Total Households | 4,690 (100.0%) | 1.99 |
Household Size by Marriage Status in Groton
Out of a total of 4,690 households in Groton, 2,407 (51.3%) are family households, while 2,283 (48.7%) are nonfamily households. The most numerous type of family households are 2-person households, comprising 1,269, and the most common type of nonfamily households are 1-person households, comprising 2,073.
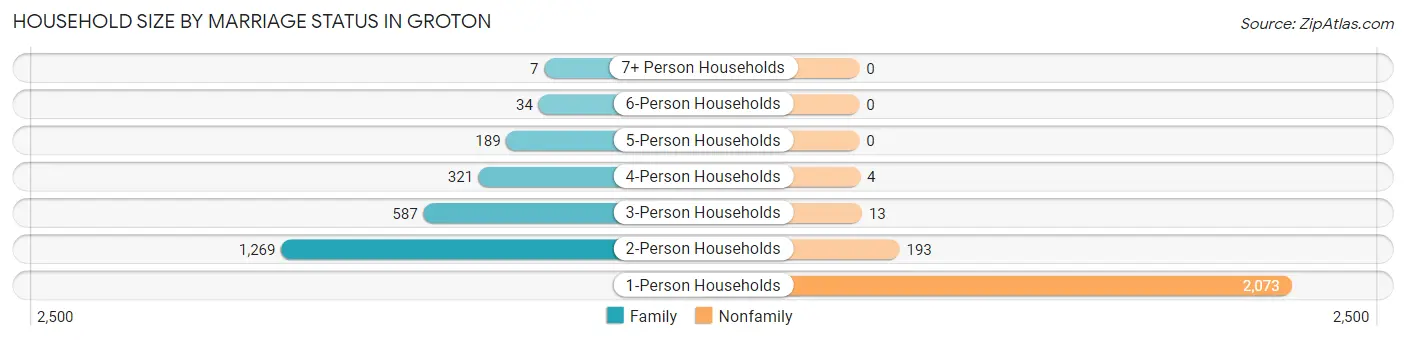
| Household Size | Family Households | Nonfamily Households |
| 1-Person Households | - | 2,073 (44.2%) |
| 2-Person Households | 1,269 (27.1%) | 193 (4.1%) |
| 3-Person Households | 587 (12.5%) | 13 (0.3%) |
| 4-Person Households | 321 (6.8%) | 4 (0.1%) |
| 5-Person Households | 189 (4.0%) | 0 (0.0%) |
| 6-Person Households | 34 (0.7%) | 0 (0.0%) |
| 7+ Person Households | 7 (0.2%) | 0 (0.0%) |
| Total | 2,407 (51.3%) | 2,283 (48.7%) |
Female Fertility in Groton
Fertility by Age in Groton
Average fertility rate in Groton is 37.0 births per 1,000 women. Women in the age bracket of 20 to 34 years have the highest fertility rate with 54.0 births per 1,000 women. Women in the age bracket of 20 to 34 years acount for 75.9% of all women with births.
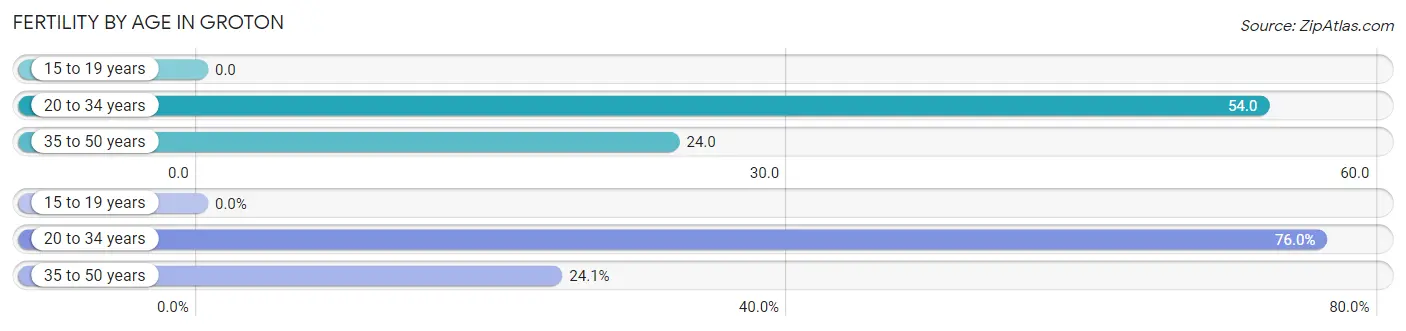
| Age Bracket | Women with Births | Births / 1,000 Women |
| 15 to 19 years | 0 (0.0%) | 0.0 |
| 20 to 34 years | 60 (75.9%) | 54.0 |
| 35 to 50 years | 19 (24.0%) | 24.0 |
| Total | 79 (100.0%) | 37.0 |
Fertility by Age by Marriage Status in Groton
60.8% of women with births (79) in Groton are married. The highest percentage of unmarried women with births falls into 20 to 34 years age bracket with 51.7% of them unmarried at the time of birth, while the lowest percentage of unmarried women with births belong to 35 to 50 years age bracket with 0.0% of them unmarried.
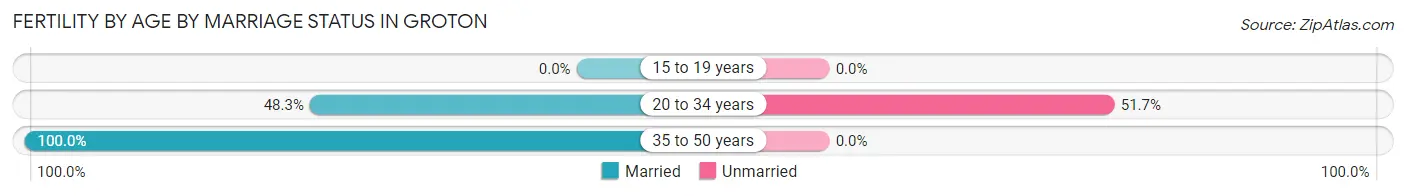
| Age Bracket | Married | Unmarried |
| 15 to 19 years | 0 (0.0%) | 0 (0.0%) |
| 20 to 34 years | 29 (48.3%) | 31 (51.7%) |
| 35 to 50 years | 19 (100.0%) | 0 (0.0%) |
| Total | 48 (60.8%) | 31 (39.2%) |
Fertility by Education in Groton
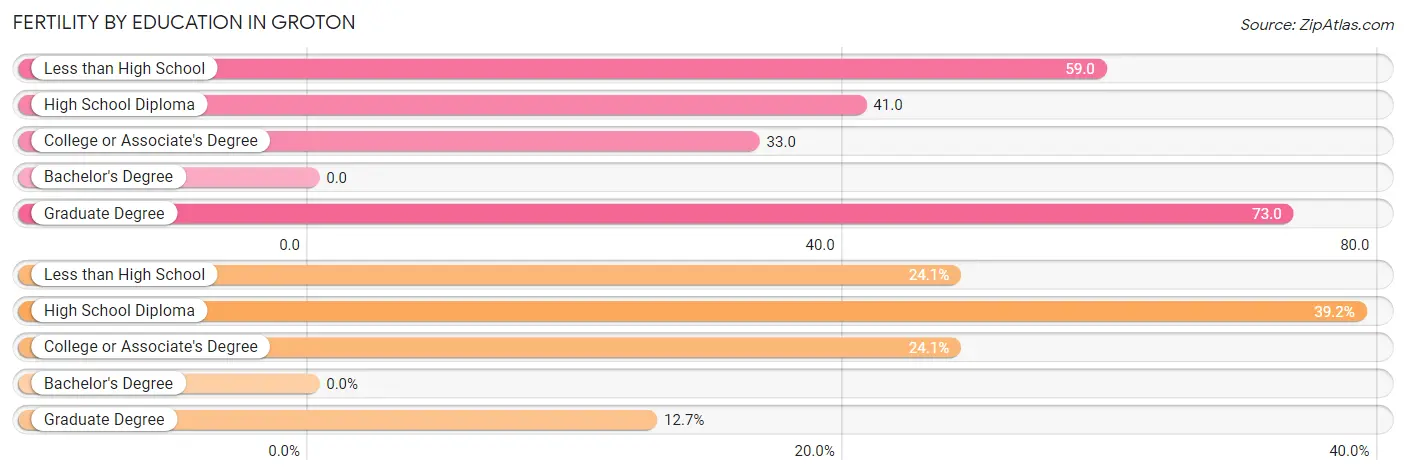
| Educational Attainment | Women with Births | Births / 1,000 Women |
| Less than High School | 19 (24.0%) | 59.0 |
| High School Diploma | 31 (39.2%) | 41.0 |
| College or Associate's Degree | 19 (24.0%) | 33.0 |
| Bachelor's Degree | 0 (0.0%) | 0.0 |
| Graduate Degree | 10 (12.7%) | 73.0 |
| Total | 79 (100.0%) | 37.0 |
Fertility by Education by Marriage Status in Groton
39.2% of women with births in Groton are unmarried. Women with the educational attainment of less than high school are most likely to be married with 100.0% of them married at childbirth, while women with the educational attainment of high school diploma are least likely to be married with 100.0% of them unmarried at childbirth.
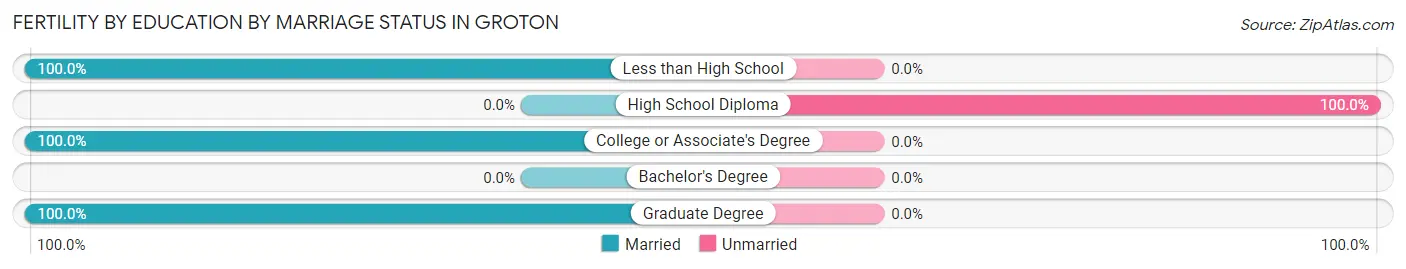
| Educational Attainment | Married | Unmarried |
| Less than High School | 19 (100.0%) | 0 (0.0%) |
| High School Diploma | 0 (0.0%) | 31 (100.0%) |
| College or Associate's Degree | 19 (100.0%) | 0 (0.0%) |
| Bachelor's Degree | 0 (0.0%) | 0 (0.0%) |
| Graduate Degree | 10 (100.0%) | 0 (0.0%) |
| Total | 48 (60.8%) | 31 (39.2%) |
Employment Characteristics in Groton
Employment by Class of Employer in Groton
Among the 5,233 employed individuals in Groton, private company employees (3,595 | 68.7%), not-for-profit organizations (513 | 9.8%), and federal government employees (426 | 8.1%) make up the most common classes of employment.
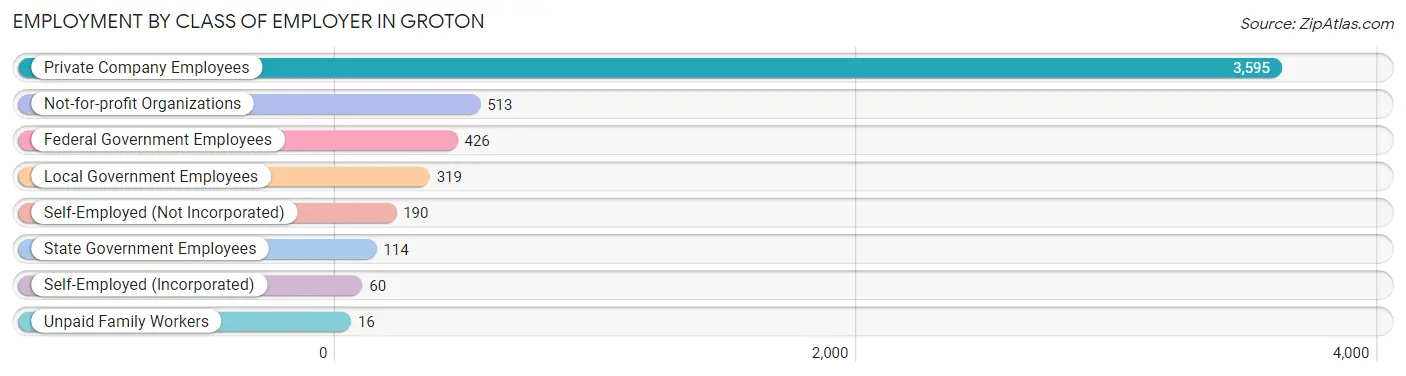
| Employer Class | # Employees | % Employees |
| Private Company Employees | 3,595 | 68.7% |
| Self-Employed (Incorporated) | 60 | 1.1% |
| Self-Employed (Not Incorporated) | 190 | 3.6% |
| Not-for-profit Organizations | 513 | 9.8% |
| Local Government Employees | 319 | 6.1% |
| State Government Employees | 114 | 2.2% |
| Federal Government Employees | 426 | 8.1% |
| Unpaid Family Workers | 16 | 0.3% |
| Total | 5,233 | 100.0% |
Employment Status by Age in Groton
According to the labor force statistics for Groton, out of the total population over 16 years of age (7,943), 72.0% or 5,719 individuals are in the labor force, with 6.1% or 349 of them unemployed. The age group with the highest labor force participation rate is 20 to 24 years, with 99.7% or 678 individuals in the labor force. Within the labor force, the 55 to 59 years age range has the highest percentage of unemployed individuals, with 18.8% or 150 of them being unemployed.
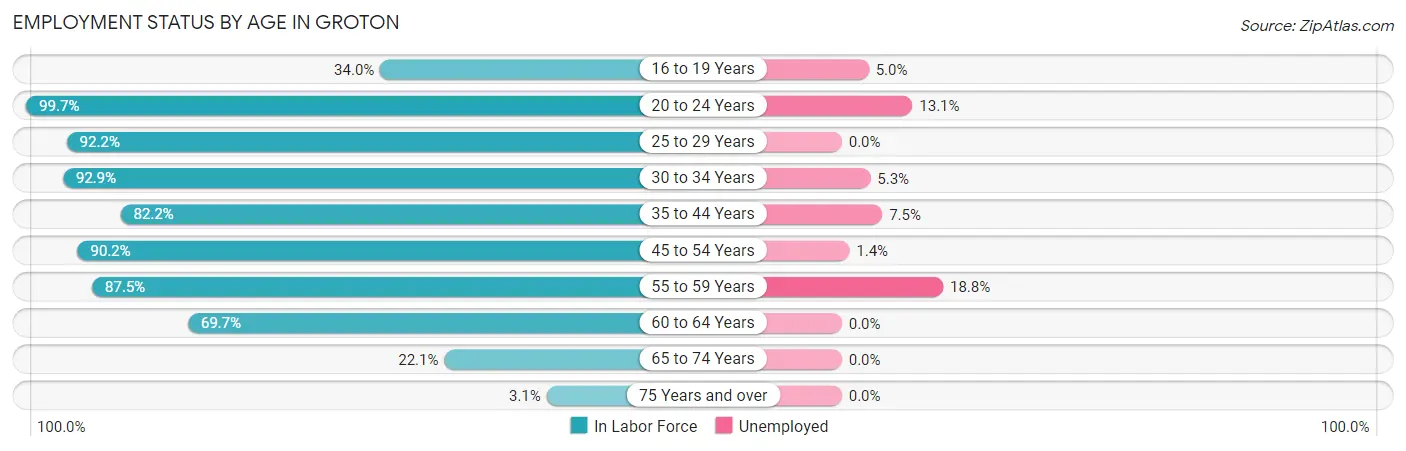
| Age Bracket | In Labor Force | Unemployed |
| 16 to 19 Years | 161 (34.0%) | 8 (5.0%) |
| 20 to 24 Years | 678 (99.7%) | 89 (13.1%) |
| 25 to 29 Years | 1,041 (92.2%) | 0 (0.0%) |
| 30 to 34 Years | 598 (92.9%) | 32 (5.3%) |
| 35 to 44 Years | 783 (82.2%) | 59 (7.5%) |
| 45 to 54 Years | 966 (90.2%) | 14 (1.4%) |
| 55 to 59 Years | 797 (87.5%) | 150 (18.8%) |
| 60 to 64 Years | 518 (69.7%) | 0 (0.0%) |
| 65 to 74 Years | 159 (22.1%) | 0 (0.0%) |
| 75 Years and over | 19 (3.1%) | 0 (0.0%) |
| Total | 5,719 (72.0%) | 349 (6.1%) |
Employment Status by Educational Attainment in Groton
According to labor force statistics for Groton, 86.3% of individuals (4,703) out of the total population between 25 and 64 years of age (5,450) are in the labor force, with 5.4% or 254 of them being unemployed. The group with the highest labor force participation rate are those with the educational attainment of bachelor's degree or higher, with 92.5% or 1,597 individuals in the labor force. Within the labor force, individuals with college / associate degree education have the highest percentage of unemployment, with 10.1% or 154 of them being unemployed.
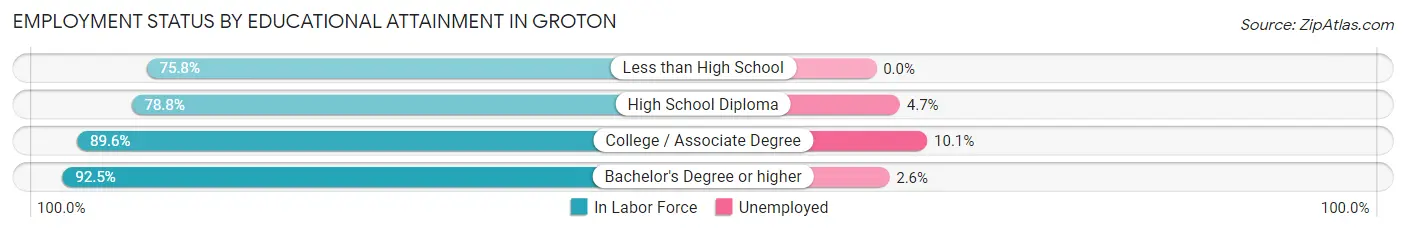
| Educational Attainment | In Labor Force | Unemployed |
| Less than High School | 301 (75.8%) | 0 (0.0%) |
| High School Diploma | 1,284 (78.8%) | 77 (4.7%) |
| College / Associate Degree | 1,521 (89.6%) | 171 (10.1%) |
| Bachelor's Degree or higher | 1,597 (92.5%) | 45 (2.6%) |
| Total | 4,703 (86.3%) | 294 (5.4%) |
Employment Occupations by Sex in Groton
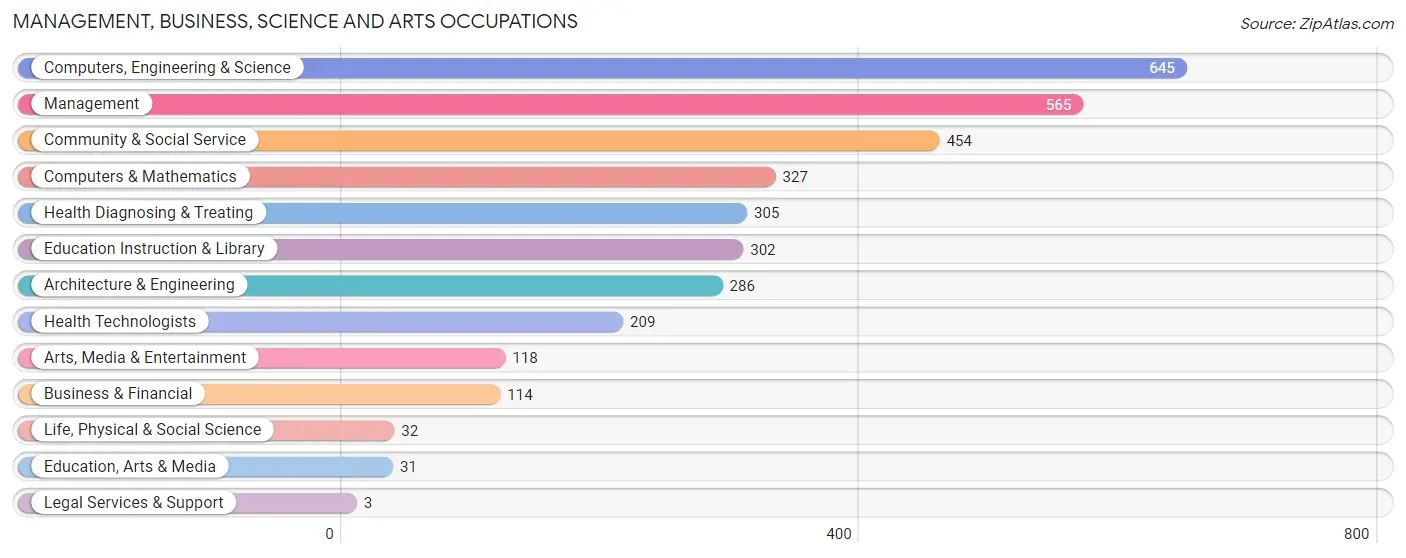
Management, Business, Science and Arts Occupations
The most common Management, Business, Science and Arts occupations in Groton are Computers, Engineering & Science (645 | 12.3%), Management (565 | 10.8%), Community & Social Service (454 | 8.6%), Computers & Mathematics (327 | 6.2%), and Health Diagnosing & Treating (305 | 5.8%).
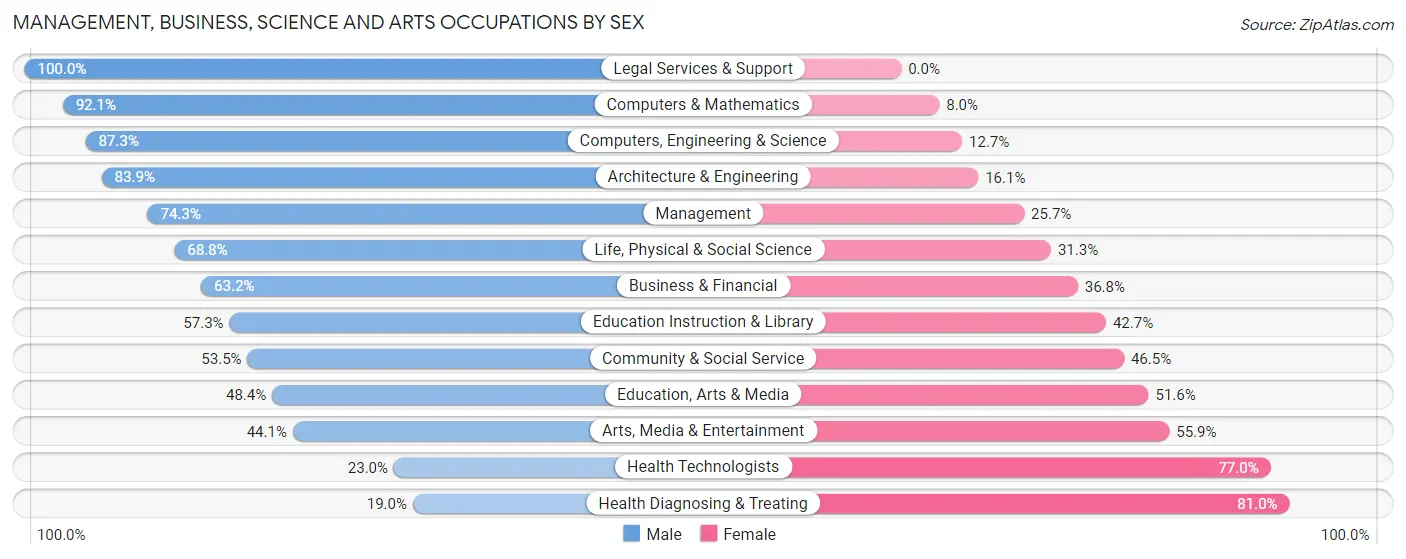
Management, Business, Science and Arts Occupations by Sex
Within the Management, Business, Science and Arts occupations in Groton, the most male-oriented occupations are Legal Services & Support (100.0%), Computers & Mathematics (92.0%), and Computers, Engineering & Science (87.3%), while the most female-oriented occupations are Health Diagnosing & Treating (81.0%), Health Technologists (77.0%), and Arts, Media & Entertainment (55.9%).
| Occupation | Male | Female |
| Management | 420 (74.3%) | 145 (25.7%) |
| Business & Financial | 72 (63.2%) | 42 (36.8%) |
| Computers, Engineering & Science | 563 (87.3%) | 82 (12.7%) |
| Computers & Mathematics | 301 (92.0%) | 26 (8.0%) |
| Architecture & Engineering | 240 (83.9%) | 46 (16.1%) |
| Life, Physical & Social Science | 22 (68.8%) | 10 (31.2%) |
| Community & Social Service | 243 (53.5%) | 211 (46.5%) |
| Education, Arts & Media | 15 (48.4%) | 16 (51.6%) |
| Legal Services & Support | 3 (100.0%) | 0 (0.0%) |
| Education Instruction & Library | 173 (57.3%) | 129 (42.7%) |
| Arts, Media & Entertainment | 52 (44.1%) | 66 (55.9%) |
| Health Diagnosing & Treating | 58 (19.0%) | 247 (81.0%) |
| Health Technologists | 48 (23.0%) | 161 (77.0%) |
| Total (Category) | 1,356 (65.1%) | 727 (34.9%) |
| Total (Overall) | 2,792 (53.2%) | 2,458 (46.8%) |
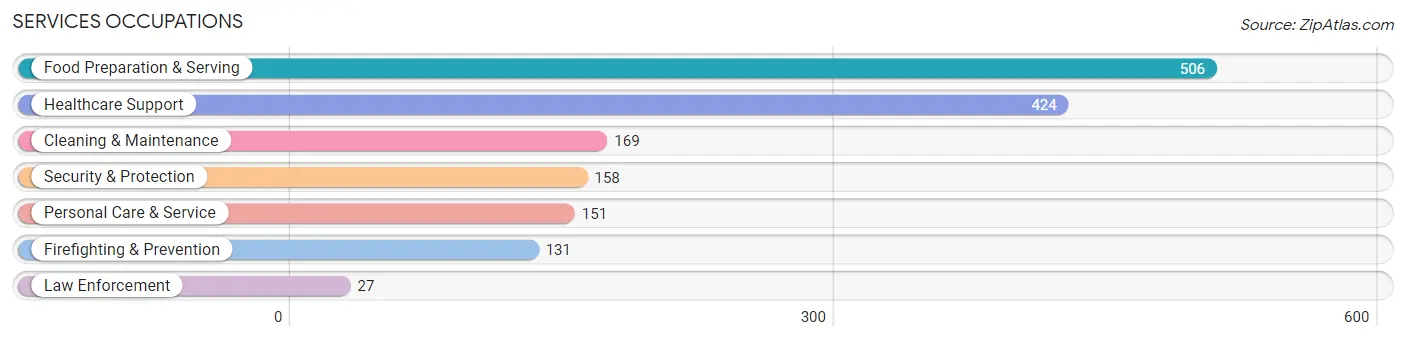
Services Occupations
The most common Services occupations in Groton are Food Preparation & Serving (506 | 9.6%), Healthcare Support (424 | 8.1%), Cleaning & Maintenance (169 | 3.2%), Security & Protection (158 | 3.0%), and Personal Care & Service (151 | 2.9%).
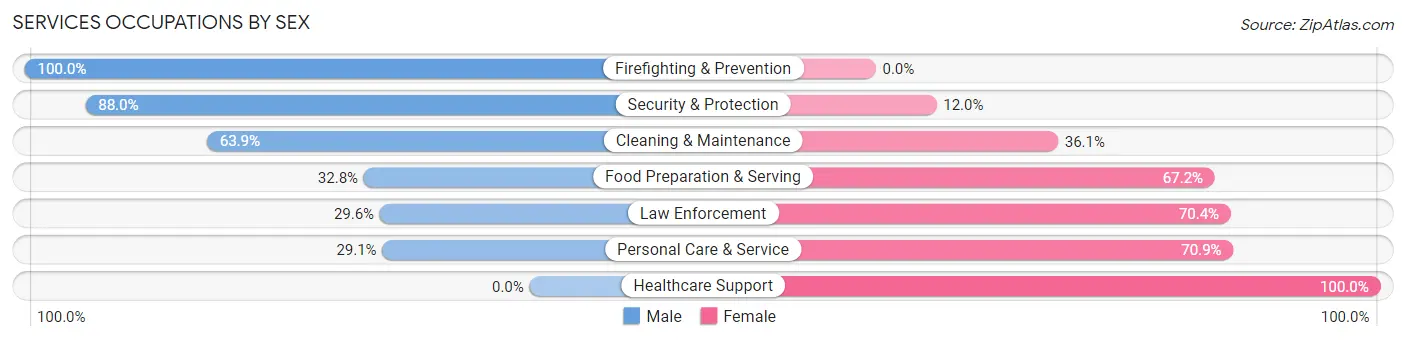
Services Occupations by Sex
Within the Services occupations in Groton, the most male-oriented occupations are Firefighting & Prevention (100.0%), Security & Protection (88.0%), and Cleaning & Maintenance (63.9%), while the most female-oriented occupations are Healthcare Support (100.0%), Personal Care & Service (70.9%), and Law Enforcement (70.4%).
| Occupation | Male | Female |
| Healthcare Support | 0 (0.0%) | 424 (100.0%) |
| Security & Protection | 139 (88.0%) | 19 (12.0%) |
| Firefighting & Prevention | 131 (100.0%) | 0 (0.0%) |
| Law Enforcement | 8 (29.6%) | 19 (70.4%) |
| Food Preparation & Serving | 166 (32.8%) | 340 (67.2%) |
| Cleaning & Maintenance | 108 (63.9%) | 61 (36.1%) |
| Personal Care & Service | 44 (29.1%) | 107 (70.9%) |
| Total (Category) | 457 (32.5%) | 951 (67.5%) |
| Total (Overall) | 2,792 (53.2%) | 2,458 (46.8%) |
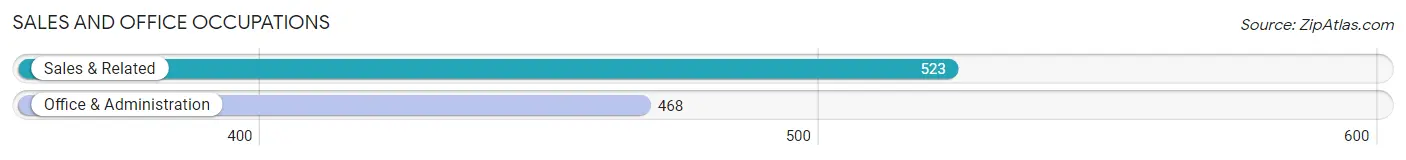
Sales and Office Occupations
The most common Sales and Office occupations in Groton are Sales & Related (523 | 10.0%), and Office & Administration (468 | 8.9%).
Sales and Office Occupations by Sex
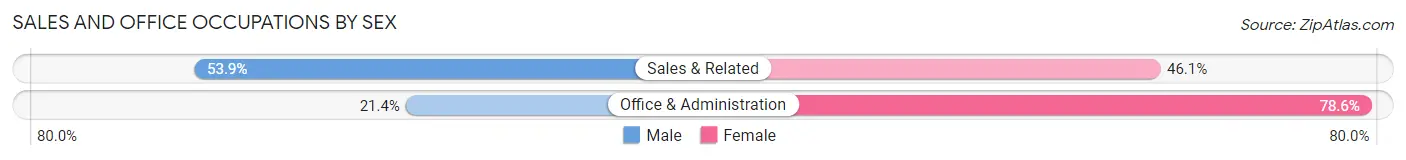
| Occupation | Male | Female |
| Sales & Related | 282 (53.9%) | 241 (46.1%) |
| Office & Administration | 100 (21.4%) | 368 (78.6%) |
| Total (Category) | 382 (38.6%) | 609 (61.5%) |
| Total (Overall) | 2,792 (53.2%) | 2,458 (46.8%) |
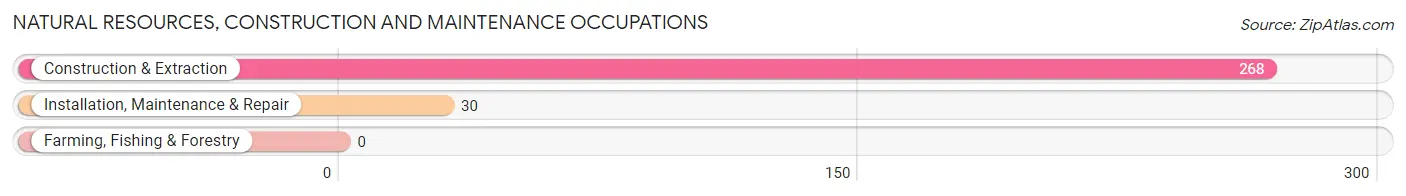
Natural Resources, Construction and Maintenance Occupations
The most common Natural Resources, Construction and Maintenance occupations in Groton are Construction & Extraction (268 | 5.1%), and Installation, Maintenance & Repair (30 | 0.6%).
Natural Resources, Construction and Maintenance Occupations by Sex
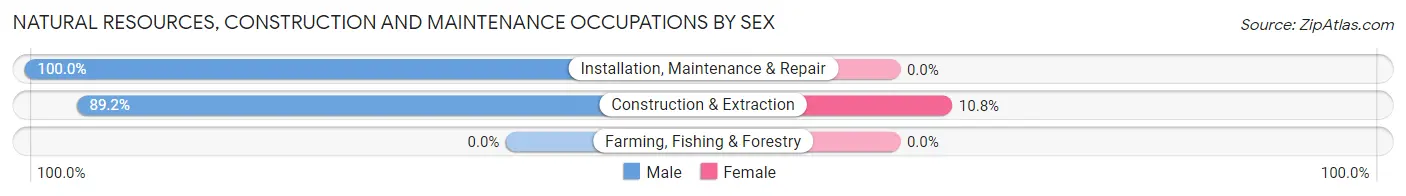
| Occupation | Male | Female |
| Farming, Fishing & Forestry | 0 (0.0%) | 0 (0.0%) |
| Construction & Extraction | 239 (89.2%) | 29 (10.8%) |
| Installation, Maintenance & Repair | 30 (100.0%) | 0 (0.0%) |
| Total (Category) | 269 (90.3%) | 29 (9.7%) |
| Total (Overall) | 2,792 (53.2%) | 2,458 (46.8%) |
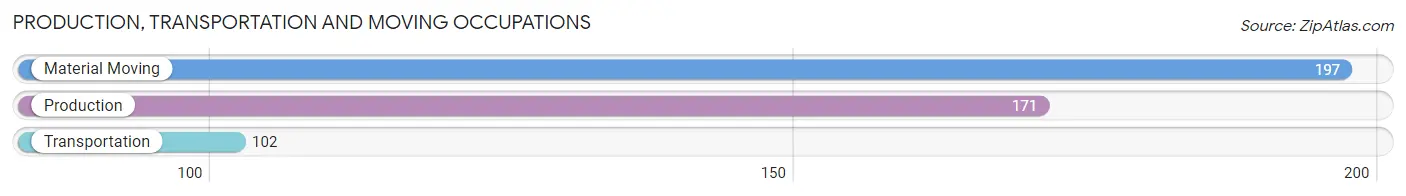
Production, Transportation and Moving Occupations
The most common Production, Transportation and Moving occupations in Groton are Material Moving (197 | 3.7%), Production (171 | 3.3%), and Transportation (102 | 1.9%).
Production, Transportation and Moving Occupations by Sex
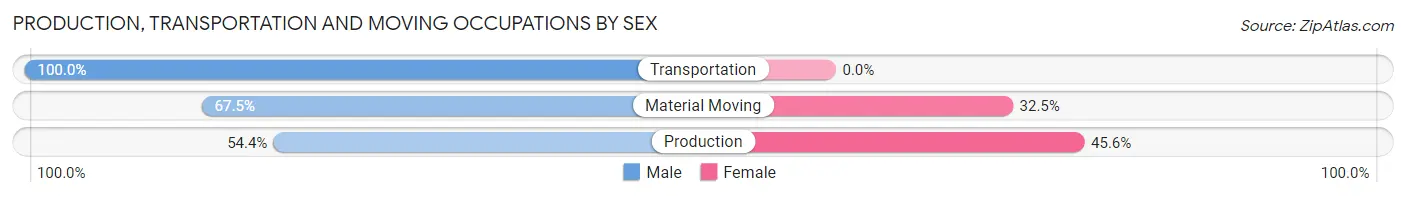
| Occupation | Male | Female |
| Production | 93 (54.4%) | 78 (45.6%) |
| Transportation | 102 (100.0%) | 0 (0.0%) |
| Material Moving | 133 (67.5%) | 64 (32.5%) |
| Total (Category) | 328 (69.8%) | 142 (30.2%) |
| Total (Overall) | 2,792 (53.2%) | 2,458 (46.8%) |
Employment Industries by Sex in Groton
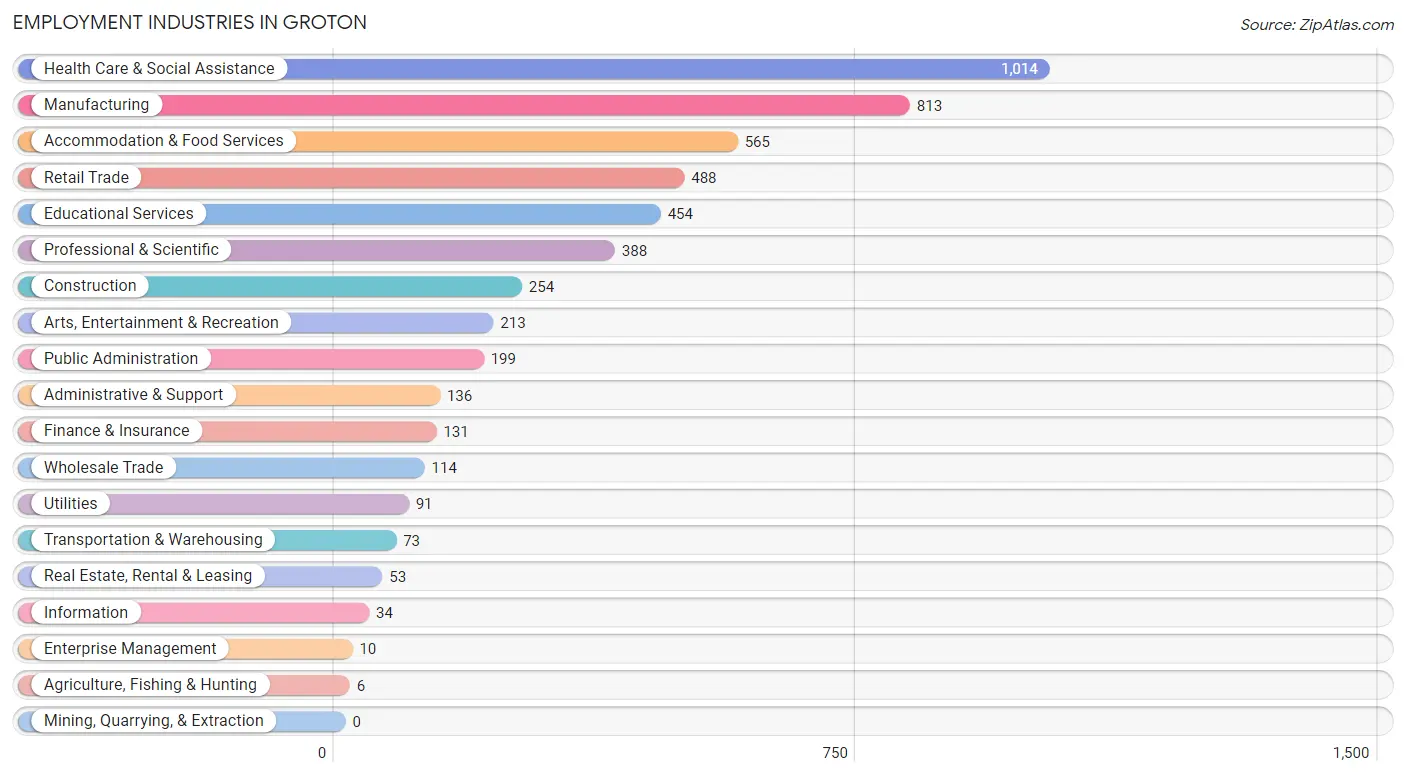
Employment Industries in Groton
The major employment industries in Groton include Health Care & Social Assistance (1,014 | 19.3%), Manufacturing (813 | 15.5%), Accommodation & Food Services (565 | 10.8%), Retail Trade (488 | 9.3%), and Educational Services (454 | 8.6%).
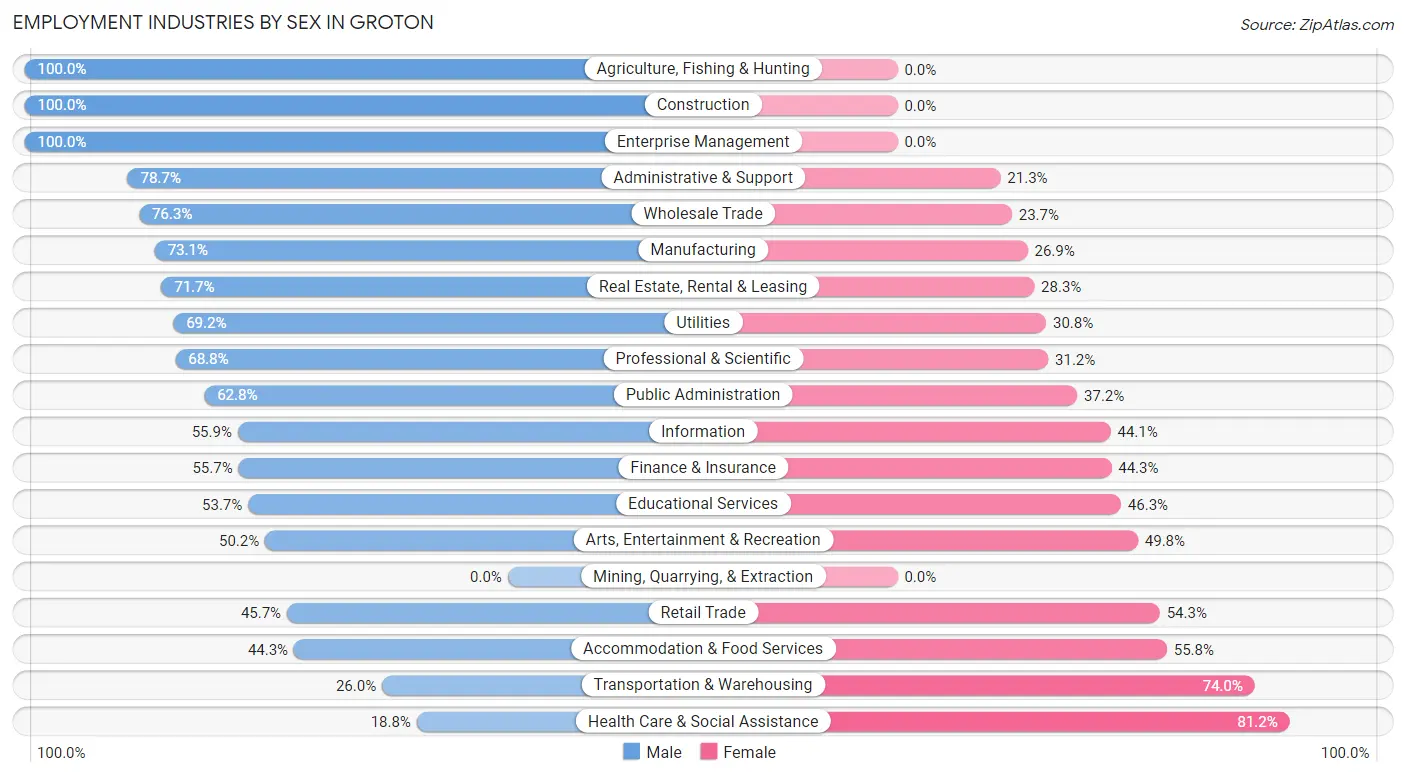
Employment Industries by Sex in Groton
The Groton industries that see more men than women are Agriculture, Fishing & Hunting (100.0%), Construction (100.0%), and Enterprise Management (100.0%), whereas the industries that tend to have a higher number of women are Health Care & Social Assistance (81.2%), Transportation & Warehousing (74.0%), and Accommodation & Food Services (55.7%).
| Industry | Male | Female |
| Agriculture, Fishing & Hunting | 6 (100.0%) | 0 (0.0%) |
| Mining, Quarrying, & Extraction | 0 (0.0%) | 0 (0.0%) |
| Construction | 254 (100.0%) | 0 (0.0%) |
| Manufacturing | 594 (73.1%) | 219 (26.9%) |
| Wholesale Trade | 87 (76.3%) | 27 (23.7%) |
| Retail Trade | 223 (45.7%) | 265 (54.3%) |
| Transportation & Warehousing | 19 (26.0%) | 54 (74.0%) |
| Utilities | 63 (69.2%) | 28 (30.8%) |
| Information | 19 (55.9%) | 15 (44.1%) |
| Finance & Insurance | 73 (55.7%) | 58 (44.3%) |
| Real Estate, Rental & Leasing | 38 (71.7%) | 15 (28.3%) |
| Professional & Scientific | 267 (68.8%) | 121 (31.2%) |
| Enterprise Management | 10 (100.0%) | 0 (0.0%) |
| Administrative & Support | 107 (78.7%) | 29 (21.3%) |
| Educational Services | 244 (53.7%) | 210 (46.3%) |
| Health Care & Social Assistance | 191 (18.8%) | 823 (81.2%) |
| Arts, Entertainment & Recreation | 107 (50.2%) | 106 (49.8%) |
| Accommodation & Food Services | 250 (44.3%) | 315 (55.7%) |
| Public Administration | 125 (62.8%) | 74 (37.2%) |
| Total | 2,792 (53.2%) | 2,458 (46.8%) |
Education in Groton
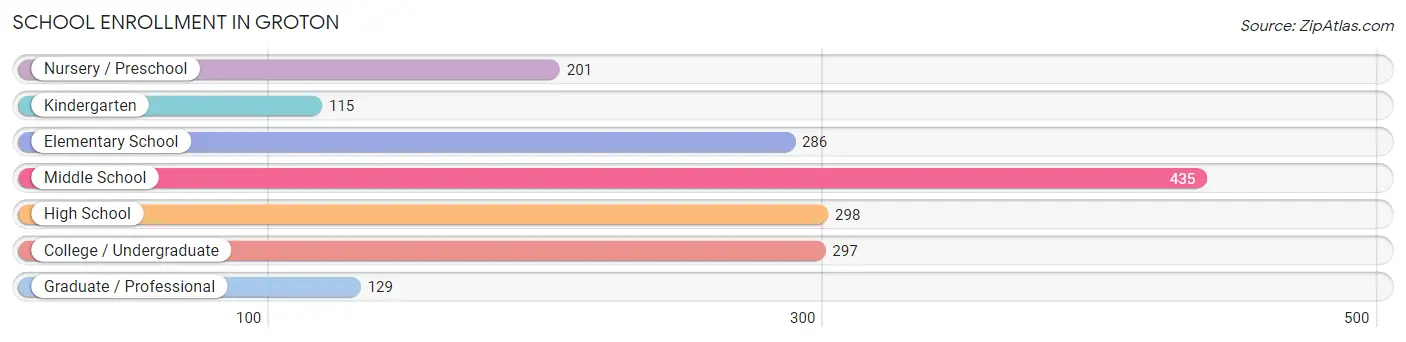
School Enrollment in Groton
The most common levels of schooling among the 1,761 students in Groton are middle school (435 | 24.7%), high school (298 | 16.9%), and college / undergraduate (297 | 16.9%).
| School Level | # Students | % Students |
| Nursery / Preschool | 201 | 11.4% |
| Kindergarten | 115 | 6.5% |
| Elementary School | 286 | 16.2% |
| Middle School | 435 | 24.7% |
| High School | 298 | 16.9% |
| College / Undergraduate | 297 | 16.9% |
| Graduate / Professional | 129 | 7.3% |
| Total | 1,761 | 100.0% |
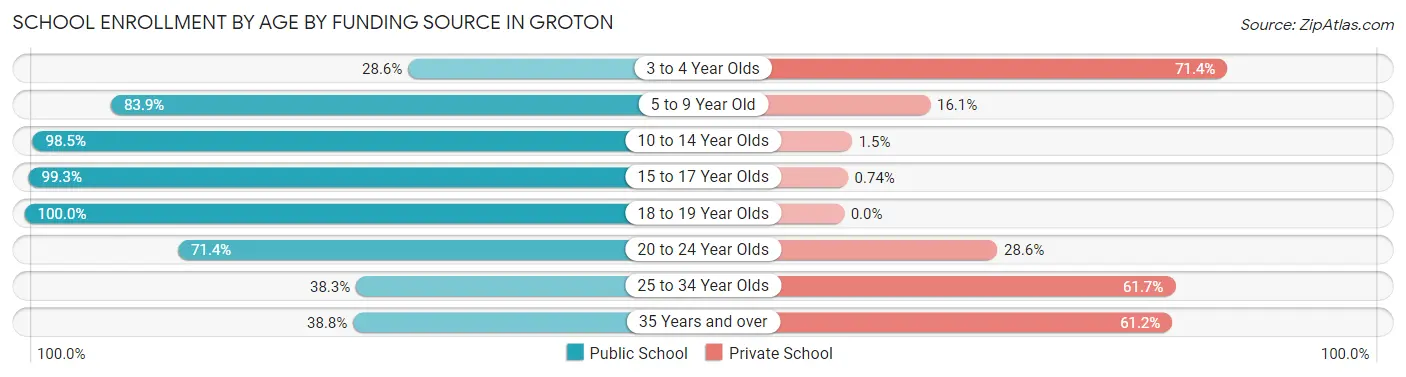
School Enrollment by Age by Funding Source in Groton
Out of a total of 1,761 students who are enrolled in schools in Groton, 331 (18.8%) attend a private institution, while the remaining 1,430 (81.2%) are enrolled in public schools. The age group of 3 to 4 year olds has the highest likelihood of being enrolled in private schools, with 115 (71.4% in the age bracket) enrolled. Conversely, the age group of 18 to 19 year olds has the lowest likelihood of being enrolled in a private school, with 118 (100.0% in the age bracket) attending a public institution.
| Age Bracket | Public School | Private School |
| 3 to 4 Year Olds | 46 (28.6%) | 115 (71.4%) |
| 5 to 9 Year Old | 365 (83.9%) | 70 (16.1%) |
| 10 to 14 Year Olds | 459 (98.5%) | 7 (1.5%) |
| 15 to 17 Year Olds | 270 (99.3%) | 2 (0.7%) |
| 18 to 19 Year Olds | 118 (100.0%) | 0 (0.0%) |
| 20 to 24 Year Olds | 115 (71.4%) | 46 (28.6%) |
| 25 to 34 Year Olds | 31 (38.3%) | 50 (61.7%) |
| 35 Years and over | 26 (38.8%) | 41 (61.2%) |
| Total | 1,430 (81.2%) | 331 (18.8%) |
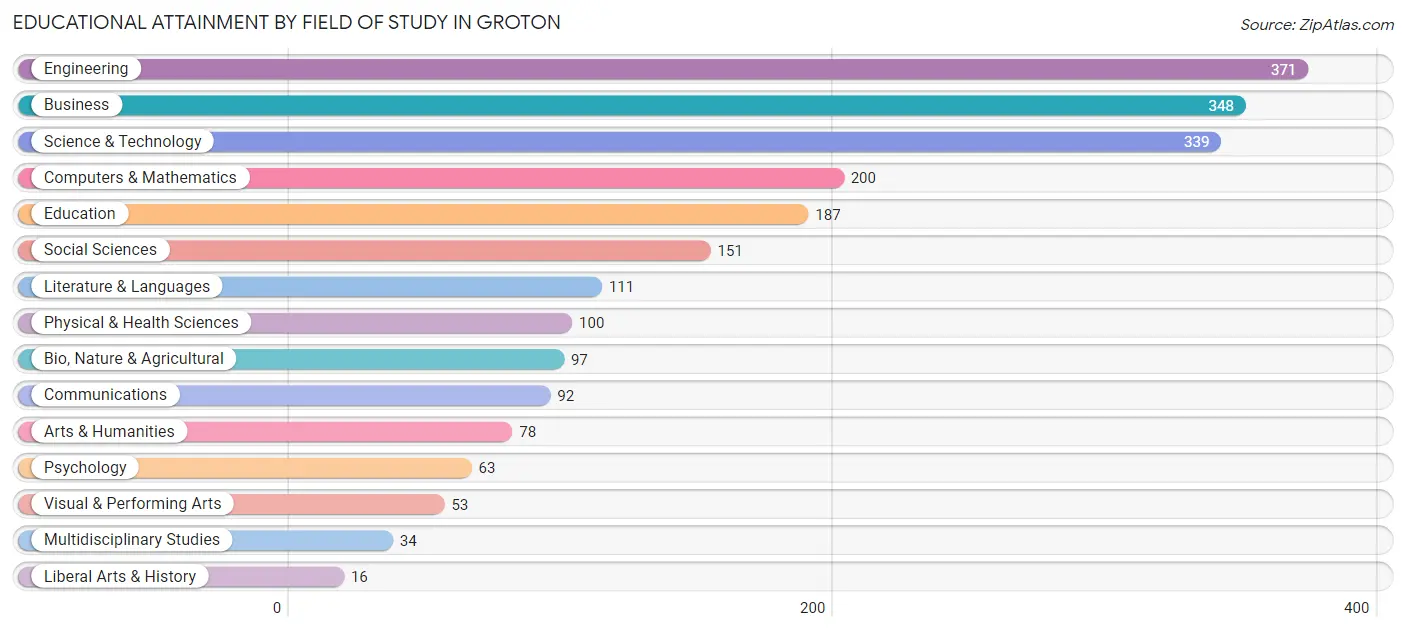
Educational Attainment by Field of Study in Groton
Engineering (371 | 16.6%), business (348 | 15.5%), science & technology (339 | 15.1%), computers & mathematics (200 | 8.9%), and education (187 | 8.4%) are the most common fields of study among 2,240 individuals in Groton who have obtained a bachelor's degree or higher.
| Field of Study | # Graduates | % Graduates |
| Computers & Mathematics | 200 | 8.9% |
| Bio, Nature & Agricultural | 97 | 4.3% |
| Physical & Health Sciences | 100 | 4.5% |
| Psychology | 63 | 2.8% |
| Social Sciences | 151 | 6.7% |
| Engineering | 371 | 16.6% |
| Multidisciplinary Studies | 34 | 1.5% |
| Science & Technology | 339 | 15.1% |
| Business | 348 | 15.5% |
| Education | 187 | 8.4% |
| Literature & Languages | 111 | 5.0% |
| Liberal Arts & History | 16 | 0.7% |
| Visual & Performing Arts | 53 | 2.4% |
| Communications | 92 | 4.1% |
| Arts & Humanities | 78 | 3.5% |
| Total | 2,240 | 100.0% |
Transportation & Commute in Groton
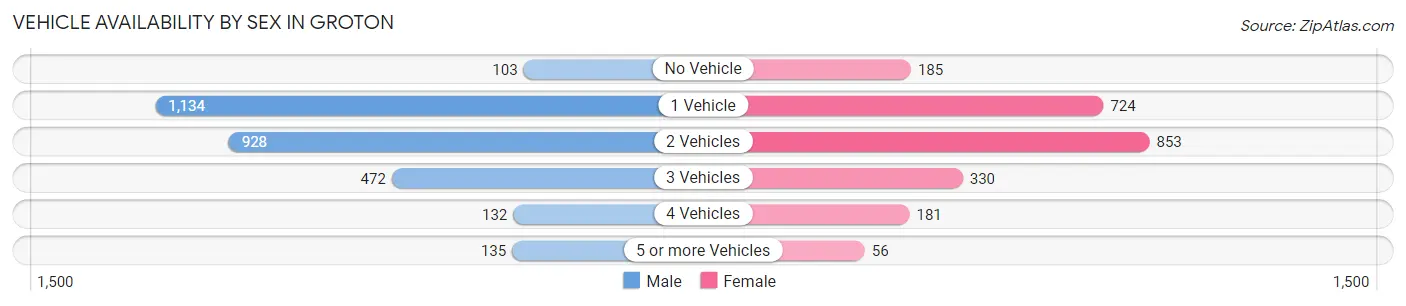
Vehicle Availability by Sex in Groton
The most prevalent vehicle ownership categories in Groton are males with 1 vehicle (1,134, accounting for 39.1%) and females with 1 vehicle (724, making up 48.7%).
| Vehicles Available | Male | Female |
| No Vehicle | 103 (3.5%) | 185 (7.9%) |
| 1 Vehicle | 1,134 (39.1%) | 724 (31.1%) |
| 2 Vehicles | 928 (32.0%) | 853 (36.6%) |
| 3 Vehicles | 472 (16.3%) | 330 (14.2%) |
| 4 Vehicles | 132 (4.5%) | 181 (7.8%) |
| 5 or more Vehicles | 135 (4.6%) | 56 (2.4%) |
| Total | 2,904 (100.0%) | 2,329 (100.0%) |
Commute Time in Groton
The most frequently occuring commute durations in Groton are 10 to 14 minutes (1,300 commuters, 26.0%), 15 to 19 minutes (1,044 commuters, 20.8%), and 5 to 9 minutes (922 commuters, 18.4%).
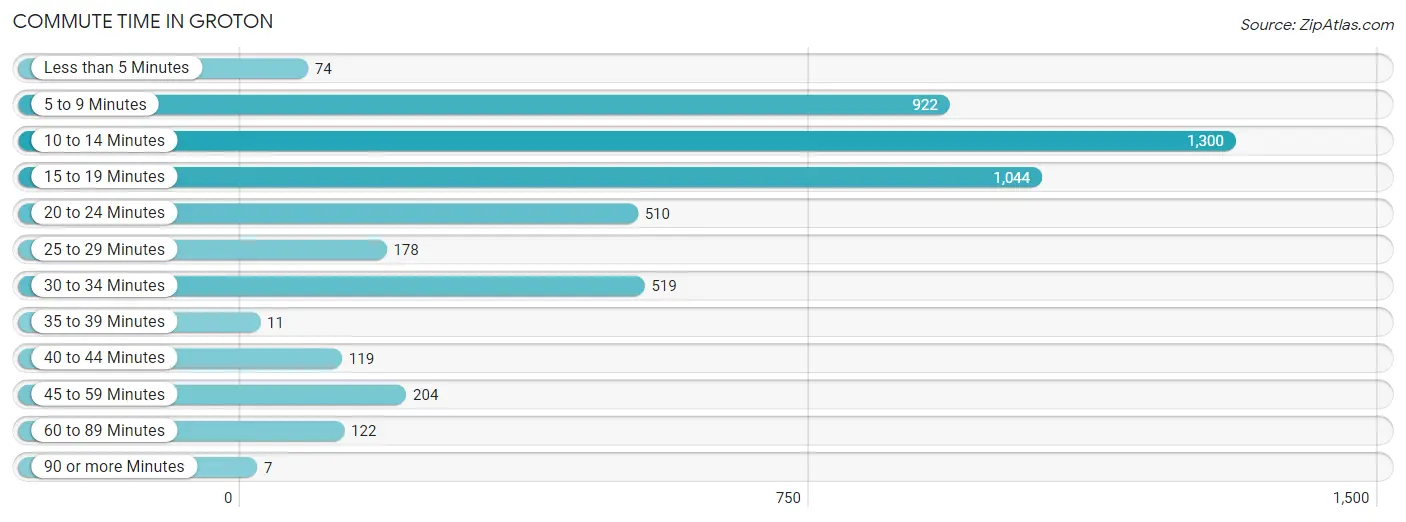
| Commute Time | # Commuters | % Commuters |
| Less than 5 Minutes | 74 | 1.5% |
| 5 to 9 Minutes | 922 | 18.4% |
| 10 to 14 Minutes | 1,300 | 26.0% |
| 15 to 19 Minutes | 1,044 | 20.8% |
| 20 to 24 Minutes | 510 | 10.2% |
| 25 to 29 Minutes | 178 | 3.5% |
| 30 to 34 Minutes | 519 | 10.4% |
| 35 to 39 Minutes | 11 | 0.2% |
| 40 to 44 Minutes | 119 | 2.4% |
| 45 to 59 Minutes | 204 | 4.1% |
| 60 to 89 Minutes | 122 | 2.4% |
| 90 or more Minutes | 7 | 0.1% |
Commute Time by Sex in Groton
The most common commute times in Groton are 10 to 14 minutes (663 commuters, 24.1%) for males and 10 to 14 minutes (637 commuters, 28.1%) for females.
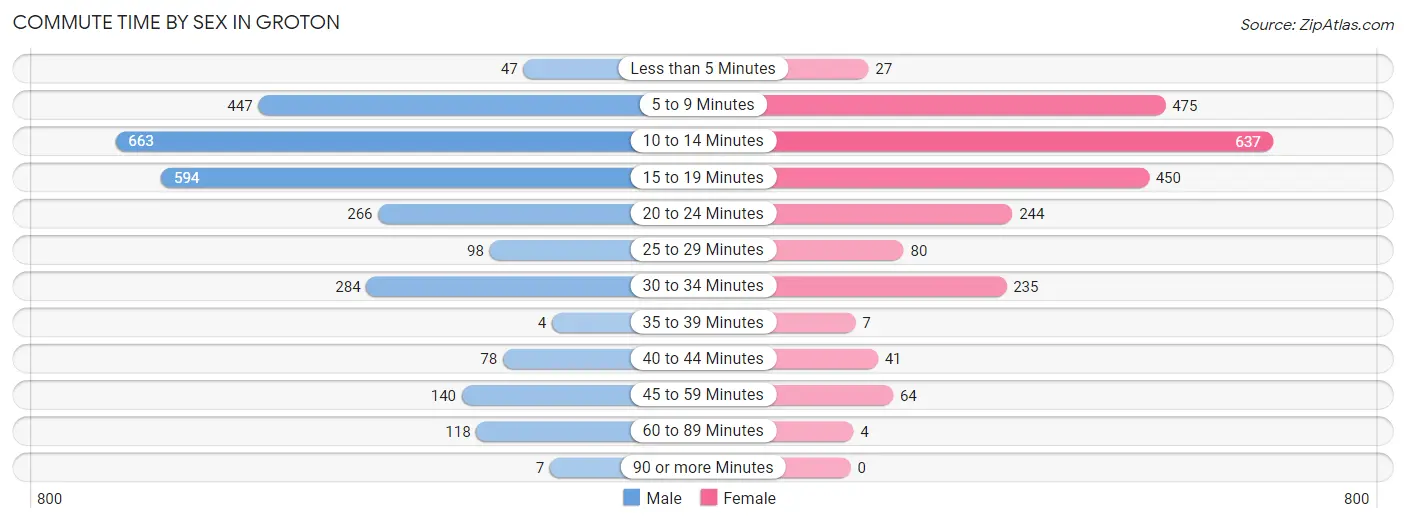
| Commute Time | Male | Female |
| Less than 5 Minutes | 47 (1.7%) | 27 (1.2%) |
| 5 to 9 Minutes | 447 (16.3%) | 475 (21.0%) |
| 10 to 14 Minutes | 663 (24.1%) | 637 (28.1%) |
| 15 to 19 Minutes | 594 (21.6%) | 450 (19.9%) |
| 20 to 24 Minutes | 266 (9.7%) | 244 (10.8%) |
| 25 to 29 Minutes | 98 (3.6%) | 80 (3.5%) |
| 30 to 34 Minutes | 284 (10.3%) | 235 (10.4%) |
| 35 to 39 Minutes | 4 (0.2%) | 7 (0.3%) |
| 40 to 44 Minutes | 78 (2.8%) | 41 (1.8%) |
| 45 to 59 Minutes | 140 (5.1%) | 64 (2.8%) |
| 60 to 89 Minutes | 118 (4.3%) | 4 (0.2%) |
| 90 or more Minutes | 7 (0.3%) | 0 (0.0%) |
Time of Departure to Work by Sex in Groton
The most frequent times of departure to work in Groton are 6:30 AM to 6:59 AM (502, 18.3%) for males and 8:00 AM to 8:29 AM (302, 13.3%) for females.
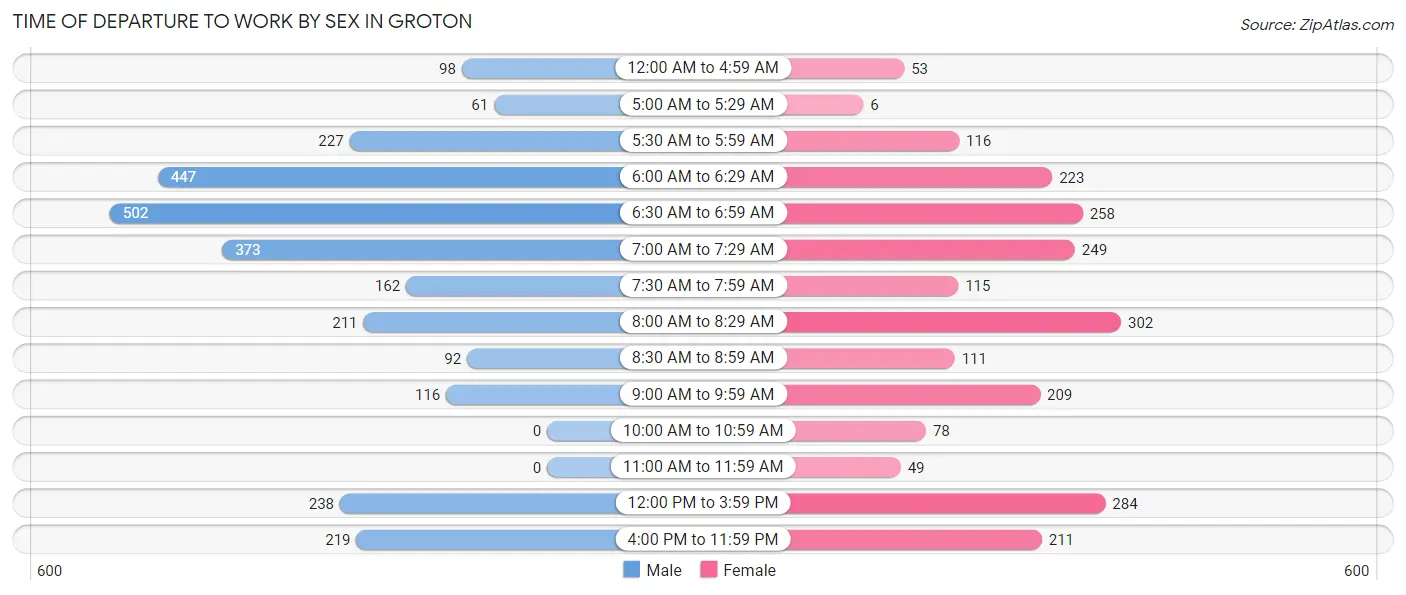
| Time of Departure | Male | Female |
| 12:00 AM to 4:59 AM | 98 (3.6%) | 53 (2.3%) |
| 5:00 AM to 5:29 AM | 61 (2.2%) | 6 (0.3%) |
| 5:30 AM to 5:59 AM | 227 (8.3%) | 116 (5.1%) |
| 6:00 AM to 6:29 AM | 447 (16.3%) | 223 (9.9%) |
| 6:30 AM to 6:59 AM | 502 (18.3%) | 258 (11.4%) |
| 7:00 AM to 7:29 AM | 373 (13.6%) | 249 (11.0%) |
| 7:30 AM to 7:59 AM | 162 (5.9%) | 115 (5.1%) |
| 8:00 AM to 8:29 AM | 211 (7.7%) | 302 (13.3%) |
| 8:30 AM to 8:59 AM | 92 (3.4%) | 111 (4.9%) |
| 9:00 AM to 9:59 AM | 116 (4.2%) | 209 (9.2%) |
| 10:00 AM to 10:59 AM | 0 (0.0%) | 78 (3.5%) |
| 11:00 AM to 11:59 AM | 0 (0.0%) | 49 (2.2%) |
| 12:00 PM to 3:59 PM | 238 (8.7%) | 284 (12.5%) |
| 4:00 PM to 11:59 PM | 219 (8.0%) | 211 (9.3%) |
| Total | 2,746 (100.0%) | 2,264 (100.0%) |
Housing Occupancy in Groton
Occupancy by Ownership in Groton
Of the total 4,690 dwellings in Groton, owner-occupied units account for 2,123 (45.3%), while renter-occupied units make up 2,567 (54.7%).
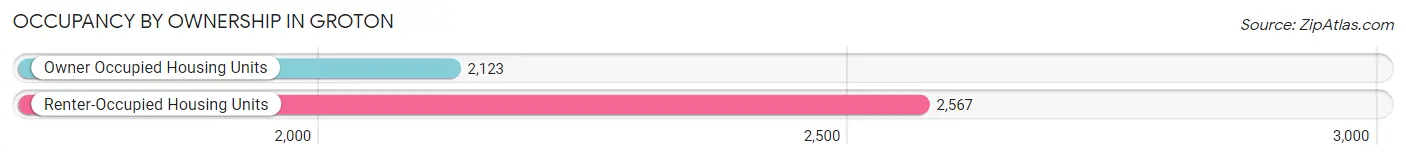
| Occupancy | # Housing Units | % Housing Units |
| Owner Occupied Housing Units | 2,123 | 45.3% |
| Renter-Occupied Housing Units | 2,567 | 54.7% |
| Total Occupied Housing Units | 4,690 | 100.0% |
Occupancy by Household Size in Groton
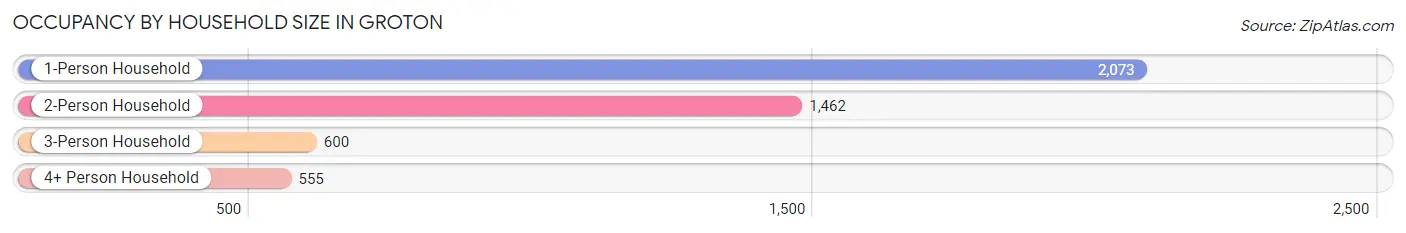
| Household Size | # Housing Units | % Housing Units |
| 1-Person Household | 2,073 | 44.2% |
| 2-Person Household | 1,462 | 31.2% |
| 3-Person Household | 600 | 12.8% |
| 4+ Person Household | 555 | 11.8% |
| Total Housing Units | 4,690 | 100.0% |
Occupancy by Ownership by Household Size in Groton
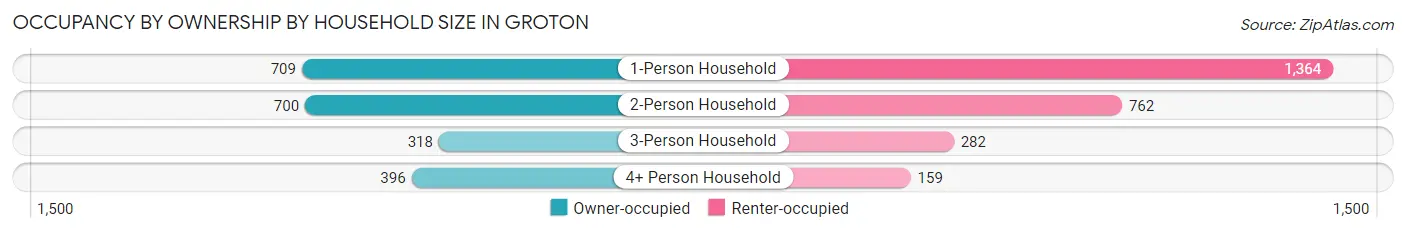
| Household Size | Owner-occupied | Renter-occupied |
| 1-Person Household | 709 (34.2%) | 1,364 (65.8%) |
| 2-Person Household | 700 (47.9%) | 762 (52.1%) |
| 3-Person Household | 318 (53.0%) | 282 (47.0%) |
| 4+ Person Household | 396 (71.4%) | 159 (28.6%) |
| Total Housing Units | 2,123 (45.3%) | 2,567 (54.7%) |
Occupancy by Educational Attainment in Groton
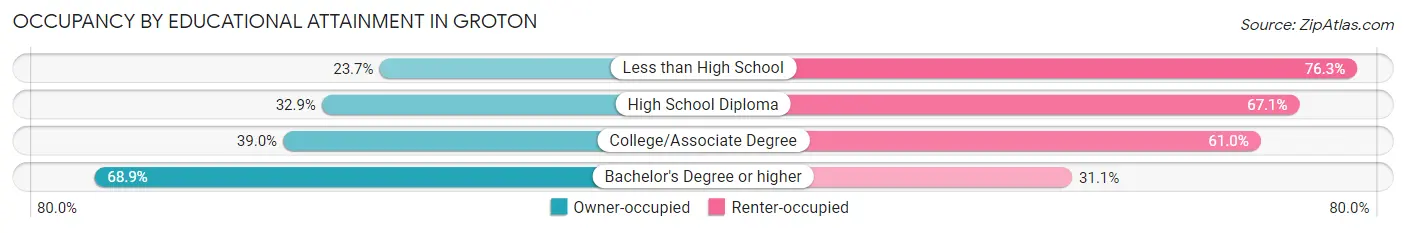
| Household Size | Owner-occupied | Renter-occupied |
| Less than High School | 94 (23.7%) | 302 (76.3%) |
| High School Diploma | 431 (32.9%) | 880 (67.1%) |
| College/Associate Degree | 598 (39.0%) | 934 (61.0%) |
| Bachelor's Degree or higher | 1,000 (68.9%) | 451 (31.1%) |
Occupancy by Age of Householder in Groton
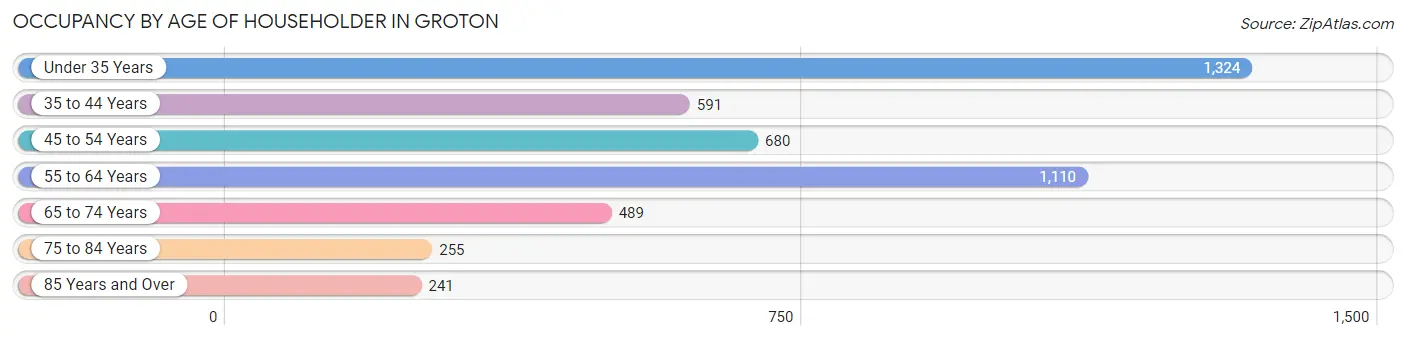
| Age Bracket | # Households | % Households |
| Under 35 Years | 1,324 | 28.2% |
| 35 to 44 Years | 591 | 12.6% |
| 45 to 54 Years | 680 | 14.5% |
| 55 to 64 Years | 1,110 | 23.7% |
| 65 to 74 Years | 489 | 10.4% |
| 75 to 84 Years | 255 | 5.4% |
| 85 Years and Over | 241 | 5.1% |
| Total | 4,690 | 100.0% |
Housing Finances in Groton
Median Income by Occupancy in Groton
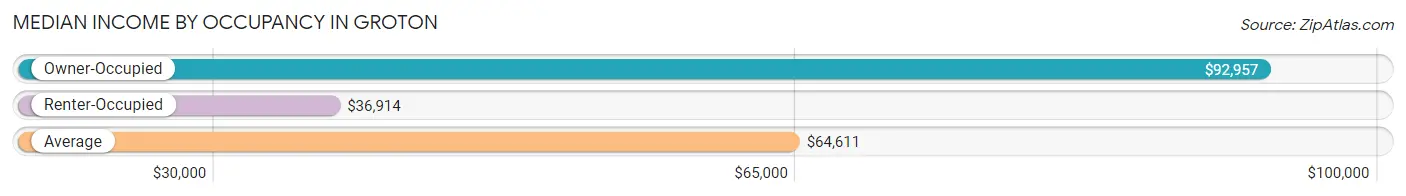
| Occupancy Type | # Households | Median Income |
| Owner-Occupied | 2,123 (45.3%) | $92,957 |
| Renter-Occupied | 2,567 (54.7%) | $36,914 |
| Average | 4,690 (100.0%) | $64,611 |
Occupancy by Householder Income Bracket in Groton
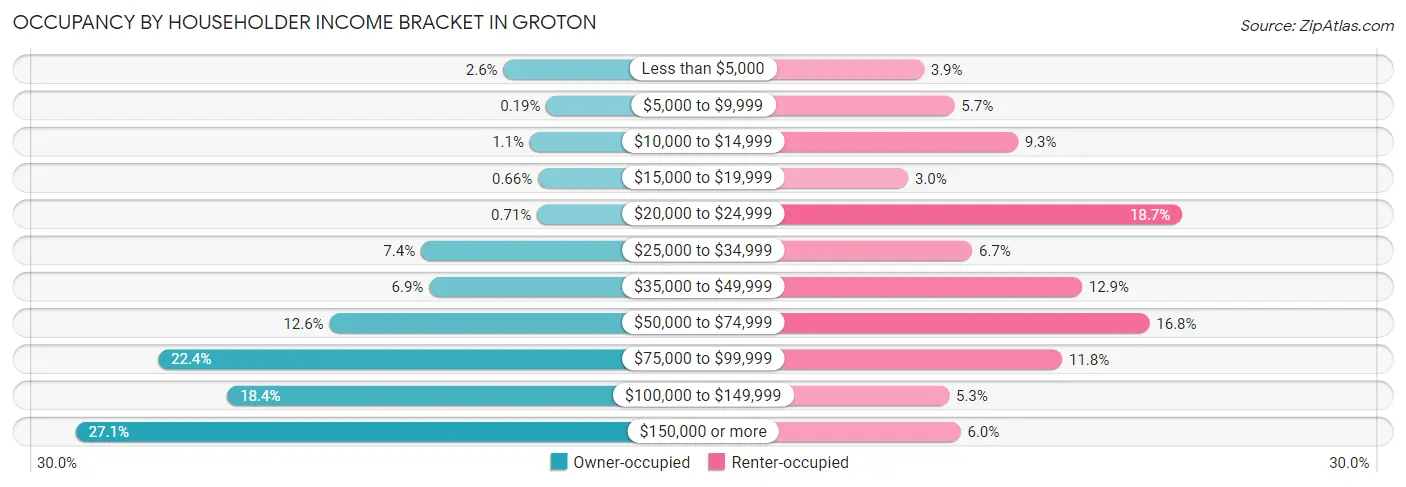
| Income Bracket | Owner-occupied | Renter-occupied |
| Less than $5,000 | 56 (2.6%) | 100 (3.9%) |
| $5,000 to $9,999 | 4 (0.2%) | 145 (5.7%) |
| $10,000 to $14,999 | 24 (1.1%) | 238 (9.3%) |
| $15,000 to $19,999 | 14 (0.7%) | 77 (3.0%) |
| $20,000 to $24,999 | 15 (0.7%) | 479 (18.7%) |
| $25,000 to $34,999 | 156 (7.3%) | 171 (6.7%) |
| $35,000 to $49,999 | 146 (6.9%) | 332 (12.9%) |
| $50,000 to $74,999 | 267 (12.6%) | 431 (16.8%) |
| $75,000 to $99,999 | 475 (22.4%) | 303 (11.8%) |
| $100,000 to $149,999 | 391 (18.4%) | 137 (5.3%) |
| $150,000 or more | 575 (27.1%) | 154 (6.0%) |
| Total | 2,123 (100.0%) | 2,567 (100.0%) |
Monthly Housing Cost Tiers in Groton
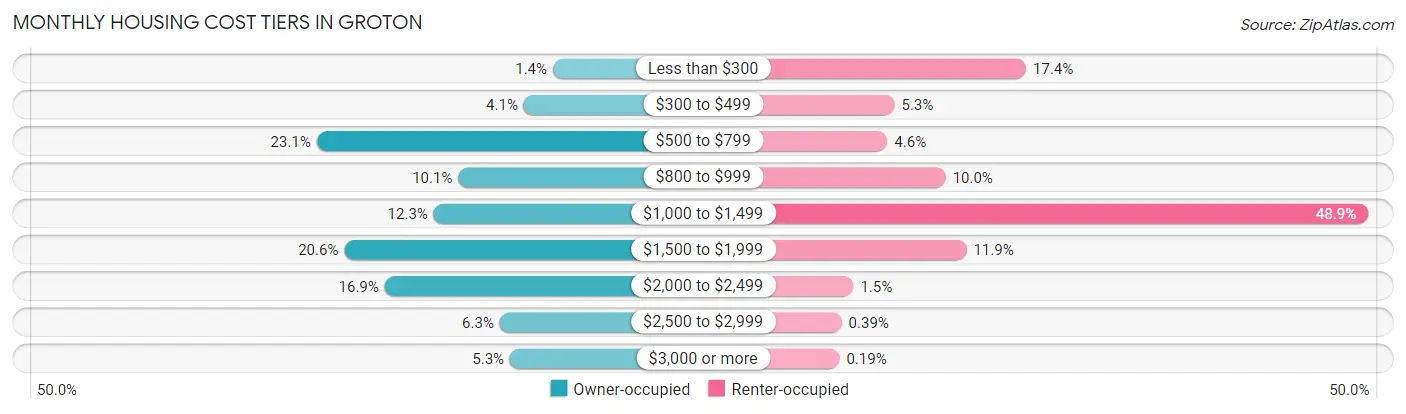
| Monthly Cost | Owner-occupied | Renter-occupied |
| Less than $300 | 29 (1.4%) | 446 (17.4%) |
| $300 to $499 | 86 (4.1%) | 135 (5.3%) |
| $500 to $799 | 491 (23.1%) | 118 (4.6%) |
| $800 to $999 | 214 (10.1%) | 256 (10.0%) |
| $1,000 to $1,499 | 262 (12.3%) | 1,254 (48.8%) |
| $1,500 to $1,999 | 437 (20.6%) | 305 (11.9%) |
| $2,000 to $2,499 | 358 (16.9%) | 38 (1.5%) |
| $2,500 to $2,999 | 133 (6.3%) | 10 (0.4%) |
| $3,000 or more | 113 (5.3%) | 5 (0.2%) |
| Total | 2,123 (100.0%) | 2,567 (100.0%) |
Physical Housing Characteristics in Groton
Housing Structures in Groton
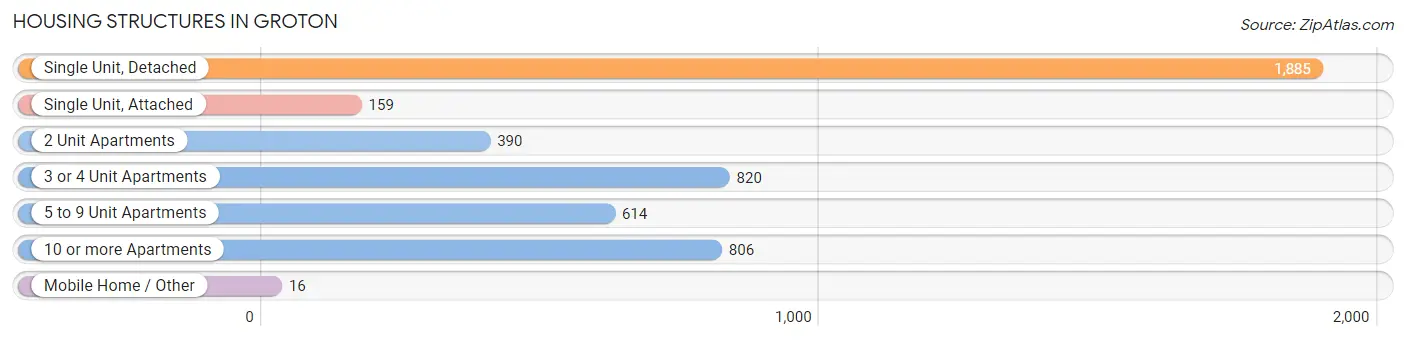
| Structure Type | # Housing Units | % Housing Units |
| Single Unit, Detached | 1,885 | 40.2% |
| Single Unit, Attached | 159 | 3.4% |
| 2 Unit Apartments | 390 | 8.3% |
| 3 or 4 Unit Apartments | 820 | 17.5% |
| 5 to 9 Unit Apartments | 614 | 13.1% |
| 10 or more Apartments | 806 | 17.2% |
| Mobile Home / Other | 16 | 0.3% |
| Total | 4,690 | 100.0% |
Housing Structures by Occupancy in Groton
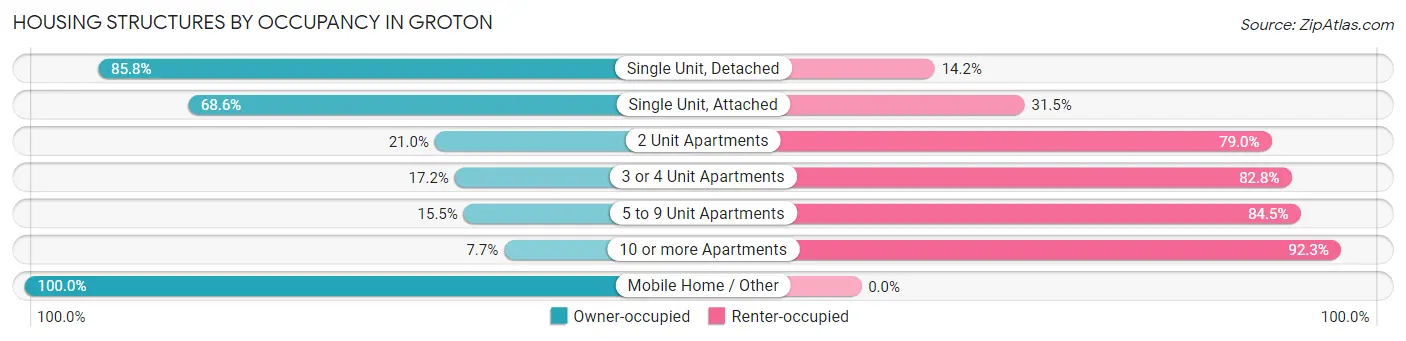
| Structure Type | Owner-occupied | Renter-occupied |
| Single Unit, Detached | 1,618 (85.8%) | 267 (14.2%) |
| Single Unit, Attached | 109 (68.5%) | 50 (31.5%) |
| 2 Unit Apartments | 82 (21.0%) | 308 (79.0%) |
| 3 or 4 Unit Apartments | 141 (17.2%) | 679 (82.8%) |
| 5 to 9 Unit Apartments | 95 (15.5%) | 519 (84.5%) |
| 10 or more Apartments | 62 (7.7%) | 744 (92.3%) |
| Mobile Home / Other | 16 (100.0%) | 0 (0.0%) |
| Total | 2,123 (45.3%) | 2,567 (54.7%) |
Housing Structures by Number of Rooms in Groton
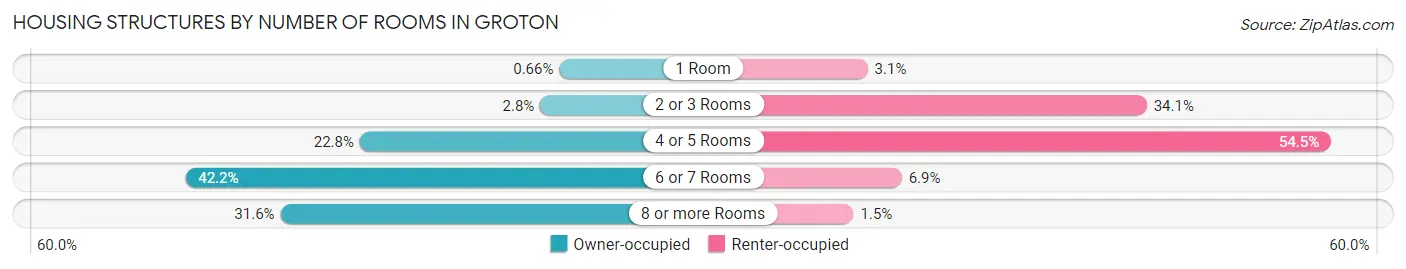
| Number of Rooms | Owner-occupied | Renter-occupied |
| 1 Room | 14 (0.7%) | 79 (3.1%) |
| 2 or 3 Rooms | 59 (2.8%) | 874 (34.1%) |
| 4 or 5 Rooms | 484 (22.8%) | 1,399 (54.5%) |
| 6 or 7 Rooms | 895 (42.2%) | 176 (6.9%) |
| 8 or more Rooms | 671 (31.6%) | 39 (1.5%) |
| Total | 2,123 (100.0%) | 2,567 (100.0%) |
Housing Structure by Heating Type in Groton
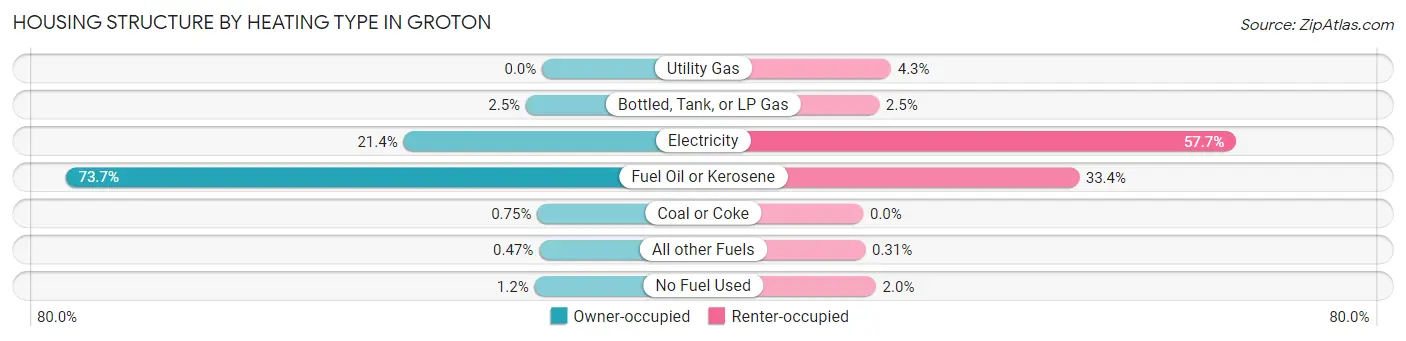
| Heating Type | Owner-occupied | Renter-occupied |
| Utility Gas | 0 (0.0%) | 110 (4.3%) |
| Bottled, Tank, or LP Gas | 53 (2.5%) | 63 (2.5%) |
| Electricity | 455 (21.4%) | 1,480 (57.7%) |
| Fuel Oil or Kerosene | 1,564 (73.7%) | 856 (33.4%) |
| Coal or Coke | 16 (0.7%) | 0 (0.0%) |
| All other Fuels | 10 (0.5%) | 8 (0.3%) |
| No Fuel Used | 25 (1.2%) | 50 (1.9%) |
| Total | 2,123 (100.0%) | 2,567 (100.0%) |
Household Vehicle Usage in Groton
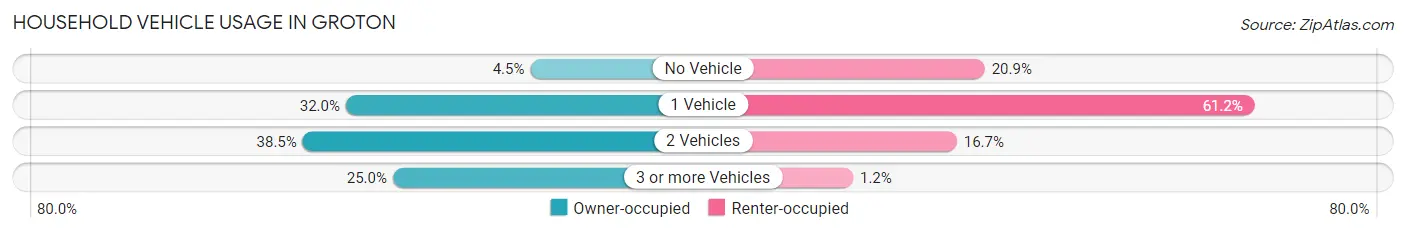
| Vehicles per Household | Owner-occupied | Renter-occupied |
| No Vehicle | 95 (4.5%) | 536 (20.9%) |
| 1 Vehicle | 680 (32.0%) | 1,571 (61.2%) |
| 2 Vehicles | 817 (38.5%) | 429 (16.7%) |
| 3 or more Vehicles | 531 (25.0%) | 31 (1.2%) |
| Total | 2,123 (100.0%) | 2,567 (100.0%) |
Real Estate & Mortgages in Groton
Real Estate and Mortgage Overview in Groton
| Characteristic | Without Mortgage | With Mortgage |
| Housing Units | 970 | 1,153 |
| Median Property Value | $256,800 | $257,700 |
| Median Household Income | $79,200 | $404 |
| Monthly Housing Costs | $691 | $113 |
| Real Estate Taxes | $4,162 | $20 |
Property Value by Mortgage Status in Groton
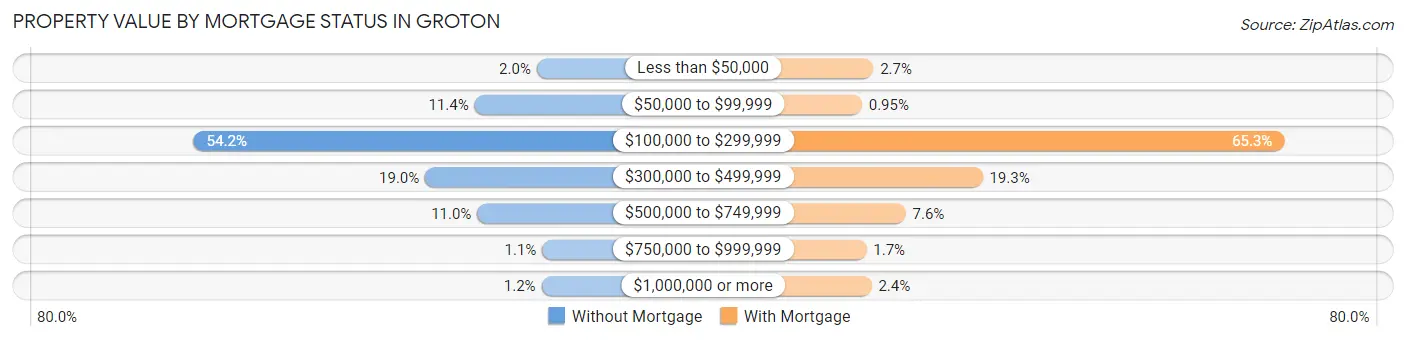
| Property Value | Without Mortgage | With Mortgage |
| Less than $50,000 | 19 (2.0%) | 31 (2.7%) |
| $50,000 to $99,999 | 111 (11.4%) | 11 (0.9%) |
| $100,000 to $299,999 | 526 (54.2%) | 753 (65.3%) |
| $300,000 to $499,999 | 184 (19.0%) | 223 (19.3%) |
| $500,000 to $749,999 | 107 (11.0%) | 88 (7.6%) |
| $750,000 to $999,999 | 11 (1.1%) | 19 (1.7%) |
| $1,000,000 or more | 12 (1.2%) | 28 (2.4%) |
| Total | 970 (100.0%) | 1,153 (100.0%) |
Household Income by Mortgage Status in Groton
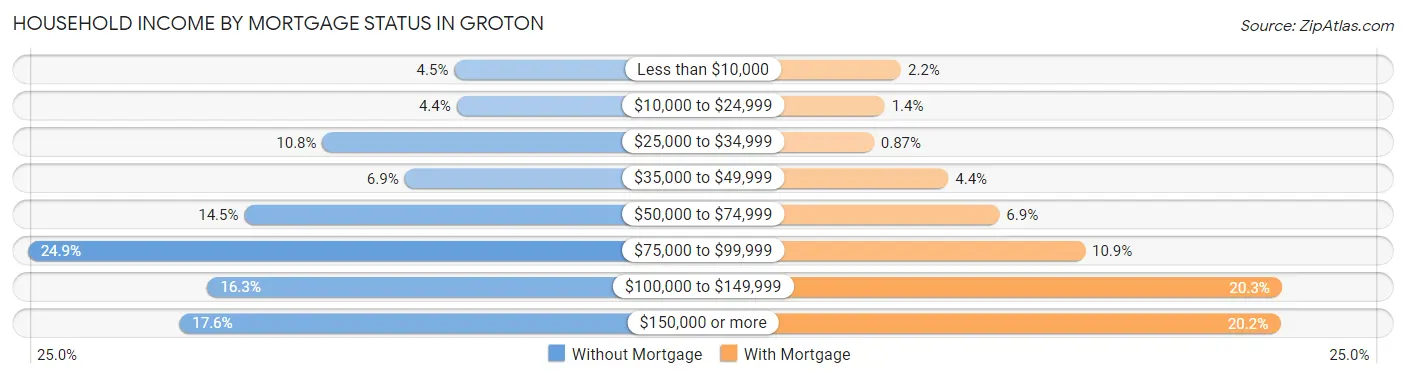
| Household Income | Without Mortgage | With Mortgage |
| Less than $10,000 | 44 (4.5%) | 25 (2.2%) |
| $10,000 to $24,999 | 43 (4.4%) | 16 (1.4%) |
| $25,000 to $34,999 | 105 (10.8%) | 10 (0.9%) |
| $35,000 to $49,999 | 67 (6.9%) | 51 (4.4%) |
| $50,000 to $74,999 | 141 (14.5%) | 79 (6.9%) |
| $75,000 to $99,999 | 241 (24.8%) | 126 (10.9%) |
| $100,000 to $149,999 | 158 (16.3%) | 234 (20.3%) |
| $150,000 or more | 171 (17.6%) | 233 (20.2%) |
| Total | 970 (100.0%) | 1,153 (100.0%) |
Property Value to Household Income Ratio in Groton
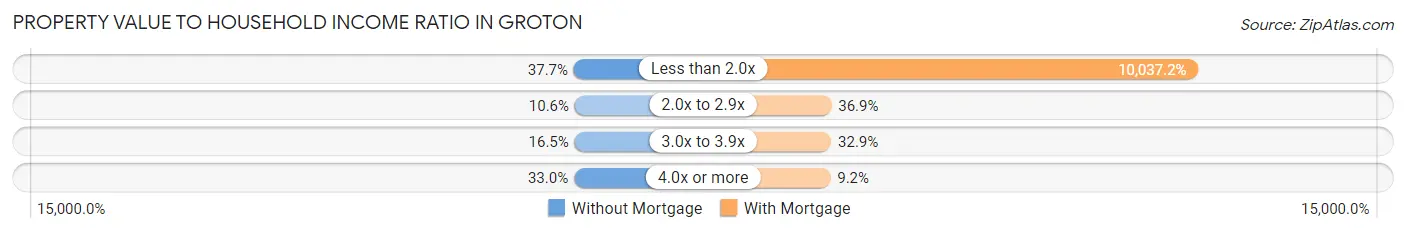
| Value-to-Income Ratio | Without Mortgage | With Mortgage |
| Less than 2.0x | 366 (37.7%) | 115,729 (10,037.2%) |
| 2.0x to 2.9x | 103 (10.6%) | 425 (36.9%) |
| 3.0x to 3.9x | 160 (16.5%) | 379 (32.9%) |
| 4.0x or more | 320 (33.0%) | 106 (9.2%) |
| Total | 970 (100.0%) | 1,153 (100.0%) |
Real Estate Taxes by Mortgage Status in Groton
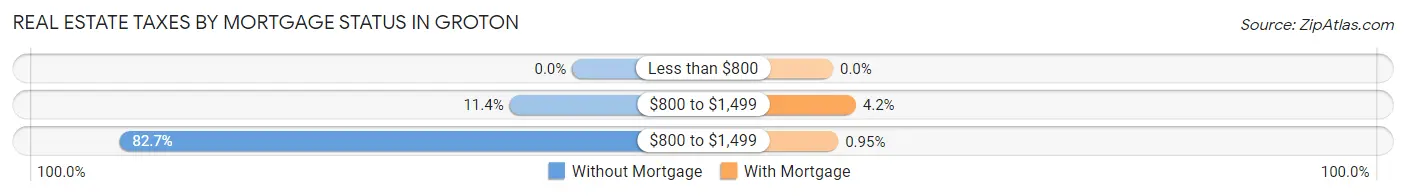
| Property Taxes | Without Mortgage | With Mortgage |
| Less than $800 | 0 (0.0%) | 0 (0.0%) |
| $800 to $1,499 | 111 (11.4%) | 48 (4.2%) |
| $800 to $1,499 | 802 (82.7%) | 11 (0.9%) |
| Total | 970 (100.0%) | 1,153 (100.0%) |
Health & Disability in Groton
Health Insurance Coverage by Age in Groton
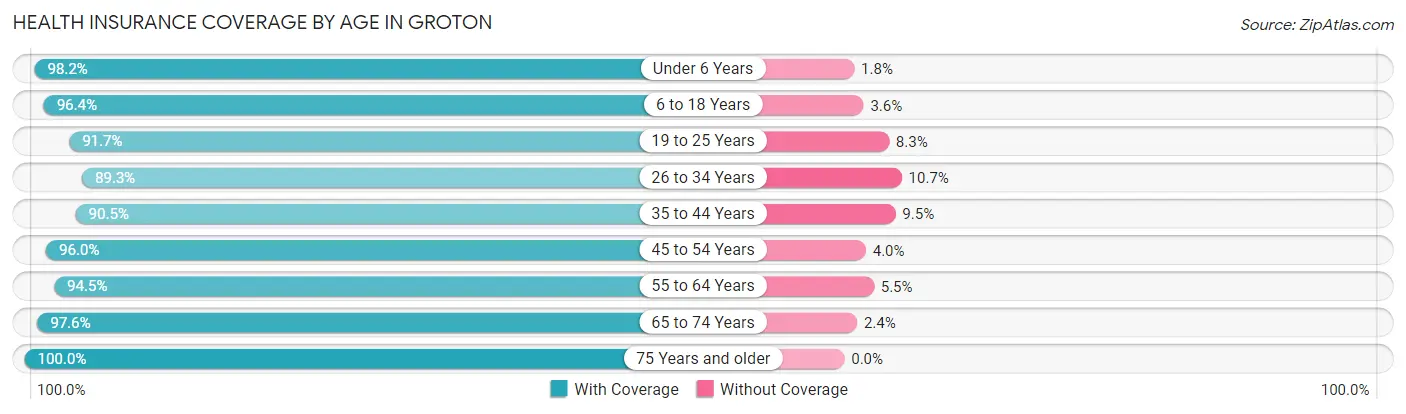
| Age Bracket | With Coverage | Without Coverage |
| Under 6 Years | 587 (98.2%) | 11 (1.8%) |
| 6 to 18 Years | 1,082 (96.4%) | 40 (3.6%) |
| 19 to 25 Years | 903 (91.7%) | 82 (8.3%) |
| 26 to 34 Years | 1,352 (89.3%) | 162 (10.7%) |
| 35 to 44 Years | 854 (90.5%) | 90 (9.5%) |
| 45 to 54 Years | 1,028 (96.0%) | 43 (4.0%) |
| 55 to 64 Years | 1,563 (94.5%) | 91 (5.5%) |
| 65 to 74 Years | 701 (97.6%) | 17 (2.4%) |
| 75 Years and older | 622 (100.0%) | 0 (0.0%) |
| Total | 8,692 (94.2%) | 536 (5.8%) |
Health Insurance Coverage by Citizenship Status in Groton
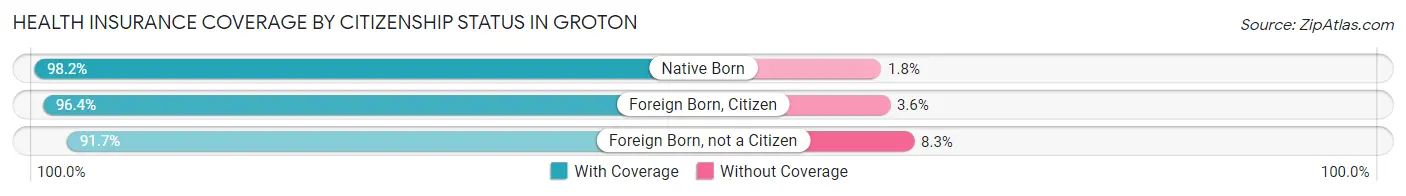
| Citizenship Status | With Coverage | Without Coverage |
| Native Born | 587 (98.2%) | 11 (1.8%) |
| Foreign Born, Citizen | 1,082 (96.4%) | 40 (3.6%) |
| Foreign Born, not a Citizen | 903 (91.7%) | 82 (8.3%) |
Health Insurance Coverage by Household Income in Groton
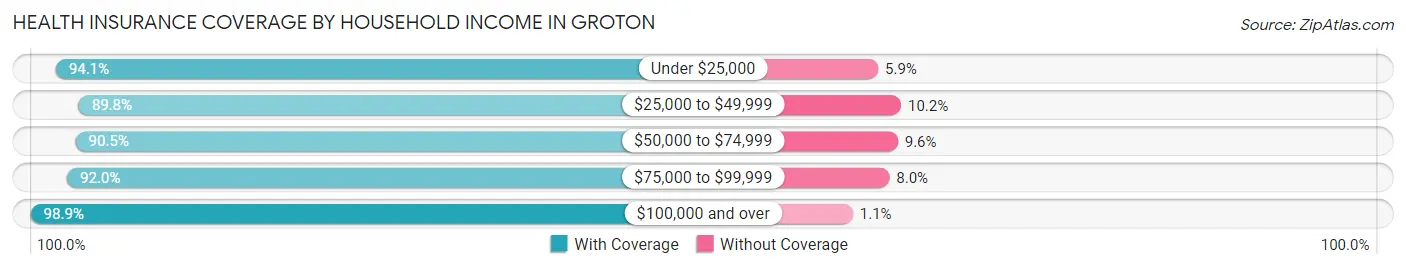
| Household Income | With Coverage | Without Coverage |
| Under $25,000 | 1,624 (94.1%) | 101 (5.9%) |
| $25,000 to $49,999 | 1,202 (89.8%) | 136 (10.2%) |
| $50,000 to $74,999 | 1,373 (90.4%) | 145 (9.6%) |
| $75,000 to $99,999 | 1,362 (92.0%) | 118 (8.0%) |
| $100,000 and over | 3,128 (98.9%) | 36 (1.1%) |
Public vs Private Health Insurance Coverage by Age in Groton
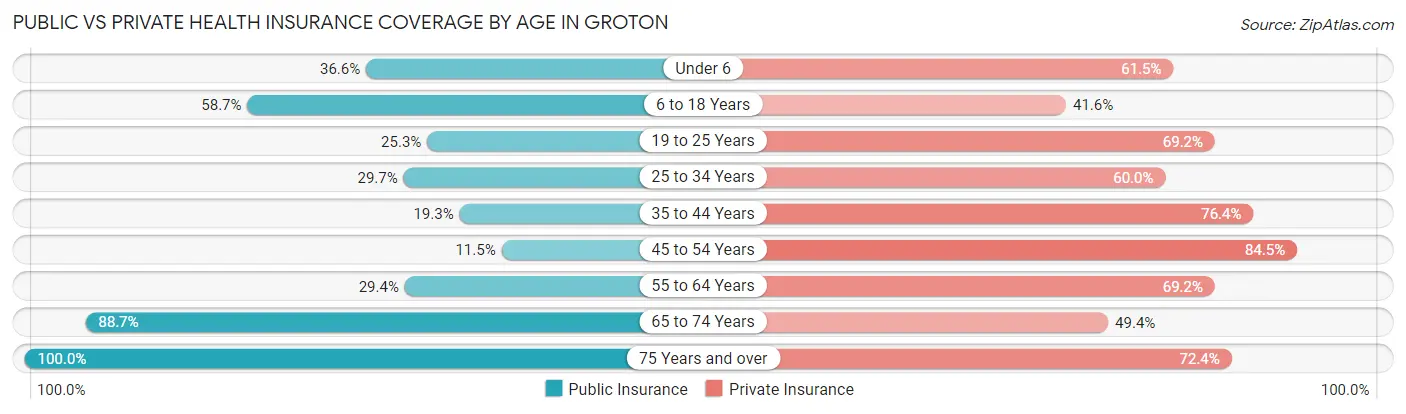
| Age Bracket | Public Insurance | Private Insurance |
| Under 6 | 219 (36.6%) | 368 (61.5%) |
| 6 to 18 Years | 658 (58.7%) | 467 (41.6%) |
| 19 to 25 Years | 249 (25.3%) | 682 (69.2%) |
| 25 to 34 Years | 449 (29.7%) | 909 (60.0%) |
| 35 to 44 Years | 182 (19.3%) | 721 (76.4%) |
| 45 to 54 Years | 123 (11.5%) | 905 (84.5%) |
| 55 to 64 Years | 487 (29.4%) | 1,145 (69.2%) |
| 65 to 74 Years | 637 (88.7%) | 355 (49.4%) |
| 75 Years and over | 622 (100.0%) | 450 (72.4%) |
| Total | 3,626 (39.3%) | 6,002 (65.0%) |
Disability Status by Sex by Age in Groton
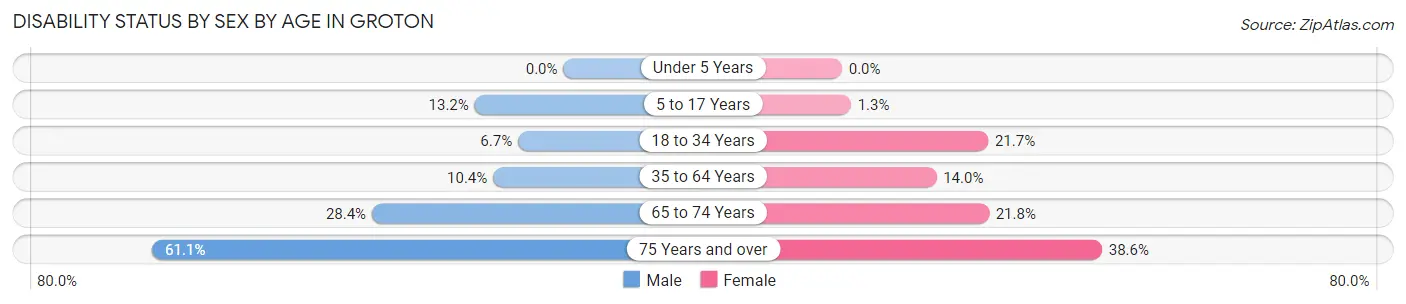
| Age Bracket | Male | Female |
| Under 5 Years | 0 (0.0%) | 0 (0.0%) |
| 5 to 17 Years | 97 (13.2%) | 6 (1.3%) |
| 18 to 34 Years | 87 (6.7%) | 282 (21.7%) |
| 35 to 64 Years | 213 (10.4%) | 228 (14.0%) |
| 65 to 74 Years | 79 (28.4%) | 96 (21.8%) |
| 75 Years and over | 160 (61.1%) | 139 (38.6%) |
Disability Class by Sex by Age in Groton
Disability Class: Hearing Difficulty
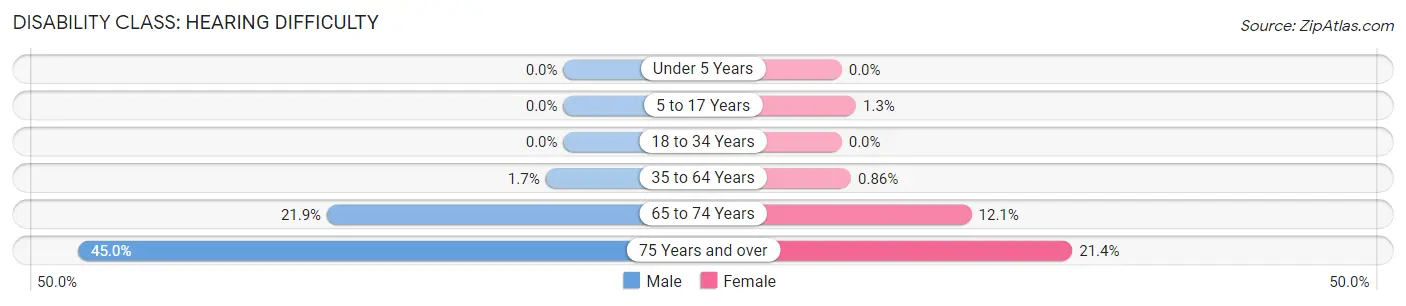
| Age Bracket | Male | Female |
| Under 5 Years | 0 (0.0%) | 0 (0.0%) |
| 5 to 17 Years | 0 (0.0%) | 6 (1.3%) |
| 18 to 34 Years | 0 (0.0%) | 0 (0.0%) |
| 35 to 64 Years | 34 (1.7%) | 14 (0.9%) |
| 65 to 74 Years | 61 (21.9%) | 53 (12.0%) |
| 75 Years and over | 118 (45.0%) | 77 (21.4%) |
Disability Class: Vision Difficulty
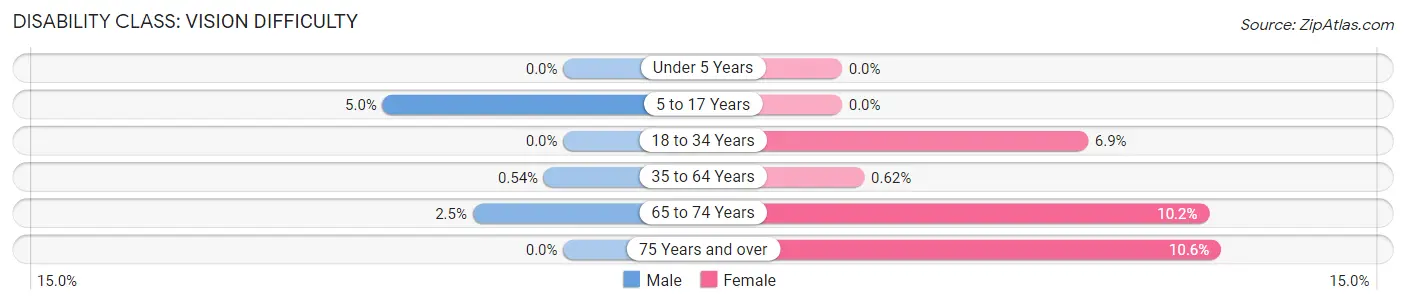
| Age Bracket | Male | Female |
| Under 5 Years | 0 (0.0%) | 0 (0.0%) |
| 5 to 17 Years | 37 (5.0%) | 0 (0.0%) |
| 18 to 34 Years | 0 (0.0%) | 89 (6.9%) |
| 35 to 64 Years | 11 (0.5%) | 10 (0.6%) |
| 65 to 74 Years | 7 (2.5%) | 45 (10.2%) |
| 75 Years and over | 0 (0.0%) | 38 (10.6%) |
Disability Class: Cognitive Difficulty
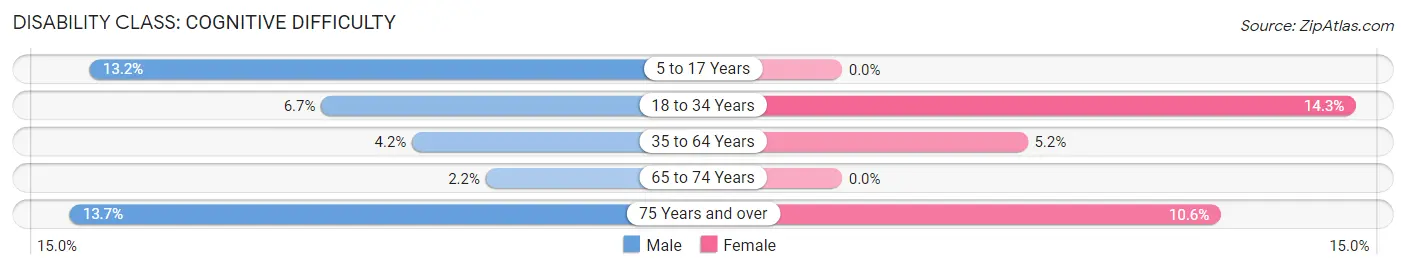
| Age Bracket | Male | Female |
| 5 to 17 Years | 97 (13.2%) | 0 (0.0%) |
| 18 to 34 Years | 87 (6.7%) | 186 (14.3%) |
| 35 to 64 Years | 86 (4.2%) | 84 (5.2%) |
| 65 to 74 Years | 6 (2.2%) | 0 (0.0%) |
| 75 Years and over | 36 (13.7%) | 38 (10.6%) |
Disability Class: Ambulatory Difficulty
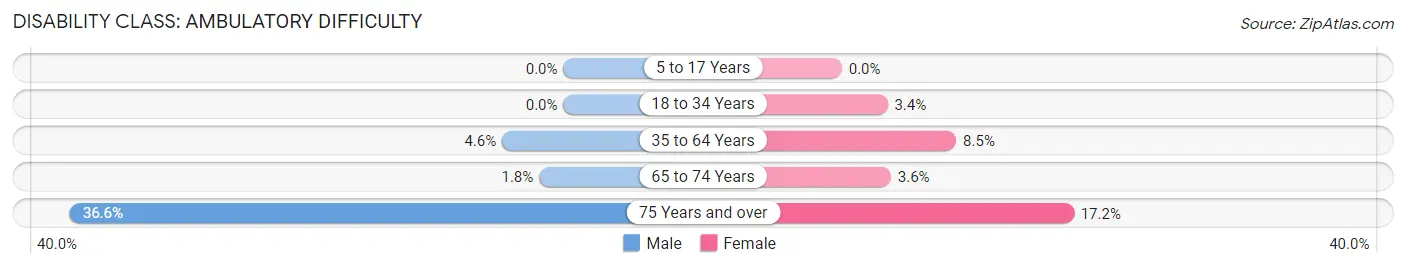
| Age Bracket | Male | Female |
| 5 to 17 Years | 0 (0.0%) | 0 (0.0%) |
| 18 to 34 Years | 0 (0.0%) | 44 (3.4%) |
| 35 to 64 Years | 93 (4.5%) | 138 (8.5%) |
| 65 to 74 Years | 5 (1.8%) | 16 (3.6%) |
| 75 Years and over | 96 (36.6%) | 62 (17.2%) |
Disability Class: Self-Care Difficulty
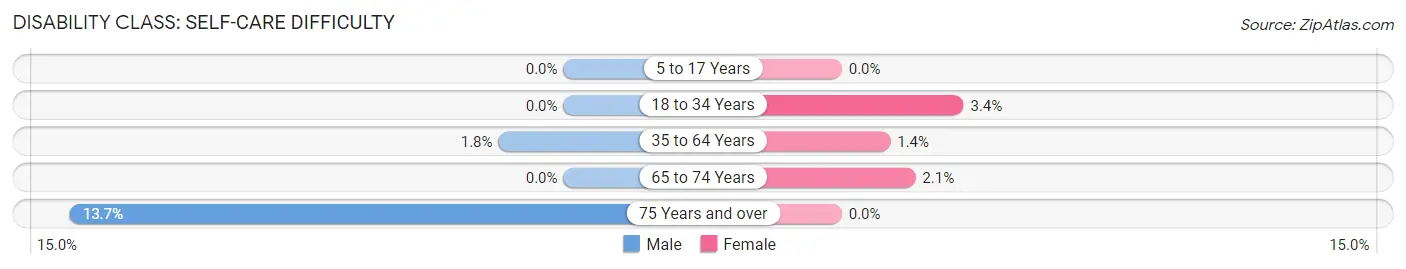
| Age Bracket | Male | Female |
| 5 to 17 Years | 0 (0.0%) | 0 (0.0%) |
| 18 to 34 Years | 0 (0.0%) | 44 (3.4%) |
| 35 to 64 Years | 37 (1.8%) | 22 (1.3%) |
| 65 to 74 Years | 0 (0.0%) | 9 (2.1%) |
| 75 Years and over | 36 (13.7%) | 0 (0.0%) |
Technology Access in Groton
Computing Device Access in Groton
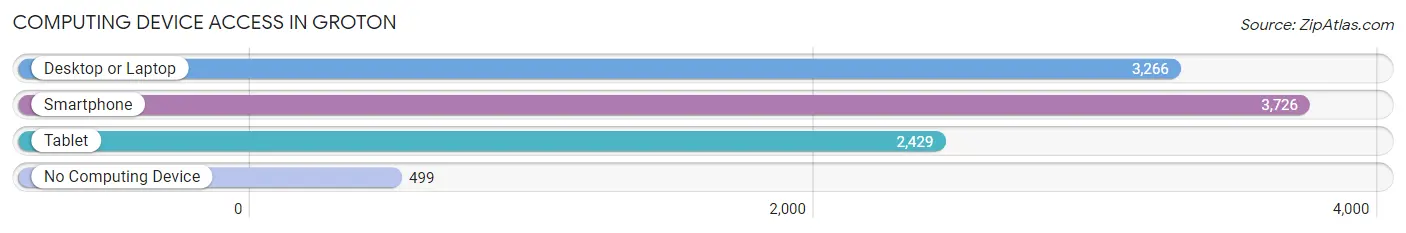
| Device Type | # Households | % Households |
| Desktop or Laptop | 3,266 | 69.6% |
| Smartphone | 3,726 | 79.4% |
| Tablet | 2,429 | 51.8% |
| No Computing Device | 499 | 10.6% |
| Total | 4,690 | 100.0% |
Internet Access in Groton
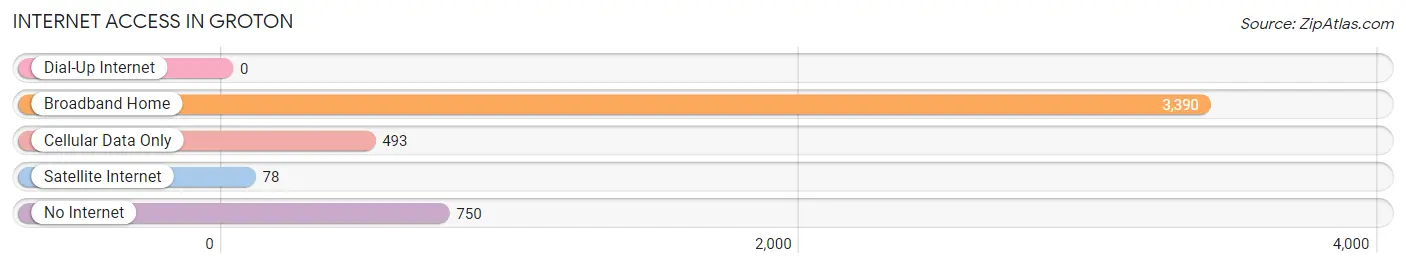
| Internet Type | # Households | % Households |
| Dial-Up Internet | 0 | 0.0% |
| Broadband Home | 3,390 | 72.3% |
| Cellular Data Only | 493 | 10.5% |
| Satellite Internet | 78 | 1.7% |
| No Internet | 750 | 16.0% |
| Total | 4,690 | 100.0% |
Groton Summary
Groton, Connecticut is a town located in New London County, Connecticut. It is situated on the Thames River and is bordered by the towns of Ledyard, Waterford, East Lyme, and Stonington. The town has a population of approximately 10,000 people and is part of the larger Norwich-New London metropolitan area.
History
The area that is now Groton was originally inhabited by the Mohegan tribe, who called the area “Mashantucket”. The first European settlers arrived in the area in 1655, and the town was officially incorporated in 1705. The town was named after the English town of Groton, Suffolk.
During the Revolutionary War, Groton was the site of several battles, including the Battle of Groton Heights in 1781. The town was also the site of the first submarine attack in history, when the American submarine Turtle attacked the British warship Eagle in 1776.
In the 19th century, Groton became an important shipbuilding center, with several shipyards located along the Thames River. The town was also home to the Electric Boat Company, which built the first nuclear-powered submarine, the USS Nautilus, in 1954.
Geography
Groton is located in southeastern Connecticut, on the Thames River. The town is bordered by the towns of Ledyard, Waterford, East Lyme, and Stonington. The town covers an area of approximately 28 square miles, and is located approximately 40 miles east of Hartford and 60 miles southwest of Boston.
The town is located in a hilly region, with several small rivers and streams running through it. The highest point in Groton is the summit of Fort Hill, which has an elevation of approximately 200 feet.
Economy
The economy of Groton is largely based on the defense industry. The town is home to the Naval Submarine Base New London, which is the primary base for the United States Navy’s submarine fleet. The base is the largest employer in the town, with approximately 10,000 employees.
The town is also home to several other defense-related companies, including Electric Boat, which builds submarines for the Navy, and Pfizer, which manufactures pharmaceuticals. Groton is also home to several manufacturing companies, including the Groton Iron Works and the Groton Shipyard.
Demographics
As of the 2010 census, the population of Groton was 9,395. The racial makeup of the town was 87.3% White, 5.2% African American, 0.7% Native American, 2.2% Asian, 0.1% Pacific Islander, and 4.5% from other races. Hispanic or Latino of any race were 6.3% of the population.
The median household income in Groton was $63,944, and the median family income was $76,945. The per capita income in Groton was $30,945. Approximately 8.3% of the population was below the poverty line.
The town is served by the Groton Public Schools system, which consists of five elementary schools, two middle schools, and one high school. The town is also home to several private schools, including the Groton School and the St. Bernard School.
Common Questions
What is Per Capita Income in Groton?
Per Capita income in Groton is $40,702.
What is the Median Family Income in Groton?
Median Family Income in Groton is $83,472.
What is the Median Household income in Groton?
Median Household Income in Groton is $64,611.
What is Income or Wage Gap in Groton?
Income or Wage Gap in Groton is 38.2%.
Women in Groton earn 61.8 cents for every dollar earned by a man.
What is Inequality or Gini Index in Groton?
Inequality or Gini Index in Groton is 0.46.
What is the Total Population of Groton?
Total Population of Groton is 9,364.
What is the Total Male Population of Groton?
Total Male Population of Groton is 5,015.
What is the Total Female Population of Groton?
Total Female Population of Groton is 4,349.
What is the Ratio of Males per 100 Females in Groton?
There are 115.31 Males per 100 Females in Groton.
What is the Ratio of Females per 100 Males in Groton?
There are 86.72 Females per 100 Males in Groton.
What is the Median Population Age in Groton?
Median Population Age in Groton is 38.0 Years.
What is the Average Family Size in Groton
Average Family Size in Groton is 2.7 People.
What is the Average Household Size in Groton
Average Household Size in Groton is 2.0 People.
How Large is the Labor Force in Groton?
There are 5,719 People in the Labor Forcein in Groton.
What is the Percentage of People in the Labor Force in Groton?
72.0% of People are in the Labor Force in Groton.
What is the Unemployment Rate in Groton?
Unemployment Rate in Groton is 6.1%.