Danielson borough, CT Map & Demographics
Danielson borough Overview
$28,055
PER CAPITA INCOME
$76,025
AVG FAMILY INCOME
$69,007
AVG HOUSEHOLD INCOME
26.2%
WAGE / INCOME GAP [ % ]
73.8¢/ $1
WAGE / INCOME GAP [ $ ]
0.35
INEQUALITY / GINI INDEX
4,162
TOTAL POPULATION
1,801
MALE POPULATION
2,361
FEMALE POPULATION
76.28
MALES / 100 FEMALES
131.09
FEMALES / 100 MALES
31.3
MEDIAN AGE
2.8
AVG FAMILY SIZE
2.3
AVG HOUSEHOLD SIZE
2,523
LABOR FORCE [ PEOPLE ]
77.2%
PERCENT IN LABOR FORCE
16.9%
UNEMPLOYMENT RATE
Income in Danielson borough
Income Overview in Danielson borough
Per Capita Income in Danielson borough is $28,055, while median incomes of families and households are $76,025 and $69,007 respectively.
| Characteristic | Number | Measure |
| Per Capita Income | 4,162 | $28,055 |
| Median Family Income | 1,047 | $76,025 |
| Mean Family Income | 1,047 | $74,219 |
| Median Household Income | 1,782 | $69,007 |
| Mean Household Income | 1,782 | $69,496 |
| Income Deficit | 1,047 | $0 |
| Wage / Income Gap (%) | 4,162 | 26.15% |
| Wage / Income Gap ($) | 4,162 | 73.85¢ per $1 |
| Gini / Inequality Index | 4,162 | 0.35 |
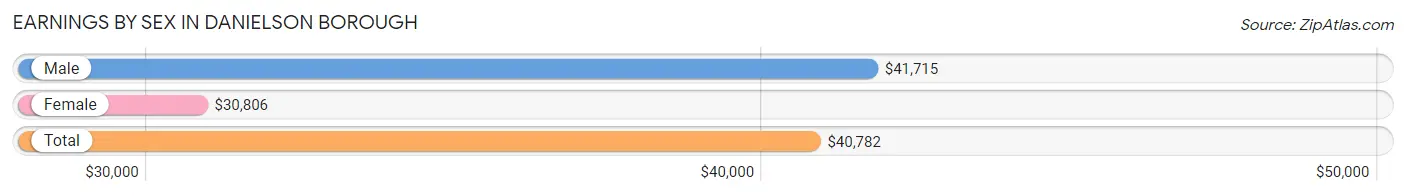
Earnings by Sex in Danielson borough
Average Earnings in Danielson borough are $40,782, $41,715 for men and $30,806 for women, a difference of 26.2%.
| Sex | Number | Average Earnings |
| Male | 1,031 (42.9%) | $41,715 |
| Female | 1,371 (57.1%) | $30,806 |
| Total | 2,402 (100.0%) | $40,782 |
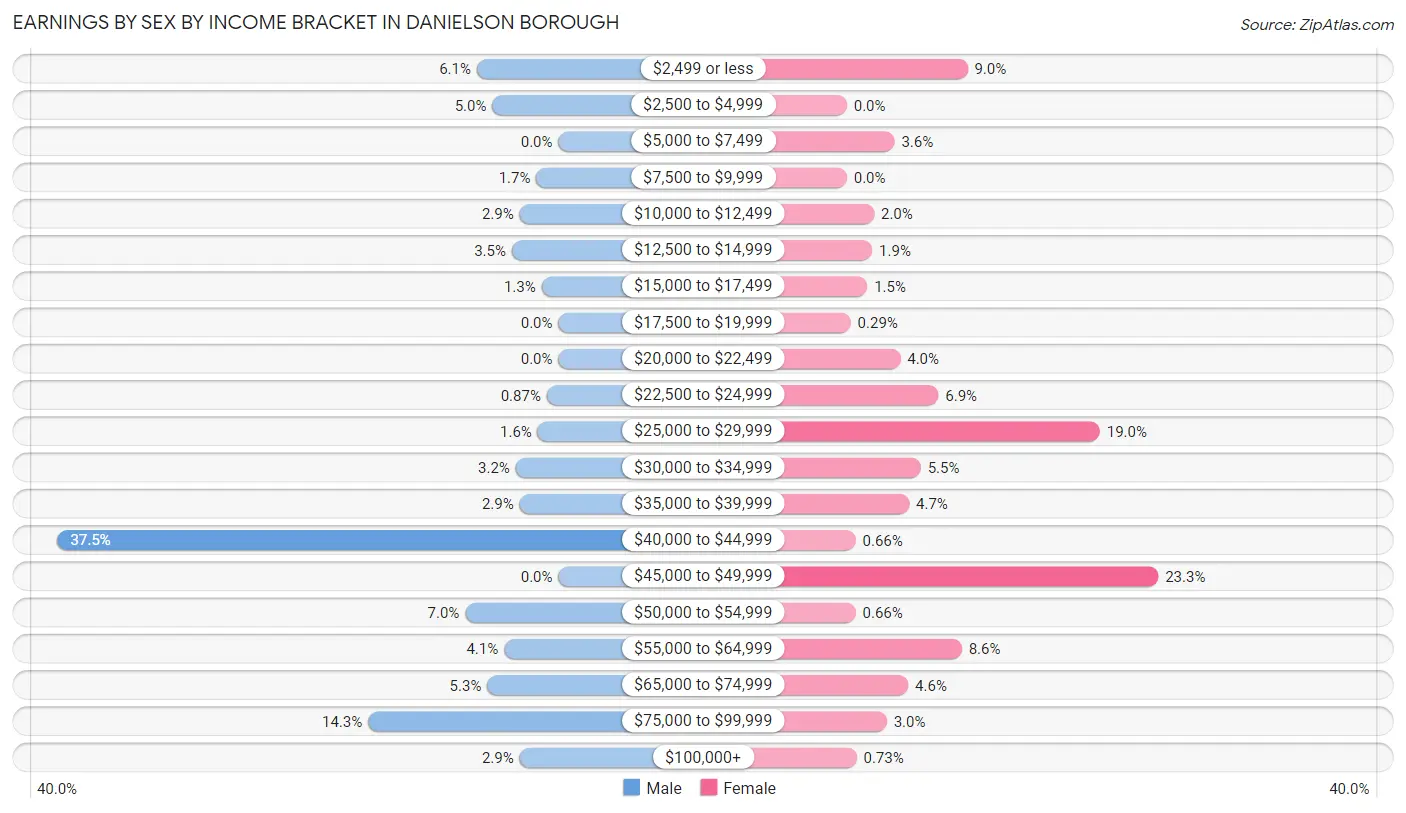
Earnings by Sex by Income Bracket in Danielson borough
The most common earnings brackets in Danielson borough are $40,000 to $44,999 for men (387 | 37.5%) and $45,000 to $49,999 for women (320 | 23.3%).
| Income | Male | Female |
| $2,499 or less | 63 (6.1%) | 124 (9.0%) |
| $2,500 to $4,999 | 51 (5.0%) | 0 (0.0%) |
| $5,000 to $7,499 | 0 (0.0%) | 49 (3.6%) |
| $7,500 to $9,999 | 17 (1.7%) | 0 (0.0%) |
| $10,000 to $12,499 | 30 (2.9%) | 28 (2.0%) |
| $12,500 to $14,999 | 36 (3.5%) | 26 (1.9%) |
| $15,000 to $17,499 | 13 (1.3%) | 21 (1.5%) |
| $17,500 to $19,999 | 0 (0.0%) | 4 (0.3%) |
| $20,000 to $22,499 | 0 (0.0%) | 55 (4.0%) |
| $22,500 to $24,999 | 9 (0.9%) | 94 (6.9%) |
| $25,000 to $29,999 | 16 (1.5%) | 260 (19.0%) |
| $30,000 to $34,999 | 33 (3.2%) | 76 (5.5%) |
| $35,000 to $39,999 | 30 (2.9%) | 64 (4.7%) |
| $40,000 to $44,999 | 387 (37.5%) | 9 (0.7%) |
| $45,000 to $49,999 | 0 (0.0%) | 320 (23.3%) |
| $50,000 to $54,999 | 72 (7.0%) | 9 (0.7%) |
| $55,000 to $64,999 | 42 (4.1%) | 118 (8.6%) |
| $65,000 to $74,999 | 55 (5.3%) | 63 (4.6%) |
| $75,000 to $99,999 | 147 (14.3%) | 41 (3.0%) |
| $100,000+ | 30 (2.9%) | 10 (0.7%) |
| Total | 1,031 (100.0%) | 1,371 (100.0%) |
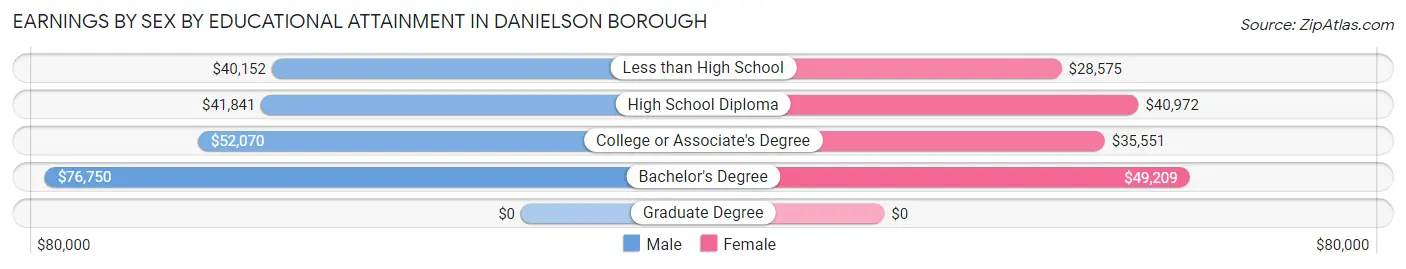
Earnings by Sex by Educational Attainment in Danielson borough
Average earnings in Danielson borough are $42,228 for men and $38,750 for women, a difference of 8.2%. Men with an educational attainment of bachelor's degree enjoy the highest average annual earnings of $76,750, while those with less than high school education earn the least with $40,152. Women with an educational attainment of bachelor's degree earn the most with the average annual earnings of $49,209, while those with less than high school education have the smallest earnings of $28,575.
| Educational Attainment | Male Income | Female Income |
| Less than High School | $40,152 | $28,575 |
| High School Diploma | $41,841 | $40,972 |
| College or Associate's Degree | $52,070 | $35,551 |
| Bachelor's Degree | $76,750 | $49,209 |
| Graduate Degree | - | - |
| Total | $42,228 | $38,750 |
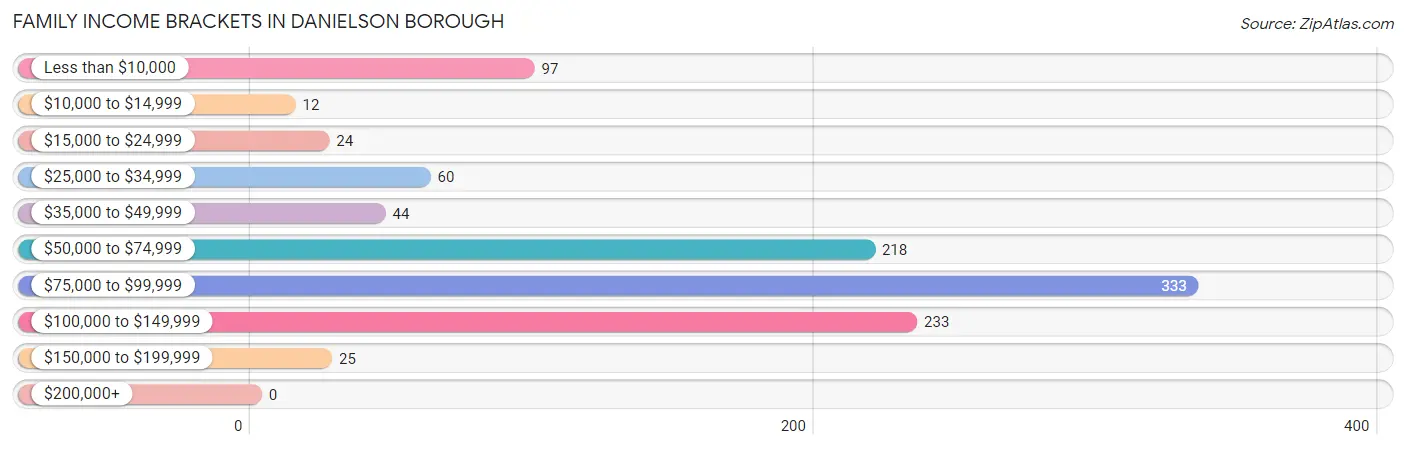
Family Income in Danielson borough
Family Income Brackets in Danielson borough
According to the Danielson borough family income data, there are 333 families falling into the $75,000 to $99,999 income range, which is the most common income bracket and makes up 31.8% of all families.
| Income Bracket | # Families | % Families |
| Less than $10,000 | 97 | 9.3% |
| $10,000 to $14,999 | 12 | 1.1% |
| $15,000 to $24,999 | 24 | 2.3% |
| $25,000 to $34,999 | 60 | 5.7% |
| $35,000 to $49,999 | 44 | 4.2% |
| $50,000 to $74,999 | 218 | 20.8% |
| $75,000 to $99,999 | 333 | 31.8% |
| $100,000 to $149,999 | 233 | 22.3% |
| $150,000 to $199,999 | 25 | 2.4% |
| $200,000+ | 0 | 0.0% |
Family Income by Famaliy Size in Danielson borough
4-person families (143 | 13.7%) account for the highest median family income in Danielson borough with $106,492 per family, while 2-person families (291 | 27.8%) have the highest median income of $37,760 per family member.
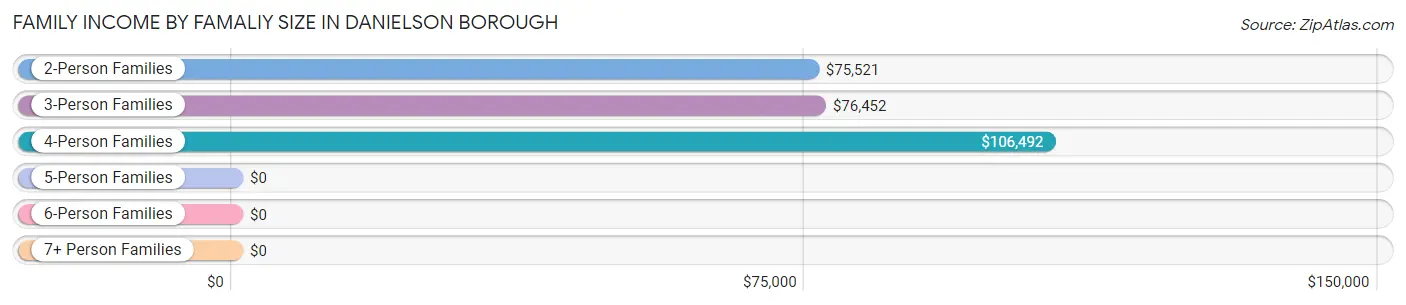
| Income Bracket | # Families | Median Income |
| 2-Person Families | 291 (27.8%) | $75,521 |
| 3-Person Families | 448 (42.8%) | $76,452 |
| 4-Person Families | 143 (13.7%) | $106,492 |
| 5-Person Families | 153 (14.6%) | $0 |
| 6-Person Families | 0 (0.0%) | $0 |
| 7+ Person Families | 12 (1.1%) | $0 |
| Total | 1,047 (100.0%) | $76,025 |
Family Income by Number of Earners in Danielson borough
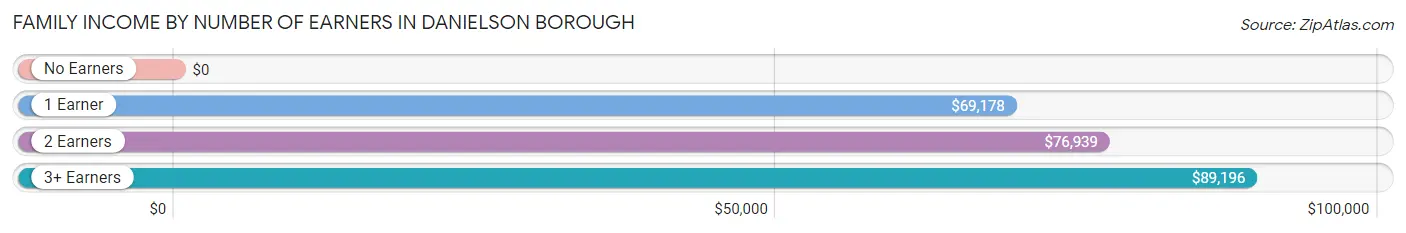
| Number of Earners | # Families | Median Income |
| No Earners | 108 (10.3%) | $0 |
| 1 Earner | 327 (31.2%) | $69,178 |
| 2 Earners | 513 (49.0%) | $76,939 |
| 3+ Earners | 99 (9.5%) | $89,196 |
| Total | 1,047 (100.0%) | $76,025 |
Household Income in Danielson borough
Household Income Brackets in Danielson borough
With 396 households falling in the category, the $75,000 to $99,999 income range is the most frequent in Danielson borough, accounting for 22.2% of all households. In contrast, only 34 households (1.9%) fall into the $200,000+ income bracket, making it the least populous group.
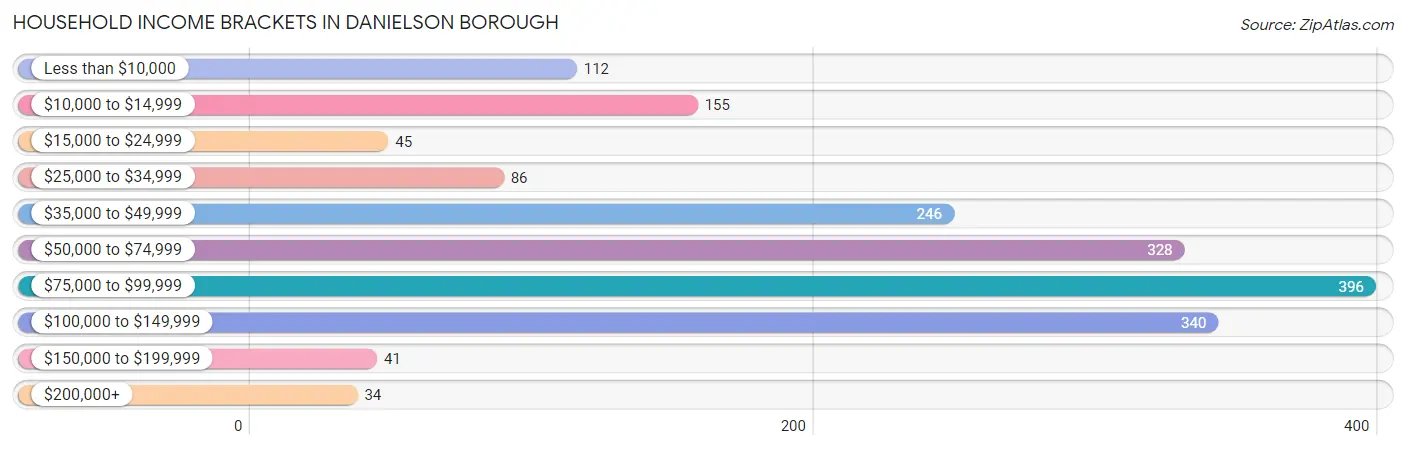
| Income Bracket | # Households | % Households |
| Less than $10,000 | 112 | 6.3% |
| $10,000 to $14,999 | 155 | 8.7% |
| $15,000 to $24,999 | 45 | 2.5% |
| $25,000 to $34,999 | 86 | 4.8% |
| $35,000 to $49,999 | 246 | 13.8% |
| $50,000 to $74,999 | 328 | 18.4% |
| $75,000 to $99,999 | 396 | 22.2% |
| $100,000 to $149,999 | 340 | 19.1% |
| $150,000 to $199,999 | 41 | 2.3% |
| $200,000+ | 34 | 1.9% |
Household Income by Householder Age in Danielson borough
The median household income in Danielson borough is $69,007, with the highest median household income of $88,788 found in the 45 to 64 years age bracket for the primary householder. A total of 435 households (24.4%) fall into this category. Meanwhile, the 15 to 24 years age bracket for the primary householder has the lowest median household income of $0, with 44 households (2.5%) in this group.
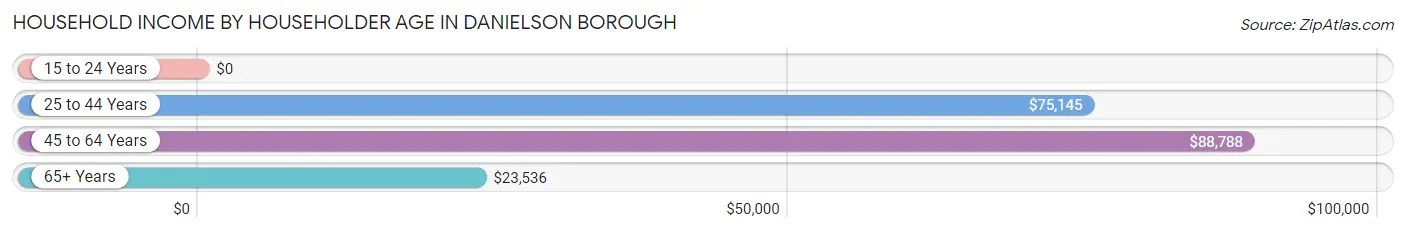
| Income Bracket | # Households | Median Income |
| 15 to 24 Years | 44 (2.5%) | $0 |
| 25 to 44 Years | 986 (55.3%) | $75,145 |
| 45 to 64 Years | 435 (24.4%) | $88,788 |
| 65+ Years | 317 (17.8%) | $23,536 |
| Total | 1,782 (100.0%) | $69,007 |
Poverty in Danielson borough
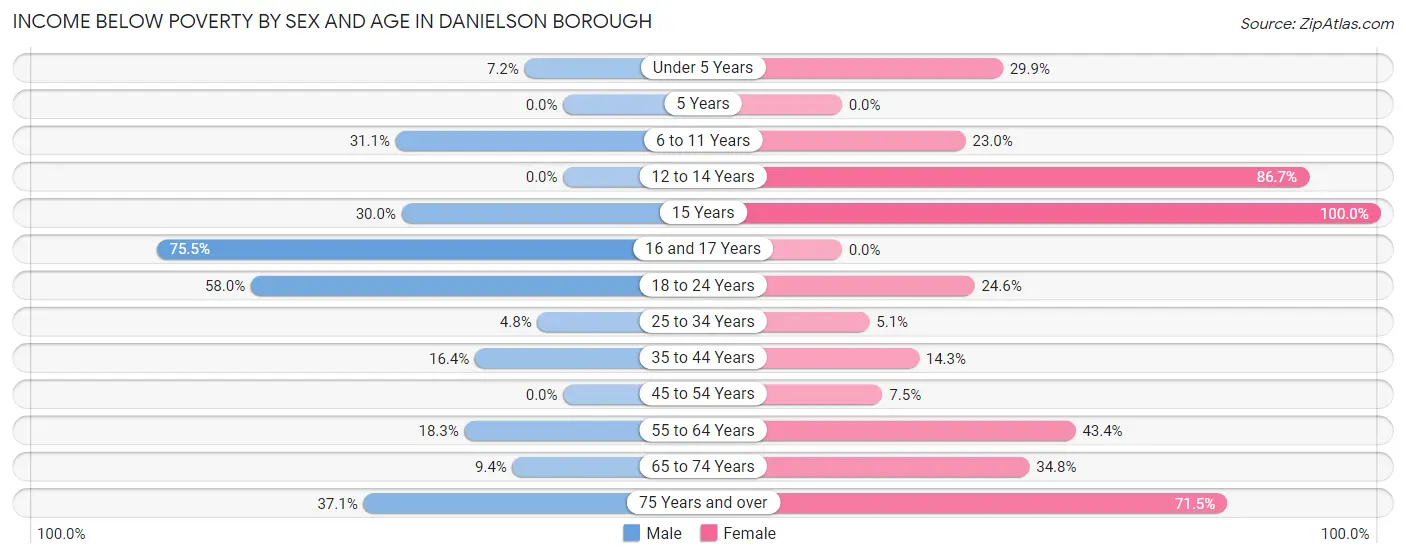
Income Below Poverty by Sex and Age in Danielson borough
With 18.6% poverty level for males and 24.4% for females among the residents of Danielson borough, 16 and 17 year old males and 15 year old females are the most vulnerable to poverty, with 37 males (75.5%) and 51 females (100.0%) in their respective age groups living below the poverty level.
| Age Bracket | Male | Female |
| Under 5 Years | 11 (7.2%) | 23 (29.9%) |
| 5 Years | 0 (0.0%) | 0 (0.0%) |
| 6 to 11 Years | 42 (31.1%) | 65 (23.0%) |
| 12 to 14 Years | 0 (0.0%) | 65 (86.7%) |
| 15 Years | 3 (30.0%) | 51 (100.0%) |
| 16 and 17 Years | 37 (75.5%) | 0 (0.0%) |
| 18 to 24 Years | 109 (58.0%) | 33 (24.6%) |
| 25 to 34 Years | 22 (4.8%) | 29 (5.1%) |
| 35 to 44 Years | 49 (16.4%) | 45 (14.3%) |
| 45 to 54 Years | 0 (0.0%) | 19 (7.5%) |
| 55 to 64 Years | 31 (18.3%) | 72 (43.4%) |
| 65 to 74 Years | 8 (9.4%) | 47 (34.8%) |
| 75 Years and over | 23 (37.1%) | 123 (71.5%) |
| Total | 335 (18.6%) | 572 (24.4%) |
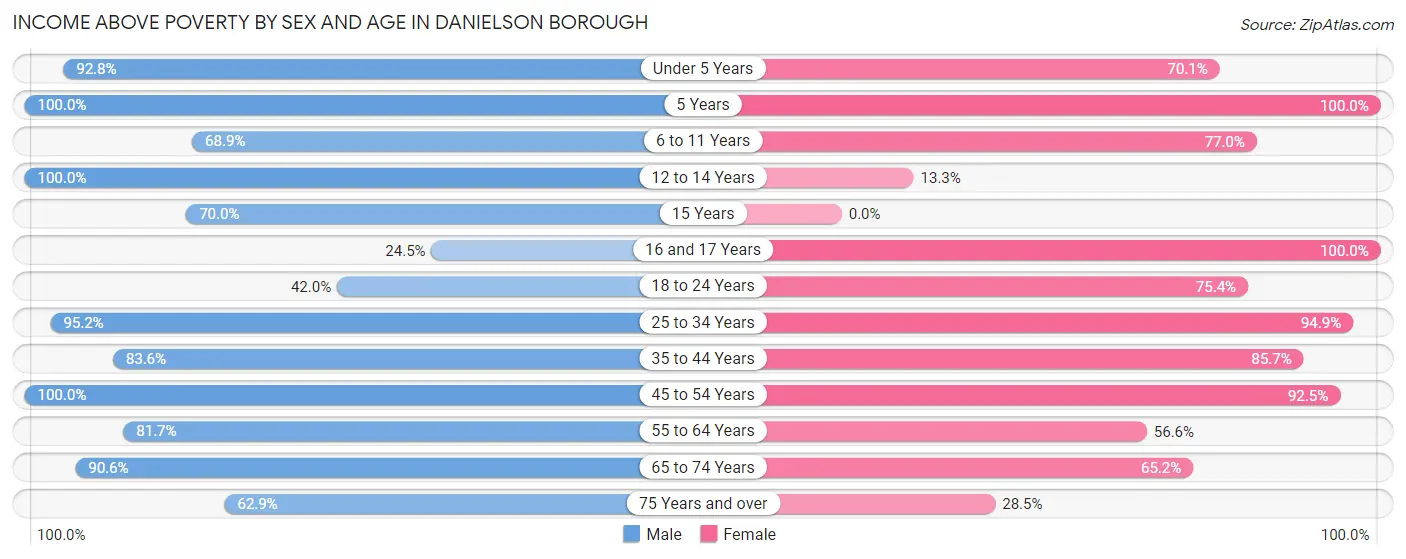
Income Above Poverty by Sex and Age in Danielson borough
According to the poverty statistics in Danielson borough, males aged 5 years and females aged 5 years are the age groups that are most secure financially, with 100.0% of males and 100.0% of females in these age groups living above the poverty line.
| Age Bracket | Male | Female |
| Under 5 Years | 142 (92.8%) | 54 (70.1%) |
| 5 Years | 10 (100.0%) | 42 (100.0%) |
| 6 to 11 Years | 93 (68.9%) | 218 (77.0%) |
| 12 to 14 Years | 48 (100.0%) | 10 (13.3%) |
| 15 Years | 7 (70.0%) | 0 (0.0%) |
| 16 and 17 Years | 12 (24.5%) | 78 (100.0%) |
| 18 to 24 Years | 79 (42.0%) | 101 (75.4%) |
| 25 to 34 Years | 436 (95.2%) | 537 (94.9%) |
| 35 to 44 Years | 250 (83.6%) | 270 (85.7%) |
| 45 to 54 Years | 135 (100.0%) | 233 (92.5%) |
| 55 to 64 Years | 138 (81.7%) | 94 (56.6%) |
| 65 to 74 Years | 77 (90.6%) | 88 (65.2%) |
| 75 Years and over | 39 (62.9%) | 49 (28.5%) |
| Total | 1,466 (81.4%) | 1,774 (75.6%) |
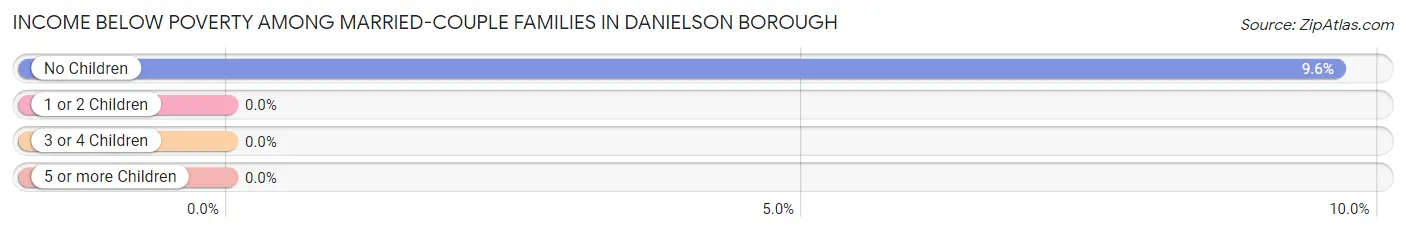
Income Below Poverty Among Married-Couple Families in Danielson borough
The poverty statistics for married-couple families in Danielson borough show that 4.7% or 24 of the total 507 families live below the poverty line. Families with no children have the highest poverty rate of 9.6%, comprising of 24 families. On the other hand, families with 1 or 2 children have the lowest poverty rate of 0.0%, which includes 0 families.
| Children | Above Poverty | Below Poverty |
| No Children | 225 (90.4%) | 24 (9.6%) |
| 1 or 2 Children | 150 (100.0%) | 0 (0.0%) |
| 3 or 4 Children | 108 (100.0%) | 0 (0.0%) |
| 5 or more Children | 0 (0.0%) | 0 (0.0%) |
| Total | 483 (95.3%) | 24 (4.7%) |
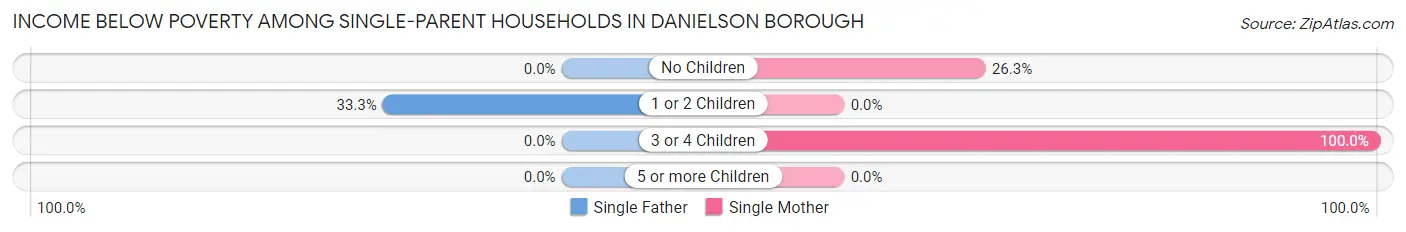
Income Below Poverty Among Single-Parent Households in Danielson borough
According to the poverty data in Danielson borough, 24.7% or 39 single-father households and 21.5% or 82 single-mother households are living below the poverty line. Among single-father households, those with 1 or 2 children have the highest poverty rate, with 39 households (33.3%) experiencing poverty. Likewise, among single-mother households, those with 3 or 4 children have the highest poverty rate, with 57 households (100.0%) falling below the poverty line.
| Children | Single Father | Single Mother |
| No Children | 0 (0.0%) | 25 (26.3%) |
| 1 or 2 Children | 39 (33.3%) | 0 (0.0%) |
| 3 or 4 Children | 0 (0.0%) | 57 (100.0%) |
| 5 or more Children | 0 (0.0%) | 0 (0.0%) |
| Total | 39 (24.7%) | 82 (21.5%) |
Income Below Poverty Among Married-Couple vs Single-Parent Households in Danielson borough
The poverty data for Danielson borough shows that 24 of the married-couple family households (4.7%) and 121 of the single-parent households (22.4%) are living below the poverty level. Within the married-couple family households, those with no children have the highest poverty rate, with 24 households (9.6%) falling below the poverty line. Among the single-parent households, those with 3 or 4 children have the highest poverty rate, with 57 household (100.0%) living below poverty.
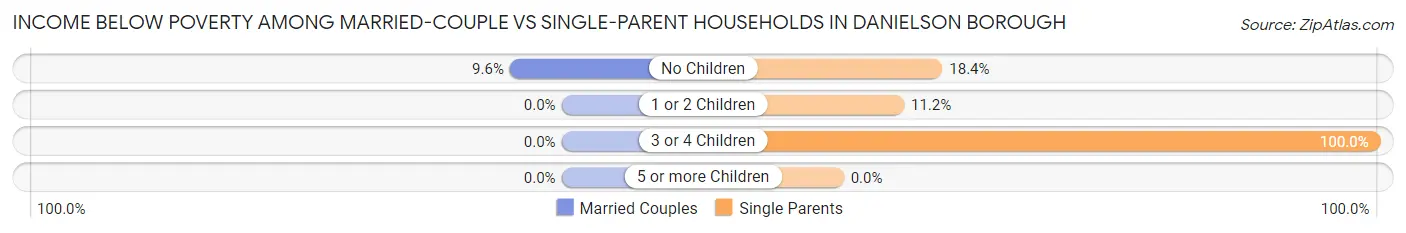
| Children | Married-Couple Families | Single-Parent Households |
| No Children | 24 (9.6%) | 25 (18.4%) |
| 1 or 2 Children | 0 (0.0%) | 39 (11.2%) |
| 3 or 4 Children | 0 (0.0%) | 57 (100.0%) |
| 5 or more Children | 0 (0.0%) | 0 (0.0%) |
| Total | 24 (4.7%) | 121 (22.4%) |
Race in Danielson borough
The most populous races in Danielson borough are White / Caucasian (2,809 | 67.5%), Hispanic or Latino (1,196 | 28.7%), and Two or more Races (667 | 16.0%).
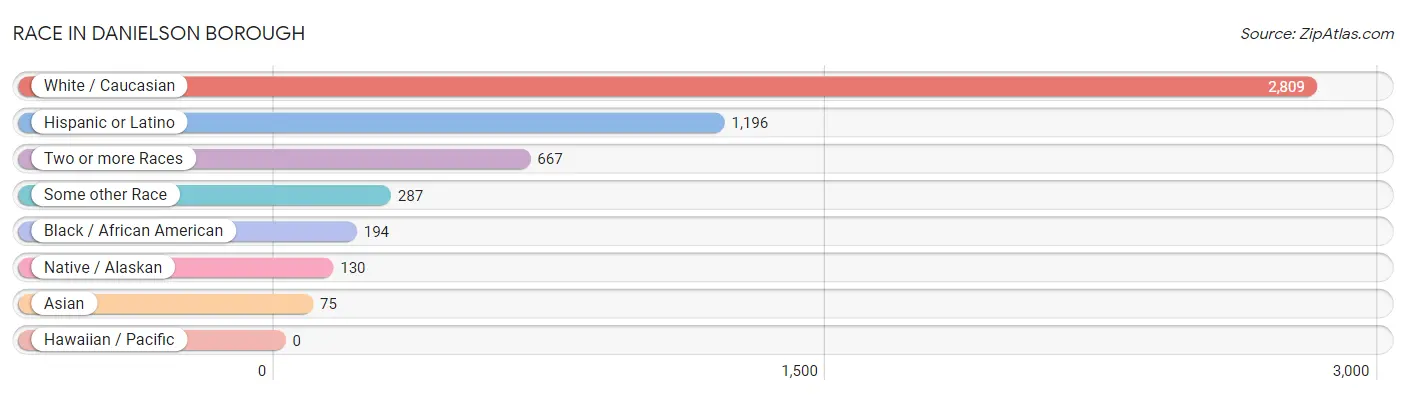
| Race | # Population | % Population |
| Asian | 75 | 1.8% |
| Black / African American | 194 | 4.7% |
| Hawaiian / Pacific | 0 | 0.0% |
| Hispanic or Latino | 1,196 | 28.7% |
| Native / Alaskan | 130 | 3.1% |
| White / Caucasian | 2,809 | 67.5% |
| Two or more Races | 667 | 16.0% |
| Some other Race | 287 | 6.9% |
| Total | 4,162 | 100.0% |
Ancestry in Danielson borough
The most populous ancestries reported in Danielson borough are Puerto Rican (529 | 12.7%), Irish (497 | 11.9%), Central American Indian (474 | 11.4%), South American (464 | 11.2%), and English (400 | 9.6%), together accounting for 56.8% of all Danielson borough residents.
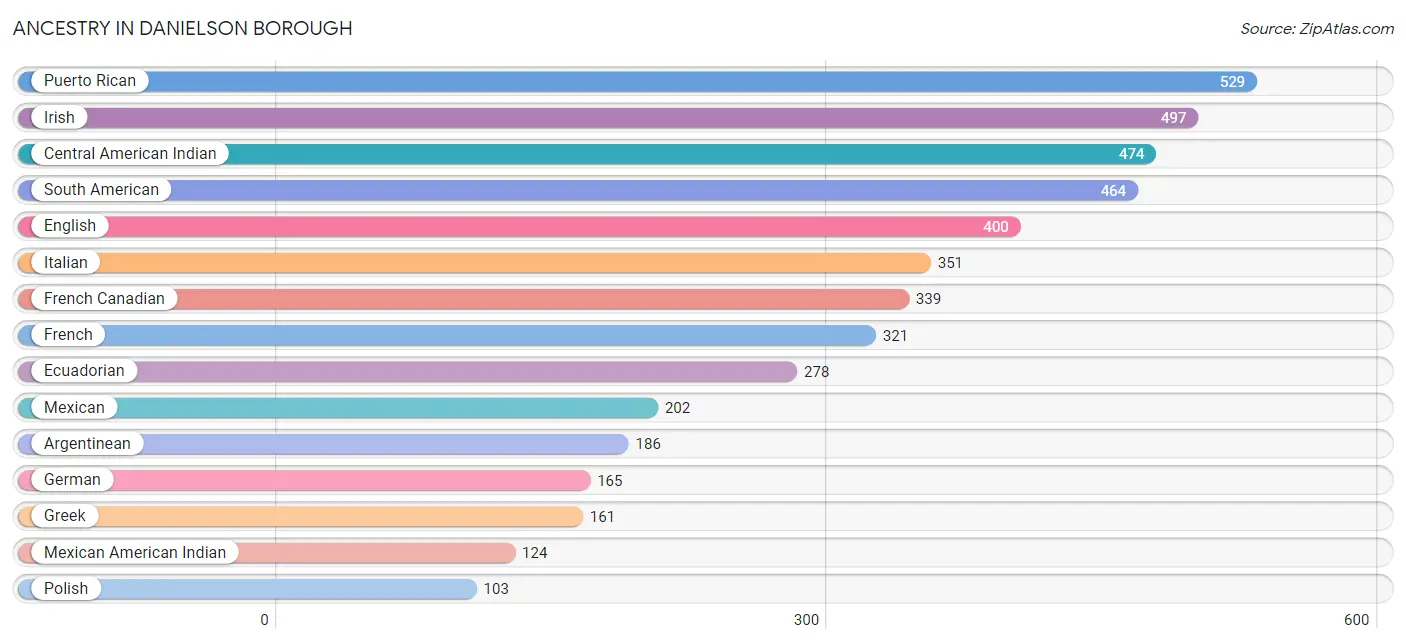
| Ancestry | # Population | % Population |
| American | 22 | 0.5% |
| Arab | 11 | 0.3% |
| Argentinean | 186 | 4.5% |
| Blackfeet | 12 | 0.3% |
| Brazilian | 15 | 0.4% |
| Central American Indian | 474 | 11.4% |
| Cherokee | 25 | 0.6% |
| Dominican | 1 | 0.0% |
| Ecuadorian | 278 | 6.7% |
| English | 400 | 9.6% |
| European | 27 | 0.6% |
| French | 321 | 7.7% |
| French Canadian | 339 | 8.2% |
| German | 165 | 4.0% |
| Greek | 161 | 3.9% |
| Indian (Asian) | 64 | 1.5% |
| Irish | 497 | 11.9% |
| Iroquois | 25 | 0.6% |
| Italian | 351 | 8.4% |
| Korean | 11 | 0.3% |
| Luxembourger | 11 | 0.3% |
| Mexican | 202 | 4.9% |
| Mexican American Indian | 124 | 3.0% |
| Polish | 103 | 2.5% |
| Portuguese | 74 | 1.8% |
| Puerto Rican | 529 | 12.7% |
| Russian | 11 | 0.3% |
| Scotch-Irish | 10 | 0.2% |
| Scottish | 54 | 1.3% |
| South American | 464 | 11.2% |
| Swedish | 48 | 1.1% | View All 31 Rows |
Immigrants in Danielson borough
The most numerous immigrant groups reported in Danielson borough came from Central America (124 | 3.0%), Latin America (124 | 3.0%), Mexico (124 | 3.0%), Asia (64 | 1.5%), and China (64 | 1.5%), together accounting for 12.0% of all Danielson borough residents.
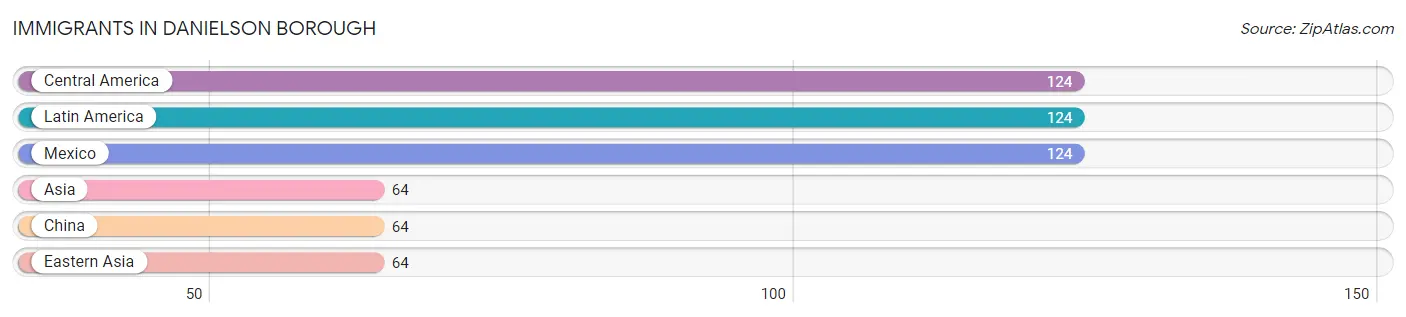
| Immigration Origin | # Population | % Population |
| Asia | 64 | 1.5% |
| Central America | 124 | 3.0% |
| China | 64 | 1.5% |
| Eastern Asia | 64 | 1.5% |
| Latin America | 124 | 3.0% |
| Mexico | 124 | 3.0% | View All 6 Rows |
Sex and Age in Danielson borough
Sex and Age in Danielson borough
The most populous age groups in Danielson borough are 40 to 44 Years (261 | 14.5%) for men and 30 to 34 Years (319 | 13.5%) for women.
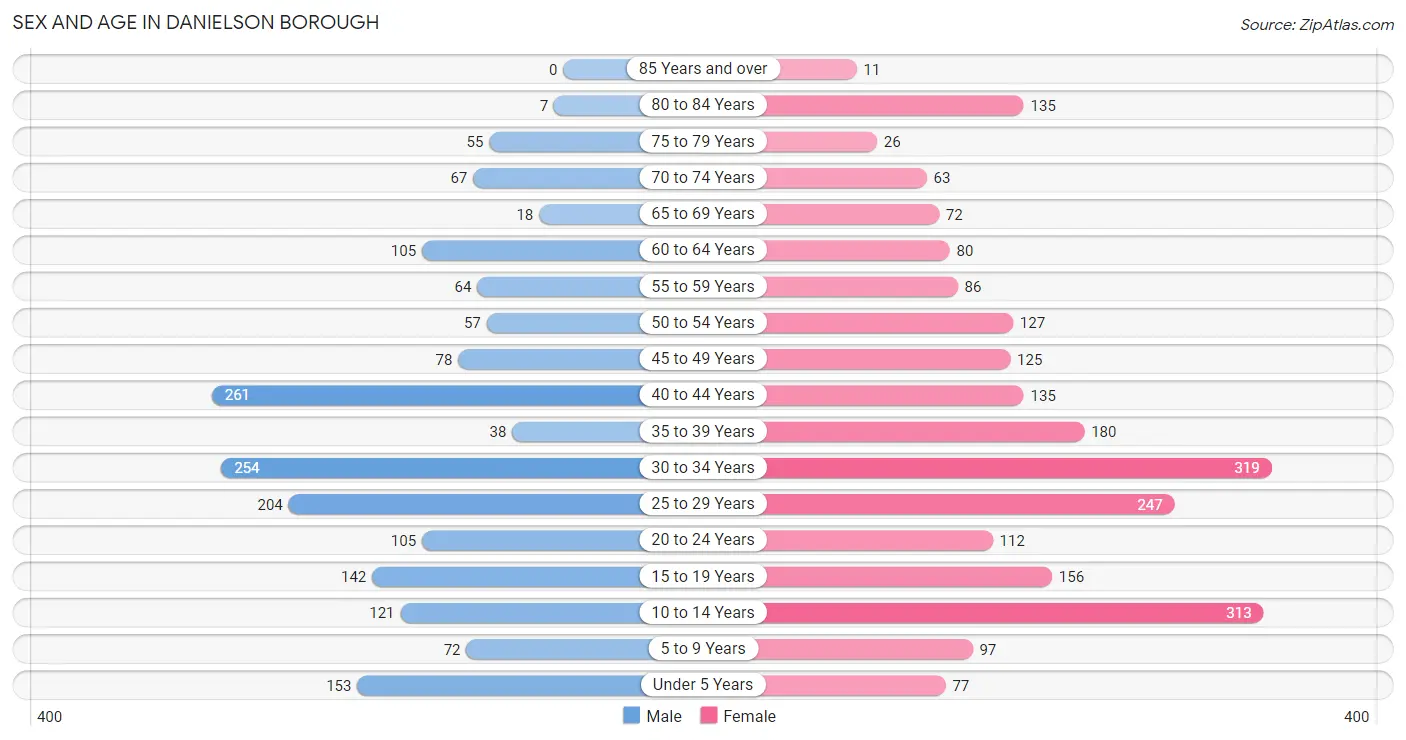
| Age Bracket | Male | Female |
| Under 5 Years | 153 (8.5%) | 77 (3.3%) |
| 5 to 9 Years | 72 (4.0%) | 97 (4.1%) |
| 10 to 14 Years | 121 (6.7%) | 313 (13.3%) |
| 15 to 19 Years | 142 (7.9%) | 156 (6.6%) |
| 20 to 24 Years | 105 (5.8%) | 112 (4.7%) |
| 25 to 29 Years | 204 (11.3%) | 247 (10.5%) |
| 30 to 34 Years | 254 (14.1%) | 319 (13.5%) |
| 35 to 39 Years | 38 (2.1%) | 180 (7.6%) |
| 40 to 44 Years | 261 (14.5%) | 135 (5.7%) |
| 45 to 49 Years | 78 (4.3%) | 125 (5.3%) |
| 50 to 54 Years | 57 (3.2%) | 127 (5.4%) |
| 55 to 59 Years | 64 (3.5%) | 86 (3.6%) |
| 60 to 64 Years | 105 (5.8%) | 80 (3.4%) |
| 65 to 69 Years | 18 (1.0%) | 72 (3.0%) |
| 70 to 74 Years | 67 (3.7%) | 63 (2.7%) |
| 75 to 79 Years | 55 (3.0%) | 26 (1.1%) |
| 80 to 84 Years | 7 (0.4%) | 135 (5.7%) |
| 85 Years and over | 0 (0.0%) | 11 (0.5%) |
| Total | 1,801 (100.0%) | 2,361 (100.0%) |
Families and Households in Danielson borough
Median Family Size in Danielson borough
The median family size in Danielson borough is 2.84 persons per family, with married-couple families (507 | 48.4%) accounting for the largest median family size of 3.02 persons per family. On the other hand, single male/father families (158 | 15.1%) represent the smallest median family size with 2.56 persons per family.
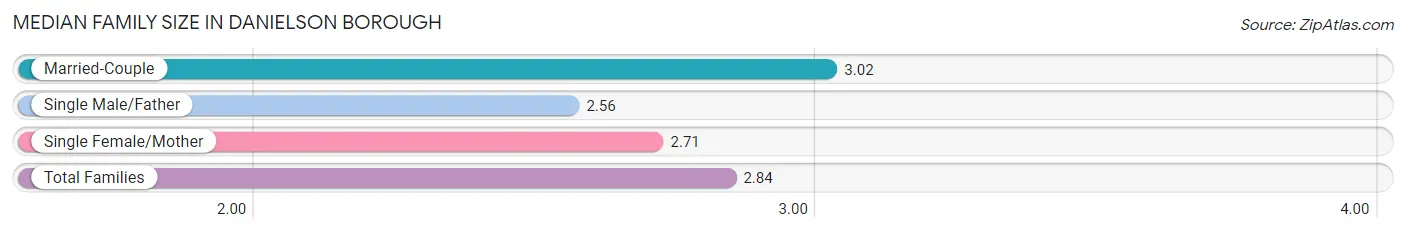
| Family Type | # Families | Family Size |
| Married-Couple | 507 (48.4%) | 3.02 |
| Single Male/Father | 158 (15.1%) | 2.56 |
| Single Female/Mother | 382 (36.5%) | 2.71 |
| Total Families | 1,047 (100.0%) | 2.84 |
Median Household Size in Danielson borough
The median household size in Danielson borough is 2.31 persons per household, with married-couple households (507 | 28.4%) accounting for the largest median household size of 3.11 persons per household. non-family households (735 | 41.2%) represent the smallest median household size with 1.39 persons per household.
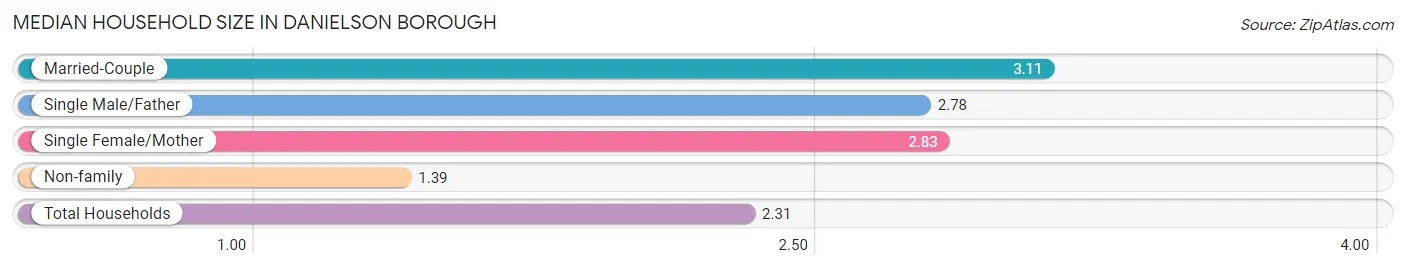
| Household Type | # Households | Household Size |
| Married-Couple | 507 (28.4%) | 3.11 |
| Single Male/Father | 158 (8.9%) | 2.78 |
| Single Female/Mother | 382 (21.4%) | 2.83 |
| Non-family | 735 (41.2%) | 1.39 |
| Total Households | 1,782 (100.0%) | 2.31 |
Household Size by Marriage Status in Danielson borough
Out of a total of 1,782 households in Danielson borough, 1,047 (58.8%) are family households, while 735 (41.2%) are nonfamily households. The most numerous type of family households are 3-person households, comprising 405, and the most common type of nonfamily households are 1-person households, comprising 462.
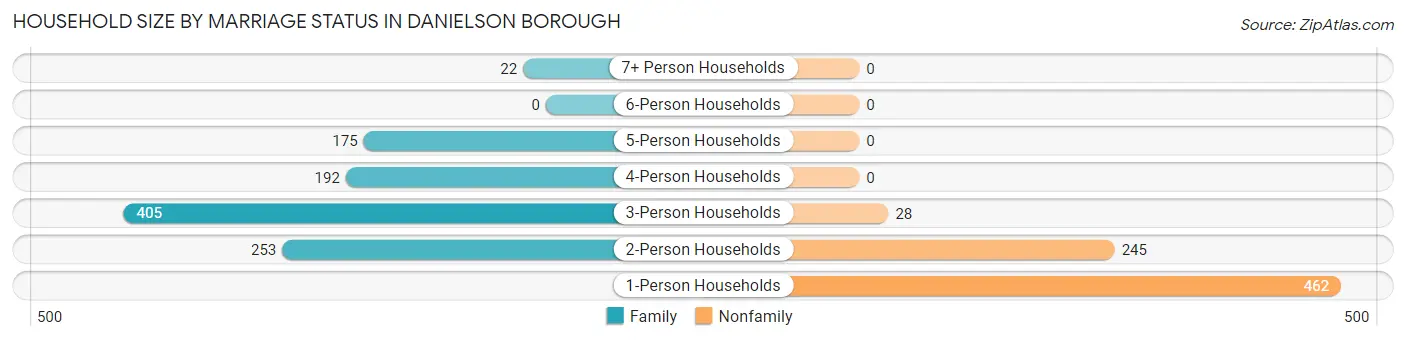
| Household Size | Family Households | Nonfamily Households |
| 1-Person Households | - | 462 (25.9%) |
| 2-Person Households | 253 (14.2%) | 245 (13.8%) |
| 3-Person Households | 405 (22.7%) | 28 (1.6%) |
| 4-Person Households | 192 (10.8%) | 0 (0.0%) |
| 5-Person Households | 175 (9.8%) | 0 (0.0%) |
| 6-Person Households | 0 (0.0%) | 0 (0.0%) |
| 7+ Person Households | 22 (1.2%) | 0 (0.0%) |
| Total | 1,047 (58.8%) | 735 (41.2%) |
Female Fertility in Danielson borough
Fertility by Age in Danielson borough
Average fertility rate in Danielson borough is 23.0 births per 1,000 women. Women in the age bracket of 20 to 34 years have the highest fertility rate with 37.0 births per 1,000 women. Women in the age bracket of 20 to 34 years acount for 83.3% of all women with births.
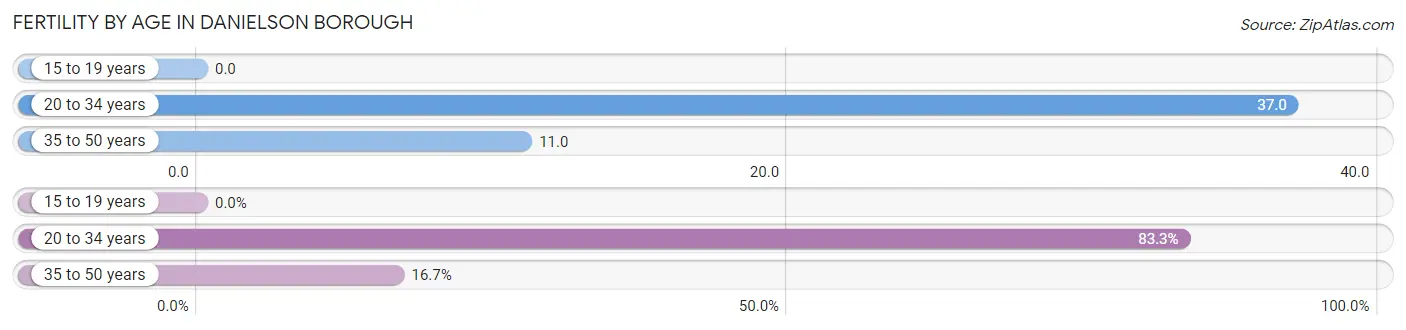
| Age Bracket | Women with Births | Births / 1,000 Women |
| 15 to 19 years | 0 (0.0%) | 0.0 |
| 20 to 34 years | 25 (83.3%) | 37.0 |
| 35 to 50 years | 5 (16.7%) | 11.0 |
| Total | 30 (100.0%) | 23.0 |
Fertility by Age by Marriage Status in Danielson borough
43.3% of women with births (30) in Danielson borough are married. The highest percentage of unmarried women with births falls into 35 to 50 years age bracket with 100.0% of them unmarried at the time of birth, while the lowest percentage of unmarried women with births belong to 20 to 34 years age bracket with 48.0% of them unmarried.
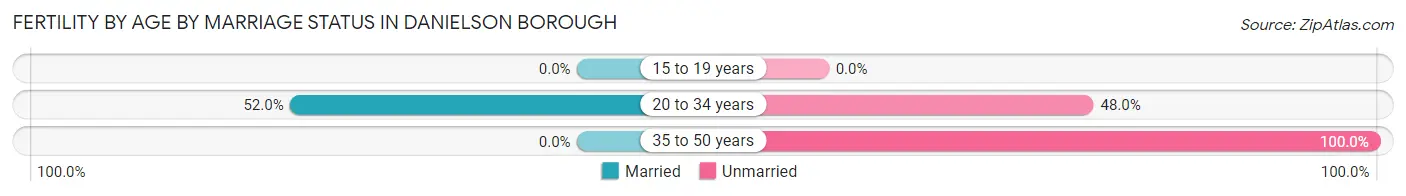
| Age Bracket | Married | Unmarried |
| 15 to 19 years | 0 (0.0%) | 0 (0.0%) |
| 20 to 34 years | 13 (52.0%) | 12 (48.0%) |
| 35 to 50 years | 0 (0.0%) | 5 (100.0%) |
| Total | 13 (43.3%) | 17 (56.7%) |
Fertility by Education in Danielson borough
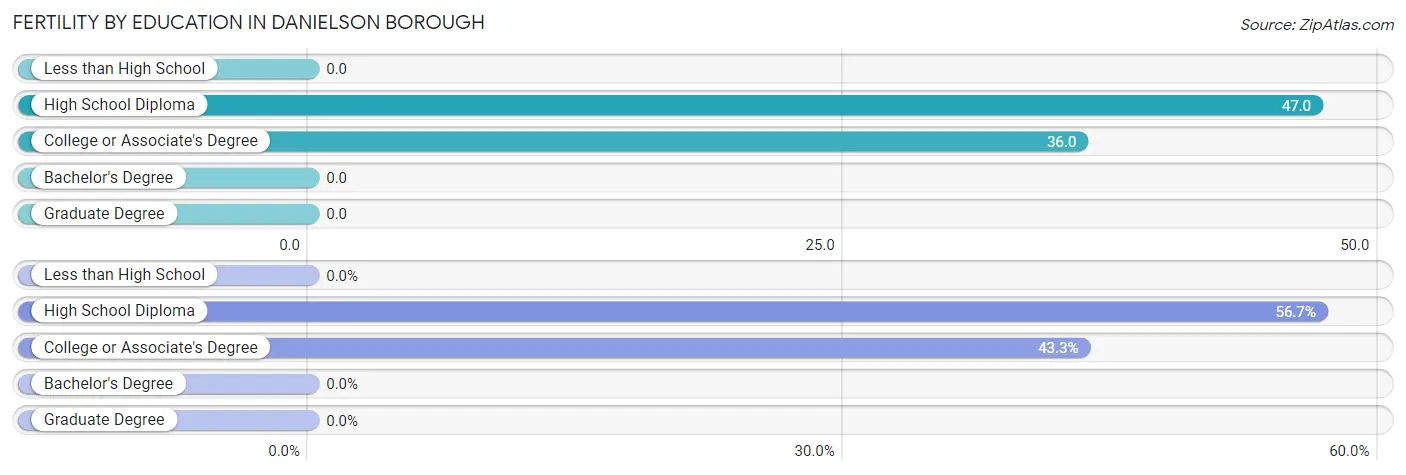
| Educational Attainment | Women with Births | Births / 1,000 Women |
| Less than High School | 0 (0.0%) | 0.0 |
| High School Diploma | 17 (56.7%) | 47.0 |
| College or Associate's Degree | 13 (43.3%) | 36.0 |
| Bachelor's Degree | 0 (0.0%) | 0.0 |
| Graduate Degree | 0 (0.0%) | 0.0 |
| Total | 30 (100.0%) | 23.0 |
Fertility by Education by Marriage Status in Danielson borough
56.7% of women with births in Danielson borough are unmarried. Women with the educational attainment of college or associate's degree are most likely to be married with 100.0% of them married at childbirth, while women with the educational attainment of high school diploma are least likely to be married with 100.0% of them unmarried at childbirth.
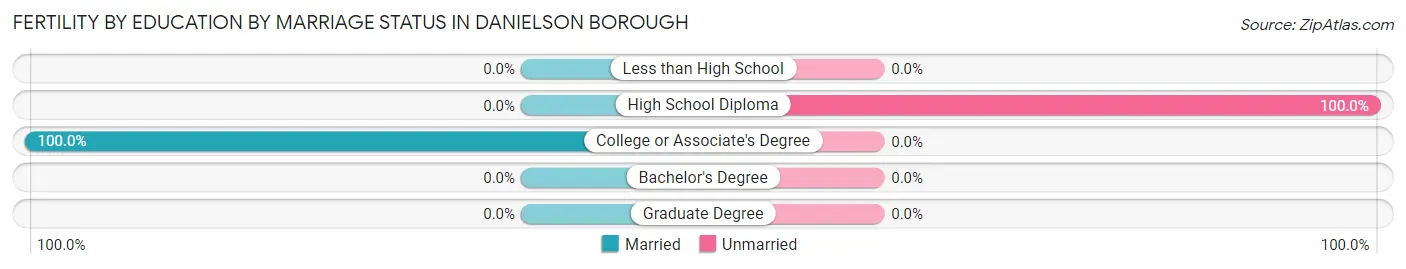
| Educational Attainment | Married | Unmarried |
| Less than High School | 0 (0.0%) | 0 (0.0%) |
| High School Diploma | 0 (0.0%) | 17 (100.0%) |
| College or Associate's Degree | 13 (100.0%) | 0 (0.0%) |
| Bachelor's Degree | 0 (0.0%) | 0 (0.0%) |
| Graduate Degree | 0 (0.0%) | 0 (0.0%) |
| Total | 13 (43.3%) | 17 (56.7%) |
Employment Characteristics in Danielson borough
Employment by Class of Employer in Danielson borough
Among the 2,086 employed individuals in Danielson borough, private company employees (1,816 | 87.1%), not-for-profit organizations (143 | 6.9%), and federal government employees (42 | 2.0%) make up the most common classes of employment.
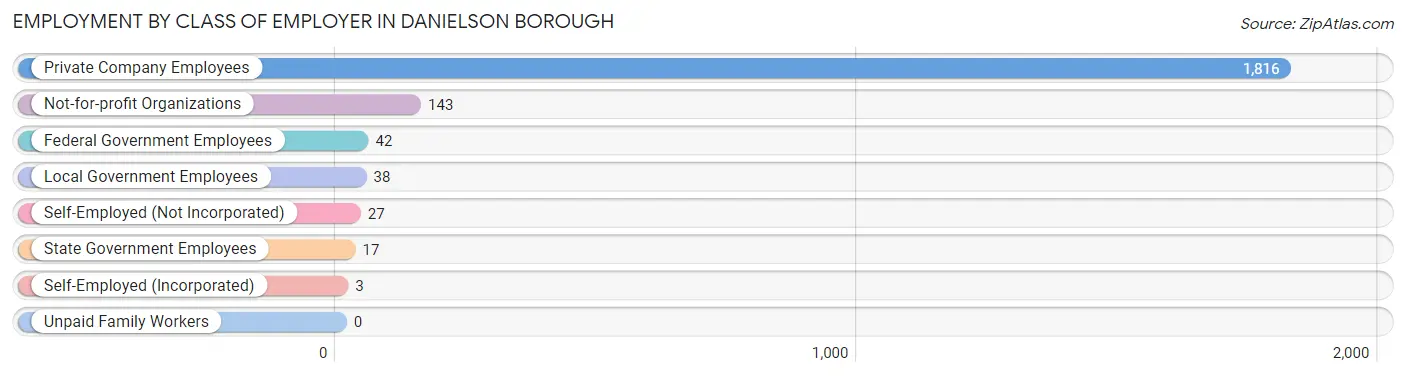
| Employer Class | # Employees | % Employees |
| Private Company Employees | 1,816 | 87.1% |
| Self-Employed (Incorporated) | 3 | 0.1% |
| Self-Employed (Not Incorporated) | 27 | 1.3% |
| Not-for-profit Organizations | 143 | 6.9% |
| Local Government Employees | 38 | 1.8% |
| State Government Employees | 17 | 0.8% |
| Federal Government Employees | 42 | 2.0% |
| Unpaid Family Workers | 0 | 0.0% |
| Total | 2,086 | 100.0% |
Employment Status by Age in Danielson borough
According to the labor force statistics for Danielson borough, out of the total population over 16 years of age (3,268), 77.2% or 2,523 individuals are in the labor force, with 16.9% or 426 of them unemployed. The age group with the highest labor force participation rate is 25 to 29 years, with 100.0% or 451 individuals in the labor force. Within the labor force, the 20 to 24 years age range has the highest percentage of unemployed individuals, with 50.0% or 79 of them being unemployed.
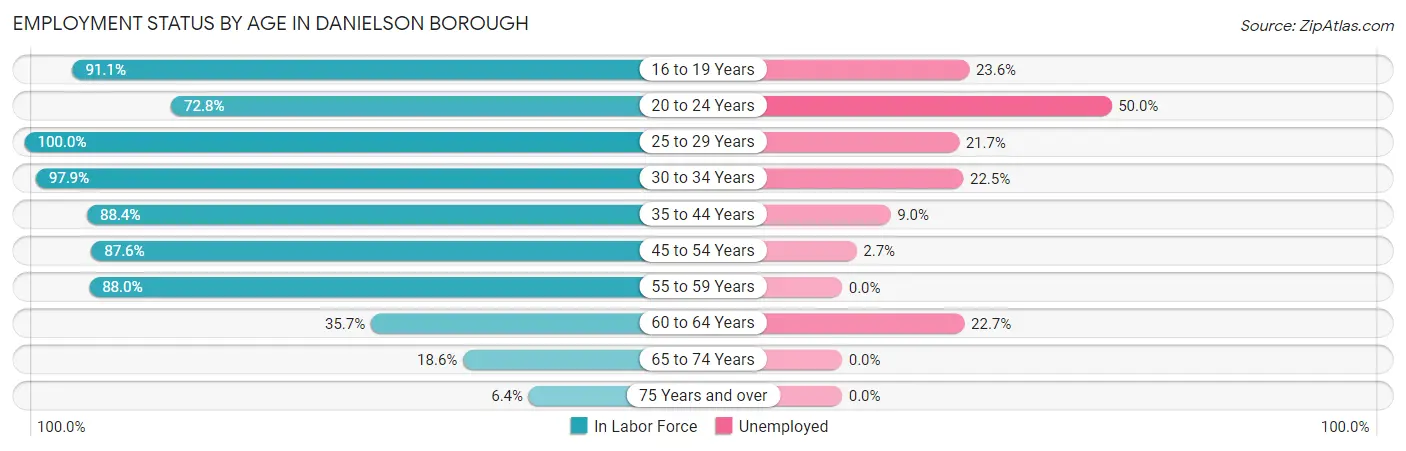
| Age Bracket | In Labor Force | Unemployed |
| 16 to 19 Years | 216 (91.1%) | 51 (23.6%) |
| 20 to 24 Years | 158 (72.8%) | 79 (50.0%) |
| 25 to 29 Years | 451 (100.0%) | 98 (21.7%) |
| 30 to 34 Years | 561 (97.9%) | 126 (22.5%) |
| 35 to 44 Years | 543 (88.4%) | 49 (9.0%) |
| 45 to 54 Years | 339 (87.6%) | 9 (2.7%) |
| 55 to 59 Years | 132 (88.0%) | 0 (0.0%) |
| 60 to 64 Years | 66 (35.7%) | 15 (22.7%) |
| 65 to 74 Years | 41 (18.6%) | 0 (0.0%) |
| 75 Years and over | 15 (6.4%) | 0 (0.0%) |
| Total | 2,523 (77.2%) | 426 (16.9%) |
Employment Status by Educational Attainment in Danielson borough
According to labor force statistics for Danielson borough, 88.6% of individuals (2,091) out of the total population between 25 and 64 years of age (2,360) are in the labor force, with 14.2% or 297 of them being unemployed. The group with the highest labor force participation rate are those with the educational attainment of bachelor's degree or higher, with 95.9% or 304 individuals in the labor force. Within the labor force, individuals with less than high school education have the highest percentage of unemployment, with 63.7% or 109 of them being unemployed.
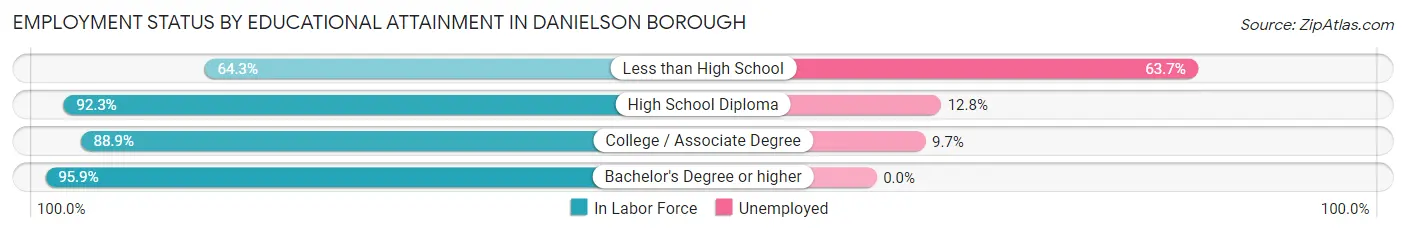
| Educational Attainment | In Labor Force | Unemployed |
| Less than High School | 171 (64.3%) | 169 (63.7%) |
| High School Diploma | 1,011 (92.3%) | 140 (12.8%) |
| College / Associate Degree | 606 (88.9%) | 66 (9.7%) |
| Bachelor's Degree or higher | 304 (95.9%) | 0 (0.0%) |
| Total | 2,091 (88.6%) | 335 (14.2%) |
Employment Occupations by Sex in Danielson borough
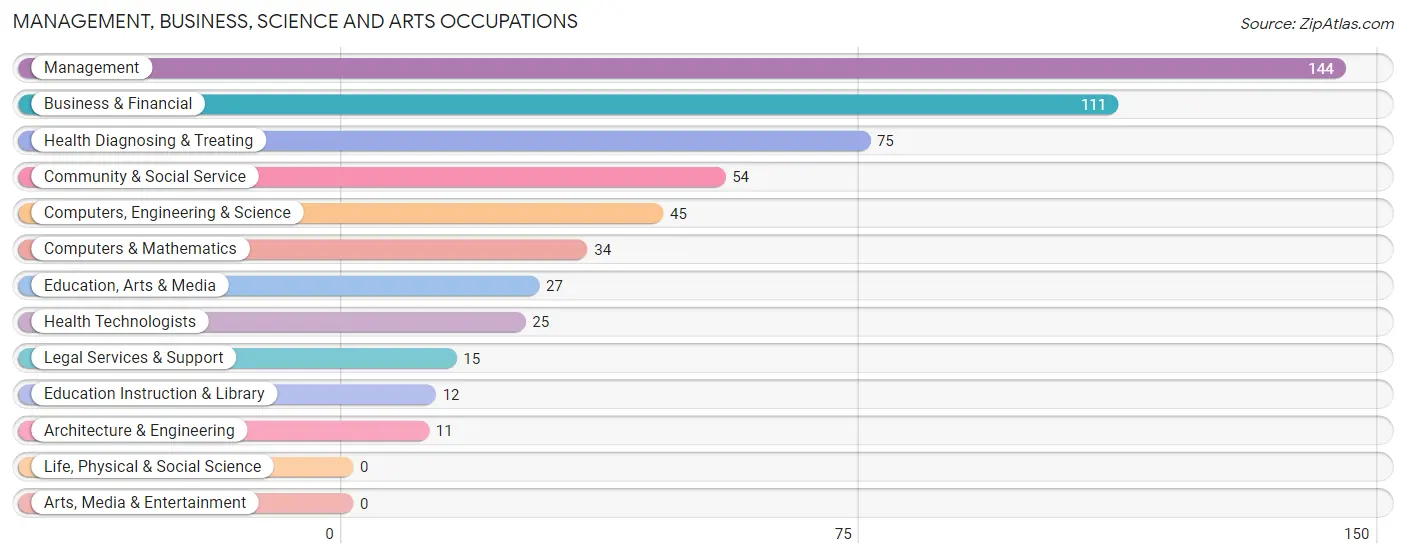
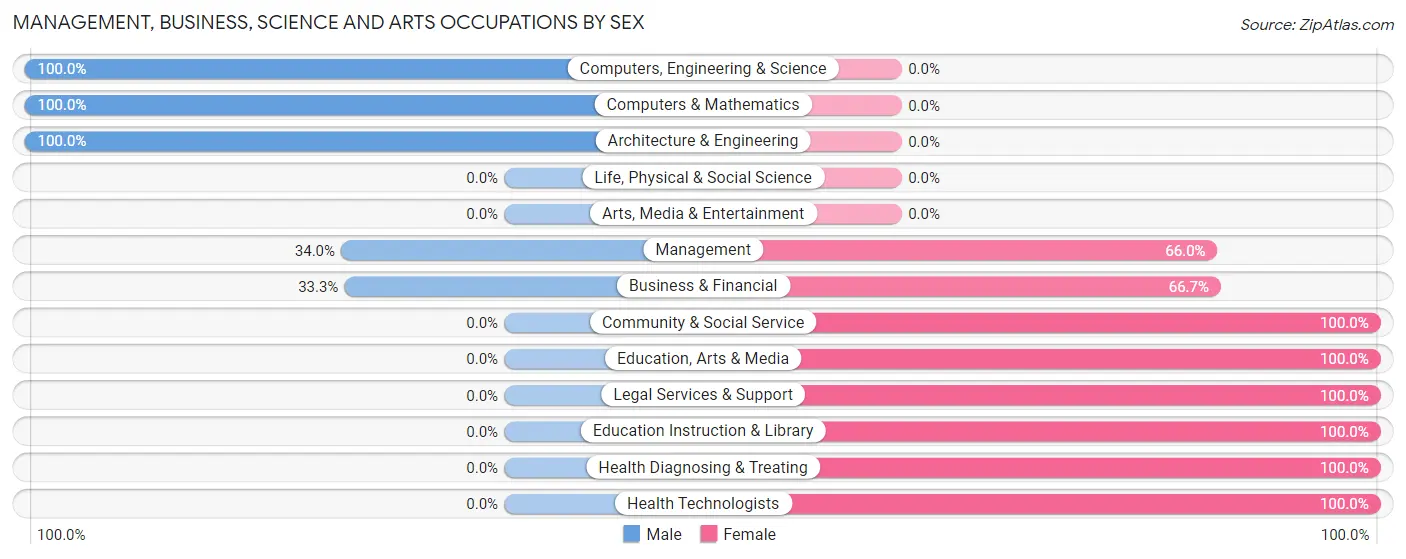
Management, Business, Science and Arts Occupations
The most common Management, Business, Science and Arts occupations in Danielson borough are Management (144 | 6.9%), Business & Financial (111 | 5.3%), Health Diagnosing & Treating (75 | 3.6%), Community & Social Service (54 | 2.6%), and Computers, Engineering & Science (45 | 2.1%).
Management, Business, Science and Arts Occupations by Sex
Within the Management, Business, Science and Arts occupations in Danielson borough, the most male-oriented occupations are Computers, Engineering & Science (100.0%), Computers & Mathematics (100.0%), and Architecture & Engineering (100.0%), while the most female-oriented occupations are Community & Social Service (100.0%), Education, Arts & Media (100.0%), and Legal Services & Support (100.0%).
| Occupation | Male | Female |
| Management | 49 (34.0%) | 95 (66.0%) |
| Business & Financial | 37 (33.3%) | 74 (66.7%) |
| Computers, Engineering & Science | 45 (100.0%) | 0 (0.0%) |
| Computers & Mathematics | 34 (100.0%) | 0 (0.0%) |
| Architecture & Engineering | 11 (100.0%) | 0 (0.0%) |
| Life, Physical & Social Science | 0 (0.0%) | 0 (0.0%) |
| Community & Social Service | 0 (0.0%) | 54 (100.0%) |
| Education, Arts & Media | 0 (0.0%) | 27 (100.0%) |
| Legal Services & Support | 0 (0.0%) | 15 (100.0%) |
| Education Instruction & Library | 0 (0.0%) | 12 (100.0%) |
| Arts, Media & Entertainment | 0 (0.0%) | 0 (0.0%) |
| Health Diagnosing & Treating | 0 (0.0%) | 75 (100.0%) |
| Health Technologists | 0 (0.0%) | 25 (100.0%) |
| Total (Category) | 131 (30.5%) | 298 (69.5%) |
| Total (Overall) | 906 (43.2%) | 1,189 (56.8%) |
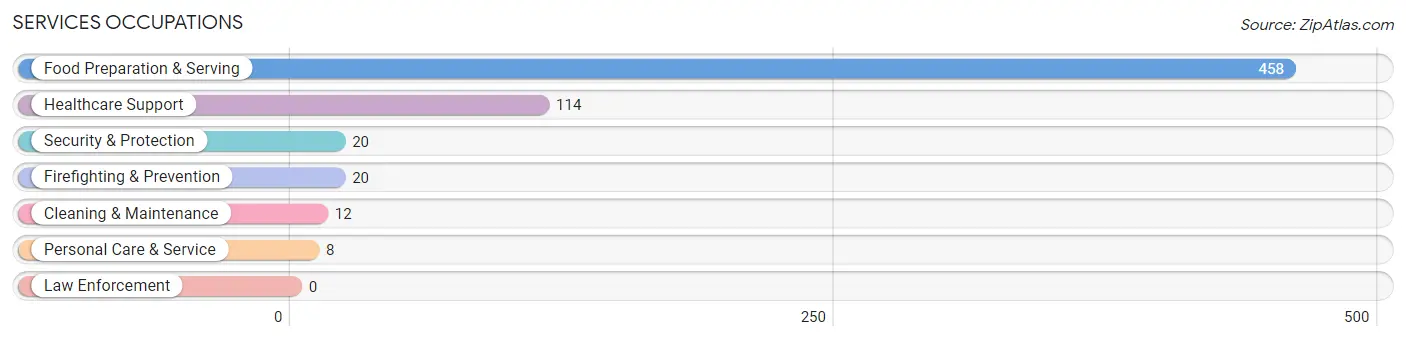
Services Occupations
The most common Services occupations in Danielson borough are Food Preparation & Serving (458 | 21.9%), Healthcare Support (114 | 5.4%), Security & Protection (20 | 0.9%), Firefighting & Prevention (20 | 0.9%), and Cleaning & Maintenance (12 | 0.6%).
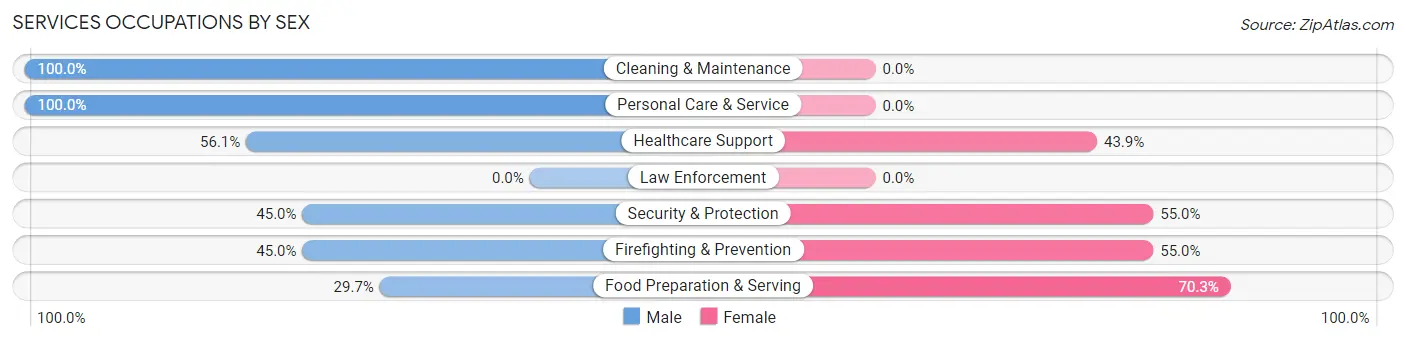
Services Occupations by Sex
Within the Services occupations in Danielson borough, the most male-oriented occupations are Cleaning & Maintenance (100.0%), Personal Care & Service (100.0%), and Healthcare Support (56.1%), while the most female-oriented occupations are Food Preparation & Serving (70.3%), Security & Protection (55.0%), and Firefighting & Prevention (55.0%).
| Occupation | Male | Female |
| Healthcare Support | 64 (56.1%) | 50 (43.9%) |
| Security & Protection | 9 (45.0%) | 11 (55.0%) |
| Firefighting & Prevention | 9 (45.0%) | 11 (55.0%) |
| Law Enforcement | 0 (0.0%) | 0 (0.0%) |
| Food Preparation & Serving | 136 (29.7%) | 322 (70.3%) |
| Cleaning & Maintenance | 12 (100.0%) | 0 (0.0%) |
| Personal Care & Service | 8 (100.0%) | 0 (0.0%) |
| Total (Category) | 229 (37.4%) | 383 (62.6%) |
| Total (Overall) | 906 (43.2%) | 1,189 (56.8%) |
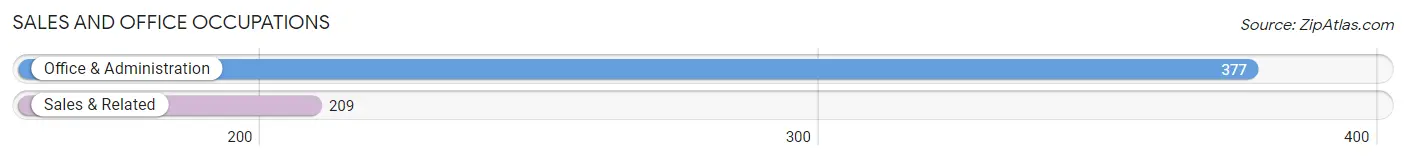
Sales and Office Occupations
The most common Sales and Office occupations in Danielson borough are Office & Administration (377 | 18.0%), and Sales & Related (209 | 10.0%).
Sales and Office Occupations by Sex
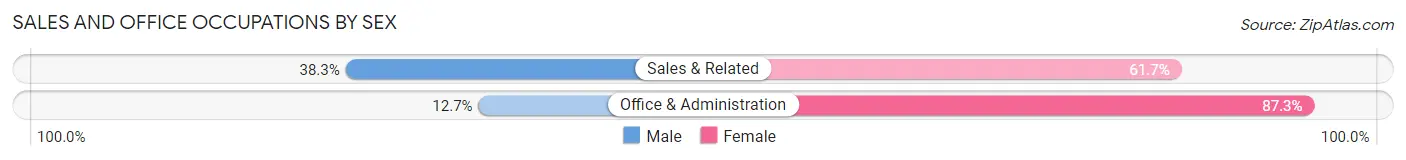
| Occupation | Male | Female |
| Sales & Related | 80 (38.3%) | 129 (61.7%) |
| Office & Administration | 48 (12.7%) | 329 (87.3%) |
| Total (Category) | 128 (21.8%) | 458 (78.2%) |
| Total (Overall) | 906 (43.2%) | 1,189 (56.8%) |
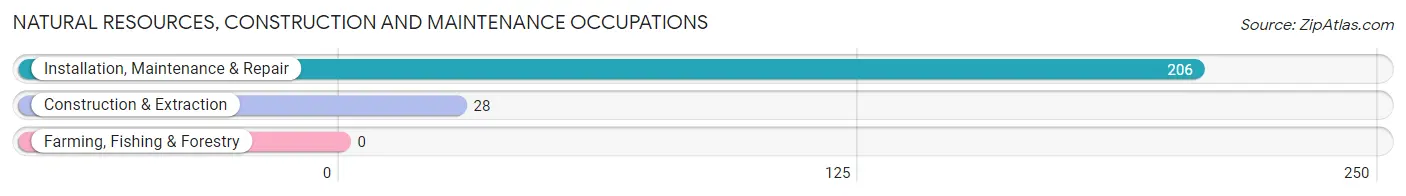
Natural Resources, Construction and Maintenance Occupations
The most common Natural Resources, Construction and Maintenance occupations in Danielson borough are Installation, Maintenance & Repair (206 | 9.8%), and Construction & Extraction (28 | 1.3%).
Natural Resources, Construction and Maintenance Occupations by Sex
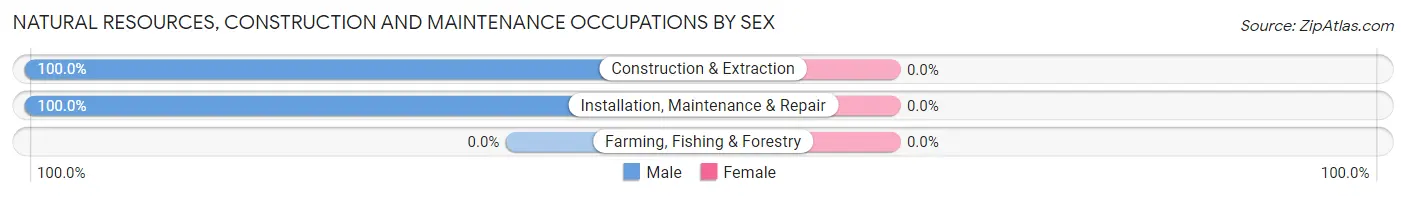
| Occupation | Male | Female |
| Farming, Fishing & Forestry | 0 (0.0%) | 0 (0.0%) |
| Construction & Extraction | 28 (100.0%) | 0 (0.0%) |
| Installation, Maintenance & Repair | 206 (100.0%) | 0 (0.0%) |
| Total (Category) | 234 (100.0%) | 0 (0.0%) |
| Total (Overall) | 906 (43.2%) | 1,189 (56.8%) |
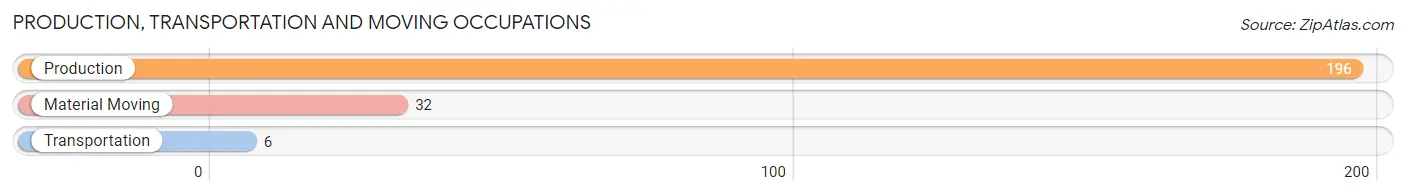
Production, Transportation and Moving Occupations
The most common Production, Transportation and Moving occupations in Danielson borough are Production (196 | 9.4%), Material Moving (32 | 1.5%), and Transportation (6 | 0.3%).
Production, Transportation and Moving Occupations by Sex
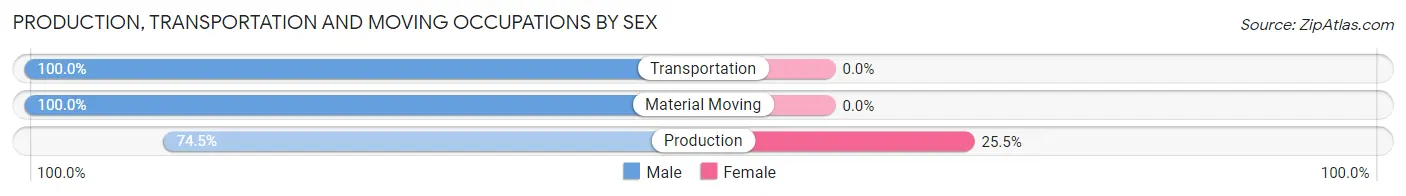
| Occupation | Male | Female |
| Production | 146 (74.5%) | 50 (25.5%) |
| Transportation | 6 (100.0%) | 0 (0.0%) |
| Material Moving | 32 (100.0%) | 0 (0.0%) |
| Total (Category) | 184 (78.6%) | 50 (21.4%) |
| Total (Overall) | 906 (43.2%) | 1,189 (56.8%) |
Employment Industries by Sex in Danielson borough
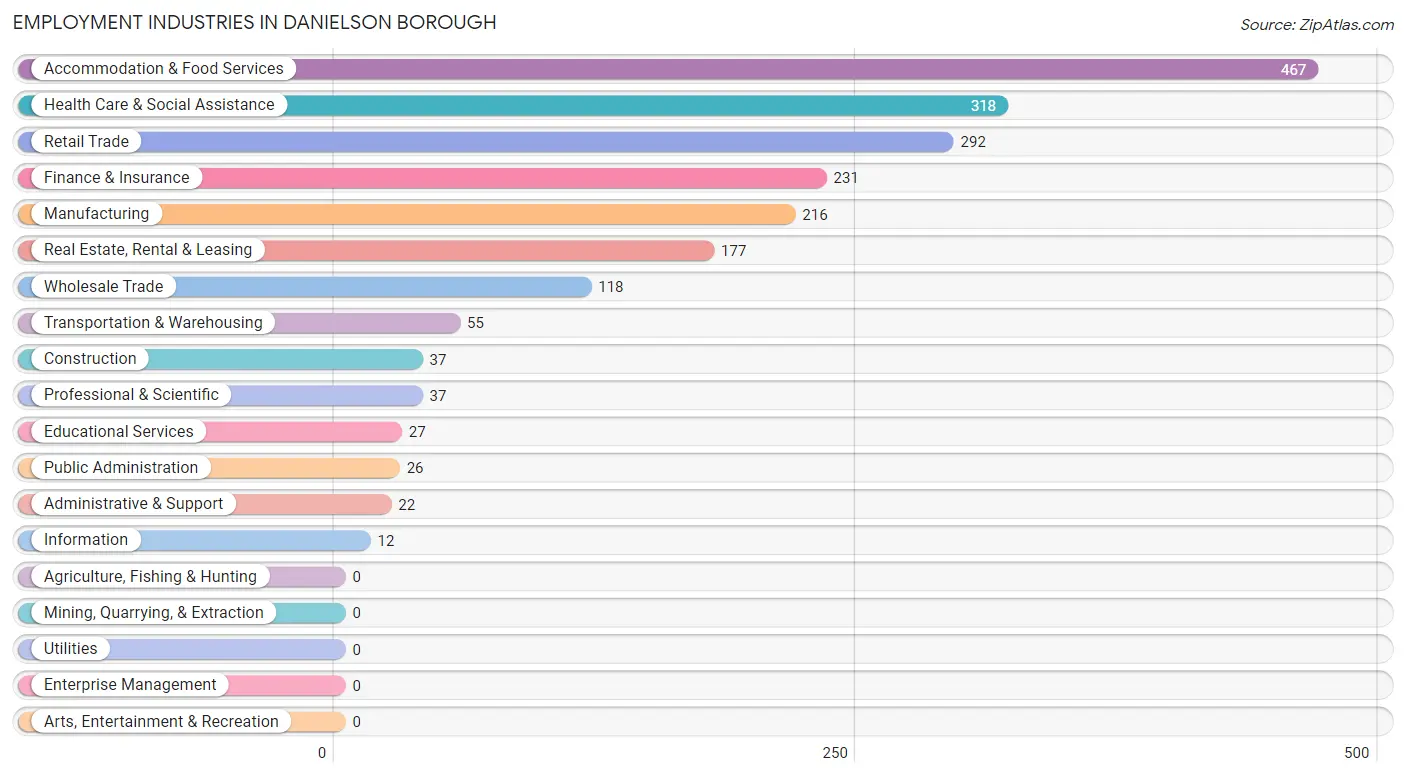
Employment Industries in Danielson borough
The major employment industries in Danielson borough include Accommodation & Food Services (467 | 22.3%), Health Care & Social Assistance (318 | 15.2%), Retail Trade (292 | 13.9%), Finance & Insurance (231 | 11.0%), and Manufacturing (216 | 10.3%).
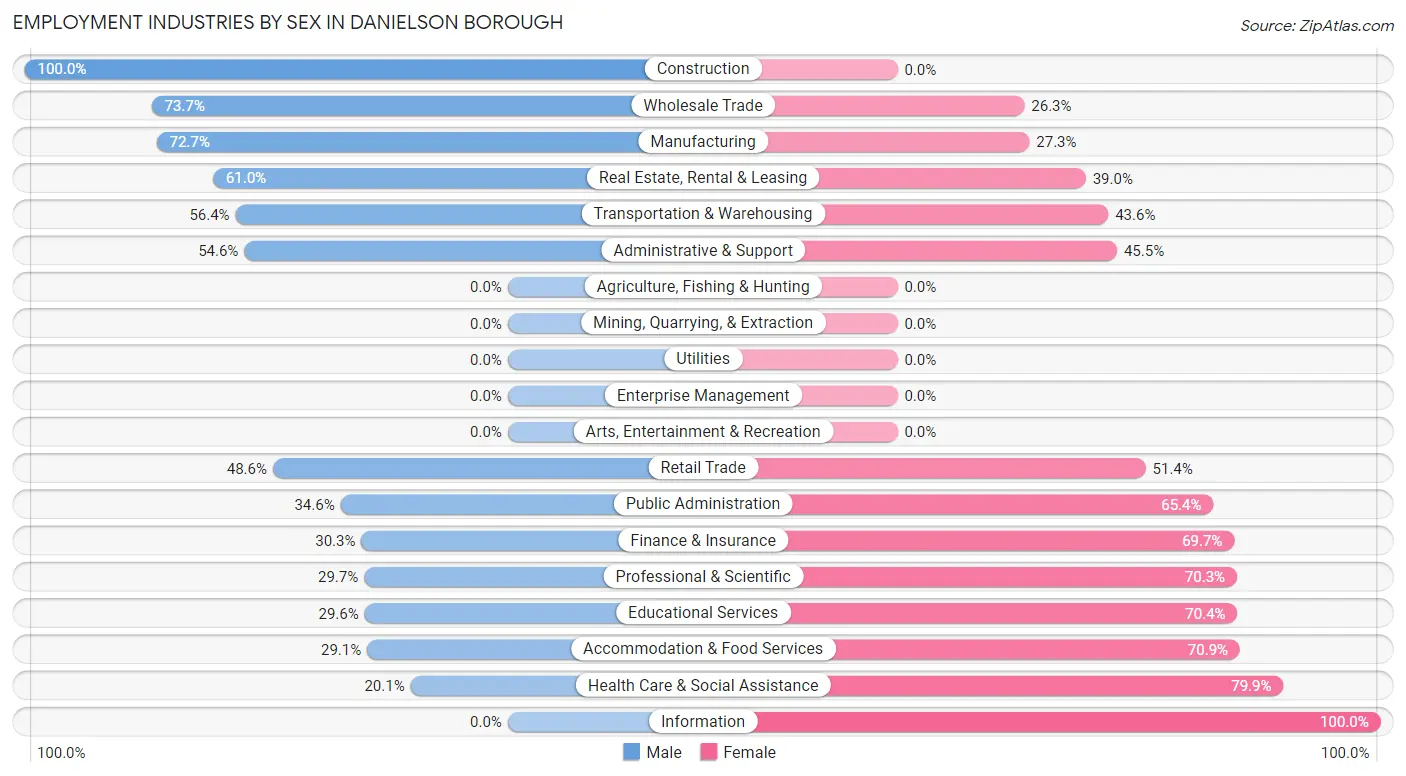
Employment Industries by Sex in Danielson borough
The Danielson borough industries that see more men than women are Construction (100.0%), Wholesale Trade (73.7%), and Manufacturing (72.7%), whereas the industries that tend to have a higher number of women are Information (100.0%), Health Care & Social Assistance (79.9%), and Accommodation & Food Services (70.9%).
| Industry | Male | Female |
| Agriculture, Fishing & Hunting | 0 (0.0%) | 0 (0.0%) |
| Mining, Quarrying, & Extraction | 0 (0.0%) | 0 (0.0%) |
| Construction | 37 (100.0%) | 0 (0.0%) |
| Manufacturing | 157 (72.7%) | 59 (27.3%) |
| Wholesale Trade | 87 (73.7%) | 31 (26.3%) |
| Retail Trade | 142 (48.6%) | 150 (51.4%) |
| Transportation & Warehousing | 31 (56.4%) | 24 (43.6%) |
| Utilities | 0 (0.0%) | 0 (0.0%) |
| Information | 0 (0.0%) | 12 (100.0%) |
| Finance & Insurance | 70 (30.3%) | 161 (69.7%) |
| Real Estate, Rental & Leasing | 108 (61.0%) | 69 (39.0%) |
| Professional & Scientific | 11 (29.7%) | 26 (70.3%) |
| Enterprise Management | 0 (0.0%) | 0 (0.0%) |
| Administrative & Support | 12 (54.5%) | 10 (45.5%) |
| Educational Services | 8 (29.6%) | 19 (70.4%) |
| Health Care & Social Assistance | 64 (20.1%) | 254 (79.9%) |
| Arts, Entertainment & Recreation | 0 (0.0%) | 0 (0.0%) |
| Accommodation & Food Services | 136 (29.1%) | 331 (70.9%) |
| Public Administration | 9 (34.6%) | 17 (65.4%) |
| Total | 906 (43.2%) | 1,189 (56.8%) |
Education in Danielson borough
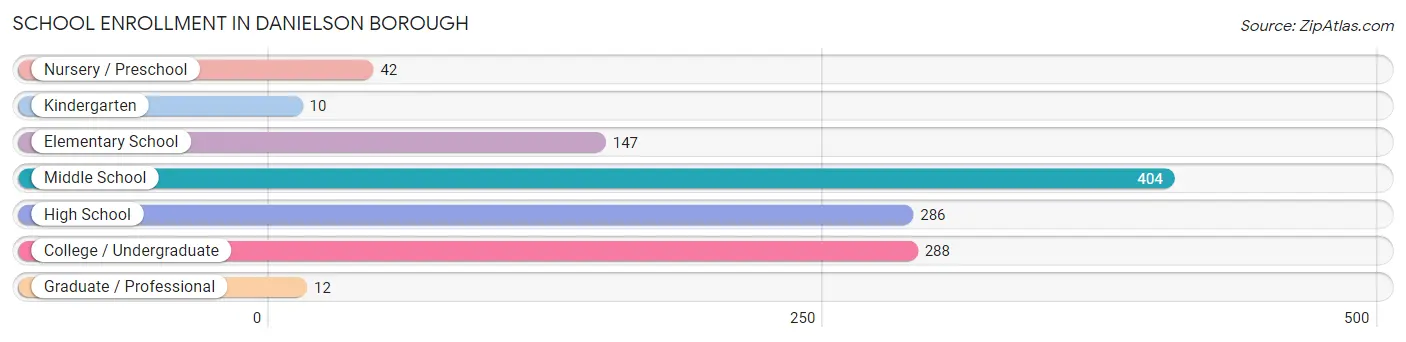
School Enrollment in Danielson borough
The most common levels of schooling among the 1,189 students in Danielson borough are middle school (404 | 34.0%), college / undergraduate (288 | 24.2%), and high school (286 | 24.0%).
| School Level | # Students | % Students |
| Nursery / Preschool | 42 | 3.5% |
| Kindergarten | 10 | 0.8% |
| Elementary School | 147 | 12.4% |
| Middle School | 404 | 34.0% |
| High School | 286 | 24.0% |
| College / Undergraduate | 288 | 24.2% |
| Graduate / Professional | 12 | 1.0% |
| Total | 1,189 | 100.0% |
School Enrollment by Age by Funding Source in Danielson borough
Out of a total of 1,189 students who are enrolled in schools in Danielson borough, 74 (6.2%) attend a private institution, while the remaining 1,115 (93.8%) are enrolled in public schools. The age group of 10 to 14 year olds has the highest likelihood of being enrolled in private schools, with 52 (12.0% in the age bracket) enrolled. Conversely, the age group of 15 to 17 year olds has the lowest likelihood of being enrolled in a private school, with 193 (100.0% in the age bracket) attending a public institution.
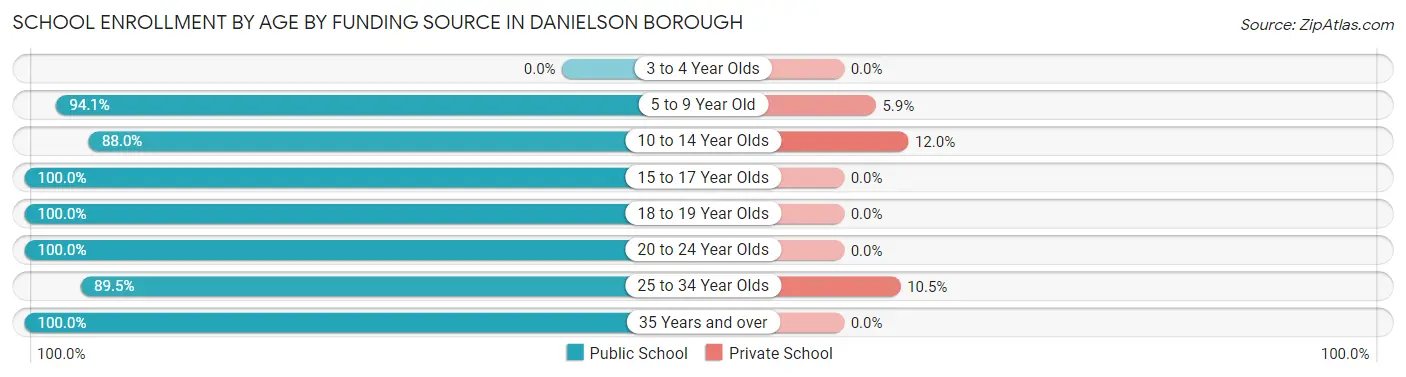
| Age Bracket | Public School | Private School |
| 3 to 4 Year Olds | 0 (0.0%) | 0 (0.0%) |
| 5 to 9 Year Old | 159 (94.1%) | 10 (5.9%) |
| 10 to 14 Year Olds | 382 (88.0%) | 52 (12.0%) |
| 15 to 17 Year Olds | 193 (100.0%) | 0 (0.0%) |
| 18 to 19 Year Olds | 30 (100.0%) | 0 (0.0%) |
| 20 to 24 Year Olds | 109 (100.0%) | 0 (0.0%) |
| 25 to 34 Year Olds | 102 (89.5%) | 12 (10.5%) |
| 35 Years and over | 140 (100.0%) | 0 (0.0%) |
| Total | 1,115 (93.8%) | 74 (6.2%) |
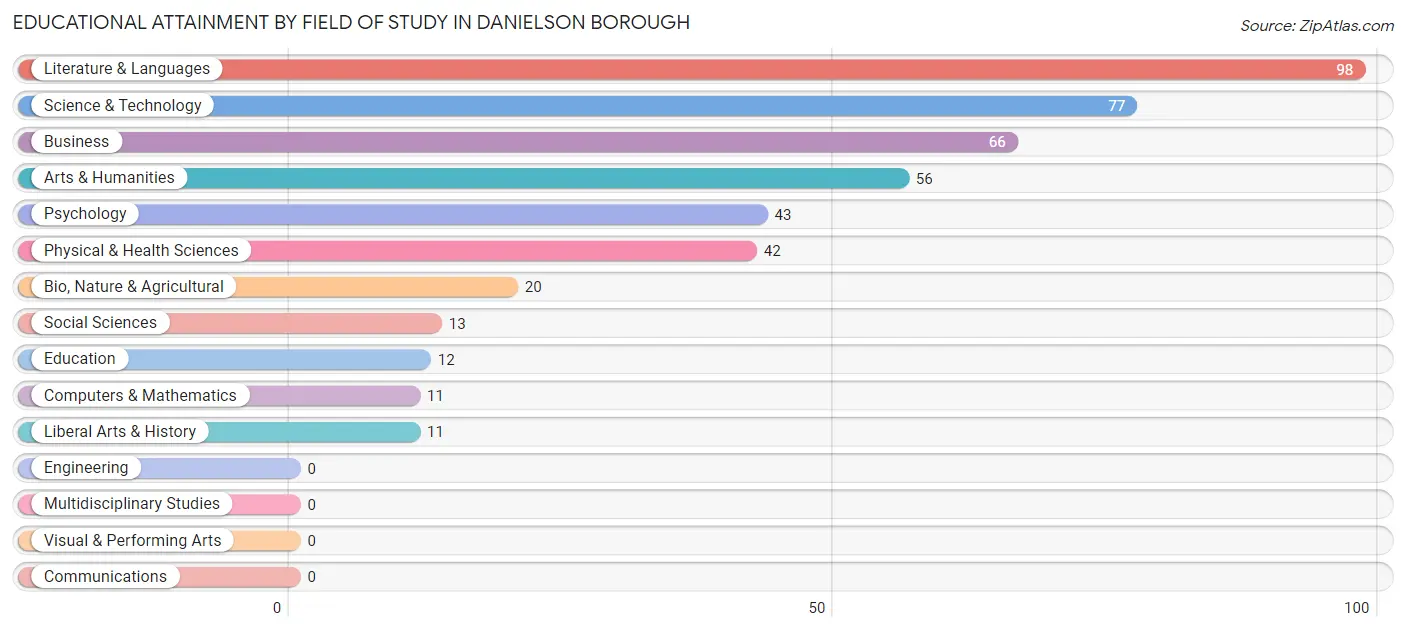
Educational Attainment by Field of Study in Danielson borough
Literature & languages (98 | 21.8%), science & technology (77 | 17.2%), business (66 | 14.7%), arts & humanities (56 | 12.5%), and psychology (43 | 9.6%) are the most common fields of study among 449 individuals in Danielson borough who have obtained a bachelor's degree or higher.
| Field of Study | # Graduates | % Graduates |
| Computers & Mathematics | 11 | 2.5% |
| Bio, Nature & Agricultural | 20 | 4.4% |
| Physical & Health Sciences | 42 | 9.3% |
| Psychology | 43 | 9.6% |
| Social Sciences | 13 | 2.9% |
| Engineering | 0 | 0.0% |
| Multidisciplinary Studies | 0 | 0.0% |
| Science & Technology | 77 | 17.2% |
| Business | 66 | 14.7% |
| Education | 12 | 2.7% |
| Literature & Languages | 98 | 21.8% |
| Liberal Arts & History | 11 | 2.5% |
| Visual & Performing Arts | 0 | 0.0% |
| Communications | 0 | 0.0% |
| Arts & Humanities | 56 | 12.5% |
| Total | 449 | 100.0% |
Transportation & Commute in Danielson borough
Vehicle Availability by Sex in Danielson borough
The most prevalent vehicle ownership categories in Danielson borough are males with 2 vehicles (628, accounting for 71.4%) and females with 2 vehicles (706, making up 53.3%).
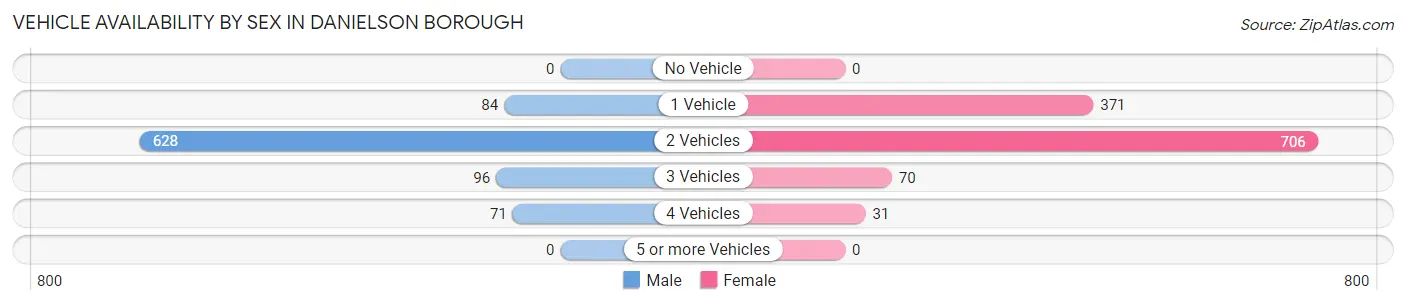
| Vehicles Available | Male | Female |
| No Vehicle | 0 (0.0%) | 0 (0.0%) |
| 1 Vehicle | 84 (9.6%) | 371 (31.5%) |
| 2 Vehicles | 628 (71.4%) | 706 (59.9%) |
| 3 Vehicles | 96 (10.9%) | 70 (5.9%) |
| 4 Vehicles | 71 (8.1%) | 31 (2.6%) |
| 5 or more Vehicles | 0 (0.0%) | 0 (0.0%) |
| Total | 879 (100.0%) | 1,178 (100.0%) |
Commute Time in Danielson borough
The most frequently occuring commute durations in Danielson borough are 45 to 59 minutes (380 commuters, 19.1%), 5 to 9 minutes (304 commuters, 15.3%), and 10 to 14 minutes (283 commuters, 14.2%).
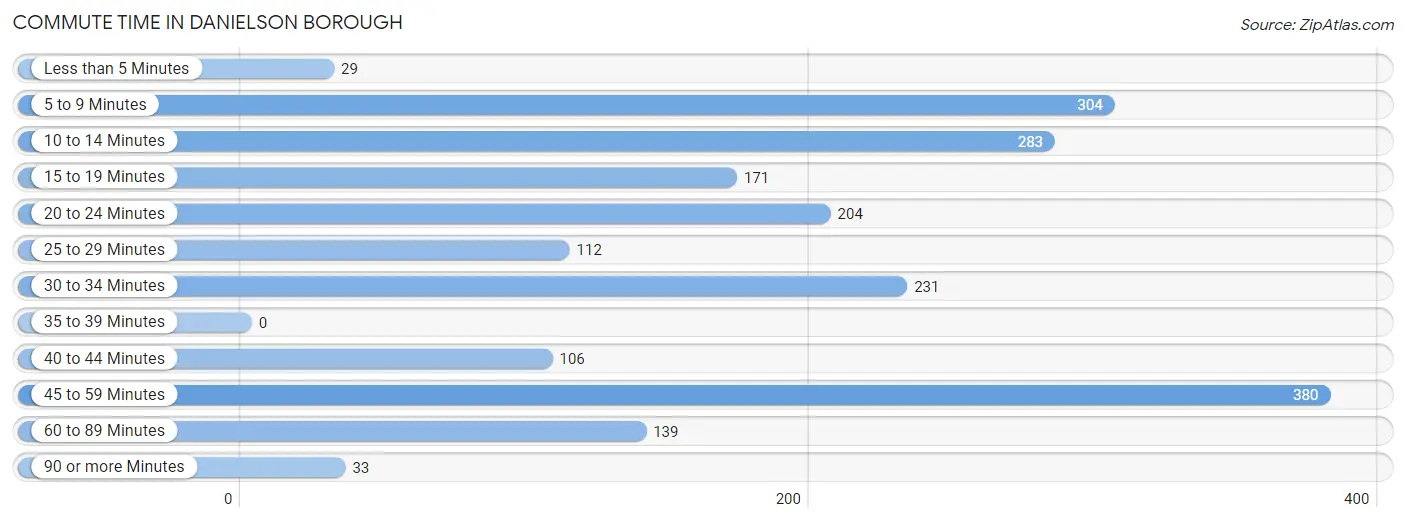
| Commute Time | # Commuters | % Commuters |
| Less than 5 Minutes | 29 | 1.5% |
| 5 to 9 Minutes | 304 | 15.3% |
| 10 to 14 Minutes | 283 | 14.2% |
| 15 to 19 Minutes | 171 | 8.6% |
| 20 to 24 Minutes | 204 | 10.2% |
| 25 to 29 Minutes | 112 | 5.6% |
| 30 to 34 Minutes | 231 | 11.6% |
| 35 to 39 Minutes | 0 | 0.0% |
| 40 to 44 Minutes | 106 | 5.3% |
| 45 to 59 Minutes | 380 | 19.1% |
| 60 to 89 Minutes | 139 | 7.0% |
| 90 or more Minutes | 33 | 1.7% |
Commute Time by Sex in Danielson borough
The most common commute times in Danielson borough are 5 to 9 minutes (214 commuters, 23.9%) for males and 10 to 14 minutes (249 commuters, 22.7%) for females.
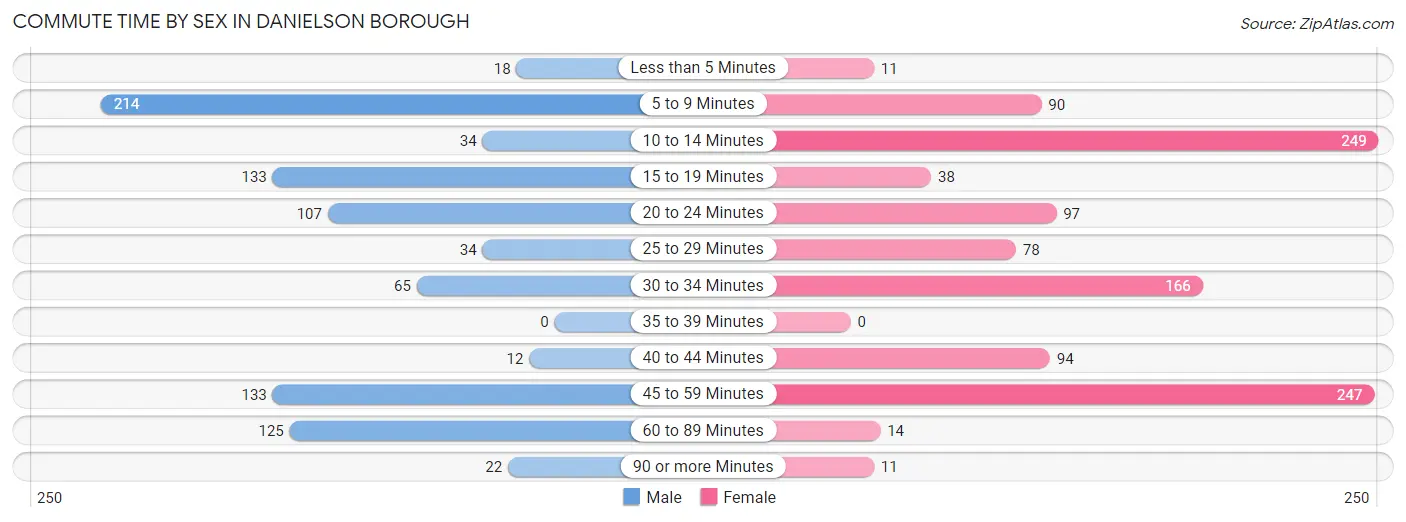
| Commute Time | Male | Female |
| Less than 5 Minutes | 18 (2.0%) | 11 (1.0%) |
| 5 to 9 Minutes | 214 (23.9%) | 90 (8.2%) |
| 10 to 14 Minutes | 34 (3.8%) | 249 (22.7%) |
| 15 to 19 Minutes | 133 (14.8%) | 38 (3.5%) |
| 20 to 24 Minutes | 107 (11.9%) | 97 (8.9%) |
| 25 to 29 Minutes | 34 (3.8%) | 78 (7.1%) |
| 30 to 34 Minutes | 65 (7.2%) | 166 (15.2%) |
| 35 to 39 Minutes | 0 (0.0%) | 0 (0.0%) |
| 40 to 44 Minutes | 12 (1.3%) | 94 (8.6%) |
| 45 to 59 Minutes | 133 (14.8%) | 247 (22.6%) |
| 60 to 89 Minutes | 125 (13.9%) | 14 (1.3%) |
| 90 or more Minutes | 22 (2.5%) | 11 (1.0%) |
Time of Departure to Work by Sex in Danielson borough
The most frequent times of departure to work in Danielson borough are 6:30 AM to 6:59 AM (201, 22.4%) for males and 6:00 AM to 6:29 AM (263, 24.0%) for females.
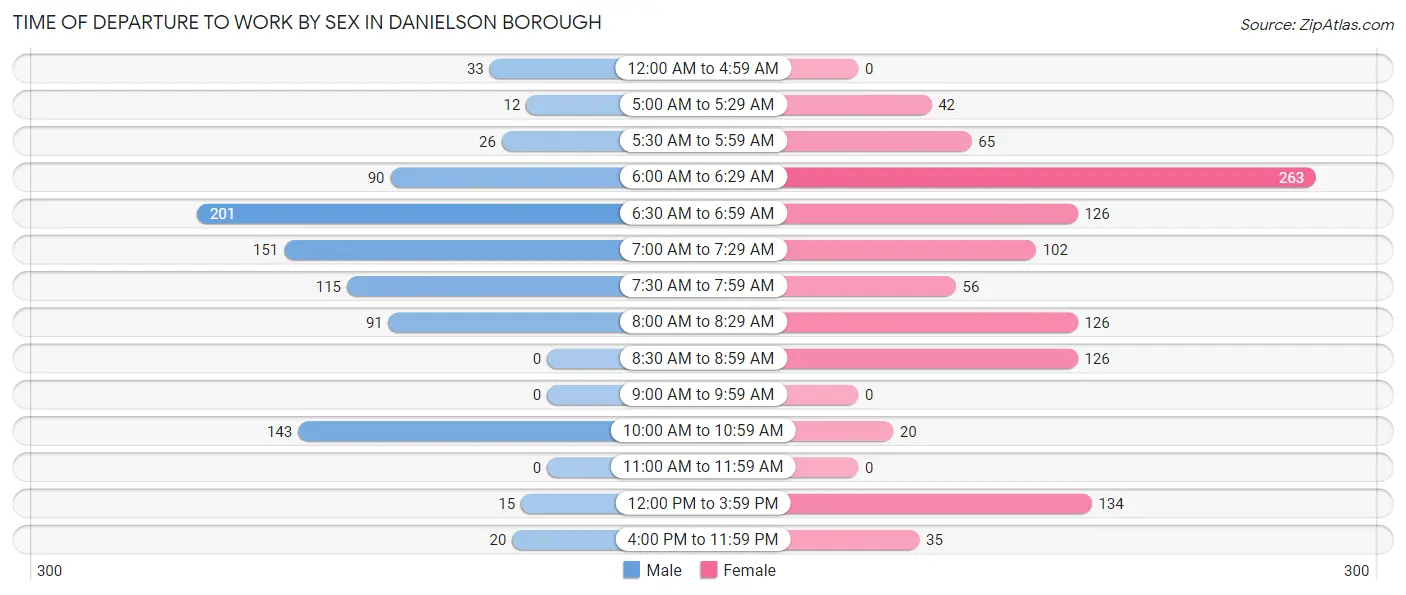
| Time of Departure | Male | Female |
| 12:00 AM to 4:59 AM | 33 (3.7%) | 0 (0.0%) |
| 5:00 AM to 5:29 AM | 12 (1.3%) | 42 (3.8%) |
| 5:30 AM to 5:59 AM | 26 (2.9%) | 65 (5.9%) |
| 6:00 AM to 6:29 AM | 90 (10.0%) | 263 (24.0%) |
| 6:30 AM to 6:59 AM | 201 (22.4%) | 126 (11.5%) |
| 7:00 AM to 7:29 AM | 151 (16.8%) | 102 (9.3%) |
| 7:30 AM to 7:59 AM | 115 (12.8%) | 56 (5.1%) |
| 8:00 AM to 8:29 AM | 91 (10.1%) | 126 (11.5%) |
| 8:30 AM to 8:59 AM | 0 (0.0%) | 126 (11.5%) |
| 9:00 AM to 9:59 AM | 0 (0.0%) | 0 (0.0%) |
| 10:00 AM to 10:59 AM | 143 (15.9%) | 20 (1.8%) |
| 11:00 AM to 11:59 AM | 0 (0.0%) | 0 (0.0%) |
| 12:00 PM to 3:59 PM | 15 (1.7%) | 134 (12.2%) |
| 4:00 PM to 11:59 PM | 20 (2.2%) | 35 (3.2%) |
| Total | 897 (100.0%) | 1,095 (100.0%) |
Housing Occupancy in Danielson borough
Occupancy by Ownership in Danielson borough
Of the total 1,782 dwellings in Danielson borough, owner-occupied units account for 719 (40.4%), while renter-occupied units make up 1,063 (59.7%).
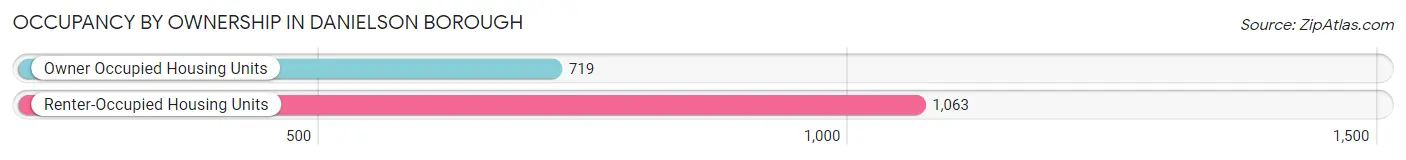
| Occupancy | # Housing Units | % Housing Units |
| Owner Occupied Housing Units | 719 | 40.4% |
| Renter-Occupied Housing Units | 1,063 | 59.7% |
| Total Occupied Housing Units | 1,782 | 100.0% |
Occupancy by Household Size in Danielson borough
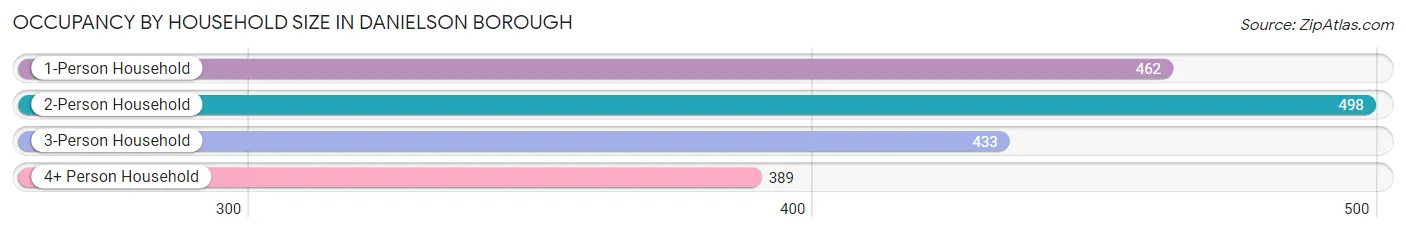
| Household Size | # Housing Units | % Housing Units |
| 1-Person Household | 462 | 25.9% |
| 2-Person Household | 498 | 28.0% |
| 3-Person Household | 433 | 24.3% |
| 4+ Person Household | 389 | 21.8% |
| Total Housing Units | 1,782 | 100.0% |
Occupancy by Ownership by Household Size in Danielson borough
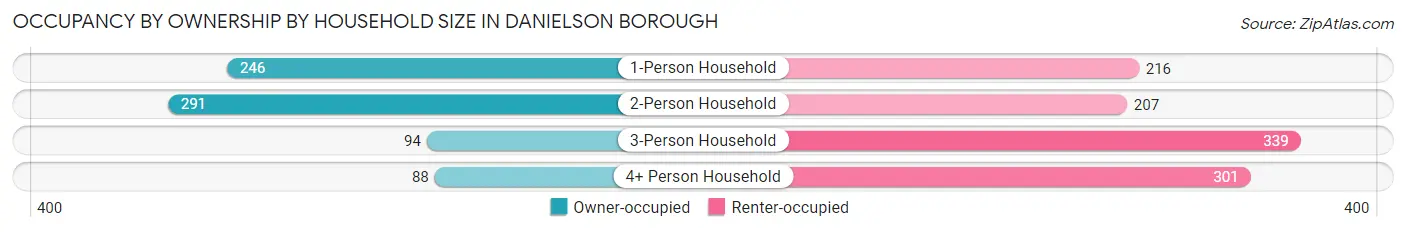
| Household Size | Owner-occupied | Renter-occupied |
| 1-Person Household | 246 (53.2%) | 216 (46.8%) |
| 2-Person Household | 291 (58.4%) | 207 (41.6%) |
| 3-Person Household | 94 (21.7%) | 339 (78.3%) |
| 4+ Person Household | 88 (22.6%) | 301 (77.4%) |
| Total Housing Units | 719 (40.4%) | 1,063 (59.7%) |
Occupancy by Educational Attainment in Danielson borough
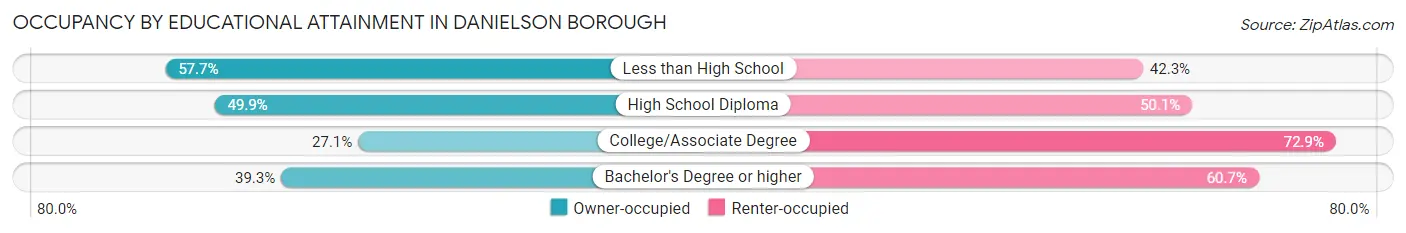
| Household Size | Owner-occupied | Renter-occupied |
| Less than High School | 15 (57.7%) | 11 (42.3%) |
| High School Diploma | 428 (49.9%) | 430 (50.1%) |
| College/Associate Degree | 171 (27.1%) | 460 (72.9%) |
| Bachelor's Degree or higher | 105 (39.3%) | 162 (60.7%) |
Occupancy by Age of Householder in Danielson borough
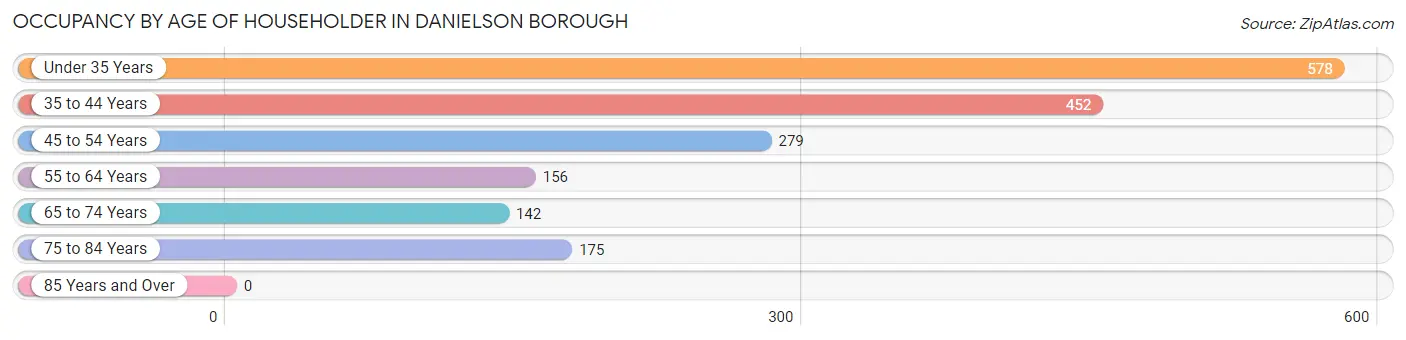
| Age Bracket | # Households | % Households |
| Under 35 Years | 578 | 32.4% |
| 35 to 44 Years | 452 | 25.4% |
| 45 to 54 Years | 279 | 15.7% |
| 55 to 64 Years | 156 | 8.7% |
| 65 to 74 Years | 142 | 8.0% |
| 75 to 84 Years | 175 | 9.8% |
| 85 Years and Over | 0 | 0.0% |
| Total | 1,782 | 100.0% |
Housing Finances in Danielson borough
Median Income by Occupancy in Danielson borough
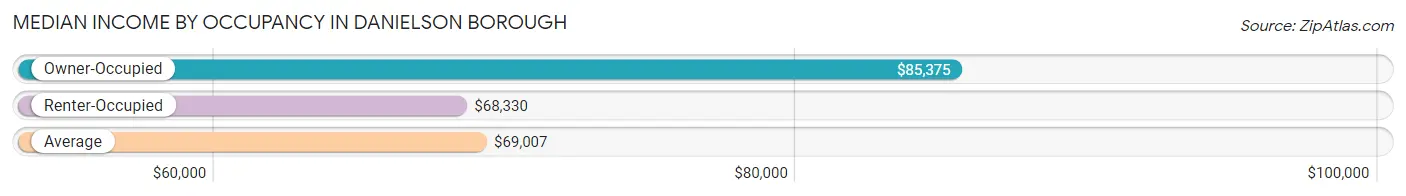
| Occupancy Type | # Households | Median Income |
| Owner-Occupied | 719 (40.4%) | $85,375 |
| Renter-Occupied | 1,063 (59.7%) | $68,330 |
| Average | 1,782 (100.0%) | $69,007 |
Occupancy by Householder Income Bracket in Danielson borough
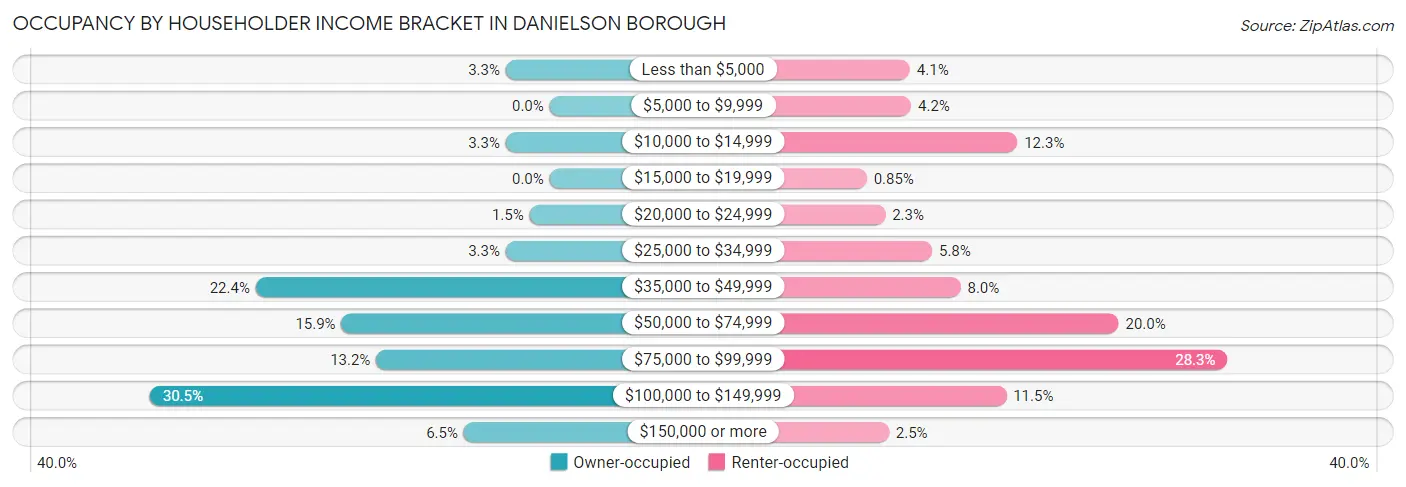
| Income Bracket | Owner-occupied | Renter-occupied |
| Less than $5,000 | 24 (3.3%) | 44 (4.1%) |
| $5,000 to $9,999 | 0 (0.0%) | 45 (4.2%) |
| $10,000 to $14,999 | 24 (3.3%) | 131 (12.3%) |
| $15,000 to $19,999 | 0 (0.0%) | 9 (0.9%) |
| $20,000 to $24,999 | 11 (1.5%) | 24 (2.3%) |
| $25,000 to $34,999 | 24 (3.3%) | 62 (5.8%) |
| $35,000 to $49,999 | 161 (22.4%) | 85 (8.0%) |
| $50,000 to $74,999 | 114 (15.9%) | 213 (20.0%) |
| $75,000 to $99,999 | 95 (13.2%) | 301 (28.3%) |
| $100,000 to $149,999 | 219 (30.5%) | 122 (11.5%) |
| $150,000 or more | 47 (6.5%) | 27 (2.5%) |
| Total | 719 (100.0%) | 1,063 (100.0%) |
Monthly Housing Cost Tiers in Danielson borough
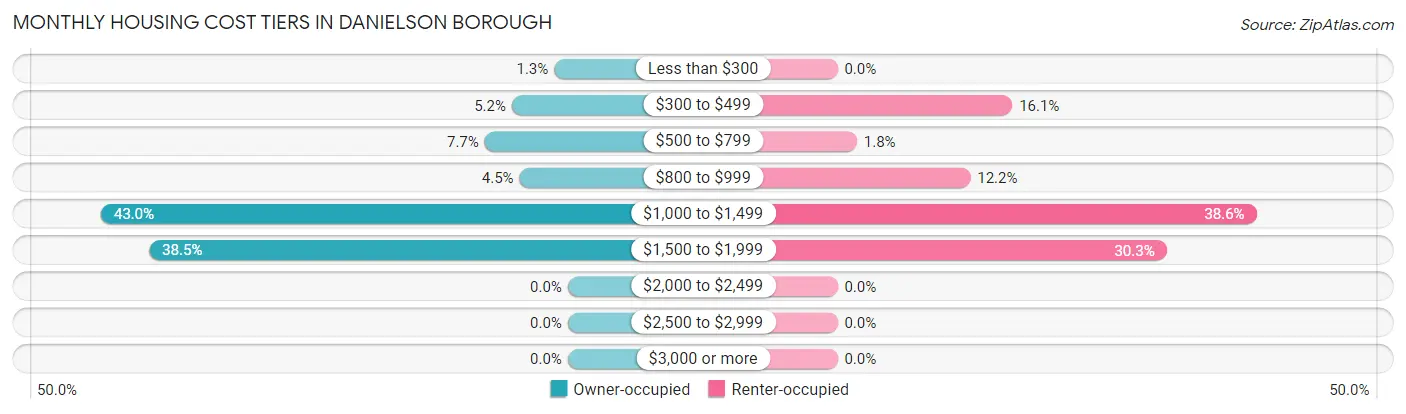
| Monthly Cost | Owner-occupied | Renter-occupied |
| Less than $300 | 9 (1.3%) | 0 (0.0%) |
| $300 to $499 | 37 (5.1%) | 171 (16.1%) |
| $500 to $799 | 55 (7.6%) | 19 (1.8%) |
| $800 to $999 | 32 (4.4%) | 130 (12.2%) |
| $1,000 to $1,499 | 309 (43.0%) | 410 (38.6%) |
| $1,500 to $1,999 | 277 (38.5%) | 322 (30.3%) |
| $2,000 to $2,499 | 0 (0.0%) | 0 (0.0%) |
| $2,500 to $2,999 | 0 (0.0%) | 0 (0.0%) |
| $3,000 or more | 0 (0.0%) | 0 (0.0%) |
| Total | 719 (100.0%) | 1,063 (100.0%) |
Physical Housing Characteristics in Danielson borough
Housing Structures in Danielson borough
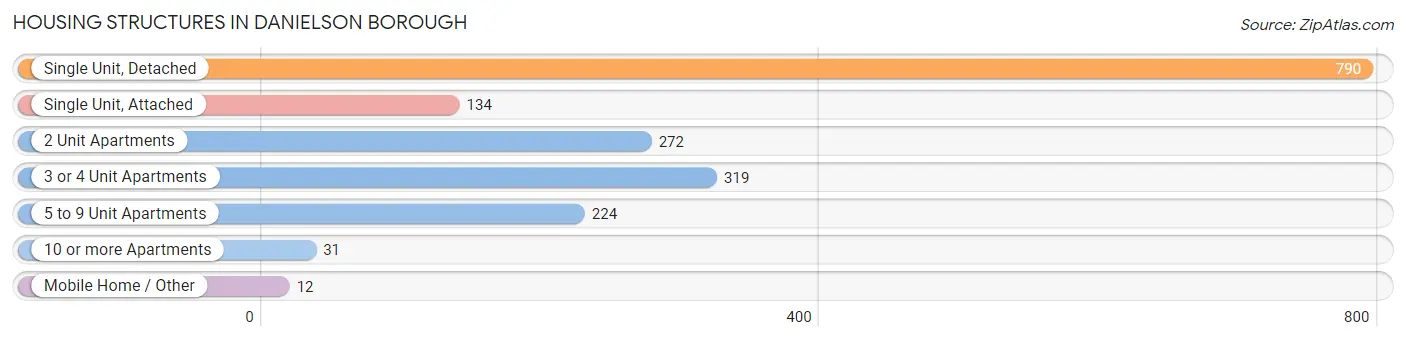
| Structure Type | # Housing Units | % Housing Units |
| Single Unit, Detached | 790 | 44.3% |
| Single Unit, Attached | 134 | 7.5% |
| 2 Unit Apartments | 272 | 15.3% |
| 3 or 4 Unit Apartments | 319 | 17.9% |
| 5 to 9 Unit Apartments | 224 | 12.6% |
| 10 or more Apartments | 31 | 1.7% |
| Mobile Home / Other | 12 | 0.7% |
| Total | 1,782 | 100.0% |
Housing Structures by Occupancy in Danielson borough
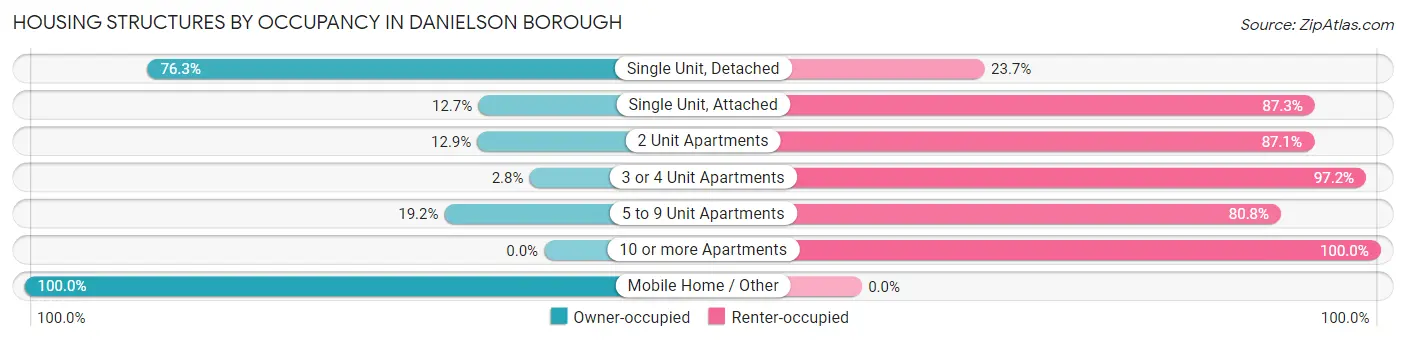
| Structure Type | Owner-occupied | Renter-occupied |
| Single Unit, Detached | 603 (76.3%) | 187 (23.7%) |
| Single Unit, Attached | 17 (12.7%) | 117 (87.3%) |
| 2 Unit Apartments | 35 (12.9%) | 237 (87.1%) |
| 3 or 4 Unit Apartments | 9 (2.8%) | 310 (97.2%) |
| 5 to 9 Unit Apartments | 43 (19.2%) | 181 (80.8%) |
| 10 or more Apartments | 0 (0.0%) | 31 (100.0%) |
| Mobile Home / Other | 12 (100.0%) | 0 (0.0%) |
| Total | 719 (40.4%) | 1,063 (59.7%) |
Housing Structures by Number of Rooms in Danielson borough
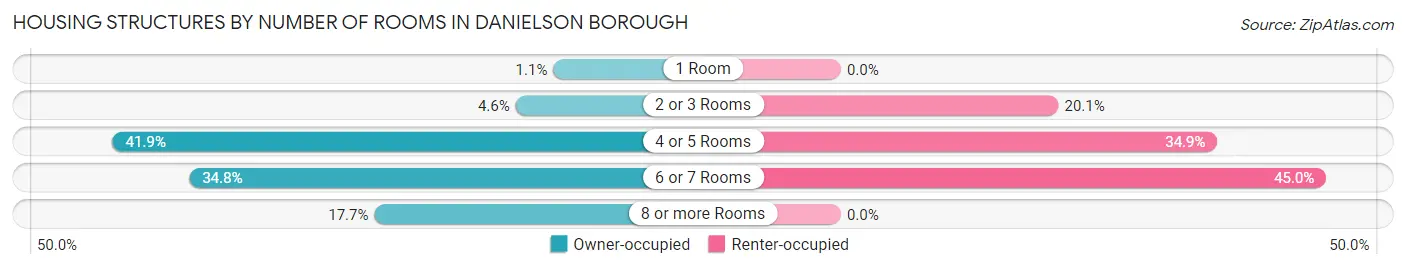
| Number of Rooms | Owner-occupied | Renter-occupied |
| 1 Room | 8 (1.1%) | 0 (0.0%) |
| 2 or 3 Rooms | 33 (4.6%) | 214 (20.1%) |
| 4 or 5 Rooms | 301 (41.9%) | 371 (34.9%) |
| 6 or 7 Rooms | 250 (34.8%) | 478 (45.0%) |
| 8 or more Rooms | 127 (17.7%) | 0 (0.0%) |
| Total | 719 (100.0%) | 1,063 (100.0%) |
Housing Structure by Heating Type in Danielson borough
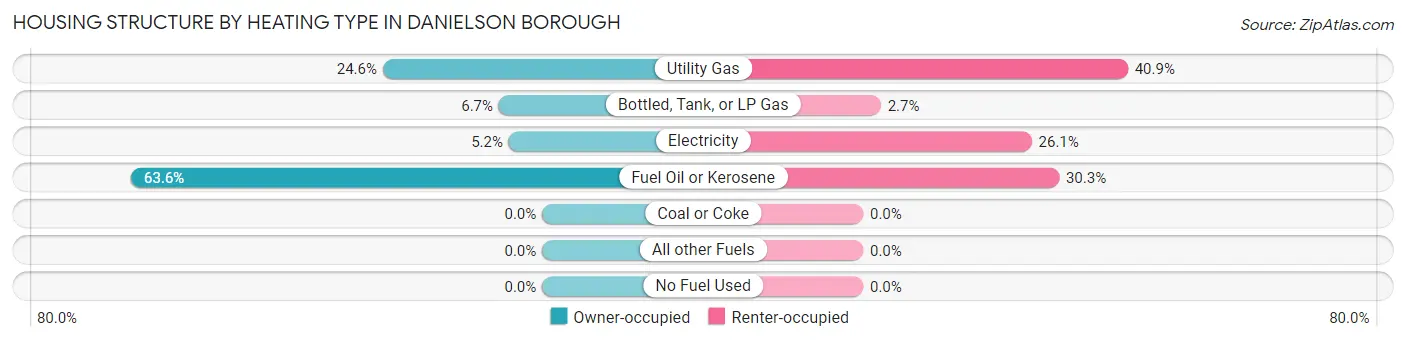
| Heating Type | Owner-occupied | Renter-occupied |
| Utility Gas | 177 (24.6%) | 435 (40.9%) |
| Bottled, Tank, or LP Gas | 48 (6.7%) | 29 (2.7%) |
| Electricity | 37 (5.1%) | 277 (26.1%) |
| Fuel Oil or Kerosene | 457 (63.6%) | 322 (30.3%) |
| Coal or Coke | 0 (0.0%) | 0 (0.0%) |
| All other Fuels | 0 (0.0%) | 0 (0.0%) |
| No Fuel Used | 0 (0.0%) | 0 (0.0%) |
| Total | 719 (100.0%) | 1,063 (100.0%) |
Household Vehicle Usage in Danielson borough
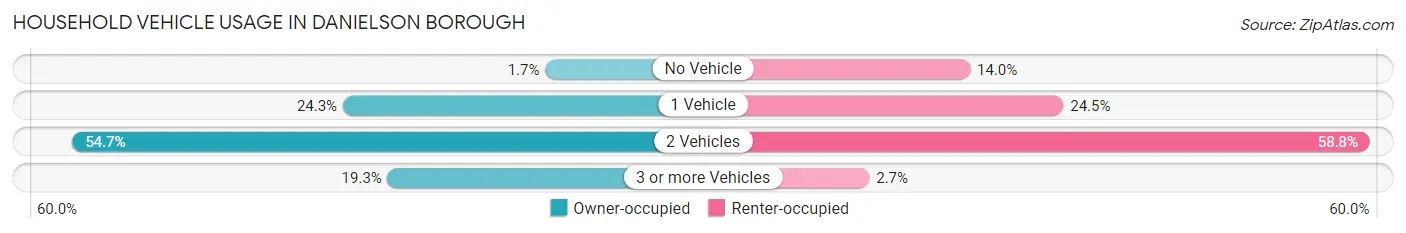
| Vehicles per Household | Owner-occupied | Renter-occupied |
| No Vehicle | 12 (1.7%) | 149 (14.0%) |
| 1 Vehicle | 175 (24.3%) | 260 (24.5%) |
| 2 Vehicles | 393 (54.7%) | 625 (58.8%) |
| 3 or more Vehicles | 139 (19.3%) | 29 (2.7%) |
| Total | 719 (100.0%) | 1,063 (100.0%) |
Real Estate & Mortgages in Danielson borough
Real Estate and Mortgage Overview in Danielson borough
| Characteristic | Without Mortgage | With Mortgage |
| Housing Units | 155 | 564 |
| Median Property Value | $201,000 | $231,900 |
| Median Household Income | $59,196 | $36 |
| Monthly Housing Costs | $706 | $0 |
| Real Estate Taxes | $3,653 | $13 |
Property Value by Mortgage Status in Danielson borough
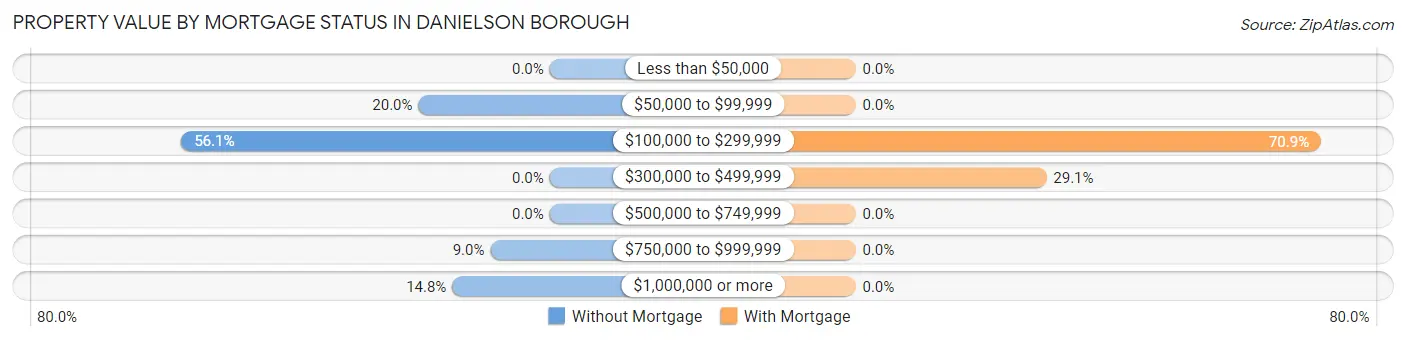
| Property Value | Without Mortgage | With Mortgage |
| Less than $50,000 | 0 (0.0%) | 0 (0.0%) |
| $50,000 to $99,999 | 31 (20.0%) | 0 (0.0%) |
| $100,000 to $299,999 | 87 (56.1%) | 400 (70.9%) |
| $300,000 to $499,999 | 0 (0.0%) | 164 (29.1%) |
| $500,000 to $749,999 | 0 (0.0%) | 0 (0.0%) |
| $750,000 to $999,999 | 14 (9.0%) | 0 (0.0%) |
| $1,000,000 or more | 23 (14.8%) | 0 (0.0%) |
| Total | 155 (100.0%) | 564 (100.0%) |
Household Income by Mortgage Status in Danielson borough
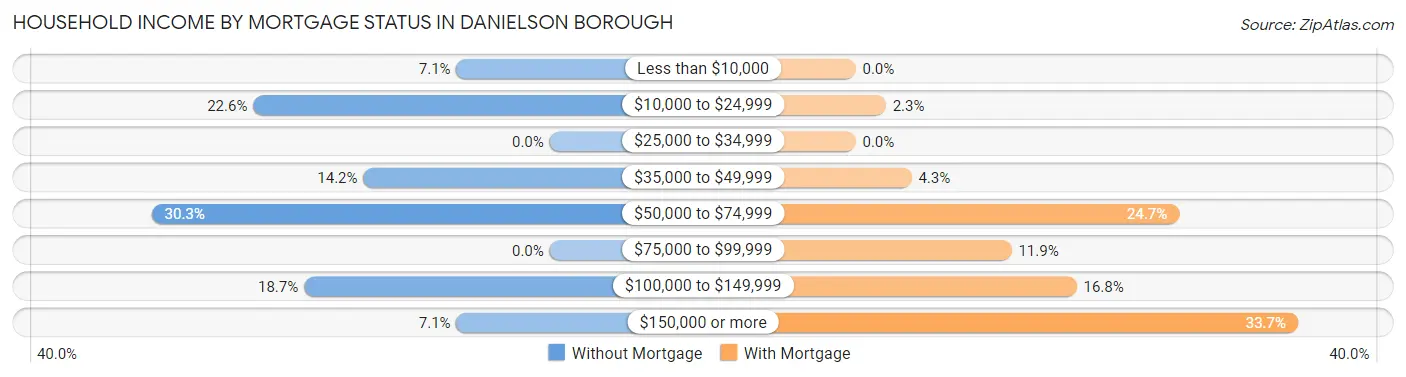
| Household Income | Without Mortgage | With Mortgage |
| Less than $10,000 | 11 (7.1%) | 0 (0.0%) |
| $10,000 to $24,999 | 35 (22.6%) | 13 (2.3%) |
| $25,000 to $34,999 | 0 (0.0%) | 0 (0.0%) |
| $35,000 to $49,999 | 22 (14.2%) | 24 (4.3%) |
| $50,000 to $74,999 | 47 (30.3%) | 139 (24.6%) |
| $75,000 to $99,999 | 0 (0.0%) | 67 (11.9%) |
| $100,000 to $149,999 | 29 (18.7%) | 95 (16.8%) |
| $150,000 or more | 11 (7.1%) | 190 (33.7%) |
| Total | 155 (100.0%) | 564 (100.0%) |
Property Value to Household Income Ratio in Danielson borough
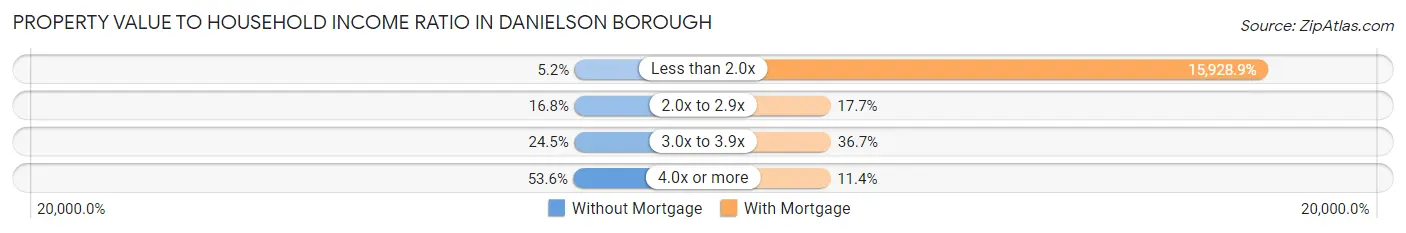
| Value-to-Income Ratio | Without Mortgage | With Mortgage |
| Less than 2.0x | 8 (5.2%) | 89,839 (15,928.9%) |
| 2.0x to 2.9x | 26 (16.8%) | 100 (17.7%) |
| 3.0x to 3.9x | 38 (24.5%) | 207 (36.7%) |
| 4.0x or more | 83 (53.5%) | 64 (11.4%) |
| Total | 155 (100.0%) | 564 (100.0%) |
Real Estate Taxes by Mortgage Status in Danielson borough
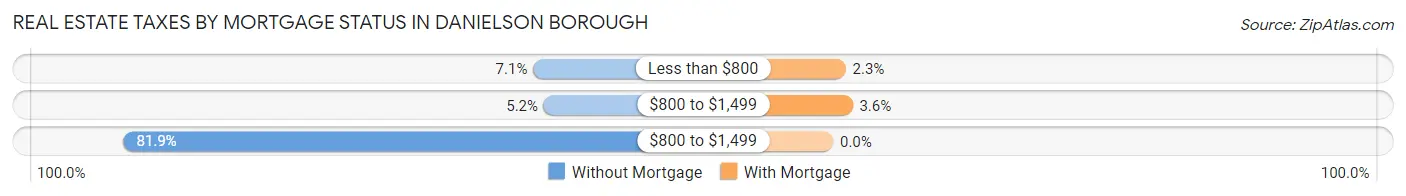
| Property Taxes | Without Mortgage | With Mortgage |
| Less than $800 | 11 (7.1%) | 13 (2.3%) |
| $800 to $1,499 | 8 (5.2%) | 20 (3.5%) |
| $800 to $1,499 | 127 (81.9%) | 0 (0.0%) |
| Total | 155 (100.0%) | 564 (100.0%) |
Health & Disability in Danielson borough
Health Insurance Coverage by Age in Danielson borough
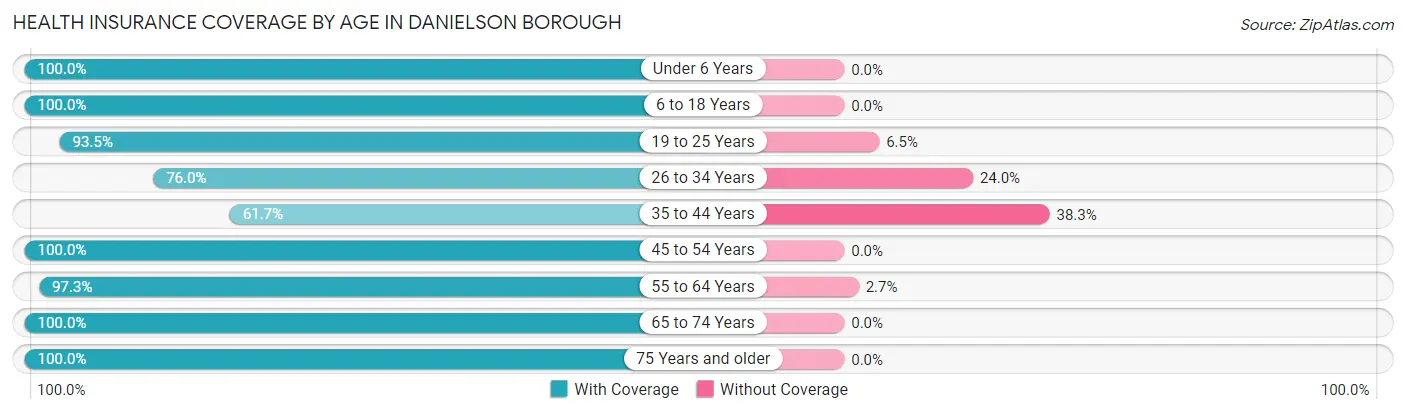
| Age Bracket | With Coverage | Without Coverage |
| Under 6 Years | 282 (100.0%) | 0 (0.0%) |
| 6 to 18 Years | 741 (100.0%) | 0 (0.0%) |
| 19 to 25 Years | 402 (93.5%) | 28 (6.5%) |
| 26 to 34 Years | 694 (76.0%) | 219 (24.0%) |
| 35 to 44 Years | 379 (61.7%) | 235 (38.3%) |
| 45 to 54 Years | 387 (100.0%) | 0 (0.0%) |
| 55 to 64 Years | 326 (97.3%) | 9 (2.7%) |
| 65 to 74 Years | 220 (100.0%) | 0 (0.0%) |
| 75 Years and older | 234 (100.0%) | 0 (0.0%) |
| Total | 3,665 (88.2%) | 491 (11.8%) |
Health Insurance Coverage by Citizenship Status in Danielson borough
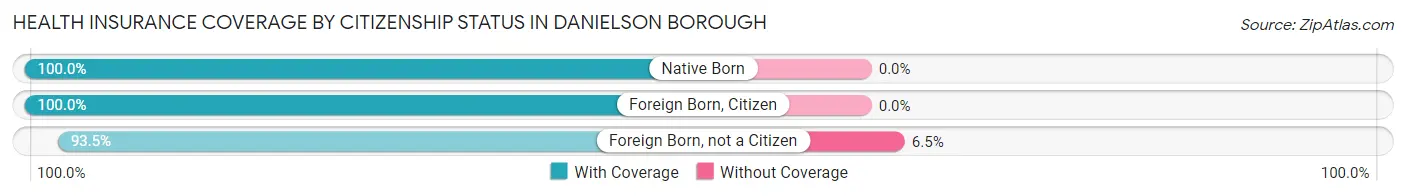
| Citizenship Status | With Coverage | Without Coverage |
| Native Born | 282 (100.0%) | 0 (0.0%) |
| Foreign Born, Citizen | 741 (100.0%) | 0 (0.0%) |
| Foreign Born, not a Citizen | 402 (93.5%) | 28 (6.5%) |
Health Insurance Coverage by Household Income in Danielson borough
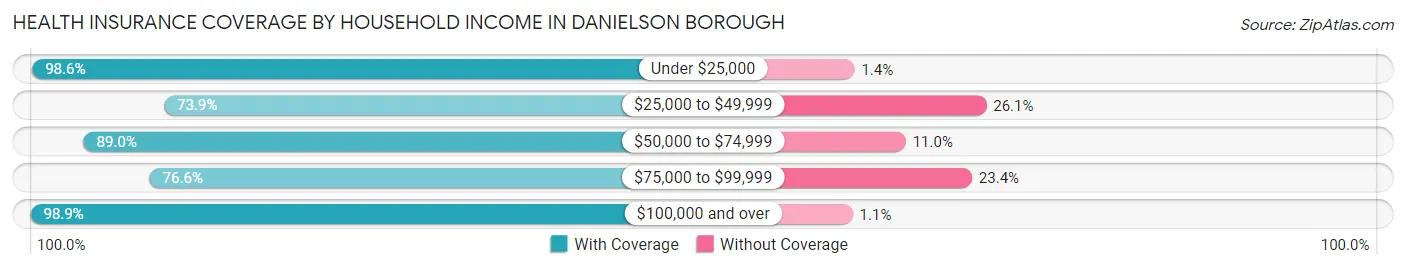
| Household Income | With Coverage | Without Coverage |
| Under $25,000 | 684 (98.6%) | 10 (1.4%) |
| $25,000 to $49,999 | 458 (73.9%) | 162 (26.1%) |
| $50,000 to $74,999 | 814 (89.0%) | 101 (11.0%) |
| $75,000 to $99,999 | 676 (76.6%) | 207 (23.4%) |
| $100,000 and over | 993 (98.9%) | 11 (1.1%) |
Public vs Private Health Insurance Coverage by Age in Danielson borough
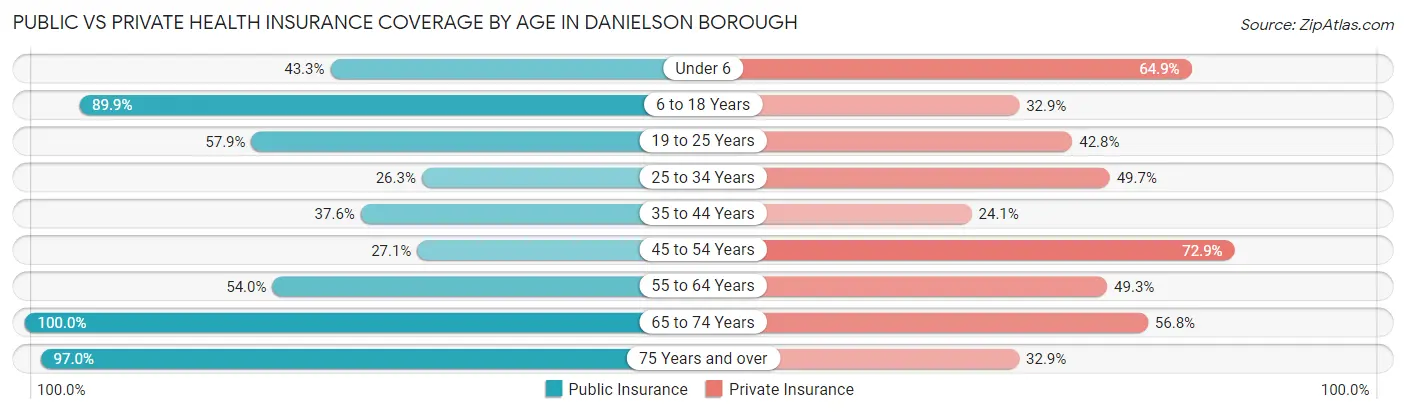
| Age Bracket | Public Insurance | Private Insurance |
| Under 6 | 122 (43.3%) | 183 (64.9%) |
| 6 to 18 Years | 666 (89.9%) | 244 (32.9%) |
| 19 to 25 Years | 249 (57.9%) | 184 (42.8%) |
| 25 to 34 Years | 240 (26.3%) | 454 (49.7%) |
| 35 to 44 Years | 231 (37.6%) | 148 (24.1%) |
| 45 to 54 Years | 105 (27.1%) | 282 (72.9%) |
| 55 to 64 Years | 181 (54.0%) | 165 (49.2%) |
| 65 to 74 Years | 220 (100.0%) | 125 (56.8%) |
| 75 Years and over | 227 (97.0%) | 77 (32.9%) |
| Total | 2,241 (53.9%) | 1,862 (44.8%) |
Disability Status by Sex by Age in Danielson borough
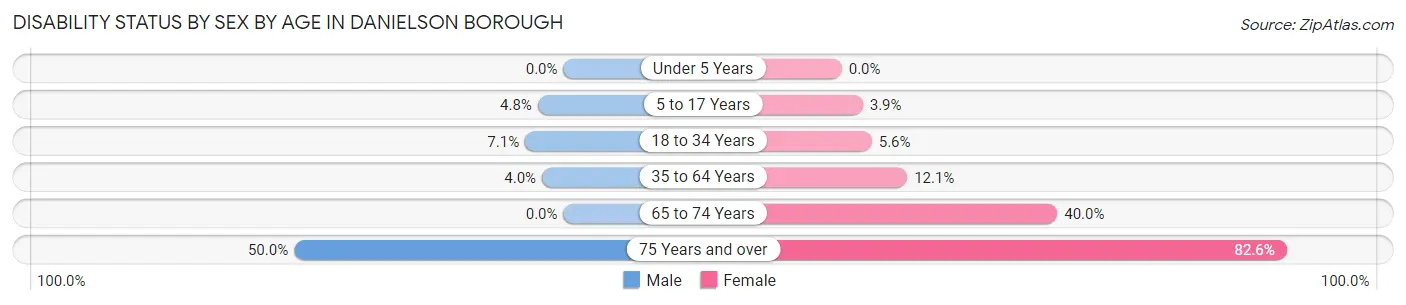
| Age Bracket | Male | Female |
| Under 5 Years | 0 (0.0%) | 0 (0.0%) |
| 5 to 17 Years | 12 (4.8%) | 21 (3.9%) |
| 18 to 34 Years | 46 (7.1%) | 39 (5.6%) |
| 35 to 64 Years | 24 (4.0%) | 89 (12.1%) |
| 65 to 74 Years | 0 (0.0%) | 54 (40.0%) |
| 75 Years and over | 31 (50.0%) | 142 (82.6%) |
Disability Class by Sex by Age in Danielson borough
Disability Class: Hearing Difficulty
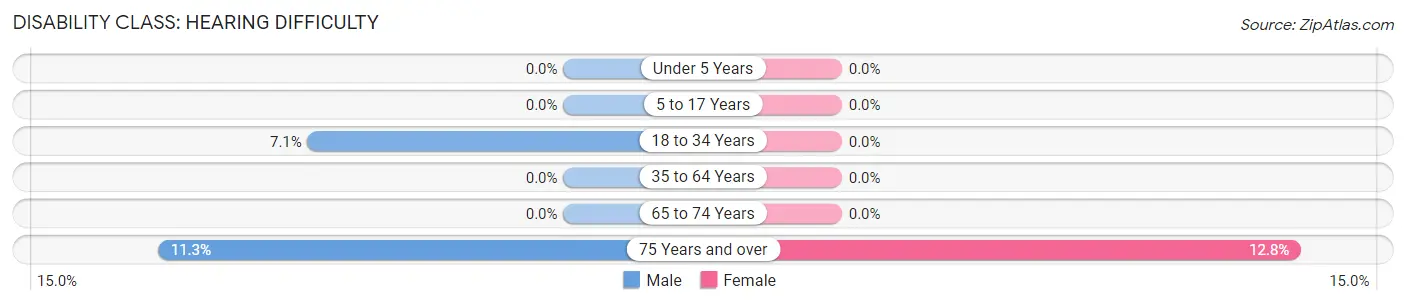
| Age Bracket | Male | Female |
| Under 5 Years | 0 (0.0%) | 0 (0.0%) |
| 5 to 17 Years | 0 (0.0%) | 0 (0.0%) |
| 18 to 34 Years | 46 (7.1%) | 0 (0.0%) |
| 35 to 64 Years | 0 (0.0%) | 0 (0.0%) |
| 65 to 74 Years | 0 (0.0%) | 0 (0.0%) |
| 75 Years and over | 7 (11.3%) | 22 (12.8%) |
Disability Class: Vision Difficulty
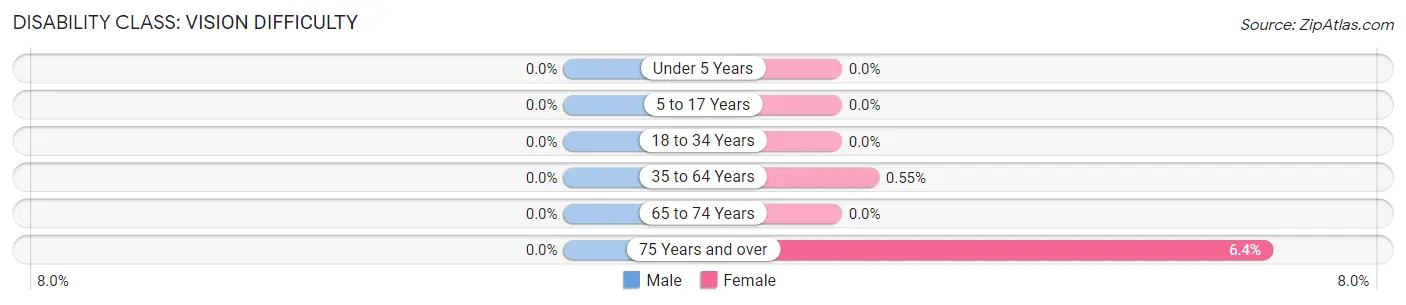
| Age Bracket | Male | Female |
| Under 5 Years | 0 (0.0%) | 0 (0.0%) |
| 5 to 17 Years | 0 (0.0%) | 0 (0.0%) |
| 18 to 34 Years | 0 (0.0%) | 0 (0.0%) |
| 35 to 64 Years | 0 (0.0%) | 4 (0.5%) |
| 65 to 74 Years | 0 (0.0%) | 0 (0.0%) |
| 75 Years and over | 0 (0.0%) | 11 (6.4%) |
Disability Class: Cognitive Difficulty
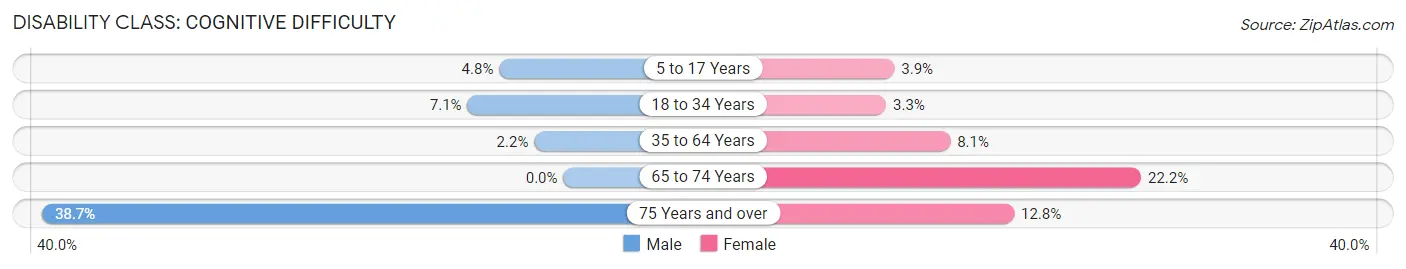
| Age Bracket | Male | Female |
| 5 to 17 Years | 12 (4.8%) | 21 (3.9%) |
| 18 to 34 Years | 46 (7.1%) | 23 (3.3%) |
| 35 to 64 Years | 13 (2.2%) | 59 (8.1%) |
| 65 to 74 Years | 0 (0.0%) | 30 (22.2%) |
| 75 Years and over | 24 (38.7%) | 22 (12.8%) |
Disability Class: Ambulatory Difficulty
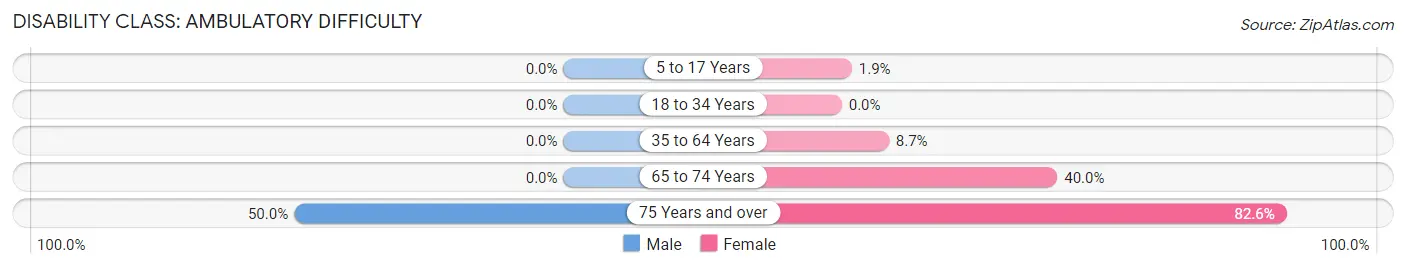
| Age Bracket | Male | Female |
| 5 to 17 Years | 0 (0.0%) | 10 (1.9%) |
| 18 to 34 Years | 0 (0.0%) | 0 (0.0%) |
| 35 to 64 Years | 0 (0.0%) | 64 (8.7%) |
| 65 to 74 Years | 0 (0.0%) | 54 (40.0%) |
| 75 Years and over | 31 (50.0%) | 142 (82.6%) |
Disability Class: Self-Care Difficulty
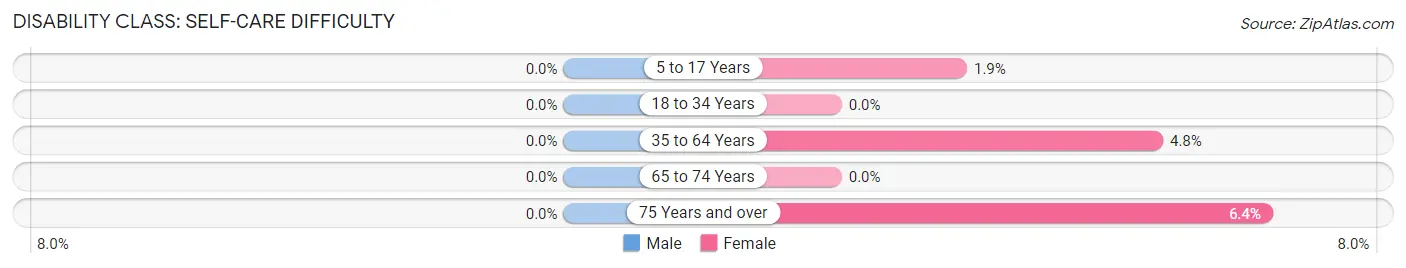
| Age Bracket | Male | Female |
| 5 to 17 Years | 0 (0.0%) | 10 (1.9%) |
| 18 to 34 Years | 0 (0.0%) | 0 (0.0%) |
| 35 to 64 Years | 0 (0.0%) | 35 (4.8%) |
| 65 to 74 Years | 0 (0.0%) | 0 (0.0%) |
| 75 Years and over | 0 (0.0%) | 11 (6.4%) |
Technology Access in Danielson borough
Computing Device Access in Danielson borough
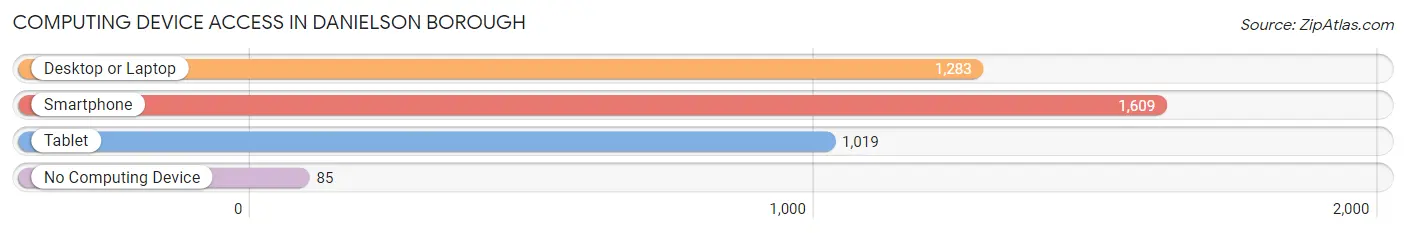
| Device Type | # Households | % Households |
| Desktop or Laptop | 1,283 | 72.0% |
| Smartphone | 1,609 | 90.3% |
| Tablet | 1,019 | 57.2% |
| No Computing Device | 85 | 4.8% |
| Total | 1,782 | 100.0% |
Internet Access in Danielson borough
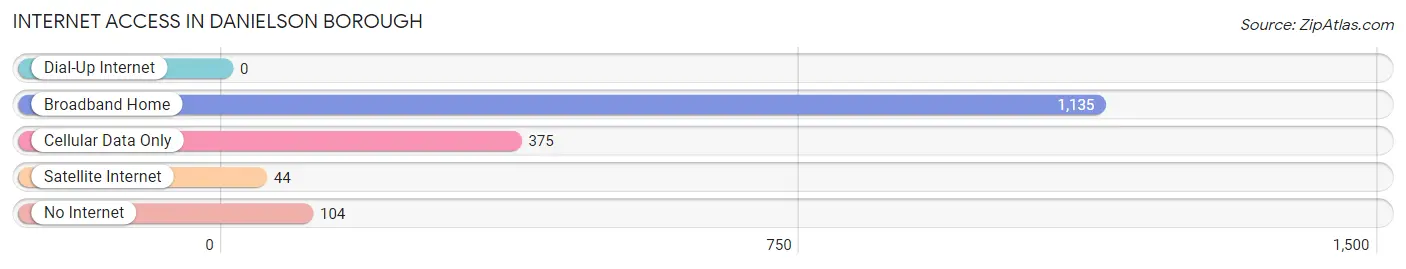
| Internet Type | # Households | % Households |
| Dial-Up Internet | 0 | 0.0% |
| Broadband Home | 1,135 | 63.7% |
| Cellular Data Only | 375 | 21.0% |
| Satellite Internet | 44 | 2.5% |
| No Internet | 104 | 5.8% |
| Total | 1,782 | 100.0% |
Danielson borough Summary
Danielson Borough is a borough in Windham County, Connecticut, United States. The population was 4,845 at the 2010 census. It is the county seat of Windham County.
History
The area that is now Danielson Borough was originally inhabited by the Nipmuc people. The first European settlers arrived in the area in the 1660s. The town was originally known as Killingly, and was incorporated in 1708. In 1854, the town was divided into two separate towns, Killingly and Danielsonville. In 1871, Danielsonville was incorporated as a borough.
The borough was named after John Danielson, a prominent local businessman and politician. He was a major landowner in the area and was instrumental in the development of the town.
Geography
Danielson Borough is located in the eastern part of Windham County, in the northeastern corner of Connecticut. It is bordered by the towns of Killingly to the north, Brooklyn to the east, Canterbury to the south, and Plainfield to the west.
The borough is located in the Quinebaug River Valley, which is part of the larger Connecticut River Valley. The Quinebaug River flows through the borough, and is a major source of water for the area.
The borough has a total area of 4 2 square miles all of which is land
Economy
Danielson Borough is home to a variety of businesses, including manufacturing, retail, and service industries. The borough is also home to several educational institutions, including Quinebaug Valley Community College and the University of Connecticut at Quinebaug Valley.
The borough is also home to several large employers, including the Quinebaug Valley Medical Center, the Quinebaug Valley Regional School District, and the Windham Regional Vocational Technical School.
Demographics
As of the 2010 census, there were 4,845 people, 1,945 households, and 1,213 families residing in the borough. The population density was 1,154.3 people per square mile. The racial makeup of the borough was 87.3% White, 5.2% African American, 0.7% Native American, 1.2% Asian, 0.1% Pacific Islander, 2.7% from other races, and 2.9% from two or more races. Hispanic or Latino of any race were 6.3% of the population.
The median income for a household in the borough was $45,938, and the median income for a family was $54,938. The per capita income for the borough was $21,945. About 11.2% of families and 14.2% of the population were below the poverty line, including 19.2% of those under age 18 and 8.2% of those age 65 or over.
Common Questions
What is Per Capita Income in Danielson borough?
Per Capita income in Danielson borough is $28,055.
What is the Median Family Income in Danielson borough?
Median Family Income in Danielson borough is $76,025.
What is the Median Household income in Danielson borough?
Median Household Income in Danielson borough is $69,007.
What is Income or Wage Gap in Danielson borough?
Income or Wage Gap in Danielson borough is 26.2%.
Women in Danielson borough earn 73.8 cents for every dollar earned by a man.
What is Inequality or Gini Index in Danielson borough?
Inequality or Gini Index in Danielson borough is 0.35.
What is the Total Population of Danielson borough?
Total Population of Danielson borough is 4,162.
What is the Total Male Population of Danielson borough?
Total Male Population of Danielson borough is 1,801.
What is the Total Female Population of Danielson borough?
Total Female Population of Danielson borough is 2,361.
What is the Ratio of Males per 100 Females in Danielson borough?
There are 76.28 Males per 100 Females in Danielson borough.
What is the Ratio of Females per 100 Males in Danielson borough?
There are 131.09 Females per 100 Males in Danielson borough.
What is the Median Population Age in Danielson borough?
Median Population Age in Danielson borough is 31.3 Years.
What is the Average Family Size in Danielson borough
Average Family Size in Danielson borough is 2.8 People.
What is the Average Household Size in Danielson borough
Average Household Size in Danielson borough is 2.3 People.
How Large is the Labor Force in Danielson borough?
There are 2,523 People in the Labor Forcein in Danielson borough.
What is the Percentage of People in the Labor Force in Danielson borough?
77.2% of People are in the Labor Force in Danielson borough.
What is the Unemployment Rate in Danielson borough?
Unemployment Rate in Danielson borough is 16.9%.