New London, CT Map & Demographics
New London Map
New London Overview
$30,943
PER CAPITA INCOME
$65,357
AVG FAMILY INCOME
$56,237
AVG HOUSEHOLD INCOME
34.4%
WAGE / INCOME GAP [ % ]
65.6¢/ $1
WAGE / INCOME GAP [ $ ]
$9,491
FAMILY INCOME DEFICIT
0.44
INEQUALITY / GINI INDEX
27,596
TOTAL POPULATION
13,359
MALE POPULATION
14,237
FEMALE POPULATION
93.83
MALES / 100 FEMALES
106.57
FEMALES / 100 MALES
35.5
MEDIAN AGE
2.8
AVG FAMILY SIZE
2.1
AVG HOUSEHOLD SIZE
15,010
LABOR FORCE [ PEOPLE ]
64.4%
PERCENT IN LABOR FORCE
7.1%
UNEMPLOYMENT RATE
New London Zip Codes
New London Area Codes
Income in New London
Income Overview in New London
Per Capita Income in New London is $30,943, while median incomes of families and households are $65,357 and $56,237 respectively.
| Characteristic | Number | Measure |
| Per Capita Income | 27,596 | $30,943 |
| Median Family Income | 5,682 | $65,357 |
| Mean Family Income | 5,682 | $82,969 |
| Median Household Income | 11,125 | $56,237 |
| Mean Household Income | 11,125 | $72,393 |
| Income Deficit | 5,682 | $9,491 |
| Wage / Income Gap (%) | 27,596 | 34.36% |
| Wage / Income Gap ($) | 27,596 | 65.64¢ per $1 |
| Gini / Inequality Index | 27,596 | 0.44 |
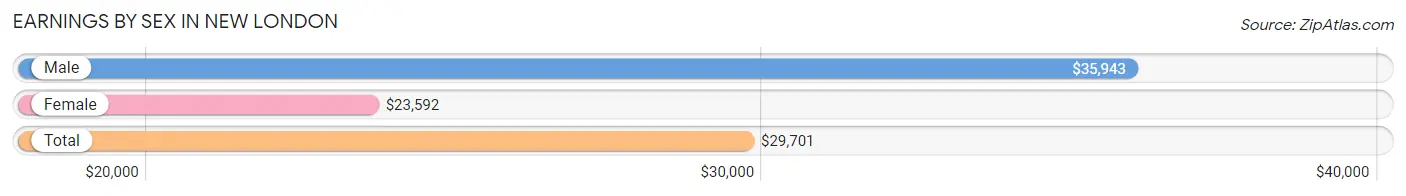
Earnings by Sex in New London
Average Earnings in New London are $29,701, $35,943 for men and $23,592 for women, a difference of 34.4%.
| Sex | Number | Average Earnings |
| Male | 8,347 (51.2%) | $35,943 |
| Female | 7,966 (48.8%) | $23,592 |
| Total | 16,313 (100.0%) | $29,701 |
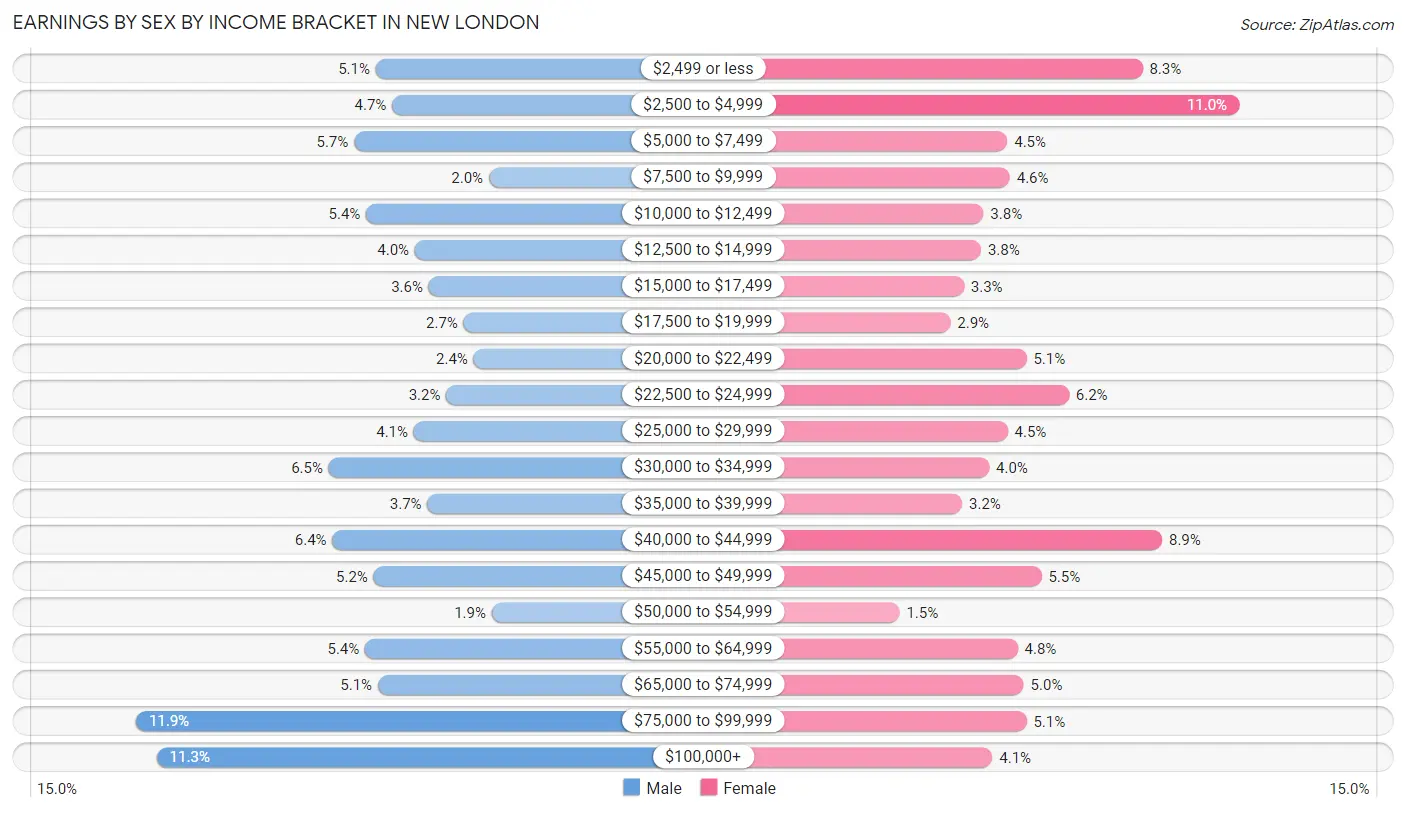
Earnings by Sex by Income Bracket in New London
The most common earnings brackets in New London are $75,000 to $99,999 for men (991 | 11.9%) and $2,500 to $4,999 for women (878 | 11.0%).
| Income | Male | Female |
| $2,499 or less | 428 (5.1%) | 662 (8.3%) |
| $2,500 to $4,999 | 390 (4.7%) | 878 (11.0%) |
| $5,000 to $7,499 | 479 (5.7%) | 359 (4.5%) |
| $7,500 to $9,999 | 163 (1.9%) | 365 (4.6%) |
| $10,000 to $12,499 | 451 (5.4%) | 306 (3.8%) |
| $12,500 to $14,999 | 336 (4.0%) | 300 (3.8%) |
| $15,000 to $17,499 | 304 (3.6%) | 262 (3.3%) |
| $17,500 to $19,999 | 222 (2.7%) | 232 (2.9%) |
| $20,000 to $22,499 | 199 (2.4%) | 402 (5.1%) |
| $22,500 to $24,999 | 263 (3.2%) | 497 (6.2%) |
| $25,000 to $29,999 | 339 (4.1%) | 360 (4.5%) |
| $30,000 to $34,999 | 538 (6.5%) | 319 (4.0%) |
| $35,000 to $39,999 | 307 (3.7%) | 258 (3.2%) |
| $40,000 to $44,999 | 530 (6.4%) | 706 (8.9%) |
| $45,000 to $49,999 | 433 (5.2%) | 436 (5.5%) |
| $50,000 to $54,999 | 156 (1.9%) | 118 (1.5%) |
| $55,000 to $64,999 | 453 (5.4%) | 382 (4.8%) |
| $65,000 to $74,999 | 423 (5.1%) | 396 (5.0%) |
| $75,000 to $99,999 | 991 (11.9%) | 402 (5.1%) |
| $100,000+ | 942 (11.3%) | 326 (4.1%) |
| Total | 8,347 (100.0%) | 7,966 (100.0%) |
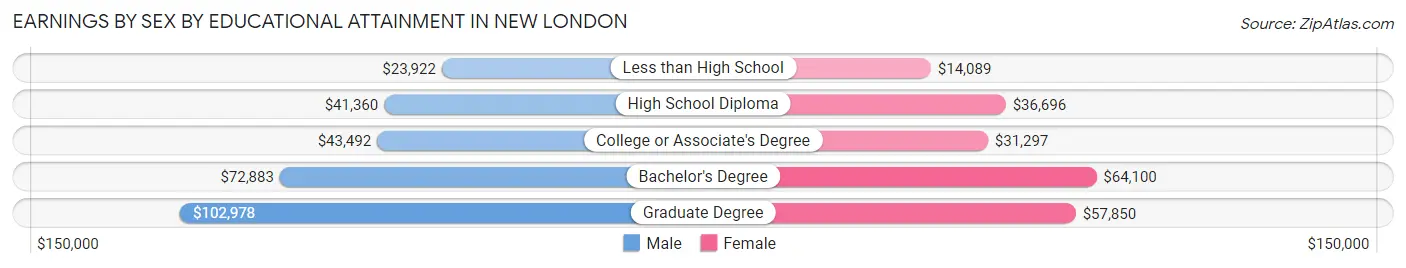
Earnings by Sex by Educational Attainment in New London
Average earnings in New London are $45,742 for men and $38,613 for women, a difference of 15.6%. Men with an educational attainment of graduate degree enjoy the highest average annual earnings of $102,978, while those with less than high school education earn the least with $23,922. Women with an educational attainment of bachelor's degree earn the most with the average annual earnings of $64,100, while those with less than high school education have the smallest earnings of $14,089.
| Educational Attainment | Male Income | Female Income |
| Less than High School | $23,922 | $14,089 |
| High School Diploma | $41,360 | $36,696 |
| College or Associate's Degree | $43,492 | $31,297 |
| Bachelor's Degree | $72,883 | $64,100 |
| Graduate Degree | $102,978 | $57,850 |
| Total | $45,742 | $38,613 |
Family Income in New London
Family Income Brackets in New London
According to the New London family income data, there are 1,051 families falling into the $50,000 to $74,999 income range, which is the most common income bracket and makes up 18.5% of all families. Conversely, the less than $10,000 income bracket is the least frequent group with only 131 families (2.3%) belonging to this category.
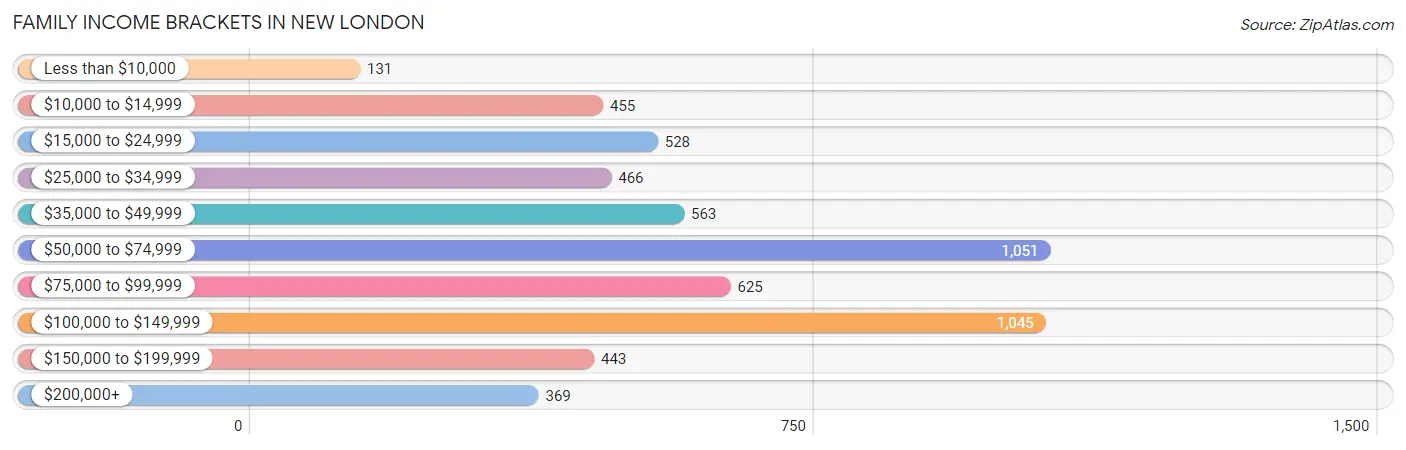
| Income Bracket | # Families | % Families |
| Less than $10,000 | 131 | 2.3% |
| $10,000 to $14,999 | 455 | 8.0% |
| $15,000 to $24,999 | 528 | 9.3% |
| $25,000 to $34,999 | 466 | 8.2% |
| $35,000 to $49,999 | 563 | 9.9% |
| $50,000 to $74,999 | 1,051 | 18.5% |
| $75,000 to $99,999 | 625 | 11.0% |
| $100,000 to $149,999 | 1,045 | 18.4% |
| $150,000 to $199,999 | 443 | 7.8% |
| $200,000+ | 369 | 6.5% |
Family Income by Famaliy Size in New London
6-person families (145 | 2.5%) account for the highest median family income in New London with $91,215 per family, while 2-person families (2,987 | 52.6%) have the highest median income of $31,841 per family member.
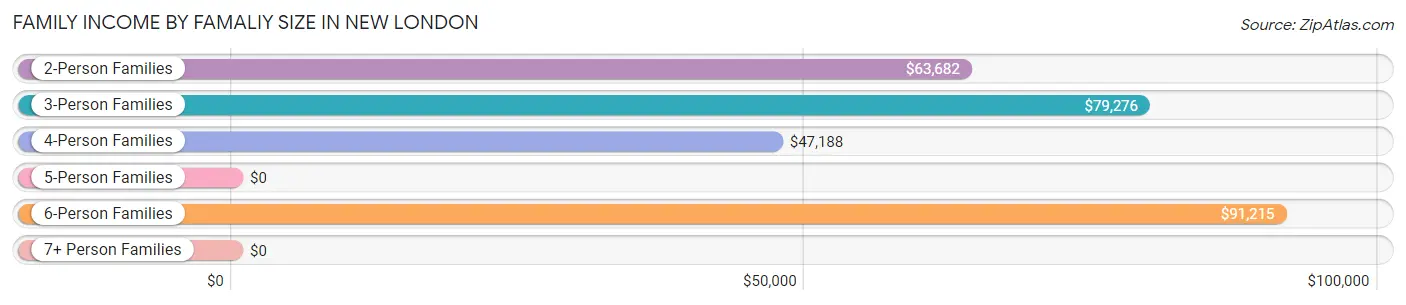
| Income Bracket | # Families | Median Income |
| 2-Person Families | 2,987 (52.6%) | $63,682 |
| 3-Person Families | 1,409 (24.8%) | $79,276 |
| 4-Person Families | 896 (15.8%) | $47,188 |
| 5-Person Families | 245 (4.3%) | $0 |
| 6-Person Families | 145 (2.5%) | $91,215 |
| 7+ Person Families | 0 (0.0%) | $0 |
| Total | 5,682 (100.0%) | $65,357 |
Family Income by Number of Earners in New London
The median family income in New London is $65,357, with families comprising 3+ earners (561) having the highest median family income of $116,020, while families with no earners (765) have the lowest median family income of $36,393, accounting for 9.9% and 13.5% of families, respectively.
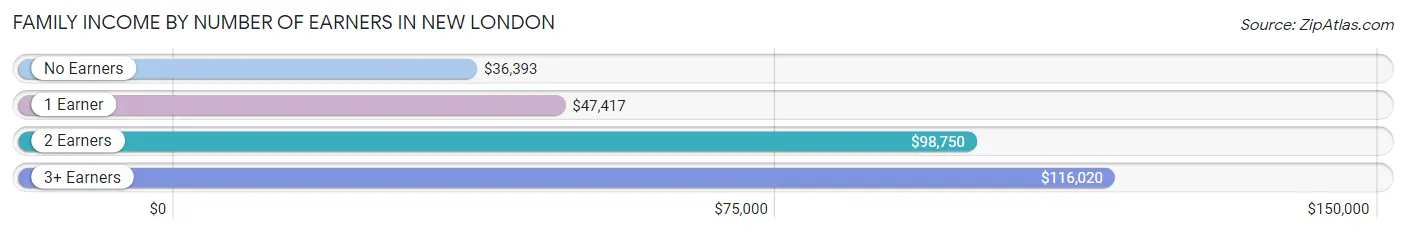
| Number of Earners | # Families | Median Income |
| No Earners | 765 (13.5%) | $36,393 |
| 1 Earner | 2,248 (39.6%) | $47,417 |
| 2 Earners | 2,108 (37.1%) | $98,750 |
| 3+ Earners | 561 (9.9%) | $116,020 |
| Total | 5,682 (100.0%) | $65,357 |
Household Income in New London
Household Income Brackets in New London
With 1,813 households falling in the category, the $100,000 to $149,999 income range is the most frequent in New London, accounting for 16.3% of all households. In contrast, only 378 households (3.4%) fall into the less than $10,000 income bracket, making it the least populous group.
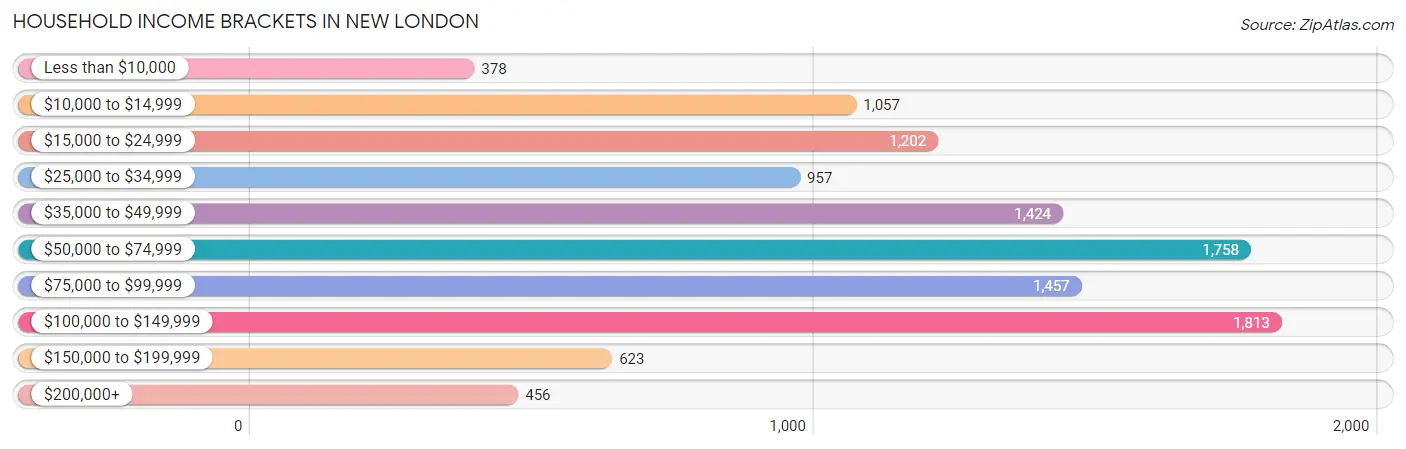
| Income Bracket | # Households | % Households |
| Less than $10,000 | 378 | 3.4% |
| $10,000 to $14,999 | 1,057 | 9.5% |
| $15,000 to $24,999 | 1,202 | 10.8% |
| $25,000 to $34,999 | 957 | 8.6% |
| $35,000 to $49,999 | 1,424 | 12.8% |
| $50,000 to $74,999 | 1,758 | 15.8% |
| $75,000 to $99,999 | 1,457 | 13.1% |
| $100,000 to $149,999 | 1,813 | 16.3% |
| $150,000 to $199,999 | 623 | 5.6% |
| $200,000+ | 456 | 4.1% |
Household Income by Householder Age in New London
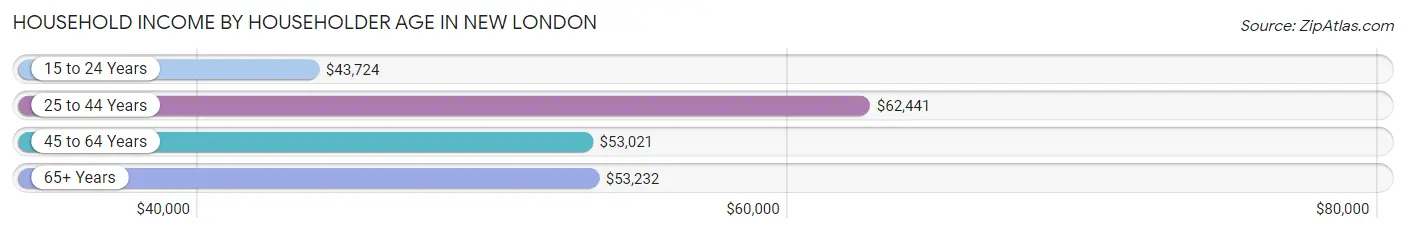
The median household income in New London is $56,237, with the highest median household income of $62,441 found in the 25 to 44 years age bracket for the primary householder. A total of 4,128 households (37.1%) fall into this category. Meanwhile, the 15 to 24 years age bracket for the primary householder has the lowest median household income of $43,724, with 559 households (5.0%) in this group.
| Income Bracket | # Households | Median Income |
| 15 to 24 Years | 559 (5.0%) | $43,724 |
| 25 to 44 Years | 4,128 (37.1%) | $62,441 |
| 45 to 64 Years | 3,435 (30.9%) | $53,021 |
| 65+ Years | 3,003 (27.0%) | $53,232 |
| Total | 11,125 (100.0%) | $56,237 |
Poverty in New London
Income Below Poverty by Sex and Age in New London
With 21.4% poverty level for males and 21.6% for females among the residents of New London, 15 year old males and 12 to 14 year old females are the most vulnerable to poverty, with 40 males (95.2%) and 213 females (46.0%) in their respective age groups living below the poverty level.
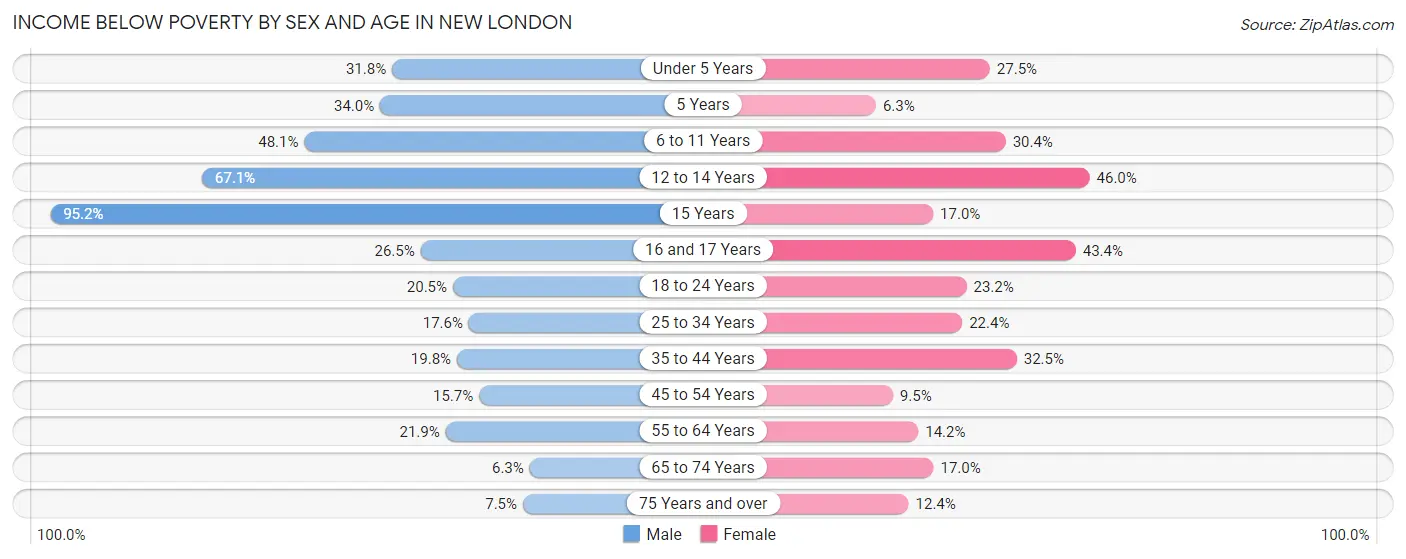
| Age Bracket | Male | Female |
| Under 5 Years | 237 (31.8%) | 182 (27.5%) |
| 5 Years | 33 (34.0%) | 13 (6.3%) |
| 6 to 11 Years | 290 (48.1%) | 212 (30.4%) |
| 12 to 14 Years | 269 (67.1%) | 213 (46.0%) |
| 15 Years | 40 (95.2%) | 48 (17.0%) |
| 16 and 17 Years | 44 (26.5%) | 43 (43.4%) |
| 18 to 24 Years | 176 (20.5%) | 258 (23.2%) |
| 25 to 34 Years | 359 (17.5%) | 320 (22.4%) |
| 35 to 44 Years | 362 (19.8%) | 644 (32.5%) |
| 45 to 54 Years | 224 (15.7%) | 118 (9.5%) |
| 55 to 64 Years | 292 (21.9%) | 300 (14.2%) |
| 65 to 74 Years | 79 (6.3%) | 209 (17.0%) |
| 75 Years and over | 48 (7.5%) | 95 (12.4%) |
| Total | 2,453 (21.4%) | 2,655 (21.6%) |
Income Above Poverty by Sex and Age in New London
According to the poverty statistics in New London, males aged 65 to 74 years and females aged 5 years are the age groups that are most secure financially, with 93.7% of males and 93.7% of females in these age groups living above the poverty line.
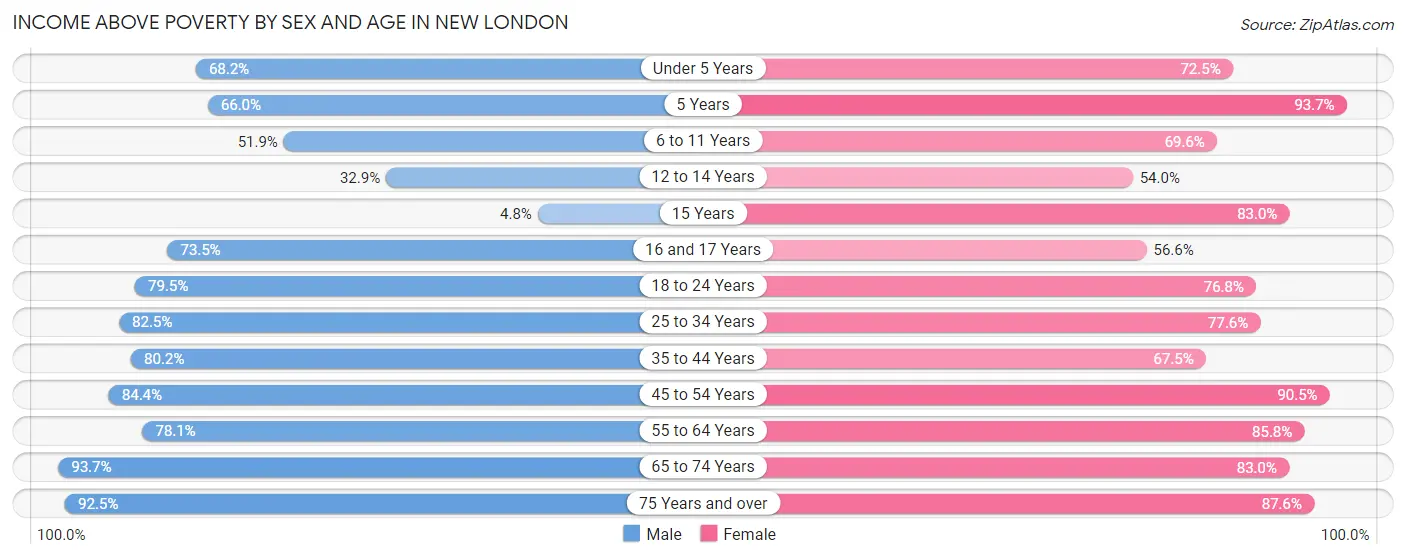
| Age Bracket | Male | Female |
| Under 5 Years | 508 (68.2%) | 480 (72.5%) |
| 5 Years | 64 (66.0%) | 192 (93.7%) |
| 6 to 11 Years | 313 (51.9%) | 485 (69.6%) |
| 12 to 14 Years | 132 (32.9%) | 250 (54.0%) |
| 15 Years | 2 (4.8%) | 235 (83.0%) |
| 16 and 17 Years | 122 (73.5%) | 56 (56.6%) |
| 18 to 24 Years | 682 (79.5%) | 856 (76.8%) |
| 25 to 34 Years | 1,687 (82.5%) | 1,111 (77.6%) |
| 35 to 44 Years | 1,470 (80.2%) | 1,339 (67.5%) |
| 45 to 54 Years | 1,207 (84.4%) | 1,126 (90.5%) |
| 55 to 64 Years | 1,043 (78.1%) | 1,812 (85.8%) |
| 65 to 74 Years | 1,183 (93.7%) | 1,018 (83.0%) |
| 75 Years and over | 591 (92.5%) | 671 (87.6%) |
| Total | 9,004 (78.6%) | 9,631 (78.4%) |
Income Below Poverty Among Married-Couple Families in New London
The poverty statistics for married-couple families in New London show that 10.5% or 321 of the total 3,046 families live below the poverty line. Families with 3 or 4 children have the highest poverty rate of 53.7%, comprising of 123 families. On the other hand, families with no children have the lowest poverty rate of 4.7%, which includes 88 families.
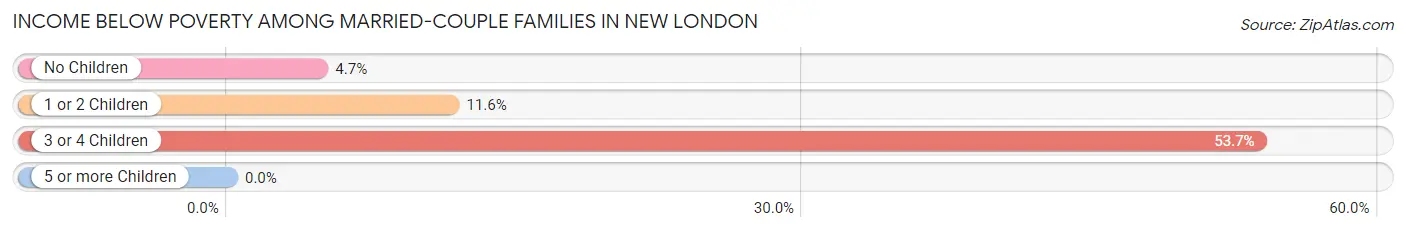
| Children | Above Poverty | Below Poverty |
| No Children | 1,778 (95.3%) | 88 (4.7%) |
| 1 or 2 Children | 841 (88.4%) | 110 (11.6%) |
| 3 or 4 Children | 106 (46.3%) | 123 (53.7%) |
| 5 or more Children | 0 (0.0%) | 0 (0.0%) |
| Total | 2,725 (89.5%) | 321 (10.5%) |
Income Below Poverty Among Single-Parent Households in New London
According to the poverty data in New London, 20.2% or 127 single-father households and 29.7% or 596 single-mother households are living below the poverty line. Among single-father households, those with 1 or 2 children have the highest poverty rate, with 119 households (36.8%) experiencing poverty. Likewise, among single-mother households, those with 3 or 4 children have the highest poverty rate, with 159 households (81.1%) falling below the poverty line.
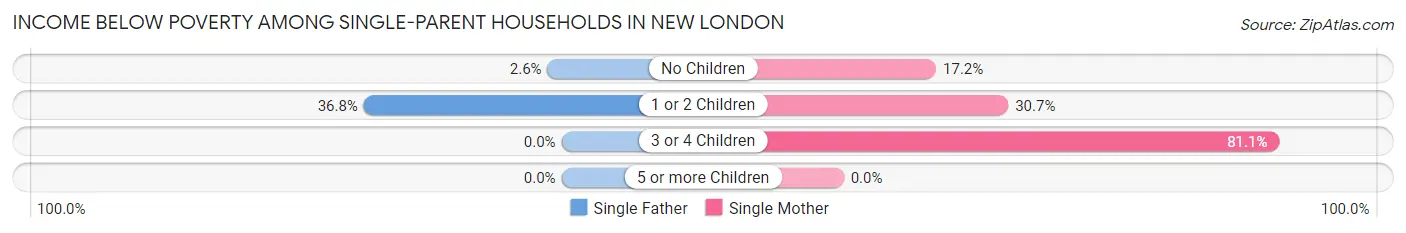
| Children | Single Father | Single Mother |
| No Children | 8 (2.6%) | 151 (17.2%) |
| 1 or 2 Children | 119 (36.8%) | 286 (30.6%) |
| 3 or 4 Children | 0 (0.0%) | 159 (81.1%) |
| 5 or more Children | 0 (0.0%) | 0 (0.0%) |
| Total | 127 (20.2%) | 596 (29.7%) |
Income Below Poverty Among Married-Couple vs Single-Parent Households in New London
The poverty data for New London shows that 321 of the married-couple family households (10.5%) and 723 of the single-parent households (27.4%) are living below the poverty level. Within the married-couple family households, those with 3 or 4 children have the highest poverty rate, with 123 households (53.7%) falling below the poverty line. Among the single-parent households, those with 3 or 4 children have the highest poverty rate, with 159 household (81.1%) living below poverty.
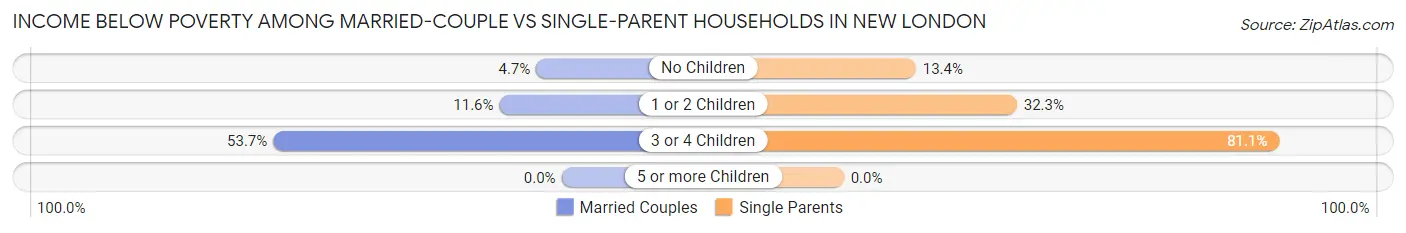
| Children | Married-Couple Families | Single-Parent Households |
| No Children | 88 (4.7%) | 159 (13.4%) |
| 1 or 2 Children | 110 (11.6%) | 405 (32.3%) |
| 3 or 4 Children | 123 (53.7%) | 159 (81.1%) |
| 5 or more Children | 0 (0.0%) | 0 (0.0%) |
| Total | 321 (10.5%) | 723 (27.4%) |
Race in New London
The most populous races in New London are White / Caucasian (15,512 | 56.2%), Hispanic or Latino (8,104 | 29.4%), and Black / African American (4,694 | 17.0%).
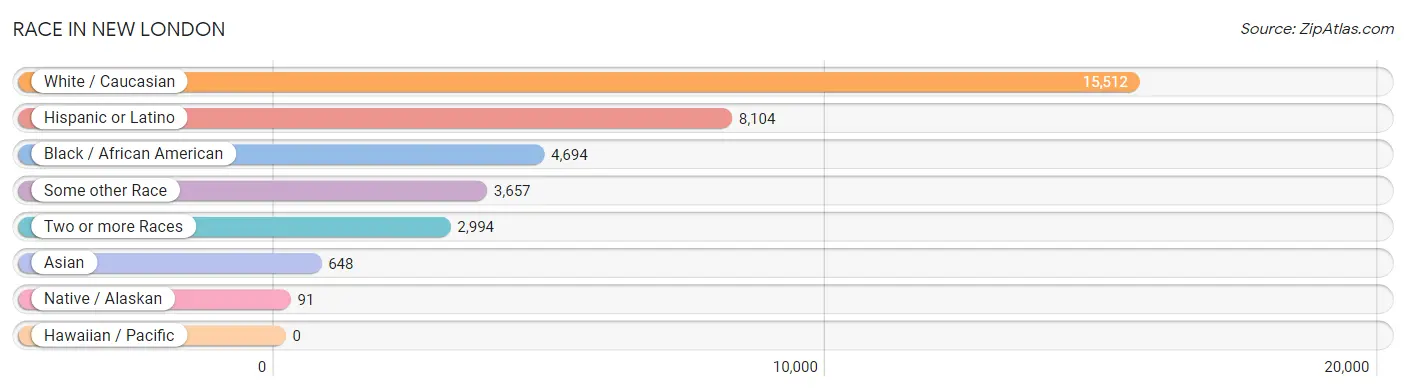
| Race | # Population | % Population |
| Asian | 648 | 2.4% |
| Black / African American | 4,694 | 17.0% |
| Hawaiian / Pacific | 0 | 0.0% |
| Hispanic or Latino | 8,104 | 29.4% |
| Native / Alaskan | 91 | 0.3% |
| White / Caucasian | 15,512 | 56.2% |
| Two or more Races | 2,994 | 10.8% |
| Some other Race | 3,657 | 13.3% |
| Total | 27,596 | 100.0% |
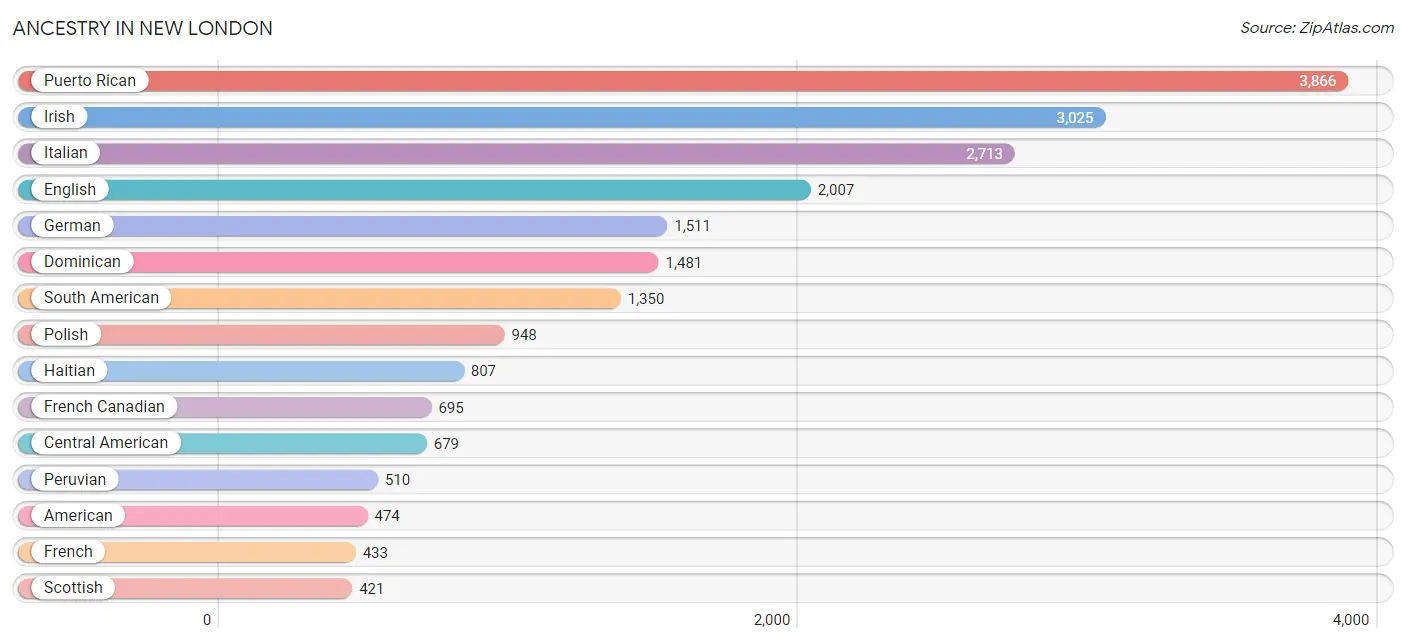
Ancestry in New London
The most populous ancestries reported in New London are Puerto Rican (3,866 | 14.0%), Irish (3,025 | 11.0%), Italian (2,713 | 9.8%), English (2,007 | 7.3%), and German (1,511 | 5.5%), together accounting for 47.5% of all New London residents.
| Ancestry | # Population | % Population |
| African | 107 | 0.4% |
| American | 474 | 1.7% |
| Arab | 112 | 0.4% |
| Argentinean | 8 | 0.0% |
| Armenian | 87 | 0.3% |
| Austrian | 30 | 0.1% |
| Bahamian | 1 | 0.0% |
| Bhutanese | 53 | 0.2% |
| Blackfeet | 3 | 0.0% |
| Brazilian | 17 | 0.1% |
| British | 72 | 0.3% |
| Bulgarian | 14 | 0.1% |
| Burmese | 62 | 0.2% |
| Canadian | 57 | 0.2% |
| Cape Verdean | 32 | 0.1% |
| Central American | 679 | 2.5% |
| Central American Indian | 30 | 0.1% |
| Cherokee | 70 | 0.3% |
| Chilean | 2 | 0.0% |
| Chippewa | 4 | 0.0% |
| Colombian | 201 | 0.7% |
| Costa Rican | 42 | 0.2% |
| Croatian | 94 | 0.3% |
| Cuban | 151 | 0.5% |
| Czech | 70 | 0.3% |
| Czechoslovakian | 51 | 0.2% |
| Danish | 62 | 0.2% |
| Dominican | 1,481 | 5.4% |
| Dutch | 163 | 0.6% |
| Eastern European | 73 | 0.3% |
| Ecuadorian | 390 | 1.4% |
| Egyptian | 17 | 0.1% |
| English | 2,007 | 7.3% |
| European | 311 | 1.1% |
| Finnish | 85 | 0.3% |
| French | 433 | 1.6% |
| French Canadian | 695 | 2.5% |
| German | 1,511 | 5.5% |
| Greek | 86 | 0.3% |
| Guatemalan | 99 | 0.4% |
| Guyanese | 25 | 0.1% |
| Haitian | 807 | 2.9% |
| Hmong | 8 | 0.0% |
| Honduran | 190 | 0.7% |
| Hungarian | 86 | 0.3% |
| Icelander | 9 | 0.0% |
| Indian (Asian) | 147 | 0.5% |
| Iranian | 11 | 0.0% |
| Irish | 3,025 | 11.0% |
| Iroquois | 12 | 0.0% |
| Italian | 2,713 | 9.8% |
| Jamaican | 221 | 0.8% |
| Korean | 329 | 1.2% |
| Lebanese | 95 | 0.3% |
| Liberian | 12 | 0.0% |
| Lithuanian | 37 | 0.1% |
| Lumbee | 11 | 0.0% |
| Macedonian | 21 | 0.1% |
| Malaysian | 30 | 0.1% |
| Mexican | 408 | 1.5% |
| Nigerian | 15 | 0.1% |
| Northern European | 31 | 0.1% |
| Norwegian | 148 | 0.5% |
| Pakistani | 36 | 0.1% |
| Panamanian | 141 | 0.5% |
| Peruvian | 510 | 1.8% |
| Polish | 948 | 3.4% |
| Portuguese | 307 | 1.1% |
| Puerto Rican | 3,866 | 14.0% |
| Romanian | 56 | 0.2% |
| Russian | 321 | 1.2% |
| Salvadoran | 207 | 0.7% |
| Samoan | 10 | 0.0% |
| Scandinavian | 19 | 0.1% |
| Scotch-Irish | 219 | 0.8% |
| Scottish | 421 | 1.5% |
| Slovak | 143 | 0.5% |
| South African | 36 | 0.1% |
| South American | 1,350 | 4.9% |
| Spaniard | 94 | 0.3% |
| Spanish American | 16 | 0.1% |
| Sri Lankan | 10 | 0.0% |
| Subsaharan African | 202 | 0.7% |
| Swedish | 369 | 1.3% |
| Swiss | 54 | 0.2% |
| Thai | 80 | 0.3% |
| Trinidadian and Tobagonian | 18 | 0.1% |
| Turkish | 78 | 0.3% |
| Ukrainian | 50 | 0.2% |
| Venezuelan | 239 | 0.9% |
| Welsh | 35 | 0.1% | View All 91 Rows |
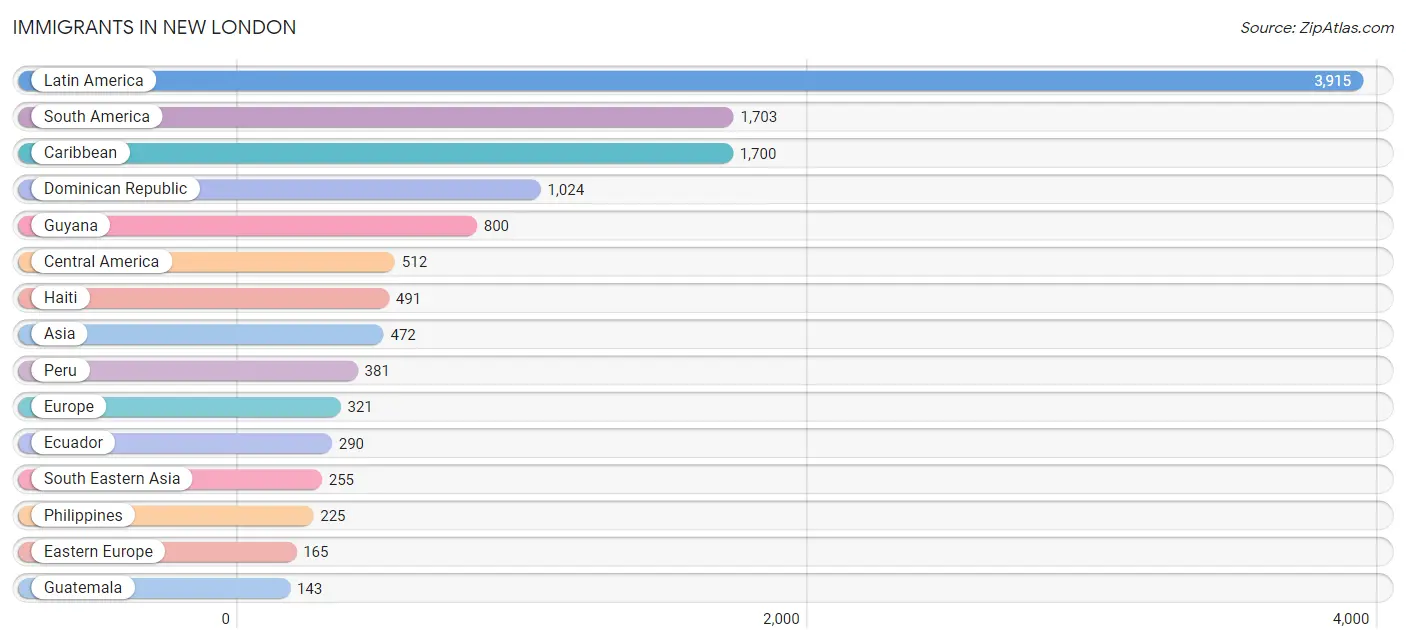
Immigrants in New London
The most numerous immigrant groups reported in New London came from Latin America (3,915 | 14.2%), South America (1,703 | 6.2%), Caribbean (1,700 | 6.2%), Dominican Republic (1,024 | 3.7%), and Guyana (800 | 2.9%), together accounting for 33.1% of all New London residents.
| Immigration Origin | # Population | % Population |
| Africa | 56 | 0.2% |
| Asia | 472 | 1.7% |
| Brazil | 17 | 0.1% |
| Bulgaria | 14 | 0.1% |
| Canada | 40 | 0.1% |
| Caribbean | 1,700 | 6.2% |
| Central America | 512 | 1.9% |
| Chile | 1 | 0.0% |
| China | 26 | 0.1% |
| Colombia | 123 | 0.4% |
| Cuba | 15 | 0.1% |
| Denmark | 10 | 0.0% |
| Dominican Republic | 1,024 | 3.7% |
| Eastern Asia | 71 | 0.3% |
| Eastern Europe | 165 | 0.6% |
| Ecuador | 290 | 1.1% |
| Egypt | 5 | 0.0% |
| El Salvador | 135 | 0.5% |
| England | 14 | 0.1% |
| Europe | 321 | 1.2% |
| Germany | 29 | 0.1% |
| Guatemala | 143 | 0.5% |
| Guyana | 800 | 2.9% |
| Haiti | 491 | 1.8% |
| Honduras | 98 | 0.4% |
| India | 23 | 0.1% |
| Italy | 59 | 0.2% |
| Jamaica | 136 | 0.5% |
| Japan | 12 | 0.0% |
| Korea | 33 | 0.1% |
| Laos | 30 | 0.1% |
| Latin America | 3,915 | 14.2% |
| Mexico | 121 | 0.4% |
| Nepal | 78 | 0.3% |
| Nigeria | 15 | 0.1% |
| Northern Africa | 5 | 0.0% |
| Northern Europe | 34 | 0.1% |
| Norway | 1 | 0.0% |
| Panama | 15 | 0.1% |
| Peru | 381 | 1.4% |
| Philippines | 225 | 0.8% |
| Poland | 75 | 0.3% |
| Romania | 19 | 0.1% |
| Russia | 29 | 0.1% |
| Serbia | 16 | 0.1% |
| South Africa | 36 | 0.1% |
| South America | 1,703 | 6.2% |
| South Central Asia | 101 | 0.4% |
| South Eastern Asia | 255 | 0.9% |
| Southern Europe | 93 | 0.3% |
| Spain | 34 | 0.1% |
| Sweden | 9 | 0.0% |
| Trinidad and Tobago | 8 | 0.0% |
| Turkey | 45 | 0.2% |
| Ukraine | 12 | 0.0% |
| Venezuela | 91 | 0.3% |
| Western Africa | 15 | 0.1% |
| Western Asia | 45 | 0.2% |
| Western Europe | 29 | 0.1% | View All 59 Rows |
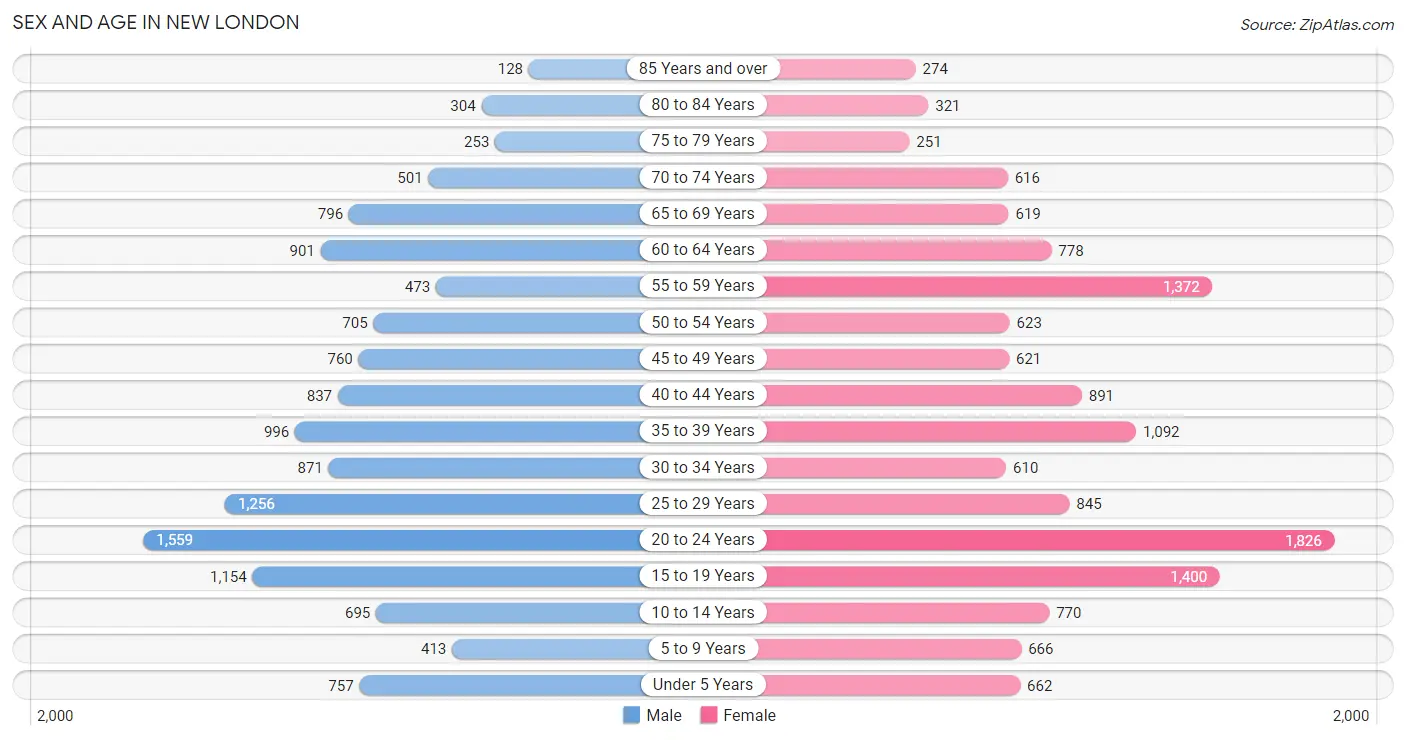
Sex and Age in New London
Sex and Age in New London
The most populous age groups in New London are 20 to 24 Years (1,559 | 11.7%) for men and 20 to 24 Years (1,826 | 12.8%) for women.
| Age Bracket | Male | Female |
| Under 5 Years | 757 (5.7%) | 662 (4.6%) |
| 5 to 9 Years | 413 (3.1%) | 666 (4.7%) |
| 10 to 14 Years | 695 (5.2%) | 770 (5.4%) |
| 15 to 19 Years | 1,154 (8.6%) | 1,400 (9.8%) |
| 20 to 24 Years | 1,559 (11.7%) | 1,826 (12.8%) |
| 25 to 29 Years | 1,256 (9.4%) | 845 (5.9%) |
| 30 to 34 Years | 871 (6.5%) | 610 (4.3%) |
| 35 to 39 Years | 996 (7.5%) | 1,092 (7.7%) |
| 40 to 44 Years | 837 (6.3%) | 891 (6.3%) |
| 45 to 49 Years | 760 (5.7%) | 621 (4.4%) |
| 50 to 54 Years | 705 (5.3%) | 623 (4.4%) |
| 55 to 59 Years | 473 (3.5%) | 1,372 (9.6%) |
| 60 to 64 Years | 901 (6.7%) | 778 (5.5%) |
| 65 to 69 Years | 796 (6.0%) | 619 (4.3%) |
| 70 to 74 Years | 501 (3.7%) | 616 (4.3%) |
| 75 to 79 Years | 253 (1.9%) | 251 (1.8%) |
| 80 to 84 Years | 304 (2.3%) | 321 (2.2%) |
| 85 Years and over | 128 (1.0%) | 274 (1.9%) |
| Total | 13,359 (100.0%) | 14,237 (100.0%) |
Families and Households in New London
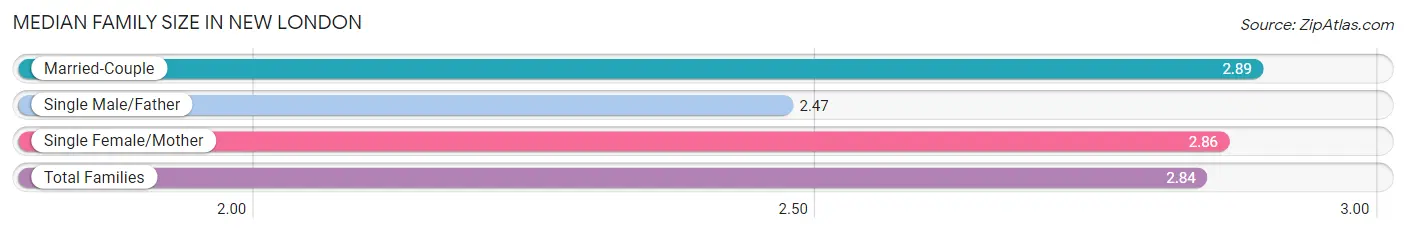
Median Family Size in New London
The median family size in New London is 2.84 persons per family, with married-couple families (3,046 | 53.6%) accounting for the largest median family size of 2.89 persons per family. On the other hand, single male/father families (630 | 11.1%) represent the smallest median family size with 2.47 persons per family.
| Family Type | # Families | Family Size |
| Married-Couple | 3,046 (53.6%) | 2.89 |
| Single Male/Father | 630 (11.1%) | 2.47 |
| Single Female/Mother | 2,006 (35.3%) | 2.86 |
| Total Families | 5,682 (100.0%) | 2.84 |
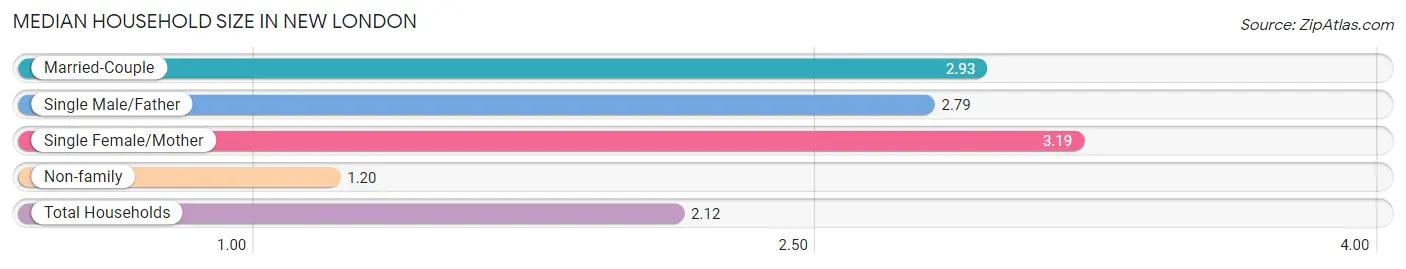
Median Household Size in New London
The median household size in New London is 2.12 persons per household, with single female/mother households (2,006 | 18.0%) accounting for the largest median household size of 3.19 persons per household. non-family households (5,443 | 48.9%) represent the smallest median household size with 1.20 persons per household.
| Household Type | # Households | Household Size |
| Married-Couple | 3,046 (27.4%) | 2.93 |
| Single Male/Father | 630 (5.7%) | 2.79 |
| Single Female/Mother | 2,006 (18.0%) | 3.19 |
| Non-family | 5,443 (48.9%) | 1.20 |
| Total Households | 11,125 (100.0%) | 2.12 |
Household Size by Marriage Status in New London
Out of a total of 11,125 households in New London, 5,682 (51.1%) are family households, while 5,443 (48.9%) are nonfamily households. The most numerous type of family households are 2-person households, comprising 2,609, and the most common type of nonfamily households are 1-person households, comprising 4,455.
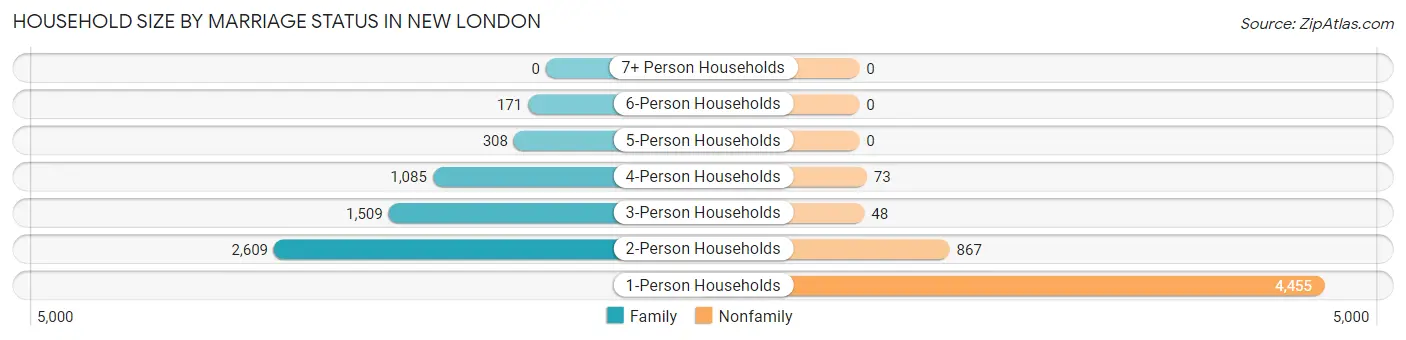
| Household Size | Family Households | Nonfamily Households |
| 1-Person Households | - | 4,455 (40.0%) |
| 2-Person Households | 2,609 (23.4%) | 867 (7.8%) |
| 3-Person Households | 1,509 (13.6%) | 48 (0.4%) |
| 4-Person Households | 1,085 (9.8%) | 73 (0.7%) |
| 5-Person Households | 308 (2.8%) | 0 (0.0%) |
| 6-Person Households | 171 (1.5%) | 0 (0.0%) |
| 7+ Person Households | 0 (0.0%) | 0 (0.0%) |
| Total | 5,682 (51.1%) | 5,443 (48.9%) |
Female Fertility in New London
Fertility by Age in New London
Average fertility rate in New London is 15.0 births per 1,000 women. Women in the age bracket of 35 to 50 years have the highest fertility rate with 19.0 births per 1,000 women. Women in the age bracket of 20 to 34 years acount for 50.0% of all women with births.
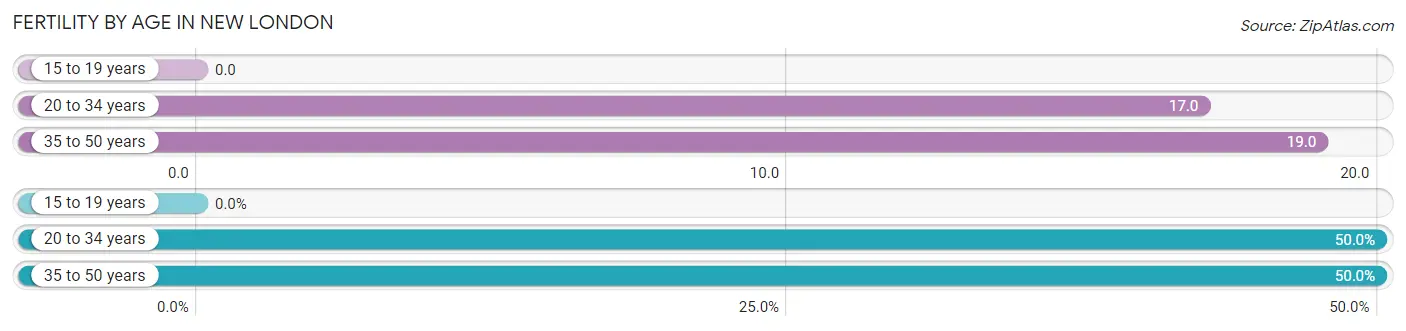
| Age Bracket | Women with Births | Births / 1,000 Women |
| 15 to 19 years | 0 (0.0%) | 0.0 |
| 20 to 34 years | 55 (50.0%) | 17.0 |
| 35 to 50 years | 55 (50.0%) | 19.0 |
| Total | 110 (100.0%) | 15.0 |
Fertility by Age by Marriage Status in New London
73.6% of women with births (110) in New London are married. The highest percentage of unmarried women with births falls into 20 to 34 years age bracket with 29.1% of them unmarried at the time of birth, while the lowest percentage of unmarried women with births belong to 35 to 50 years age bracket with 23.6% of them unmarried.
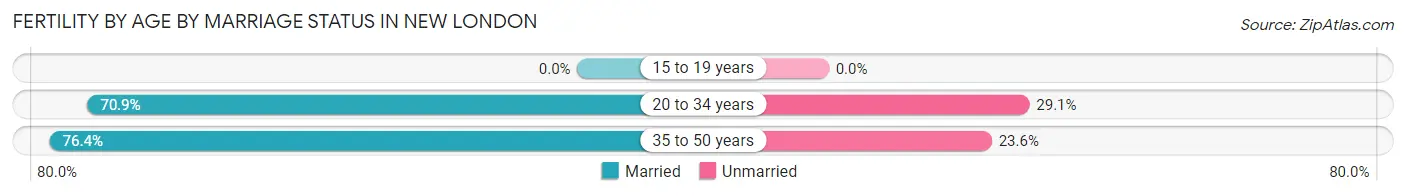
| Age Bracket | Married | Unmarried |
| 15 to 19 years | 0 (0.0%) | 0 (0.0%) |
| 20 to 34 years | 39 (70.9%) | 16 (29.1%) |
| 35 to 50 years | 42 (76.4%) | 13 (23.6%) |
| Total | 81 (73.6%) | 29 (26.4%) |
Fertility by Education in New London
Average fertility rate in New London is 15.0 births per 1,000 women. Women with the education attainment of bachelor's degree have the highest fertility rate of 38.0 births per 1,000 women, while women with the education attainment of college or associate's degree have the lowest fertility at 6.0 births per 1,000 women. Women with the education attainment of bachelor's degree represent 38.2% of all women with births.
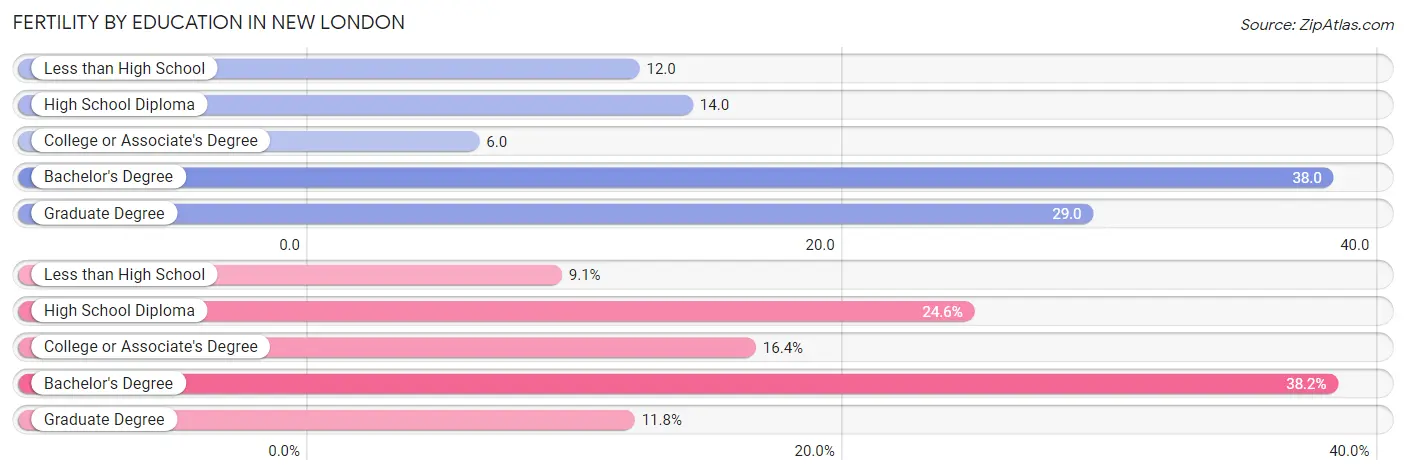
| Educational Attainment | Women with Births | Births / 1,000 Women |
| Less than High School | 10 (9.1%) | 12.0 |
| High School Diploma | 27 (24.5%) | 14.0 |
| College or Associate's Degree | 18 (16.4%) | 6.0 |
| Bachelor's Degree | 42 (38.2%) | 38.0 |
| Graduate Degree | 13 (11.8%) | 29.0 |
| Total | 110 (100.0%) | 15.0 |
Fertility by Education by Marriage Status in New London
26.4% of women with births in New London are unmarried. Women with the educational attainment of less than high school are most likely to be married with 100.0% of them married at childbirth, while women with the educational attainment of high school diploma are least likely to be married with 59.3% of them unmarried at childbirth.
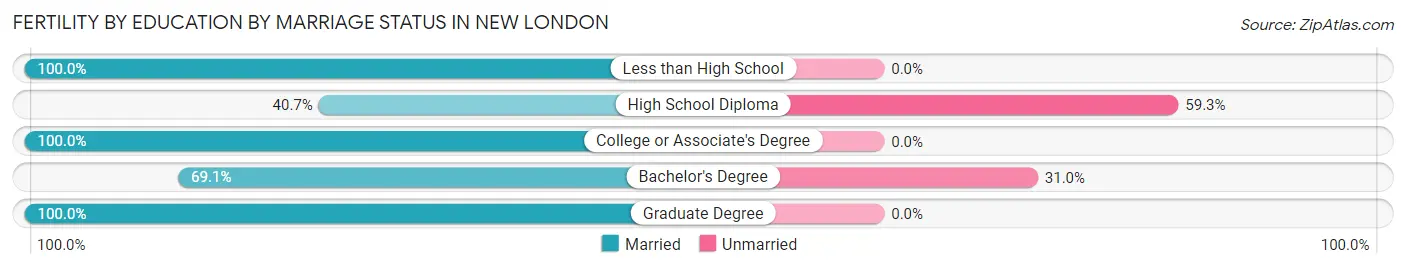
| Educational Attainment | Married | Unmarried |
| Less than High School | 10 (100.0%) | 0 (0.0%) |
| High School Diploma | 11 (40.7%) | 16 (59.3%) |
| College or Associate's Degree | 18 (100.0%) | 0 (0.0%) |
| Bachelor's Degree | 29 (69.1%) | 13 (30.9%) |
| Graduate Degree | 13 (100.0%) | 0 (0.0%) |
| Total | 81 (73.6%) | 29 (26.4%) |
Employment Characteristics in New London
Employment by Class of Employer in New London
Among the 13,482 employed individuals in New London, private company employees (8,383 | 62.2%), not-for-profit organizations (1,845 | 13.7%), and federal government employees (1,501 | 11.1%) make up the most common classes of employment.
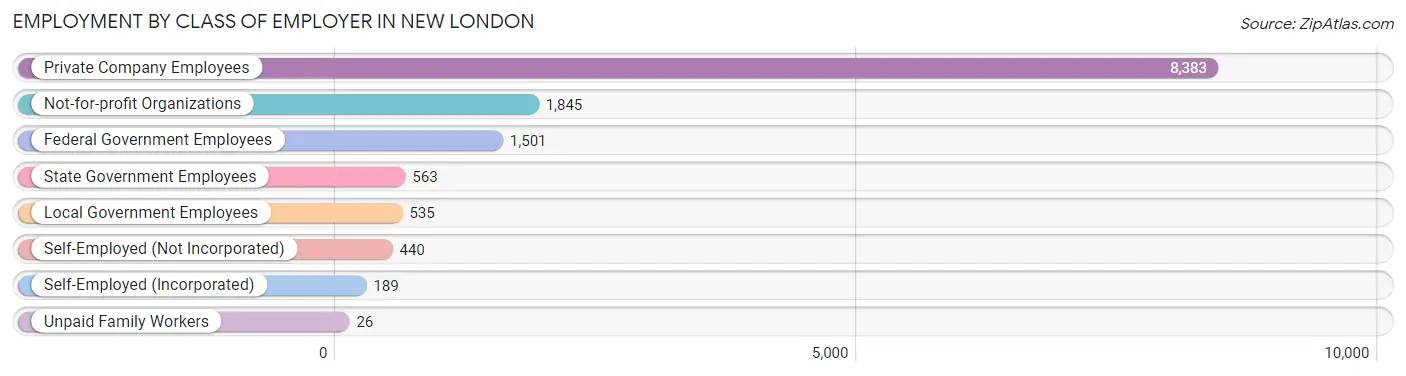
| Employer Class | # Employees | % Employees |
| Private Company Employees | 8,383 | 62.2% |
| Self-Employed (Incorporated) | 189 | 1.4% |
| Self-Employed (Not Incorporated) | 440 | 3.3% |
| Not-for-profit Organizations | 1,845 | 13.7% |
| Local Government Employees | 535 | 4.0% |
| State Government Employees | 563 | 4.2% |
| Federal Government Employees | 1,501 | 11.1% |
| Unpaid Family Workers | 26 | 0.2% |
| Total | 13,482 | 100.0% |
Employment Status by Age in New London
According to the labor force statistics for New London, out of the total population over 16 years of age (23,308), 64.4% or 15,010 individuals are in the labor force, with 7.1% or 1,066 of them unemployed. The age group with the highest labor force participation rate is 25 to 29 years, with 90.3% or 1,897 individuals in the labor force. Within the labor force, the 16 to 19 years age range has the highest percentage of unemployed individuals, with 20.3% or 225 of them being unemployed.
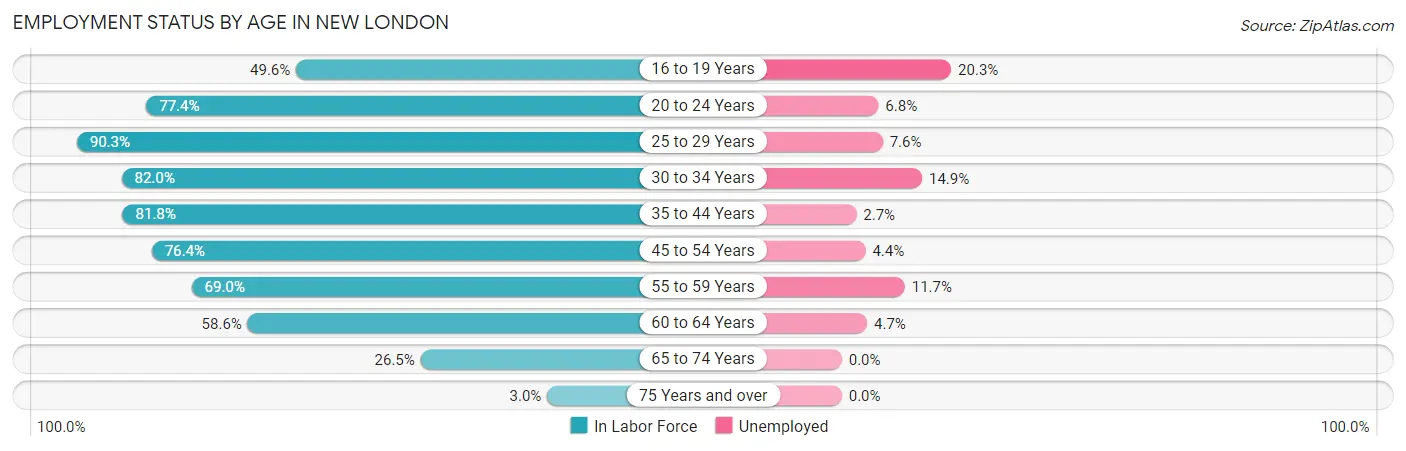
| Age Bracket | In Labor Force | Unemployed |
| 16 to 19 Years | 1,106 (49.6%) | 225 (20.3%) |
| 20 to 24 Years | 2,620 (77.4%) | 178 (6.8%) |
| 25 to 29 Years | 1,897 (90.3%) | 144 (7.6%) |
| 30 to 34 Years | 1,214 (82.0%) | 181 (14.9%) |
| 35 to 44 Years | 3,121 (81.8%) | 84 (2.7%) |
| 45 to 54 Years | 2,070 (76.4%) | 91 (4.4%) |
| 55 to 59 Years | 1,273 (69.0%) | 149 (11.7%) |
| 60 to 64 Years | 984 (58.6%) | 46 (4.7%) |
| 65 to 74 Years | 671 (26.5%) | 0 (0.0%) |
| 75 Years and over | 46 (3.0%) | 0 (0.0%) |
| Total | 15,010 (64.4%) | 1,066 (7.1%) |
Employment Status by Educational Attainment in New London
According to labor force statistics for New London, 77.5% of individuals (10,564) out of the total population between 25 and 64 years of age (13,631) are in the labor force, with 6.6% or 697 of them being unemployed. The group with the highest labor force participation rate are those with the educational attainment of bachelor's degree or higher, with 83.1% or 2,883 individuals in the labor force. Within the labor force, individuals with high school diploma education have the highest percentage of unemployment, with 10.4% or 350 of them being unemployed.
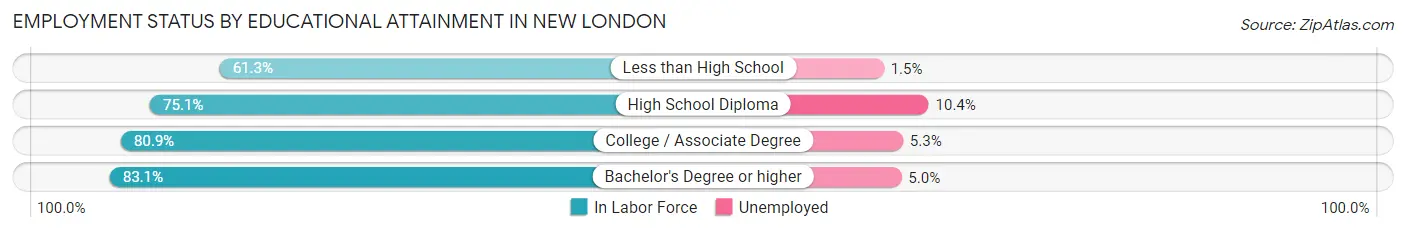
| Educational Attainment | In Labor Force | Unemployed |
| Less than High School | 891 (61.3%) | 22 (1.5%) |
| High School Diploma | 3,364 (75.1%) | 466 (10.4%) |
| College / Associate Degree | 3,421 (80.9%) | 224 (5.3%) |
| Bachelor's Degree or higher | 2,883 (83.1%) | 173 (5.0%) |
| Total | 10,564 (77.5%) | 900 (6.6%) |
Employment Occupations by Sex in New London
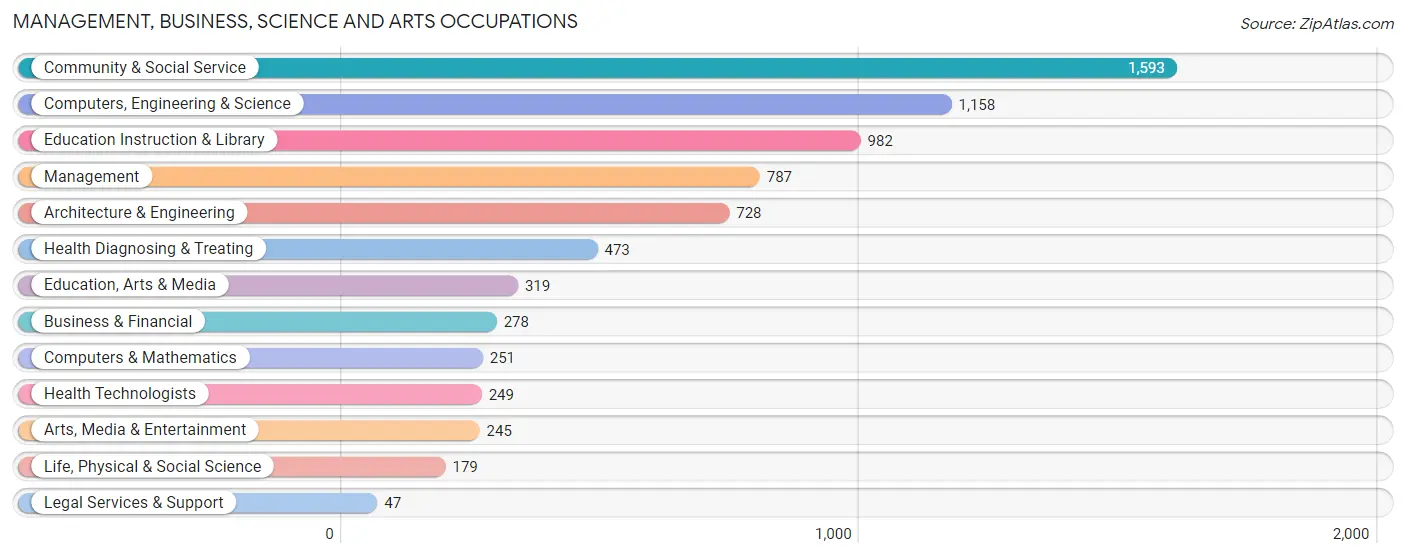
Management, Business, Science and Arts Occupations
The most common Management, Business, Science and Arts occupations in New London are Community & Social Service (1,593 | 12.3%), Computers, Engineering & Science (1,158 | 9.0%), Education Instruction & Library (982 | 7.6%), Management (787 | 6.1%), and Architecture & Engineering (728 | 5.6%).
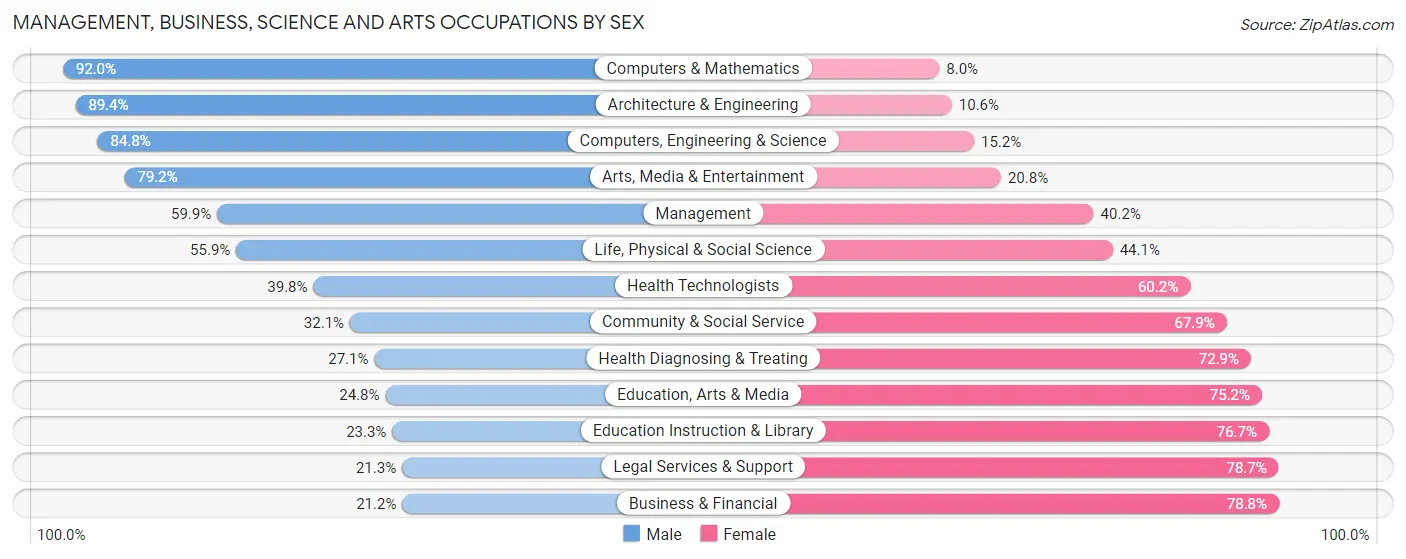
Management, Business, Science and Arts Occupations by Sex
Within the Management, Business, Science and Arts occupations in New London, the most male-oriented occupations are Computers & Mathematics (92.0%), Architecture & Engineering (89.4%), and Computers, Engineering & Science (84.8%), while the most female-oriented occupations are Business & Financial (78.8%), Legal Services & Support (78.7%), and Education Instruction & Library (76.7%).
| Occupation | Male | Female |
| Management | 471 (59.9%) | 316 (40.2%) |
| Business & Financial | 59 (21.2%) | 219 (78.8%) |
| Computers, Engineering & Science | 982 (84.8%) | 176 (15.2%) |
| Computers & Mathematics | 231 (92.0%) | 20 (8.0%) |
| Architecture & Engineering | 651 (89.4%) | 77 (10.6%) |
| Life, Physical & Social Science | 100 (55.9%) | 79 (44.1%) |
| Community & Social Service | 512 (32.1%) | 1,081 (67.9%) |
| Education, Arts & Media | 79 (24.8%) | 240 (75.2%) |
| Legal Services & Support | 10 (21.3%) | 37 (78.7%) |
| Education Instruction & Library | 229 (23.3%) | 753 (76.7%) |
| Arts, Media & Entertainment | 194 (79.2%) | 51 (20.8%) |
| Health Diagnosing & Treating | 128 (27.1%) | 345 (72.9%) |
| Health Technologists | 99 (39.8%) | 150 (60.2%) |
| Total (Category) | 2,152 (50.2%) | 2,137 (49.8%) |
| Total (Overall) | 6,270 (48.5%) | 6,657 (51.5%) |
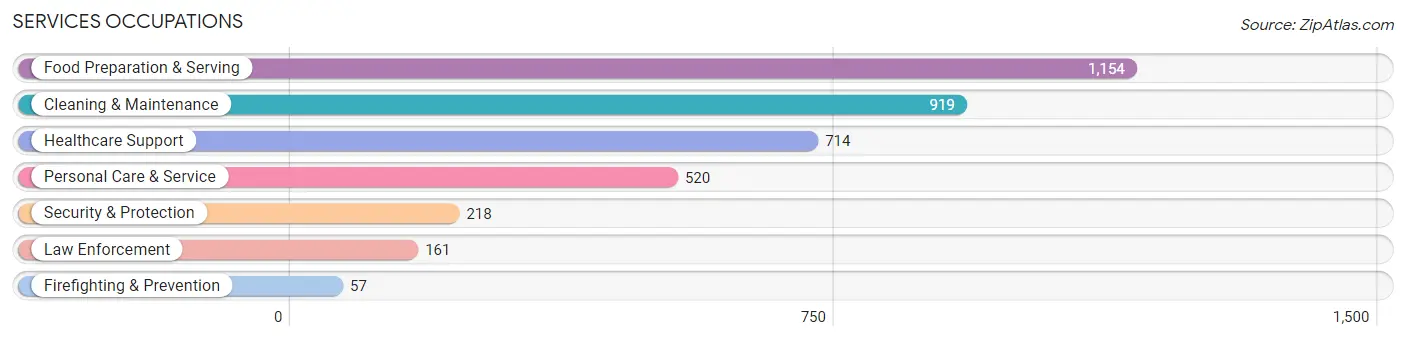
Services Occupations
The most common Services occupations in New London are Food Preparation & Serving (1,154 | 8.9%), Cleaning & Maintenance (919 | 7.1%), Healthcare Support (714 | 5.5%), Personal Care & Service (520 | 4.0%), and Security & Protection (218 | 1.7%).
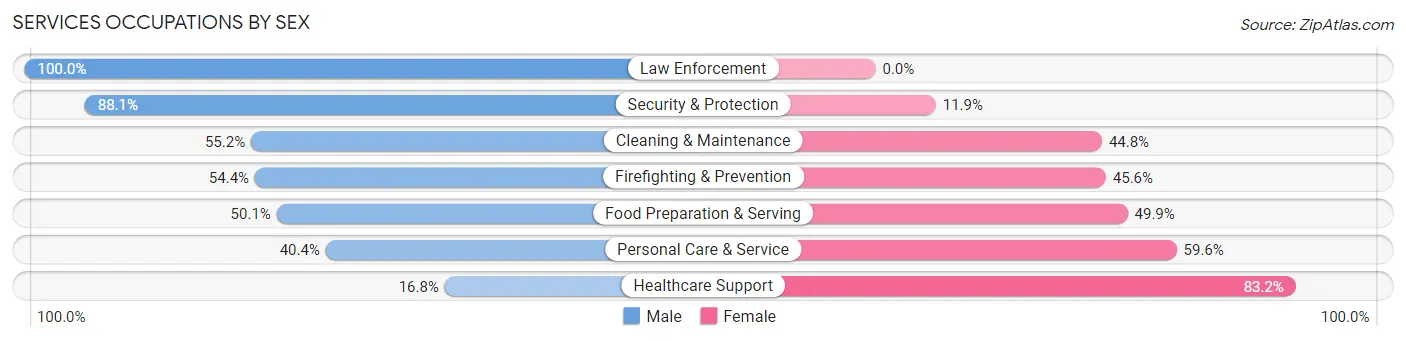
Services Occupations by Sex
Within the Services occupations in New London, the most male-oriented occupations are Law Enforcement (100.0%), Security & Protection (88.1%), and Cleaning & Maintenance (55.2%), while the most female-oriented occupations are Healthcare Support (83.2%), Personal Care & Service (59.6%), and Food Preparation & Serving (49.9%).
| Occupation | Male | Female |
| Healthcare Support | 120 (16.8%) | 594 (83.2%) |
| Security & Protection | 192 (88.1%) | 26 (11.9%) |
| Firefighting & Prevention | 31 (54.4%) | 26 (45.6%) |
| Law Enforcement | 161 (100.0%) | 0 (0.0%) |
| Food Preparation & Serving | 578 (50.1%) | 576 (49.9%) |
| Cleaning & Maintenance | 507 (55.2%) | 412 (44.8%) |
| Personal Care & Service | 210 (40.4%) | 310 (59.6%) |
| Total (Category) | 1,607 (45.6%) | 1,918 (54.4%) |
| Total (Overall) | 6,270 (48.5%) | 6,657 (51.5%) |
Sales and Office Occupations
The most common Sales and Office occupations in New London are Sales & Related (1,365 | 10.6%), and Office & Administration (1,206 | 9.3%).

Sales and Office Occupations by Sex
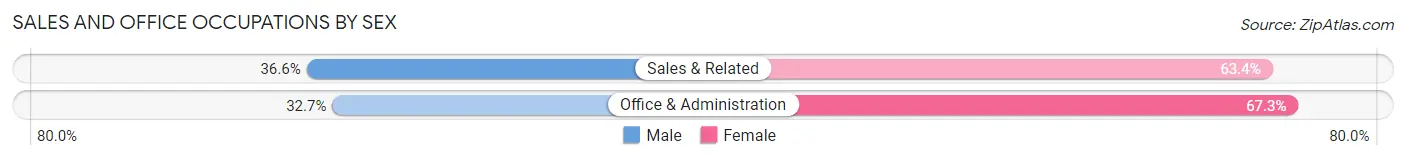
| Occupation | Male | Female |
| Sales & Related | 500 (36.6%) | 865 (63.4%) |
| Office & Administration | 394 (32.7%) | 812 (67.3%) |
| Total (Category) | 894 (34.8%) | 1,677 (65.2%) |
| Total (Overall) | 6,270 (48.5%) | 6,657 (51.5%) |
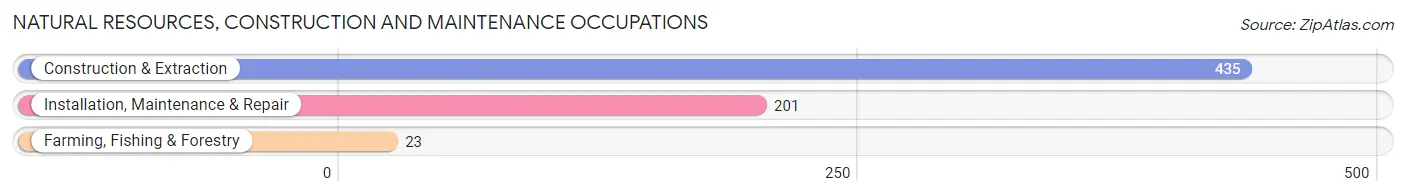
Natural Resources, Construction and Maintenance Occupations
The most common Natural Resources, Construction and Maintenance occupations in New London are Construction & Extraction (435 | 3.4%), Installation, Maintenance & Repair (201 | 1.5%), and Farming, Fishing & Forestry (23 | 0.2%).
Natural Resources, Construction and Maintenance Occupations by Sex
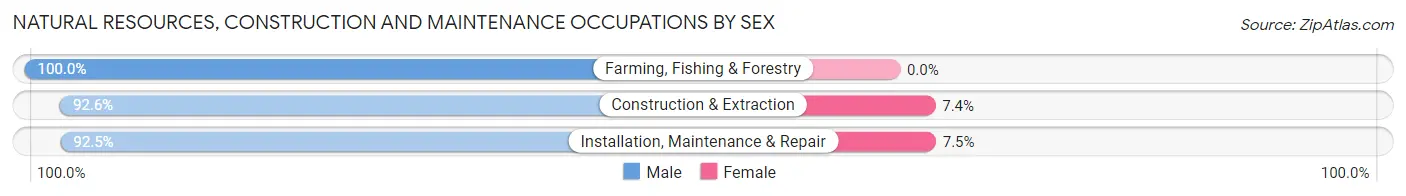
| Occupation | Male | Female |
| Farming, Fishing & Forestry | 23 (100.0%) | 0 (0.0%) |
| Construction & Extraction | 403 (92.6%) | 32 (7.4%) |
| Installation, Maintenance & Repair | 186 (92.5%) | 15 (7.5%) |
| Total (Category) | 612 (92.9%) | 47 (7.1%) |
| Total (Overall) | 6,270 (48.5%) | 6,657 (51.5%) |
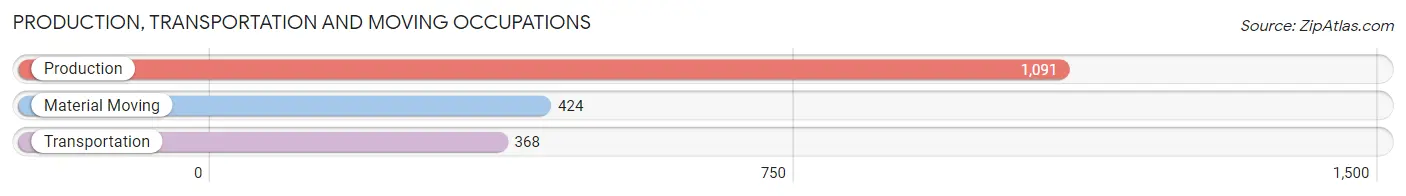
Production, Transportation and Moving Occupations
The most common Production, Transportation and Moving occupations in New London are Production (1,091 | 8.4%), Material Moving (424 | 3.3%), and Transportation (368 | 2.9%).
Production, Transportation and Moving Occupations by Sex
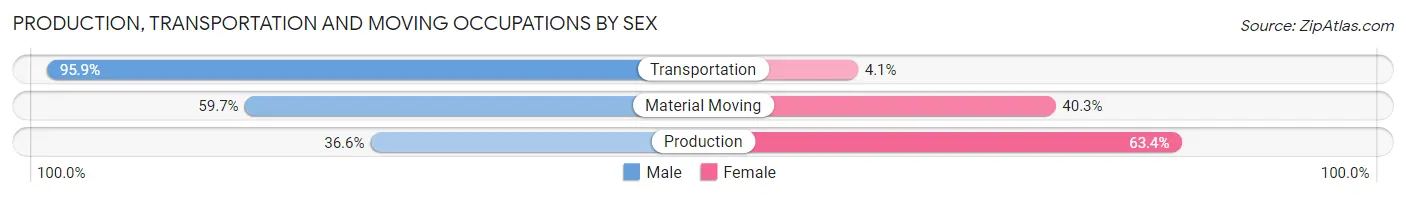
| Occupation | Male | Female |
| Production | 399 (36.6%) | 692 (63.4%) |
| Transportation | 353 (95.9%) | 15 (4.1%) |
| Material Moving | 253 (59.7%) | 171 (40.3%) |
| Total (Category) | 1,005 (53.4%) | 878 (46.6%) |
| Total (Overall) | 6,270 (48.5%) | 6,657 (51.5%) |
Employment Industries by Sex in New London
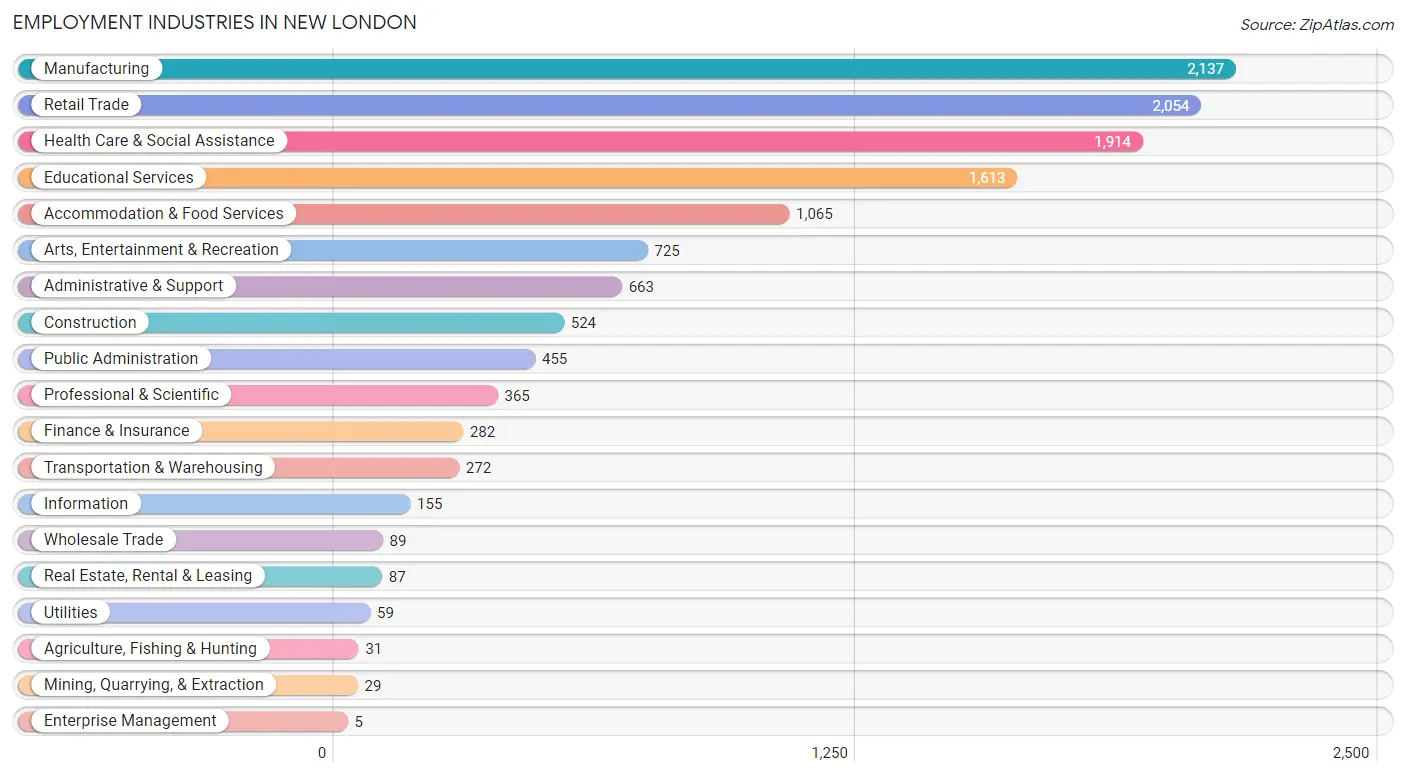
Employment Industries in New London
The major employment industries in New London include Manufacturing (2,137 | 16.5%), Retail Trade (2,054 | 15.9%), Health Care & Social Assistance (1,914 | 14.8%), Educational Services (1,613 | 12.5%), and Accommodation & Food Services (1,065 | 8.2%).
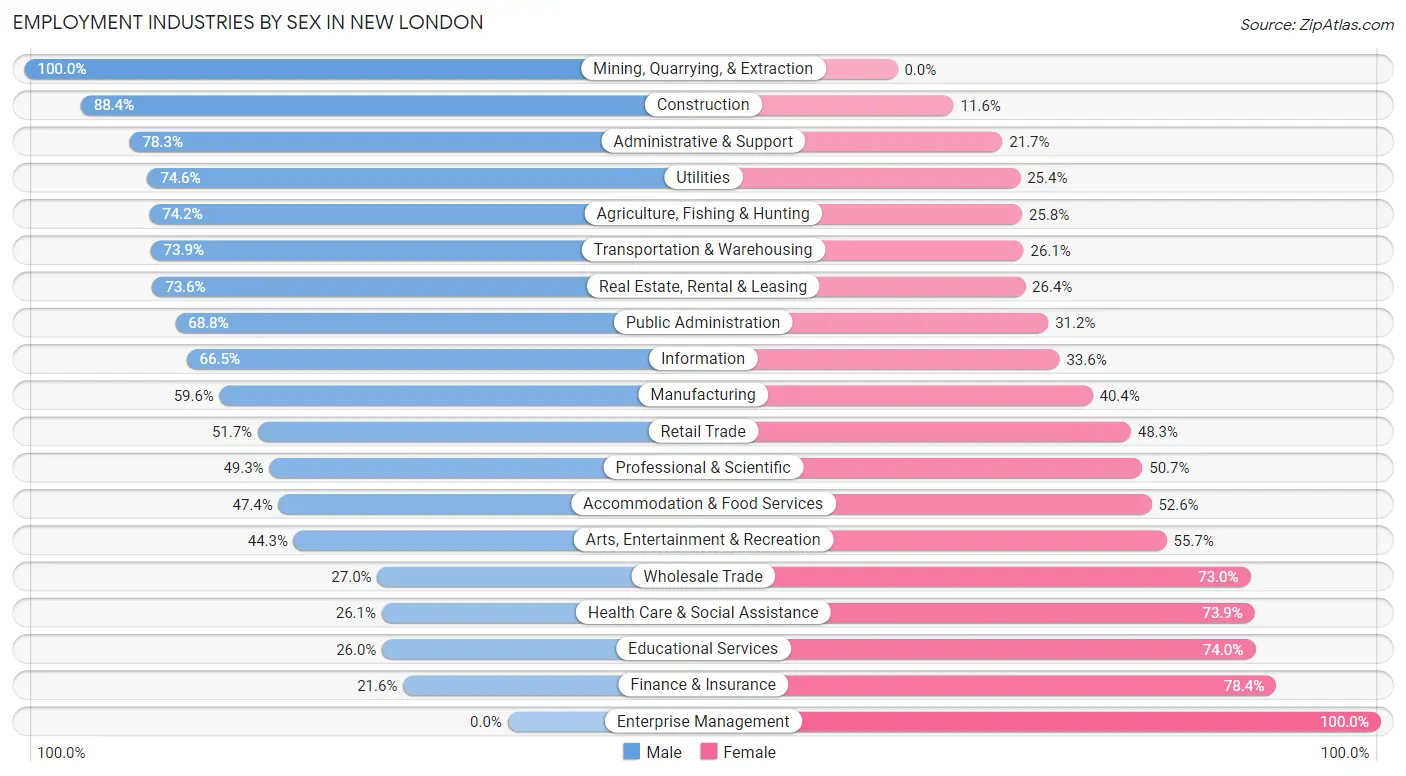
Employment Industries by Sex in New London
The New London industries that see more men than women are Mining, Quarrying, & Extraction (100.0%), Construction (88.4%), and Administrative & Support (78.3%), whereas the industries that tend to have a higher number of women are Enterprise Management (100.0%), Finance & Insurance (78.4%), and Educational Services (74.0%).
| Industry | Male | Female |
| Agriculture, Fishing & Hunting | 23 (74.2%) | 8 (25.8%) |
| Mining, Quarrying, & Extraction | 29 (100.0%) | 0 (0.0%) |
| Construction | 463 (88.4%) | 61 (11.6%) |
| Manufacturing | 1,274 (59.6%) | 863 (40.4%) |
| Wholesale Trade | 24 (27.0%) | 65 (73.0%) |
| Retail Trade | 1,062 (51.7%) | 992 (48.3%) |
| Transportation & Warehousing | 201 (73.9%) | 71 (26.1%) |
| Utilities | 44 (74.6%) | 15 (25.4%) |
| Information | 103 (66.4%) | 52 (33.6%) |
| Finance & Insurance | 61 (21.6%) | 221 (78.4%) |
| Real Estate, Rental & Leasing | 64 (73.6%) | 23 (26.4%) |
| Professional & Scientific | 180 (49.3%) | 185 (50.7%) |
| Enterprise Management | 0 (0.0%) | 5 (100.0%) |
| Administrative & Support | 519 (78.3%) | 144 (21.7%) |
| Educational Services | 419 (26.0%) | 1,194 (74.0%) |
| Health Care & Social Assistance | 499 (26.1%) | 1,415 (73.9%) |
| Arts, Entertainment & Recreation | 321 (44.3%) | 404 (55.7%) |
| Accommodation & Food Services | 505 (47.4%) | 560 (52.6%) |
| Public Administration | 313 (68.8%) | 142 (31.2%) |
| Total | 6,270 (48.5%) | 6,657 (51.5%) |
Education in New London
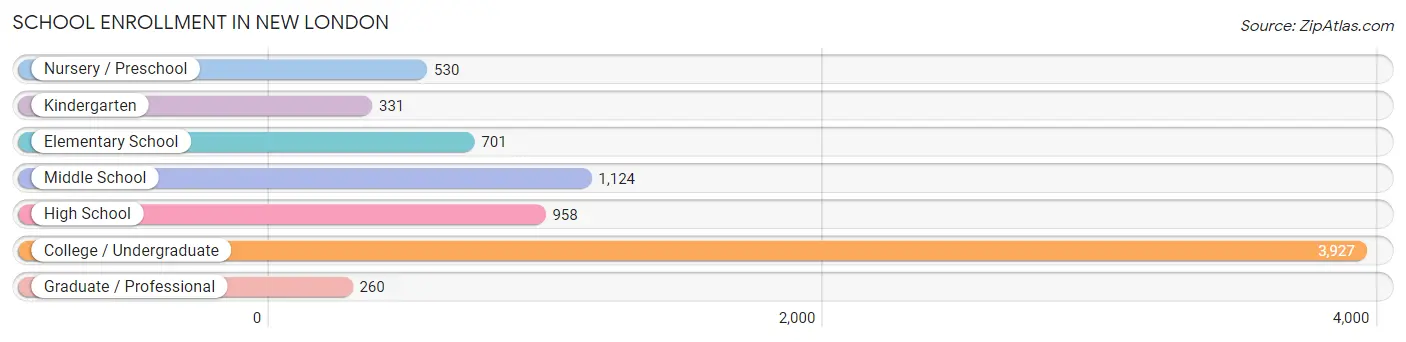
School Enrollment in New London
The most common levels of schooling among the 7,831 students in New London are college / undergraduate (3,927 | 50.1%), middle school (1,124 | 14.3%), and high school (958 | 12.2%).
| School Level | # Students | % Students |
| Nursery / Preschool | 530 | 6.8% |
| Kindergarten | 331 | 4.2% |
| Elementary School | 701 | 8.9% |
| Middle School | 1,124 | 14.3% |
| High School | 958 | 12.2% |
| College / Undergraduate | 3,927 | 50.1% |
| Graduate / Professional | 260 | 3.3% |
| Total | 7,831 | 100.0% |
School Enrollment by Age by Funding Source in New London
Out of a total of 7,831 students who are enrolled in schools in New London, 2,435 (31.1%) attend a private institution, while the remaining 5,396 (68.9%) are enrolled in public schools. The age group of 20 to 24 year olds has the highest likelihood of being enrolled in private schools, with 1,196 (55.5% in the age bracket) enrolled. Conversely, the age group of 15 to 17 year olds has the lowest likelihood of being enrolled in a private school, with 512 (94.5% in the age bracket) attending a public institution.
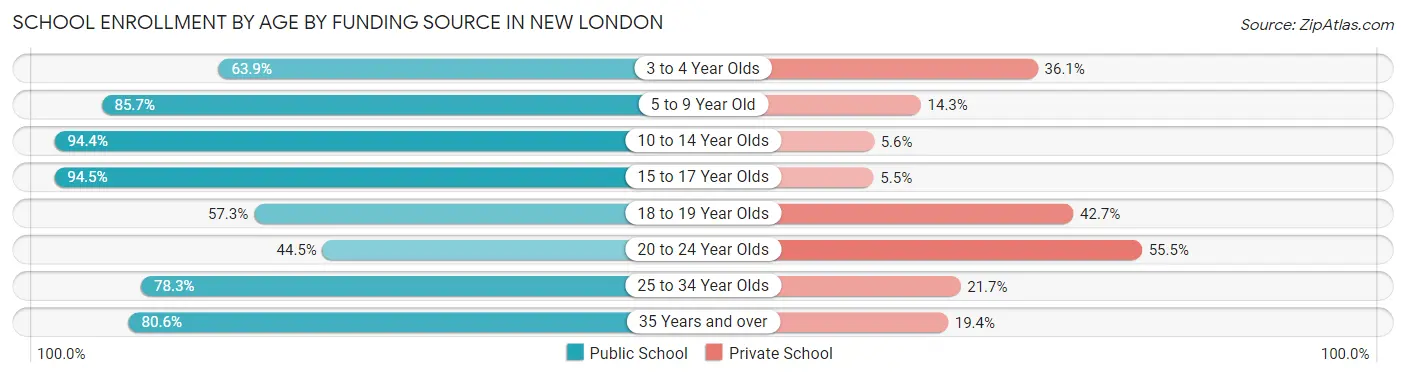
| Age Bracket | Public School | Private School |
| 3 to 4 Year Olds | 306 (63.9%) | 173 (36.1%) |
| 5 to 9 Year Old | 855 (85.7%) | 143 (14.3%) |
| 10 to 14 Year Olds | 1,383 (94.4%) | 82 (5.6%) |
| 15 to 17 Year Olds | 512 (94.5%) | 30 (5.5%) |
| 18 to 19 Year Olds | 927 (57.3%) | 692 (42.7%) |
| 20 to 24 Year Olds | 958 (44.5%) | 1,196 (55.5%) |
| 25 to 34 Year Olds | 191 (78.3%) | 53 (21.7%) |
| 35 Years and over | 266 (80.6%) | 64 (19.4%) |
| Total | 5,396 (68.9%) | 2,435 (31.1%) |
Educational Attainment by Field of Study in New London
Business (720 | 13.9%), engineering (550 | 10.6%), education (481 | 9.3%), literature & languages (464 | 8.9%), and visual & performing arts (408 | 7.9%) are the most common fields of study among 5,191 individuals in New London who have obtained a bachelor's degree or higher.
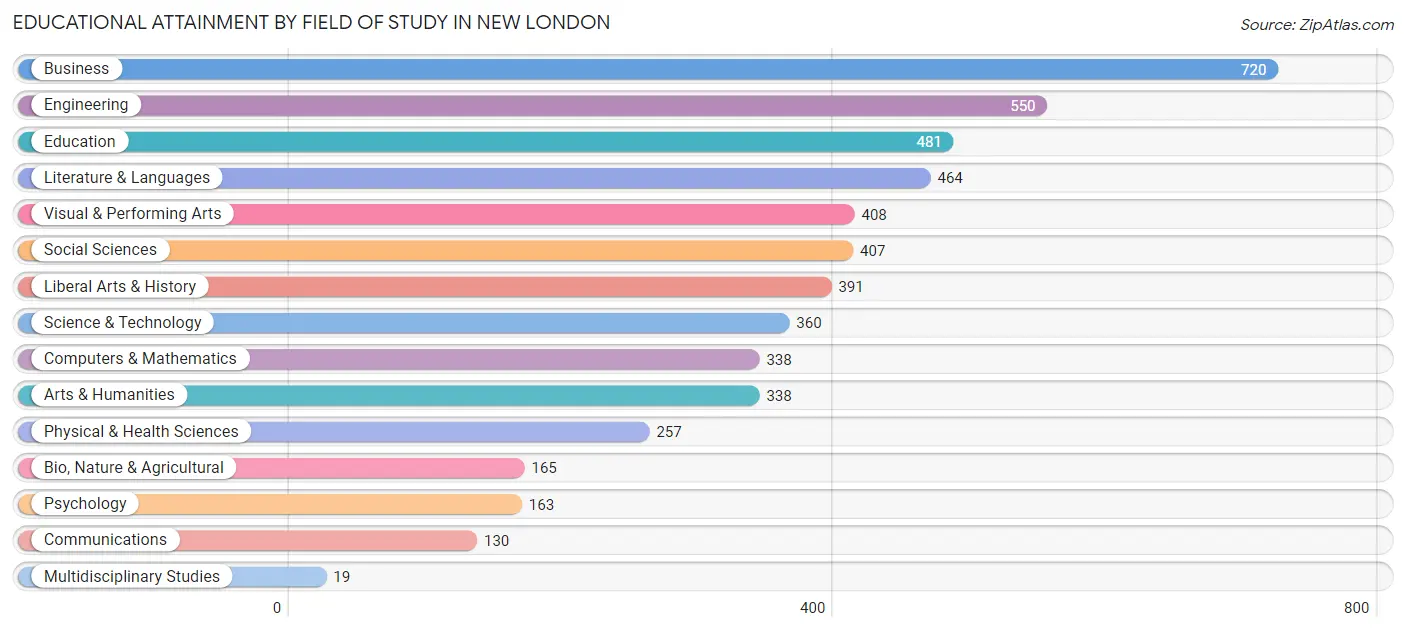
| Field of Study | # Graduates | % Graduates |
| Computers & Mathematics | 338 | 6.5% |
| Bio, Nature & Agricultural | 165 | 3.2% |
| Physical & Health Sciences | 257 | 5.0% |
| Psychology | 163 | 3.1% |
| Social Sciences | 407 | 7.8% |
| Engineering | 550 | 10.6% |
| Multidisciplinary Studies | 19 | 0.4% |
| Science & Technology | 360 | 6.9% |
| Business | 720 | 13.9% |
| Education | 481 | 9.3% |
| Literature & Languages | 464 | 8.9% |
| Liberal Arts & History | 391 | 7.5% |
| Visual & Performing Arts | 408 | 7.9% |
| Communications | 130 | 2.5% |
| Arts & Humanities | 338 | 6.5% |
| Total | 5,191 | 100.0% |
Transportation & Commute in New London
Vehicle Availability by Sex in New London
The most prevalent vehicle ownership categories in New London are males with 2 vehicles (2,229, accounting for 37.1%) and females with 2 vehicles (1,678, making up 40.1%).
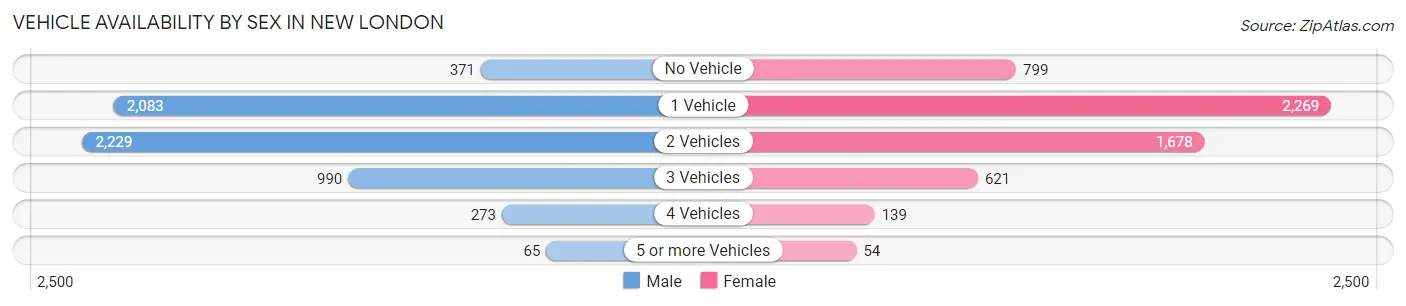
| Vehicles Available | Male | Female |
| No Vehicle | 371 (6.2%) | 799 (14.4%) |
| 1 Vehicle | 2,083 (34.6%) | 2,269 (40.8%) |
| 2 Vehicles | 2,229 (37.1%) | 1,678 (30.2%) |
| 3 Vehicles | 990 (16.5%) | 621 (11.2%) |
| 4 Vehicles | 273 (4.5%) | 139 (2.5%) |
| 5 or more Vehicles | 65 (1.1%) | 54 (1.0%) |
| Total | 6,011 (100.0%) | 5,560 (100.0%) |
Commute Time in New London
The most frequently occuring commute durations in New London are 15 to 19 minutes (2,686 commuters, 22.7%), 10 to 14 minutes (2,313 commuters, 19.5%), and 5 to 9 minutes (2,235 commuters, 18.8%).
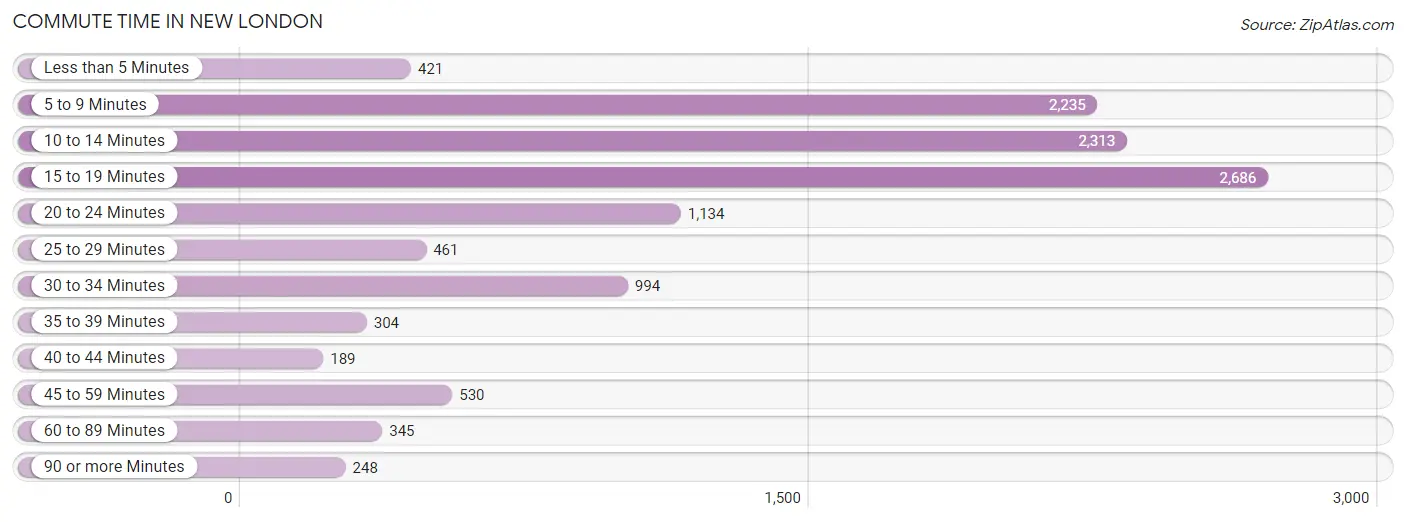
| Commute Time | # Commuters | % Commuters |
| Less than 5 Minutes | 421 | 3.5% |
| 5 to 9 Minutes | 2,235 | 18.8% |
| 10 to 14 Minutes | 2,313 | 19.5% |
| 15 to 19 Minutes | 2,686 | 22.7% |
| 20 to 24 Minutes | 1,134 | 9.6% |
| 25 to 29 Minutes | 461 | 3.9% |
| 30 to 34 Minutes | 994 | 8.4% |
| 35 to 39 Minutes | 304 | 2.6% |
| 40 to 44 Minutes | 189 | 1.6% |
| 45 to 59 Minutes | 530 | 4.5% |
| 60 to 89 Minutes | 345 | 2.9% |
| 90 or more Minutes | 248 | 2.1% |
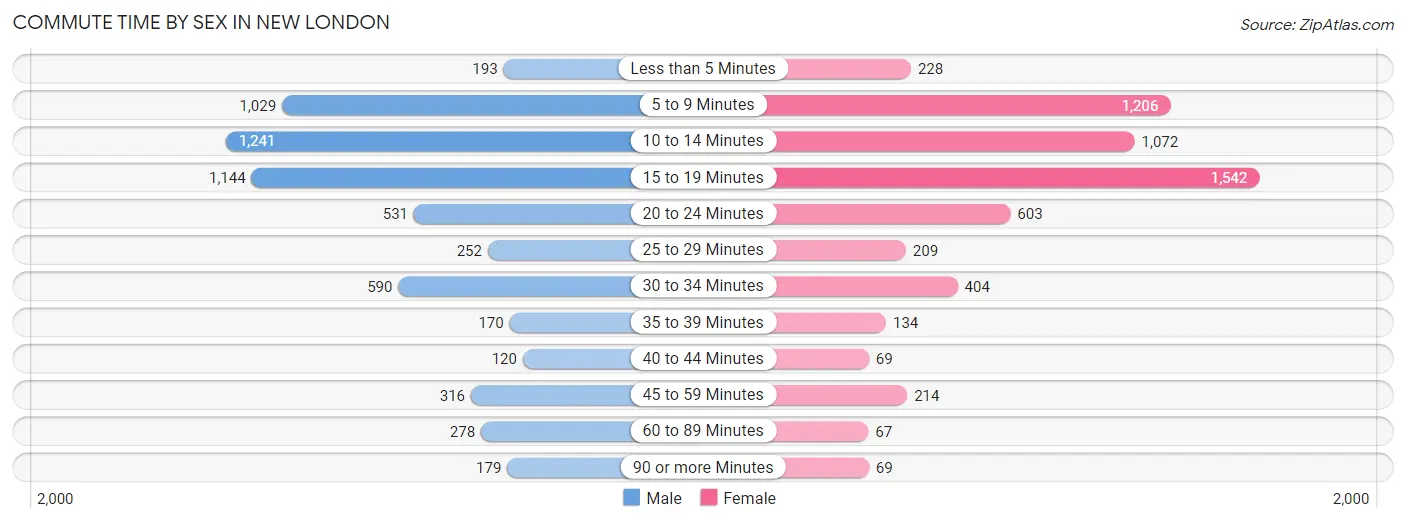
Commute Time by Sex in New London
The most common commute times in New London are 10 to 14 minutes (1,241 commuters, 20.5%) for males and 15 to 19 minutes (1,542 commuters, 26.5%) for females.
| Commute Time | Male | Female |
| Less than 5 Minutes | 193 (3.2%) | 228 (3.9%) |
| 5 to 9 Minutes | 1,029 (17.0%) | 1,206 (20.7%) |
| 10 to 14 Minutes | 1,241 (20.5%) | 1,072 (18.4%) |
| 15 to 19 Minutes | 1,144 (18.9%) | 1,542 (26.5%) |
| 20 to 24 Minutes | 531 (8.8%) | 603 (10.4%) |
| 25 to 29 Minutes | 252 (4.2%) | 209 (3.6%) |
| 30 to 34 Minutes | 590 (9.8%) | 404 (7.0%) |
| 35 to 39 Minutes | 170 (2.8%) | 134 (2.3%) |
| 40 to 44 Minutes | 120 (2.0%) | 69 (1.2%) |
| 45 to 59 Minutes | 316 (5.2%) | 214 (3.7%) |
| 60 to 89 Minutes | 278 (4.6%) | 67 (1.1%) |
| 90 or more Minutes | 179 (3.0%) | 69 (1.2%) |
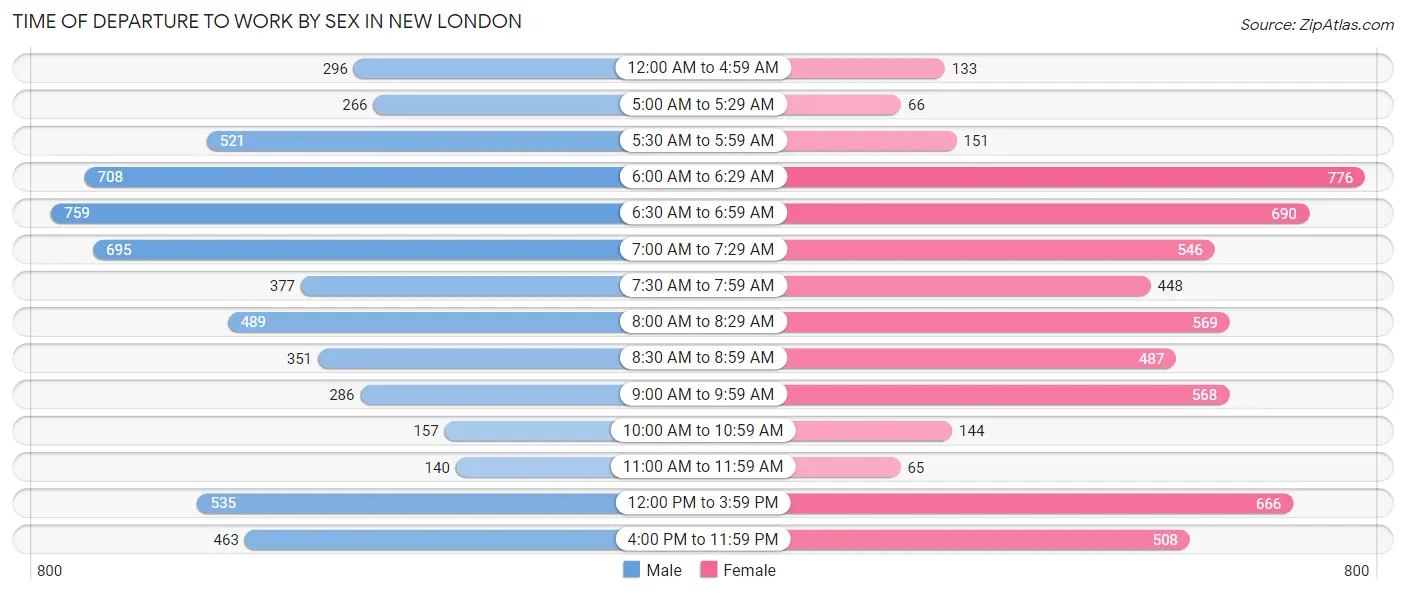
Time of Departure to Work by Sex in New London
The most frequent times of departure to work in New London are 6:30 AM to 6:59 AM (759, 12.6%) for males and 6:00 AM to 6:29 AM (776, 13.3%) for females.
| Time of Departure | Male | Female |
| 12:00 AM to 4:59 AM | 296 (4.9%) | 133 (2.3%) |
| 5:00 AM to 5:29 AM | 266 (4.4%) | 66 (1.1%) |
| 5:30 AM to 5:59 AM | 521 (8.6%) | 151 (2.6%) |
| 6:00 AM to 6:29 AM | 708 (11.7%) | 776 (13.3%) |
| 6:30 AM to 6:59 AM | 759 (12.6%) | 690 (11.9%) |
| 7:00 AM to 7:29 AM | 695 (11.5%) | 546 (9.4%) |
| 7:30 AM to 7:59 AM | 377 (6.2%) | 448 (7.7%) |
| 8:00 AM to 8:29 AM | 489 (8.1%) | 569 (9.8%) |
| 8:30 AM to 8:59 AM | 351 (5.8%) | 487 (8.4%) |
| 9:00 AM to 9:59 AM | 286 (4.7%) | 568 (9.8%) |
| 10:00 AM to 10:59 AM | 157 (2.6%) | 144 (2.5%) |
| 11:00 AM to 11:59 AM | 140 (2.3%) | 65 (1.1%) |
| 12:00 PM to 3:59 PM | 535 (8.8%) | 666 (11.5%) |
| 4:00 PM to 11:59 PM | 463 (7.7%) | 508 (8.7%) |
| Total | 6,043 (100.0%) | 5,817 (100.0%) |
Housing Occupancy in New London
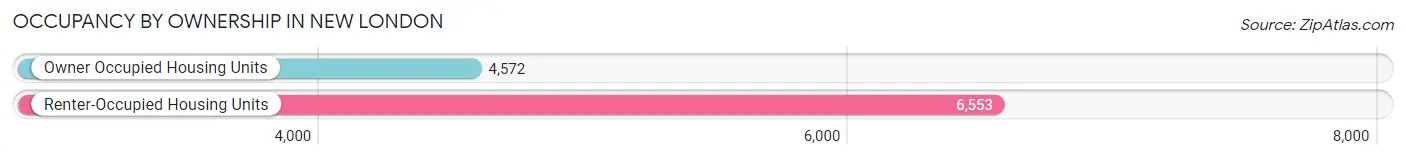
Occupancy by Ownership in New London
Of the total 11,125 dwellings in New London, owner-occupied units account for 4,572 (41.1%), while renter-occupied units make up 6,553 (58.9%).
| Occupancy | # Housing Units | % Housing Units |
| Owner Occupied Housing Units | 4,572 | 41.1% |
| Renter-Occupied Housing Units | 6,553 | 58.9% |
| Total Occupied Housing Units | 11,125 | 100.0% |
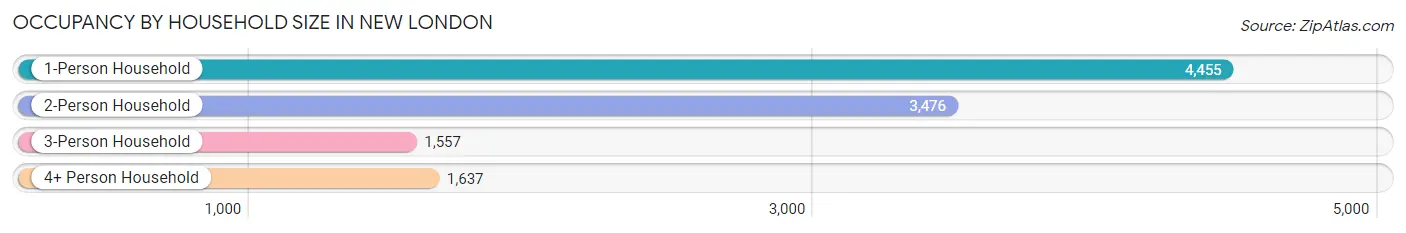
Occupancy by Household Size in New London
| Household Size | # Housing Units | % Housing Units |
| 1-Person Household | 4,455 | 40.0% |
| 2-Person Household | 3,476 | 31.2% |
| 3-Person Household | 1,557 | 14.0% |
| 4+ Person Household | 1,637 | 14.7% |
| Total Housing Units | 11,125 | 100.0% |
Occupancy by Ownership by Household Size in New London
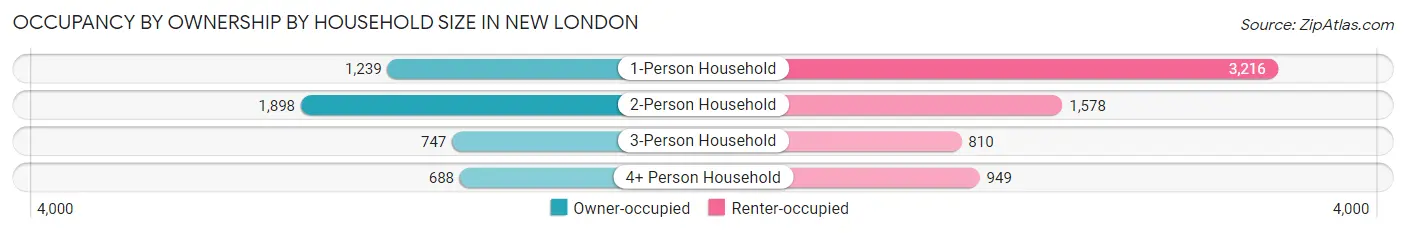
| Household Size | Owner-occupied | Renter-occupied |
| 1-Person Household | 1,239 (27.8%) | 3,216 (72.2%) |
| 2-Person Household | 1,898 (54.6%) | 1,578 (45.4%) |
| 3-Person Household | 747 (48.0%) | 810 (52.0%) |
| 4+ Person Household | 688 (42.0%) | 949 (58.0%) |
| Total Housing Units | 4,572 (41.1%) | 6,553 (58.9%) |
Occupancy by Educational Attainment in New London
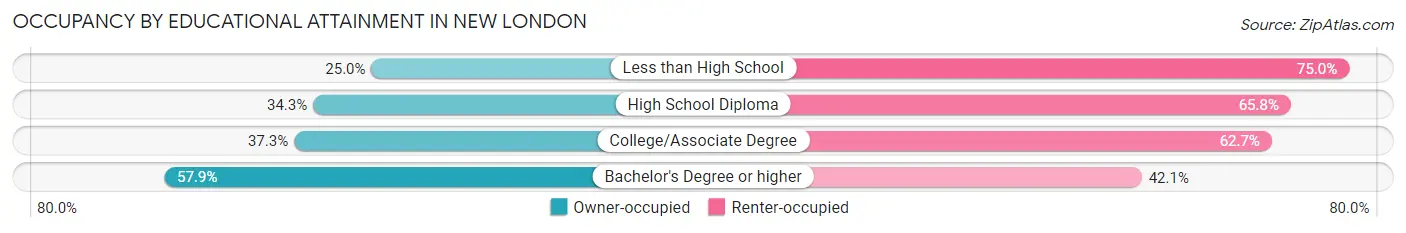
| Household Size | Owner-occupied | Renter-occupied |
| Less than High School | 346 (25.0%) | 1,038 (75.0%) |
| High School Diploma | 1,000 (34.3%) | 1,920 (65.7%) |
| College/Associate Degree | 1,306 (37.3%) | 2,198 (62.7%) |
| Bachelor's Degree or higher | 1,920 (57.9%) | 1,397 (42.1%) |
Occupancy by Age of Householder in New London
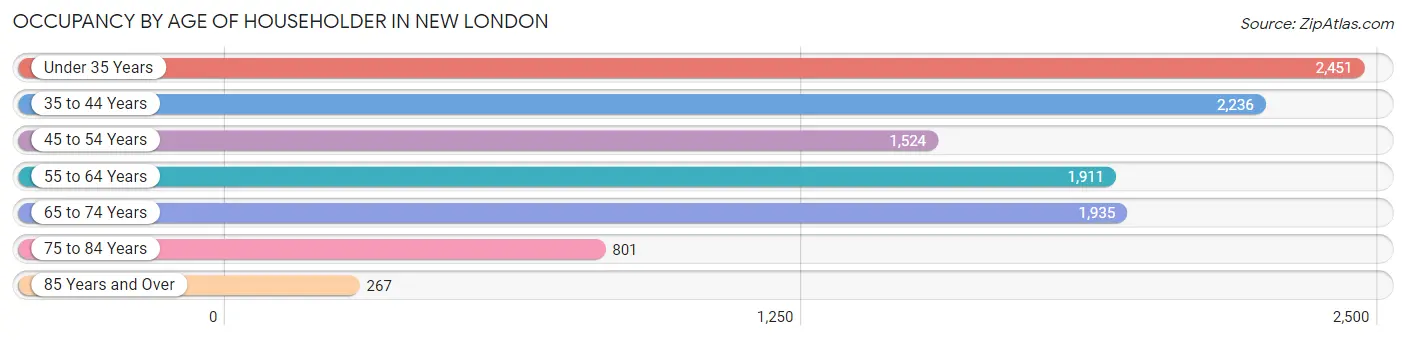
| Age Bracket | # Households | % Households |
| Under 35 Years | 2,451 | 22.0% |
| 35 to 44 Years | 2,236 | 20.1% |
| 45 to 54 Years | 1,524 | 13.7% |
| 55 to 64 Years | 1,911 | 17.2% |
| 65 to 74 Years | 1,935 | 17.4% |
| 75 to 84 Years | 801 | 7.2% |
| 85 Years and Over | 267 | 2.4% |
| Total | 11,125 | 100.0% |
Housing Finances in New London
Median Income by Occupancy in New London
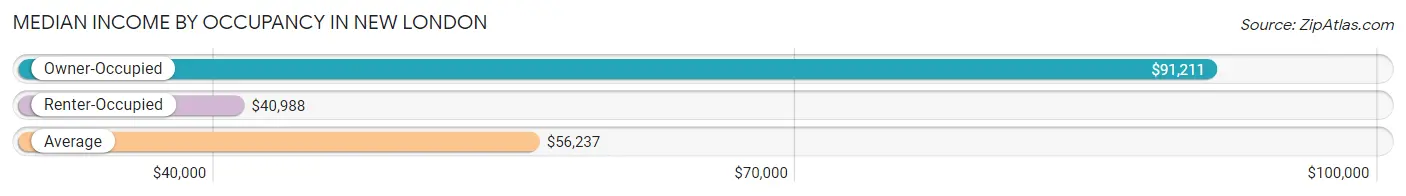
| Occupancy Type | # Households | Median Income |
| Owner-Occupied | 4,572 (41.1%) | $91,211 |
| Renter-Occupied | 6,553 (58.9%) | $40,988 |
| Average | 11,125 (100.0%) | $56,237 |
Occupancy by Householder Income Bracket in New London
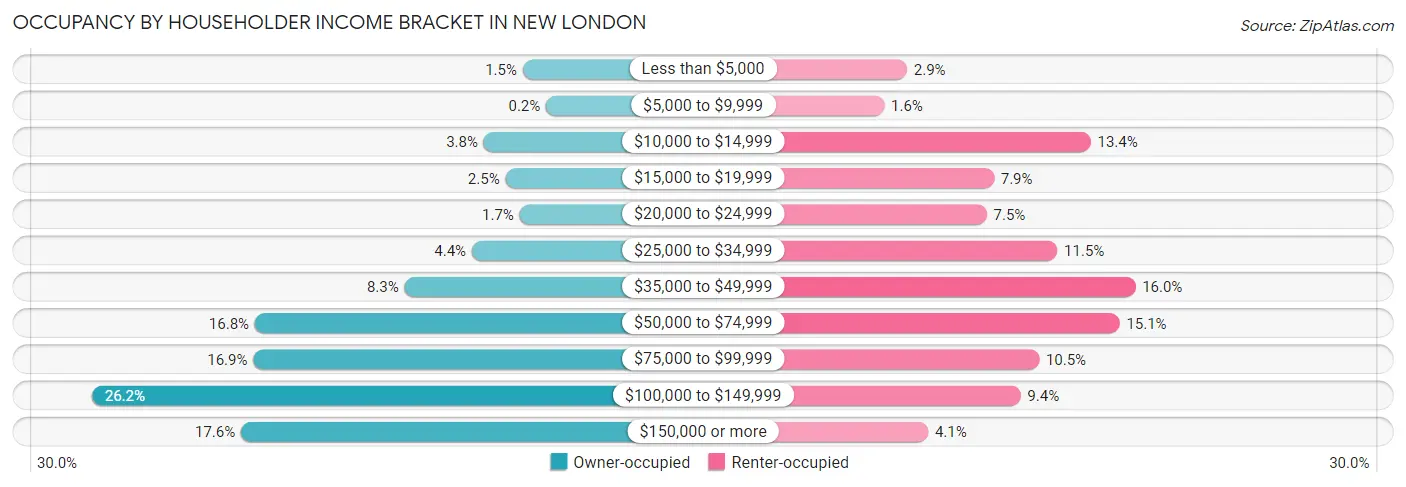
| Income Bracket | Owner-occupied | Renter-occupied |
| Less than $5,000 | 70 (1.5%) | 192 (2.9%) |
| $5,000 to $9,999 | 9 (0.2%) | 107 (1.6%) |
| $10,000 to $14,999 | 172 (3.8%) | 880 (13.4%) |
| $15,000 to $19,999 | 115 (2.5%) | 518 (7.9%) |
| $20,000 to $24,999 | 78 (1.7%) | 491 (7.5%) |
| $25,000 to $34,999 | 203 (4.4%) | 755 (11.5%) |
| $35,000 to $49,999 | 379 (8.3%) | 1,047 (16.0%) |
| $50,000 to $74,999 | 770 (16.8%) | 988 (15.1%) |
| $75,000 to $99,999 | 774 (16.9%) | 687 (10.5%) |
| $100,000 to $149,999 | 1,196 (26.2%) | 617 (9.4%) |
| $150,000 or more | 806 (17.6%) | 271 (4.1%) |
| Total | 4,572 (100.0%) | 6,553 (100.0%) |
Monthly Housing Cost Tiers in New London
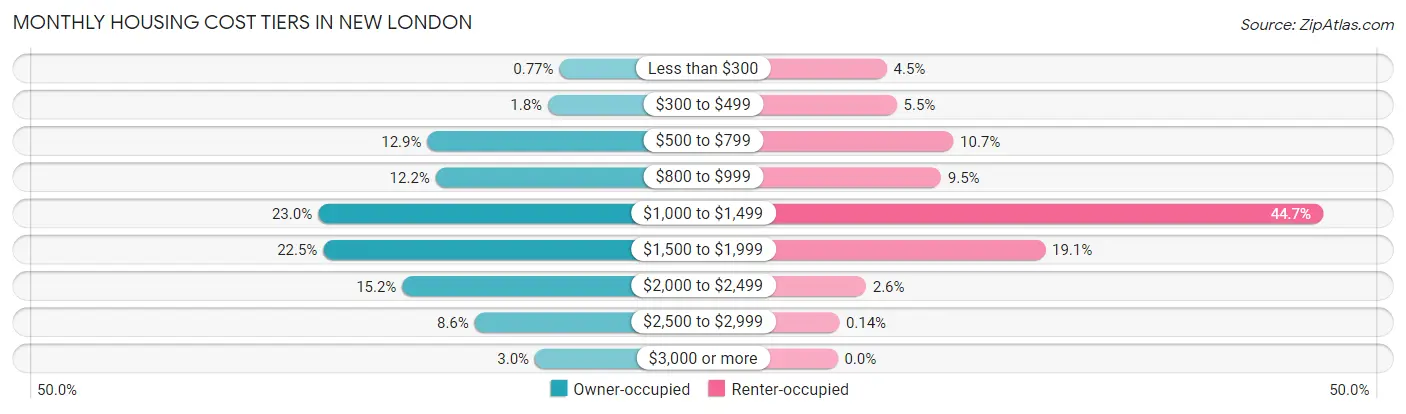
| Monthly Cost | Owner-occupied | Renter-occupied |
| Less than $300 | 35 (0.8%) | 297 (4.5%) |
| $300 to $499 | 83 (1.8%) | 357 (5.4%) |
| $500 to $799 | 591 (12.9%) | 698 (10.6%) |
| $800 to $999 | 556 (12.2%) | 624 (9.5%) |
| $1,000 to $1,499 | 1,051 (23.0%) | 2,928 (44.7%) |
| $1,500 to $1,999 | 1,029 (22.5%) | 1,252 (19.1%) |
| $2,000 to $2,499 | 697 (15.2%) | 171 (2.6%) |
| $2,500 to $2,999 | 392 (8.6%) | 9 (0.1%) |
| $3,000 or more | 138 (3.0%) | 0 (0.0%) |
| Total | 4,572 (100.0%) | 6,553 (100.0%) |
Physical Housing Characteristics in New London
Housing Structures in New London
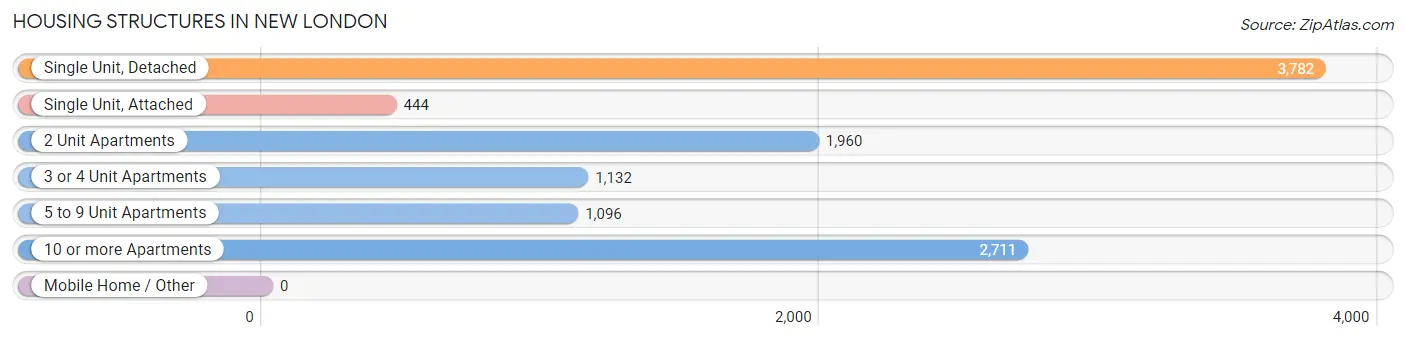
| Structure Type | # Housing Units | % Housing Units |
| Single Unit, Detached | 3,782 | 34.0% |
| Single Unit, Attached | 444 | 4.0% |
| 2 Unit Apartments | 1,960 | 17.6% |
| 3 or 4 Unit Apartments | 1,132 | 10.2% |
| 5 to 9 Unit Apartments | 1,096 | 9.9% |
| 10 or more Apartments | 2,711 | 24.4% |
| Mobile Home / Other | 0 | 0.0% |
| Total | 11,125 | 100.0% |
Housing Structures by Occupancy in New London
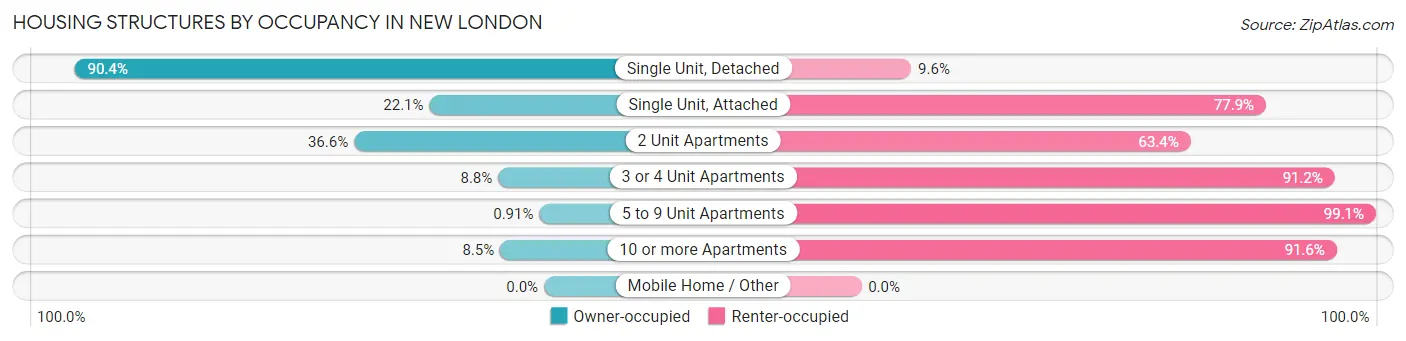
| Structure Type | Owner-occupied | Renter-occupied |
| Single Unit, Detached | 3,418 (90.4%) | 364 (9.6%) |
| Single Unit, Attached | 98 (22.1%) | 346 (77.9%) |
| 2 Unit Apartments | 717 (36.6%) | 1,243 (63.4%) |
| 3 or 4 Unit Apartments | 100 (8.8%) | 1,032 (91.2%) |
| 5 to 9 Unit Apartments | 10 (0.9%) | 1,086 (99.1%) |
| 10 or more Apartments | 229 (8.5%) | 2,482 (91.5%) |
| Mobile Home / Other | 0 (0.0%) | 0 (0.0%) |
| Total | 4,572 (41.1%) | 6,553 (58.9%) |
Housing Structures by Number of Rooms in New London
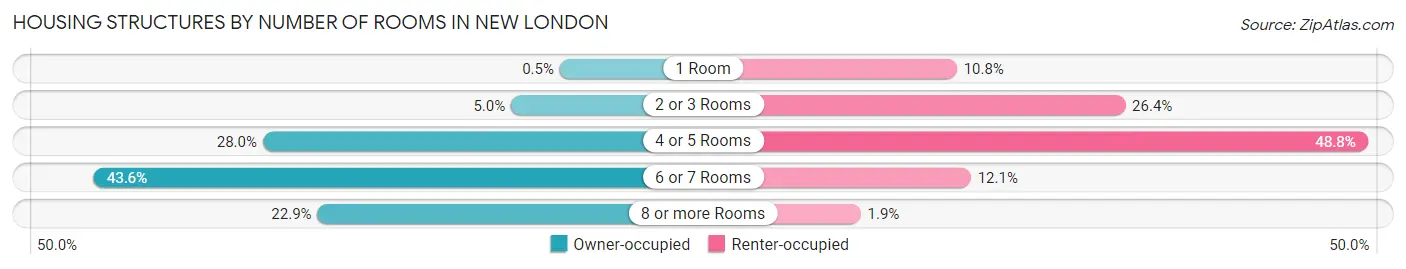
| Number of Rooms | Owner-occupied | Renter-occupied |
| 1 Room | 23 (0.5%) | 708 (10.8%) |
| 2 or 3 Rooms | 229 (5.0%) | 1,729 (26.4%) |
| 4 or 5 Rooms | 1,279 (28.0%) | 3,198 (48.8%) |
| 6 or 7 Rooms | 1,993 (43.6%) | 793 (12.1%) |
| 8 or more Rooms | 1,048 (22.9%) | 125 (1.9%) |
| Total | 4,572 (100.0%) | 6,553 (100.0%) |
Housing Structure by Heating Type in New London
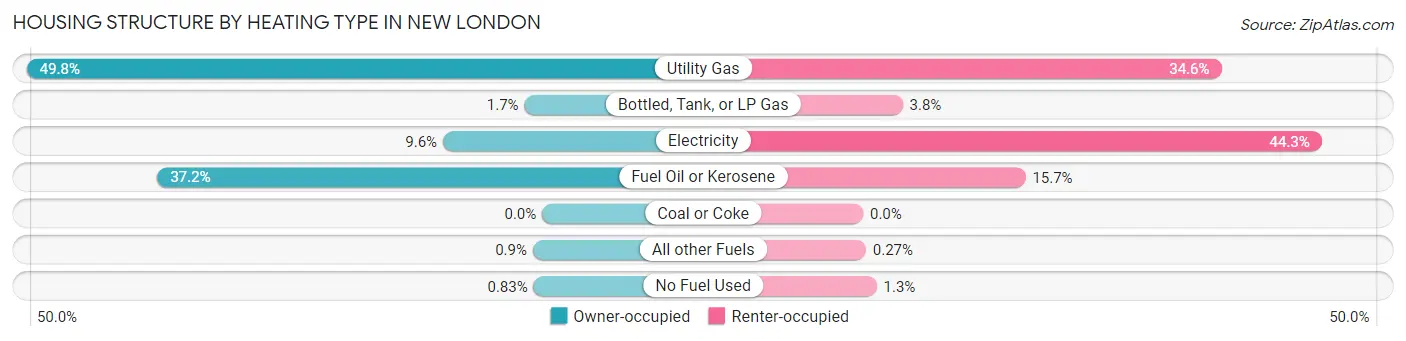
| Heating Type | Owner-occupied | Renter-occupied |
| Utility Gas | 2,277 (49.8%) | 2,268 (34.6%) |
| Bottled, Tank, or LP Gas | 78 (1.7%) | 250 (3.8%) |
| Electricity | 438 (9.6%) | 2,903 (44.3%) |
| Fuel Oil or Kerosene | 1,700 (37.2%) | 1,028 (15.7%) |
| Coal or Coke | 0 (0.0%) | 0 (0.0%) |
| All other Fuels | 41 (0.9%) | 18 (0.3%) |
| No Fuel Used | 38 (0.8%) | 86 (1.3%) |
| Total | 4,572 (100.0%) | 6,553 (100.0%) |
Household Vehicle Usage in New London
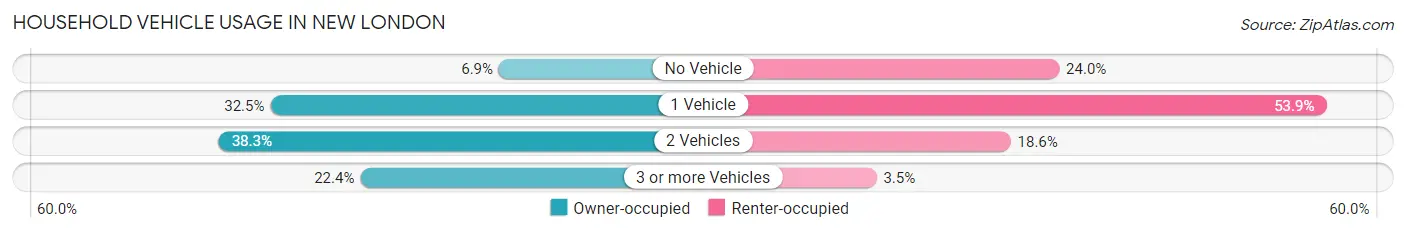
| Vehicles per Household | Owner-occupied | Renter-occupied |
| No Vehicle | 314 (6.9%) | 1,573 (24.0%) |
| 1 Vehicle | 1,485 (32.5%) | 3,533 (53.9%) |
| 2 Vehicles | 1,749 (38.3%) | 1,216 (18.6%) |
| 3 or more Vehicles | 1,024 (22.4%) | 231 (3.5%) |
| Total | 4,572 (100.0%) | 6,553 (100.0%) |
Real Estate & Mortgages in New London
Real Estate and Mortgage Overview in New London
| Characteristic | Without Mortgage | With Mortgage |
| Housing Units | 1,502 | 3,070 |
| Median Property Value | $243,800 | $213,300 |
| Median Household Income | $67,857 | $591 |
| Monthly Housing Costs | $828 | $138 |
| Real Estate Taxes | $5,142 | $75 |
Property Value by Mortgage Status in New London
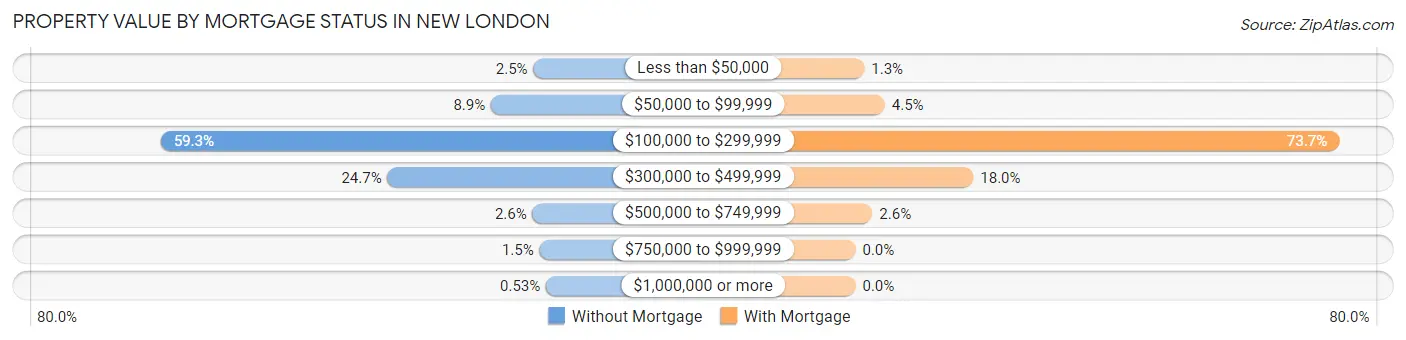
| Property Value | Without Mortgage | With Mortgage |
| Less than $50,000 | 37 (2.5%) | 41 (1.3%) |
| $50,000 to $99,999 | 134 (8.9%) | 137 (4.5%) |
| $100,000 to $299,999 | 890 (59.3%) | 2,262 (73.7%) |
| $300,000 to $499,999 | 371 (24.7%) | 551 (17.9%) |
| $500,000 to $749,999 | 39 (2.6%) | 79 (2.6%) |
| $750,000 to $999,999 | 23 (1.5%) | 0 (0.0%) |
| $1,000,000 or more | 8 (0.5%) | 0 (0.0%) |
| Total | 1,502 (100.0%) | 3,070 (100.0%) |
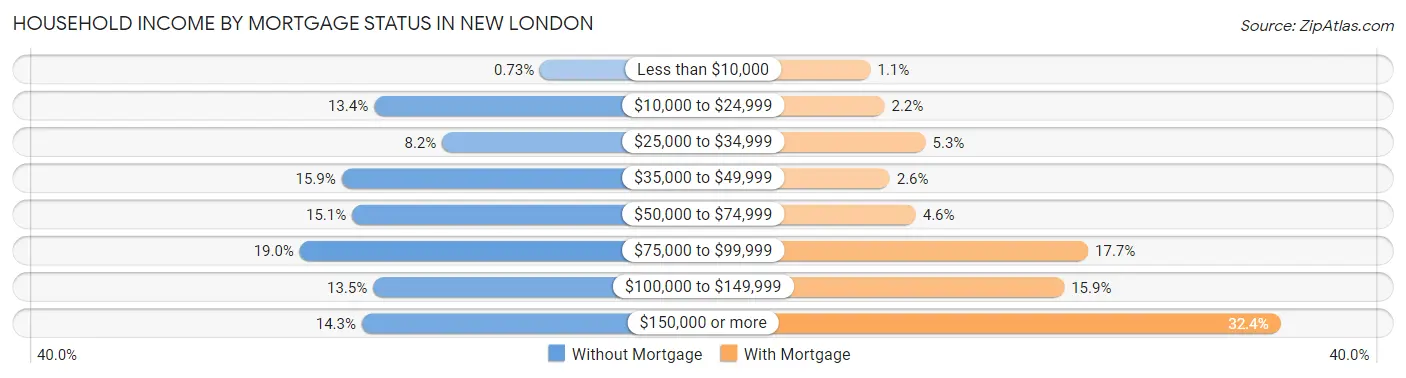
Household Income by Mortgage Status in New London
| Household Income | Without Mortgage | With Mortgage |
| Less than $10,000 | 11 (0.7%) | 35 (1.1%) |
| $10,000 to $24,999 | 201 (13.4%) | 68 (2.2%) |
| $25,000 to $34,999 | 123 (8.2%) | 164 (5.3%) |
| $35,000 to $49,999 | 238 (15.9%) | 80 (2.6%) |
| $50,000 to $74,999 | 226 (15.0%) | 141 (4.6%) |
| $75,000 to $99,999 | 286 (19.0%) | 544 (17.7%) |
| $100,000 to $149,999 | 202 (13.5%) | 488 (15.9%) |
| $150,000 or more | 215 (14.3%) | 994 (32.4%) |
| Total | 1,502 (100.0%) | 3,070 (100.0%) |
Property Value to Household Income Ratio in New London
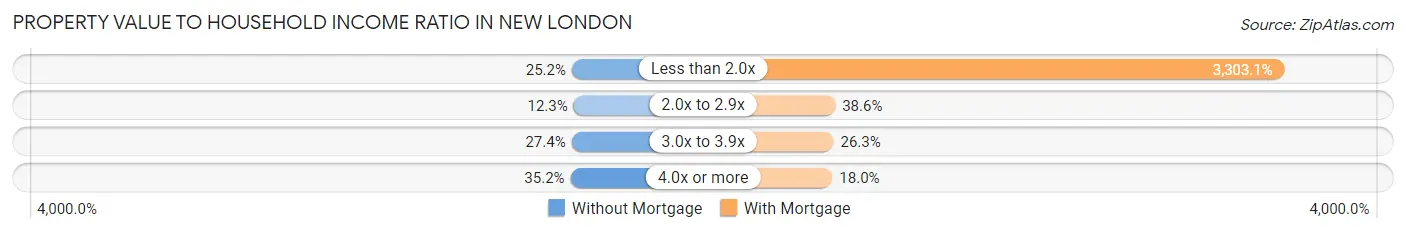
| Value-to-Income Ratio | Without Mortgage | With Mortgage |
| Less than 2.0x | 378 (25.2%) | 101,404 (3,303.1%) |
| 2.0x to 2.9x | 185 (12.3%) | 1,186 (38.6%) |
| 3.0x to 3.9x | 411 (27.4%) | 807 (26.3%) |
| 4.0x or more | 528 (35.1%) | 553 (18.0%) |
| Total | 1,502 (100.0%) | 3,070 (100.0%) |
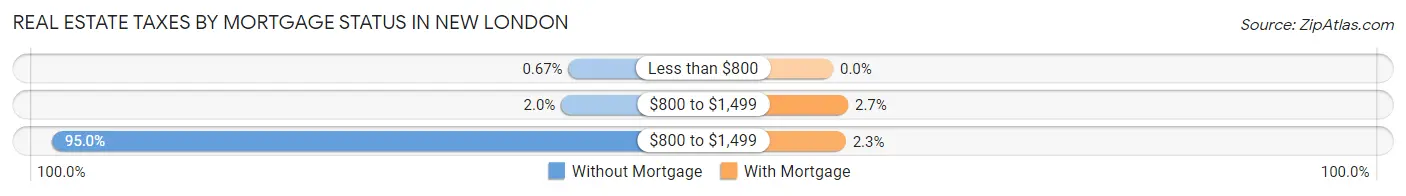
Real Estate Taxes by Mortgage Status in New London
| Property Taxes | Without Mortgage | With Mortgage |
| Less than $800 | 10 (0.7%) | 0 (0.0%) |
| $800 to $1,499 | 30 (2.0%) | 84 (2.7%) |
| $800 to $1,499 | 1,427 (95.0%) | 71 (2.3%) |
| Total | 1,502 (100.0%) | 3,070 (100.0%) |
Health & Disability in New London
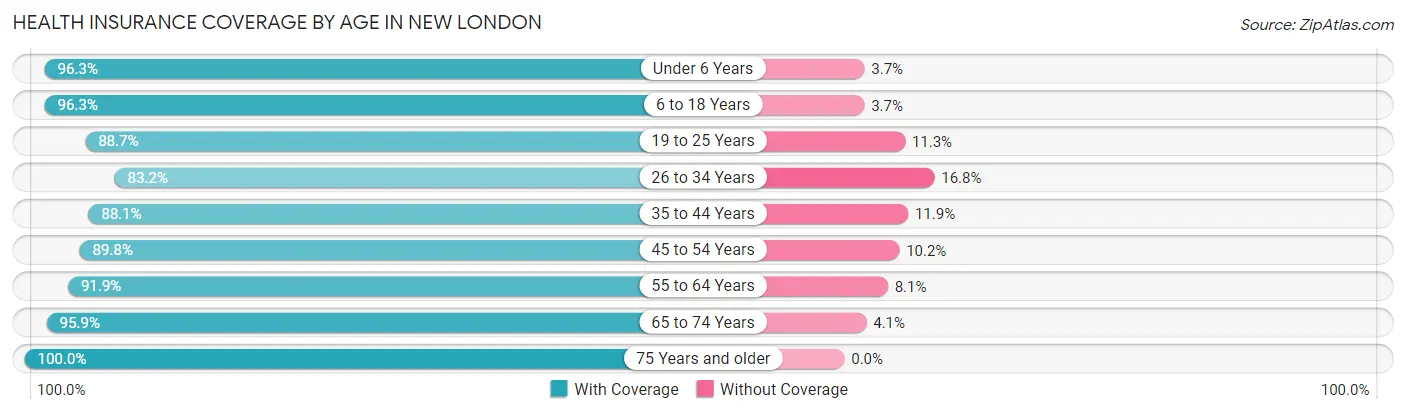
Health Insurance Coverage by Age in New London
| Age Bracket | With Coverage | Without Coverage |
| Under 6 Years | 1,674 (96.3%) | 65 (3.7%) |
| 6 to 18 Years | 3,445 (96.3%) | 133 (3.7%) |
| 19 to 25 Years | 3,787 (88.7%) | 483 (11.3%) |
| 26 to 34 Years | 2,359 (83.2%) | 476 (16.8%) |
| 35 to 44 Years | 3,322 (88.1%) | 448 (11.9%) |
| 45 to 54 Years | 2,411 (89.8%) | 275 (10.2%) |
| 55 to 64 Years | 3,169 (91.9%) | 279 (8.1%) |
| 65 to 74 Years | 2,387 (95.9%) | 102 (4.1%) |
| 75 Years and older | 1,405 (100.0%) | 0 (0.0%) |
| Total | 23,959 (91.4%) | 2,261 (8.6%) |
Health Insurance Coverage by Citizenship Status in New London
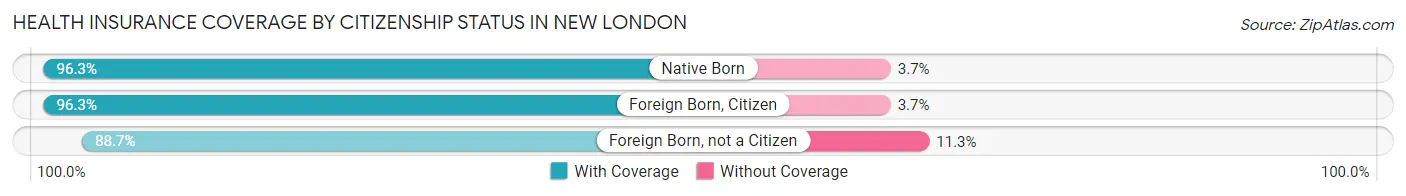
| Citizenship Status | With Coverage | Without Coverage |
| Native Born | 1,674 (96.3%) | 65 (3.7%) |
| Foreign Born, Citizen | 3,445 (96.3%) | 133 (3.7%) |
| Foreign Born, not a Citizen | 3,787 (88.7%) | 483 (11.3%) |
Health Insurance Coverage by Household Income in New London
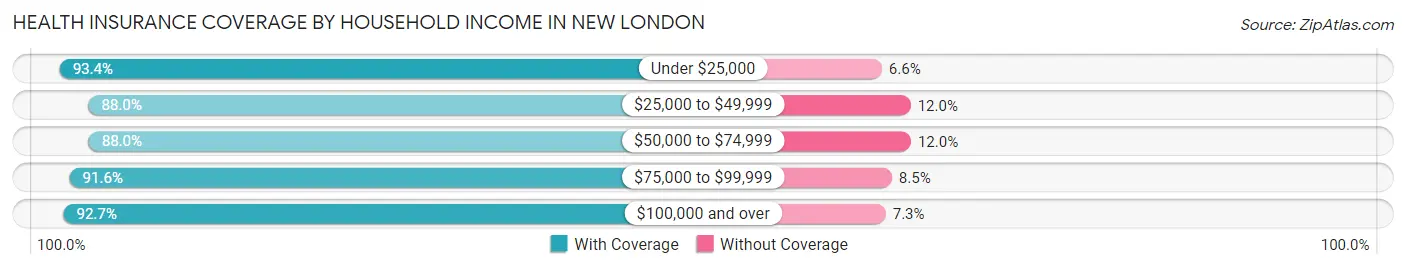
| Household Income | With Coverage | Without Coverage |
| Under $25,000 | 4,173 (93.4%) | 294 (6.6%) |
| $25,000 to $49,999 | 4,062 (88.0%) | 553 (12.0%) |
| $50,000 to $74,999 | 4,140 (88.0%) | 566 (12.0%) |
| $75,000 to $99,999 | 2,556 (91.5%) | 236 (8.5%) |
| $100,000 and over | 6,225 (92.7%) | 491 (7.3%) |
Public vs Private Health Insurance Coverage by Age in New London
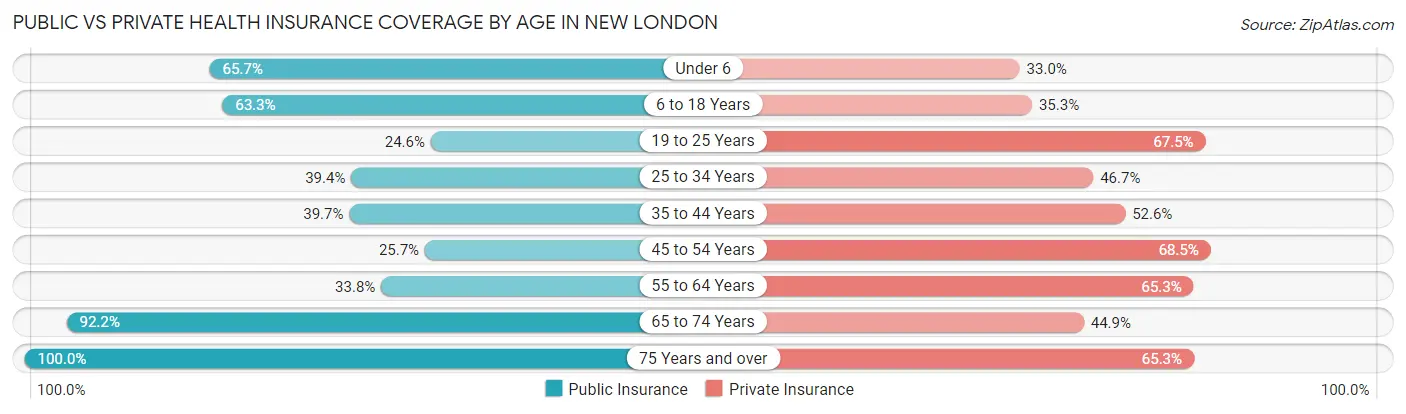
| Age Bracket | Public Insurance | Private Insurance |
| Under 6 | 1,142 (65.7%) | 574 (33.0%) |
| 6 to 18 Years | 2,265 (63.3%) | 1,263 (35.3%) |
| 19 to 25 Years | 1,051 (24.6%) | 2,882 (67.5%) |
| 25 to 34 Years | 1,116 (39.4%) | 1,323 (46.7%) |
| 35 to 44 Years | 1,498 (39.7%) | 1,983 (52.6%) |
| 45 to 54 Years | 690 (25.7%) | 1,839 (68.5%) |
| 55 to 64 Years | 1,166 (33.8%) | 2,251 (65.3%) |
| 65 to 74 Years | 2,295 (92.2%) | 1,118 (44.9%) |
| 75 Years and over | 1,405 (100.0%) | 918 (65.3%) |
| Total | 12,628 (48.2%) | 14,151 (54.0%) |
Disability Status by Sex by Age in New London
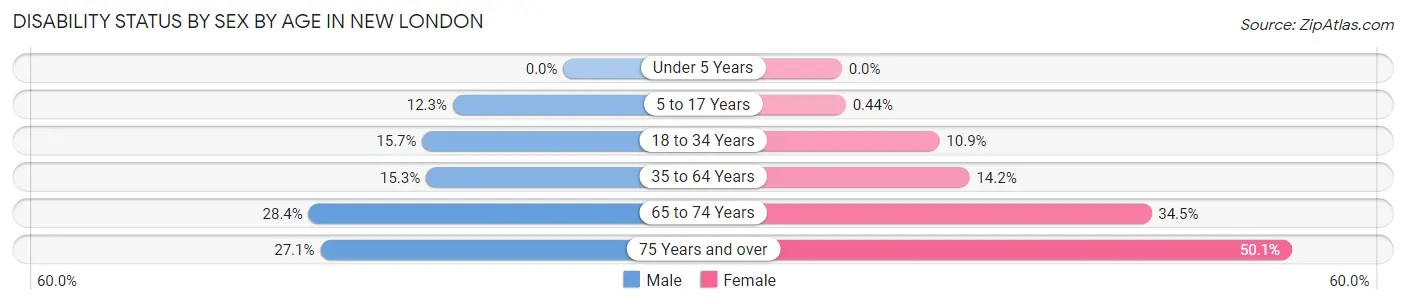
| Age Bracket | Male | Female |
| Under 5 Years | 0 (0.0%) | 0 (0.0%) |
| 5 to 17 Years | 162 (12.3%) | 8 (0.4%) |
| 18 to 34 Years | 587 (15.7%) | 449 (10.9%) |
| 35 to 64 Years | 698 (15.3%) | 759 (14.2%) |
| 65 to 74 Years | 358 (28.4%) | 423 (34.5%) |
| 75 Years and over | 173 (27.1%) | 384 (50.1%) |
Disability Class by Sex by Age in New London
Disability Class: Hearing Difficulty
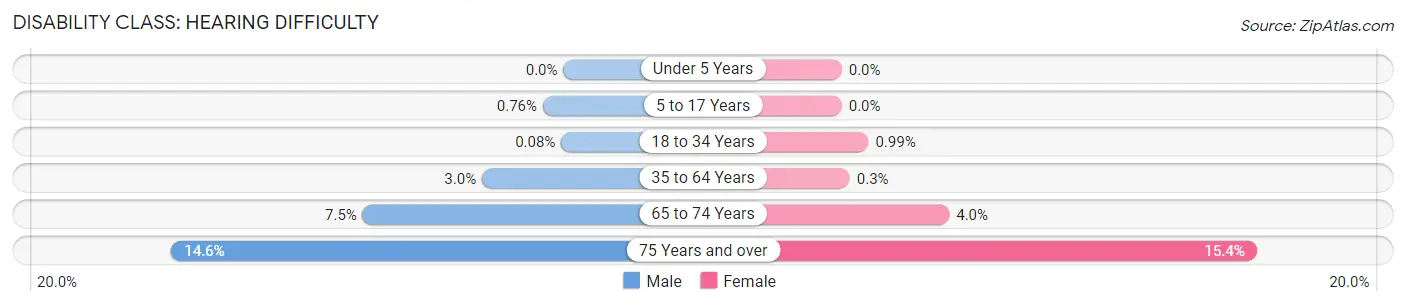
| Age Bracket | Male | Female |
| Under 5 Years | 0 (0.0%) | 0 (0.0%) |
| 5 to 17 Years | 10 (0.8%) | 0 (0.0%) |
| 18 to 34 Years | 3 (0.1%) | 41 (1.0%) |
| 35 to 64 Years | 138 (3.0%) | 16 (0.3%) |
| 65 to 74 Years | 94 (7.4%) | 49 (4.0%) |
| 75 Years and over | 93 (14.5%) | 118 (15.4%) |
Disability Class: Vision Difficulty
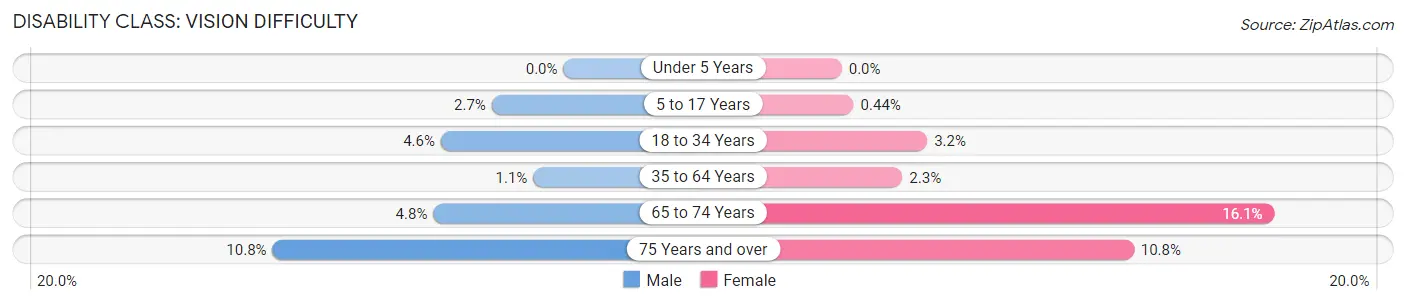
| Age Bracket | Male | Female |
| Under 5 Years | 0 (0.0%) | 0 (0.0%) |
| 5 to 17 Years | 35 (2.7%) | 8 (0.4%) |
| 18 to 34 Years | 170 (4.5%) | 131 (3.2%) |
| 35 to 64 Years | 51 (1.1%) | 120 (2.2%) |
| 65 to 74 Years | 61 (4.8%) | 197 (16.1%) |
| 75 Years and over | 69 (10.8%) | 83 (10.8%) |
Disability Class: Cognitive Difficulty
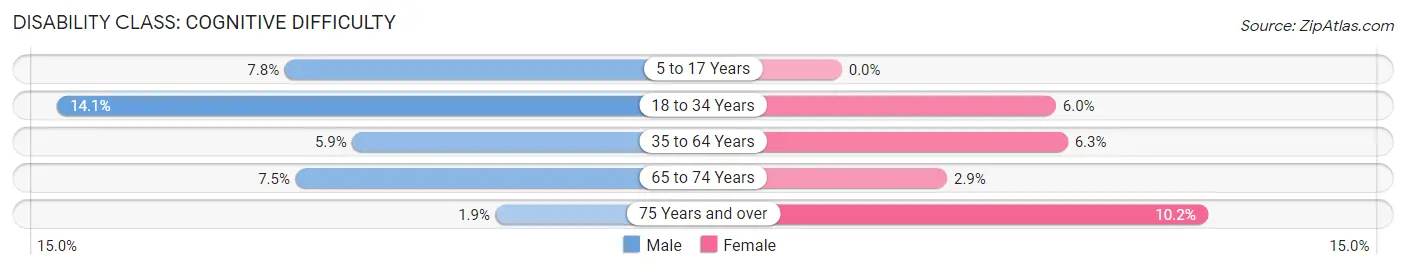
| Age Bracket | Male | Female |
| 5 to 17 Years | 102 (7.7%) | 0 (0.0%) |
| 18 to 34 Years | 527 (14.1%) | 246 (6.0%) |
| 35 to 64 Years | 268 (5.9%) | 336 (6.3%) |
| 65 to 74 Years | 94 (7.4%) | 36 (2.9%) |
| 75 Years and over | 12 (1.9%) | 78 (10.2%) |
Disability Class: Ambulatory Difficulty
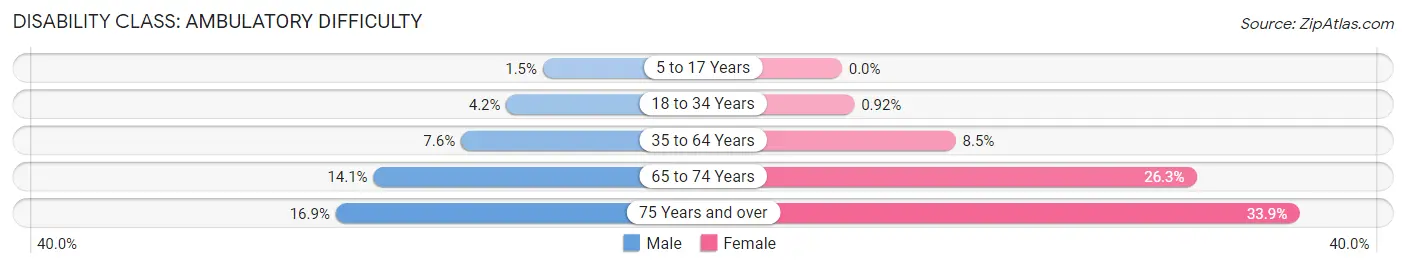
| Age Bracket | Male | Female |
| 5 to 17 Years | 20 (1.5%) | 0 (0.0%) |
| 18 to 34 Years | 158 (4.2%) | 38 (0.9%) |
| 35 to 64 Years | 347 (7.6%) | 451 (8.5%) |
| 65 to 74 Years | 178 (14.1%) | 323 (26.3%) |
| 75 Years and over | 108 (16.9%) | 260 (33.9%) |
Disability Class: Self-Care Difficulty
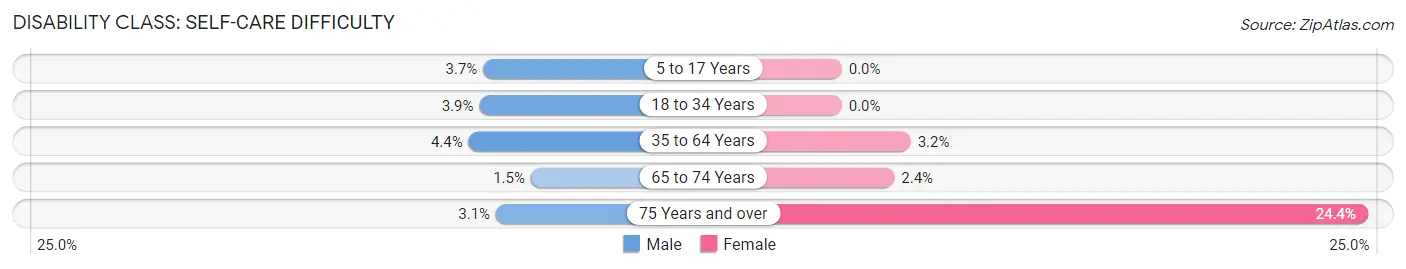
| Age Bracket | Male | Female |
| 5 to 17 Years | 49 (3.7%) | 0 (0.0%) |
| 18 to 34 Years | 146 (3.9%) | 0 (0.0%) |
| 35 to 64 Years | 201 (4.4%) | 171 (3.2%) |
| 65 to 74 Years | 19 (1.5%) | 30 (2.4%) |
| 75 Years and over | 20 (3.1%) | 187 (24.4%) |
Technology Access in New London
Computing Device Access in New London
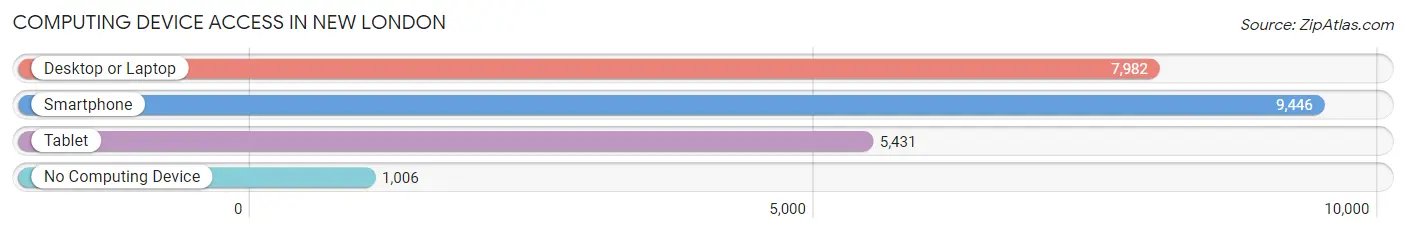
| Device Type | # Households | % Households |
| Desktop or Laptop | 7,982 | 71.8% |
| Smartphone | 9,446 | 84.9% |
| Tablet | 5,431 | 48.8% |
| No Computing Device | 1,006 | 9.0% |
| Total | 11,125 | 100.0% |
Internet Access in New London
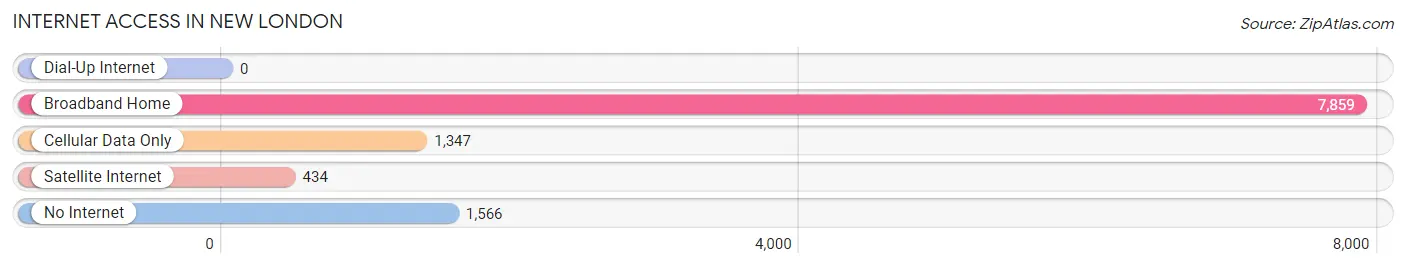
| Internet Type | # Households | % Households |
| Dial-Up Internet | 0 | 0.0% |
| Broadband Home | 7,859 | 70.6% |
| Cellular Data Only | 1,347 | 12.1% |
| Satellite Internet | 434 | 3.9% |
| No Internet | 1,566 | 14.1% |
| Total | 11,125 | 100.0% |
New London Summary
New London, Connecticut is a city located in New London County, Connecticut, United States. It is situated on the Thames River, at the mouth of the river, and is the county seat of New London County. The city has a population of approximately 27,620 people, according to the 2010 census.
History
The area that is now New London was originally inhabited by the Mohegan and Pequot Native American tribes. The first European settlers arrived in the area in 1646, when the Dutch established a trading post. The area was then part of the New Haven Colony, and was incorporated as a town in 1658. The town was named after London, England, and was the first permanent settlement in the area.
In 1705, the town was renamed New London, and it was incorporated as a city in 1784. During the Revolutionary War, New London was a major port for the Continental Navy, and was the site of the Battle of Groton Heights in 1781.
In the 19th century, New London was a major whaling port, and was home to the first commercial whaling company in the United States. The city was also a major shipbuilding center, and was home to the first submarine base in the United States.
Geography
New London is located at 41°20'N 72°05'W (41.33, -72.08). It is situated on the Thames River, at the mouth of the river, and is the county seat of New London County. The city has a total area of 10.3 square miles, of which 9.3 square miles is land and 1.0 square mile is water.
The city is located in the southeastern corner of Connecticut, and is bordered by the towns of Groton, Waterford, East Lyme, and Montville. The city is located approximately 60 miles from Hartford, Connecticut, and approximately 120 miles from New York City.
Economy
New London has a diverse economy, with a mix of manufacturing, retail, and service industries. The city is home to several major employers, including Electric Boat, Pfizer, and the United States Coast Guard Academy.
The city is also home to several educational institutions, including the United States Coast Guard Academy, Connecticut College, and Mitchell College.
Demographics
As of the 2010 census, there were 27,620 people, 11,845 households, and 5,945 families residing in the city. The population density was 2,945.3 people per square mile. The racial makeup of the city was 63.2% White, 22.2% African American, 0.5% Native American, 5.2% Asian, 0.1% Pacific Islander, 5.2% from other races, and 3.7% from two or more races. Hispanic or Latino of any race were 13.3% of the population.
The median income for a household in the city was $37,837, and the median income for a family was $45,945. The per capita income for the city was $20,945. About 17.2% of families and 20.7% of the population were below the poverty line, including 28.2% of those under age 18 and 11.2% of those age 65 or over.
Common Questions
What is Per Capita Income in New London?
Per Capita income in New London is $30,943.
What is the Median Family Income in New London?
Median Family Income in New London is $65,357.
What is the Median Household income in New London?
Median Household Income in New London is $56,237.
What is Income or Wage Gap in New London?
Income or Wage Gap in New London is 34.4%.
Women in New London earn 65.6 cents for every dollar earned by a man.
What is Family Income Deficit in New London?
Family Income Deficit in New London is $9,491.
Families that are below poverty line in New London earn $9,491 less on average than the poverty threshold level.
What is Inequality or Gini Index in New London?
Inequality or Gini Index in New London is 0.44.
What is the Total Population of New London?
Total Population of New London is 27,596.
What is the Total Male Population of New London?
Total Male Population of New London is 13,359.
What is the Total Female Population of New London?
Total Female Population of New London is 14,237.
What is the Ratio of Males per 100 Females in New London?
There are 93.83 Males per 100 Females in New London.
What is the Ratio of Females per 100 Males in New London?
There are 106.57 Females per 100 Males in New London.
What is the Median Population Age in New London?
Median Population Age in New London is 35.5 Years.
What is the Average Family Size in New London
Average Family Size in New London is 2.8 People.
What is the Average Household Size in New London
Average Household Size in New London is 2.1 People.
How Large is the Labor Force in New London?
There are 15,010 People in the Labor Forcein in New London.
What is the Percentage of People in the Labor Force in New London?
64.4% of People are in the Labor Force in New London.
What is the Unemployment Rate in New London?
Unemployment Rate in New London is 7.1%.