Oxoboxo River, CT Map & Demographics
Oxoboxo River Map
Oxoboxo River Overview
$35,003
PER CAPITA INCOME
$75,444
AVG FAMILY INCOME
$69,740
AVG HOUSEHOLD INCOME
37.2%
WAGE / INCOME GAP [ % ]
62.8¢/ $1
WAGE / INCOME GAP [ $ ]
0.41
INEQUALITY / GINI INDEX
2,429
TOTAL POPULATION
1,223
MALE POPULATION
1,206
FEMALE POPULATION
101.41
MALES / 100 FEMALES
98.61
FEMALES / 100 MALES
54.2
MEDIAN AGE
2.6
AVG FAMILY SIZE
2.1
AVG HOUSEHOLD SIZE
1,210
LABOR FORCE [ PEOPLE ]
57.5%
PERCENT IN LABOR FORCE
6.9%
UNEMPLOYMENT RATE
Income in Oxoboxo River
Income Overview in Oxoboxo River
Per Capita Income in Oxoboxo River is $35,003, while median incomes of families and households are $75,444 and $69,740 respectively.
| Characteristic | Number | Measure |
| Per Capita Income | 2,429 | $35,003 |
| Median Family Income | 672 | $75,444 |
| Mean Family Income | 672 | $88,408 |
| Median Household Income | 1,111 | $69,740 |
| Mean Household Income | 1,111 | $74,399 |
| Income Deficit | 672 | $0 |
| Wage / Income Gap (%) | 2,429 | 37.23% |
| Wage / Income Gap ($) | 2,429 | 62.77¢ per $1 |
| Gini / Inequality Index | 2,429 | 0.41 |
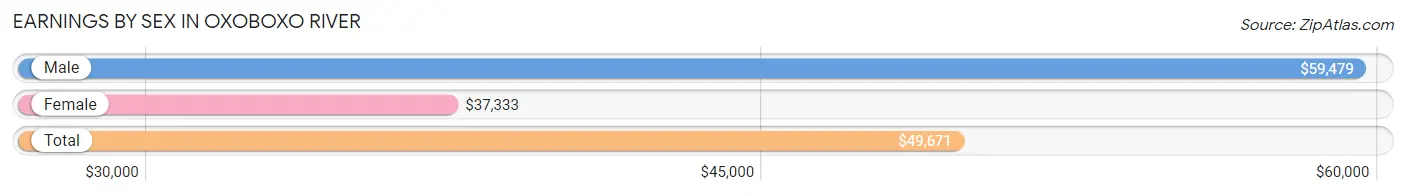
Earnings by Sex in Oxoboxo River
Average Earnings in Oxoboxo River are $49,671, $59,479 for men and $37,333 for women, a difference of 37.2%.
| Sex | Number | Average Earnings |
| Male | 601 (50.5%) | $59,479 |
| Female | 588 (49.4%) | $37,333 |
| Total | 1,189 (100.0%) | $49,671 |
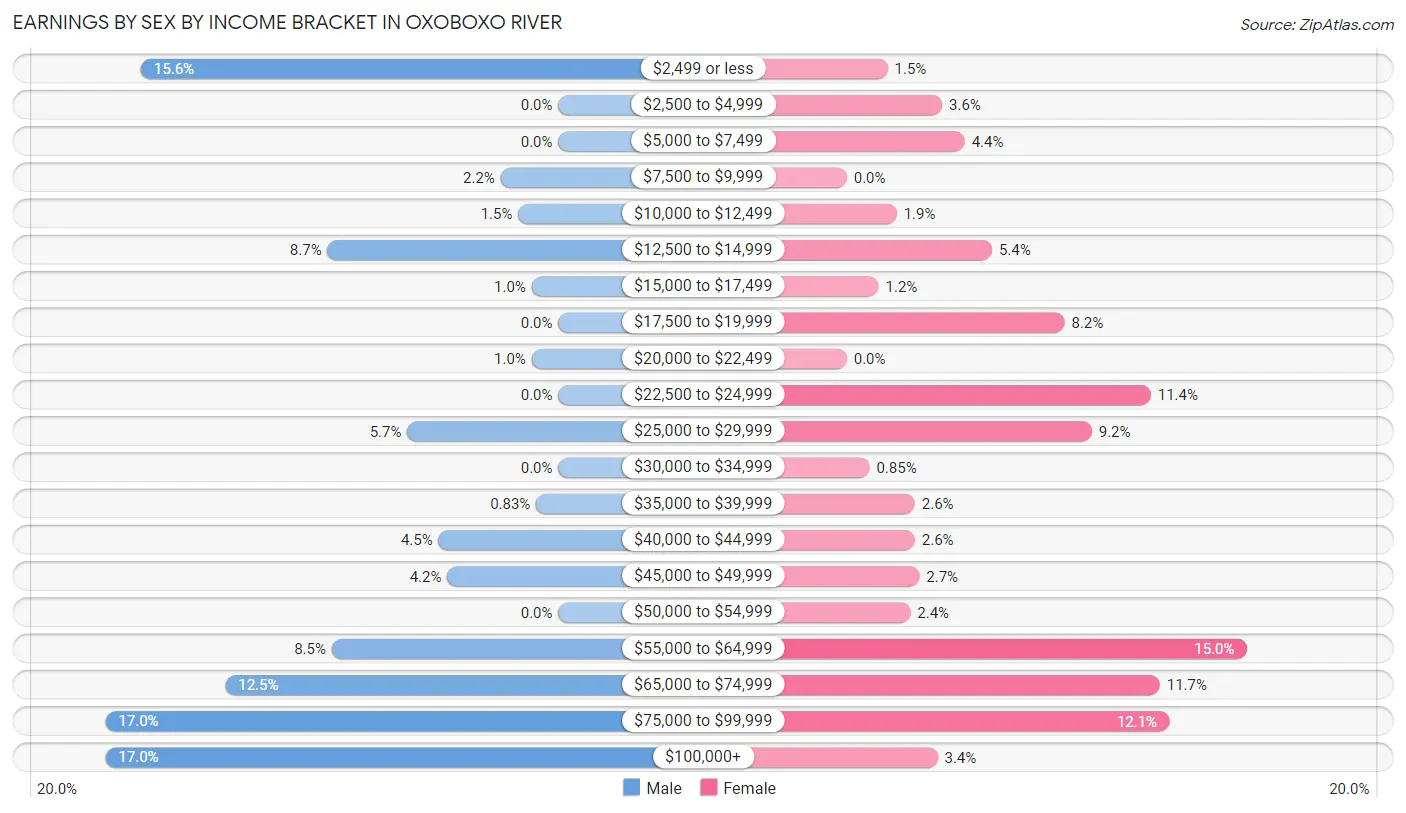
Earnings by Sex by Income Bracket in Oxoboxo River
The most common earnings brackets in Oxoboxo River are $75,000 to $99,999 for men (102 | 17.0%) and $55,000 to $64,999 for women (88 | 15.0%).
| Income | Male | Female |
| $2,499 or less | 94 (15.6%) | 9 (1.5%) |
| $2,500 to $4,999 | 0 (0.0%) | 21 (3.6%) |
| $5,000 to $7,499 | 0 (0.0%) | 26 (4.4%) |
| $7,500 to $9,999 | 13 (2.2%) | 0 (0.0%) |
| $10,000 to $12,499 | 9 (1.5%) | 11 (1.9%) |
| $12,500 to $14,999 | 52 (8.6%) | 32 (5.4%) |
| $15,000 to $17,499 | 6 (1.0%) | 7 (1.2%) |
| $17,500 to $19,999 | 0 (0.0%) | 48 (8.2%) |
| $20,000 to $22,499 | 6 (1.0%) | 0 (0.0%) |
| $22,500 to $24,999 | 0 (0.0%) | 67 (11.4%) |
| $25,000 to $29,999 | 34 (5.7%) | 54 (9.2%) |
| $30,000 to $34,999 | 0 (0.0%) | 5 (0.9%) |
| $35,000 to $39,999 | 5 (0.8%) | 15 (2.5%) |
| $40,000 to $44,999 | 27 (4.5%) | 15 (2.5%) |
| $45,000 to $49,999 | 25 (4.2%) | 16 (2.7%) |
| $50,000 to $54,999 | 0 (0.0%) | 14 (2.4%) |
| $55,000 to $64,999 | 51 (8.5%) | 88 (15.0%) |
| $65,000 to $74,999 | 75 (12.5%) | 69 (11.7%) |
| $75,000 to $99,999 | 102 (17.0%) | 71 (12.1%) |
| $100,000+ | 102 (17.0%) | 20 (3.4%) |
| Total | 601 (100.0%) | 588 (100.0%) |
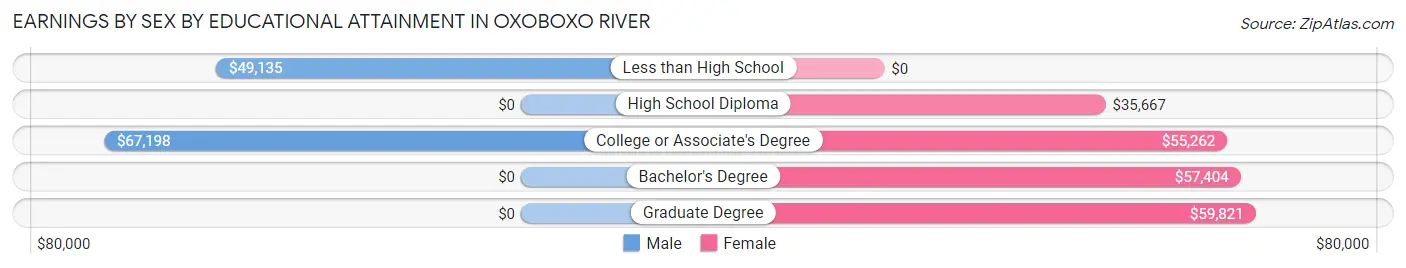
Earnings by Sex by Educational Attainment in Oxoboxo River
Average earnings in Oxoboxo River are $65,234 for men and $51,250 for women, a difference of 21.4%. Men with an educational attainment of college or associate's degree enjoy the highest average annual earnings of $67,198, while those with less than high school education earn the least with $49,135. Women with an educational attainment of graduate degree earn the most with the average annual earnings of $59,821, while those with high school diploma education have the smallest earnings of $35,667.
| Educational Attainment | Male Income | Female Income |
| Less than High School | $49,135 | $0 |
| High School Diploma | - | - |
| College or Associate's Degree | $67,198 | $55,262 |
| Bachelor's Degree | - | - |
| Graduate Degree | - | - |
| Total | $65,234 | $51,250 |
Family Income in Oxoboxo River
Family Income Brackets in Oxoboxo River
According to the Oxoboxo River family income data, there are 133 families falling into the $75,000 to $99,999 income range, which is the most common income bracket and makes up 19.8% of all families. Conversely, the $15,000 to $24,999 income bracket is the least frequent group with only 9 families (1.3%) belonging to this category.
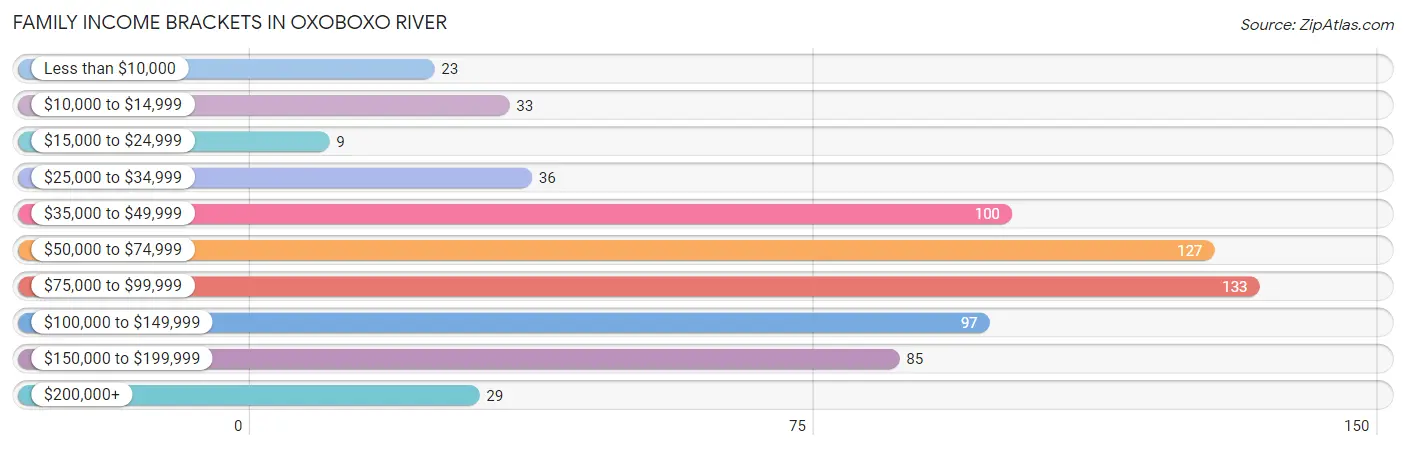
| Income Bracket | # Families | % Families |
| Less than $10,000 | 23 | 3.4% |
| $10,000 to $14,999 | 33 | 4.9% |
| $15,000 to $24,999 | 9 | 1.3% |
| $25,000 to $34,999 | 36 | 5.4% |
| $35,000 to $49,999 | 100 | 14.9% |
| $50,000 to $74,999 | 127 | 18.9% |
| $75,000 to $99,999 | 133 | 19.8% |
| $100,000 to $149,999 | 97 | 14.4% |
| $150,000 to $199,999 | 85 | 12.6% |
| $200,000+ | 29 | 4.3% |
Family Income by Famaliy Size in Oxoboxo River
2-person families (488 | 72.6%) account for the highest median family income in Oxoboxo River with $76,813 per family, while 2-person families (488 | 72.6%) have the highest median income of $38,406 per family member.
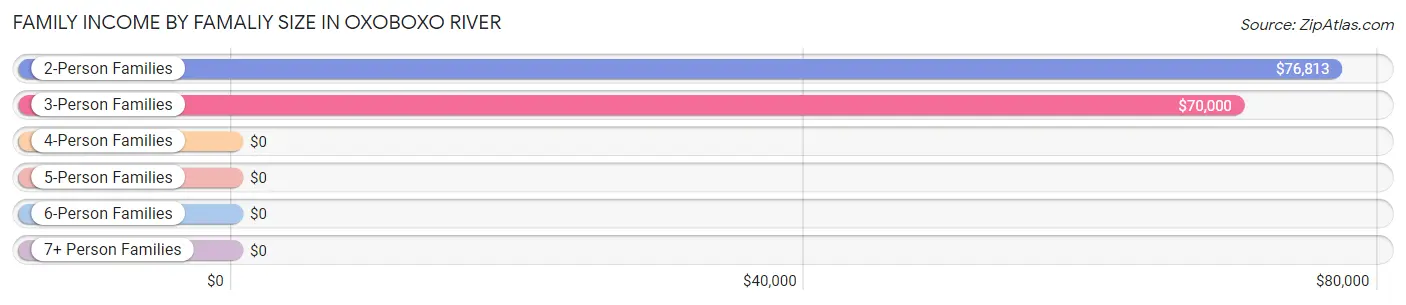
| Income Bracket | # Families | Median Income |
| 2-Person Families | 488 (72.6%) | $76,813 |
| 3-Person Families | 86 (12.8%) | $70,000 |
| 4-Person Families | 98 (14.6%) | $0 |
| 5-Person Families | 0 (0.0%) | $0 |
| 6-Person Families | 0 (0.0%) | $0 |
| 7+ Person Families | 0 (0.0%) | $0 |
| Total | 672 (100.0%) | $75,444 |
Family Income by Number of Earners in Oxoboxo River
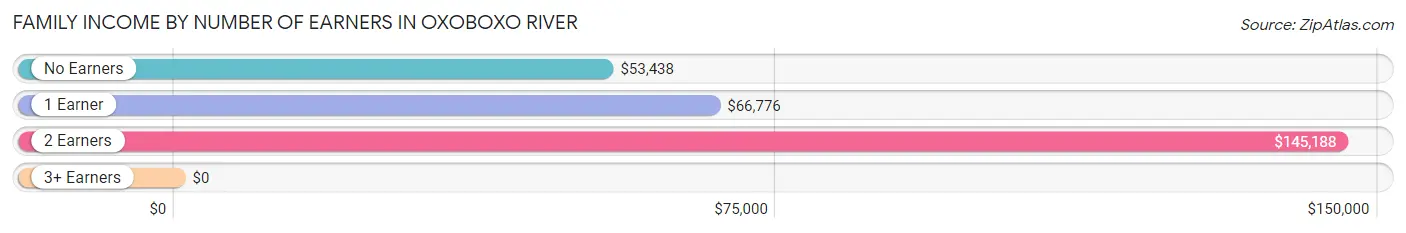
| Number of Earners | # Families | Median Income |
| No Earners | 207 (30.8%) | $53,438 |
| 1 Earner | 165 (24.5%) | $66,776 |
| 2 Earners | 284 (42.3%) | $145,188 |
| 3+ Earners | 16 (2.4%) | $0 |
| Total | 672 (100.0%) | $75,444 |
Household Income in Oxoboxo River
Household Income Brackets in Oxoboxo River
With 237 households falling in the category, the $75,000 to $99,999 income range is the most frequent in Oxoboxo River, accounting for 21.3% of all households. In contrast, only 29 households (2.6%) fall into the $10,000 to $14,999 income bracket, making it the least populous group.
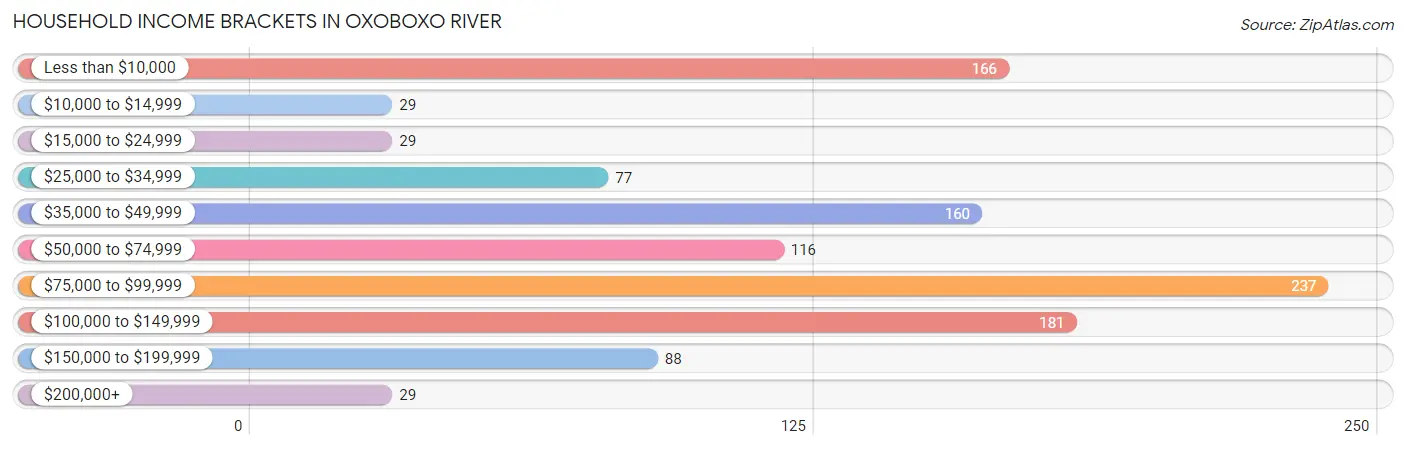
| Income Bracket | # Households | % Households |
| Less than $10,000 | 166 | 14.9% |
| $10,000 to $14,999 | 29 | 2.6% |
| $15,000 to $24,999 | 29 | 2.6% |
| $25,000 to $34,999 | 77 | 6.9% |
| $35,000 to $49,999 | 160 | 14.4% |
| $50,000 to $74,999 | 116 | 10.4% |
| $75,000 to $99,999 | 237 | 21.3% |
| $100,000 to $149,999 | 181 | 16.3% |
| $150,000 to $199,999 | 88 | 7.9% |
| $200,000+ | 29 | 2.6% |
Household Income by Householder Age in Oxoboxo River
The median household income in Oxoboxo River is $69,740, with the highest median household income of $85,167 found in the 25 to 44 years age bracket for the primary householder. A total of 260 households (23.4%) fall into this category.
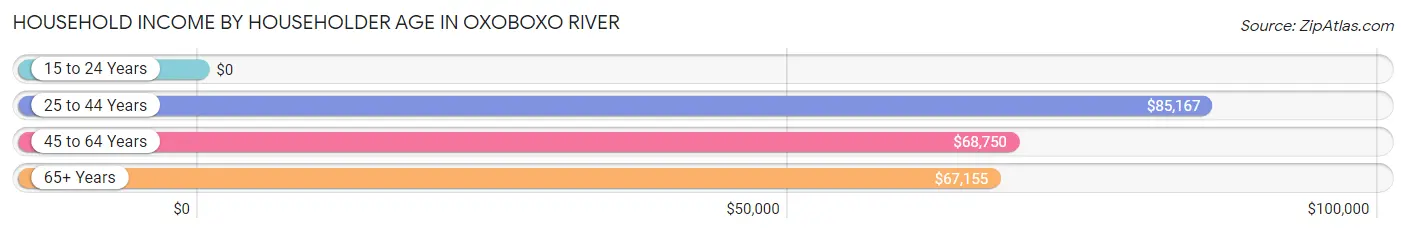
| Income Bracket | # Households | Median Income |
| 15 to 24 Years | 0 (0.0%) | $0 |
| 25 to 44 Years | 260 (23.4%) | $85,167 |
| 45 to 64 Years | 541 (48.7%) | $68,750 |
| 65+ Years | 310 (27.9%) | $67,155 |
| Total | 1,111 (100.0%) | $69,740 |
Poverty in Oxoboxo River
Income Below Poverty by Sex and Age in Oxoboxo River
With 23.9% poverty level for males and 13.7% for females among the residents of Oxoboxo River, 5 year old males and 55 to 64 year old females are the most vulnerable to poverty, with 8 males (100.0%) and 96 females (31.6%) in their respective age groups living below the poverty level.
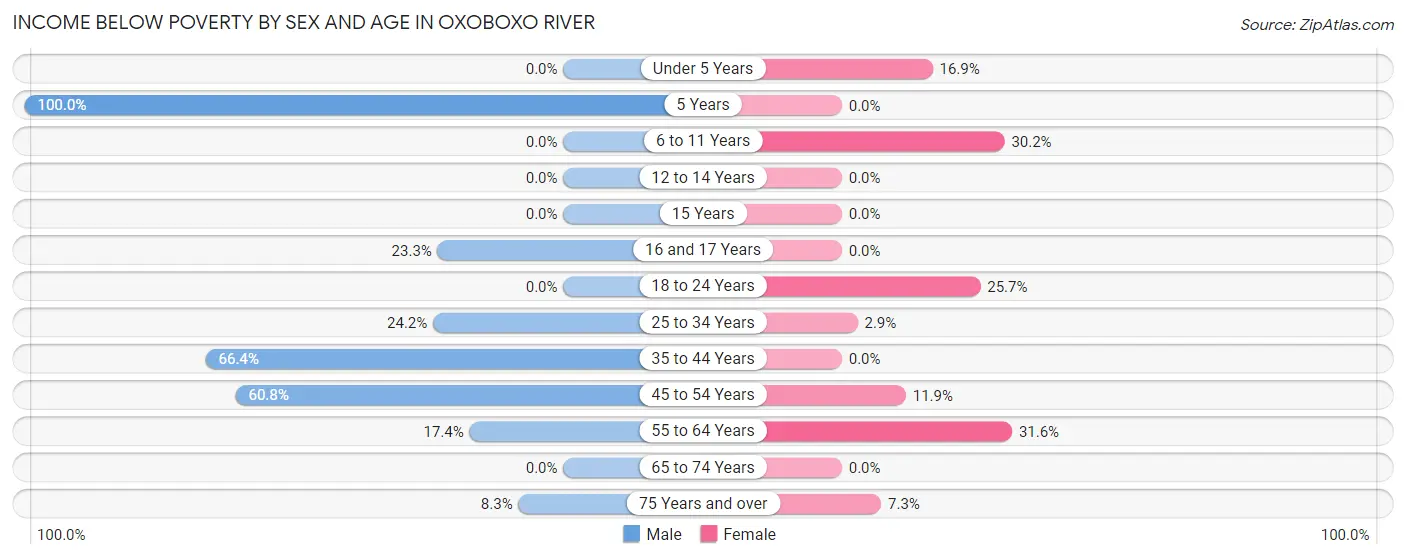
| Age Bracket | Male | Female |
| Under 5 Years | 0 (0.0%) | 15 (16.9%) |
| 5 Years | 8 (100.0%) | 0 (0.0%) |
| 6 to 11 Years | 0 (0.0%) | 16 (30.2%) |
| 12 to 14 Years | 0 (0.0%) | 0 (0.0%) |
| 15 Years | 0 (0.0%) | 0 (0.0%) |
| 16 and 17 Years | 7 (23.3%) | 0 (0.0%) |
| 18 to 24 Years | 0 (0.0%) | 9 (25.7%) |
| 25 to 34 Years | 37 (24.2%) | 4 (2.9%) |
| 35 to 44 Years | 83 (66.4%) | 0 (0.0%) |
| 45 to 54 Years | 87 (60.8%) | 12 (11.9%) |
| 55 to 64 Years | 51 (17.4%) | 96 (31.6%) |
| 65 to 74 Years | 0 (0.0%) | 0 (0.0%) |
| 75 Years and over | 12 (8.3%) | 13 (7.3%) |
| Total | 285 (23.9%) | 165 (13.7%) |
Income Above Poverty by Sex and Age in Oxoboxo River
According to the poverty statistics in Oxoboxo River, males aged under 5 years and females aged 5 years are the age groups that are most secure financially, with 100.0% of males and 100.0% of females in these age groups living above the poverty line.
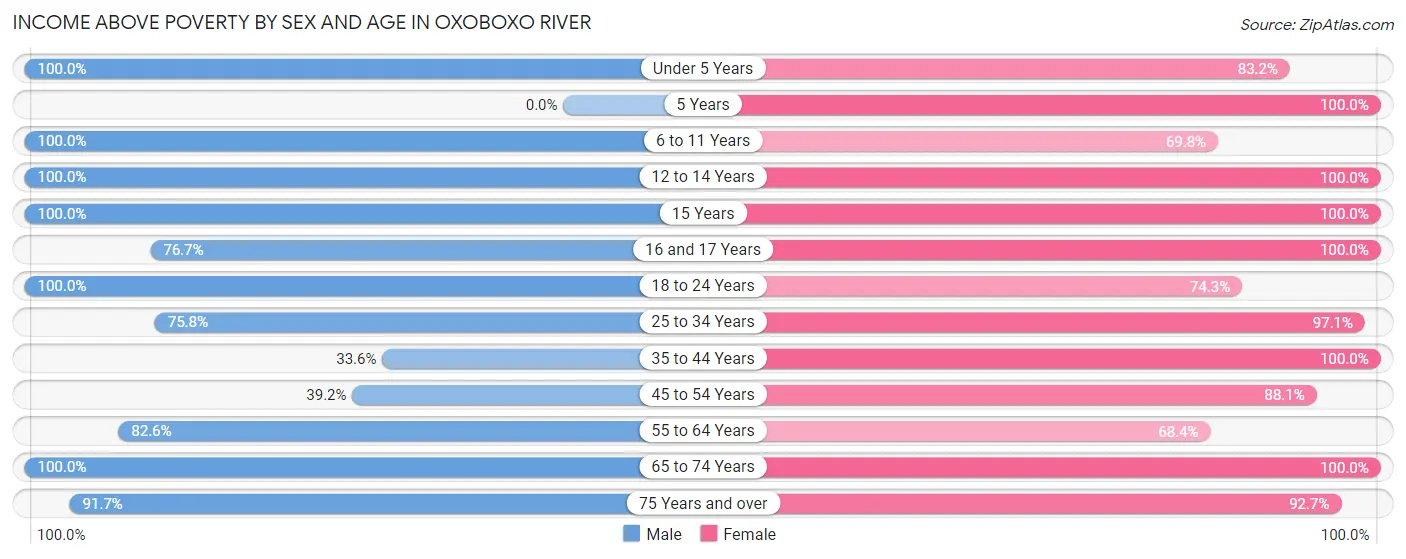
| Age Bracket | Male | Female |
| Under 5 Years | 22 (100.0%) | 74 (83.2%) |
| 5 Years | 0 (0.0%) | 10 (100.0%) |
| 6 to 11 Years | 5 (100.0%) | 37 (69.8%) |
| 12 to 14 Years | 48 (100.0%) | 51 (100.0%) |
| 15 Years | 7 (100.0%) | 32 (100.0%) |
| 16 and 17 Years | 23 (76.7%) | 43 (100.0%) |
| 18 to 24 Years | 73 (100.0%) | 26 (74.3%) |
| 25 to 34 Years | 116 (75.8%) | 133 (97.1%) |
| 35 to 44 Years | 42 (33.6%) | 96 (100.0%) |
| 45 to 54 Years | 56 (39.2%) | 89 (88.1%) |
| 55 to 64 Years | 242 (82.6%) | 208 (68.4%) |
| 65 to 74 Years | 139 (100.0%) | 77 (100.0%) |
| 75 Years and over | 132 (91.7%) | 165 (92.7%) |
| Total | 905 (76.0%) | 1,041 (86.3%) |
Income Below Poverty Among Married-Couple Families in Oxoboxo River
The poverty statistics for married-couple families in Oxoboxo River show that 4.8% or 22 of the total 457 families live below the poverty line. Families with no children have the highest poverty rate of 5.9%, comprising of 22 families. On the other hand, families with 1 or 2 children have the lowest poverty rate of 0.0%, which includes 0 families.
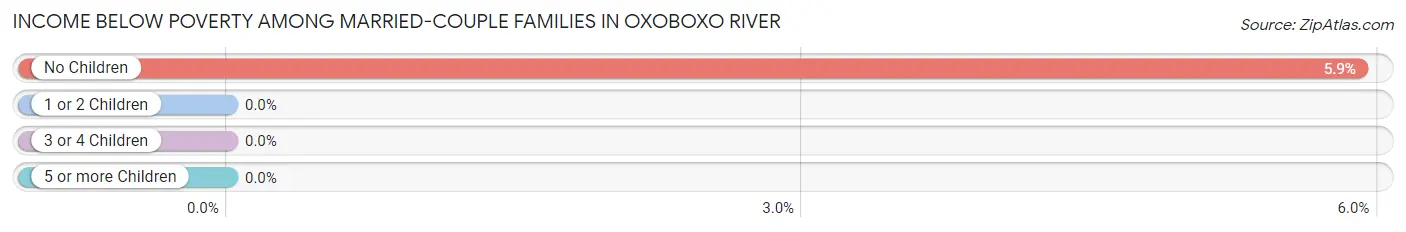
| Children | Above Poverty | Below Poverty |
| No Children | 351 (94.1%) | 22 (5.9%) |
| 1 or 2 Children | 84 (100.0%) | 0 (0.0%) |
| 3 or 4 Children | 0 (0.0%) | 0 (0.0%) |
| 5 or more Children | 0 (0.0%) | 0 (0.0%) |
| Total | 435 (95.2%) | 22 (4.8%) |
Income Below Poverty Among Single-Parent Households in Oxoboxo River
According to the poverty data in Oxoboxo River, 7.6% or 7 single-father households and 29.3% or 36 single-mother households are living below the poverty line. Among single-father households, those with 3 or 4 children have the highest poverty rate, with 7 households (100.0%) experiencing poverty. Likewise, among single-mother households, those with no children have the highest poverty rate, with 29 households (50.9%) falling below the poverty line.
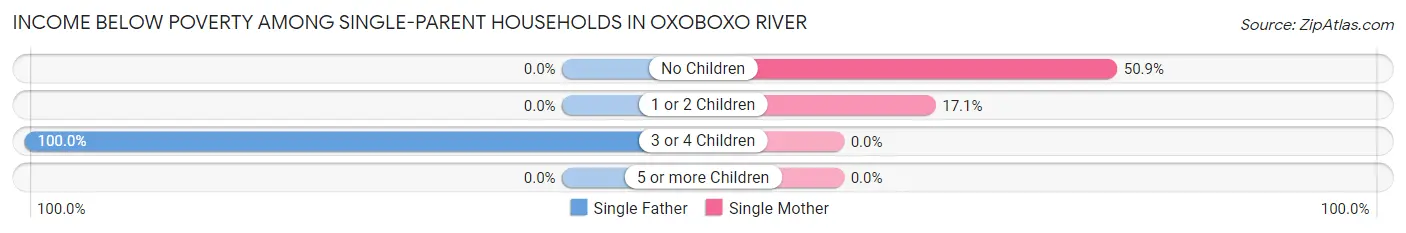
| Children | Single Father | Single Mother |
| No Children | 0 (0.0%) | 29 (50.9%) |
| 1 or 2 Children | 0 (0.0%) | 7 (17.1%) |
| 3 or 4 Children | 7 (100.0%) | 0 (0.0%) |
| 5 or more Children | 0 (0.0%) | 0 (0.0%) |
| Total | 7 (7.6%) | 36 (29.3%) |
Income Below Poverty Among Married-Couple vs Single-Parent Households in Oxoboxo River
The poverty data for Oxoboxo River shows that 22 of the married-couple family households (4.8%) and 43 of the single-parent households (20.0%) are living below the poverty level. Within the married-couple family households, those with no children have the highest poverty rate, with 22 households (5.9%) falling below the poverty line. Among the single-parent households, those with no children have the highest poverty rate, with 29 household (26.4%) living below poverty.
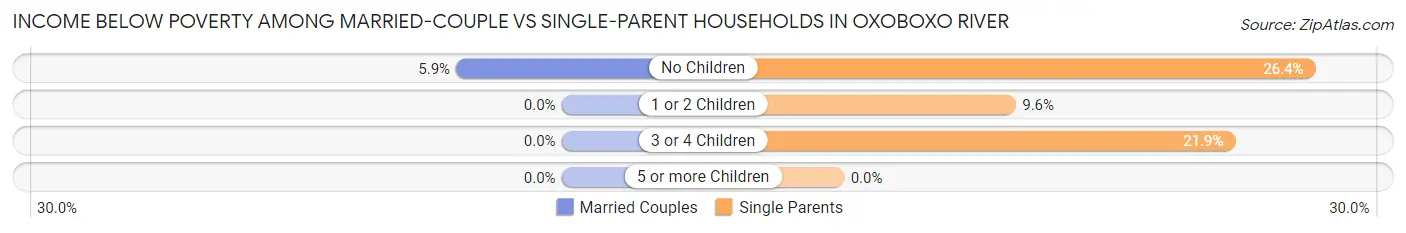
| Children | Married-Couple Families | Single-Parent Households |
| No Children | 22 (5.9%) | 29 (26.4%) |
| 1 or 2 Children | 0 (0.0%) | 7 (9.6%) |
| 3 or 4 Children | 0 (0.0%) | 7 (21.9%) |
| 5 or more Children | 0 (0.0%) | 0 (0.0%) |
| Total | 22 (4.8%) | 43 (20.0%) |
Race in Oxoboxo River
The most populous races in Oxoboxo River are White / Caucasian (2,027 | 83.5%), Two or more Races (188 | 7.7%), and Black / African American (170 | 7.0%).
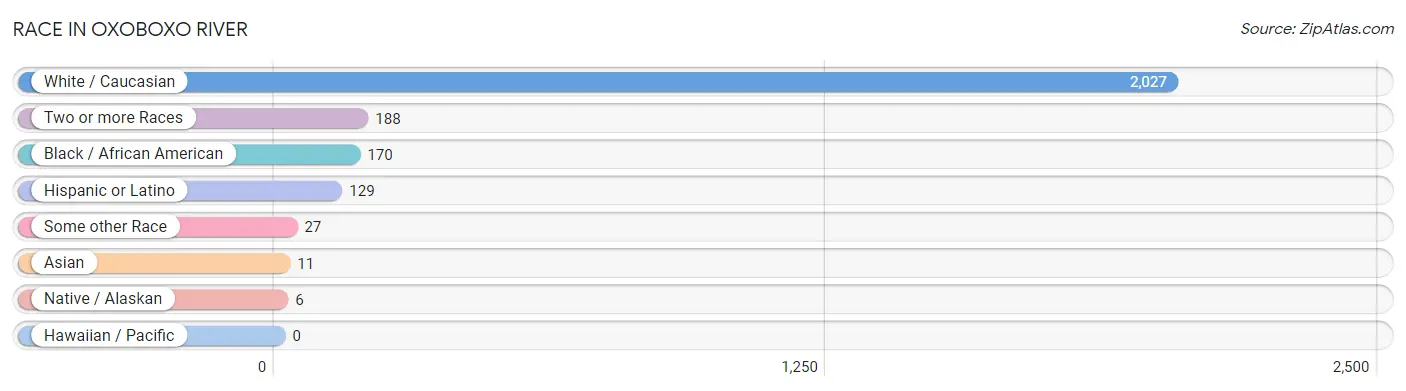
| Race | # Population | % Population |
| Asian | 11 | 0.4% |
| Black / African American | 170 | 7.0% |
| Hawaiian / Pacific | 0 | 0.0% |
| Hispanic or Latino | 129 | 5.3% |
| Native / Alaskan | 6 | 0.3% |
| White / Caucasian | 2,027 | 83.5% |
| Two or more Races | 188 | 7.7% |
| Some other Race | 27 | 1.1% |
| Total | 2,429 | 100.0% |
Ancestry in Oxoboxo River
The most populous ancestries reported in Oxoboxo River are German (379 | 15.6%), Irish (322 | 13.3%), English (294 | 12.1%), Polish (241 | 9.9%), and French (232 | 9.6%), together accounting for 60.4% of all Oxoboxo River residents.
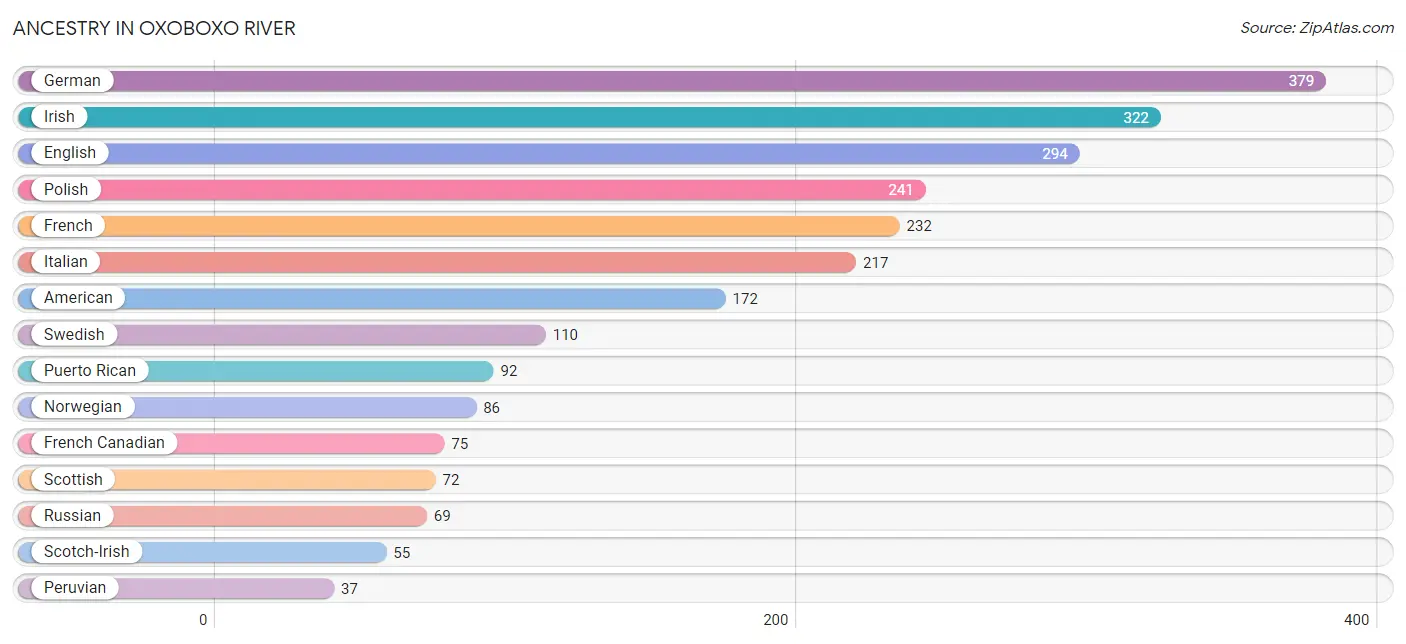
| Ancestry | # Population | % Population |
| American | 172 | 7.1% |
| Arab | 4 | 0.2% |
| Blackfeet | 11 | 0.4% |
| British | 24 | 1.0% |
| Chippewa | 10 | 0.4% |
| Dutch | 13 | 0.5% |
| English | 294 | 12.1% |
| European | 22 | 0.9% |
| Finnish | 12 | 0.5% |
| French | 232 | 9.6% |
| French Canadian | 75 | 3.1% |
| German | 379 | 15.6% |
| Hungarian | 6 | 0.3% |
| Iranian | 10 | 0.4% |
| Irish | 322 | 13.3% |
| Italian | 217 | 8.9% |
| Jamaican | 9 | 0.4% |
| Korean | 19 | 0.8% |
| Lebanese | 4 | 0.2% |
| Lithuanian | 1 | 0.0% |
| Norwegian | 86 | 3.5% |
| Peruvian | 37 | 1.5% |
| Polish | 241 | 9.9% |
| Portuguese | 4 | 0.2% |
| Puerto Rican | 92 | 3.8% |
| Russian | 69 | 2.8% |
| Scotch-Irish | 55 | 2.3% |
| Scottish | 72 | 3.0% |
| South African | 9 | 0.4% |
| South American | 37 | 1.5% |
| Subsaharan African | 9 | 0.4% |
| Swedish | 110 | 4.5% |
| Ukrainian | 18 | 0.7% | View All 33 Rows |
Immigrants in Oxoboxo River
The most numerous immigrant groups reported in Oxoboxo River came from Latin America (40 | 1.7%), Peru (37 | 1.5%), South America (37 | 1.5%), Europe (18 | 0.7%), and Western Europe (18 | 0.7%), together accounting for 6.2% of all Oxoboxo River residents.
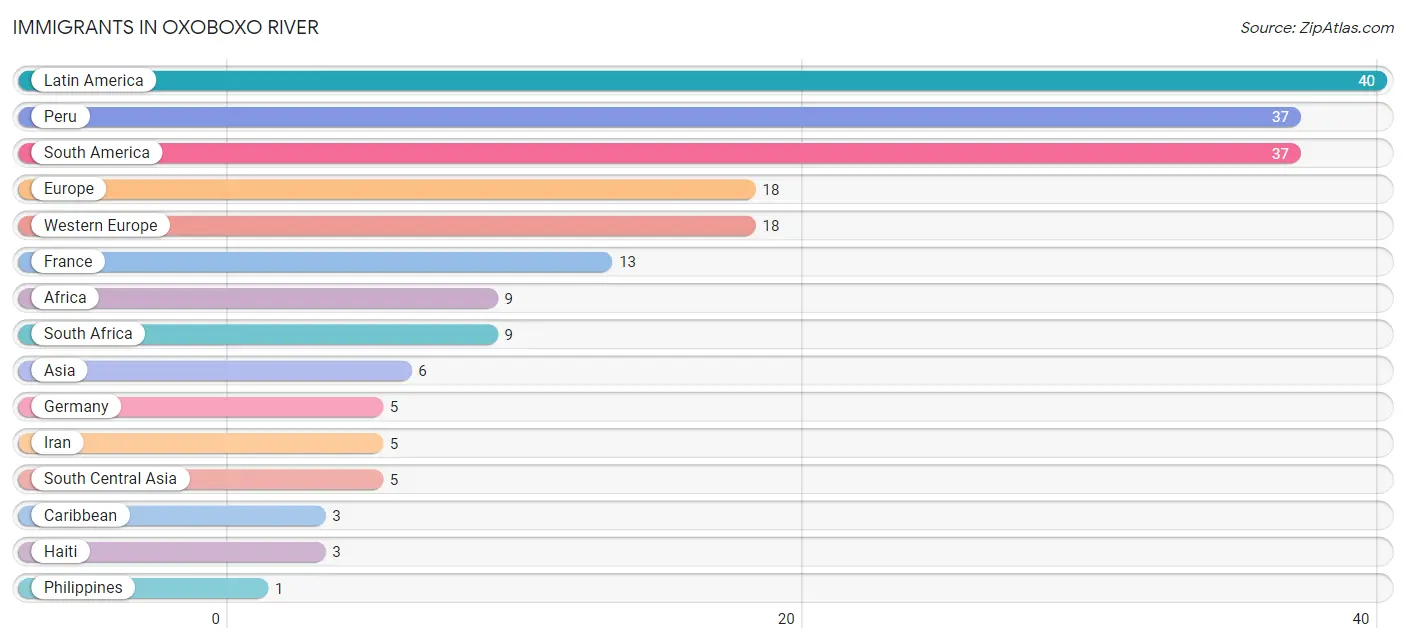
| Immigration Origin | # Population | % Population |
| Africa | 9 | 0.4% |
| Asia | 6 | 0.3% |
| Caribbean | 3 | 0.1% |
| Europe | 18 | 0.7% |
| France | 13 | 0.5% |
| Germany | 5 | 0.2% |
| Haiti | 3 | 0.1% |
| Iran | 5 | 0.2% |
| Latin America | 40 | 1.7% |
| Peru | 37 | 1.5% |
| Philippines | 1 | 0.0% |
| South Africa | 9 | 0.4% |
| South America | 37 | 1.5% |
| South Central Asia | 5 | 0.2% |
| South Eastern Asia | 1 | 0.0% |
| Western Europe | 18 | 0.7% | View All 16 Rows |
Sex and Age in Oxoboxo River
Sex and Age in Oxoboxo River
The most populous age groups in Oxoboxo River are 55 to 59 Years (199 | 16.3%) for men and 55 to 59 Years (173 | 14.3%) for women.
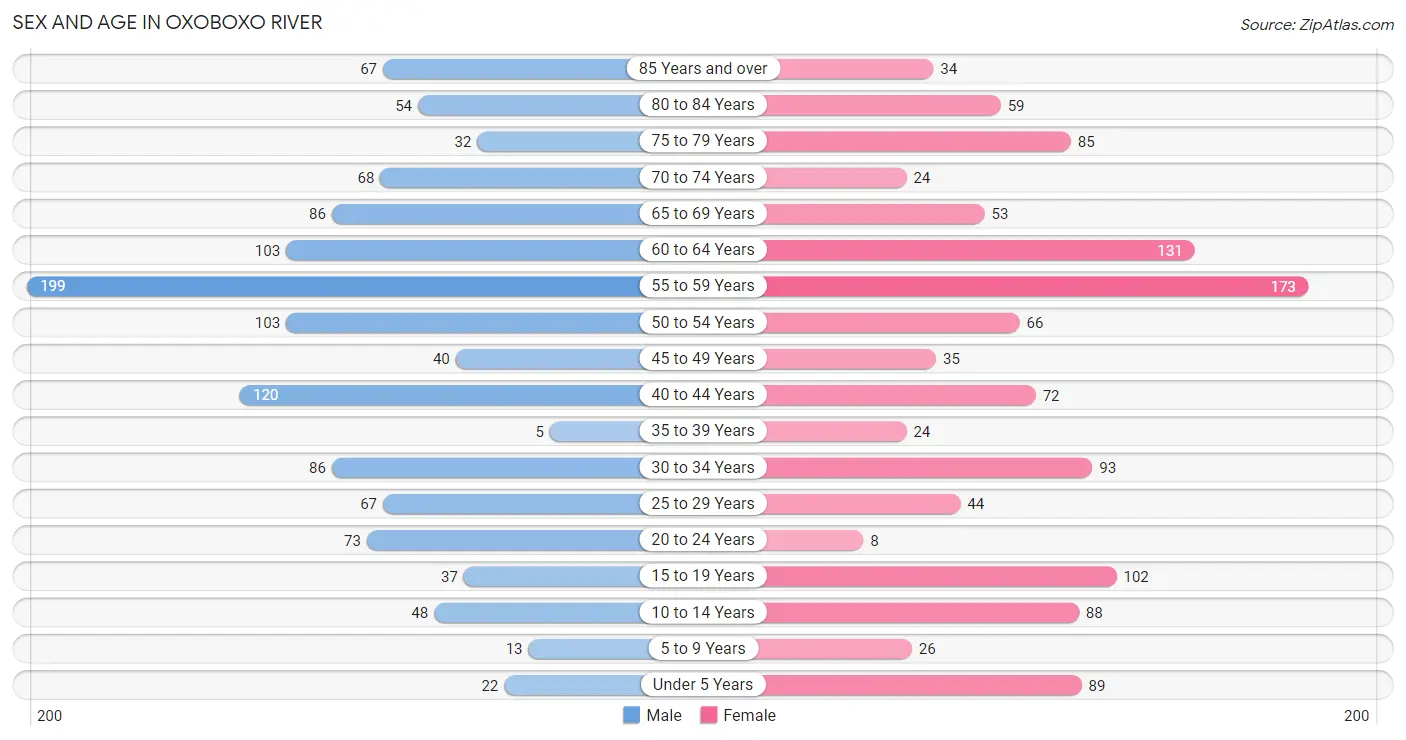
| Age Bracket | Male | Female |
| Under 5 Years | 22 (1.8%) | 89 (7.4%) |
| 5 to 9 Years | 13 (1.1%) | 26 (2.2%) |
| 10 to 14 Years | 48 (3.9%) | 88 (7.3%) |
| 15 to 19 Years | 37 (3.0%) | 102 (8.5%) |
| 20 to 24 Years | 73 (6.0%) | 8 (0.7%) |
| 25 to 29 Years | 67 (5.5%) | 44 (3.6%) |
| 30 to 34 Years | 86 (7.0%) | 93 (7.7%) |
| 35 to 39 Years | 5 (0.4%) | 24 (2.0%) |
| 40 to 44 Years | 120 (9.8%) | 72 (6.0%) |
| 45 to 49 Years | 40 (3.3%) | 35 (2.9%) |
| 50 to 54 Years | 103 (8.4%) | 66 (5.5%) |
| 55 to 59 Years | 199 (16.3%) | 173 (14.3%) |
| 60 to 64 Years | 103 (8.4%) | 131 (10.9%) |
| 65 to 69 Years | 86 (7.0%) | 53 (4.4%) |
| 70 to 74 Years | 68 (5.6%) | 24 (2.0%) |
| 75 to 79 Years | 32 (2.6%) | 85 (7.0%) |
| 80 to 84 Years | 54 (4.4%) | 59 (4.9%) |
| 85 Years and over | 67 (5.5%) | 34 (2.8%) |
| Total | 1,223 (100.0%) | 1,206 (100.0%) |
Families and Households in Oxoboxo River
Median Family Size in Oxoboxo River
The median family size in Oxoboxo River is 2.56 persons per family, with single female/mother families (123 | 18.3%) accounting for the largest median family size of 2.98 persons per family. On the other hand, married-couple families (457 | 68.0%) represent the smallest median family size with 2.45 persons per family.
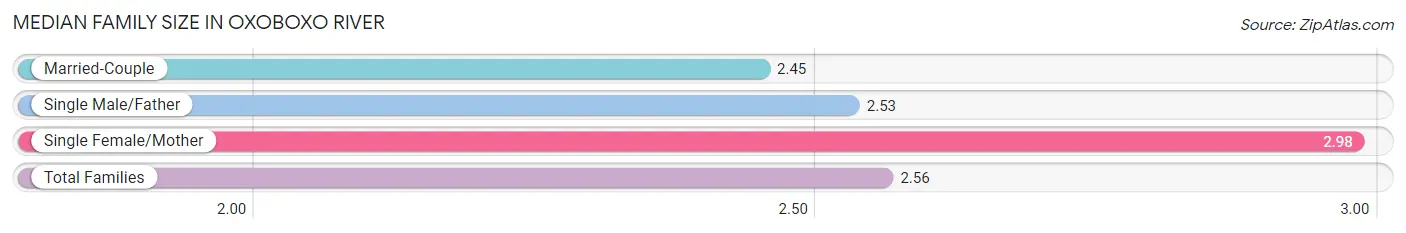
| Family Type | # Families | Family Size |
| Married-Couple | 457 (68.0%) | 2.45 |
| Single Male/Father | 92 (13.7%) | 2.53 |
| Single Female/Mother | 123 (18.3%) | 2.98 |
| Total Families | 672 (100.0%) | 2.56 |
Median Household Size in Oxoboxo River
The median household size in Oxoboxo River is 2.15 persons per household, with single female/mother households (123 | 11.1%) accounting for the largest median household size of 3.42 persons per household. non-family households (439 | 39.5%) represent the smallest median household size with 1.29 persons per household.
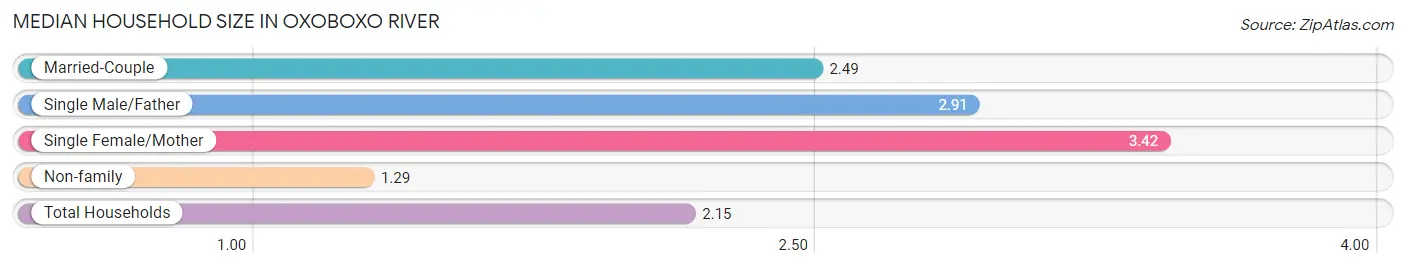
| Household Type | # Households | Household Size |
| Married-Couple | 457 (41.1%) | 2.49 |
| Single Male/Father | 92 (8.3%) | 2.91 |
| Single Female/Mother | 123 (11.1%) | 3.42 |
| Non-family | 439 (39.5%) | 1.29 |
| Total Households | 1,111 (100.0%) | 2.15 |
Household Size by Marriage Status in Oxoboxo River
Out of a total of 1,111 households in Oxoboxo River, 672 (60.5%) are family households, while 439 (39.5%) are nonfamily households. The most numerous type of family households are 2-person households, comprising 455, and the most common type of nonfamily households are 1-person households, comprising 350.
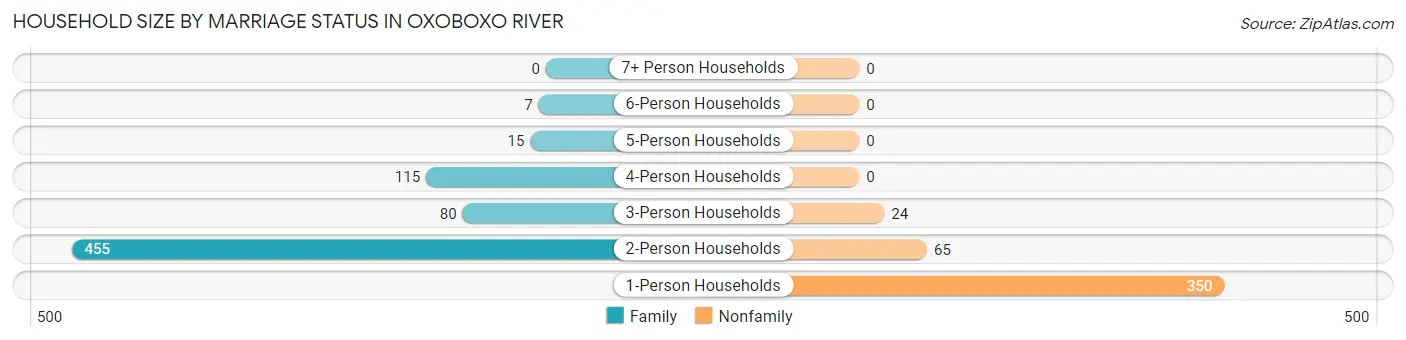
| Household Size | Family Households | Nonfamily Households |
| 1-Person Households | - | 350 (31.5%) |
| 2-Person Households | 455 (40.9%) | 65 (5.9%) |
| 3-Person Households | 80 (7.2%) | 24 (2.2%) |
| 4-Person Households | 115 (10.3%) | 0 (0.0%) |
| 5-Person Households | 15 (1.3%) | 0 (0.0%) |
| 6-Person Households | 7 (0.6%) | 0 (0.0%) |
| 7+ Person Households | 0 (0.0%) | 0 (0.0%) |
| Total | 672 (60.5%) | 439 (39.5%) |
Female Fertility in Oxoboxo River
Fertility by Age in Oxoboxo River
Average fertility rate in Oxoboxo River is 77.0 births per 1,000 women. Women in the age bracket of 20 to 34 years have the highest fertility rate with 214.0 births per 1,000 women. Women in the age bracket of 20 to 34 years acount for 100.0% of all women with births.
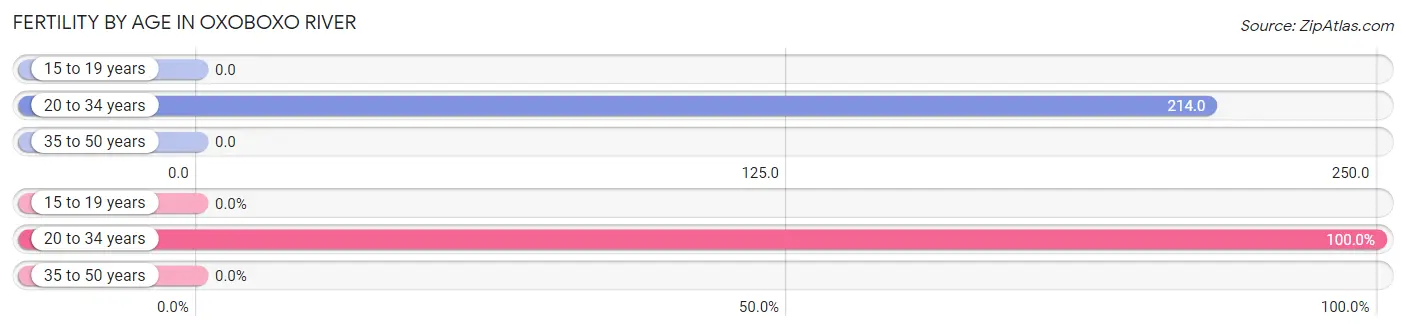
| Age Bracket | Women with Births | Births / 1,000 Women |
| 15 to 19 years | 0 (0.0%) | 0.0 |
| 20 to 34 years | 31 (100.0%) | 214.0 |
| 35 to 50 years | 0 (0.0%) | 0.0 |
| Total | 31 (100.0%) | 77.0 |
Fertility by Age by Marriage Status in Oxoboxo River
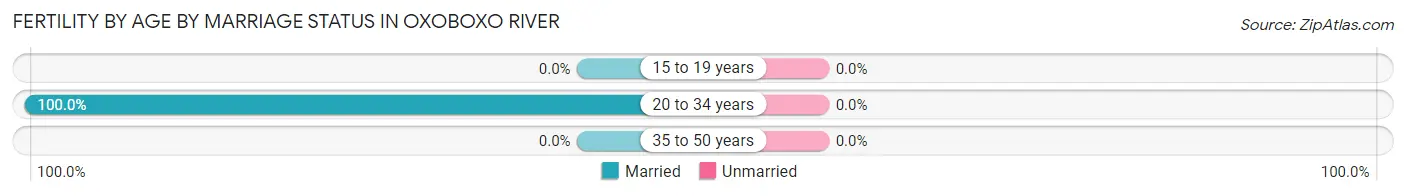
| Age Bracket | Married | Unmarried |
| 15 to 19 years | 0 (0.0%) | 0 (0.0%) |
| 20 to 34 years | 31 (100.0%) | 0 (0.0%) |
| 35 to 50 years | 0 (0.0%) | 0 (0.0%) |
| Total | 31 (100.0%) | 0 (0.0%) |
Fertility by Education in Oxoboxo River
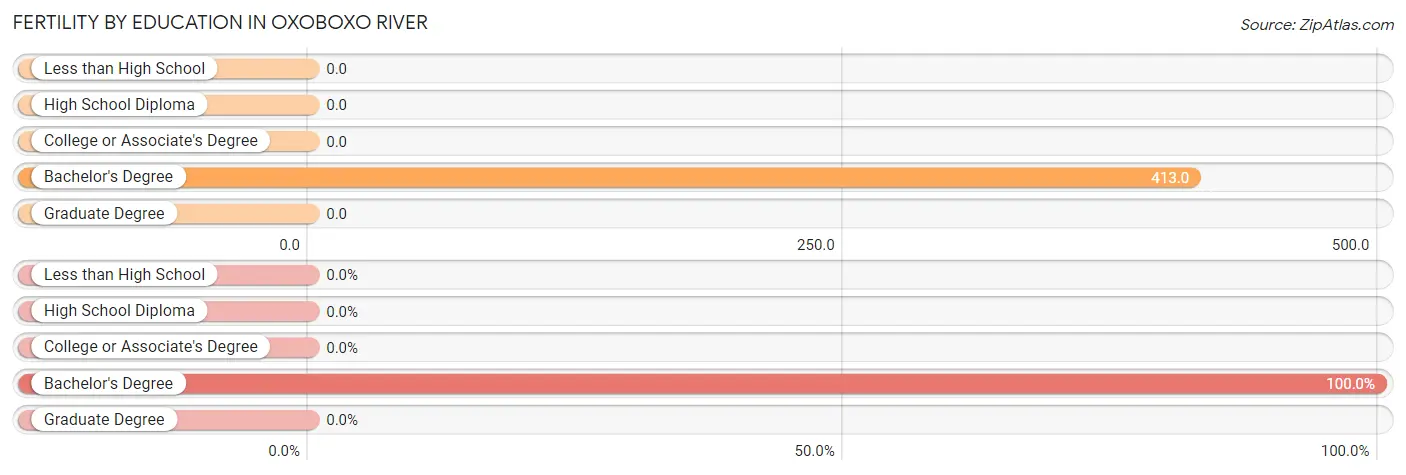
| Educational Attainment | Women with Births | Births / 1,000 Women |
| Less than High School | 0 (0.0%) | 0.0 |
| High School Diploma | 0 (0.0%) | 0.0 |
| College or Associate's Degree | 0 (0.0%) | 0.0 |
| Bachelor's Degree | 31 (100.0%) | 413.0 |
| Graduate Degree | 0 (0.0%) | 0.0 |
| Total | 31 (100.0%) | 77.0 |
Fertility by Education by Marriage Status in Oxoboxo River
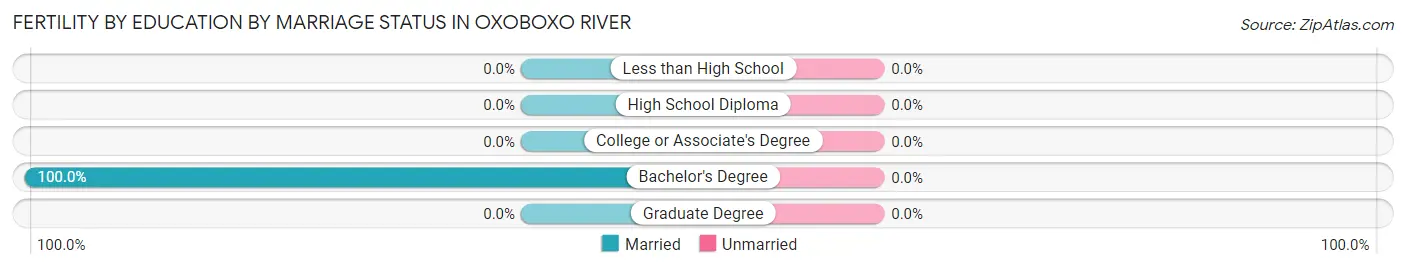
| Educational Attainment | Married | Unmarried |
| Less than High School | 0 (0.0%) | 0 (0.0%) |
| High School Diploma | 0 (0.0%) | 0 (0.0%) |
| College or Associate's Degree | 0 (0.0%) | 0 (0.0%) |
| Bachelor's Degree | 31 (100.0%) | 0 (0.0%) |
| Graduate Degree | 0 (0.0%) | 0 (0.0%) |
| Total | 31 (100.0%) | 0 (0.0%) |
Employment Characteristics in Oxoboxo River
Employment by Class of Employer in Oxoboxo River
Among the 1,087 employed individuals in Oxoboxo River, private company employees (783 | 72.0%), local government employees (99 | 9.1%), and self-employed (not incorporated) (75 | 6.9%) make up the most common classes of employment.
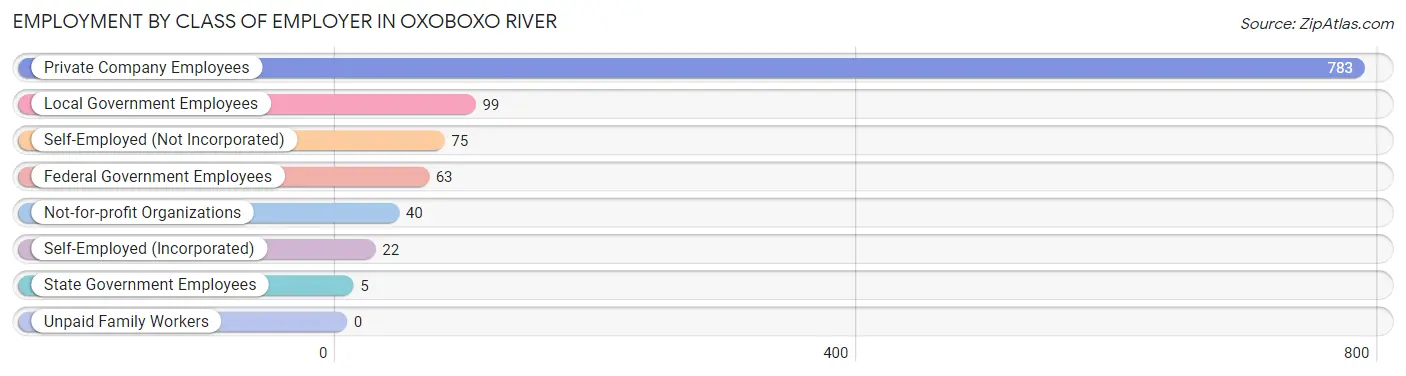
| Employer Class | # Employees | % Employees |
| Private Company Employees | 783 | 72.0% |
| Self-Employed (Incorporated) | 22 | 2.0% |
| Self-Employed (Not Incorporated) | 75 | 6.9% |
| Not-for-profit Organizations | 40 | 3.7% |
| Local Government Employees | 99 | 9.1% |
| State Government Employees | 5 | 0.5% |
| Federal Government Employees | 63 | 5.8% |
| Unpaid Family Workers | 0 | 0.0% |
| Total | 1,087 | 100.0% |
Employment Status by Age in Oxoboxo River
According to the labor force statistics for Oxoboxo River, out of the total population over 16 years of age (2,104), 57.5% or 1,210 individuals are in the labor force, with 6.9% or 83 of them unemployed. The age group with the highest labor force participation rate is 30 to 34 years, with 100.0% or 179 individuals in the labor force. Within the labor force, the 20 to 24 years age range has the highest percentage of unemployed individuals, with 21.1% or 16 of them being unemployed.
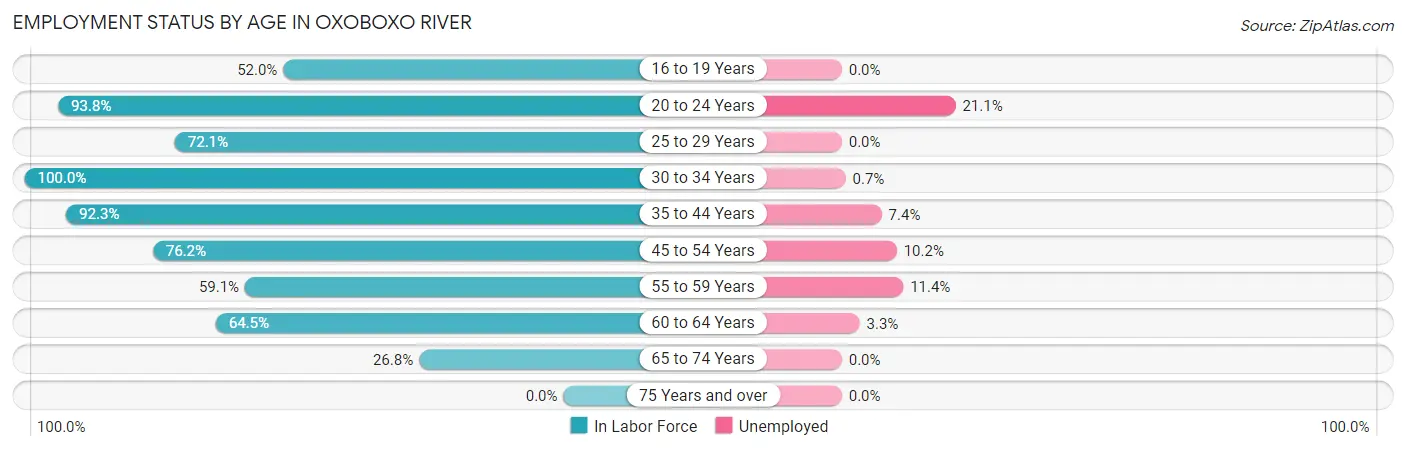
| Age Bracket | In Labor Force | Unemployed |
| 16 to 19 Years | 52 (52.0%) | 0 (0.0%) |
| 20 to 24 Years | 76 (93.8%) | 16 (21.1%) |
| 25 to 29 Years | 80 (72.1%) | 0 (0.0%) |
| 30 to 34 Years | 179 (100.0%) | 1 (0.7%) |
| 35 to 44 Years | 204 (92.3%) | 15 (7.4%) |
| 45 to 54 Years | 186 (76.2%) | 19 (10.2%) |
| 55 to 59 Years | 220 (59.1%) | 25 (11.4%) |
| 60 to 64 Years | 151 (64.5%) | 5 (3.3%) |
| 65 to 74 Years | 62 (26.8%) | 0 (0.0%) |
| 75 Years and over | 0 (0.0%) | 0 (0.0%) |
| Total | 1,210 (57.5%) | 83 (6.9%) |
Employment Status by Educational Attainment in Oxoboxo River
According to labor force statistics for Oxoboxo River, 74.9% of individuals (1,019) out of the total population between 25 and 64 years of age (1,361) are in the labor force, with 6.6% or 67 of them being unemployed. The group with the highest labor force participation rate are those with the educational attainment of college / associate degree, with 83.0% or 385 individuals in the labor force. Within the labor force, individuals with high school diploma education have the highest percentage of unemployment, with 15.0% or 65 of them being unemployed.
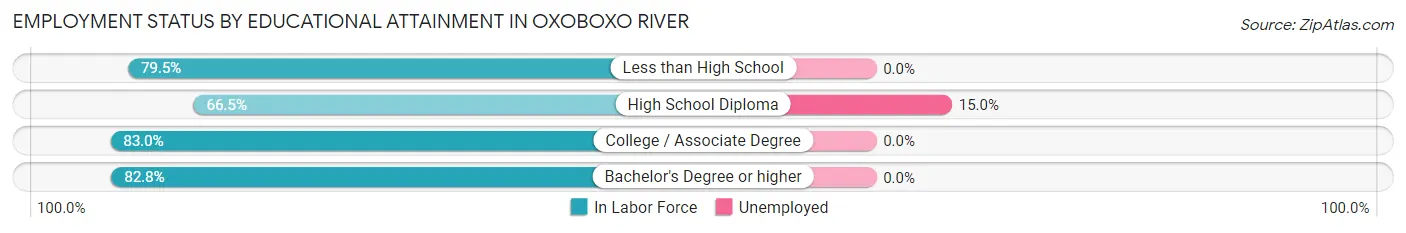
| Educational Attainment | In Labor Force | Unemployed |
| Less than High School | 35 (79.5%) | 0 (0.0%) |
| High School Diploma | 432 (66.5%) | 98 (15.0%) |
| College / Associate Degree | 385 (83.0%) | 0 (0.0%) |
| Bachelor's Degree or higher | 168 (82.8%) | 0 (0.0%) |
| Total | 1,019 (74.9%) | 90 (6.6%) |
Employment Occupations by Sex in Oxoboxo River
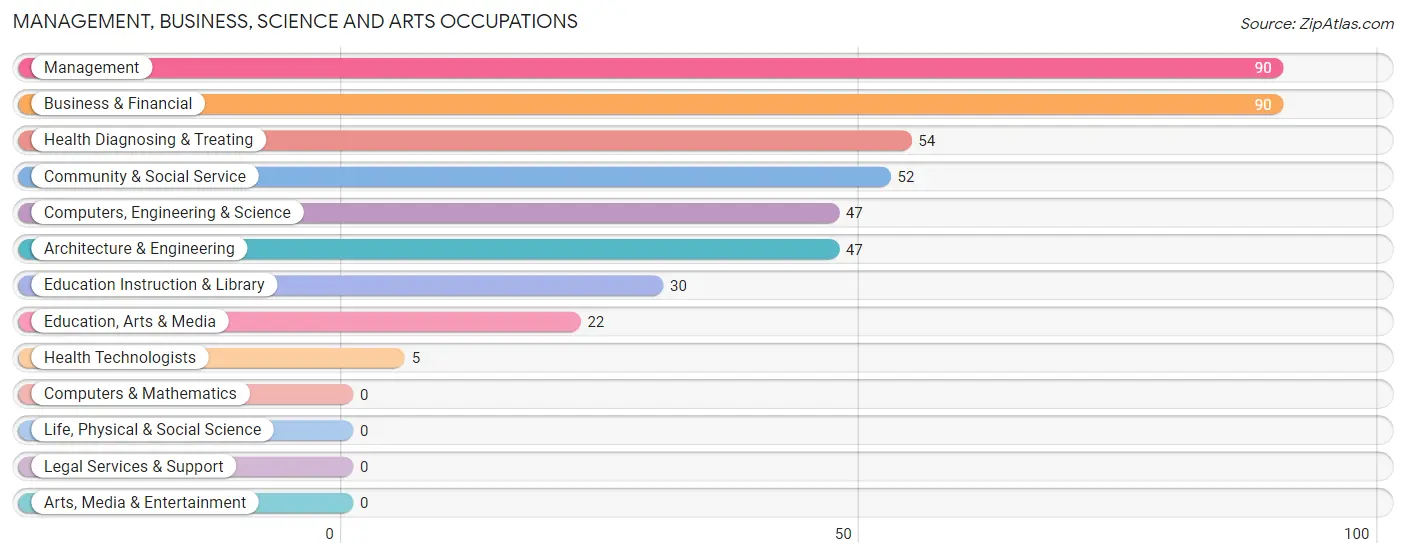
Management, Business, Science and Arts Occupations
The most common Management, Business, Science and Arts occupations in Oxoboxo River are Management (90 | 8.2%), Business & Financial (90 | 8.2%), Health Diagnosing & Treating (54 | 4.9%), Community & Social Service (52 | 4.7%), and Computers, Engineering & Science (47 | 4.3%).
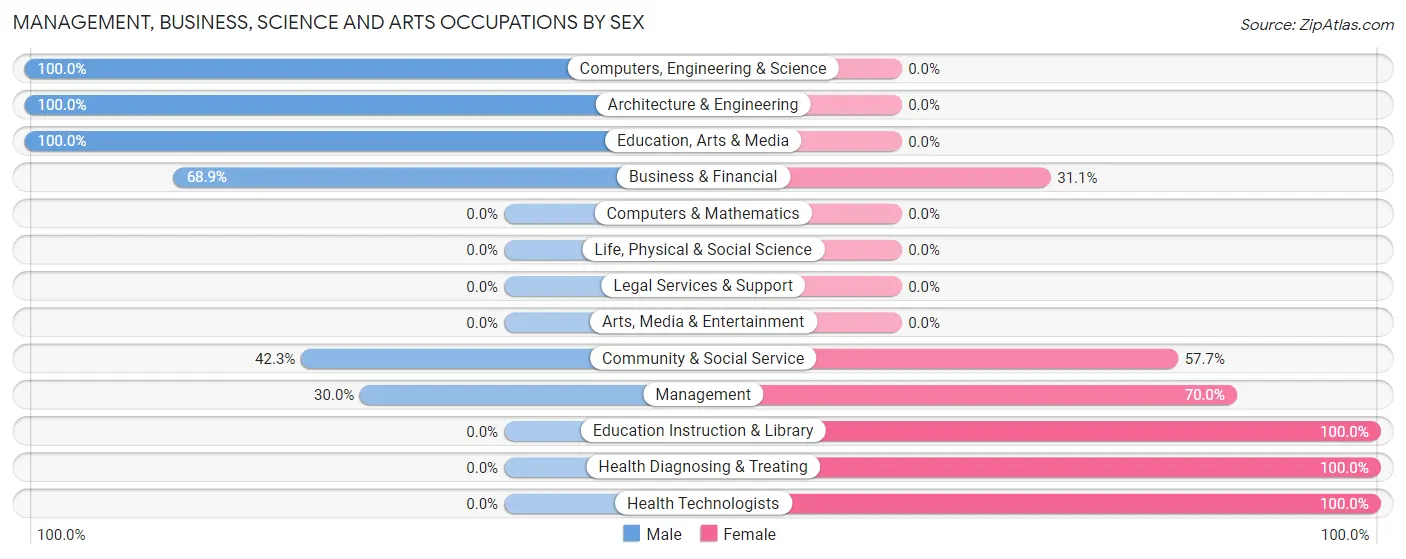
Management, Business, Science and Arts Occupations by Sex
Within the Management, Business, Science and Arts occupations in Oxoboxo River, the most male-oriented occupations are Computers, Engineering & Science (100.0%), Architecture & Engineering (100.0%), and Education, Arts & Media (100.0%), while the most female-oriented occupations are Education Instruction & Library (100.0%), Health Diagnosing & Treating (100.0%), and Health Technologists (100.0%).
| Occupation | Male | Female |
| Management | 27 (30.0%) | 63 (70.0%) |
| Business & Financial | 62 (68.9%) | 28 (31.1%) |
| Computers, Engineering & Science | 47 (100.0%) | 0 (0.0%) |
| Computers & Mathematics | 0 (0.0%) | 0 (0.0%) |
| Architecture & Engineering | 47 (100.0%) | 0 (0.0%) |
| Life, Physical & Social Science | 0 (0.0%) | 0 (0.0%) |
| Community & Social Service | 22 (42.3%) | 30 (57.7%) |
| Education, Arts & Media | 22 (100.0%) | 0 (0.0%) |
| Legal Services & Support | 0 (0.0%) | 0 (0.0%) |
| Education Instruction & Library | 0 (0.0%) | 30 (100.0%) |
| Arts, Media & Entertainment | 0 (0.0%) | 0 (0.0%) |
| Health Diagnosing & Treating | 0 (0.0%) | 54 (100.0%) |
| Health Technologists | 0 (0.0%) | 5 (100.0%) |
| Total (Category) | 158 (47.4%) | 175 (52.5%) |
| Total (Overall) | 567 (51.5%) | 533 (48.4%) |
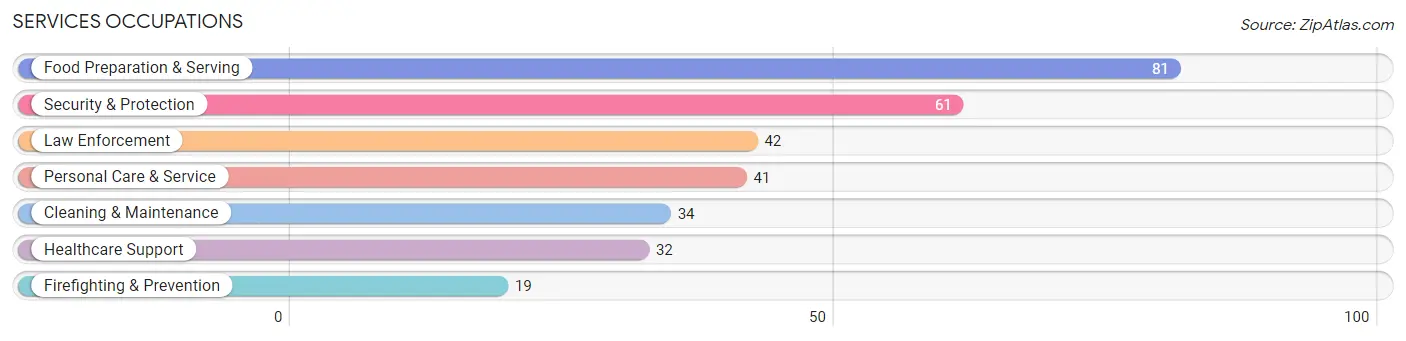
Services Occupations
The most common Services occupations in Oxoboxo River are Food Preparation & Serving (81 | 7.4%), Security & Protection (61 | 5.6%), Law Enforcement (42 | 3.8%), Personal Care & Service (41 | 3.7%), and Cleaning & Maintenance (34 | 3.1%).
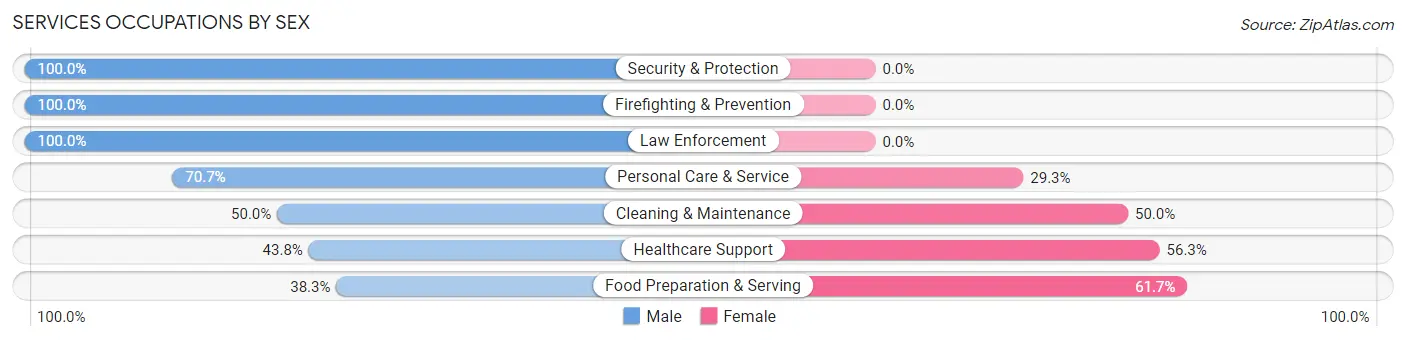
Services Occupations by Sex
Within the Services occupations in Oxoboxo River, the most male-oriented occupations are Security & Protection (100.0%), Firefighting & Prevention (100.0%), and Law Enforcement (100.0%), while the most female-oriented occupations are Food Preparation & Serving (61.7%), Healthcare Support (56.2%), and Cleaning & Maintenance (50.0%).
| Occupation | Male | Female |
| Healthcare Support | 14 (43.8%) | 18 (56.2%) |
| Security & Protection | 61 (100.0%) | 0 (0.0%) |
| Firefighting & Prevention | 19 (100.0%) | 0 (0.0%) |
| Law Enforcement | 42 (100.0%) | 0 (0.0%) |
| Food Preparation & Serving | 31 (38.3%) | 50 (61.7%) |
| Cleaning & Maintenance | 17 (50.0%) | 17 (50.0%) |
| Personal Care & Service | 29 (70.7%) | 12 (29.3%) |
| Total (Category) | 152 (61.0%) | 97 (39.0%) |
| Total (Overall) | 567 (51.5%) | 533 (48.4%) |
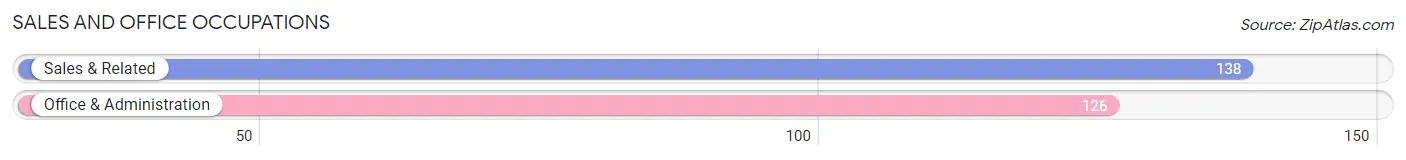
Sales and Office Occupations
The most common Sales and Office occupations in Oxoboxo River are Sales & Related (138 | 12.6%), and Office & Administration (126 | 11.5%).
Sales and Office Occupations by Sex
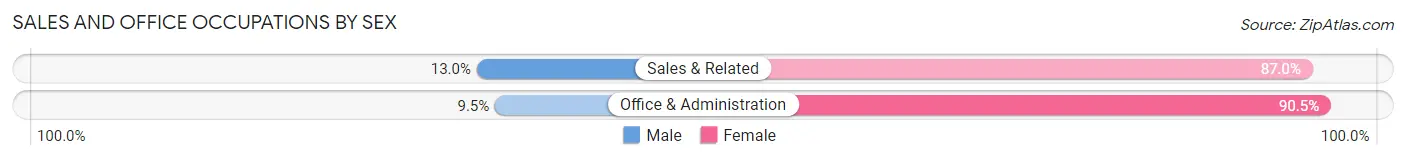
| Occupation | Male | Female |
| Sales & Related | 18 (13.0%) | 120 (87.0%) |
| Office & Administration | 12 (9.5%) | 114 (90.5%) |
| Total (Category) | 30 (11.4%) | 234 (88.6%) |
| Total (Overall) | 567 (51.5%) | 533 (48.4%) |
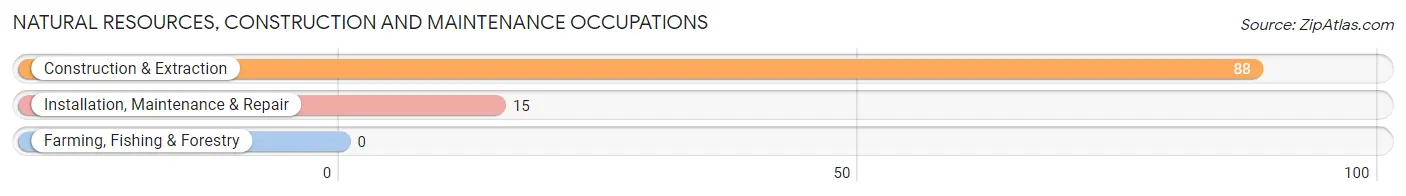
Natural Resources, Construction and Maintenance Occupations
The most common Natural Resources, Construction and Maintenance occupations in Oxoboxo River are Construction & Extraction (88 | 8.0%), and Installation, Maintenance & Repair (15 | 1.4%).
Natural Resources, Construction and Maintenance Occupations by Sex
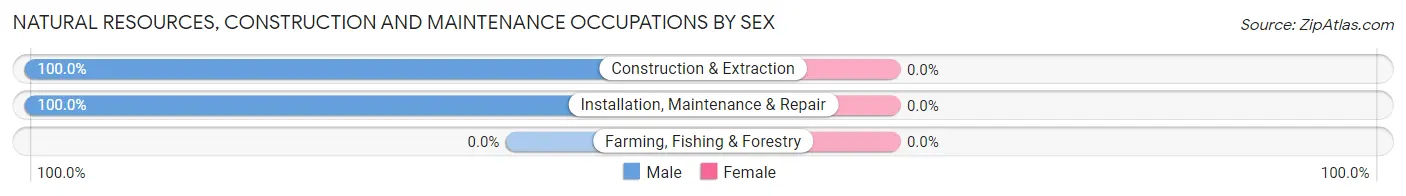
| Occupation | Male | Female |
| Farming, Fishing & Forestry | 0 (0.0%) | 0 (0.0%) |
| Construction & Extraction | 88 (100.0%) | 0 (0.0%) |
| Installation, Maintenance & Repair | 15 (100.0%) | 0 (0.0%) |
| Total (Category) | 103 (100.0%) | 0 (0.0%) |
| Total (Overall) | 567 (51.5%) | 533 (48.4%) |
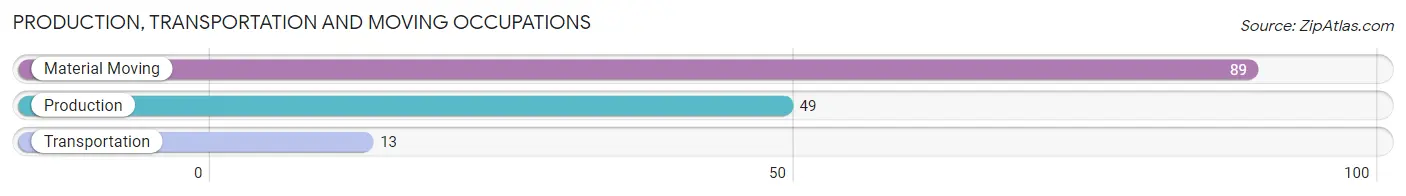
Production, Transportation and Moving Occupations
The most common Production, Transportation and Moving occupations in Oxoboxo River are Material Moving (89 | 8.1%), Production (49 | 4.4%), and Transportation (13 | 1.2%).
Production, Transportation and Moving Occupations by Sex
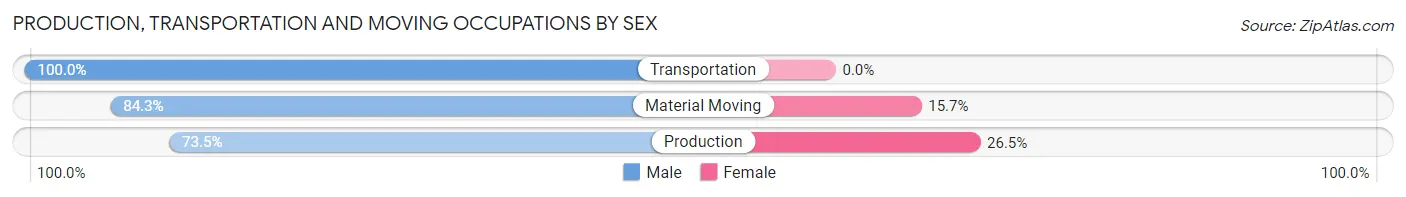
| Occupation | Male | Female |
| Production | 36 (73.5%) | 13 (26.5%) |
| Transportation | 13 (100.0%) | 0 (0.0%) |
| Material Moving | 75 (84.3%) | 14 (15.7%) |
| Total (Category) | 124 (82.1%) | 27 (17.9%) |
| Total (Overall) | 567 (51.5%) | 533 (48.4%) |
Employment Industries by Sex in Oxoboxo River
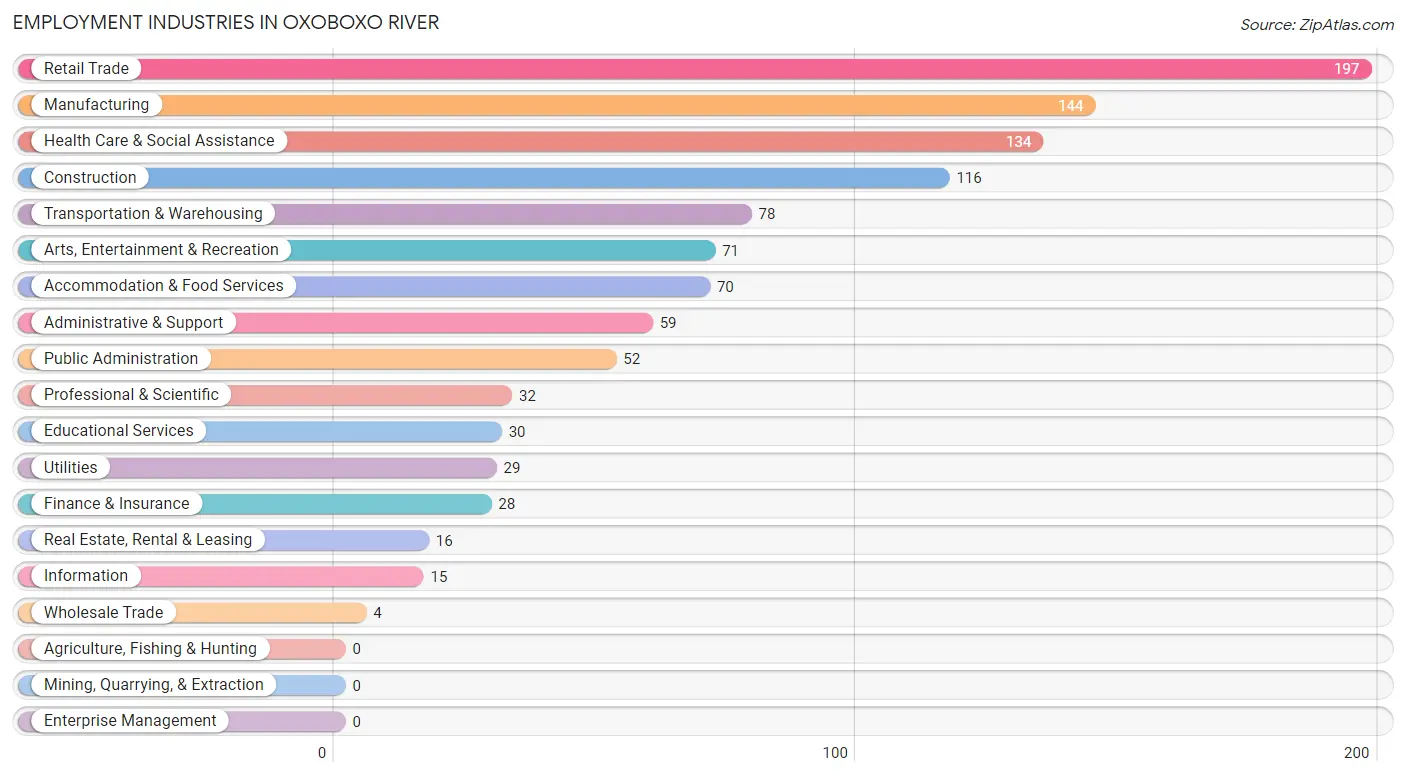
Employment Industries in Oxoboxo River
The major employment industries in Oxoboxo River include Retail Trade (197 | 17.9%), Manufacturing (144 | 13.1%), Health Care & Social Assistance (134 | 12.2%), Construction (116 | 10.5%), and Transportation & Warehousing (78 | 7.1%).
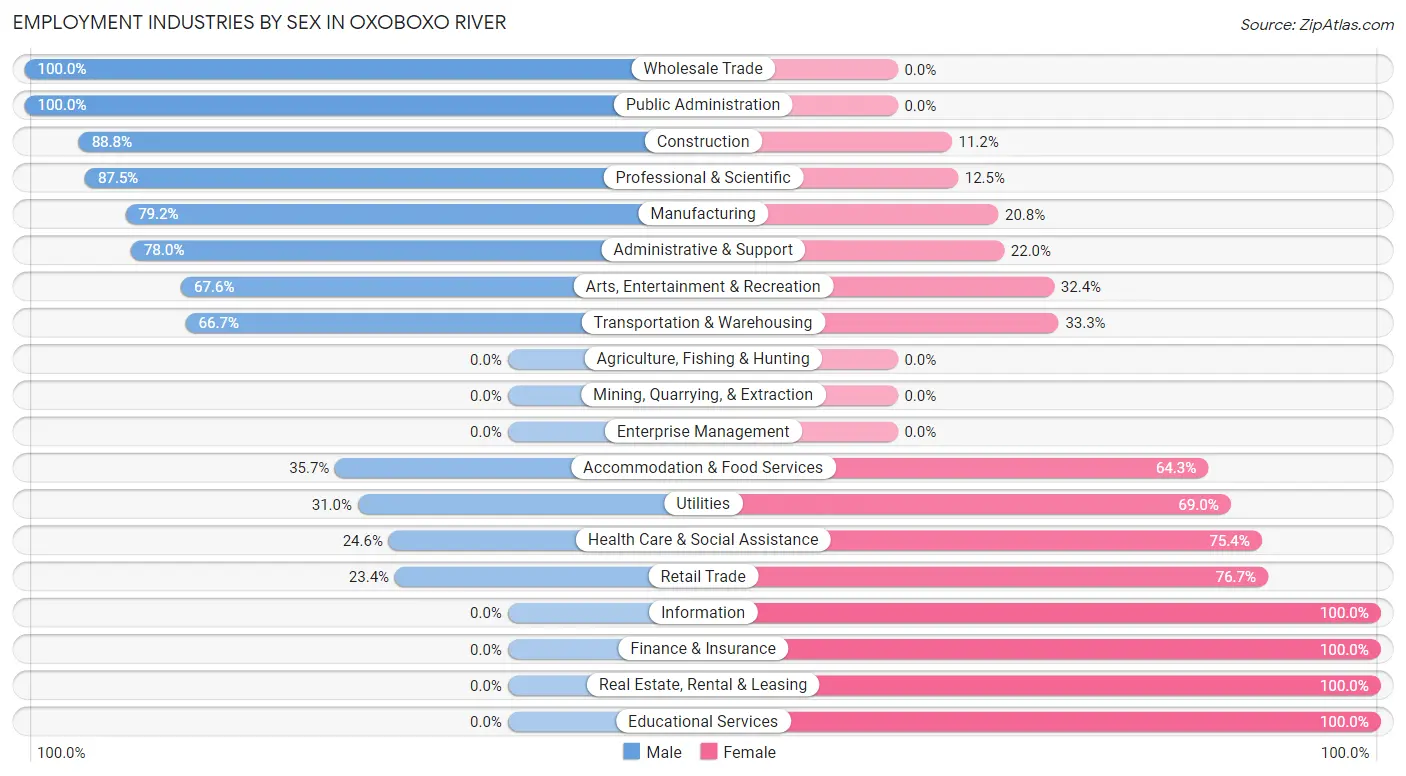
Employment Industries by Sex in Oxoboxo River
The Oxoboxo River industries that see more men than women are Wholesale Trade (100.0%), Public Administration (100.0%), and Construction (88.8%), whereas the industries that tend to have a higher number of women are Information (100.0%), Finance & Insurance (100.0%), and Real Estate, Rental & Leasing (100.0%).
| Industry | Male | Female |
| Agriculture, Fishing & Hunting | 0 (0.0%) | 0 (0.0%) |
| Mining, Quarrying, & Extraction | 0 (0.0%) | 0 (0.0%) |
| Construction | 103 (88.8%) | 13 (11.2%) |
| Manufacturing | 114 (79.2%) | 30 (20.8%) |
| Wholesale Trade | 4 (100.0%) | 0 (0.0%) |
| Retail Trade | 46 (23.4%) | 151 (76.6%) |
| Transportation & Warehousing | 52 (66.7%) | 26 (33.3%) |
| Utilities | 9 (31.0%) | 20 (69.0%) |
| Information | 0 (0.0%) | 15 (100.0%) |
| Finance & Insurance | 0 (0.0%) | 28 (100.0%) |
| Real Estate, Rental & Leasing | 0 (0.0%) | 16 (100.0%) |
| Professional & Scientific | 28 (87.5%) | 4 (12.5%) |
| Enterprise Management | 0 (0.0%) | 0 (0.0%) |
| Administrative & Support | 46 (78.0%) | 13 (22.0%) |
| Educational Services | 0 (0.0%) | 30 (100.0%) |
| Health Care & Social Assistance | 33 (24.6%) | 101 (75.4%) |
| Arts, Entertainment & Recreation | 48 (67.6%) | 23 (32.4%) |
| Accommodation & Food Services | 25 (35.7%) | 45 (64.3%) |
| Public Administration | 52 (100.0%) | 0 (0.0%) |
| Total | 567 (51.5%) | 533 (48.4%) |
Education in Oxoboxo River
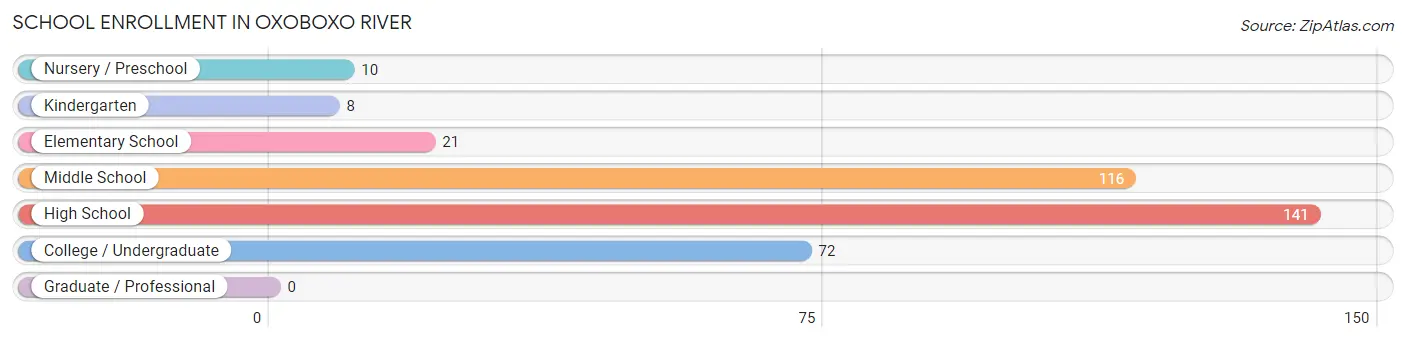
School Enrollment in Oxoboxo River
The most common levels of schooling among the 368 students in Oxoboxo River are high school (141 | 38.3%), middle school (116 | 31.5%), and college / undergraduate (72 | 19.6%).
| School Level | # Students | % Students |
| Nursery / Preschool | 10 | 2.7% |
| Kindergarten | 8 | 2.2% |
| Elementary School | 21 | 5.7% |
| Middle School | 116 | 31.5% |
| High School | 141 | 38.3% |
| College / Undergraduate | 72 | 19.6% |
| Graduate / Professional | 0 | 0.0% |
| Total | 368 | 100.0% |
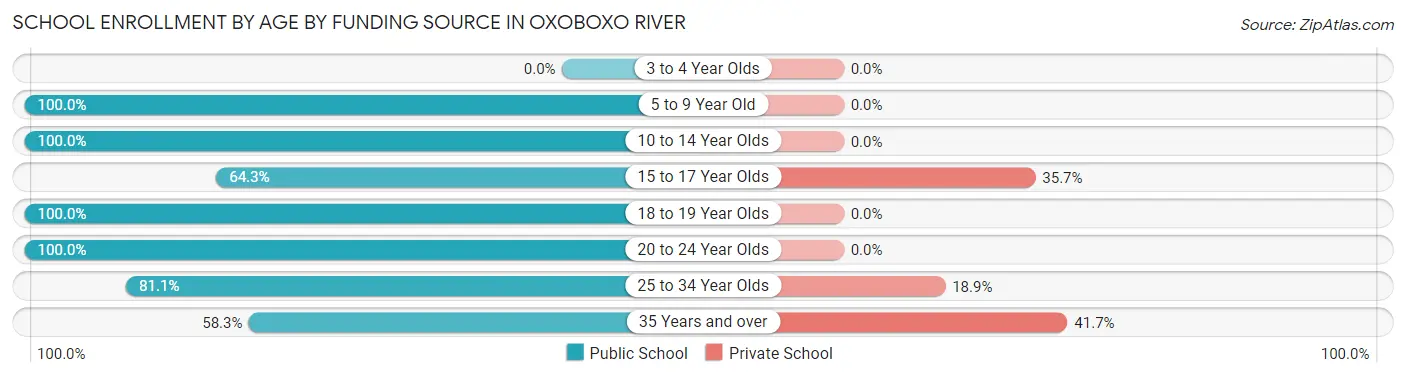
School Enrollment by Age by Funding Source in Oxoboxo River
Out of a total of 368 students who are enrolled in schools in Oxoboxo River, 52 (14.1%) attend a private institution, while the remaining 316 (85.9%) are enrolled in public schools. The age group of 35 years and over has the highest likelihood of being enrolled in private schools, with 5 (41.7% in the age bracket) enrolled. Conversely, the age group of 5 to 9 year old has the lowest likelihood of being enrolled in a private school, with 39 (100.0% in the age bracket) attending a public institution.
| Age Bracket | Public School | Private School |
| 3 to 4 Year Olds | 0 (0.0%) | 0 (0.0%) |
| 5 to 9 Year Old | 39 (100.0%) | 0 (0.0%) |
| 10 to 14 Year Olds | 136 (100.0%) | 0 (0.0%) |
| 15 to 17 Year Olds | 72 (64.3%) | 40 (35.7%) |
| 18 to 19 Year Olds | 27 (100.0%) | 0 (0.0%) |
| 20 to 24 Year Olds | 5 (100.0%) | 0 (0.0%) |
| 25 to 34 Year Olds | 30 (81.1%) | 7 (18.9%) |
| 35 Years and over | 7 (58.3%) | 5 (41.7%) |
| Total | 316 (85.9%) | 52 (14.1%) |
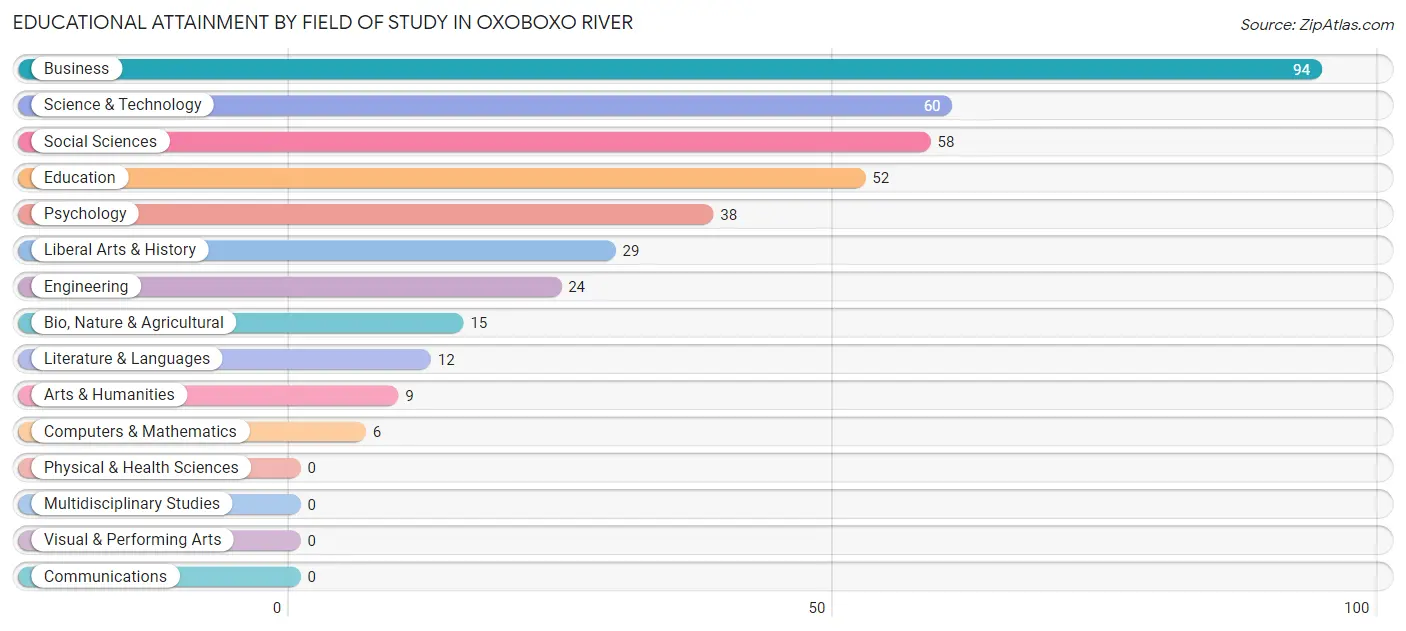
Educational Attainment by Field of Study in Oxoboxo River
Business (94 | 23.7%), science & technology (60 | 15.1%), social sciences (58 | 14.6%), education (52 | 13.1%), and psychology (38 | 9.6%) are the most common fields of study among 397 individuals in Oxoboxo River who have obtained a bachelor's degree or higher.
| Field of Study | # Graduates | % Graduates |
| Computers & Mathematics | 6 | 1.5% |
| Bio, Nature & Agricultural | 15 | 3.8% |
| Physical & Health Sciences | 0 | 0.0% |
| Psychology | 38 | 9.6% |
| Social Sciences | 58 | 14.6% |
| Engineering | 24 | 6.0% |
| Multidisciplinary Studies | 0 | 0.0% |
| Science & Technology | 60 | 15.1% |
| Business | 94 | 23.7% |
| Education | 52 | 13.1% |
| Literature & Languages | 12 | 3.0% |
| Liberal Arts & History | 29 | 7.3% |
| Visual & Performing Arts | 0 | 0.0% |
| Communications | 0 | 0.0% |
| Arts & Humanities | 9 | 2.3% |
| Total | 397 | 100.0% |
Transportation & Commute in Oxoboxo River
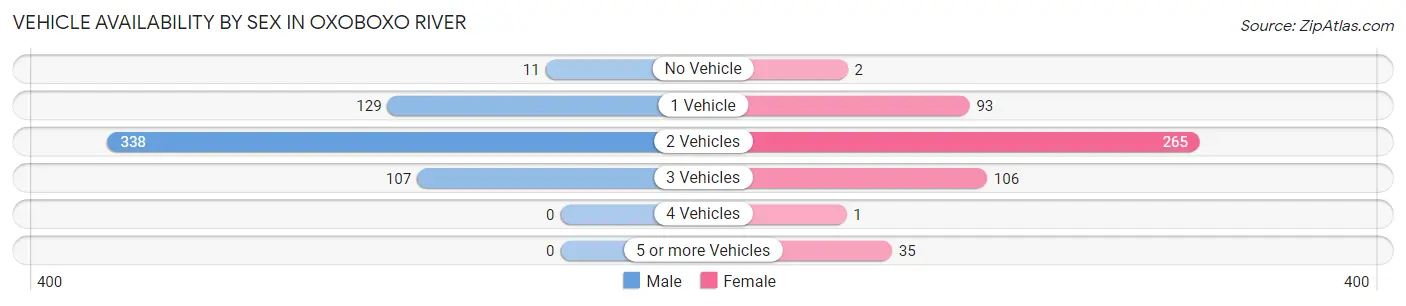
Vehicle Availability by Sex in Oxoboxo River
The most prevalent vehicle ownership categories in Oxoboxo River are males with 2 vehicles (338, accounting for 57.8%) and females with 2 vehicles (265, making up 67.3%).
| Vehicles Available | Male | Female |
| No Vehicle | 11 (1.9%) | 2 (0.4%) |
| 1 Vehicle | 129 (22.1%) | 93 (18.5%) |
| 2 Vehicles | 338 (57.8%) | 265 (52.8%) |
| 3 Vehicles | 107 (18.3%) | 106 (21.1%) |
| 4 Vehicles | 0 (0.0%) | 1 (0.2%) |
| 5 or more Vehicles | 0 (0.0%) | 35 (7.0%) |
| Total | 585 (100.0%) | 502 (100.0%) |
Commute Time in Oxoboxo River
The most frequently occuring commute durations in Oxoboxo River are 20 to 24 minutes (261 commuters, 26.3%), 10 to 14 minutes (223 commuters, 22.5%), and 15 to 19 minutes (129 commuters, 13.0%).
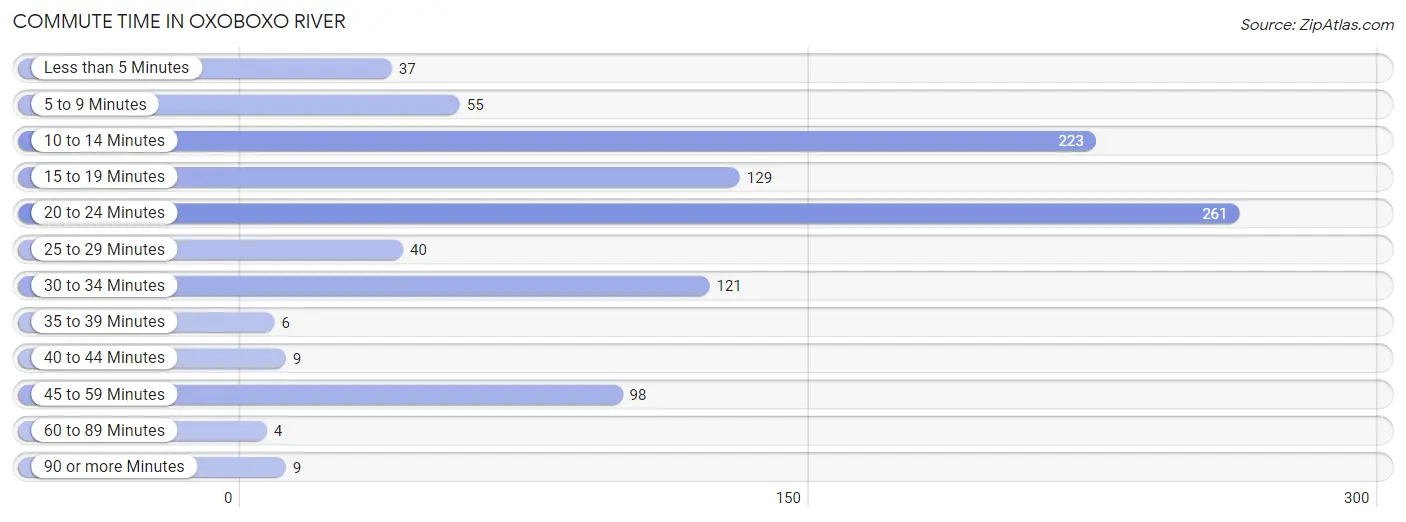
| Commute Time | # Commuters | % Commuters |
| Less than 5 Minutes | 37 | 3.7% |
| 5 to 9 Minutes | 55 | 5.5% |
| 10 to 14 Minutes | 223 | 22.5% |
| 15 to 19 Minutes | 129 | 13.0% |
| 20 to 24 Minutes | 261 | 26.3% |
| 25 to 29 Minutes | 40 | 4.0% |
| 30 to 34 Minutes | 121 | 12.2% |
| 35 to 39 Minutes | 6 | 0.6% |
| 40 to 44 Minutes | 9 | 0.9% |
| 45 to 59 Minutes | 98 | 9.9% |
| 60 to 89 Minutes | 4 | 0.4% |
| 90 or more Minutes | 9 | 0.9% |
Commute Time by Sex in Oxoboxo River
The most common commute times in Oxoboxo River are 20 to 24 minutes (110 commuters, 21.0%) for males and 10 to 14 minutes (169 commuters, 36.0%) for females.
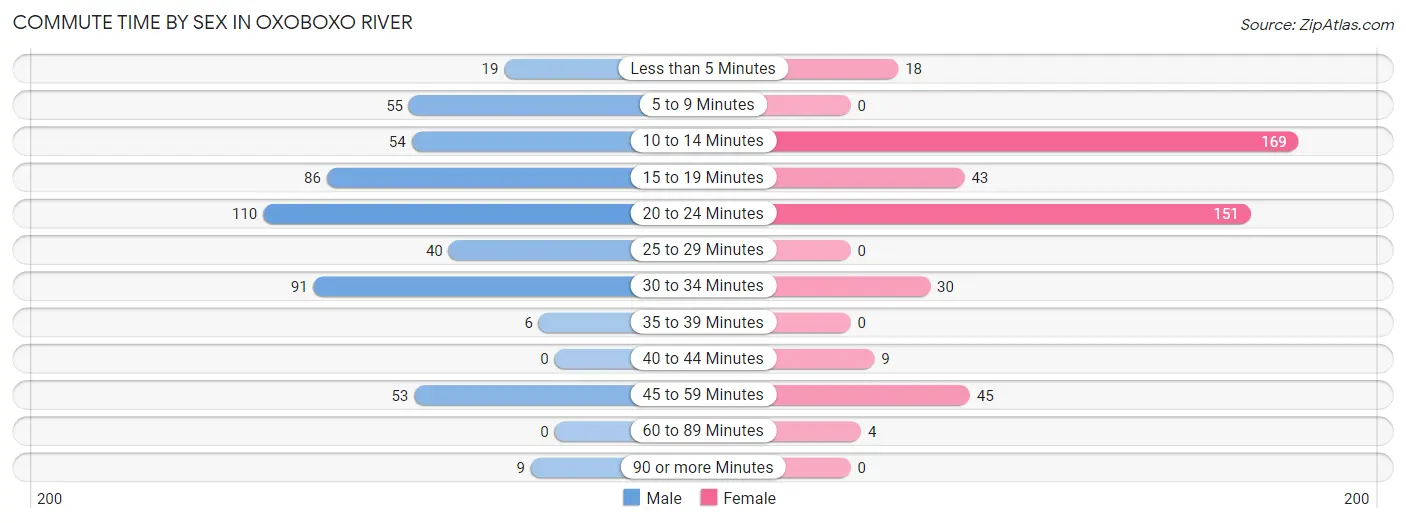
| Commute Time | Male | Female |
| Less than 5 Minutes | 19 (3.6%) | 18 (3.8%) |
| 5 to 9 Minutes | 55 (10.5%) | 0 (0.0%) |
| 10 to 14 Minutes | 54 (10.3%) | 169 (36.0%) |
| 15 to 19 Minutes | 86 (16.4%) | 43 (9.2%) |
| 20 to 24 Minutes | 110 (21.0%) | 151 (32.2%) |
| 25 to 29 Minutes | 40 (7.6%) | 0 (0.0%) |
| 30 to 34 Minutes | 91 (17.4%) | 30 (6.4%) |
| 35 to 39 Minutes | 6 (1.1%) | 0 (0.0%) |
| 40 to 44 Minutes | 0 (0.0%) | 9 (1.9%) |
| 45 to 59 Minutes | 53 (10.1%) | 45 (9.6%) |
| 60 to 89 Minutes | 0 (0.0%) | 4 (0.9%) |
| 90 or more Minutes | 9 (1.7%) | 0 (0.0%) |
Time of Departure to Work by Sex in Oxoboxo River
The most frequent times of departure to work in Oxoboxo River are 12:00 AM to 4:59 AM (121, 23.1%) for males and 7:30 AM to 7:59 AM (91, 19.4%) for females.
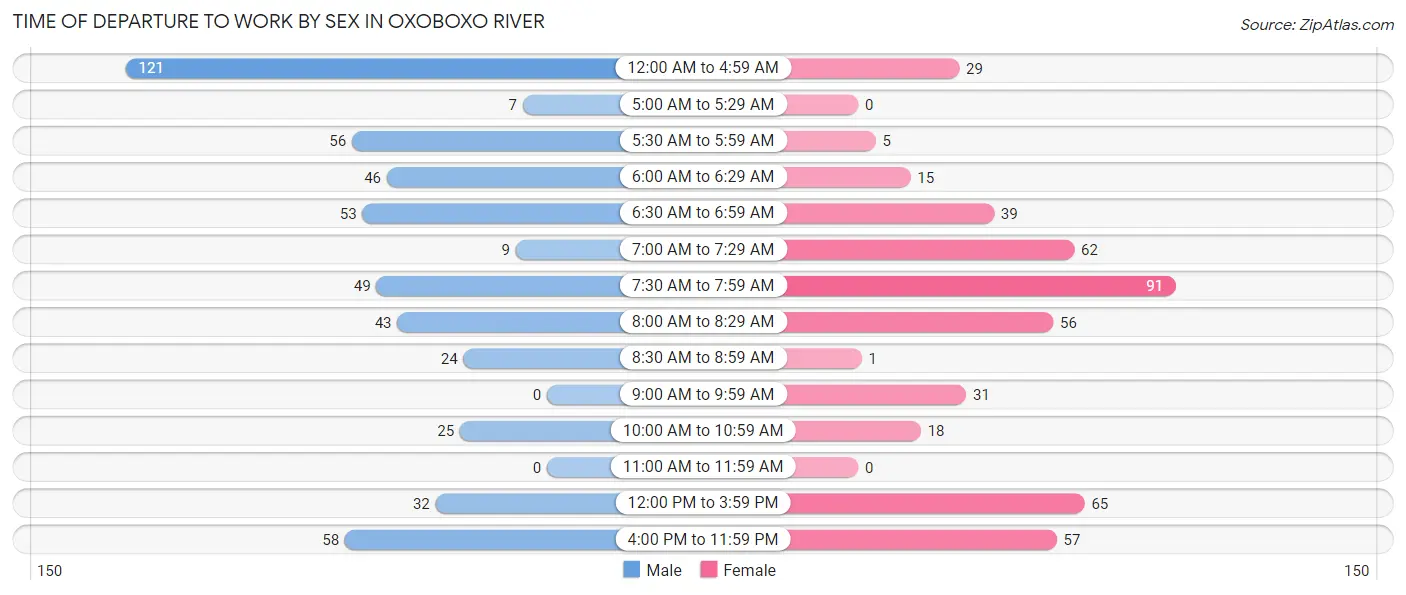
| Time of Departure | Male | Female |
| 12:00 AM to 4:59 AM | 121 (23.1%) | 29 (6.2%) |
| 5:00 AM to 5:29 AM | 7 (1.3%) | 0 (0.0%) |
| 5:30 AM to 5:59 AM | 56 (10.7%) | 5 (1.1%) |
| 6:00 AM to 6:29 AM | 46 (8.8%) | 15 (3.2%) |
| 6:30 AM to 6:59 AM | 53 (10.1%) | 39 (8.3%) |
| 7:00 AM to 7:29 AM | 9 (1.7%) | 62 (13.2%) |
| 7:30 AM to 7:59 AM | 49 (9.4%) | 91 (19.4%) |
| 8:00 AM to 8:29 AM | 43 (8.2%) | 56 (11.9%) |
| 8:30 AM to 8:59 AM | 24 (4.6%) | 1 (0.2%) |
| 9:00 AM to 9:59 AM | 0 (0.0%) | 31 (6.6%) |
| 10:00 AM to 10:59 AM | 25 (4.8%) | 18 (3.8%) |
| 11:00 AM to 11:59 AM | 0 (0.0%) | 0 (0.0%) |
| 12:00 PM to 3:59 PM | 32 (6.1%) | 65 (13.9%) |
| 4:00 PM to 11:59 PM | 58 (11.1%) | 57 (12.1%) |
| Total | 523 (100.0%) | 469 (100.0%) |
Housing Occupancy in Oxoboxo River
Occupancy by Ownership in Oxoboxo River
Of the total 1,111 dwellings in Oxoboxo River, owner-occupied units account for 797 (71.7%), while renter-occupied units make up 314 (28.3%).
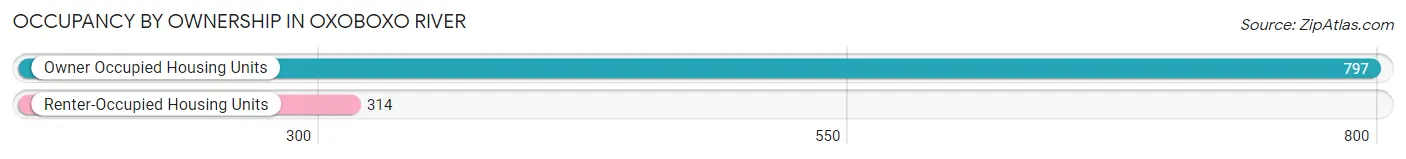
| Occupancy | # Housing Units | % Housing Units |
| Owner Occupied Housing Units | 797 | 71.7% |
| Renter-Occupied Housing Units | 314 | 28.3% |
| Total Occupied Housing Units | 1,111 | 100.0% |
Occupancy by Household Size in Oxoboxo River
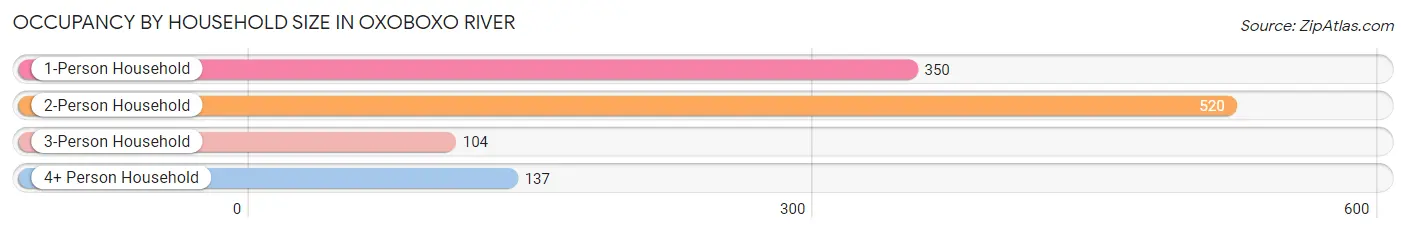
| Household Size | # Housing Units | % Housing Units |
| 1-Person Household | 350 | 31.5% |
| 2-Person Household | 520 | 46.8% |
| 3-Person Household | 104 | 9.4% |
| 4+ Person Household | 137 | 12.3% |
| Total Housing Units | 1,111 | 100.0% |
Occupancy by Ownership by Household Size in Oxoboxo River
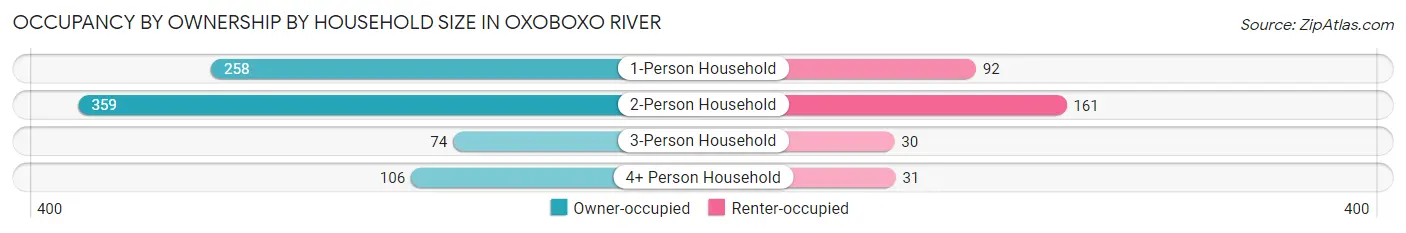
| Household Size | Owner-occupied | Renter-occupied |
| 1-Person Household | 258 (73.7%) | 92 (26.3%) |
| 2-Person Household | 359 (69.0%) | 161 (31.0%) |
| 3-Person Household | 74 (71.2%) | 30 (28.8%) |
| 4+ Person Household | 106 (77.4%) | 31 (22.6%) |
| Total Housing Units | 797 (71.7%) | 314 (28.3%) |
Occupancy by Educational Attainment in Oxoboxo River
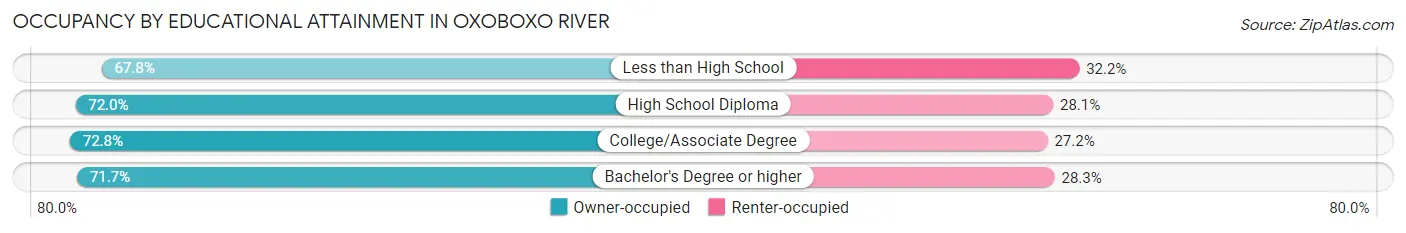
| Household Size | Owner-occupied | Renter-occupied |
| Less than High School | 80 (67.8%) | 38 (32.2%) |
| High School Diploma | 318 (72.0%) | 124 (28.1%) |
| College/Associate Degree | 252 (72.8%) | 94 (27.2%) |
| Bachelor's Degree or higher | 147 (71.7%) | 58 (28.3%) |
Occupancy by Age of Householder in Oxoboxo River
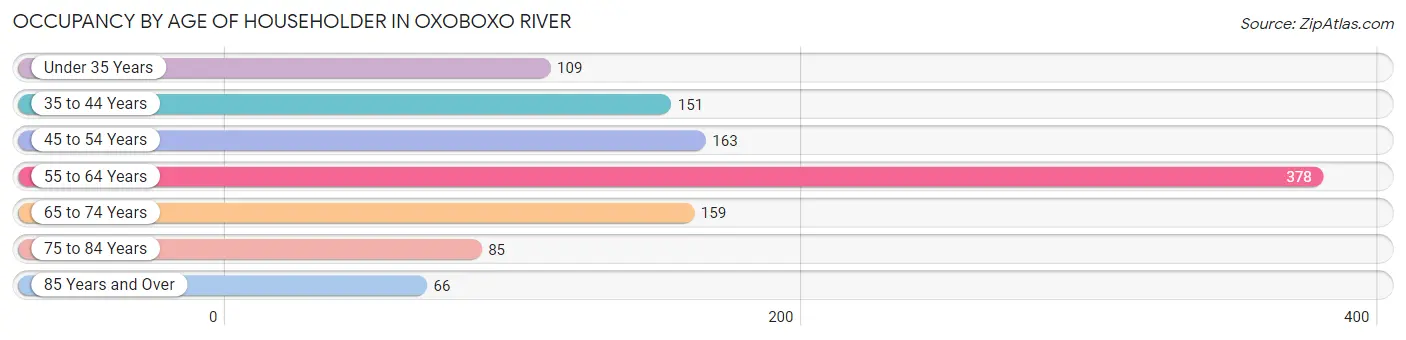
| Age Bracket | # Households | % Households |
| Under 35 Years | 109 | 9.8% |
| 35 to 44 Years | 151 | 13.6% |
| 45 to 54 Years | 163 | 14.7% |
| 55 to 64 Years | 378 | 34.0% |
| 65 to 74 Years | 159 | 14.3% |
| 75 to 84 Years | 85 | 7.6% |
| 85 Years and Over | 66 | 5.9% |
| Total | 1,111 | 100.0% |
Housing Finances in Oxoboxo River
Median Income by Occupancy in Oxoboxo River
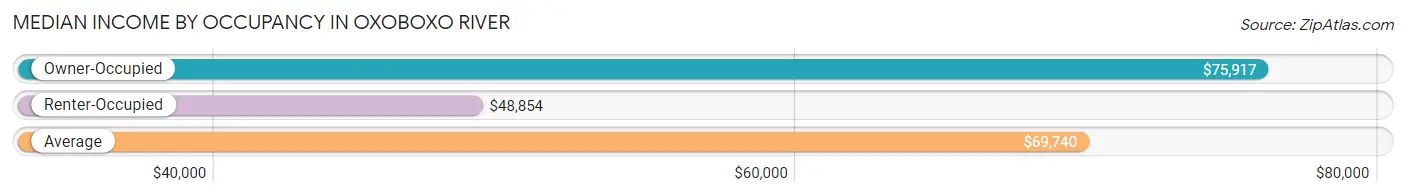
| Occupancy Type | # Households | Median Income |
| Owner-Occupied | 797 (71.7%) | $75,917 |
| Renter-Occupied | 314 (28.3%) | $48,854 |
| Average | 1,111 (100.0%) | $69,740 |
Occupancy by Householder Income Bracket in Oxoboxo River
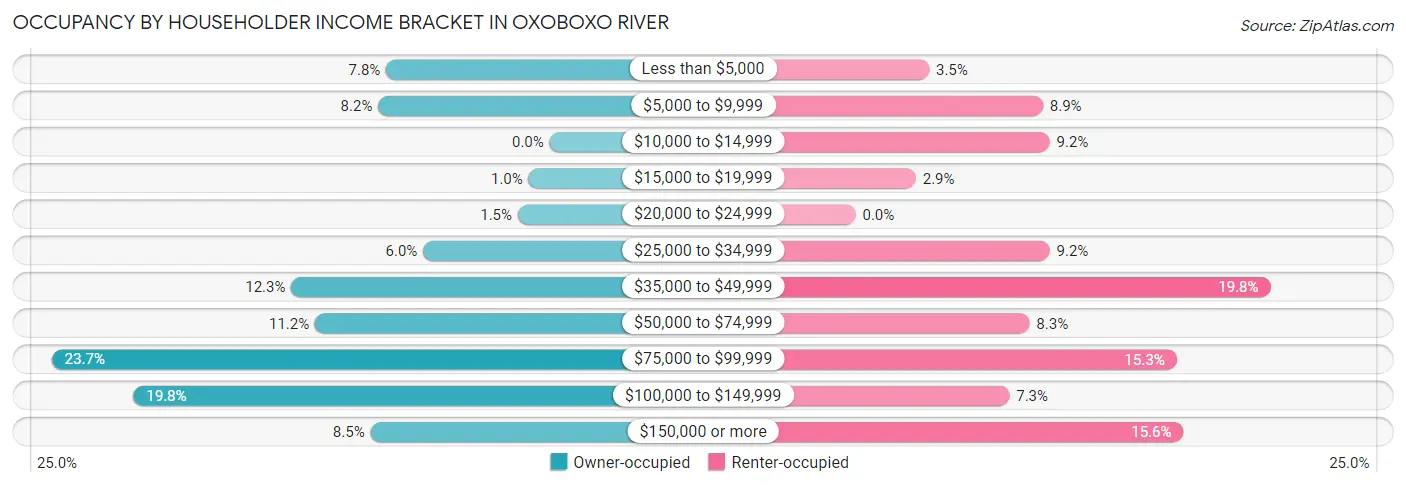
| Income Bracket | Owner-occupied | Renter-occupied |
| Less than $5,000 | 62 (7.8%) | 11 (3.5%) |
| $5,000 to $9,999 | 65 (8.2%) | 28 (8.9%) |
| $10,000 to $14,999 | 0 (0.0%) | 29 (9.2%) |
| $15,000 to $19,999 | 8 (1.0%) | 9 (2.9%) |
| $20,000 to $24,999 | 12 (1.5%) | 0 (0.0%) |
| $25,000 to $34,999 | 48 (6.0%) | 29 (9.2%) |
| $35,000 to $49,999 | 98 (12.3%) | 62 (19.8%) |
| $50,000 to $74,999 | 89 (11.2%) | 26 (8.3%) |
| $75,000 to $99,999 | 189 (23.7%) | 48 (15.3%) |
| $100,000 to $149,999 | 158 (19.8%) | 23 (7.3%) |
| $150,000 or more | 68 (8.5%) | 49 (15.6%) |
| Total | 797 (100.0%) | 314 (100.0%) |
Monthly Housing Cost Tiers in Oxoboxo River
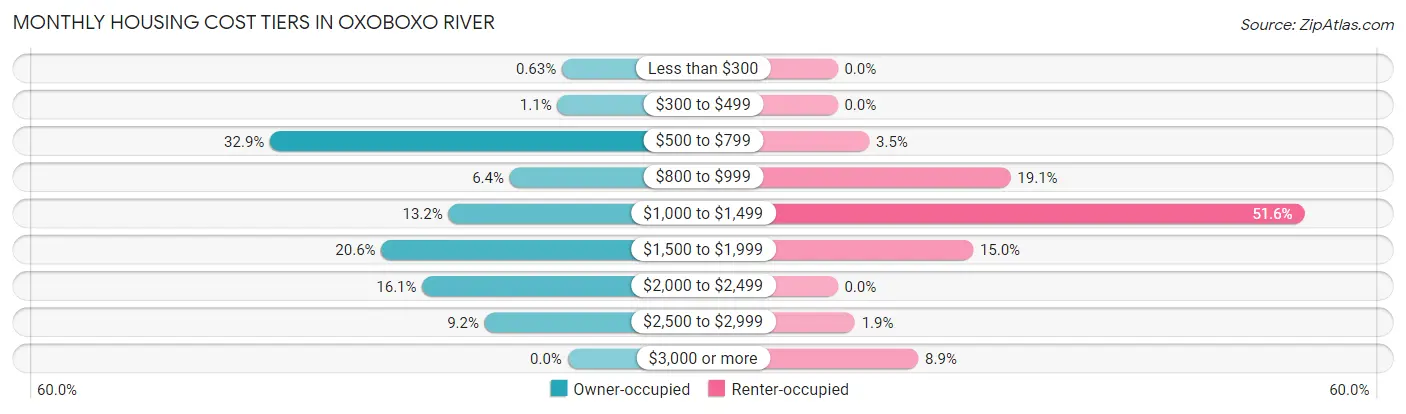
| Monthly Cost | Owner-occupied | Renter-occupied |
| Less than $300 | 5 (0.6%) | 0 (0.0%) |
| $300 to $499 | 9 (1.1%) | 0 (0.0%) |
| $500 to $799 | 262 (32.9%) | 11 (3.5%) |
| $800 to $999 | 51 (6.4%) | 60 (19.1%) |
| $1,000 to $1,499 | 105 (13.2%) | 162 (51.6%) |
| $1,500 to $1,999 | 164 (20.6%) | 47 (15.0%) |
| $2,000 to $2,499 | 128 (16.1%) | 0 (0.0%) |
| $2,500 to $2,999 | 73 (9.2%) | 6 (1.9%) |
| $3,000 or more | 0 (0.0%) | 28 (8.9%) |
| Total | 797 (100.0%) | 314 (100.0%) |
Physical Housing Characteristics in Oxoboxo River
Housing Structures in Oxoboxo River
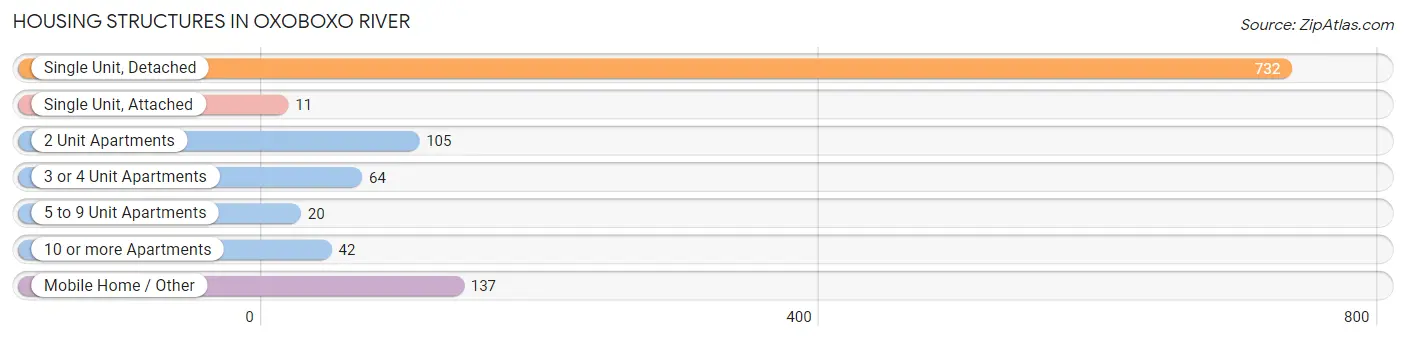
| Structure Type | # Housing Units | % Housing Units |
| Single Unit, Detached | 732 | 65.9% |
| Single Unit, Attached | 11 | 1.0% |
| 2 Unit Apartments | 105 | 9.5% |
| 3 or 4 Unit Apartments | 64 | 5.8% |
| 5 to 9 Unit Apartments | 20 | 1.8% |
| 10 or more Apartments | 42 | 3.8% |
| Mobile Home / Other | 137 | 12.3% |
| Total | 1,111 | 100.0% |
Housing Structures by Occupancy in Oxoboxo River
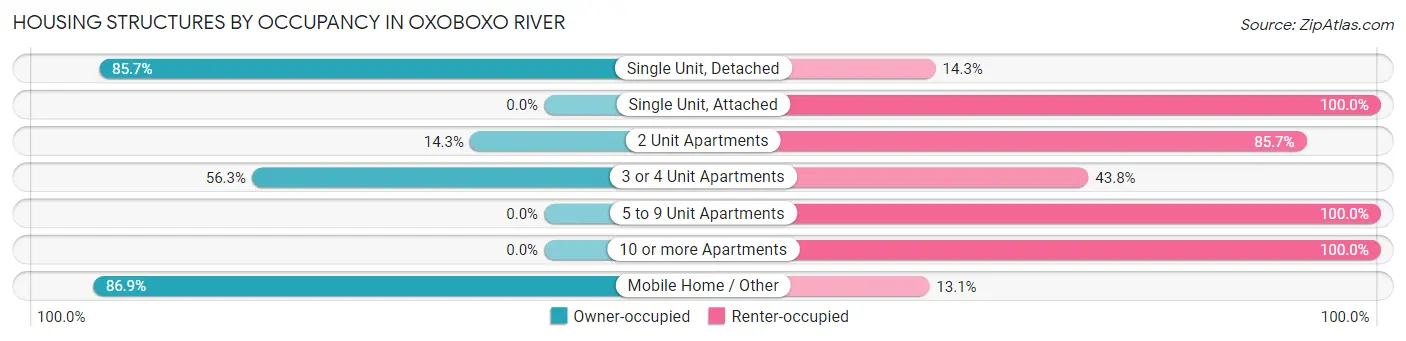
| Structure Type | Owner-occupied | Renter-occupied |
| Single Unit, Detached | 627 (85.7%) | 105 (14.3%) |
| Single Unit, Attached | 0 (0.0%) | 11 (100.0%) |
| 2 Unit Apartments | 15 (14.3%) | 90 (85.7%) |
| 3 or 4 Unit Apartments | 36 (56.2%) | 28 (43.8%) |
| 5 to 9 Unit Apartments | 0 (0.0%) | 20 (100.0%) |
| 10 or more Apartments | 0 (0.0%) | 42 (100.0%) |
| Mobile Home / Other | 119 (86.9%) | 18 (13.1%) |
| Total | 797 (71.7%) | 314 (28.3%) |
Housing Structures by Number of Rooms in Oxoboxo River
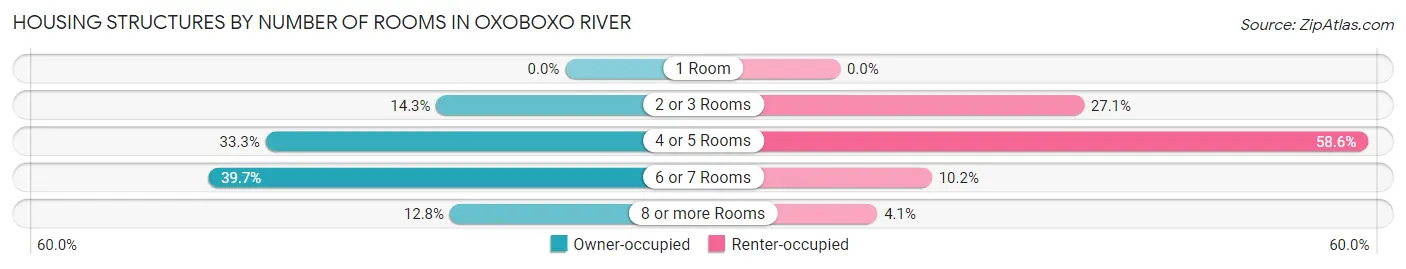
| Number of Rooms | Owner-occupied | Renter-occupied |
| 1 Room | 0 (0.0%) | 0 (0.0%) |
| 2 or 3 Rooms | 114 (14.3%) | 85 (27.1%) |
| 4 or 5 Rooms | 265 (33.3%) | 184 (58.6%) |
| 6 or 7 Rooms | 316 (39.7%) | 32 (10.2%) |
| 8 or more Rooms | 102 (12.8%) | 13 (4.1%) |
| Total | 797 (100.0%) | 314 (100.0%) |
Housing Structure by Heating Type in Oxoboxo River
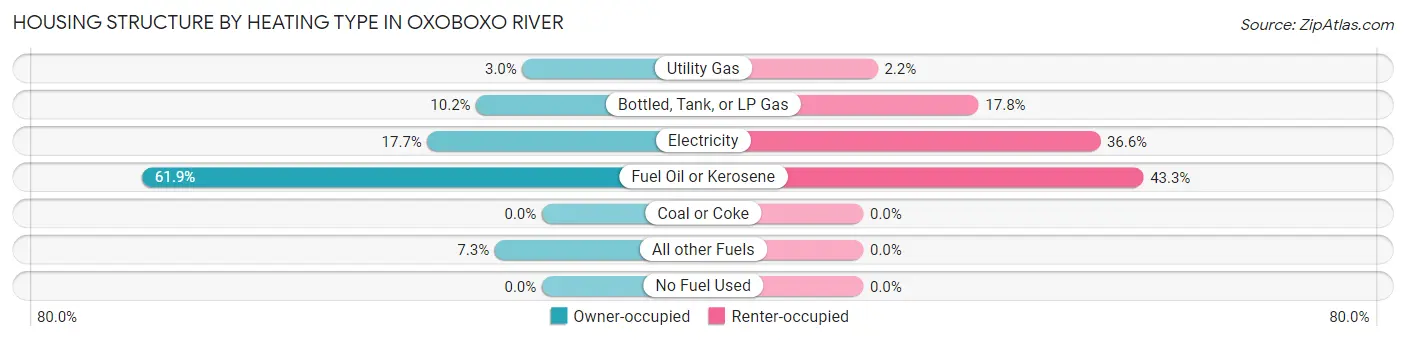
| Heating Type | Owner-occupied | Renter-occupied |
| Utility Gas | 24 (3.0%) | 7 (2.2%) |
| Bottled, Tank, or LP Gas | 81 (10.2%) | 56 (17.8%) |
| Electricity | 141 (17.7%) | 115 (36.6%) |
| Fuel Oil or Kerosene | 493 (61.9%) | 136 (43.3%) |
| Coal or Coke | 0 (0.0%) | 0 (0.0%) |
| All other Fuels | 58 (7.3%) | 0 (0.0%) |
| No Fuel Used | 0 (0.0%) | 0 (0.0%) |
| Total | 797 (100.0%) | 314 (100.0%) |
Household Vehicle Usage in Oxoboxo River
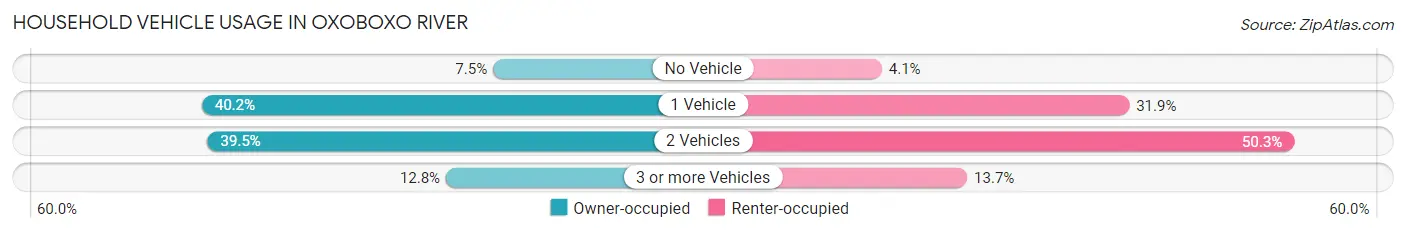
| Vehicles per Household | Owner-occupied | Renter-occupied |
| No Vehicle | 60 (7.5%) | 13 (4.1%) |
| 1 Vehicle | 320 (40.2%) | 100 (31.9%) |
| 2 Vehicles | 315 (39.5%) | 158 (50.3%) |
| 3 or more Vehicles | 102 (12.8%) | 43 (13.7%) |
| Total | 797 (100.0%) | 314 (100.0%) |
Real Estate & Mortgages in Oxoboxo River
Real Estate and Mortgage Overview in Oxoboxo River
| Characteristic | Without Mortgage | With Mortgage |
| Housing Units | 394 | 403 |
| Median Property Value | $183,700 | $231,800 |
| Median Household Income | $47,891 | $56 |
| Monthly Housing Costs | $701 | $0 |
| Real Estate Taxes | $3,375 | $0 |
Property Value by Mortgage Status in Oxoboxo River
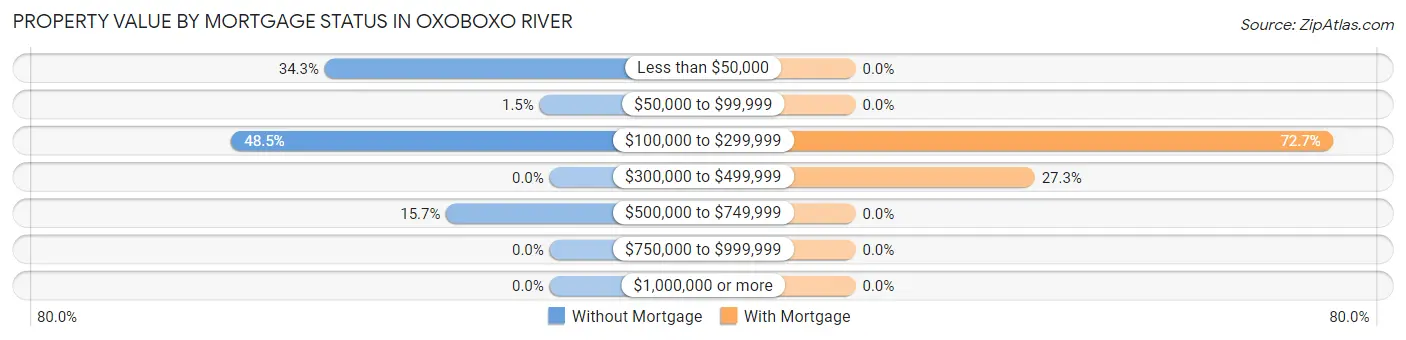
| Property Value | Without Mortgage | With Mortgage |
| Less than $50,000 | 135 (34.3%) | 0 (0.0%) |
| $50,000 to $99,999 | 6 (1.5%) | 0 (0.0%) |
| $100,000 to $299,999 | 191 (48.5%) | 293 (72.7%) |
| $300,000 to $499,999 | 0 (0.0%) | 110 (27.3%) |
| $500,000 to $749,999 | 62 (15.7%) | 0 (0.0%) |
| $750,000 to $999,999 | 0 (0.0%) | 0 (0.0%) |
| $1,000,000 or more | 0 (0.0%) | 0 (0.0%) |
| Total | 394 (100.0%) | 403 (100.0%) |
Household Income by Mortgage Status in Oxoboxo River
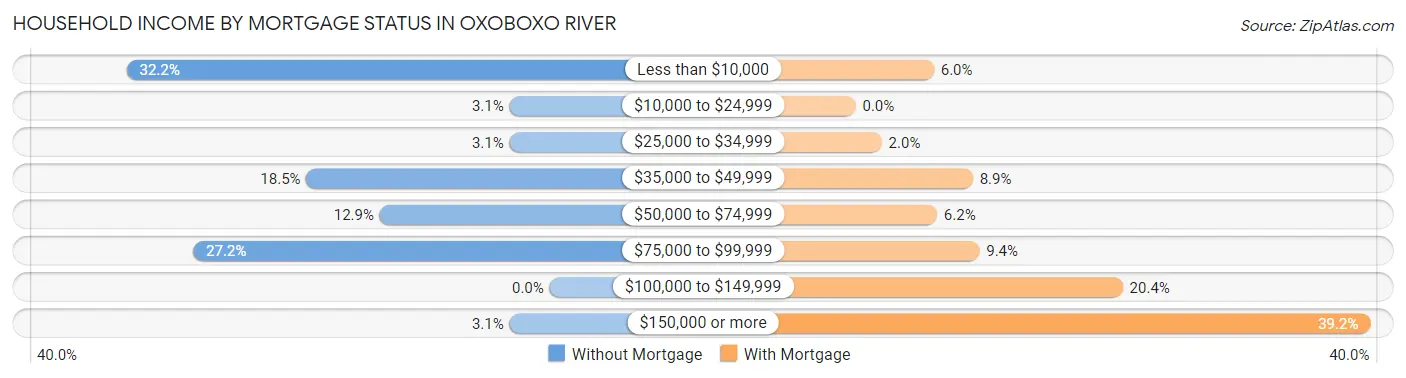
| Household Income | Without Mortgage | With Mortgage |
| Less than $10,000 | 127 (32.2%) | 24 (6.0%) |
| $10,000 to $24,999 | 12 (3.0%) | 0 (0.0%) |
| $25,000 to $34,999 | 12 (3.0%) | 8 (2.0%) |
| $35,000 to $49,999 | 73 (18.5%) | 36 (8.9%) |
| $50,000 to $74,999 | 51 (12.9%) | 25 (6.2%) |
| $75,000 to $99,999 | 107 (27.2%) | 38 (9.4%) |
| $100,000 to $149,999 | 0 (0.0%) | 82 (20.3%) |
| $150,000 or more | 12 (3.0%) | 158 (39.2%) |
| Total | 394 (100.0%) | 403 (100.0%) |
Property Value to Household Income Ratio in Oxoboxo River
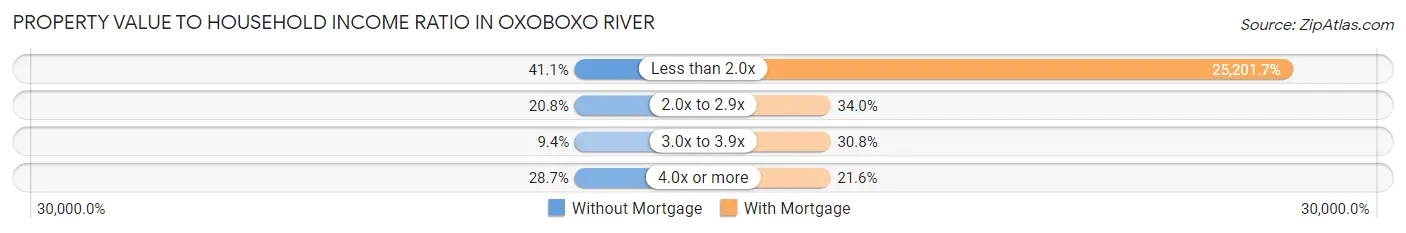
| Value-to-Income Ratio | Without Mortgage | With Mortgage |
| Less than 2.0x | 162 (41.1%) | 101,563 (25,201.7%) |
| 2.0x to 2.9x | 82 (20.8%) | 137 (34.0%) |
| 3.0x to 3.9x | 37 (9.4%) | 124 (30.8%) |
| 4.0x or more | 113 (28.7%) | 87 (21.6%) |
| Total | 394 (100.0%) | 403 (100.0%) |
Real Estate Taxes by Mortgage Status in Oxoboxo River
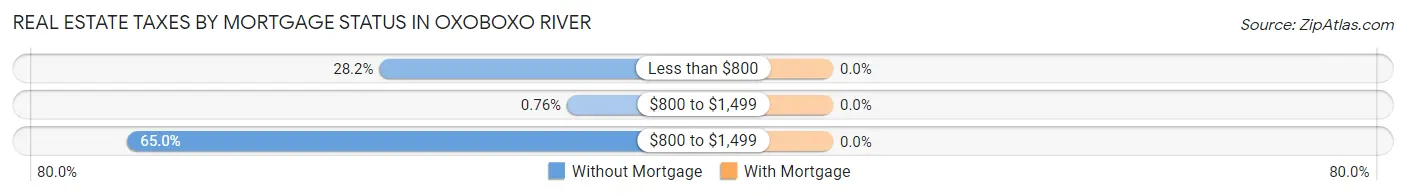
| Property Taxes | Without Mortgage | With Mortgage |
| Less than $800 | 111 (28.2%) | 0 (0.0%) |
| $800 to $1,499 | 3 (0.8%) | 0 (0.0%) |
| $800 to $1,499 | 256 (65.0%) | 0 (0.0%) |
| Total | 394 (100.0%) | 403 (100.0%) |
Health & Disability in Oxoboxo River
Health Insurance Coverage by Age in Oxoboxo River
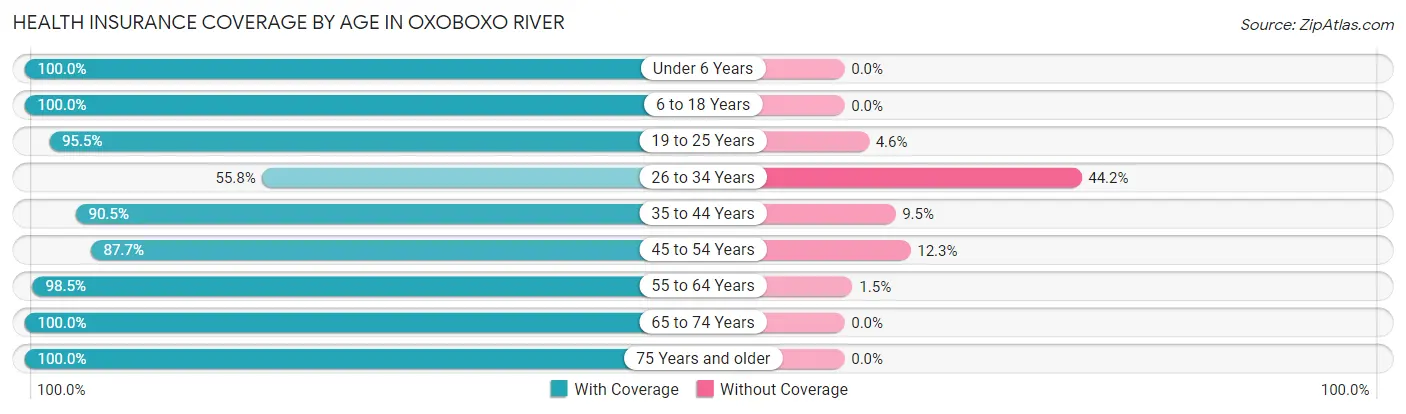
| Age Bracket | With Coverage | Without Coverage |
| Under 6 Years | 129 (100.0%) | 0 (0.0%) |
| 6 to 18 Years | 269 (100.0%) | 0 (0.0%) |
| 19 to 25 Years | 147 (95.5%) | 7 (4.5%) |
| 26 to 34 Years | 120 (55.8%) | 95 (44.2%) |
| 35 to 44 Years | 200 (90.5%) | 21 (9.5%) |
| 45 to 54 Years | 214 (87.7%) | 30 (12.3%) |
| 55 to 64 Years | 588 (98.5%) | 9 (1.5%) |
| 65 to 74 Years | 216 (100.0%) | 0 (0.0%) |
| 75 Years and older | 322 (100.0%) | 0 (0.0%) |
| Total | 2,205 (93.2%) | 162 (6.8%) |
Health Insurance Coverage by Citizenship Status in Oxoboxo River
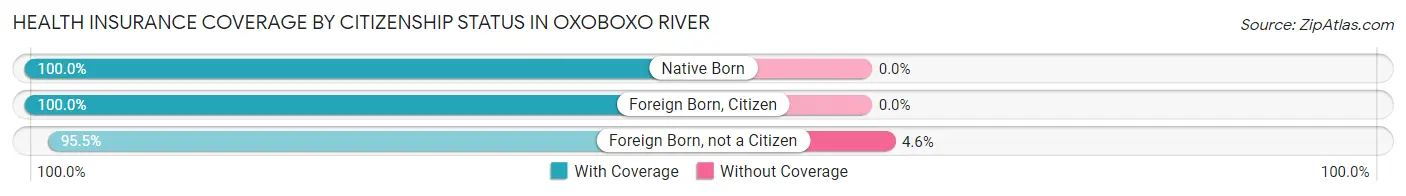
| Citizenship Status | With Coverage | Without Coverage |
| Native Born | 129 (100.0%) | 0 (0.0%) |
| Foreign Born, Citizen | 269 (100.0%) | 0 (0.0%) |
| Foreign Born, not a Citizen | 147 (95.5%) | 7 (4.5%) |
Health Insurance Coverage by Household Income in Oxoboxo River
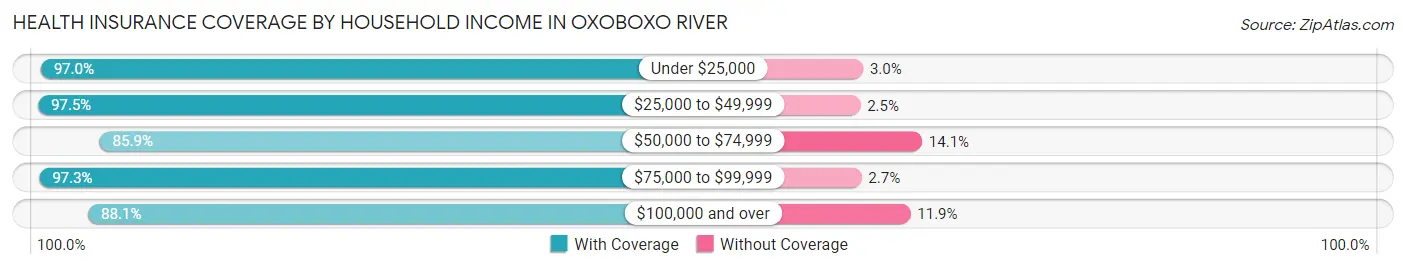
| Household Income | With Coverage | Without Coverage |
| Under $25,000 | 288 (97.0%) | 9 (3.0%) |
| $25,000 to $49,999 | 505 (97.5%) | 13 (2.5%) |
| $50,000 to $74,999 | 226 (85.9%) | 37 (14.1%) |
| $75,000 to $99,999 | 532 (97.3%) | 15 (2.7%) |
| $100,000 and over | 651 (88.1%) | 88 (11.9%) |
Public vs Private Health Insurance Coverage by Age in Oxoboxo River
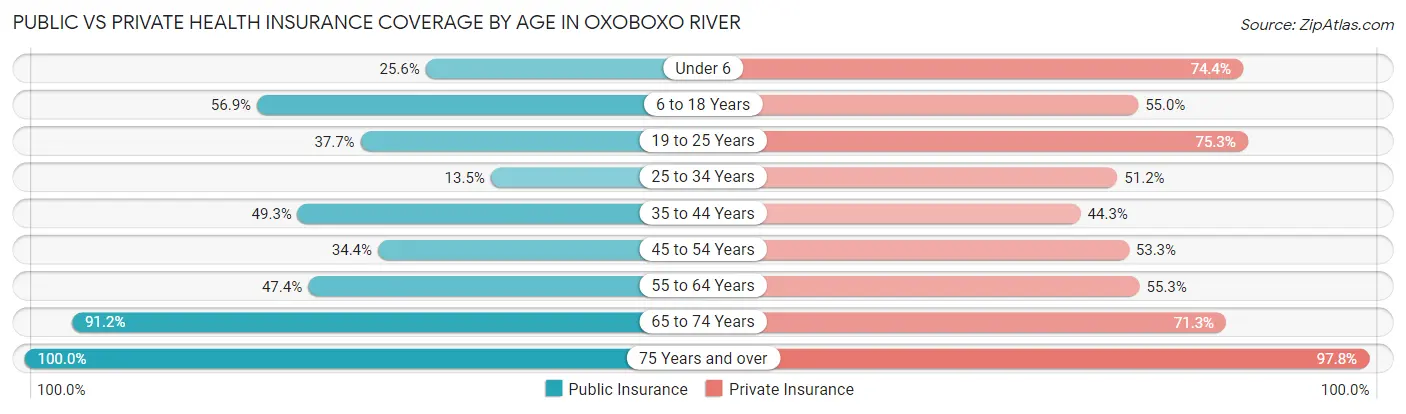
| Age Bracket | Public Insurance | Private Insurance |
| Under 6 | 33 (25.6%) | 96 (74.4%) |
| 6 to 18 Years | 153 (56.9%) | 148 (55.0%) |
| 19 to 25 Years | 58 (37.7%) | 116 (75.3%) |
| 25 to 34 Years | 29 (13.5%) | 110 (51.2%) |
| 35 to 44 Years | 109 (49.3%) | 98 (44.3%) |
| 45 to 54 Years | 84 (34.4%) | 130 (53.3%) |
| 55 to 64 Years | 283 (47.4%) | 330 (55.3%) |
| 65 to 74 Years | 197 (91.2%) | 154 (71.3%) |
| 75 Years and over | 322 (100.0%) | 315 (97.8%) |
| Total | 1,268 (53.6%) | 1,497 (63.2%) |
Disability Status by Sex by Age in Oxoboxo River
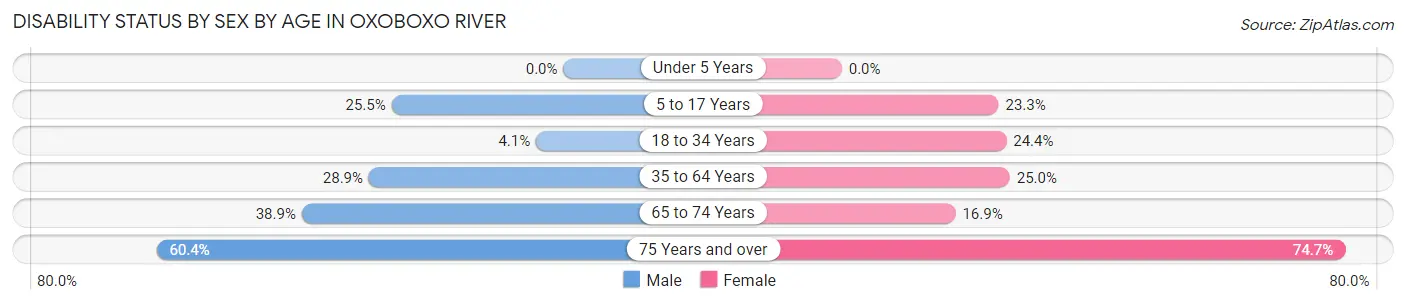
| Age Bracket | Male | Female |
| Under 5 Years | 0 (0.0%) | 0 (0.0%) |
| 5 to 17 Years | 25 (25.5%) | 44 (23.3%) |
| 18 to 34 Years | 8 (4.1%) | 42 (24.4%) |
| 35 to 64 Years | 162 (28.9%) | 125 (24.9%) |
| 65 to 74 Years | 54 (38.9%) | 13 (16.9%) |
| 75 Years and over | 87 (60.4%) | 133 (74.7%) |
Disability Class by Sex by Age in Oxoboxo River
Disability Class: Hearing Difficulty
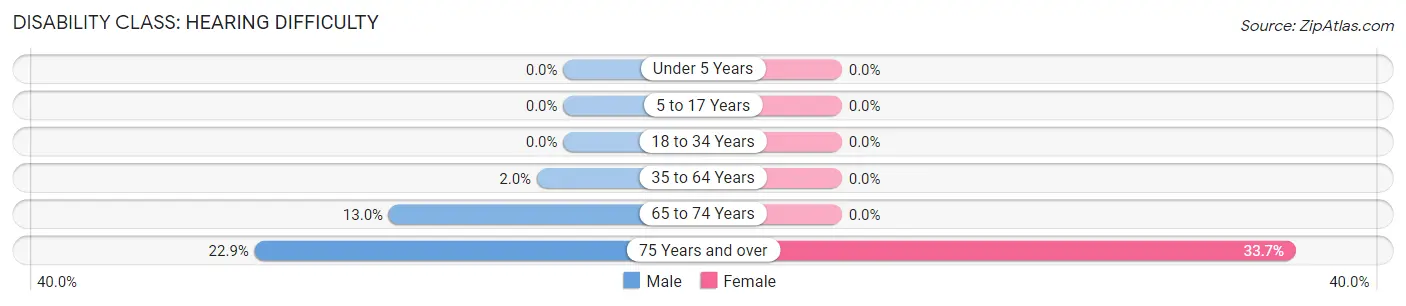
| Age Bracket | Male | Female |
| Under 5 Years | 0 (0.0%) | 0 (0.0%) |
| 5 to 17 Years | 0 (0.0%) | 0 (0.0%) |
| 18 to 34 Years | 0 (0.0%) | 0 (0.0%) |
| 35 to 64 Years | 11 (2.0%) | 0 (0.0%) |
| 65 to 74 Years | 18 (13.0%) | 0 (0.0%) |
| 75 Years and over | 33 (22.9%) | 60 (33.7%) |
Disability Class: Vision Difficulty
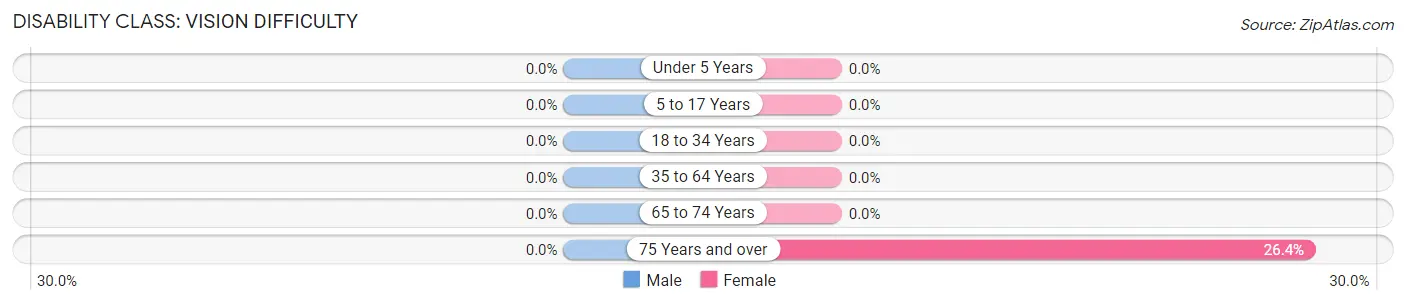
| Age Bracket | Male | Female |
| Under 5 Years | 0 (0.0%) | 0 (0.0%) |
| 5 to 17 Years | 0 (0.0%) | 0 (0.0%) |
| 18 to 34 Years | 0 (0.0%) | 0 (0.0%) |
| 35 to 64 Years | 0 (0.0%) | 0 (0.0%) |
| 65 to 74 Years | 0 (0.0%) | 0 (0.0%) |
| 75 Years and over | 0 (0.0%) | 47 (26.4%) |
Disability Class: Cognitive Difficulty
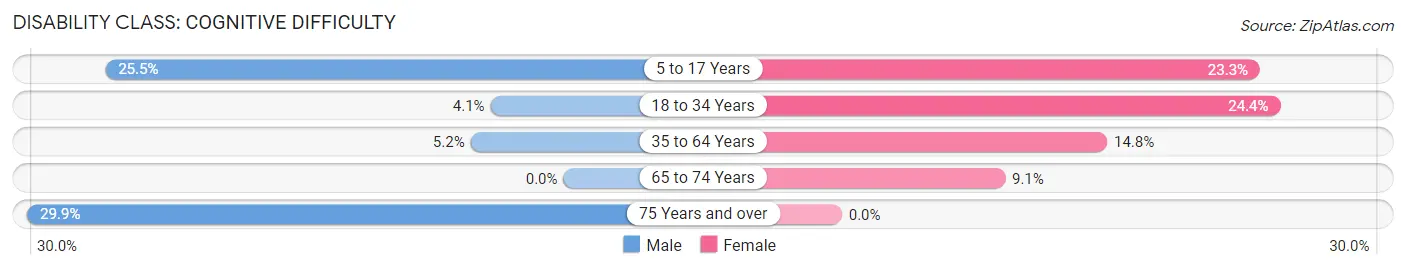
| Age Bracket | Male | Female |
| 5 to 17 Years | 25 (25.5%) | 44 (23.3%) |
| 18 to 34 Years | 8 (4.1%) | 42 (24.4%) |
| 35 to 64 Years | 29 (5.2%) | 74 (14.8%) |
| 65 to 74 Years | 0 (0.0%) | 7 (9.1%) |
| 75 Years and over | 43 (29.9%) | 0 (0.0%) |
Disability Class: Ambulatory Difficulty
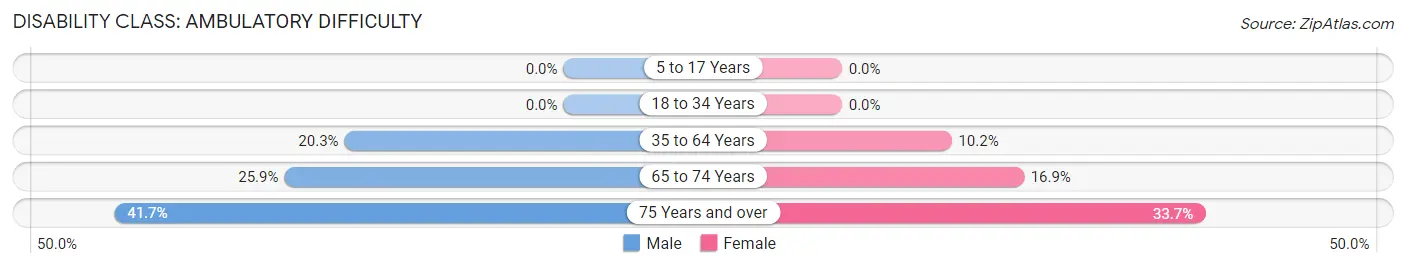
| Age Bracket | Male | Female |
| 5 to 17 Years | 0 (0.0%) | 0 (0.0%) |
| 18 to 34 Years | 0 (0.0%) | 0 (0.0%) |
| 35 to 64 Years | 114 (20.3%) | 51 (10.2%) |
| 65 to 74 Years | 36 (25.9%) | 13 (16.9%) |
| 75 Years and over | 60 (41.7%) | 60 (33.7%) |
Disability Class: Self-Care Difficulty
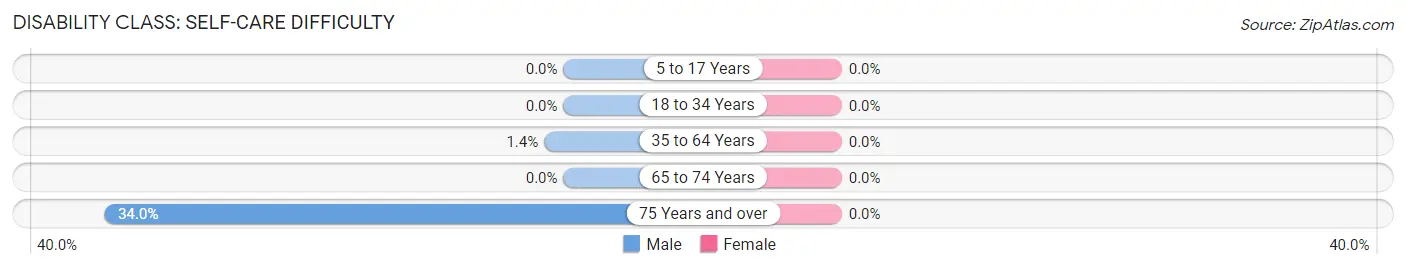
| Age Bracket | Male | Female |
| 5 to 17 Years | 0 (0.0%) | 0 (0.0%) |
| 18 to 34 Years | 0 (0.0%) | 0 (0.0%) |
| 35 to 64 Years | 8 (1.4%) | 0 (0.0%) |
| 65 to 74 Years | 0 (0.0%) | 0 (0.0%) |
| 75 Years and over | 49 (34.0%) | 0 (0.0%) |
Technology Access in Oxoboxo River
Computing Device Access in Oxoboxo River
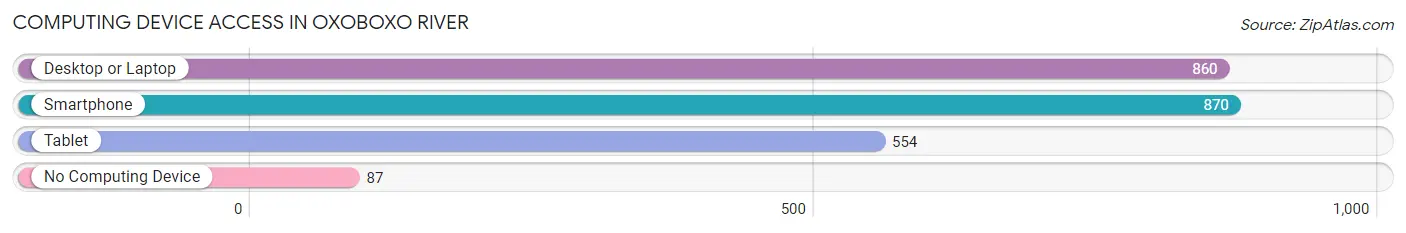
| Device Type | # Households | % Households |
| Desktop or Laptop | 860 | 77.4% |
| Smartphone | 870 | 78.3% |
| Tablet | 554 | 49.9% |
| No Computing Device | 87 | 7.8% |
| Total | 1,111 | 100.0% |
Internet Access in Oxoboxo River
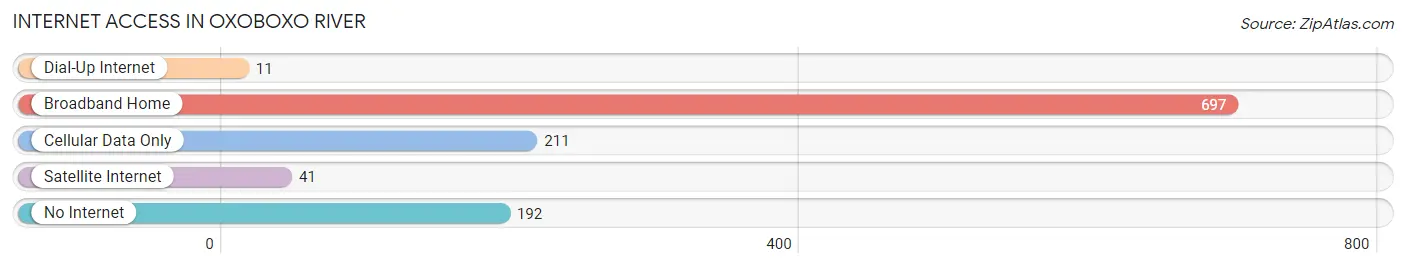
| Internet Type | # Households | % Households |
| Dial-Up Internet | 11 | 1.0% |
| Broadband Home | 697 | 62.7% |
| Cellular Data Only | 211 | 19.0% |
| Satellite Internet | 41 | 3.7% |
| No Internet | 192 | 17.3% |
| Total | 1,111 | 100.0% |
Oxoboxo River Summary
Oxoboxo River is a small river located in the town of Montville, Connecticut. It is a tributary of the Thames River, which flows into Long Island Sound. The river is approximately 8 miles long and is a popular destination for fishing, canoeing, and kayaking.
History
The Oxoboxo River has been a part of the local history of Montville since the early 1700s. The river was used by the Mohegan Indians for fishing and transportation. The Mohegan Indians were the first inhabitants of the area and were known for their fishing and hunting skills. The river was also used by the colonists for transportation and trade. In the late 1700s, the river was used to transport goods from the Thames River to the Long Island Sound.
In the early 1800s, the river was used for industrial purposes. The river was used to power several mills, including a grist mill, a saw mill, and a paper mill. The mills were used to produce flour, lumber, and paper products. The mills were powered by the river’s strong current.
In the late 1800s, the river was used for recreational purposes. The river was a popular destination for fishing, canoeing, and kayaking. The river was also used for swimming and boating.
Geography
The Oxoboxo River is located in the town of Montville, Connecticut. The river is approximately 8 miles long and is a tributary of the Thames River. The river is fed by several small streams and creeks, including the Oxoboxo Brook, the Little River, and the Mohegan River. The river is surrounded by forests and wetlands, providing a habitat for a variety of wildlife.
The Oxoboxo River is a popular destination for fishing, canoeing, and kayaking. The river is also a popular destination for swimming and boating. The river is home to a variety of fish, including bass, trout, and catfish.
Economy
The Oxoboxo River is an important part of the local economy. The river is used for recreational purposes, such as fishing, canoeing, and kayaking. The river is also used for industrial purposes, such as powering mills. The river is also used for transportation, as it is a tributary of the Thames River.
The river is also home to a variety of businesses, including marinas, boat rentals, and restaurants. The river is also home to several parks, including Oxoboxo River State Park and Oxoboxo River Wildlife Management Area.
Demographics
The population of Montville, Connecticut is approximately 21,000. The town is predominantly white, with a small percentage of African Americans, Hispanics, and Asians. The median household income is approximately $60,000. The town is home to several colleges and universities, including the University of Connecticut and Eastern Connecticut State University.
Conclusion
The Oxoboxo River is an important part of the local history, geography, economy, and demographics of Montville, Connecticut. The river is a popular destination for fishing, canoeing, and kayaking. The river is also used for industrial and transportation purposes. The river is home to a variety of businesses, including marinas, boat rentals, and restaurants. The river is also home to several parks, including Oxoboxo River State Park and Oxoboxo River Wildlife Management Area. The population of Montville is predominantly white, with a small percentage of African Americans, Hispanics, and Asians. The median household income is approximately $60,000.
Common Questions
What is Per Capita Income in Oxoboxo River?
Per Capita income in Oxoboxo River is $35,003.
What is the Median Family Income in Oxoboxo River?
Median Family Income in Oxoboxo River is $75,444.
What is the Median Household income in Oxoboxo River?
Median Household Income in Oxoboxo River is $69,740.
What is Income or Wage Gap in Oxoboxo River?
Income or Wage Gap in Oxoboxo River is 37.2%.
Women in Oxoboxo River earn 62.8 cents for every dollar earned by a man.
What is Inequality or Gini Index in Oxoboxo River?
Inequality or Gini Index in Oxoboxo River is 0.41.
What is the Total Population of Oxoboxo River?
Total Population of Oxoboxo River is 2,429.
What is the Total Male Population of Oxoboxo River?
Total Male Population of Oxoboxo River is 1,223.
What is the Total Female Population of Oxoboxo River?
Total Female Population of Oxoboxo River is 1,206.
What is the Ratio of Males per 100 Females in Oxoboxo River?
There are 101.41 Males per 100 Females in Oxoboxo River.
What is the Ratio of Females per 100 Males in Oxoboxo River?
There are 98.61 Females per 100 Males in Oxoboxo River.
What is the Median Population Age in Oxoboxo River?
Median Population Age in Oxoboxo River is 54.2 Years.
What is the Average Family Size in Oxoboxo River
Average Family Size in Oxoboxo River is 2.6 People.
What is the Average Household Size in Oxoboxo River
Average Household Size in Oxoboxo River is 2.1 People.
How Large is the Labor Force in Oxoboxo River?
There are 1,210 People in the Labor Forcein in Oxoboxo River.
What is the Percentage of People in the Labor Force in Oxoboxo River?
57.5% of People are in the Labor Force in Oxoboxo River.
What is the Unemployment Rate in Oxoboxo River?
Unemployment Rate in Oxoboxo River is 6.9%.