Cities with the Highest Percentage of English Population in Connecticut
RELATED REPORTS & OPTIONS
English
Connecticut
Compare Cities
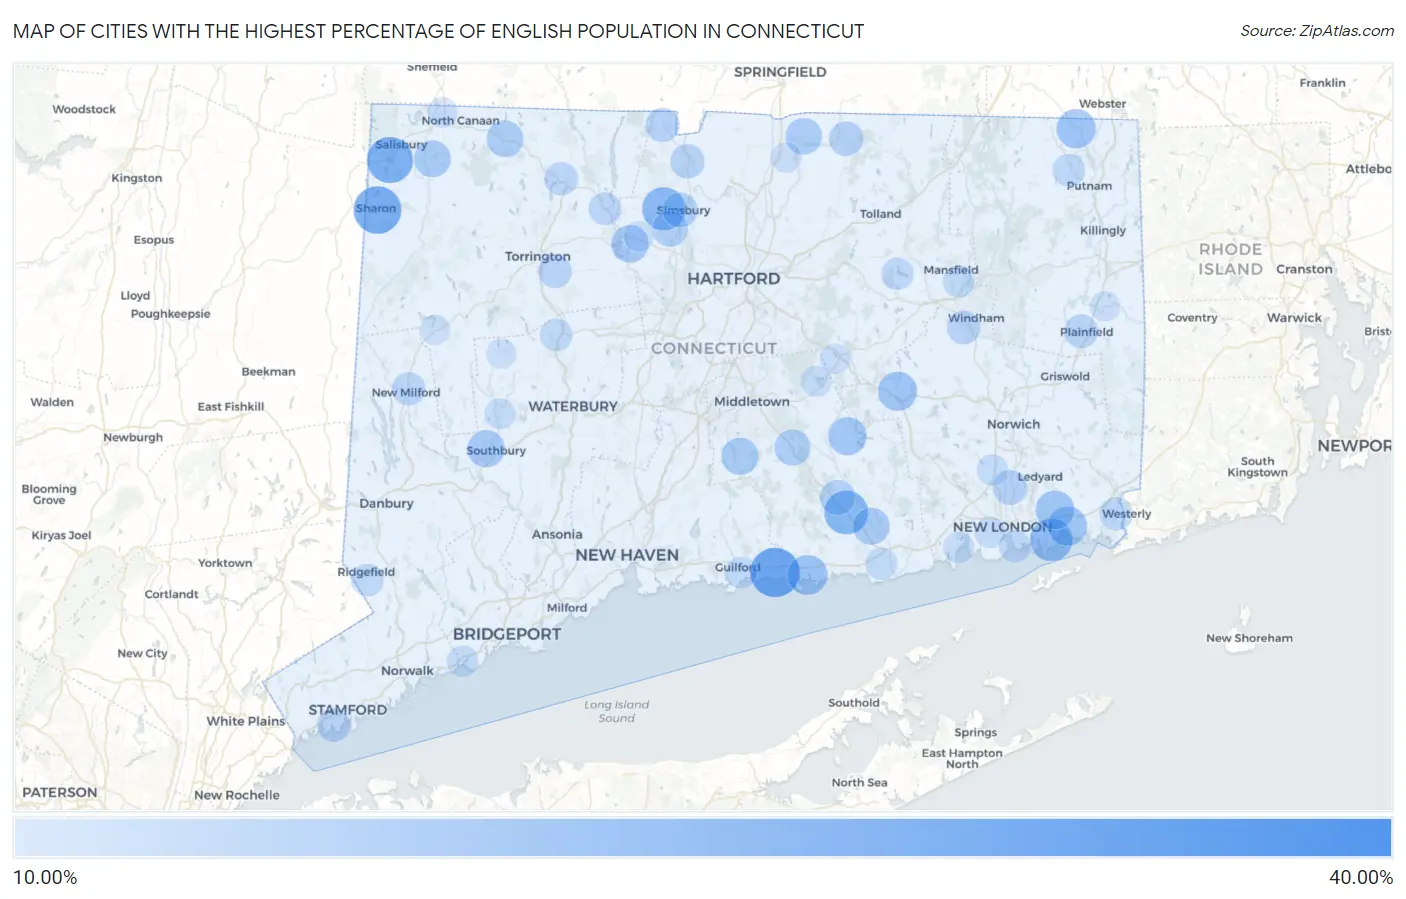
Map of Cities with the Highest Percentage of English Population in Connecticut
0.00%
40.00%
Cities with the Highest Percentage of English Population in Connecticut
| City | English | vs State | vs National | |
| 1. | Witches Woods | 36.52% | 8.56%(+28.0)#1 | 8.59%(+27.9)#618 |
| 2. | Bridgewater | 35.92% | 8.56%(+27.4)#2 | 8.59%(+27.3)#658 |
| 3. | Candlewood Knolls | 33.53% | 8.56%(+25.0)#3 | 8.59%(+24.9)#783 |
| 4. | Redding Center | 31.78% | 8.56%(+23.2)#4 | 8.59%(+23.2)#910 |
| 5. | Branchville | 31.65% | 8.56%(+23.1)#5 | 8.59%(+23.1)#918 |
| 6. | Riverton | 29.82% | 8.56%(+21.3)#6 | 8.59%(+21.2)#1,079 |
| 7. | Madison Center | 29.56% | 8.56%(+21.0)#7 | 8.59%(+21.0)#1,105 |
| 8. | Candlewood Shores | 28.91% | 8.56%(+20.4)#8 | 8.59%(+20.3)#1,185 |
| 9. | Candlewood Isle | 28.69% | 8.56%(+20.1)#9 | 8.59%(+20.1)#1,210 |
| 10. | Candlewood Lake Club | 28.28% | 8.56%(+19.7)#10 | 8.59%(+19.7)#1,259 |
| 11. | Hawleyville | 28.00% | 8.56%(+19.4)#11 | 8.59%(+19.4)#1,296 |
| 12. | Sharon | 27.79% | 8.56%(+19.2)#12 | 8.59%(+19.2)#1,314 |
| 13. | Fenwick Borough | 27.50% | 8.56%(+18.9)#13 | 8.59%(+18.9)#1,354 |
| 14. | Lakeville | 26.19% | 8.56%(+17.6)#14 | 8.59%(+17.6)#1,546 |
| 15. | Stonington Borough | 25.69% | 8.56%(+17.1)#15 | 8.59%(+17.1)#1,609 |
| 16. | Brookfield Center | 25.29% | 8.56%(+16.7)#16 | 8.59%(+16.7)#1,692 |
| 17. | Mamanasco Lake | 24.68% | 8.56%(+16.1)#17 | 8.59%(+16.1)#1,789 |
| 18. | Lakeside Woods | 24.38% | 8.56%(+15.8)#18 | 8.59%(+15.8)#1,845 |
| 19. | Deep River Center | 24.15% | 8.56%(+15.6)#19 | 8.59%(+15.6)#1,891 |
| 20. | Poplar Plains | 24.11% | 8.56%(+15.5)#20 | 8.59%(+15.5)#1,900 |
| 21. | West Simsbury | 23.50% | 8.56%(+14.9)#21 | 8.59%(+14.9)#2,015 |
| 22. | Noank | 22.66% | 8.56%(+14.1)#22 | 8.59%(+14.1)#2,175 |
| 23. | Noroton Heights | 22.55% | 8.56%(+14.0)#23 | 8.59%(+14.0)#2,190 |
| 24. | Lakes East | 21.41% | 8.56%(+12.9)#24 | 8.59%(+12.8)#2,520 |
| 25. | Litchfield Borough | 20.66% | 8.56%(+12.1)#25 | 8.59%(+12.1)#2,748 |
| 26. | Groton Long Point Borough | 20.50% | 8.56%(+11.9)#26 | 8.59%(+11.9)#2,802 |
| 27. | Clinton | 20.40% | 8.56%(+11.8)#27 | 8.59%(+11.8)#2,832 |
| 28. | Quinebaug | 19.66% | 8.56%(+11.1)#28 | 8.59%(+11.1)#3,100 |
| 29. | Mystic | 19.61% | 8.56%(+11.0)#29 | 8.59%(+11.0)#3,124 |
| 30. | Colchester | 19.54% | 8.56%(+11.0)#30 | 8.59%(+10.9)#3,161 |
| 31. | Old Mystic | 19.14% | 8.56%(+10.6)#31 | 8.59%(+10.6)#3,336 |
| 32. | Moodus | 18.55% | 8.56%(+9.99)#32 | 8.59%(+9.96)#3,581 |
| 33. | Collinsville | 17.89% | 8.56%(+9.33)#33 | 8.59%(+9.30)#3,920 |
| 34. | Heritage Village | 17.71% | 8.56%(+9.14)#34 | 8.59%(+9.12)#4,037 |
| 35. | Durham | 17.56% | 8.56%(+8.99)#35 | 8.59%(+8.97)#4,135 |
| 36. | Essex Village | 17.39% | 8.56%(+8.83)#36 | 8.59%(+8.81)#4,233 |
| 37. | Falls Village | 17.34% | 8.56%(+8.77)#37 | 8.59%(+8.75)#4,271 |
| 38. | Pleasant Valley | 17.26% | 8.56%(+8.70)#38 | 8.59%(+8.68)#4,308 |
| 39. | Dayville | 17.24% | 8.56%(+8.68)#39 | 8.59%(+8.65)#4,326 |
| 40. | Norfolk | 17.18% | 8.56%(+8.62)#40 | 8.59%(+8.59)#4,361 |
| 41. | Tokeneke | 17.09% | 8.56%(+8.53)#41 | 8.59%(+8.50)#4,418 |
| 42. | Hazardville | 17.00% | 8.56%(+8.44)#42 | 8.59%(+8.41)#4,466 |
| 43. | Chimney Point | 16.98% | 8.56%(+8.42)#43 | 8.59%(+8.39)#4,484 |
| 44. | Higganum | 16.66% | 8.56%(+8.09)#44 | 8.59%(+8.07)#4,700 |
| 45. | Noroton | 16.65% | 8.56%(+8.08)#45 | 8.59%(+8.06)#4,703 |
| 46. | Weatogue | 16.29% | 8.56%(+7.72)#46 | 8.59%(+7.70)#4,954 |
| 47. | New Canaan | 16.26% | 8.56%(+7.70)#47 | 8.59%(+7.67)#4,971 |
| 48. | Dodgingtown | 15.73% | 8.56%(+7.17)#48 | 8.59%(+7.14)#5,382 |
| 49. | Chester Center | 15.62% | 8.56%(+7.05)#49 | 8.59%(+7.03)#5,479 |
| 50. | Simsbury Center | 15.53% | 8.56%(+6.97)#50 | 8.59%(+6.94)#5,533 |
| 51. | Gales Ferry | 15.45% | 8.56%(+6.89)#51 | 8.59%(+6.87)#5,580 |
| 52. | Candlewood Orchards | 15.27% | 8.56%(+6.71)#52 | 8.59%(+6.68)#5,720 |
| 53. | Somers | 15.15% | 8.56%(+6.59)#53 | 8.59%(+6.56)#5,814 |
| 54. | Salmon Brook | 14.93% | 8.56%(+6.36)#54 | 8.59%(+6.34)#6,037 |
| 55. | Weston | 14.81% | 8.56%(+6.24)#55 | 8.59%(+6.22)#6,147 |
| 56. | North Granby | 14.65% | 8.56%(+6.09)#56 | 8.59%(+6.06)#6,284 |
| 57. | Plainfield Village | 14.40% | 8.56%(+5.84)#57 | 8.59%(+5.81)#6,540 |
| 58. | South Windham | 14.31% | 8.56%(+5.74)#58 | 8.59%(+5.72)#6,639 |
| 59. | Old Greenwich | 14.26% | 8.56%(+5.70)#59 | 8.59%(+5.68)#6,708 |
| 60. | Northwest Harwinton | 14.21% | 8.56%(+5.65)#60 | 8.59%(+5.62)#6,750 |
| 61. | New Milford | 14.11% | 8.56%(+5.55)#61 | 8.59%(+5.52)#6,839 |
| 62. | Winsted | 14.08% | 8.56%(+5.52)#62 | 8.59%(+5.50)#6,876 |
| 63. | Pawcatuck | 14.06% | 8.56%(+5.50)#63 | 8.59%(+5.47)#6,909 |
| 64. | Newtown Borough | 14.04% | 8.56%(+5.48)#64 | 8.59%(+5.45)#6,927 |
| 65. | Cornwall Bridge | 13.97% | 8.56%(+5.41)#65 | 8.59%(+5.39)#6,988 |
| 66. | Staples | 13.71% | 8.56%(+5.15)#66 | 8.59%(+5.12)#7,275 |
| 67. | New Hartford Center | 13.49% | 8.56%(+4.93)#67 | 8.59%(+4.90)#7,522 |
| 68. | Ridgefield | 13.35% | 8.56%(+4.79)#68 | 8.59%(+4.76)#7,668 |
| 69. | Saugatuck | 13.30% | 8.56%(+4.74)#69 | 8.59%(+4.72)#7,715 |
| 70. | Thomaston | 13.27% | 8.56%(+4.71)#70 | 8.59%(+4.68)#7,753 |
| 71. | South Woodstock | 13.19% | 8.56%(+4.63)#71 | 8.59%(+4.60)#7,856 |
| 72. | Murray | 13.01% | 8.56%(+4.45)#72 | 8.59%(+4.42)#8,055 |
| 73. | Groton | 12.99% | 8.56%(+4.42)#73 | 8.59%(+4.40)#8,091 |
| 74. | Coventry Lake | 12.96% | 8.56%(+4.40)#74 | 8.59%(+4.37)#8,119 |
| 75. | Lakes West | 12.89% | 8.56%(+4.32)#75 | 8.59%(+4.30)#8,202 |
| 76. | Old Saybrook Center | 12.84% | 8.56%(+4.28)#76 | 8.59%(+4.25)#8,257 |
| 77. | Mansfield Center | 12.80% | 8.56%(+4.24)#77 | 8.59%(+4.21)#8,295 |
| 78. | Guilford Center | 12.67% | 8.56%(+4.11)#78 | 8.59%(+4.08)#8,464 |
| 79. | Southport | 12.34% | 8.56%(+3.78)#79 | 8.59%(+3.75)#8,878 |
| 80. | Bantam Borough | 12.20% | 8.56%(+3.63)#80 | 8.59%(+3.61)#9,071 |
| 81. | Oxoboxo River | 12.10% | 8.56%(+3.54)#81 | 8.59%(+3.52)#9,204 |
| 82. | Niantic | 11.98% | 8.56%(+3.42)#82 | 8.59%(+3.39)#9,361 |
| 83. | Woodbury Center | 11.97% | 8.56%(+3.41)#83 | 8.59%(+3.38)#9,368 |
| 84. | Lordship | 11.87% | 8.56%(+3.31)#84 | 8.59%(+3.28)#9,507 |
| 85. | Lake Pocotopaug | 11.87% | 8.56%(+3.31)#85 | 8.59%(+3.28)#9,513 |
| 86. | Waterford | 11.84% | 8.56%(+3.28)#86 | 8.59%(+3.26)#9,551 |
| 87. | Indian Field | 11.75% | 8.56%(+3.19)#87 | 8.59%(+3.16)#9,695 |
| 88. | Southwood Acres | 11.50% | 8.56%(+2.94)#88 | 8.59%(+2.92)#10,042 |
| 89. | Mechanicsville | 11.44% | 8.56%(+2.88)#89 | 8.59%(+2.85)#10,128 |
| 90. | Compo | 11.41% | 8.56%(+2.85)#90 | 8.59%(+2.82)#10,173 |
| 91. | Daniels Farm | 11.36% | 8.56%(+2.79)#91 | 8.59%(+2.77)#10,252 |
| 92. | Terramuggus | 11.31% | 8.56%(+2.75)#92 | 8.59%(+2.72)#10,328 |
| 93. | Canaan | 11.31% | 8.56%(+2.75)#93 | 8.59%(+2.72)#10,334 |
| 94. | Westport | 11.28% | 8.56%(+2.72)#94 | 8.59%(+2.69)#10,374 |
| 95. | Oronoque | 11.24% | 8.56%(+2.68)#95 | 8.59%(+2.65)#10,433 |
| 96. | Moosup | 11.21% | 8.56%(+2.65)#96 | 8.59%(+2.62)#10,474 |
| 97. | Bethlehem Village | 11.13% | 8.56%(+2.56)#97 | 8.59%(+2.54)#10,603 |
| 98. | Canton Valley | 11.12% | 8.56%(+2.56)#98 | 8.59%(+2.53)#10,610 |
| 99. | West Cornwall | 11.11% | 8.56%(+2.55)#99 | 8.59%(+2.52)#10,641 |
| 100. | New Preston | 11.01% | 8.56%(+2.45)#100 | 8.59%(+2.43)#10,776 |
Common Questions
What are the Top 10 Cities with the Highest Percentage of English Population in Connecticut?
Top 10 Cities with the Highest Percentage of English Population in Connecticut are:
#1
29.56%
#2
27.79%
#3
26.19%
#4
24.15%
#5
23.50%
#6
22.66%
#7
20.40%
#8
19.66%
#9
19.61%
#10
19.54%
What city has the Highest Percentage of English Population in Connecticut?
Madison Center has the Highest Percentage of English Population in Connecticut with 29.56%.
What is the Percentage of English Population in the State of Connecticut?
Percentage of English Population in Connecticut is 8.56%.
What is the Percentage of English Population in the United States?
Percentage of English Population in the United States is 8.59%.