Conning Towers Nautilus Park, CT Map & Demographics
Conning Towers Nautilus Park Map
Conning Towers Nautilus Park Overview
$30,443
PER CAPITA INCOME
$71,866
AVG FAMILY INCOME
$75,753
AVG HOUSEHOLD INCOME
10.2%
WAGE / INCOME GAP [ % ]
89.8¢/ $1
WAGE / INCOME GAP [ $ ]
$5,045
FAMILY INCOME DEFICIT
0.33
INEQUALITY / GINI INDEX
8,330
TOTAL POPULATION
4,939
MALE POPULATION
3,391
FEMALE POPULATION
145.65
MALES / 100 FEMALES
68.66
FEMALES / 100 MALES
24.8
MEDIAN AGE
3.2
AVG FAMILY SIZE
2.7
AVG HOUSEHOLD SIZE
4,402
LABOR FORCE [ PEOPLE ]
70.4%
PERCENT IN LABOR FORCE
7.5%
UNEMPLOYMENT RATE
Income in Conning Towers Nautilus Park
Income Overview in Conning Towers Nautilus Park
Per Capita Income in Conning Towers Nautilus Park is $30,443, while median incomes of families and households are $71,866 and $75,753 respectively.
| Characteristic | Number | Measure |
| Per Capita Income | 8,330 | $30,443 |
| Median Family Income | 1,838 | $71,866 |
| Mean Family Income | 1,838 | $88,010 |
| Median Household Income | 2,521 | $75,753 |
| Mean Household Income | 2,521 | $86,627 |
| Income Deficit | 1,838 | $5,045 |
| Wage / Income Gap (%) | 8,330 | 10.25% |
| Wage / Income Gap ($) | 8,330 | 89.75¢ per $1 |
| Gini / Inequality Index | 8,330 | 0.33 |
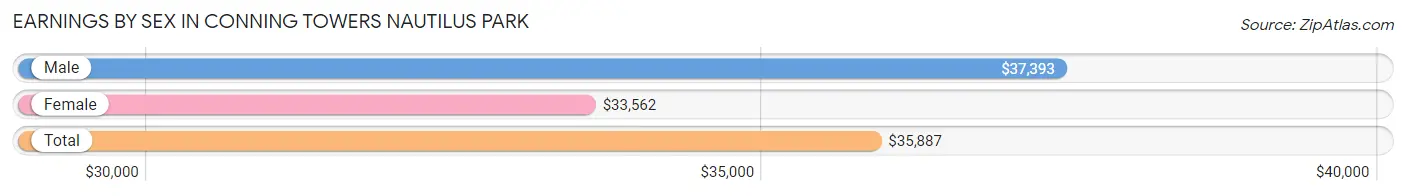
Earnings by Sex in Conning Towers Nautilus Park
Average Earnings in Conning Towers Nautilus Park are $35,887, $37,393 for men and $33,562 for women, a difference of 10.2%.
| Sex | Number | Average Earnings |
| Male | 3,323 (71.1%) | $37,393 |
| Female | 1,351 (28.9%) | $33,562 |
| Total | 4,674 (100.0%) | $35,887 |
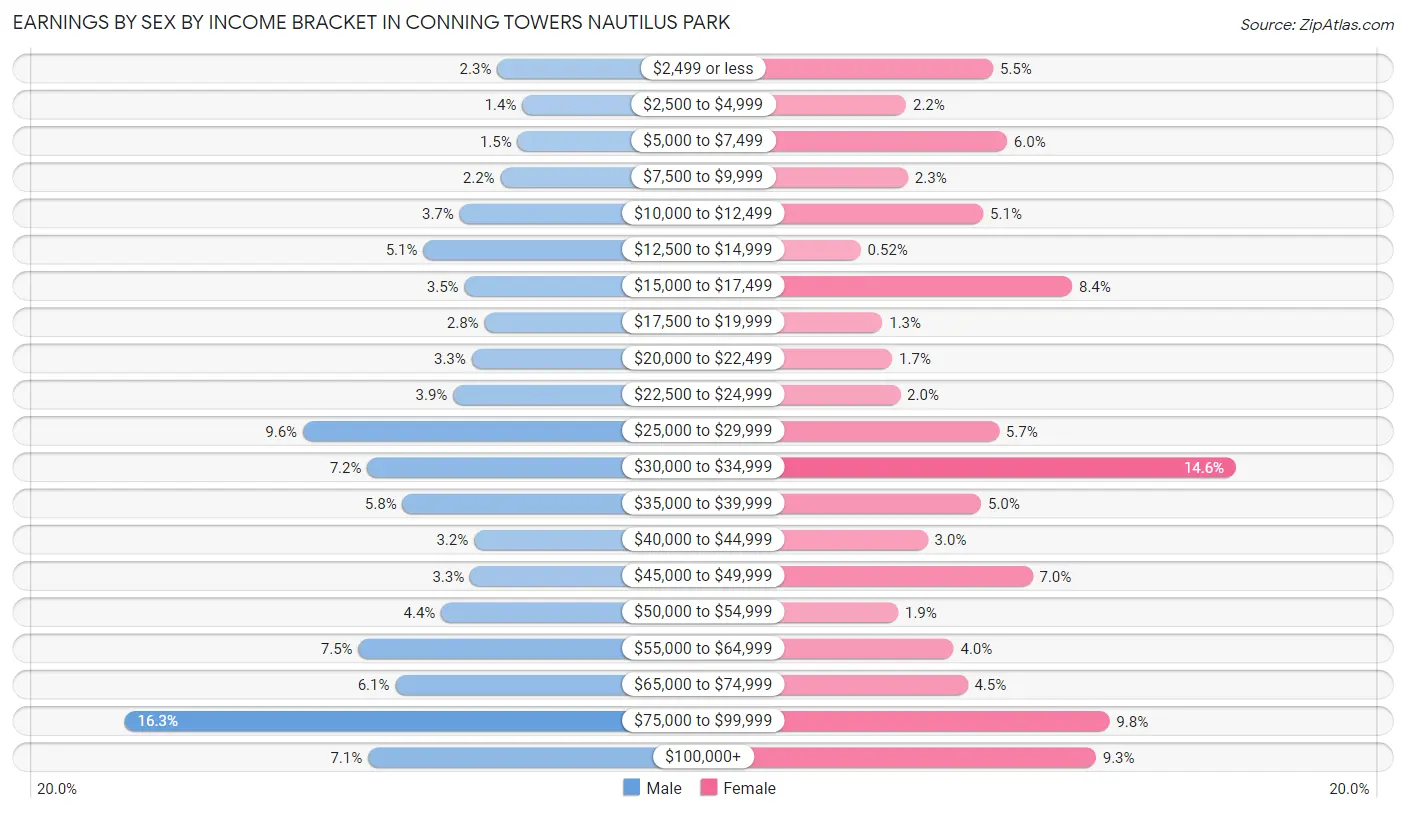
Earnings by Sex by Income Bracket in Conning Towers Nautilus Park
The most common earnings brackets in Conning Towers Nautilus Park are $75,000 to $99,999 for men (540 | 16.3%) and $30,000 to $34,999 for women (197 | 14.6%).
| Income | Male | Female |
| $2,499 or less | 76 (2.3%) | 74 (5.5%) |
| $2,500 to $4,999 | 45 (1.3%) | 30 (2.2%) |
| $5,000 to $7,499 | 51 (1.5%) | 81 (6.0%) |
| $7,500 to $9,999 | 72 (2.2%) | 31 (2.3%) |
| $10,000 to $12,499 | 123 (3.7%) | 69 (5.1%) |
| $12,500 to $14,999 | 168 (5.1%) | 7 (0.5%) |
| $15,000 to $17,499 | 117 (3.5%) | 114 (8.4%) |
| $17,500 to $19,999 | 92 (2.8%) | 18 (1.3%) |
| $20,000 to $22,499 | 108 (3.3%) | 23 (1.7%) |
| $22,500 to $24,999 | 131 (3.9%) | 27 (2.0%) |
| $25,000 to $29,999 | 318 (9.6%) | 77 (5.7%) |
| $30,000 to $34,999 | 238 (7.2%) | 197 (14.6%) |
| $35,000 to $39,999 | 194 (5.8%) | 68 (5.0%) |
| $40,000 to $44,999 | 105 (3.2%) | 41 (3.0%) |
| $45,000 to $49,999 | 110 (3.3%) | 94 (7.0%) |
| $50,000 to $54,999 | 146 (4.4%) | 26 (1.9%) |
| $55,000 to $64,999 | 249 (7.5%) | 54 (4.0%) |
| $65,000 to $74,999 | 203 (6.1%) | 61 (4.5%) |
| $75,000 to $99,999 | 540 (16.3%) | 133 (9.8%) |
| $100,000+ | 237 (7.1%) | 126 (9.3%) |
| Total | 3,323 (100.0%) | 1,351 (100.0%) |
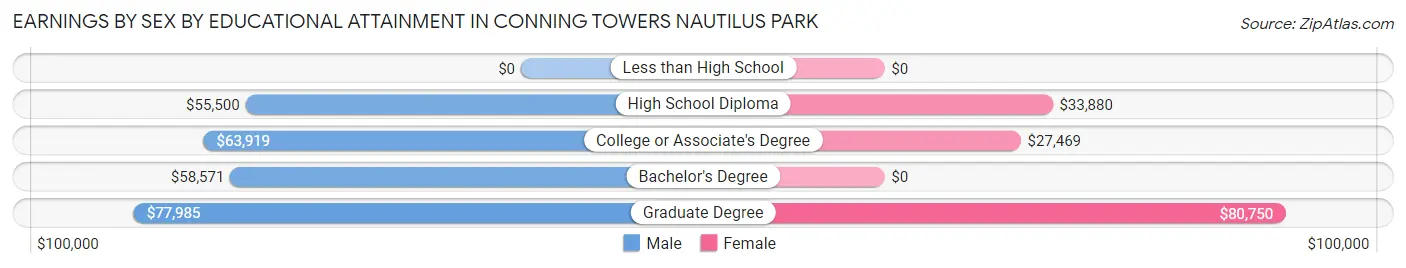
Earnings by Sex by Educational Attainment in Conning Towers Nautilus Park
Average earnings in Conning Towers Nautilus Park are $63,733 for men and $37,523 for women, a difference of 41.1%. Men with an educational attainment of graduate degree enjoy the highest average annual earnings of $77,985, while those with high school diploma education earn the least with $55,500. Women with an educational attainment of graduate degree earn the most with the average annual earnings of $80,750, while those with college or associate's degree education have the smallest earnings of $27,469.
| Educational Attainment | Male Income | Female Income |
| Less than High School | - | - |
| High School Diploma | $55,500 | $33,880 |
| College or Associate's Degree | $63,919 | $27,469 |
| Bachelor's Degree | $58,571 | $0 |
| Graduate Degree | $77,985 | $80,750 |
| Total | $63,733 | $37,523 |
Family Income in Conning Towers Nautilus Park
Family Income Brackets in Conning Towers Nautilus Park
According to the Conning Towers Nautilus Park family income data, there are 403 families falling into the $50,000 to $74,999 income range, which is the most common income bracket and makes up 21.9% of all families.
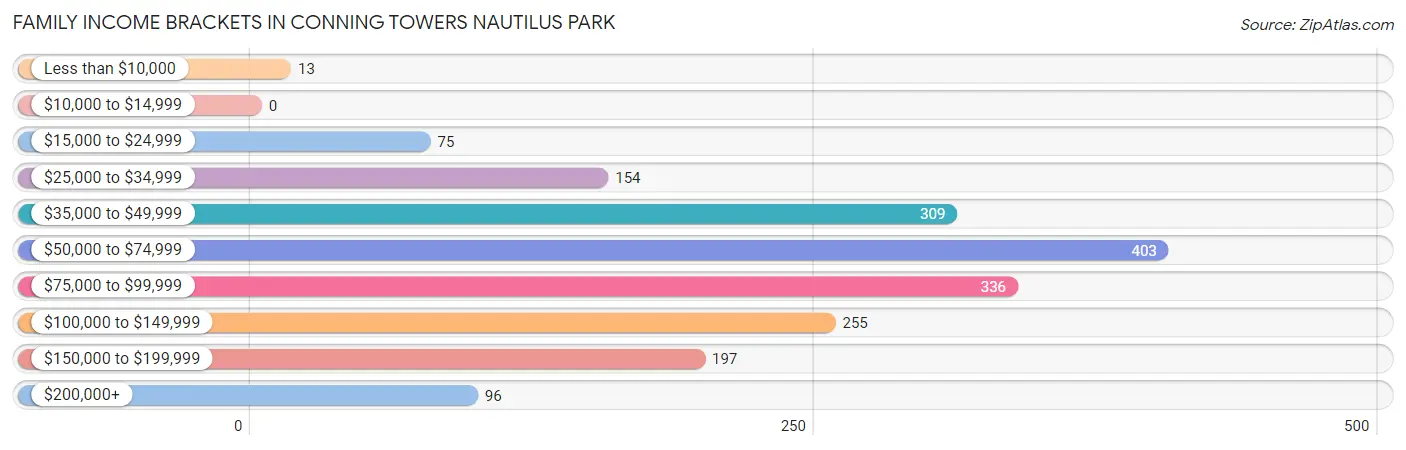
| Income Bracket | # Families | % Families |
| Less than $10,000 | 13 | 0.7% |
| $10,000 to $14,999 | 0 | 0.0% |
| $15,000 to $24,999 | 75 | 4.1% |
| $25,000 to $34,999 | 154 | 8.4% |
| $35,000 to $49,999 | 309 | 16.8% |
| $50,000 to $74,999 | 403 | 21.9% |
| $75,000 to $99,999 | 336 | 18.3% |
| $100,000 to $149,999 | 255 | 13.9% |
| $150,000 to $199,999 | 197 | 10.7% |
| $200,000+ | 96 | 5.2% |
Family Income by Famaliy Size in Conning Towers Nautilus Park
3-person families (645 | 35.1%) account for the highest median family income in Conning Towers Nautilus Park with $76,032 per family, while 2-person families (674 | 36.7%) have the highest median income of $32,292 per family member.
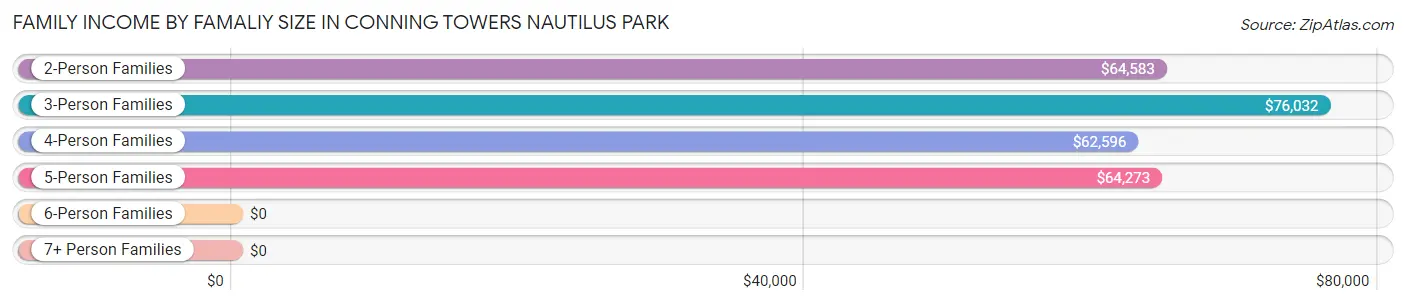
| Income Bracket | # Families | Median Income |
| 2-Person Families | 674 (36.7%) | $64,583 |
| 3-Person Families | 645 (35.1%) | $76,032 |
| 4-Person Families | 345 (18.8%) | $62,596 |
| 5-Person Families | 118 (6.4%) | $64,273 |
| 6-Person Families | 26 (1.4%) | $0 |
| 7+ Person Families | 30 (1.6%) | $0 |
| Total | 1,838 (100.0%) | $71,866 |
Family Income by Number of Earners in Conning Towers Nautilus Park
The median family income in Conning Towers Nautilus Park is $71,866, with families comprising 3+ earners (50) having the highest median family income of $213,417, while families with no earners (107) have the lowest median family income of $43,785, accounting for 2.7% and 5.8% of families, respectively.
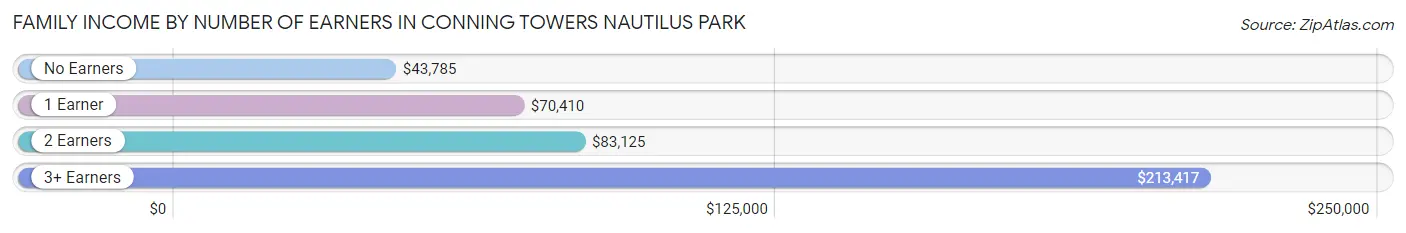
| Number of Earners | # Families | Median Income |
| No Earners | 107 (5.8%) | $43,785 |
| 1 Earner | 964 (52.4%) | $70,410 |
| 2 Earners | 717 (39.0%) | $83,125 |
| 3+ Earners | 50 (2.7%) | $213,417 |
| Total | 1,838 (100.0%) | $71,866 |
Household Income in Conning Towers Nautilus Park
Household Income Brackets in Conning Towers Nautilus Park
With 567 households falling in the category, the $75,000 to $99,999 income range is the most frequent in Conning Towers Nautilus Park, accounting for 22.5% of all households. In contrast, only 28 households (1.1%) fall into the $10,000 to $14,999 income bracket, making it the least populous group.
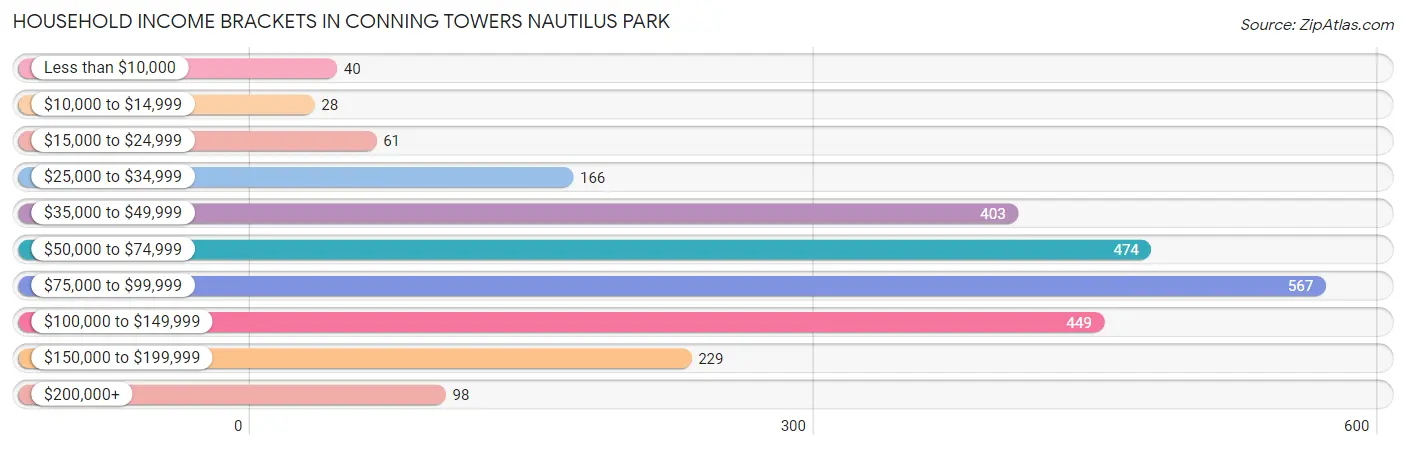
| Income Bracket | # Households | % Households |
| Less than $10,000 | 40 | 1.6% |
| $10,000 to $14,999 | 28 | 1.1% |
| $15,000 to $24,999 | 61 | 2.4% |
| $25,000 to $34,999 | 166 | 6.6% |
| $35,000 to $49,999 | 403 | 16.0% |
| $50,000 to $74,999 | 474 | 18.8% |
| $75,000 to $99,999 | 567 | 22.5% |
| $100,000 to $149,999 | 449 | 17.8% |
| $150,000 to $199,999 | 229 | 9.1% |
| $200,000+ | 98 | 3.9% |
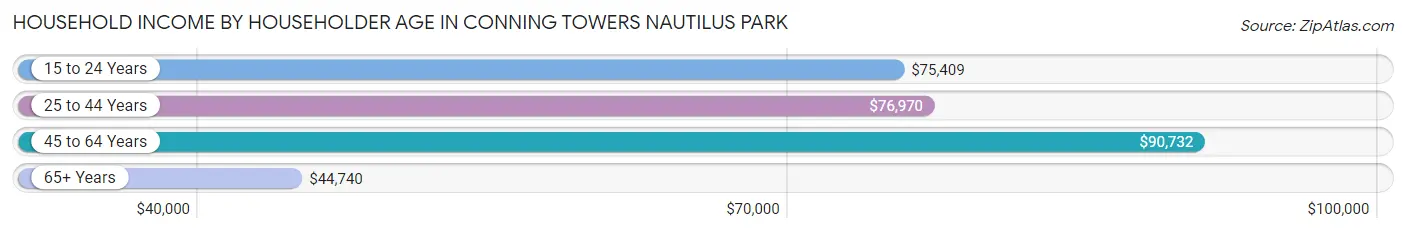
Household Income by Householder Age in Conning Towers Nautilus Park
The median household income in Conning Towers Nautilus Park is $75,753, with the highest median household income of $90,732 found in the 45 to 64 years age bracket for the primary householder. A total of 475 households (18.8%) fall into this category. Meanwhile, the 65+ years age bracket for the primary householder has the lowest median household income of $44,740, with 373 households (14.8%) in this group.
| Income Bracket | # Households | Median Income |
| 15 to 24 Years | 437 (17.3%) | $75,409 |
| 25 to 44 Years | 1,236 (49.0%) | $76,970 |
| 45 to 64 Years | 475 (18.8%) | $90,732 |
| 65+ Years | 373 (14.8%) | $44,740 |
| Total | 2,521 (100.0%) | $75,753 |
Poverty in Conning Towers Nautilus Park
Income Below Poverty by Sex and Age in Conning Towers Nautilus Park
With 4.8% poverty level for males and 5.4% for females among the residents of Conning Towers Nautilus Park, 18 to 24 year old males and 16 and 17 year old females are the most vulnerable to poverty, with 66 males (15.9%) and 5 females (50.0%) in their respective age groups living below the poverty level.
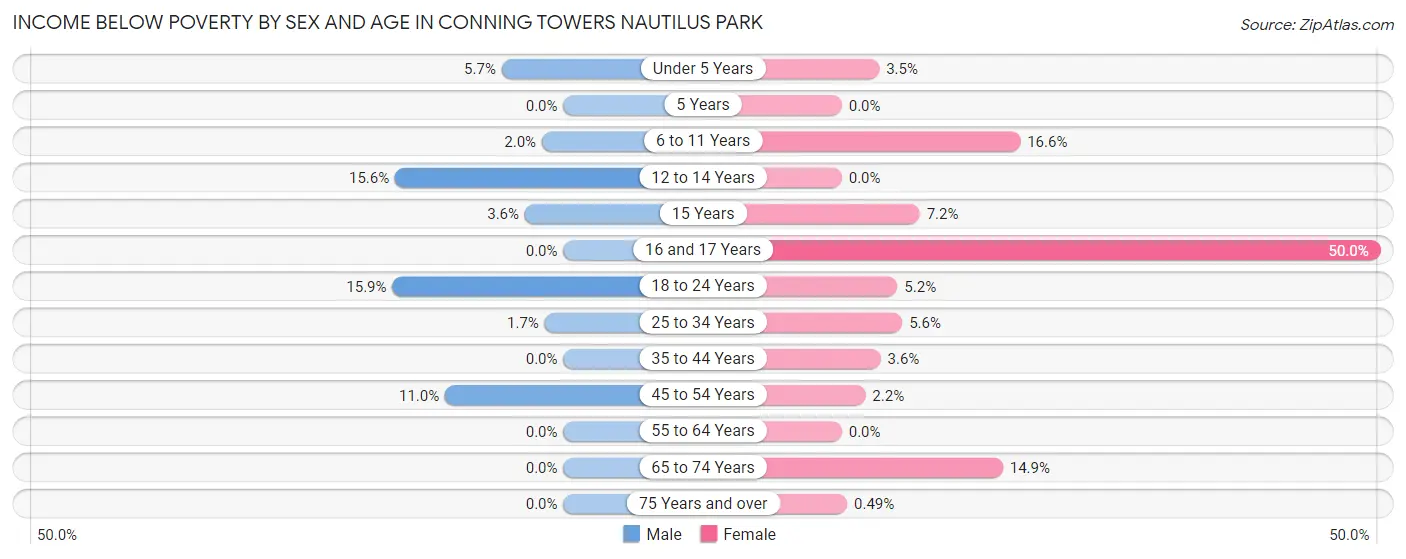
| Age Bracket | Male | Female |
| Under 5 Years | 31 (5.7%) | 14 (3.5%) |
| 5 Years | 0 (0.0%) | 0 (0.0%) |
| 6 to 11 Years | 6 (2.0%) | 50 (16.6%) |
| 12 to 14 Years | 20 (15.6%) | 0 (0.0%) |
| 15 Years | 5 (3.6%) | 6 (7.2%) |
| 16 and 17 Years | 0 (0.0%) | 5 (50.0%) |
| 18 to 24 Years | 66 (15.9%) | 33 (5.2%) |
| 25 to 34 Years | 17 (1.7%) | 39 (5.6%) |
| 35 to 44 Years | 0 (0.0%) | 12 (3.6%) |
| 45 to 54 Years | 28 (11.0%) | 5 (2.2%) |
| 55 to 64 Years | 0 (0.0%) | 0 (0.0%) |
| 65 to 74 Years | 0 (0.0%) | 13 (14.9%) |
| 75 Years and over | 0 (0.0%) | 1 (0.5%) |
| Total | 173 (4.8%) | 178 (5.4%) |
Income Above Poverty by Sex and Age in Conning Towers Nautilus Park
According to the poverty statistics in Conning Towers Nautilus Park, males aged 5 years and females aged 5 years are the age groups that are most secure financially, with 100.0% of males and 100.0% of females in these age groups living above the poverty line.
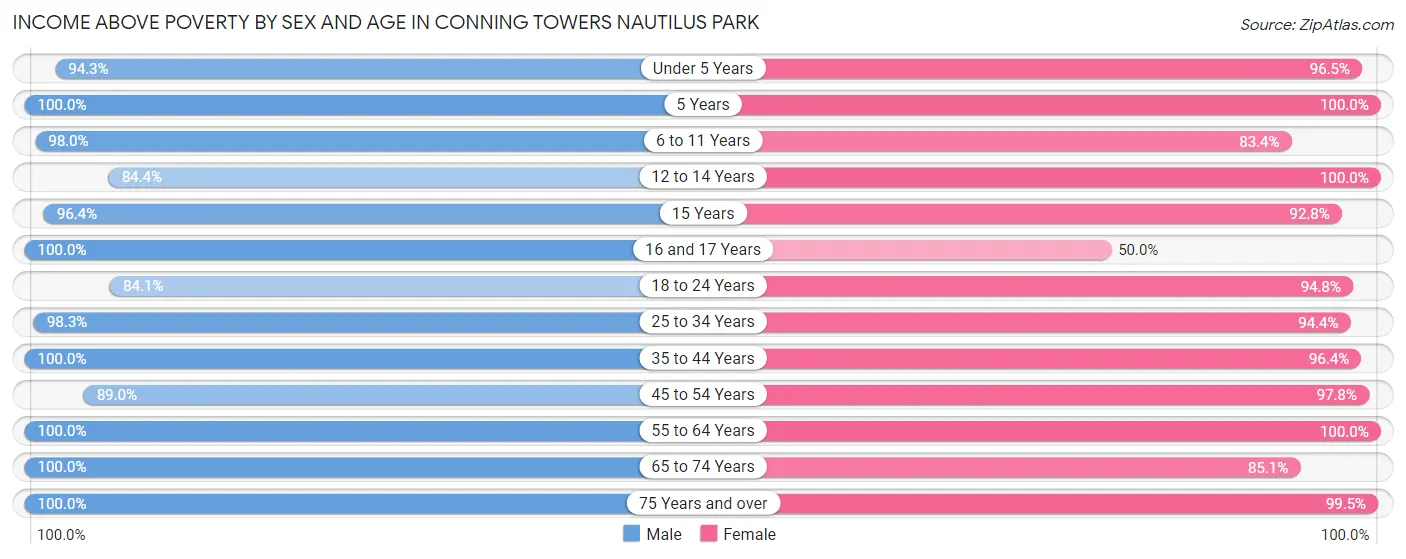
| Age Bracket | Male | Female |
| Under 5 Years | 511 (94.3%) | 390 (96.5%) |
| 5 Years | 42 (100.0%) | 26 (100.0%) |
| 6 to 11 Years | 295 (98.0%) | 252 (83.4%) |
| 12 to 14 Years | 108 (84.4%) | 105 (100.0%) |
| 15 Years | 135 (96.4%) | 77 (92.8%) |
| 16 and 17 Years | 68 (100.0%) | 5 (50.0%) |
| 18 to 24 Years | 350 (84.1%) | 606 (94.8%) |
| 25 to 34 Years | 966 (98.3%) | 656 (94.4%) |
| 35 to 44 Years | 328 (100.0%) | 321 (96.4%) |
| 45 to 54 Years | 227 (89.0%) | 223 (97.8%) |
| 55 to 64 Years | 131 (100.0%) | 158 (100.0%) |
| 65 to 74 Years | 117 (100.0%) | 74 (85.1%) |
| 75 Years and over | 168 (100.0%) | 203 (99.5%) |
| Total | 3,446 (95.2%) | 3,096 (94.6%) |
Income Below Poverty Among Married-Couple Families in Conning Towers Nautilus Park
The poverty statistics for married-couple families in Conning Towers Nautilus Park show that 3.3% or 47 of the total 1,418 families live below the poverty line. Families with 1 or 2 children have the highest poverty rate of 4.3%, comprising of 30 families. On the other hand, families with 3 or 4 children have the lowest poverty rate of 0.0%, which includes 0 families.
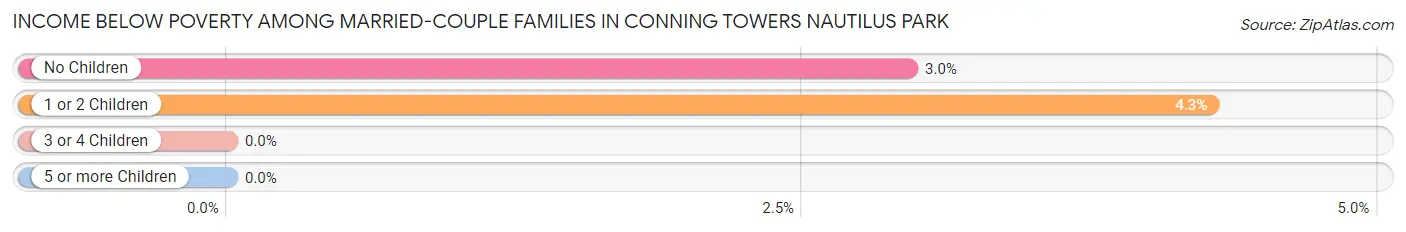
| Children | Above Poverty | Below Poverty |
| No Children | 557 (97.0%) | 17 (3.0%) |
| 1 or 2 Children | 672 (95.7%) | 30 (4.3%) |
| 3 or 4 Children | 142 (100.0%) | 0 (0.0%) |
| 5 or more Children | 0 (0.0%) | 0 (0.0%) |
| Total | 1,371 (96.7%) | 47 (3.3%) |
Income Below Poverty Among Single-Parent Households in Conning Towers Nautilus Park
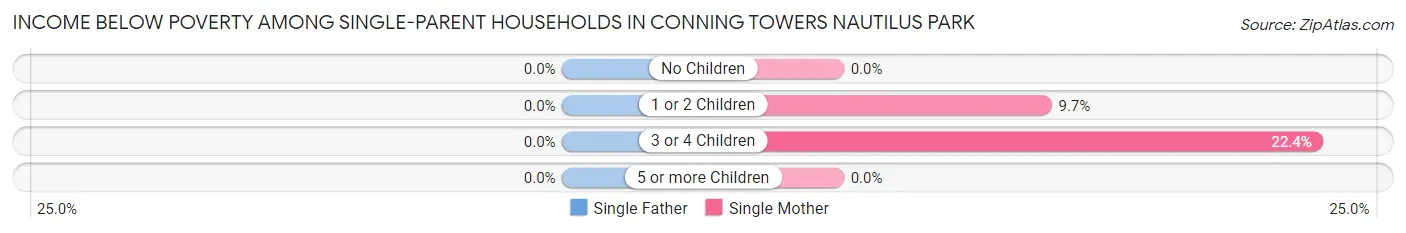
| Children | Single Father | Single Mother |
| No Children | 0 (0.0%) | 0 (0.0%) |
| 1 or 2 Children | 0 (0.0%) | 12 (9.7%) |
| 3 or 4 Children | 0 (0.0%) | 19 (22.4%) |
| 5 or more Children | 0 (0.0%) | 0 (0.0%) |
| Total | 0 (0.0%) | 31 (10.1%) |
Income Below Poverty Among Married-Couple vs Single-Parent Households in Conning Towers Nautilus Park
The poverty data for Conning Towers Nautilus Park shows that 47 of the married-couple family households (3.3%) and 31 of the single-parent households (7.4%) are living below the poverty level. Within the married-couple family households, those with 1 or 2 children have the highest poverty rate, with 30 households (4.3%) falling below the poverty line. Among the single-parent households, those with 3 or 4 children have the highest poverty rate, with 19 household (11.7%) living below poverty.
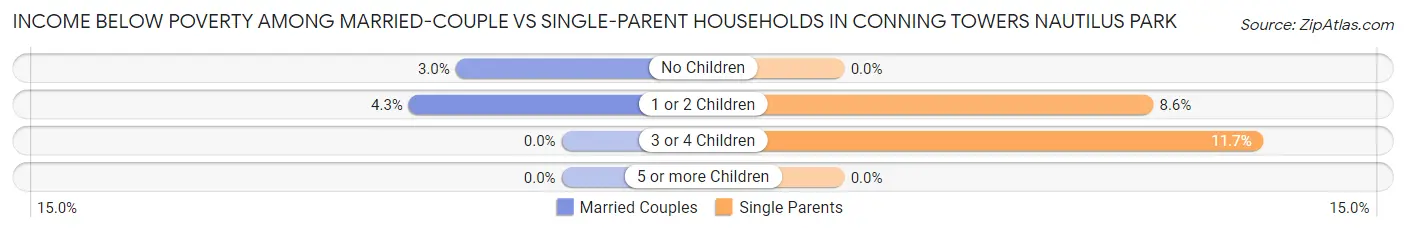
| Children | Married-Couple Families | Single-Parent Households |
| No Children | 17 (3.0%) | 0 (0.0%) |
| 1 or 2 Children | 30 (4.3%) | 12 (8.6%) |
| 3 or 4 Children | 0 (0.0%) | 19 (11.7%) |
| 5 or more Children | 0 (0.0%) | 0 (0.0%) |
| Total | 47 (3.3%) | 31 (7.4%) |
Race in Conning Towers Nautilus Park
The most populous races in Conning Towers Nautilus Park are White / Caucasian (6,335 | 76.0%), Hispanic or Latino (1,477 | 17.7%), and Two or more Races (1,003 | 12.0%).
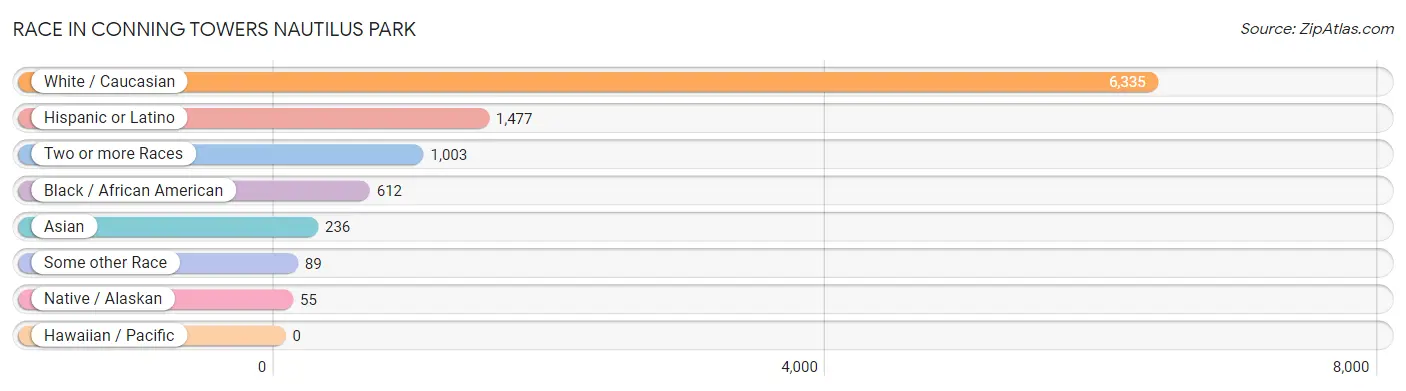
| Race | # Population | % Population |
| Asian | 236 | 2.8% |
| Black / African American | 612 | 7.3% |
| Hawaiian / Pacific | 0 | 0.0% |
| Hispanic or Latino | 1,477 | 17.7% |
| Native / Alaskan | 55 | 0.7% |
| White / Caucasian | 6,335 | 76.0% |
| Two or more Races | 1,003 | 12.0% |
| Some other Race | 89 | 1.1% |
| Total | 8,330 | 100.0% |
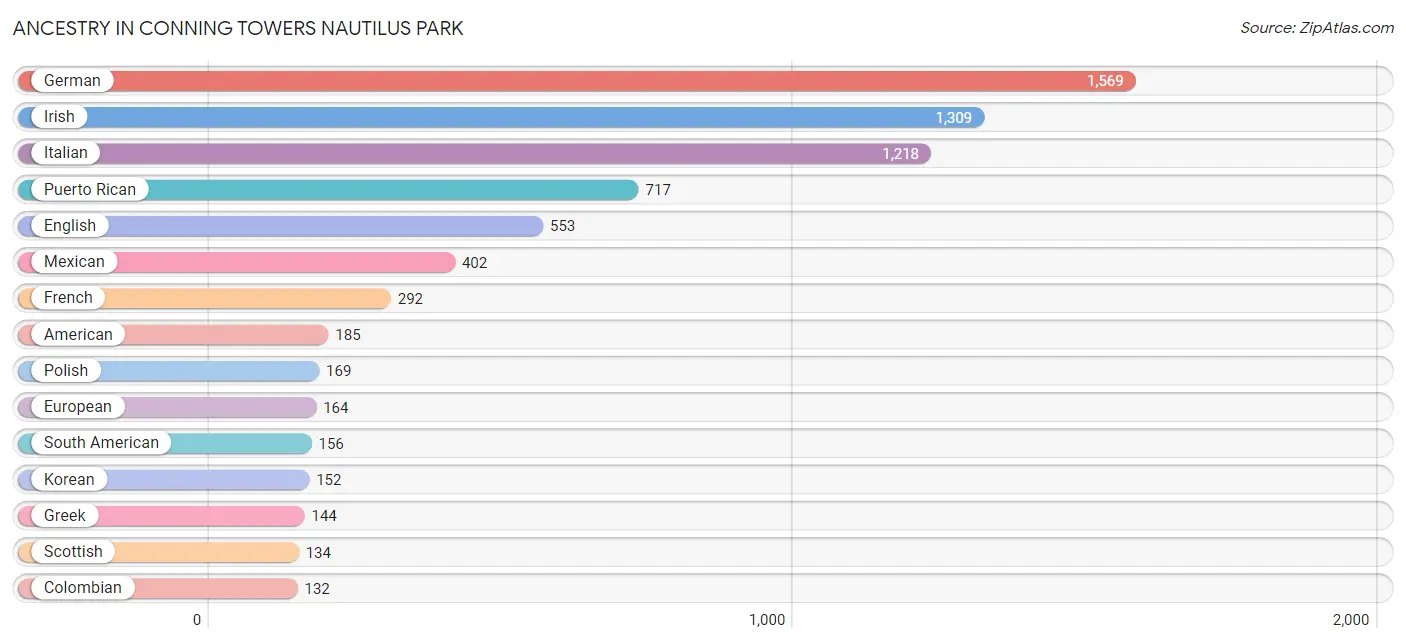
Ancestry in Conning Towers Nautilus Park
The most populous ancestries reported in Conning Towers Nautilus Park are German (1,569 | 18.8%), Irish (1,309 | 15.7%), Italian (1,218 | 14.6%), Puerto Rican (717 | 8.6%), and English (553 | 6.6%), together accounting for 64.4% of all Conning Towers Nautilus Park residents.
| Ancestry | # Population | % Population |
| African | 12 | 0.1% |
| American | 185 | 2.2% |
| Apache | 55 | 0.7% |
| Arab | 11 | 0.1% |
| Austrian | 6 | 0.1% |
| Bhutanese | 22 | 0.3% |
| Brazilian | 6 | 0.1% |
| British | 92 | 1.1% |
| Burmese | 55 | 0.7% |
| Canadian | 10 | 0.1% |
| Central American | 88 | 1.1% |
| Central American Indian | 41 | 0.5% |
| Cherokee | 5 | 0.1% |
| Chinese | 5 | 0.1% |
| Chippewa | 46 | 0.5% |
| Colombian | 132 | 1.6% |
| Costa Rican | 24 | 0.3% |
| Cuban | 19 | 0.2% |
| Czech | 5 | 0.1% |
| Czechoslovakian | 30 | 0.4% |
| Danish | 58 | 0.7% |
| Dominican | 37 | 0.4% |
| Dutch | 56 | 0.7% |
| Eastern European | 6 | 0.1% |
| Ecuadorian | 24 | 0.3% |
| Egyptian | 3 | 0.0% |
| English | 553 | 6.6% |
| European | 164 | 2.0% |
| Filipino | 4 | 0.1% |
| Finnish | 5 | 0.1% |
| French | 292 | 3.5% |
| French Canadian | 106 | 1.3% |
| German | 1,569 | 18.8% |
| Greek | 144 | 1.7% |
| Guamanian / Chamorro | 66 | 0.8% |
| Guyanese | 6 | 0.1% |
| Haitian | 15 | 0.2% |
| Honduran | 8 | 0.1% |
| Hungarian | 20 | 0.2% |
| Indian (Asian) | 30 | 0.4% |
| Irish | 1,309 | 15.7% |
| Italian | 1,218 | 14.6% |
| Jamaican | 8 | 0.1% |
| Japanese | 3 | 0.0% |
| Korean | 152 | 1.8% |
| Liberian | 28 | 0.3% |
| Lithuanian | 29 | 0.4% |
| Malaysian | 50 | 0.6% |
| Mexican | 402 | 4.8% |
| Navajo | 62 | 0.7% |
| Northern European | 18 | 0.2% |
| Norwegian | 68 | 0.8% |
| Panamanian | 30 | 0.4% |
| Polish | 169 | 2.0% |
| Portuguese | 33 | 0.4% |
| Puerto Rican | 717 | 8.6% |
| Romanian | 8 | 0.1% |
| Russian | 108 | 1.3% |
| Salvadoran | 26 | 0.3% |
| Scandinavian | 18 | 0.2% |
| Scotch-Irish | 24 | 0.3% |
| Scottish | 134 | 1.6% |
| Slovak | 55 | 0.7% |
| South American | 156 | 1.9% |
| Spaniard | 7 | 0.1% |
| Spanish | 33 | 0.4% |
| Sri Lankan | 58 | 0.7% |
| Subsaharan African | 48 | 0.6% |
| Sudanese | 4 | 0.1% |
| Swedish | 89 | 1.1% |
| Thai | 66 | 0.8% |
| Ukrainian | 13 | 0.2% |
| Welsh | 92 | 1.1% | View All 73 Rows |
Immigrants in Conning Towers Nautilus Park
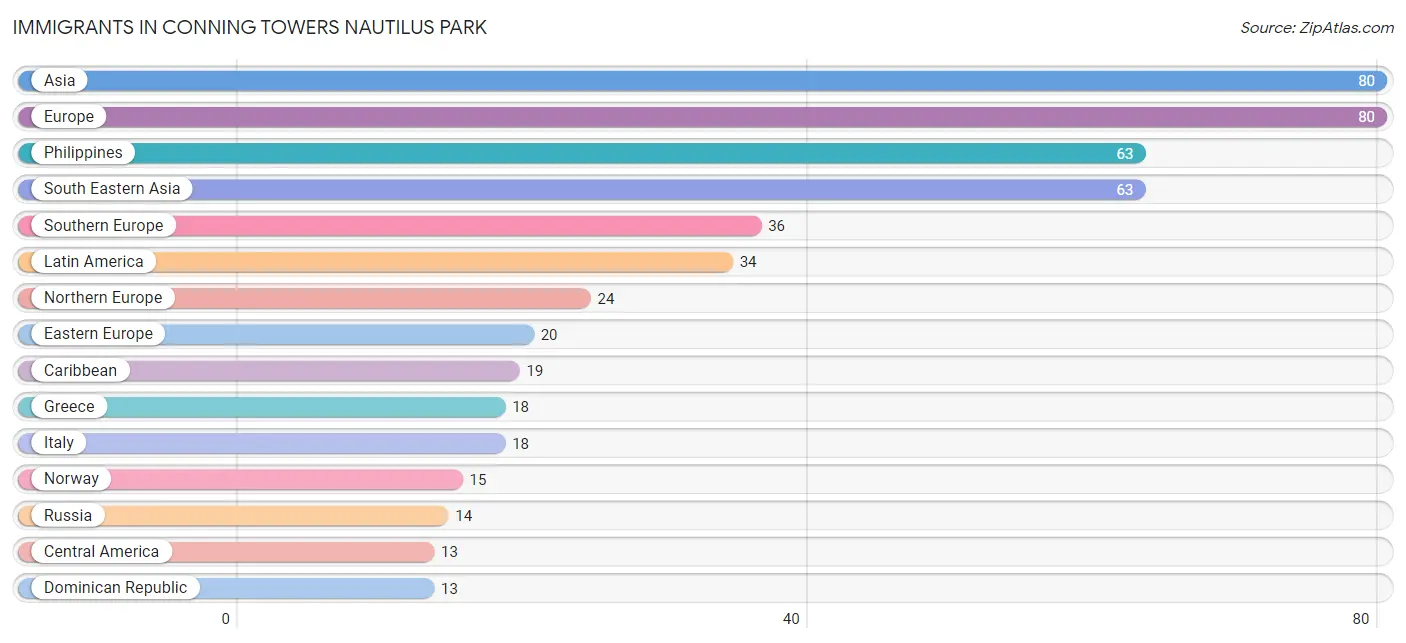
The most numerous immigrant groups reported in Conning Towers Nautilus Park came from Asia (80 | 1.0%), Europe (80 | 1.0%), Philippines (63 | 0.8%), South Eastern Asia (63 | 0.8%), and Southern Europe (36 | 0.4%), together accounting for 3.9% of all Conning Towers Nautilus Park residents.
| Immigration Origin | # Population | % Population |
| Africa | 4 | 0.1% |
| Asia | 80 | 1.0% |
| Canada | 6 | 0.1% |
| Caribbean | 19 | 0.2% |
| Central America | 13 | 0.2% |
| China | 12 | 0.1% |
| Dominican Republic | 13 | 0.2% |
| Eastern Asia | 12 | 0.1% |
| Eastern Europe | 20 | 0.2% |
| Ecuador | 2 | 0.0% |
| El Salvador | 13 | 0.2% |
| England | 5 | 0.1% |
| Europe | 80 | 1.0% |
| Greece | 18 | 0.2% |
| Haiti | 6 | 0.1% |
| India | 5 | 0.1% |
| Italy | 18 | 0.2% |
| Latin America | 34 | 0.4% |
| Northern Africa | 4 | 0.1% |
| Northern Europe | 24 | 0.3% |
| Norway | 15 | 0.2% |
| Philippines | 63 | 0.8% |
| Russia | 14 | 0.2% |
| South America | 2 | 0.0% |
| South Central Asia | 5 | 0.1% |
| South Eastern Asia | 63 | 0.8% |
| Southern Europe | 36 | 0.4% |
| Sudan | 4 | 0.1% |
| Ukraine | 6 | 0.1% | View All 29 Rows |
Sex and Age in Conning Towers Nautilus Park
Sex and Age in Conning Towers Nautilus Park
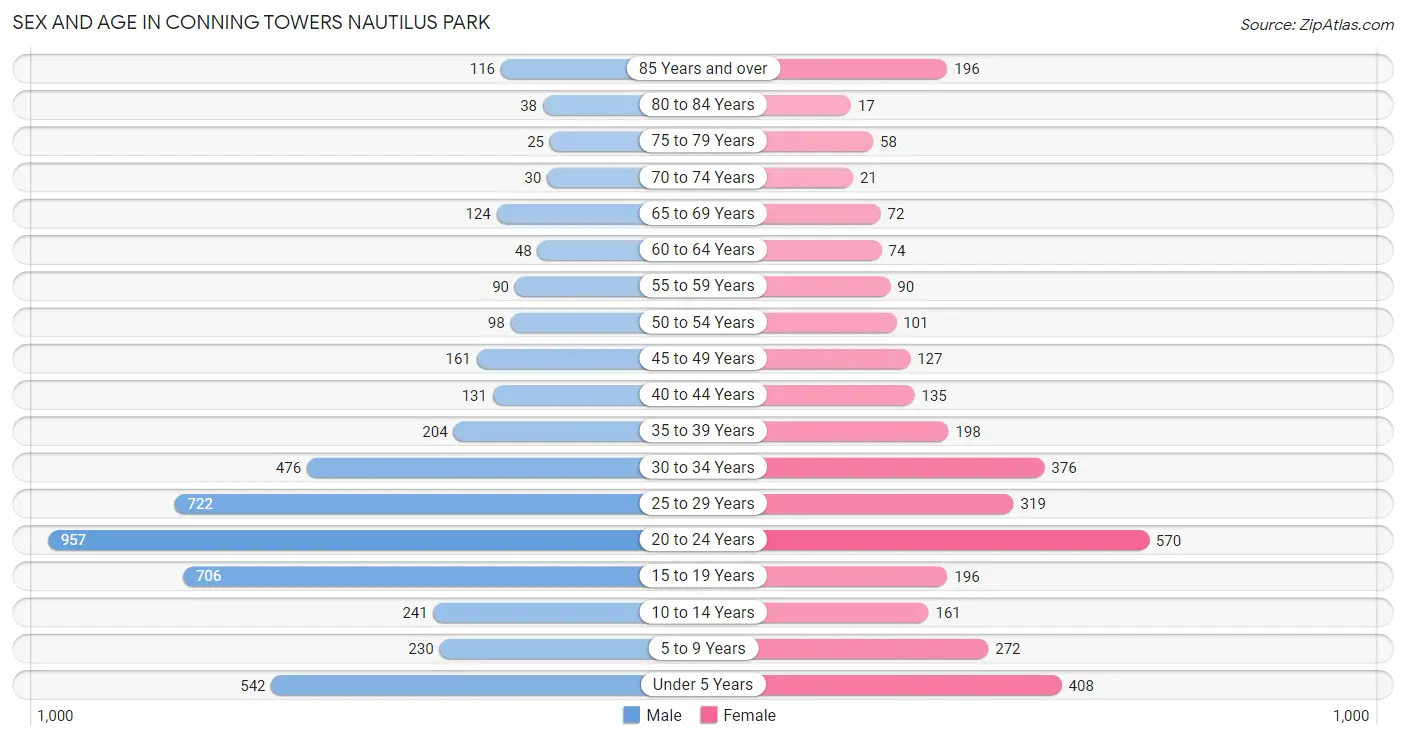
The most populous age groups in Conning Towers Nautilus Park are 20 to 24 Years (957 | 19.4%) for men and 20 to 24 Years (570 | 16.8%) for women.
| Age Bracket | Male | Female |
| Under 5 Years | 542 (11.0%) | 408 (12.0%) |
| 5 to 9 Years | 230 (4.7%) | 272 (8.0%) |
| 10 to 14 Years | 241 (4.9%) | 161 (4.8%) |
| 15 to 19 Years | 706 (14.3%) | 196 (5.8%) |
| 20 to 24 Years | 957 (19.4%) | 570 (16.8%) |
| 25 to 29 Years | 722 (14.6%) | 319 (9.4%) |
| 30 to 34 Years | 476 (9.6%) | 376 (11.1%) |
| 35 to 39 Years | 204 (4.1%) | 198 (5.8%) |
| 40 to 44 Years | 131 (2.6%) | 135 (4.0%) |
| 45 to 49 Years | 161 (3.3%) | 127 (3.7%) |
| 50 to 54 Years | 98 (2.0%) | 101 (3.0%) |
| 55 to 59 Years | 90 (1.8%) | 90 (2.6%) |
| 60 to 64 Years | 48 (1.0%) | 74 (2.2%) |
| 65 to 69 Years | 124 (2.5%) | 72 (2.1%) |
| 70 to 74 Years | 30 (0.6%) | 21 (0.6%) |
| 75 to 79 Years | 25 (0.5%) | 58 (1.7%) |
| 80 to 84 Years | 38 (0.8%) | 17 (0.5%) |
| 85 Years and over | 116 (2.4%) | 196 (5.8%) |
| Total | 4,939 (100.0%) | 3,391 (100.0%) |
Families and Households in Conning Towers Nautilus Park
Median Family Size in Conning Towers Nautilus Park
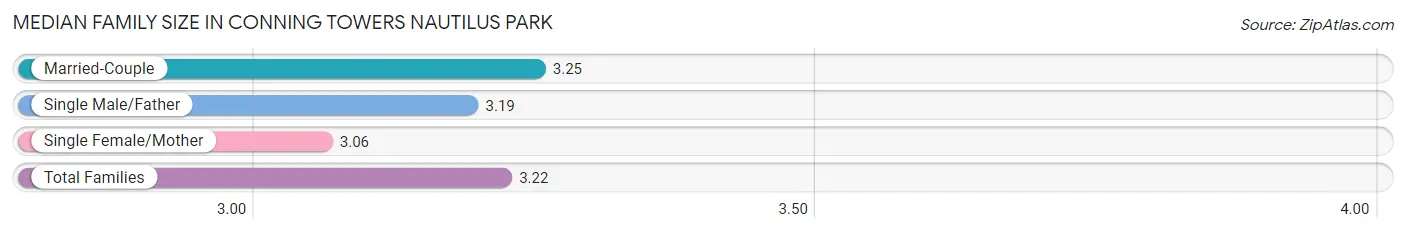
The median family size in Conning Towers Nautilus Park is 3.22 persons per family, with married-couple families (1,418 | 77.1%) accounting for the largest median family size of 3.25 persons per family. On the other hand, single female/mother families (307 | 16.7%) represent the smallest median family size with 3.06 persons per family.
| Family Type | # Families | Family Size |
| Married-Couple | 1,418 (77.1%) | 3.25 |
| Single Male/Father | 113 (6.1%) | 3.19 |
| Single Female/Mother | 307 (16.7%) | 3.06 |
| Total Families | 1,838 (100.0%) | 3.22 |
Median Household Size in Conning Towers Nautilus Park
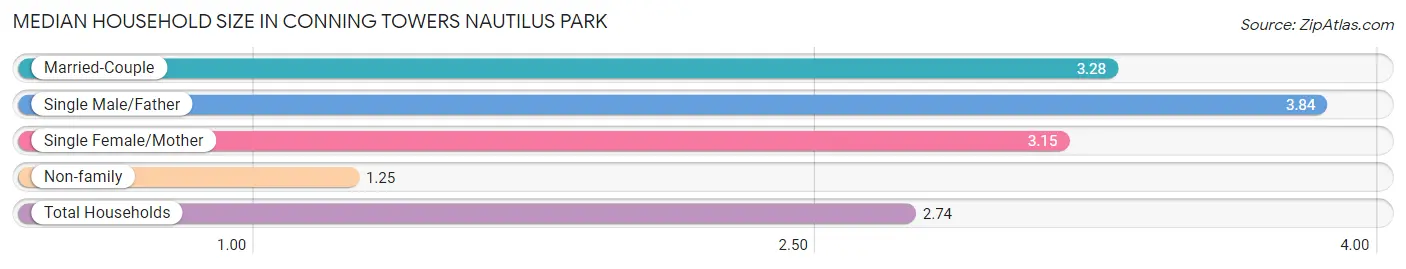
The median household size in Conning Towers Nautilus Park is 2.74 persons per household, with single male/father households (113 | 4.5%) accounting for the largest median household size of 3.84 persons per household. non-family households (683 | 27.1%) represent the smallest median household size with 1.25 persons per household.
| Household Type | # Households | Household Size |
| Married-Couple | 1,418 (56.2%) | 3.28 |
| Single Male/Father | 113 (4.5%) | 3.84 |
| Single Female/Mother | 307 (12.2%) | 3.15 |
| Non-family | 683 (27.1%) | 1.25 |
| Total Households | 2,521 (100.0%) | 2.74 |
Household Size by Marriage Status in Conning Towers Nautilus Park
Out of a total of 2,521 households in Conning Towers Nautilus Park, 1,838 (72.9%) are family households, while 683 (27.1%) are nonfamily households. The most numerous type of family households are 3-person households, comprising 683, and the most common type of nonfamily households are 1-person households, comprising 555.
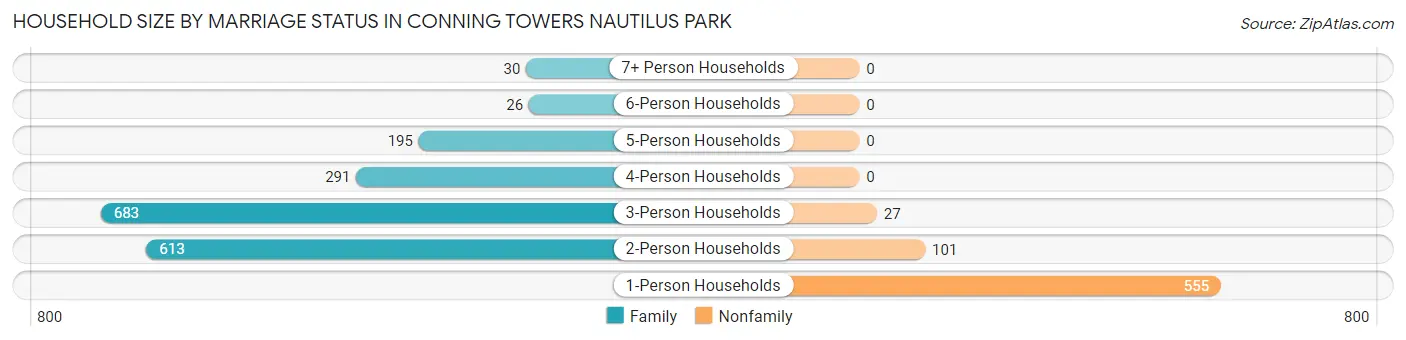
| Household Size | Family Households | Nonfamily Households |
| 1-Person Households | - | 555 (22.0%) |
| 2-Person Households | 613 (24.3%) | 101 (4.0%) |
| 3-Person Households | 683 (27.1%) | 27 (1.1%) |
| 4-Person Households | 291 (11.5%) | 0 (0.0%) |
| 5-Person Households | 195 (7.7%) | 0 (0.0%) |
| 6-Person Households | 26 (1.0%) | 0 (0.0%) |
| 7+ Person Households | 30 (1.2%) | 0 (0.0%) |
| Total | 1,838 (72.9%) | 683 (27.1%) |
Female Fertility in Conning Towers Nautilus Park
Fertility by Age in Conning Towers Nautilus Park
Average fertility rate in Conning Towers Nautilus Park is 198.0 births per 1,000 women. Women in the age bracket of 20 to 34 years have the highest fertility rate with 284.0 births per 1,000 women. Women in the age bracket of 20 to 34 years acount for 93.7% of all women with births.
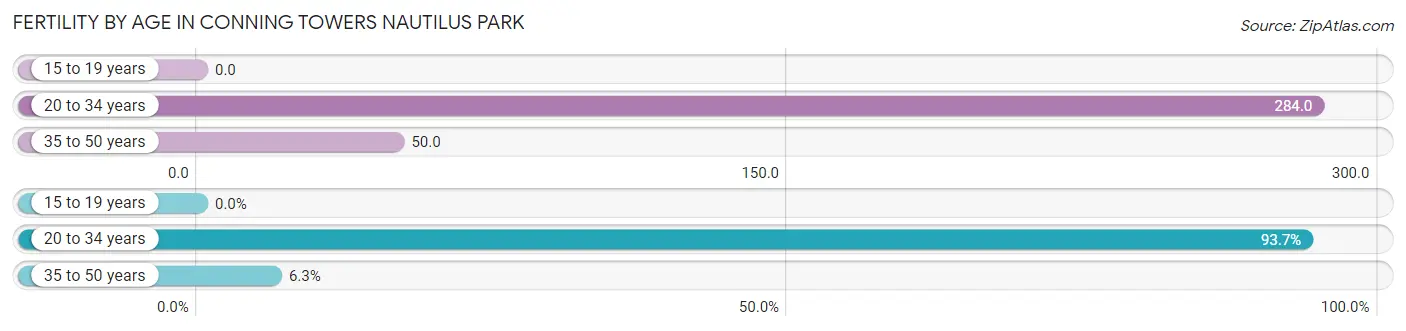
| Age Bracket | Women with Births | Births / 1,000 Women |
| 15 to 19 years | 0 (0.0%) | 0.0 |
| 20 to 34 years | 359 (93.7%) | 284.0 |
| 35 to 50 years | 24 (6.3%) | 50.0 |
| Total | 383 (100.0%) | 198.0 |
Fertility by Age by Marriage Status in Conning Towers Nautilus Park
97.1% of women with births (383) in Conning Towers Nautilus Park are married. The highest percentage of unmarried women with births falls into 35 to 50 years age bracket with 45.8% of them unmarried at the time of birth, while the lowest percentage of unmarried women with births belong to 20 to 34 years age bracket with 0.0% of them unmarried.
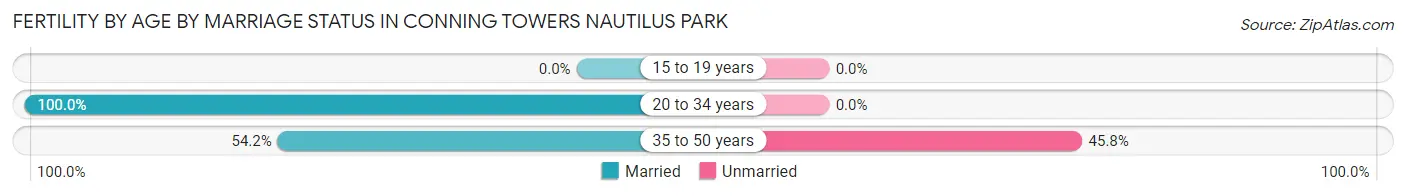
| Age Bracket | Married | Unmarried |
| 15 to 19 years | 0 (0.0%) | 0 (0.0%) |
| 20 to 34 years | 359 (100.0%) | 0 (0.0%) |
| 35 to 50 years | 13 (54.2%) | 11 (45.8%) |
| Total | 372 (97.1%) | 11 (2.9%) |
Fertility by Education in Conning Towers Nautilus Park
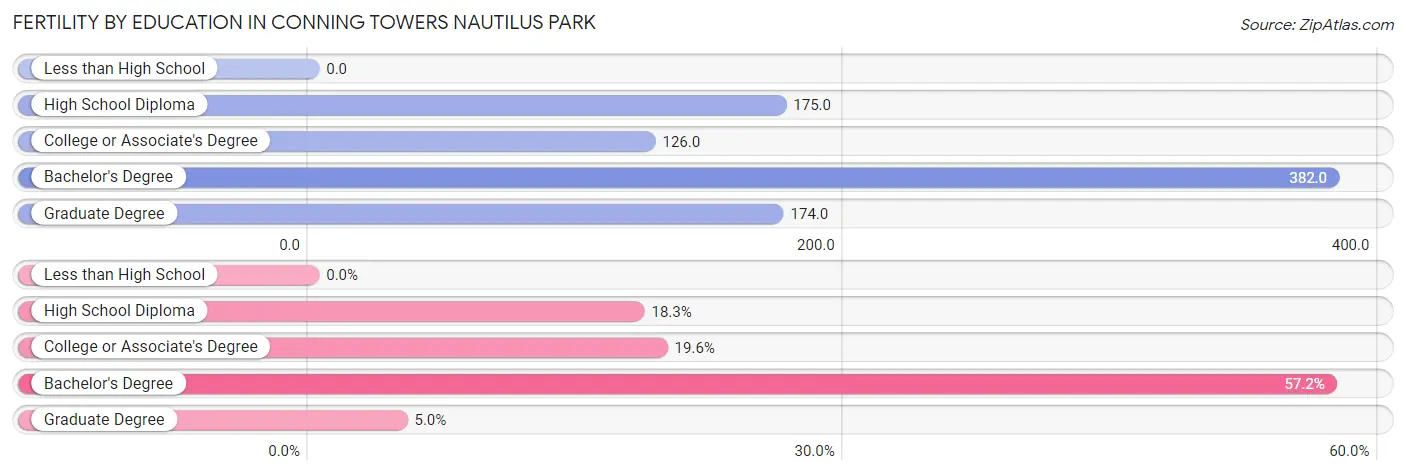
| Educational Attainment | Women with Births | Births / 1,000 Women |
| Less than High School | 0 (0.0%) | 0.0 |
| High School Diploma | 70 (18.3%) | 175.0 |
| College or Associate's Degree | 75 (19.6%) | 126.0 |
| Bachelor's Degree | 219 (57.2%) | 382.0 |
| Graduate Degree | 19 (5.0%) | 174.0 |
| Total | 383 (100.0%) | 198.0 |
Fertility by Education by Marriage Status in Conning Towers Nautilus Park
2.9% of women with births in Conning Towers Nautilus Park are unmarried. Women with the educational attainment of high school diploma are most likely to be married with 100.0% of them married at childbirth, while women with the educational attainment of college or associate's degree are least likely to be married with 14.7% of them unmarried at childbirth.
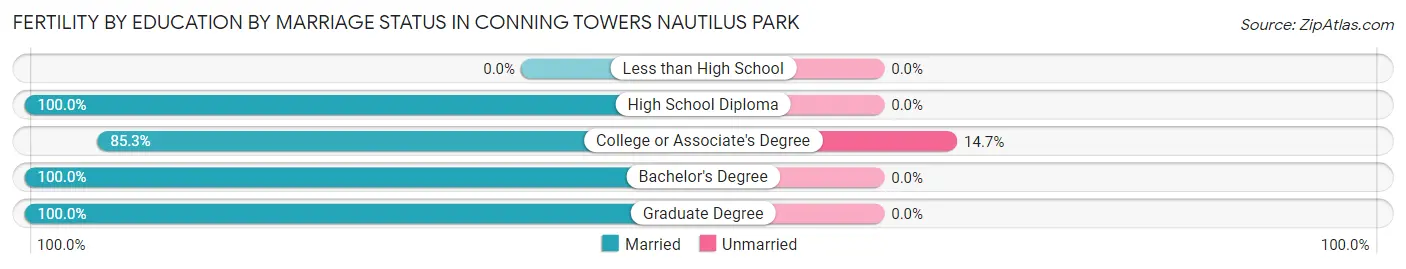
| Educational Attainment | Married | Unmarried |
| Less than High School | 0 (0.0%) | 0 (0.0%) |
| High School Diploma | 70 (100.0%) | 0 (0.0%) |
| College or Associate's Degree | 64 (85.3%) | 11 (14.7%) |
| Bachelor's Degree | 219 (100.0%) | 0 (0.0%) |
| Graduate Degree | 19 (100.0%) | 0 (0.0%) |
| Total | 372 (97.1%) | 11 (2.9%) |
Employment Characteristics in Conning Towers Nautilus Park
Employment by Class of Employer in Conning Towers Nautilus Park
Among the 4,072 employed individuals in Conning Towers Nautilus Park, federal government employees (2,424 | 59.5%), private company employees (1,138 | 28.0%), and not-for-profit organizations (183 | 4.5%) make up the most common classes of employment.
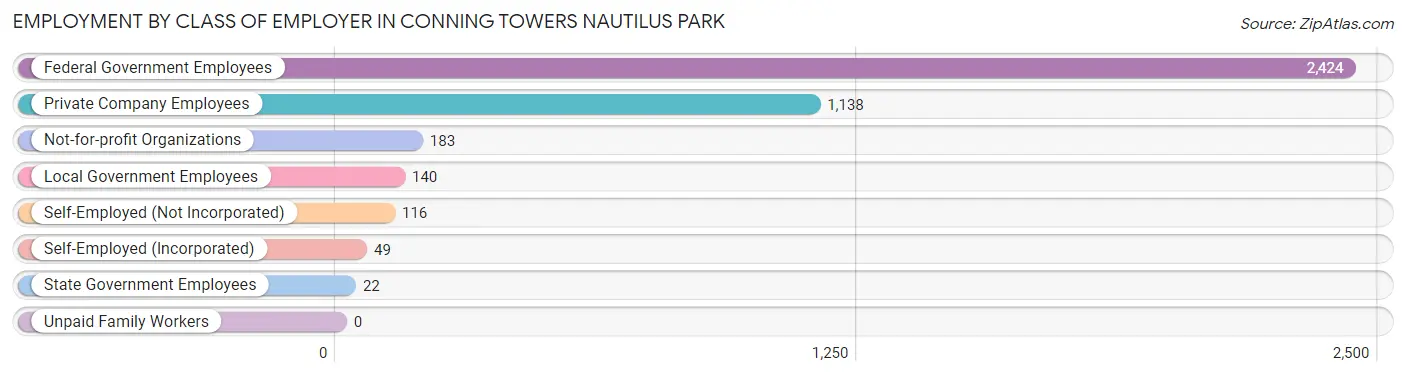
| Employer Class | # Employees | % Employees |
| Private Company Employees | 1,138 | 28.0% |
| Self-Employed (Incorporated) | 49 | 1.2% |
| Self-Employed (Not Incorporated) | 116 | 2.9% |
| Not-for-profit Organizations | 183 | 4.5% |
| Local Government Employees | 140 | 3.4% |
| State Government Employees | 22 | 0.5% |
| Federal Government Employees | 2,424 | 59.5% |
| Unpaid Family Workers | 0 | 0.0% |
| Total | 4,072 | 100.0% |
Employment Status by Age in Conning Towers Nautilus Park
According to the labor force statistics for Conning Towers Nautilus Park, out of the total population over 16 years of age (6,253), 70.4% or 4,402 individuals are in the labor force, with 7.5% or 330 of them unemployed. The age group with the highest labor force participation rate is 35 to 44 years, with 85.8% or 573 individuals in the labor force. Within the labor force, the 16 to 19 years age range has the highest percentage of unemployed individuals, with 45.9% or 254 of them being unemployed.
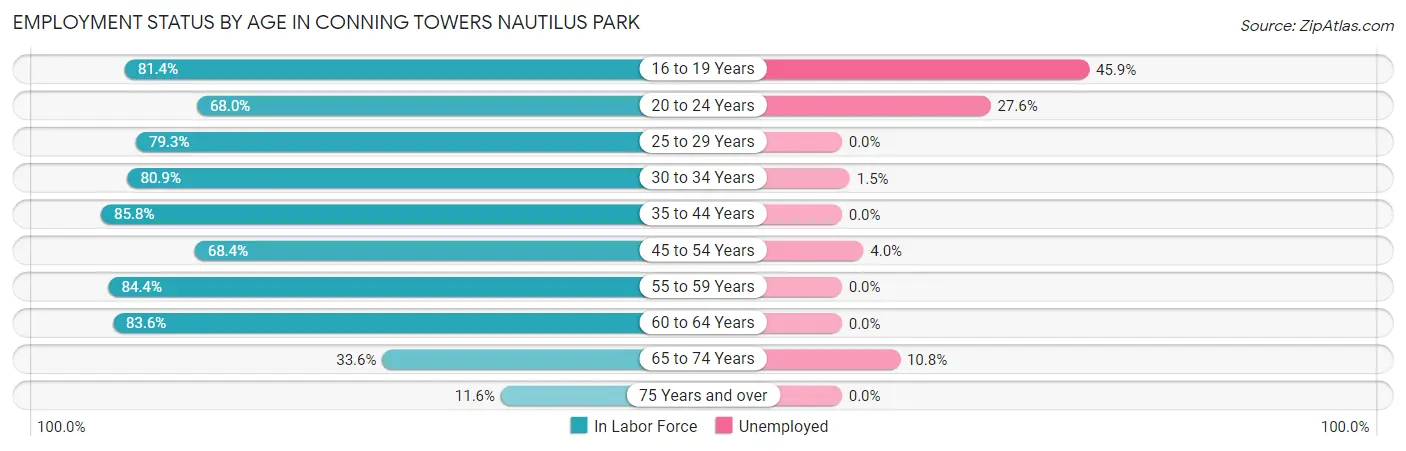
| Age Bracket | In Labor Force | Unemployed |
| 16 to 19 Years | 553 (81.4%) | 254 (45.9%) |
| 20 to 24 Years | 1,038 (68.0%) | 286 (27.6%) |
| 25 to 29 Years | 826 (79.3%) | 0 (0.0%) |
| 30 to 34 Years | 689 (80.9%) | 10 (1.5%) |
| 35 to 44 Years | 573 (85.8%) | 0 (0.0%) |
| 45 to 54 Years | 333 (68.4%) | 13 (4.0%) |
| 55 to 59 Years | 152 (84.4%) | 0 (0.0%) |
| 60 to 64 Years | 102 (83.6%) | 0 (0.0%) |
| 65 to 74 Years | 83 (33.6%) | 9 (10.8%) |
| 75 Years and over | 52 (11.6%) | 0 (0.0%) |
| Total | 4,402 (70.4%) | 330 (7.5%) |
Employment Status by Educational Attainment in Conning Towers Nautilus Park
According to labor force statistics for Conning Towers Nautilus Park, 79.8% of individuals (2,673) out of the total population between 25 and 64 years of age (3,350) are in the labor force, with 1.0% or 27 of them being unemployed. The group with the highest labor force participation rate are those with the educational attainment of bachelor's degree or higher, with 84.9% or 740 individuals in the labor force. Within the labor force, individuals with bachelor's degree or higher education have the highest percentage of unemployment, with 1.9% or 14 of them being unemployed.
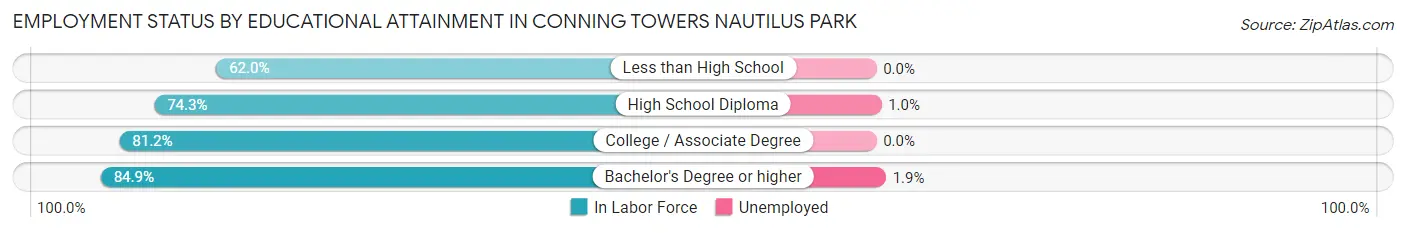
| Educational Attainment | In Labor Force | Unemployed |
| Less than High School | 44 (62.0%) | 0 (0.0%) |
| High School Diploma | 696 (74.3%) | 9 (1.0%) |
| College / Associate Degree | 1,194 (81.2%) | 0 (0.0%) |
| Bachelor's Degree or higher | 740 (84.9%) | 17 (1.9%) |
| Total | 2,673 (79.8%) | 34 (1.0%) |
Employment Occupations by Sex in Conning Towers Nautilus Park
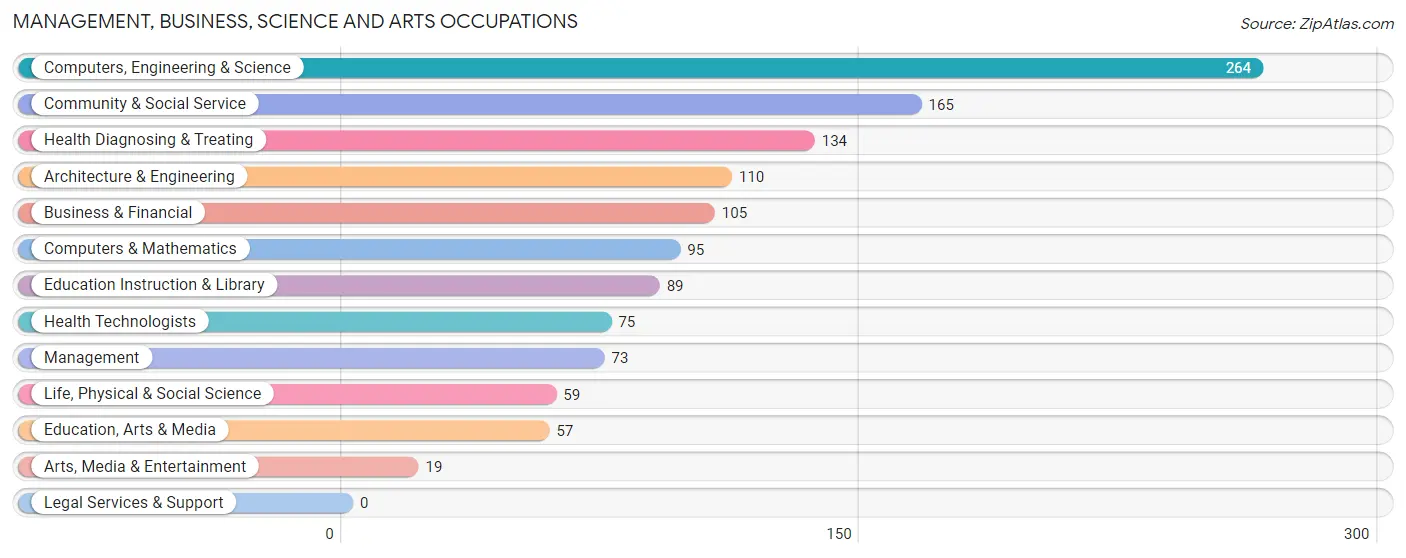
Management, Business, Science and Arts Occupations
The most common Management, Business, Science and Arts occupations in Conning Towers Nautilus Park are Computers, Engineering & Science (264 | 13.0%), Community & Social Service (165 | 8.2%), Health Diagnosing & Treating (134 | 6.6%), Architecture & Engineering (110 | 5.4%), and Business & Financial (105 | 5.2%).
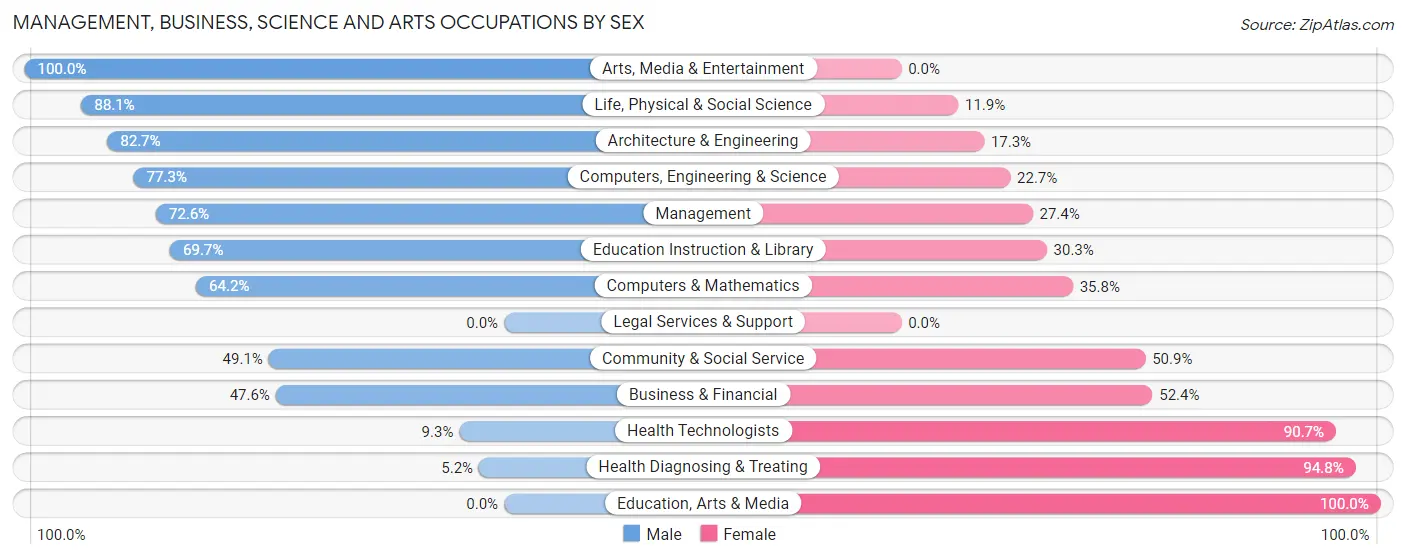
Management, Business, Science and Arts Occupations by Sex
Within the Management, Business, Science and Arts occupations in Conning Towers Nautilus Park, the most male-oriented occupations are Arts, Media & Entertainment (100.0%), Life, Physical & Social Science (88.1%), and Architecture & Engineering (82.7%), while the most female-oriented occupations are Education, Arts & Media (100.0%), Health Diagnosing & Treating (94.8%), and Health Technologists (90.7%).
| Occupation | Male | Female |
| Management | 53 (72.6%) | 20 (27.4%) |
| Business & Financial | 50 (47.6%) | 55 (52.4%) |
| Computers, Engineering & Science | 204 (77.3%) | 60 (22.7%) |
| Computers & Mathematics | 61 (64.2%) | 34 (35.8%) |
| Architecture & Engineering | 91 (82.7%) | 19 (17.3%) |
| Life, Physical & Social Science | 52 (88.1%) | 7 (11.9%) |
| Community & Social Service | 81 (49.1%) | 84 (50.9%) |
| Education, Arts & Media | 0 (0.0%) | 57 (100.0%) |
| Legal Services & Support | 0 (0.0%) | 0 (0.0%) |
| Education Instruction & Library | 62 (69.7%) | 27 (30.3%) |
| Arts, Media & Entertainment | 19 (100.0%) | 0 (0.0%) |
| Health Diagnosing & Treating | 7 (5.2%) | 127 (94.8%) |
| Health Technologists | 7 (9.3%) | 68 (90.7%) |
| Total (Category) | 395 (53.3%) | 346 (46.7%) |
| Total (Overall) | 1,037 (51.2%) | 988 (48.8%) |
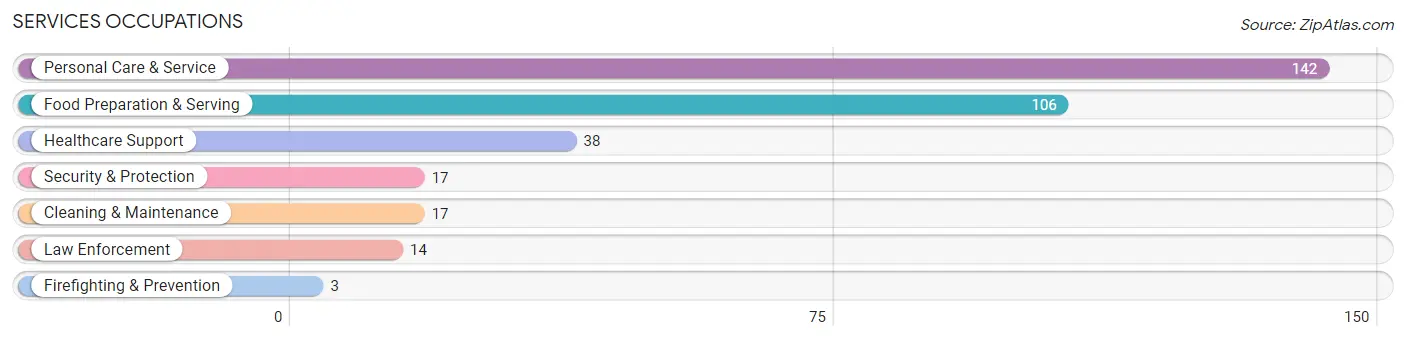
Services Occupations
The most common Services occupations in Conning Towers Nautilus Park are Personal Care & Service (142 | 7.0%), Food Preparation & Serving (106 | 5.2%), Healthcare Support (38 | 1.9%), Security & Protection (17 | 0.8%), and Cleaning & Maintenance (17 | 0.8%).
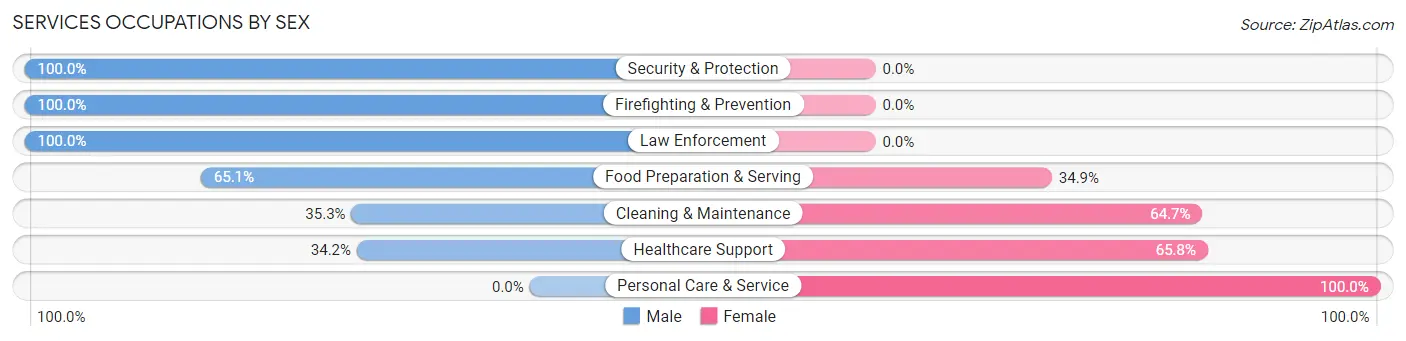
Services Occupations by Sex
Within the Services occupations in Conning Towers Nautilus Park, the most male-oriented occupations are Security & Protection (100.0%), Firefighting & Prevention (100.0%), and Law Enforcement (100.0%), while the most female-oriented occupations are Personal Care & Service (100.0%), Healthcare Support (65.8%), and Cleaning & Maintenance (64.7%).
| Occupation | Male | Female |
| Healthcare Support | 13 (34.2%) | 25 (65.8%) |
| Security & Protection | 17 (100.0%) | 0 (0.0%) |
| Firefighting & Prevention | 3 (100.0%) | 0 (0.0%) |
| Law Enforcement | 14 (100.0%) | 0 (0.0%) |
| Food Preparation & Serving | 69 (65.1%) | 37 (34.9%) |
| Cleaning & Maintenance | 6 (35.3%) | 11 (64.7%) |
| Personal Care & Service | 0 (0.0%) | 142 (100.0%) |
| Total (Category) | 105 (32.8%) | 215 (67.2%) |
| Total (Overall) | 1,037 (51.2%) | 988 (48.8%) |
Sales and Office Occupations
The most common Sales and Office occupations in Conning Towers Nautilus Park are Sales & Related (264 | 13.0%), and Office & Administration (205 | 10.1%).
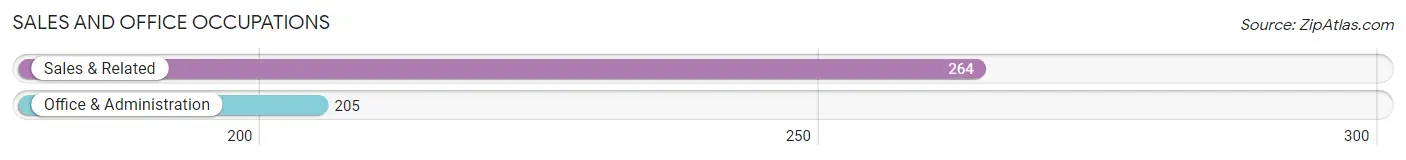
Sales and Office Occupations by Sex

| Occupation | Male | Female |
| Sales & Related | 54 (20.4%) | 210 (79.5%) |
| Office & Administration | 33 (16.1%) | 172 (83.9%) |
| Total (Category) | 87 (18.5%) | 382 (81.5%) |
| Total (Overall) | 1,037 (51.2%) | 988 (48.8%) |
Natural Resources, Construction and Maintenance Occupations
The most common Natural Resources, Construction and Maintenance occupations in Conning Towers Nautilus Park are Construction & Extraction (141 | 7.0%), and Installation, Maintenance & Repair (42 | 2.1%).
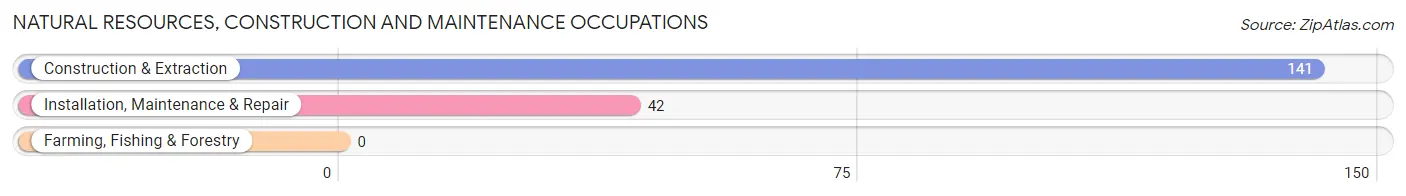
Natural Resources, Construction and Maintenance Occupations by Sex
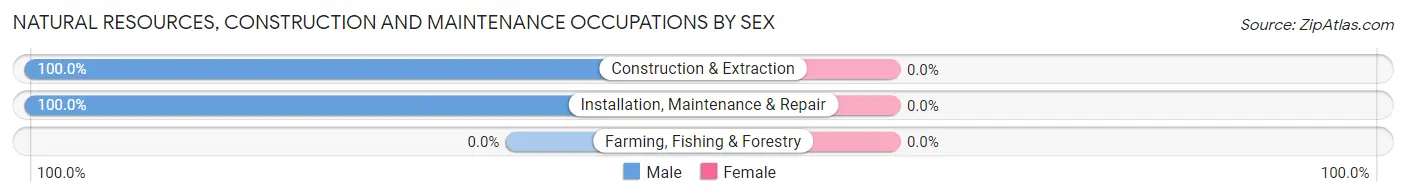
| Occupation | Male | Female |
| Farming, Fishing & Forestry | 0 (0.0%) | 0 (0.0%) |
| Construction & Extraction | 141 (100.0%) | 0 (0.0%) |
| Installation, Maintenance & Repair | 42 (100.0%) | 0 (0.0%) |
| Total (Category) | 183 (100.0%) | 0 (0.0%) |
| Total (Overall) | 1,037 (51.2%) | 988 (48.8%) |
Production, Transportation and Moving Occupations
The most common Production, Transportation and Moving occupations in Conning Towers Nautilus Park are Production (215 | 10.6%), and Transportation (97 | 4.8%).
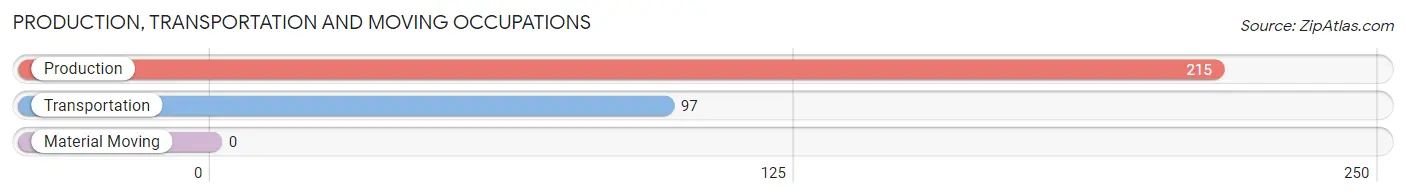
Production, Transportation and Moving Occupations by Sex
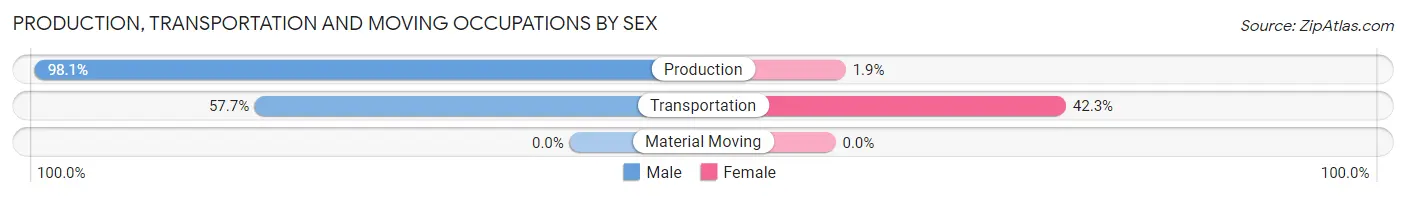
| Occupation | Male | Female |
| Production | 211 (98.1%) | 4 (1.9%) |
| Transportation | 56 (57.7%) | 41 (42.3%) |
| Material Moving | 0 (0.0%) | 0 (0.0%) |
| Total (Category) | 267 (85.6%) | 45 (14.4%) |
| Total (Overall) | 1,037 (51.2%) | 988 (48.8%) |
Employment Industries by Sex in Conning Towers Nautilus Park
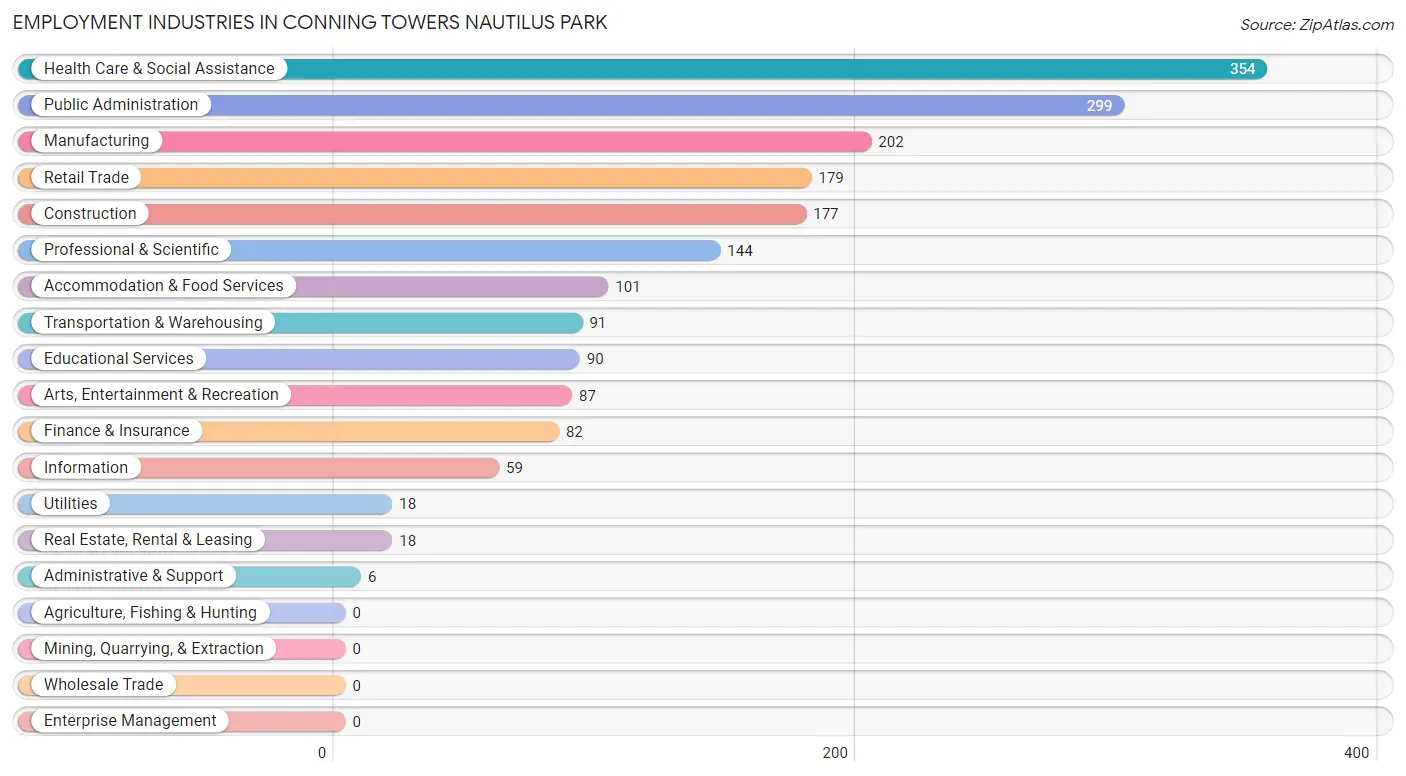
Employment Industries in Conning Towers Nautilus Park
The major employment industries in Conning Towers Nautilus Park include Health Care & Social Assistance (354 | 17.5%), Public Administration (299 | 14.8%), Manufacturing (202 | 10.0%), Retail Trade (179 | 8.8%), and Construction (177 | 8.7%).
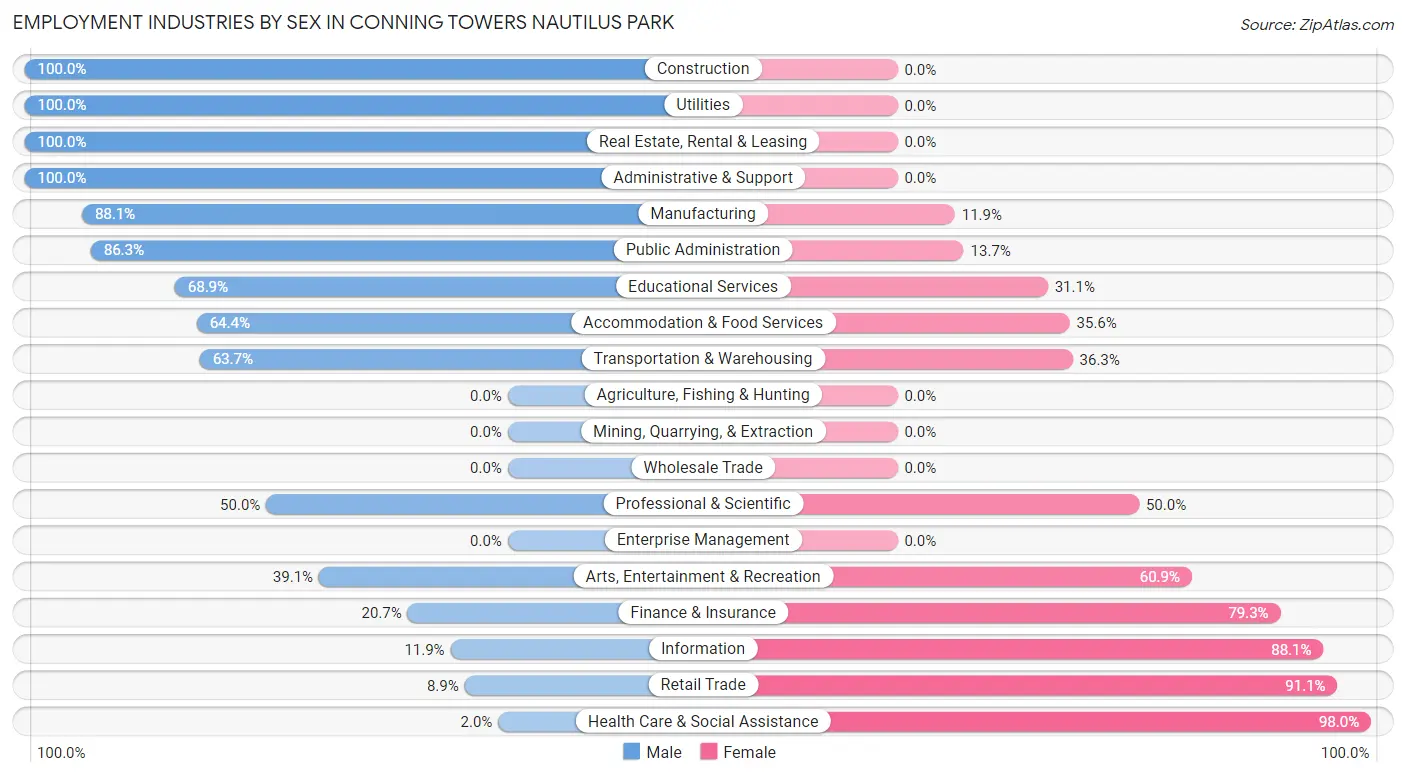
Employment Industries by Sex in Conning Towers Nautilus Park
The Conning Towers Nautilus Park industries that see more men than women are Construction (100.0%), Utilities (100.0%), and Real Estate, Rental & Leasing (100.0%), whereas the industries that tend to have a higher number of women are Health Care & Social Assistance (98.0%), Retail Trade (91.1%), and Information (88.1%).
| Industry | Male | Female |
| Agriculture, Fishing & Hunting | 0 (0.0%) | 0 (0.0%) |
| Mining, Quarrying, & Extraction | 0 (0.0%) | 0 (0.0%) |
| Construction | 177 (100.0%) | 0 (0.0%) |
| Manufacturing | 178 (88.1%) | 24 (11.9%) |
| Wholesale Trade | 0 (0.0%) | 0 (0.0%) |
| Retail Trade | 16 (8.9%) | 163 (91.1%) |
| Transportation & Warehousing | 58 (63.7%) | 33 (36.3%) |
| Utilities | 18 (100.0%) | 0 (0.0%) |
| Information | 7 (11.9%) | 52 (88.1%) |
| Finance & Insurance | 17 (20.7%) | 65 (79.3%) |
| Real Estate, Rental & Leasing | 18 (100.0%) | 0 (0.0%) |
| Professional & Scientific | 72 (50.0%) | 72 (50.0%) |
| Enterprise Management | 0 (0.0%) | 0 (0.0%) |
| Administrative & Support | 6 (100.0%) | 0 (0.0%) |
| Educational Services | 62 (68.9%) | 28 (31.1%) |
| Health Care & Social Assistance | 7 (2.0%) | 347 (98.0%) |
| Arts, Entertainment & Recreation | 34 (39.1%) | 53 (60.9%) |
| Accommodation & Food Services | 65 (64.4%) | 36 (35.6%) |
| Public Administration | 258 (86.3%) | 41 (13.7%) |
| Total | 1,037 (51.2%) | 988 (48.8%) |
Education in Conning Towers Nautilus Park
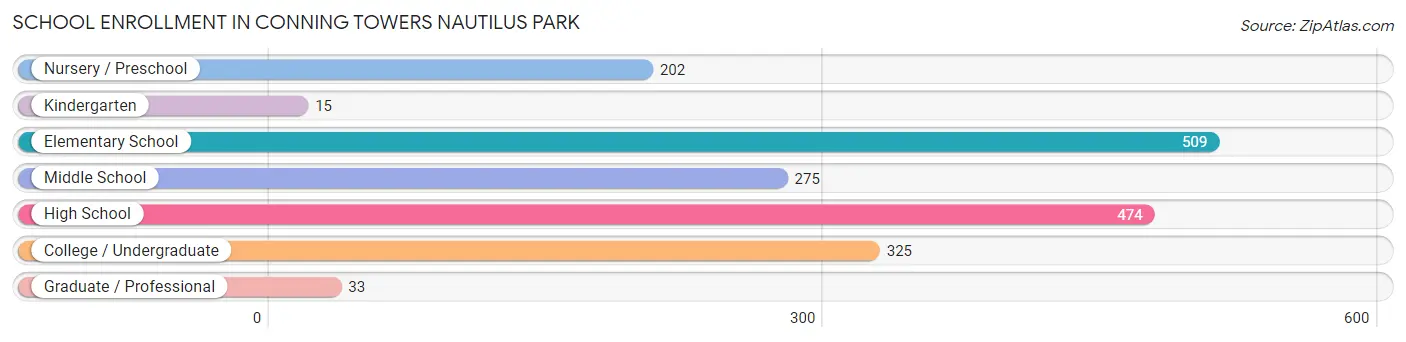
School Enrollment in Conning Towers Nautilus Park
The most common levels of schooling among the 1,833 students in Conning Towers Nautilus Park are elementary school (509 | 27.8%), high school (474 | 25.9%), and college / undergraduate (325 | 17.7%).
| School Level | # Students | % Students |
| Nursery / Preschool | 202 | 11.0% |
| Kindergarten | 15 | 0.8% |
| Elementary School | 509 | 27.8% |
| Middle School | 275 | 15.0% |
| High School | 474 | 25.9% |
| College / Undergraduate | 325 | 17.7% |
| Graduate / Professional | 33 | 1.8% |
| Total | 1,833 | 100.0% |
School Enrollment by Age by Funding Source in Conning Towers Nautilus Park
Out of a total of 1,833 students who are enrolled in schools in Conning Towers Nautilus Park, 299 (16.3%) attend a private institution, while the remaining 1,534 (83.7%) are enrolled in public schools. The age group of 18 to 19 year olds has the highest likelihood of being enrolled in private schools, with 55 (59.8% in the age bracket) enrolled. Conversely, the age group of 5 to 9 year old has the lowest likelihood of being enrolled in a private school, with 456 (94.2% in the age bracket) attending a public institution.
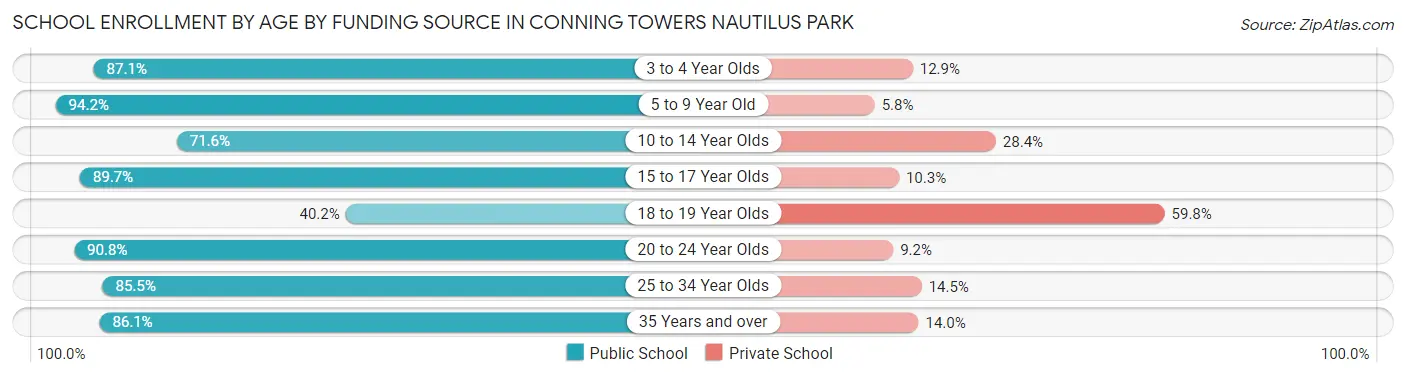
| Age Bracket | Public School | Private School |
| 3 to 4 Year Olds | 176 (87.1%) | 26 (12.9%) |
| 5 to 9 Year Old | 456 (94.2%) | 28 (5.8%) |
| 10 to 14 Year Olds | 288 (71.6%) | 114 (28.4%) |
| 15 to 17 Year Olds | 270 (89.7%) | 31 (10.3%) |
| 18 to 19 Year Olds | 37 (40.2%) | 55 (59.8%) |
| 20 to 24 Year Olds | 118 (90.8%) | 12 (9.2%) |
| 25 to 34 Year Olds | 153 (85.5%) | 26 (14.5%) |
| 35 Years and over | 37 (86.1%) | 6 (14.0%) |
| Total | 1,534 (83.7%) | 299 (16.3%) |
Educational Attainment by Field of Study in Conning Towers Nautilus Park
Education (195 | 18.0%), engineering (169 | 15.6%), business (121 | 11.2%), literature & languages (117 | 10.8%), and science & technology (107 | 9.9%) are the most common fields of study among 1,084 individuals in Conning Towers Nautilus Park who have obtained a bachelor's degree or higher.
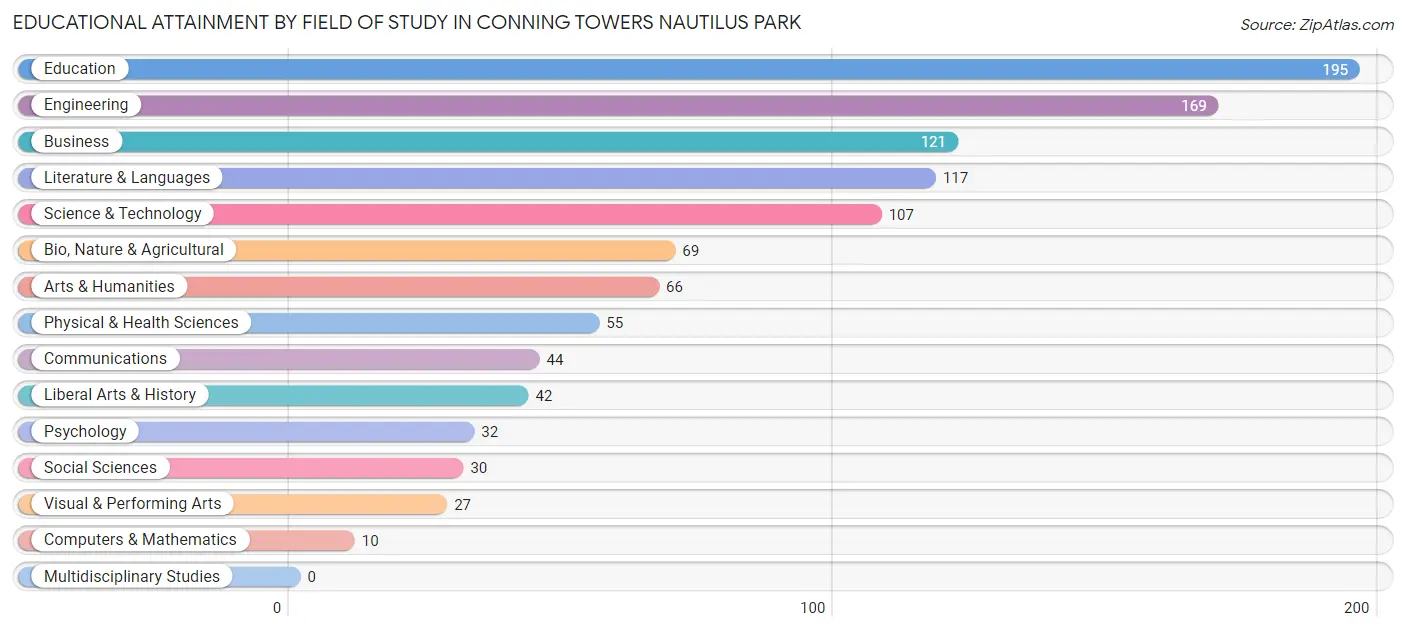
| Field of Study | # Graduates | % Graduates |
| Computers & Mathematics | 10 | 0.9% |
| Bio, Nature & Agricultural | 69 | 6.4% |
| Physical & Health Sciences | 55 | 5.1% |
| Psychology | 32 | 2.9% |
| Social Sciences | 30 | 2.8% |
| Engineering | 169 | 15.6% |
| Multidisciplinary Studies | 0 | 0.0% |
| Science & Technology | 107 | 9.9% |
| Business | 121 | 11.2% |
| Education | 195 | 18.0% |
| Literature & Languages | 117 | 10.8% |
| Liberal Arts & History | 42 | 3.9% |
| Visual & Performing Arts | 27 | 2.5% |
| Communications | 44 | 4.1% |
| Arts & Humanities | 66 | 6.1% |
| Total | 1,084 | 100.0% |
Transportation & Commute in Conning Towers Nautilus Park
Vehicle Availability by Sex in Conning Towers Nautilus Park
The most prevalent vehicle ownership categories in Conning Towers Nautilus Park are males with 2 vehicles (915, accounting for 50.7%) and females with 2 vehicles (541, making up 92.0%).
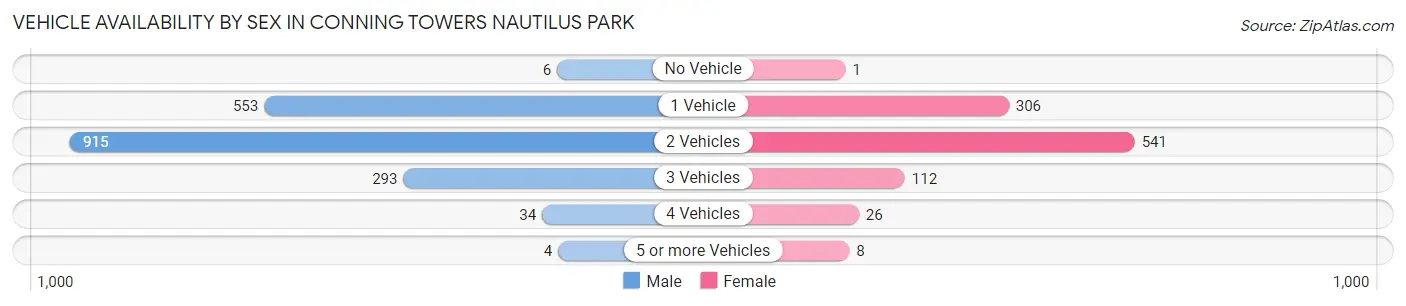
| Vehicles Available | Male | Female |
| No Vehicle | 6 (0.3%) | 1 (0.1%) |
| 1 Vehicle | 553 (30.6%) | 306 (30.8%) |
| 2 Vehicles | 915 (50.7%) | 541 (54.4%) |
| 3 Vehicles | 293 (16.2%) | 112 (11.3%) |
| 4 Vehicles | 34 (1.9%) | 26 (2.6%) |
| 5 or more Vehicles | 4 (0.2%) | 8 (0.8%) |
| Total | 1,805 (100.0%) | 994 (100.0%) |
Commute Time in Conning Towers Nautilus Park
The most frequently occuring commute durations in Conning Towers Nautilus Park are 10 to 14 minutes (960 commuters, 29.1%), 5 to 9 minutes (949 commuters, 28.8%), and 15 to 19 minutes (580 commuters, 17.6%).
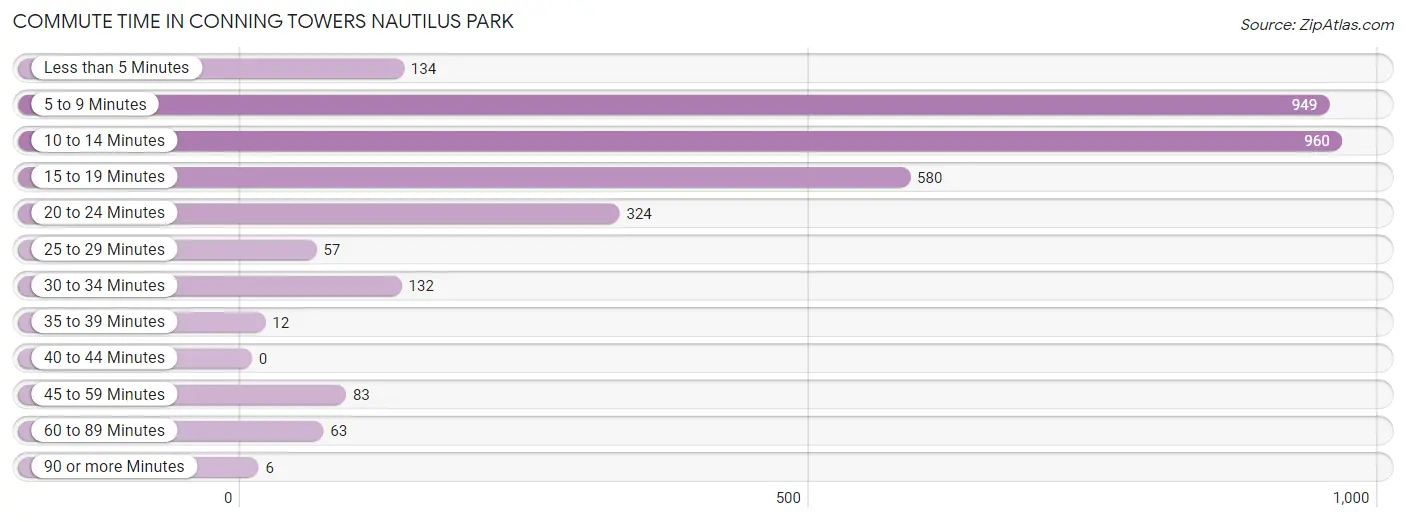
| Commute Time | # Commuters | % Commuters |
| Less than 5 Minutes | 134 | 4.1% |
| 5 to 9 Minutes | 949 | 28.8% |
| 10 to 14 Minutes | 960 | 29.1% |
| 15 to 19 Minutes | 580 | 17.6% |
| 20 to 24 Minutes | 324 | 9.8% |
| 25 to 29 Minutes | 57 | 1.7% |
| 30 to 34 Minutes | 132 | 4.0% |
| 35 to 39 Minutes | 12 | 0.4% |
| 40 to 44 Minutes | 0 | 0.0% |
| 45 to 59 Minutes | 83 | 2.5% |
| 60 to 89 Minutes | 63 | 1.9% |
| 90 or more Minutes | 6 | 0.2% |
Commute Time by Sex in Conning Towers Nautilus Park
The most common commute times in Conning Towers Nautilus Park are 5 to 9 minutes (811 commuters, 34.2%) for males and 15 to 19 minutes (269 commuters, 29.0%) for females.
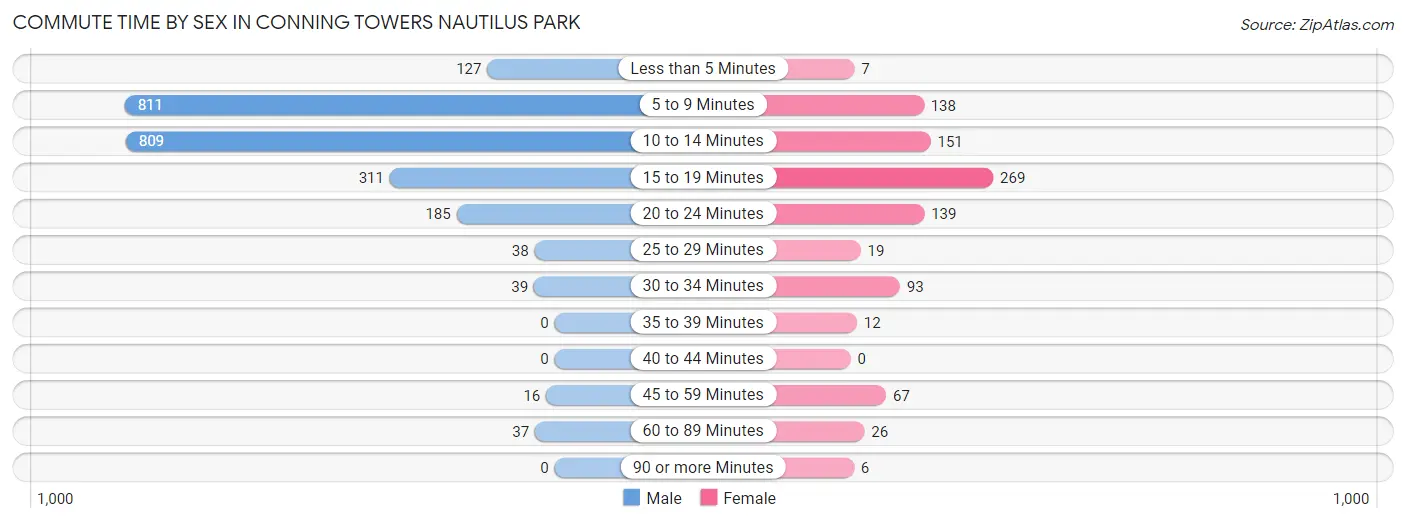
| Commute Time | Male | Female |
| Less than 5 Minutes | 127 (5.3%) | 7 (0.8%) |
| 5 to 9 Minutes | 811 (34.2%) | 138 (14.9%) |
| 10 to 14 Minutes | 809 (34.1%) | 151 (16.3%) |
| 15 to 19 Minutes | 311 (13.1%) | 269 (29.0%) |
| 20 to 24 Minutes | 185 (7.8%) | 139 (15.0%) |
| 25 to 29 Minutes | 38 (1.6%) | 19 (2.1%) |
| 30 to 34 Minutes | 39 (1.6%) | 93 (10.0%) |
| 35 to 39 Minutes | 0 (0.0%) | 12 (1.3%) |
| 40 to 44 Minutes | 0 (0.0%) | 0 (0.0%) |
| 45 to 59 Minutes | 16 (0.7%) | 67 (7.2%) |
| 60 to 89 Minutes | 37 (1.6%) | 26 (2.8%) |
| 90 or more Minutes | 0 (0.0%) | 6 (0.6%) |
Time of Departure to Work by Sex in Conning Towers Nautilus Park
The most frequent times of departure to work in Conning Towers Nautilus Park are 7:00 AM to 7:29 AM (640, 27.0%) for males and 7:30 AM to 7:59 AM (193, 20.8%) for females.
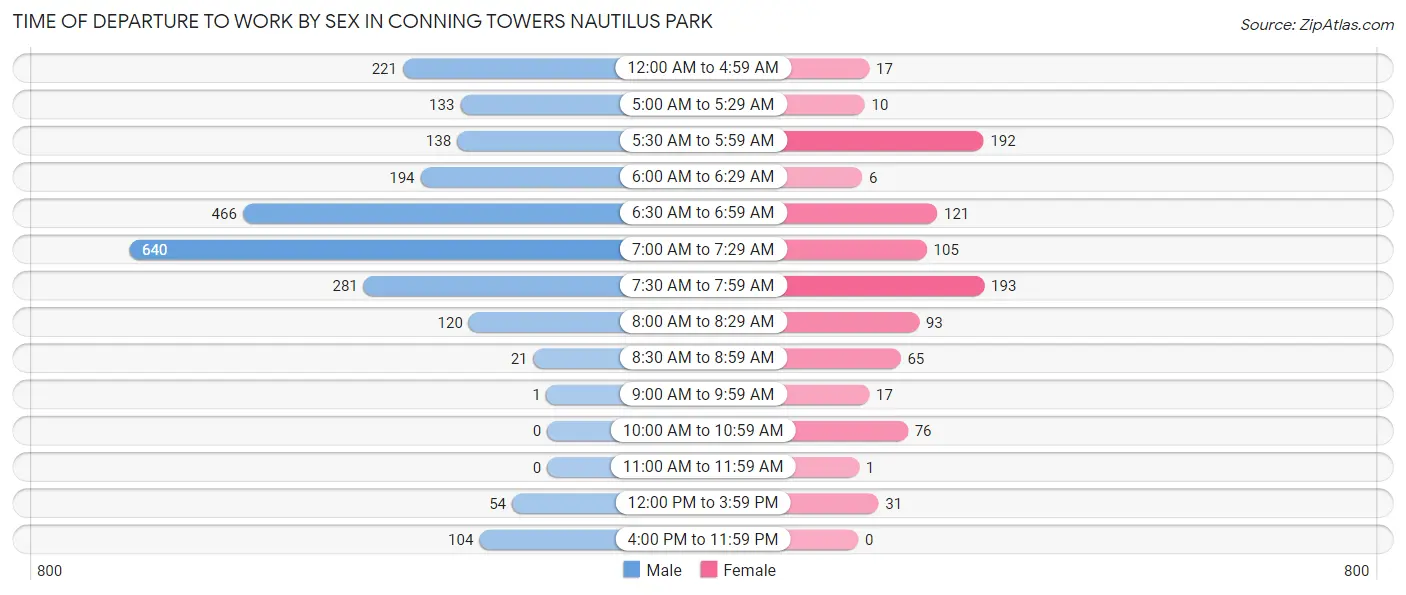
| Time of Departure | Male | Female |
| 12:00 AM to 4:59 AM | 221 (9.3%) | 17 (1.8%) |
| 5:00 AM to 5:29 AM | 133 (5.6%) | 10 (1.1%) |
| 5:30 AM to 5:59 AM | 138 (5.8%) | 192 (20.7%) |
| 6:00 AM to 6:29 AM | 194 (8.2%) | 6 (0.6%) |
| 6:30 AM to 6:59 AM | 466 (19.6%) | 121 (13.1%) |
| 7:00 AM to 7:29 AM | 640 (27.0%) | 105 (11.3%) |
| 7:30 AM to 7:59 AM | 281 (11.8%) | 193 (20.8%) |
| 8:00 AM to 8:29 AM | 120 (5.1%) | 93 (10.0%) |
| 8:30 AM to 8:59 AM | 21 (0.9%) | 65 (7.0%) |
| 9:00 AM to 9:59 AM | 1 (0.0%) | 17 (1.8%) |
| 10:00 AM to 10:59 AM | 0 (0.0%) | 76 (8.2%) |
| 11:00 AM to 11:59 AM | 0 (0.0%) | 1 (0.1%) |
| 12:00 PM to 3:59 PM | 54 (2.3%) | 31 (3.3%) |
| 4:00 PM to 11:59 PM | 104 (4.4%) | 0 (0.0%) |
| Total | 2,373 (100.0%) | 927 (100.0%) |
Housing Occupancy in Conning Towers Nautilus Park
Occupancy by Ownership in Conning Towers Nautilus Park
Of the total 2,521 dwellings in Conning Towers Nautilus Park, owner-occupied units account for 540 (21.4%), while renter-occupied units make up 1,981 (78.6%).
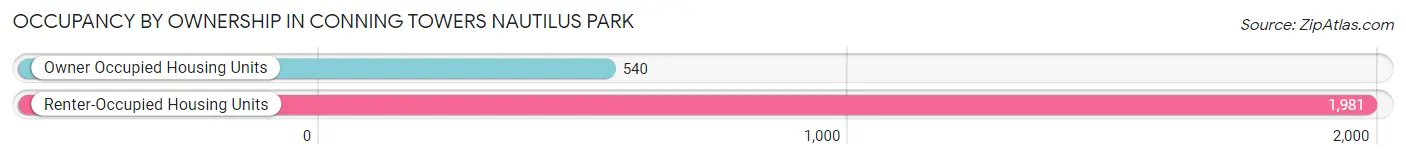
| Occupancy | # Housing Units | % Housing Units |
| Owner Occupied Housing Units | 540 | 21.4% |
| Renter-Occupied Housing Units | 1,981 | 78.6% |
| Total Occupied Housing Units | 2,521 | 100.0% |
Occupancy by Household Size in Conning Towers Nautilus Park
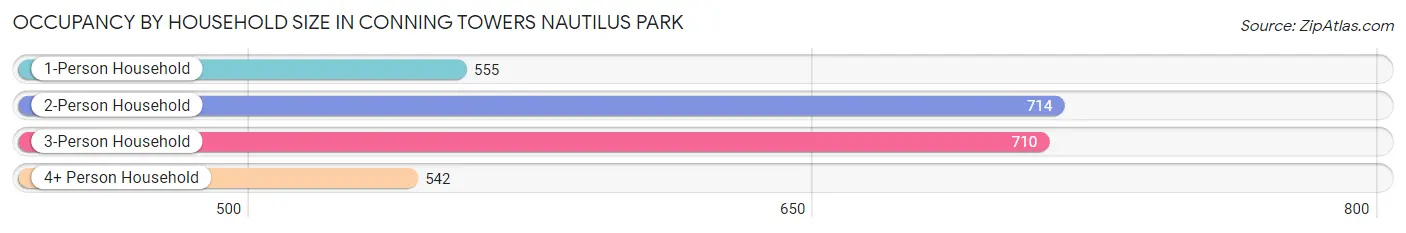
| Household Size | # Housing Units | % Housing Units |
| 1-Person Household | 555 | 22.0% |
| 2-Person Household | 714 | 28.3% |
| 3-Person Household | 710 | 28.2% |
| 4+ Person Household | 542 | 21.5% |
| Total Housing Units | 2,521 | 100.0% |
Occupancy by Ownership by Household Size in Conning Towers Nautilus Park
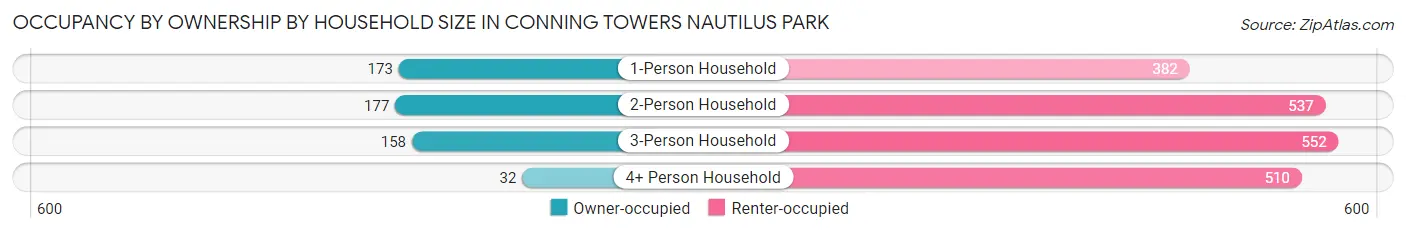
| Household Size | Owner-occupied | Renter-occupied |
| 1-Person Household | 173 (31.2%) | 382 (68.8%) |
| 2-Person Household | 177 (24.8%) | 537 (75.2%) |
| 3-Person Household | 158 (22.3%) | 552 (77.7%) |
| 4+ Person Household | 32 (5.9%) | 510 (94.1%) |
| Total Housing Units | 540 (21.4%) | 1,981 (78.6%) |
Occupancy by Educational Attainment in Conning Towers Nautilus Park
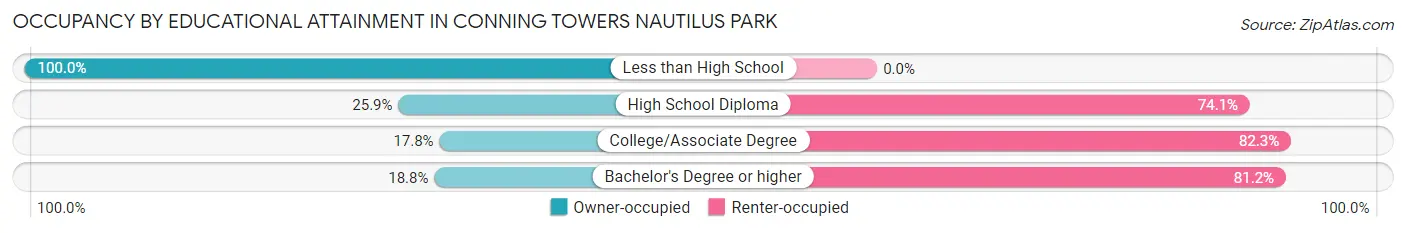
| Household Size | Owner-occupied | Renter-occupied |
| Less than High School | 18 (100.0%) | 0 (0.0%) |
| High School Diploma | 222 (25.9%) | 635 (74.1%) |
| College/Associate Degree | 156 (17.7%) | 723 (82.3%) |
| Bachelor's Degree or higher | 144 (18.8%) | 623 (81.2%) |
Occupancy by Age of Householder in Conning Towers Nautilus Park
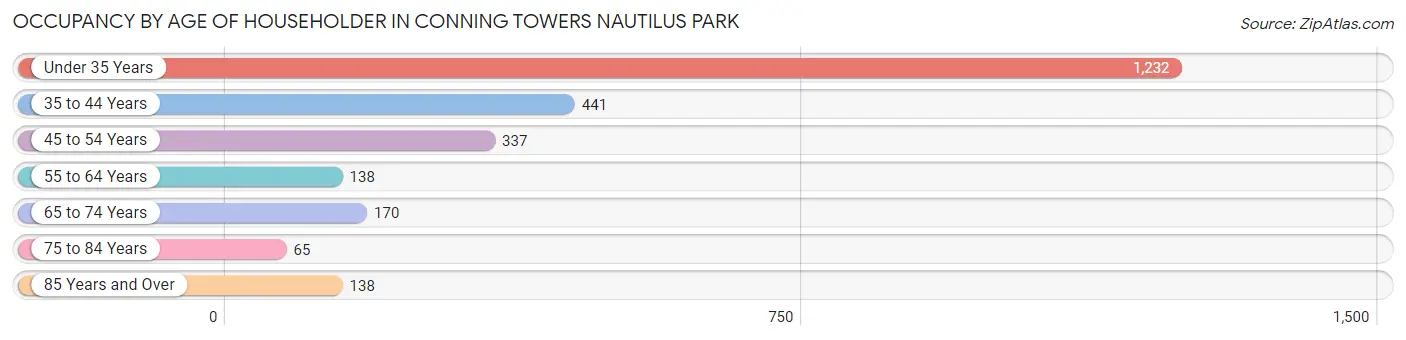
| Age Bracket | # Households | % Households |
| Under 35 Years | 1,232 | 48.9% |
| 35 to 44 Years | 441 | 17.5% |
| 45 to 54 Years | 337 | 13.4% |
| 55 to 64 Years | 138 | 5.5% |
| 65 to 74 Years | 170 | 6.7% |
| 75 to 84 Years | 65 | 2.6% |
| 85 Years and Over | 138 | 5.5% |
| Total | 2,521 | 100.0% |
Housing Finances in Conning Towers Nautilus Park
Median Income by Occupancy in Conning Towers Nautilus Park
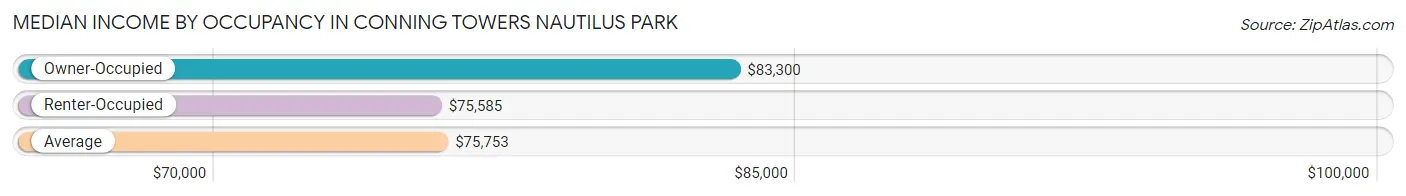
| Occupancy Type | # Households | Median Income |
| Owner-Occupied | 540 (21.4%) | $83,300 |
| Renter-Occupied | 1,981 (78.6%) | $75,585 |
| Average | 2,521 (100.0%) | $75,753 |
Occupancy by Householder Income Bracket in Conning Towers Nautilus Park
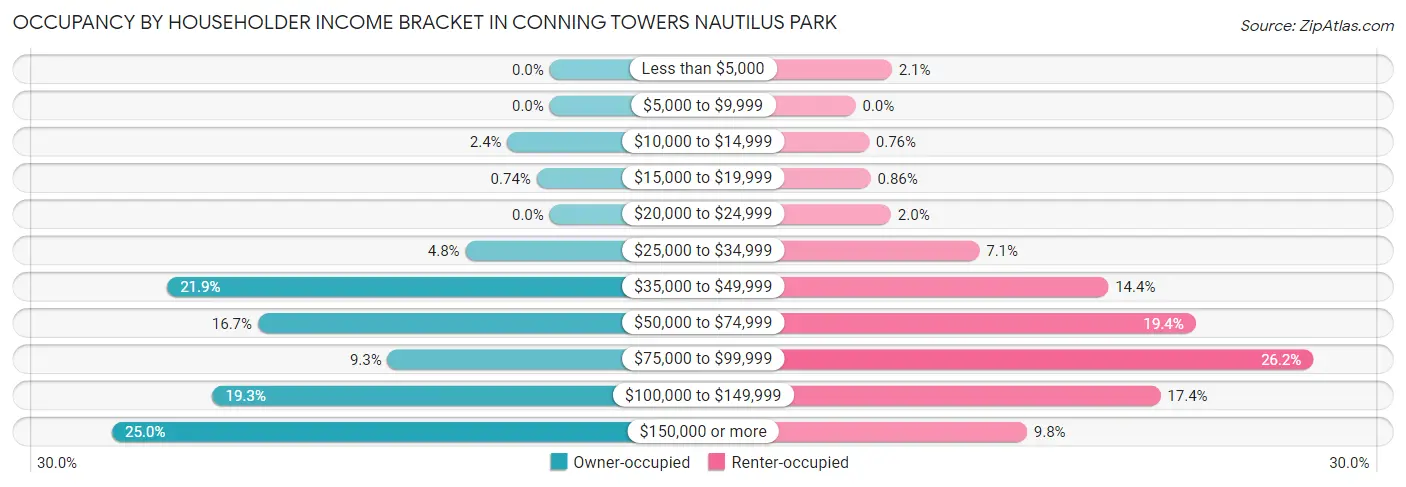
| Income Bracket | Owner-occupied | Renter-occupied |
| Less than $5,000 | 0 (0.0%) | 41 (2.1%) |
| $5,000 to $9,999 | 0 (0.0%) | 0 (0.0%) |
| $10,000 to $14,999 | 13 (2.4%) | 15 (0.8%) |
| $15,000 to $19,999 | 4 (0.7%) | 17 (0.9%) |
| $20,000 to $24,999 | 0 (0.0%) | 40 (2.0%) |
| $25,000 to $34,999 | 26 (4.8%) | 140 (7.1%) |
| $35,000 to $49,999 | 118 (21.8%) | 286 (14.4%) |
| $50,000 to $74,999 | 90 (16.7%) | 385 (19.4%) |
| $75,000 to $99,999 | 50 (9.3%) | 518 (26.2%) |
| $100,000 to $149,999 | 104 (19.3%) | 345 (17.4%) |
| $150,000 or more | 135 (25.0%) | 194 (9.8%) |
| Total | 540 (100.0%) | 1,981 (100.0%) |
Monthly Housing Cost Tiers in Conning Towers Nautilus Park
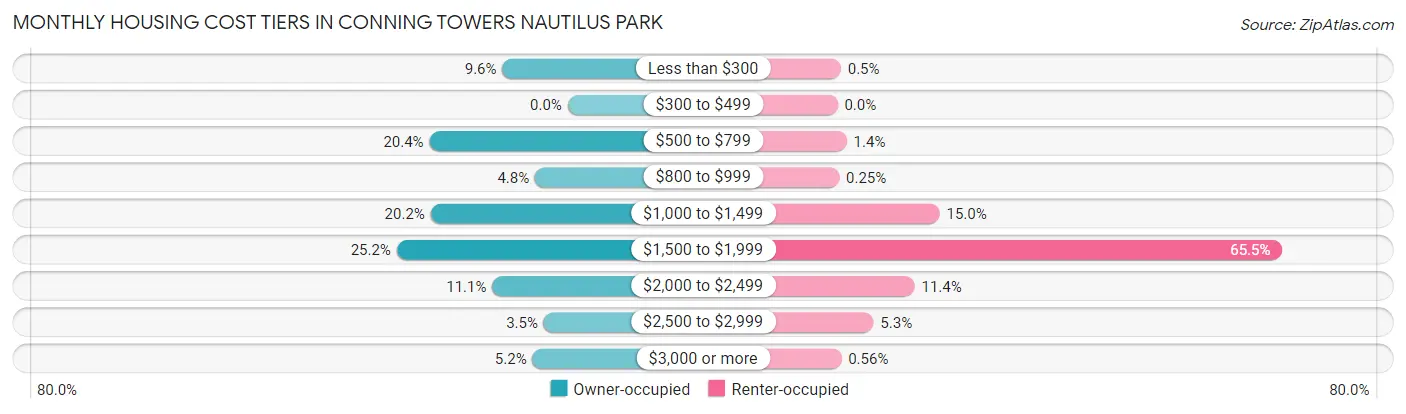
| Monthly Cost | Owner-occupied | Renter-occupied |
| Less than $300 | 52 (9.6%) | 10 (0.5%) |
| $300 to $499 | 0 (0.0%) | 0 (0.0%) |
| $500 to $799 | 110 (20.4%) | 27 (1.4%) |
| $800 to $999 | 26 (4.8%) | 5 (0.3%) |
| $1,000 to $1,499 | 109 (20.2%) | 298 (15.0%) |
| $1,500 to $1,999 | 136 (25.2%) | 1,298 (65.5%) |
| $2,000 to $2,499 | 60 (11.1%) | 225 (11.4%) |
| $2,500 to $2,999 | 19 (3.5%) | 105 (5.3%) |
| $3,000 or more | 28 (5.2%) | 11 (0.6%) |
| Total | 540 (100.0%) | 1,981 (100.0%) |
Physical Housing Characteristics in Conning Towers Nautilus Park
Housing Structures in Conning Towers Nautilus Park
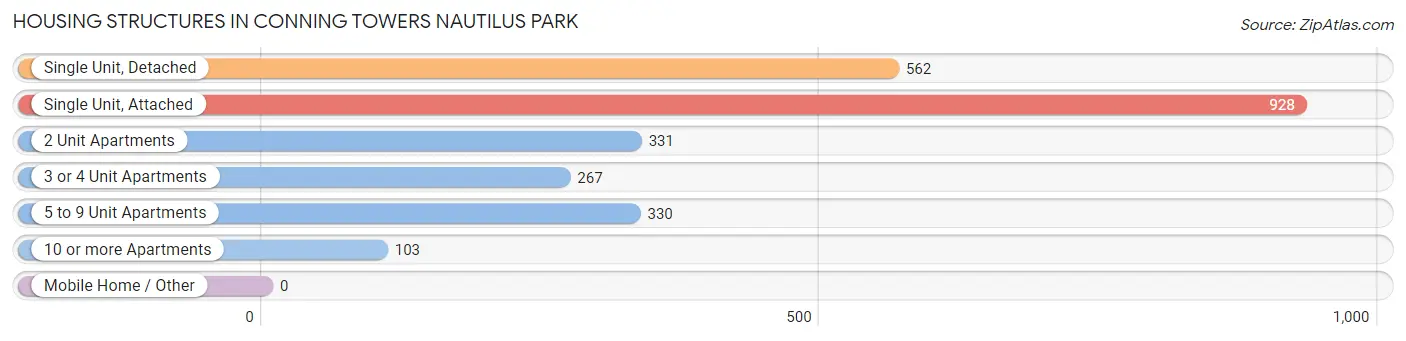
| Structure Type | # Housing Units | % Housing Units |
| Single Unit, Detached | 562 | 22.3% |
| Single Unit, Attached | 928 | 36.8% |
| 2 Unit Apartments | 331 | 13.1% |
| 3 or 4 Unit Apartments | 267 | 10.6% |
| 5 to 9 Unit Apartments | 330 | 13.1% |
| 10 or more Apartments | 103 | 4.1% |
| Mobile Home / Other | 0 | 0.0% |
| Total | 2,521 | 100.0% |
Housing Structures by Occupancy in Conning Towers Nautilus Park
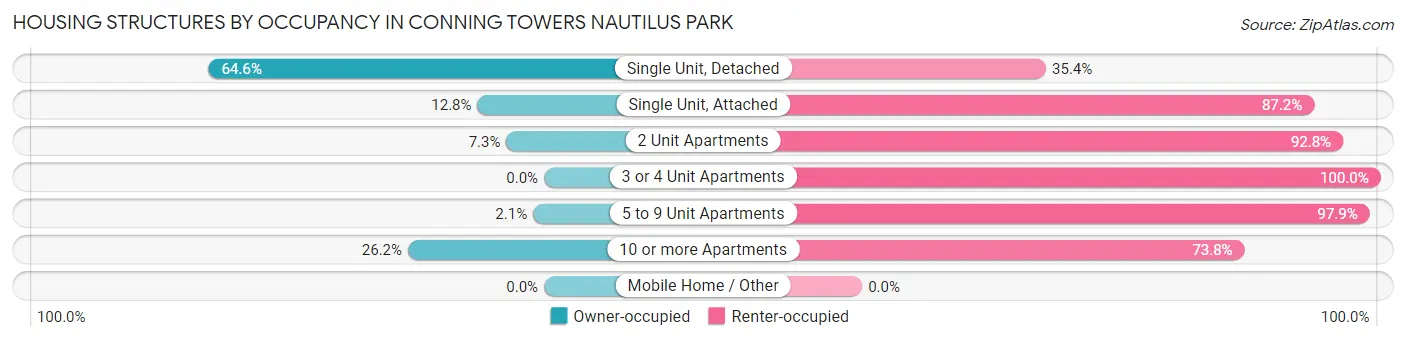
| Structure Type | Owner-occupied | Renter-occupied |
| Single Unit, Detached | 363 (64.6%) | 199 (35.4%) |
| Single Unit, Attached | 119 (12.8%) | 809 (87.2%) |
| 2 Unit Apartments | 24 (7.2%) | 307 (92.7%) |
| 3 or 4 Unit Apartments | 0 (0.0%) | 267 (100.0%) |
| 5 to 9 Unit Apartments | 7 (2.1%) | 323 (97.9%) |
| 10 or more Apartments | 27 (26.2%) | 76 (73.8%) |
| Mobile Home / Other | 0 (0.0%) | 0 (0.0%) |
| Total | 540 (21.4%) | 1,981 (78.6%) |
Housing Structures by Number of Rooms in Conning Towers Nautilus Park
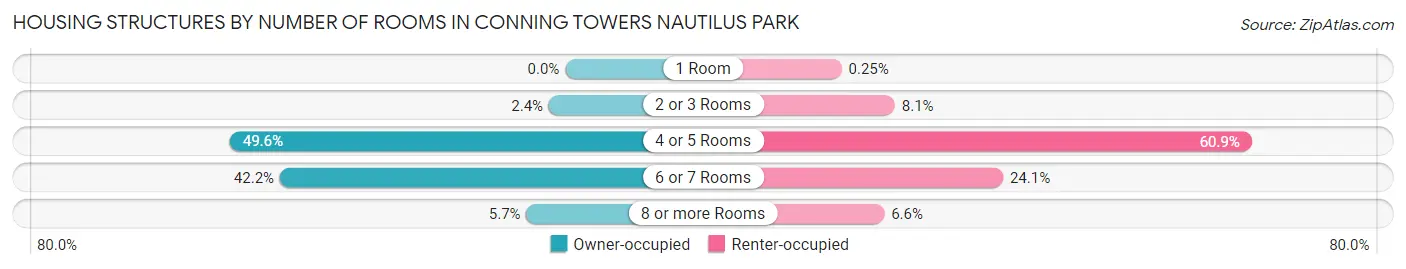
| Number of Rooms | Owner-occupied | Renter-occupied |
| 1 Room | 0 (0.0%) | 5 (0.3%) |
| 2 or 3 Rooms | 13 (2.4%) | 161 (8.1%) |
| 4 or 5 Rooms | 268 (49.6%) | 1,207 (60.9%) |
| 6 or 7 Rooms | 228 (42.2%) | 478 (24.1%) |
| 8 or more Rooms | 31 (5.7%) | 130 (6.6%) |
| Total | 540 (100.0%) | 1,981 (100.0%) |
Housing Structure by Heating Type in Conning Towers Nautilus Park
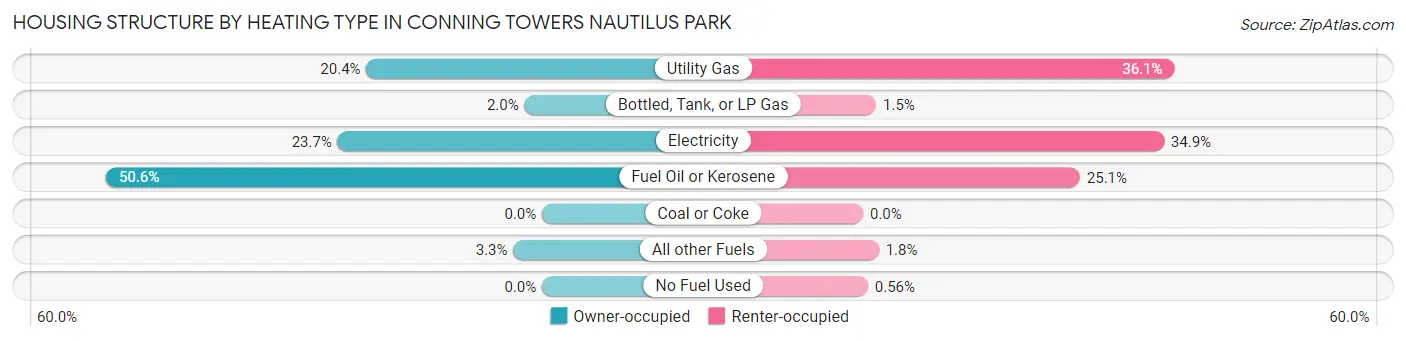
| Heating Type | Owner-occupied | Renter-occupied |
| Utility Gas | 110 (20.4%) | 715 (36.1%) |
| Bottled, Tank, or LP Gas | 11 (2.0%) | 30 (1.5%) |
| Electricity | 128 (23.7%) | 691 (34.9%) |
| Fuel Oil or Kerosene | 273 (50.6%) | 498 (25.1%) |
| Coal or Coke | 0 (0.0%) | 0 (0.0%) |
| All other Fuels | 18 (3.3%) | 36 (1.8%) |
| No Fuel Used | 0 (0.0%) | 11 (0.6%) |
| Total | 540 (100.0%) | 1,981 (100.0%) |
Household Vehicle Usage in Conning Towers Nautilus Park
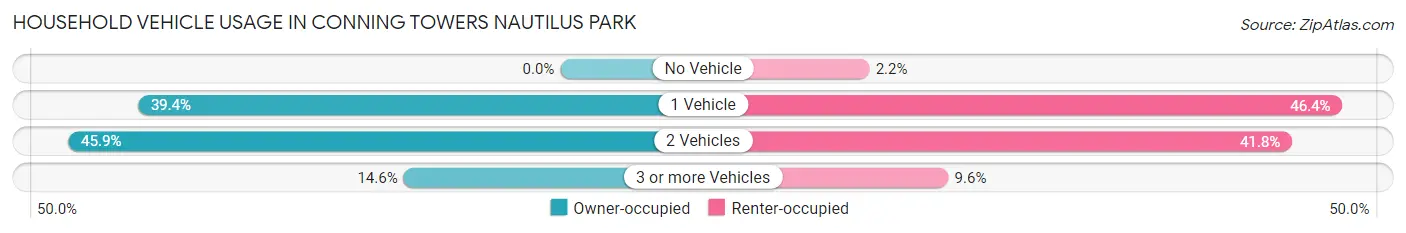
| Vehicles per Household | Owner-occupied | Renter-occupied |
| No Vehicle | 0 (0.0%) | 44 (2.2%) |
| 1 Vehicle | 213 (39.4%) | 920 (46.4%) |
| 2 Vehicles | 248 (45.9%) | 827 (41.7%) |
| 3 or more Vehicles | 79 (14.6%) | 190 (9.6%) |
| Total | 540 (100.0%) | 1,981 (100.0%) |
Real Estate & Mortgages in Conning Towers Nautilus Park
Real Estate and Mortgage Overview in Conning Towers Nautilus Park
| Characteristic | Without Mortgage | With Mortgage |
| Housing Units | 196 | 344 |
| Median Property Value | $254,900 | $245,400 |
| Median Household Income | - | - |
| Monthly Housing Costs | $650 | $28 |
| Real Estate Taxes | $3,770 | $4 |
Property Value by Mortgage Status in Conning Towers Nautilus Park
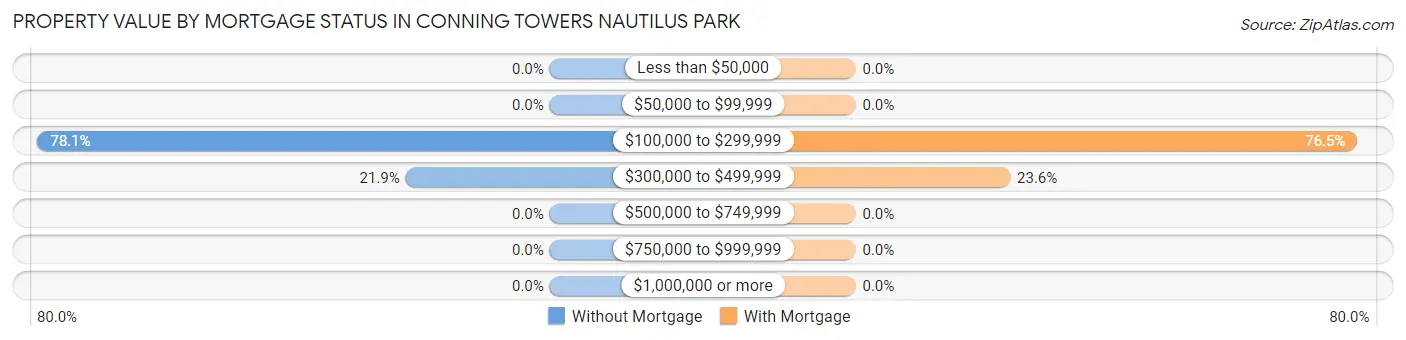
| Property Value | Without Mortgage | With Mortgage |
| Less than $50,000 | 0 (0.0%) | 0 (0.0%) |
| $50,000 to $99,999 | 0 (0.0%) | 0 (0.0%) |
| $100,000 to $299,999 | 153 (78.1%) | 263 (76.4%) |
| $300,000 to $499,999 | 43 (21.9%) | 81 (23.5%) |
| $500,000 to $749,999 | 0 (0.0%) | 0 (0.0%) |
| $750,000 to $999,999 | 0 (0.0%) | 0 (0.0%) |
| $1,000,000 or more | 0 (0.0%) | 0 (0.0%) |
| Total | 196 (100.0%) | 344 (100.0%) |
Household Income by Mortgage Status in Conning Towers Nautilus Park
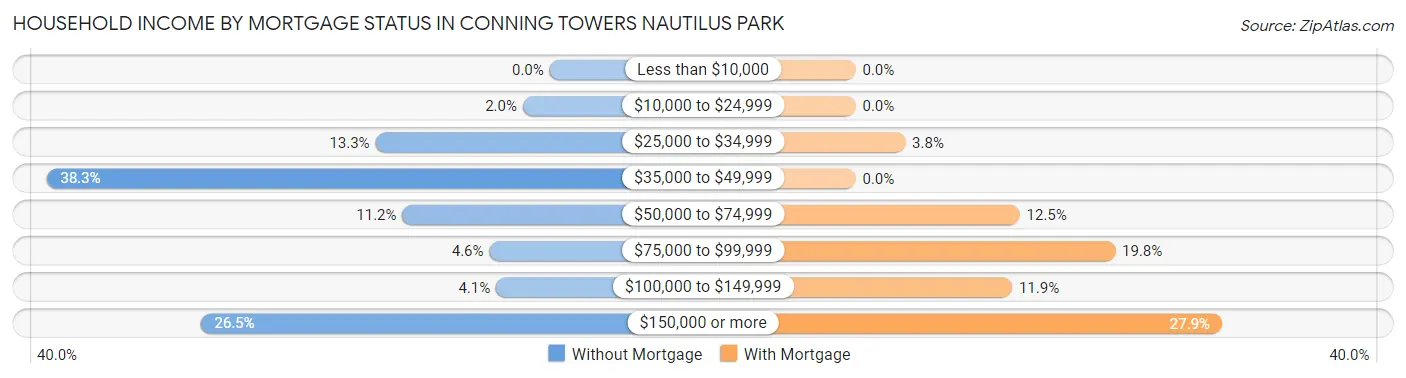
| Household Income | Without Mortgage | With Mortgage |
| Less than $10,000 | 0 (0.0%) | 0 (0.0%) |
| $10,000 to $24,999 | 4 (2.0%) | 0 (0.0%) |
| $25,000 to $34,999 | 26 (13.3%) | 13 (3.8%) |
| $35,000 to $49,999 | 75 (38.3%) | 0 (0.0%) |
| $50,000 to $74,999 | 22 (11.2%) | 43 (12.5%) |
| $75,000 to $99,999 | 9 (4.6%) | 68 (19.8%) |
| $100,000 to $149,999 | 8 (4.1%) | 41 (11.9%) |
| $150,000 or more | 52 (26.5%) | 96 (27.9%) |
| Total | 196 (100.0%) | 344 (100.0%) |
Property Value to Household Income Ratio in Conning Towers Nautilus Park
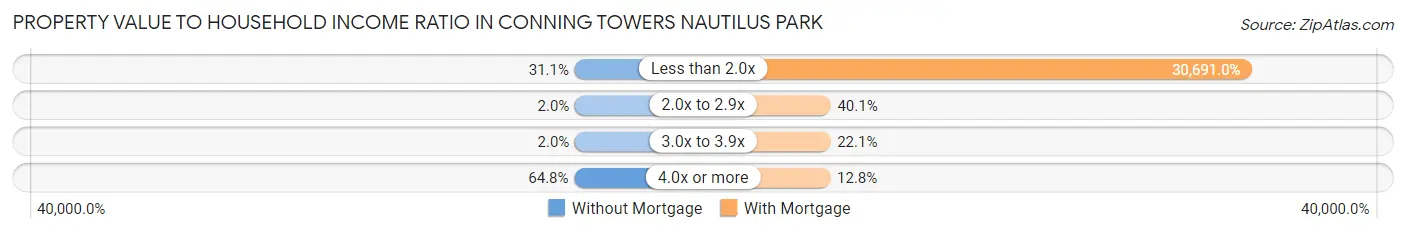
| Value-to-Income Ratio | Without Mortgage | With Mortgage |
| Less than 2.0x | 61 (31.1%) | 105,577 (30,691.0%) |
| 2.0x to 2.9x | 4 (2.0%) | 138 (40.1%) |
| 3.0x to 3.9x | 4 (2.0%) | 76 (22.1%) |
| 4.0x or more | 127 (64.8%) | 44 (12.8%) |
| Total | 196 (100.0%) | 344 (100.0%) |
Real Estate Taxes by Mortgage Status in Conning Towers Nautilus Park
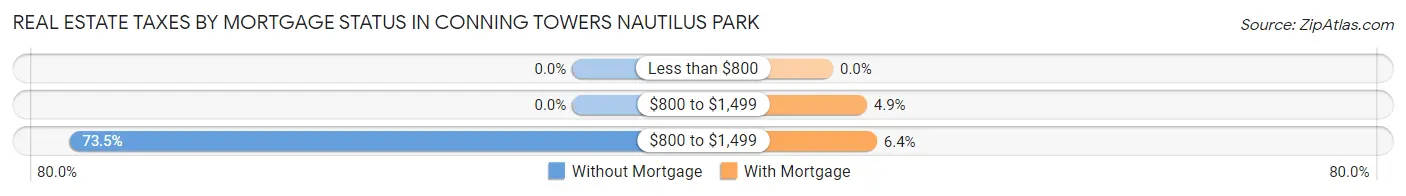
| Property Taxes | Without Mortgage | With Mortgage |
| Less than $800 | 0 (0.0%) | 0 (0.0%) |
| $800 to $1,499 | 0 (0.0%) | 17 (4.9%) |
| $800 to $1,499 | 144 (73.5%) | 22 (6.4%) |
| Total | 196 (100.0%) | 344 (100.0%) |
Health & Disability in Conning Towers Nautilus Park
Health Insurance Coverage by Age in Conning Towers Nautilus Park
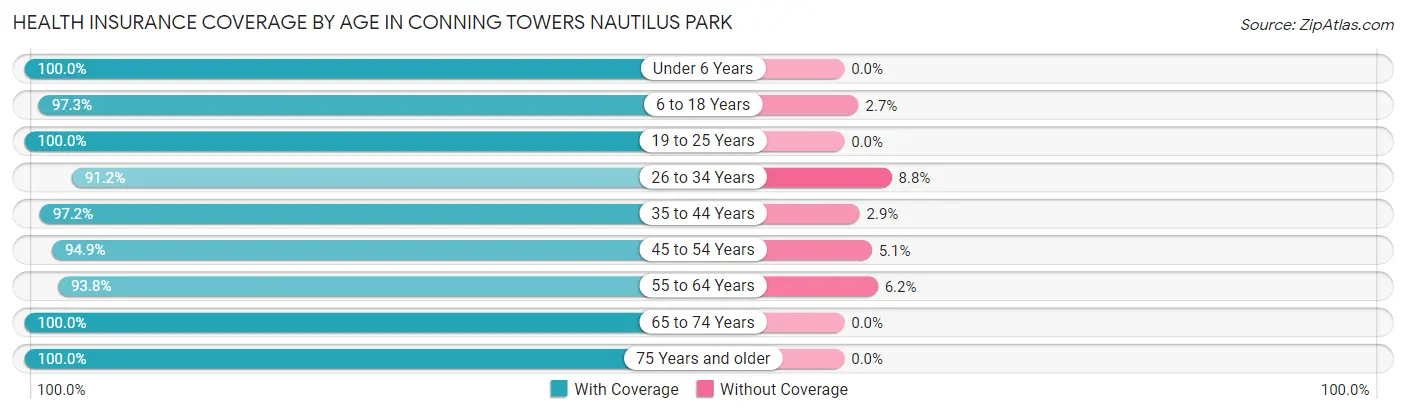
| Age Bracket | With Coverage | Without Coverage |
| Under 6 Years | 1,018 (100.0%) | 0 (0.0%) |
| 6 to 18 Years | 1,245 (97.3%) | 34 (2.7%) |
| 19 to 25 Years | 834 (100.0%) | 0 (0.0%) |
| 26 to 34 Years | 765 (91.2%) | 74 (8.8%) |
| 35 to 44 Years | 546 (97.2%) | 16 (2.9%) |
| 45 to 54 Years | 426 (94.9%) | 23 (5.1%) |
| 55 to 64 Years | 271 (93.8%) | 18 (6.2%) |
| 65 to 74 Years | 204 (100.0%) | 0 (0.0%) |
| 75 Years and older | 372 (100.0%) | 0 (0.0%) |
| Total | 5,681 (97.2%) | 165 (2.8%) |
Health Insurance Coverage by Citizenship Status in Conning Towers Nautilus Park
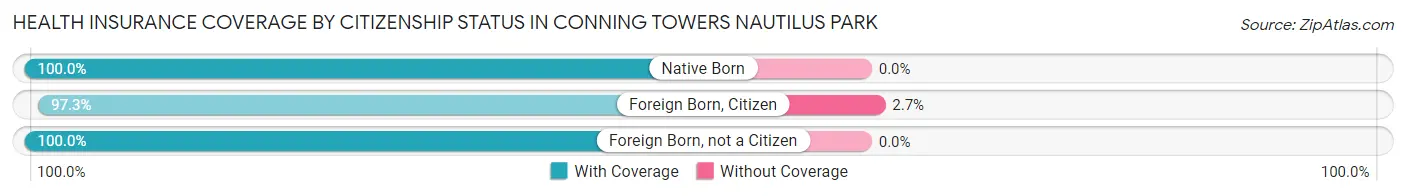
| Citizenship Status | With Coverage | Without Coverage |
| Native Born | 1,018 (100.0%) | 0 (0.0%) |
| Foreign Born, Citizen | 1,245 (97.3%) | 34 (2.7%) |
| Foreign Born, not a Citizen | 834 (100.0%) | 0 (0.0%) |
Health Insurance Coverage by Household Income in Conning Towers Nautilus Park
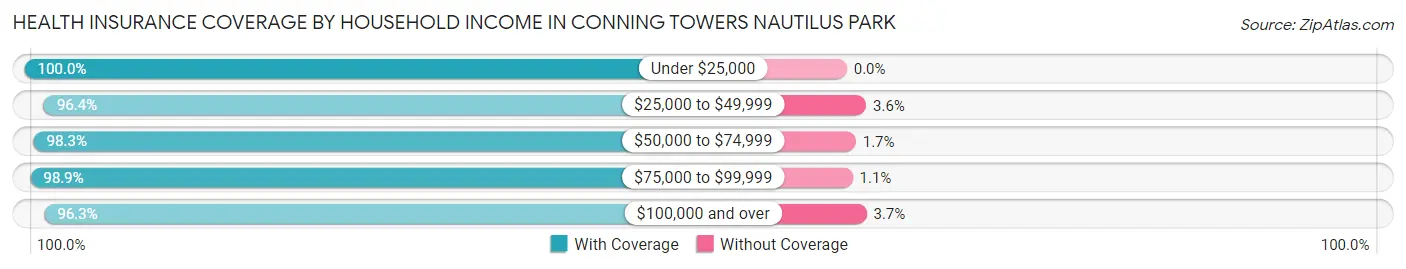
| Household Income | With Coverage | Without Coverage |
| Under $25,000 | 177 (100.0%) | 0 (0.0%) |
| $25,000 to $49,999 | 1,415 (96.4%) | 53 (3.6%) |
| $50,000 to $74,999 | 1,049 (98.3%) | 18 (1.7%) |
| $75,000 to $99,999 | 824 (98.9%) | 9 (1.1%) |
| $100,000 and over | 2,215 (96.3%) | 85 (3.7%) |
Public vs Private Health Insurance Coverage by Age in Conning Towers Nautilus Park
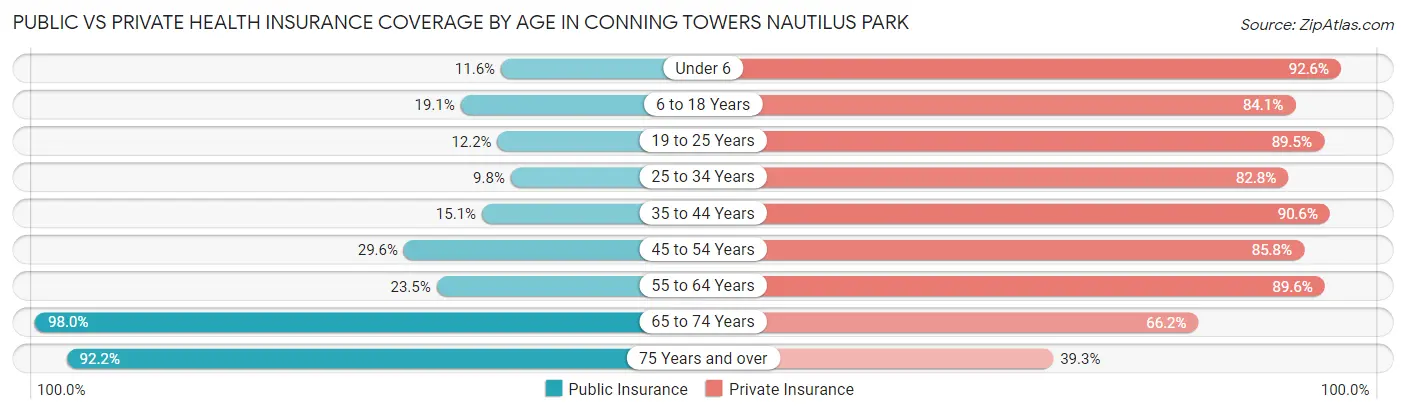
| Age Bracket | Public Insurance | Private Insurance |
| Under 6 | 118 (11.6%) | 943 (92.6%) |
| 6 to 18 Years | 244 (19.1%) | 1,076 (84.1%) |
| 19 to 25 Years | 102 (12.2%) | 746 (89.4%) |
| 25 to 34 Years | 82 (9.8%) | 695 (82.8%) |
| 35 to 44 Years | 85 (15.1%) | 509 (90.6%) |
| 45 to 54 Years | 133 (29.6%) | 385 (85.8%) |
| 55 to 64 Years | 68 (23.5%) | 259 (89.6%) |
| 65 to 74 Years | 200 (98.0%) | 135 (66.2%) |
| 75 Years and over | 343 (92.2%) | 146 (39.3%) |
| Total | 1,375 (23.5%) | 4,894 (83.7%) |
Disability Status by Sex by Age in Conning Towers Nautilus Park
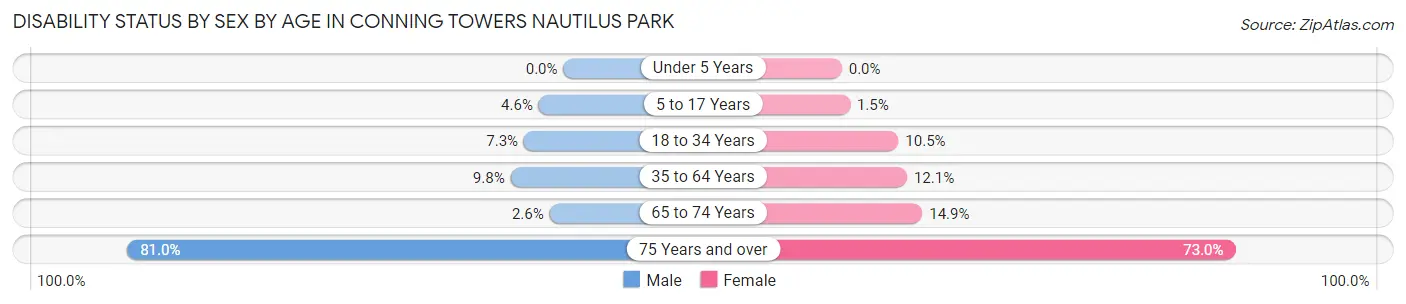
| Age Bracket | Male | Female |
| Under 5 Years | 0 (0.0%) | 0 (0.0%) |
| 5 to 17 Years | 31 (4.6%) | 8 (1.5%) |
| 18 to 34 Years | 36 (7.3%) | 139 (10.5%) |
| 35 to 64 Years | 57 (9.8%) | 87 (12.1%) |
| 65 to 74 Years | 3 (2.6%) | 13 (14.9%) |
| 75 Years and over | 136 (80.9%) | 149 (73.0%) |
Disability Class by Sex by Age in Conning Towers Nautilus Park
Disability Class: Hearing Difficulty
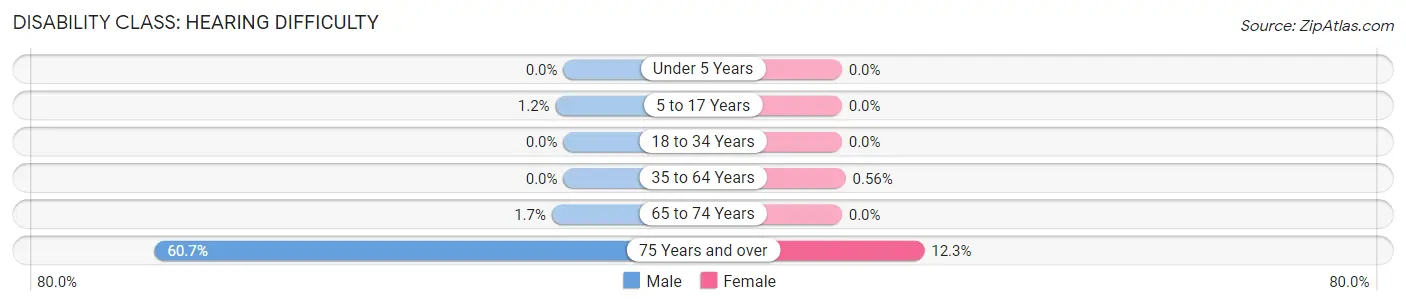
| Age Bracket | Male | Female |
| Under 5 Years | 0 (0.0%) | 0 (0.0%) |
| 5 to 17 Years | 8 (1.2%) | 0 (0.0%) |
| 18 to 34 Years | 0 (0.0%) | 0 (0.0%) |
| 35 to 64 Years | 0 (0.0%) | 4 (0.6%) |
| 65 to 74 Years | 2 (1.7%) | 0 (0.0%) |
| 75 Years and over | 102 (60.7%) | 25 (12.2%) |
Disability Class: Vision Difficulty
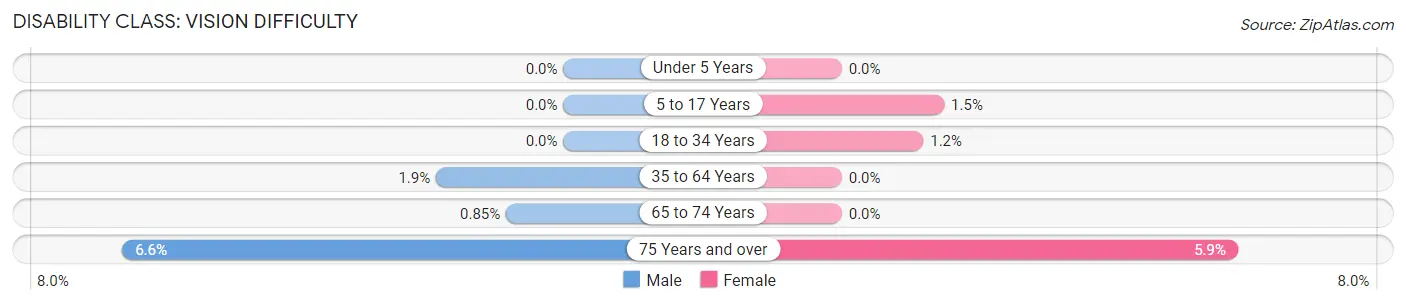
| Age Bracket | Male | Female |
| Under 5 Years | 0 (0.0%) | 0 (0.0%) |
| 5 to 17 Years | 0 (0.0%) | 8 (1.5%) |
| 18 to 34 Years | 0 (0.0%) | 16 (1.2%) |
| 35 to 64 Years | 11 (1.9%) | 0 (0.0%) |
| 65 to 74 Years | 1 (0.9%) | 0 (0.0%) |
| 75 Years and over | 11 (6.6%) | 12 (5.9%) |
Disability Class: Cognitive Difficulty
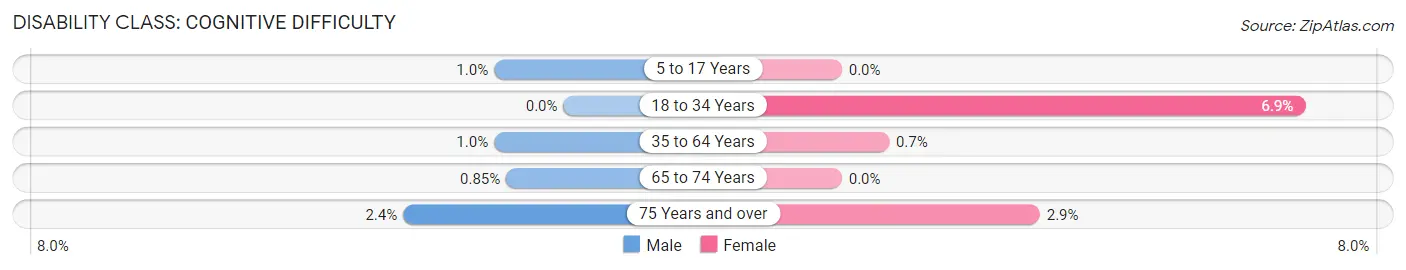
| Age Bracket | Male | Female |
| 5 to 17 Years | 7 (1.0%) | 0 (0.0%) |
| 18 to 34 Years | 0 (0.0%) | 91 (6.9%) |
| 35 to 64 Years | 6 (1.0%) | 5 (0.7%) |
| 65 to 74 Years | 1 (0.9%) | 0 (0.0%) |
| 75 Years and over | 4 (2.4%) | 6 (2.9%) |
Disability Class: Ambulatory Difficulty
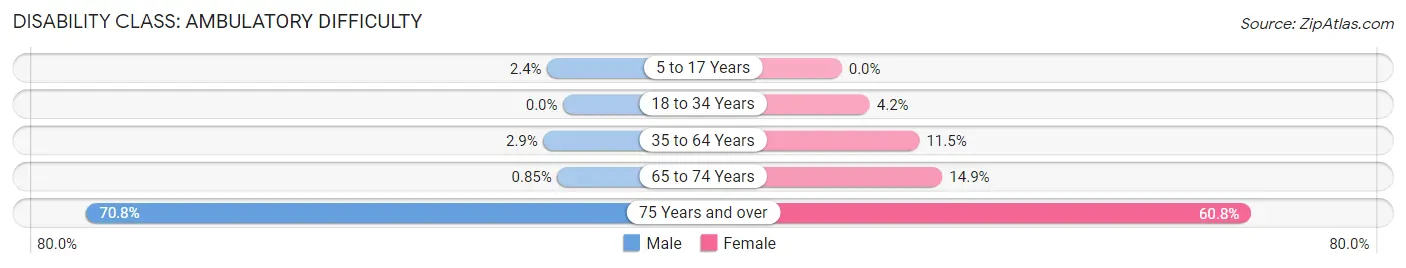
| Age Bracket | Male | Female |
| 5 to 17 Years | 16 (2.4%) | 0 (0.0%) |
| 18 to 34 Years | 0 (0.0%) | 55 (4.2%) |
| 35 to 64 Years | 17 (2.9%) | 83 (11.5%) |
| 65 to 74 Years | 1 (0.9%) | 13 (14.9%) |
| 75 Years and over | 119 (70.8%) | 124 (60.8%) |
Disability Class: Self-Care Difficulty
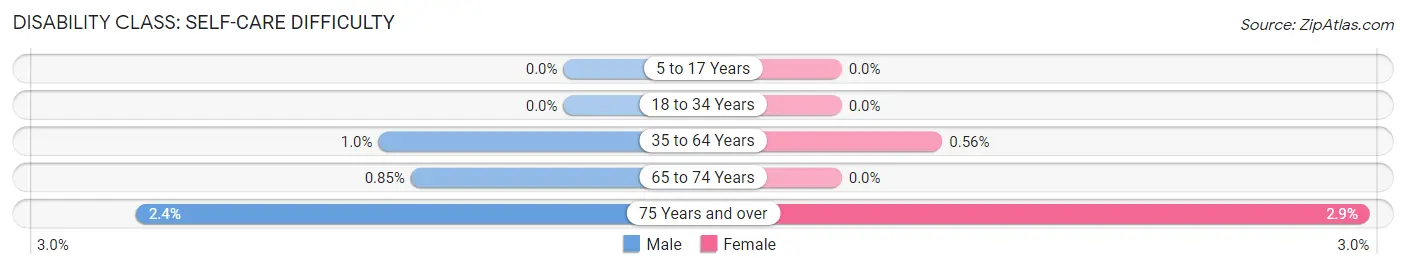
| Age Bracket | Male | Female |
| 5 to 17 Years | 0 (0.0%) | 0 (0.0%) |
| 18 to 34 Years | 0 (0.0%) | 0 (0.0%) |
| 35 to 64 Years | 6 (1.0%) | 4 (0.6%) |
| 65 to 74 Years | 1 (0.9%) | 0 (0.0%) |
| 75 Years and over | 4 (2.4%) | 6 (2.9%) |
Technology Access in Conning Towers Nautilus Park
Computing Device Access in Conning Towers Nautilus Park
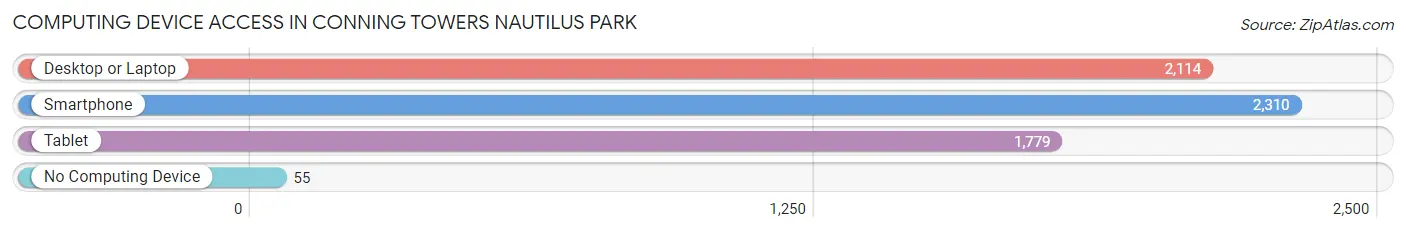
| Device Type | # Households | % Households |
| Desktop or Laptop | 2,114 | 83.9% |
| Smartphone | 2,310 | 91.6% |
| Tablet | 1,779 | 70.6% |
| No Computing Device | 55 | 2.2% |
| Total | 2,521 | 100.0% |
Internet Access in Conning Towers Nautilus Park
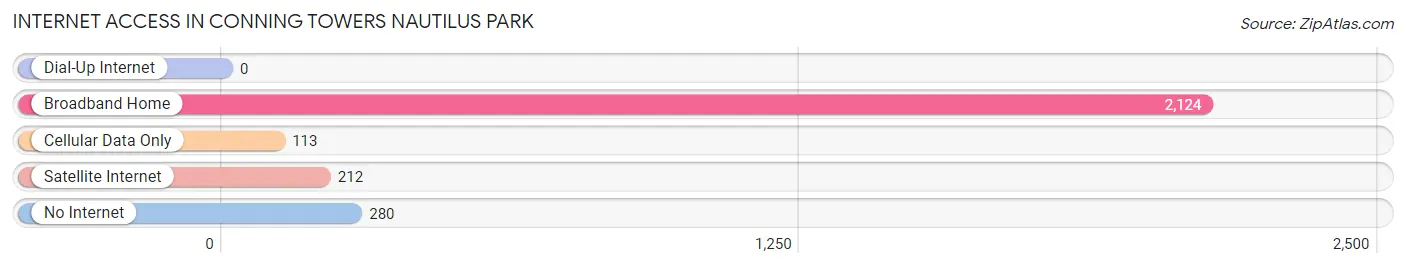
| Internet Type | # Households | % Households |
| Dial-Up Internet | 0 | 0.0% |
| Broadband Home | 2,124 | 84.3% |
| Cellular Data Only | 113 | 4.5% |
| Satellite Internet | 212 | 8.4% |
| No Internet | 280 | 11.1% |
| Total | 2,521 | 100.0% |
Conning Towers Nautilus Park Summary
Conning Towers Nautilus Park is a census-designated place (CDP) located in the town of Groton in New London County, Connecticut. It is located on the Thames River and is part of the Groton-New London metropolitan area. As of the 2010 census, the population of Conning Towers Nautilus Park was 1,521.
Geography
Conning Towers Nautilus Park is located at 41°21'17" North, 72°04'45" West (41.354722, -72.079167). It is situated on the east side of the Thames River, just south of the city of Groton. The CDP has a total area of 0.7 square miles, all of which is land.
History
The area now known as Conning Towers Nautilus Park was originally inhabited by the Mohegan tribe. The first European settlers arrived in the area in the 1630s, and the town of Groton was established in 1705.
In the early 20th century, the area was developed as a residential neighborhood. In the 1950s, the United States Navy established a submarine base in the area, which was named the Naval Submarine Base New London. The base was home to the USS Nautilus, the world's first nuclear-powered submarine. In the 1960s, the area was renamed Conning Towers Nautilus Park in honor of the submarine base.
Economy
Conning Towers Nautilus Park is primarily a residential community, with most of its residents employed in the nearby cities of Groton and New London. The Naval Submarine Base New London is the largest employer in the area, providing jobs for many of the residents. Other major employers in the area include Electric Boat, Pfizer, and the Groton-New London Airport.
Demographics
As of the 2010 census, there were 1,521 people, 602 households, and 431 families residing in Conning Towers Nautilus Park. The population density was 2,179.3 people per square mile. The racial makeup of the CDP was 87.2% White, 5.2% African American, 0.7% Native American, 2.2% Asian, 0.1% Pacific Islander, 1.7% from other races, and 2.7% from two or more races. Hispanic or Latino of any race were 5.2% of the population.
The median income for a household in Conning Towers Nautilus Park was $60,938, and the median income for a family was $71,250. Males had a median income of $50,000 versus $37,500 for females. The per capita income for the CDP was $27,945. About 4.2% of families and 5.3% of the population were below the poverty line, including 6.2% of those under age 18 and none of those age 65 or over.
Common Questions
What is Per Capita Income in Conning Towers Nautilus Park?
Per Capita income in Conning Towers Nautilus Park is $30,443.
What is the Median Family Income in Conning Towers Nautilus Park?
Median Family Income in Conning Towers Nautilus Park is $71,866.
What is the Median Household income in Conning Towers Nautilus Park?
Median Household Income in Conning Towers Nautilus Park is $75,753.
What is Income or Wage Gap in Conning Towers Nautilus Park?
Income or Wage Gap in Conning Towers Nautilus Park is 10.2%.
Women in Conning Towers Nautilus Park earn 89.8 cents for every dollar earned by a man.
What is Family Income Deficit in Conning Towers Nautilus Park?
Family Income Deficit in Conning Towers Nautilus Park is $5,045.
Families that are below poverty line in Conning Towers Nautilus Park earn $5,045 less on average than the poverty threshold level.
What is Inequality or Gini Index in Conning Towers Nautilus Park?
Inequality or Gini Index in Conning Towers Nautilus Park is 0.33.
What is the Total Population of Conning Towers Nautilus Park?
Total Population of Conning Towers Nautilus Park is 8,330.
What is the Total Male Population of Conning Towers Nautilus Park?
Total Male Population of Conning Towers Nautilus Park is 4,939.
What is the Total Female Population of Conning Towers Nautilus Park?
Total Female Population of Conning Towers Nautilus Park is 3,391.
What is the Ratio of Males per 100 Females in Conning Towers Nautilus Park?
There are 145.65 Males per 100 Females in Conning Towers Nautilus Park.
What is the Ratio of Females per 100 Males in Conning Towers Nautilus Park?
There are 68.66 Females per 100 Males in Conning Towers Nautilus Park.
What is the Median Population Age in Conning Towers Nautilus Park?
Median Population Age in Conning Towers Nautilus Park is 24.8 Years.
What is the Average Family Size in Conning Towers Nautilus Park
Average Family Size in Conning Towers Nautilus Park is 3.2 People.
What is the Average Household Size in Conning Towers Nautilus Park
Average Household Size in Conning Towers Nautilus Park is 2.7 People.
How Large is the Labor Force in Conning Towers Nautilus Park?
There are 4,402 People in the Labor Forcein in Conning Towers Nautilus Park.
What is the Percentage of People in the Labor Force in Conning Towers Nautilus Park?
70.4% of People are in the Labor Force in Conning Towers Nautilus Park.
What is the Unemployment Rate in Conning Towers Nautilus Park?
Unemployment Rate in Conning Towers Nautilus Park is 7.5%.