Cities with the Highest Percentage of Households Heated by Electricity in Connecticut
RELATED REPORTS & OPTIONS
Electrical Heating
Connecticut
Compare Cities
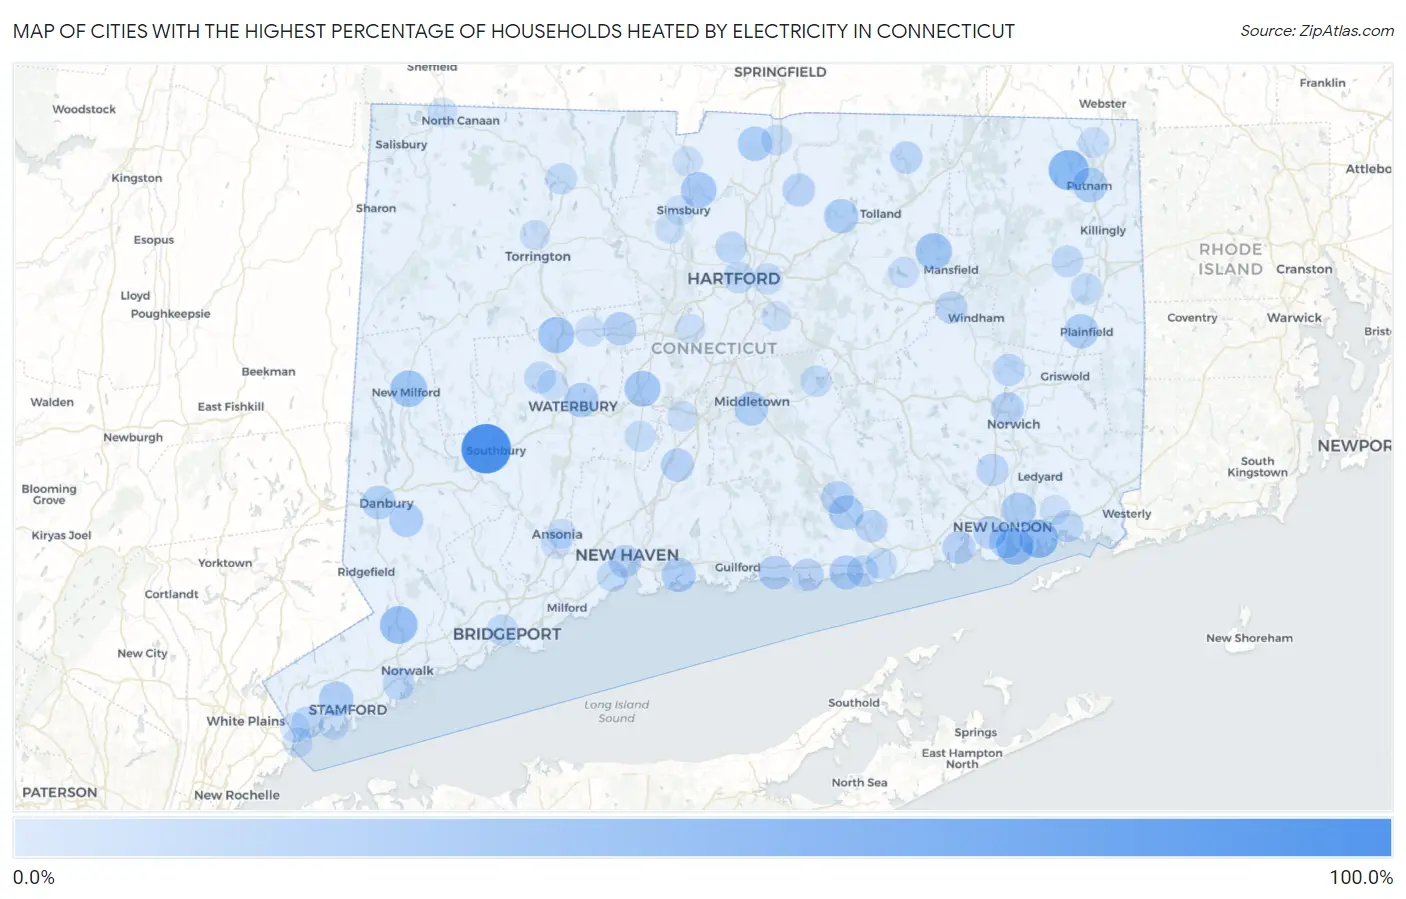
Map of Cities with the Highest Percentage of Households Heated by Electricity in Connecticut
0.0%
100.0%
Cities with the Highest Percentage of Households Heated by Electricity in Connecticut
| City | Electrical Heating | vs State | vs National | |
| 1. | Heritage Village | 89.4% | 17.3%(+72.1)#1 | 40.2%(+49.2)#2,027 |
| 2. | Hawleyville | 52.6% | 17.3%(+35.3)#2 | 40.2%(+12.4)#8,593 |
| 3. | South Woodstock | 52.4% | 17.3%(+35.1)#3 | 40.2%(+12.2)#8,627 |
| 4. | Poquonock Bridge | 46.7% | 17.3%(+29.4)#4 | 40.2%(+6.50)#9,998 |
| 5. | Route 7 Gateway | 44.7% | 17.3%(+27.4)#5 | 40.2%(+4.50)#10,519 |
| 6. | Wilton Center | 43.5% | 17.3%(+26.2)#6 | 40.2%(+3.30)#10,845 |
| 7. | Groton | 41.3% | 17.3%(+24.0)#7 | 40.2%(+1.10)#11,458 |
| 8. | Pleasant Valley | 40.8% | 17.3%(+23.5)#8 | 40.2%(+0.600)#11,611 |
| 9. | South Wilton | 39.9% | 17.3%(+22.6)#9 | 40.2%(-0.300)#11,875 |
| 10. | New Milford | 39.2% | 17.3%(+21.9)#10 | 40.2%(-1.00)#12,057 |
| 11. | Storrs | 38.4% | 17.3%(+21.1)#11 | 40.2%(-1.80)#12,279 |
| 12. | Thomaston | 37.6% | 17.3%(+20.3)#12 | 40.2%(-2.60)#12,495 |
| 13. | Plantsville | 36.0% | 17.3%(+18.7)#13 | 40.2%(-4.20)#12,955 |
| 14. | Tariffville | 35.3% | 17.3%(+18.0)#14 | 40.2%(-4.90)#13,175 |
| 15. | Darien Downtown | 34.4% | 17.3%(+17.1)#15 | 40.2%(-5.80)#13,470 |
| 16. | Conning Towers Nautilus Park | 32.5% | 17.3%(+15.2)#16 | 40.2%(-7.70)#14,117 |
| 17. | Mechanicsville | 32.5% | 17.3%(+15.2)#17 | 40.2%(-7.70)#14,139 |
| 18. | Putnam | 31.8% | 17.3%(+14.5)#18 | 40.2%(-8.40)#14,354 |
| 19. | Bogus Hill | 31.7% | 17.3%(+14.4)#19 | 40.2%(-8.50)#14,411 |
| 20. | Stamford | 31.4% | 17.3%(+14.1)#20 | 40.2%(-8.80)#14,494 |
| 21. | Waterbury | 31.1% | 17.3%(+13.8)#21 | 40.2%(-9.10)#14,586 |
| 22. | Suffield Depot | 31.1% | 17.3%(+13.8)#22 | 40.2%(-9.10)#14,597 |
| 23. | Rockville | 31.0% | 17.3%(+13.7)#23 | 40.2%(-9.20)#14,626 |
| 24. | Deep River Center | 30.8% | 17.3%(+13.5)#24 | 40.2%(-9.40)#14,697 |
| 25. | Plainfield Village | 30.6% | 17.3%(+13.3)#25 | 40.2%(-9.60)#14,781 |
| 26. | Branford Center | 30.4% | 17.3%(+13.1)#26 | 40.2%(-9.80)#14,845 |
| 27. | New London | 30.0% | 17.3%(+12.7)#27 | 40.2%(-10.2)#14,971 |
| 28. | Westbrook Center | 30.0% | 17.3%(+12.7)#28 | 40.2%(-10.2)#14,989 |
| 29. | Lake Chaffee | 29.5% | 17.3%(+12.2)#29 | 40.2%(-10.7)#15,206 |
| 30. | Bethel | 29.4% | 17.3%(+12.1)#30 | 40.2%(-10.8)#15,216 |
| 31. | Middletown | 29.0% | 17.3%(+11.7)#31 | 40.2%(-11.2)#15,378 |
| 32. | Danbury | 28.4% | 17.3%(+11.1)#32 | 40.2%(-11.8)#15,612 |
| 33. | Madison Center | 27.8% | 17.3%(+10.5)#33 | 40.2%(-12.4)#15,812 |
| 34. | Bristol | 27.2% | 17.3%(+9.90)#34 | 40.2%(-13.0)#16,029 |
| 35. | Wallingford Center | 26.6% | 17.3%(+9.30)#35 | 40.2%(-13.6)#16,260 |
| 36. | Waterford | 26.6% | 17.3%(+9.30)#36 | 40.2%(-13.6)#16,266 |
| 37. | Bantam Borough | 26.6% | 17.3%(+9.30)#37 | 40.2%(-13.6)#16,278 |
| 38. | Norwich | 26.0% | 17.3%(+8.70)#38 | 40.2%(-14.2)#16,488 |
| 39. | Chester Center | 26.0% | 17.3%(+8.70)#39 | 40.2%(-14.2)#16,502 |
| 40. | Broad Brook | 25.4% | 17.3%(+8.10)#40 | 40.2%(-14.8)#16,758 |
| 41. | New Canaan | 25.2% | 17.3%(+7.90)#41 | 40.2%(-15.0)#16,833 |
| 42. | Niantic | 25.1% | 17.3%(+7.80)#42 | 40.2%(-15.1)#16,872 |
| 43. | New Haven | 24.5% | 17.3%(+7.20)#43 | 40.2%(-15.7)#17,159 |
| 44. | Clinton | 24.5% | 17.3%(+7.20)#44 | 40.2%(-15.7)#17,177 |
| 45. | Norwalk | 23.7% | 17.3%(+6.40)#45 | 40.2%(-16.5)#17,481 |
| 46. | Bridgewater | 23.6% | 17.3%(+6.30)#46 | 40.2%(-16.6)#17,575 |
| 47. | Willimantic | 23.5% | 17.3%(+6.20)#47 | 40.2%(-16.7)#17,582 |
| 48. | Essex Village | 23.4% | 17.3%(+6.10)#48 | 40.2%(-16.8)#17,644 |
| 49. | Baltic | 23.2% | 17.3%(+5.90)#49 | 40.2%(-17.0)#17,746 |
| 50. | Oxoboxo River | 23.0% | 17.3%(+5.70)#50 | 40.2%(-17.2)#17,849 |
| 51. | Stafford Springs | 22.7% | 17.3%(+5.40)#51 | 40.2%(-17.5)#17,981 |
| 52. | Greenwich | 22.1% | 17.3%(+4.80)#52 | 40.2%(-18.1)#18,266 |
| 53. | Botsford | 22.1% | 17.3%(+4.80)#53 | 40.2%(-18.1)#18,298 |
| 54. | Mystic | 21.7% | 17.3%(+4.40)#54 | 40.2%(-18.5)#18,494 |
| 55. | Brooklyn | 21.6% | 17.3%(+4.30)#55 | 40.2%(-18.6)#18,573 |
| 56. | Naugatuck Borough | 21.5% | 17.3%(+4.20)#56 | 40.2%(-18.7)#18,600 |
| 57. | Watertown | 21.5% | 17.3%(+4.20)#57 | 40.2%(-18.7)#18,617 |
| 58. | Groton Long Point Borough | 21.4% | 17.3%(+4.10)#58 | 40.2%(-18.8)#18,691 |
| 59. | Blue Hills | 21.3% | 17.3%(+4.00)#59 | 40.2%(-18.9)#18,731 |
| 60. | Saybrook Manor | 20.9% | 17.3%(+3.60)#60 | 40.2%(-19.3)#18,941 |
| 61. | Hartford | 20.8% | 17.3%(+3.50)#61 | 40.2%(-19.4)#18,960 |
| 62. | Fenwick Borough | 20.8% | 17.3%(+3.50)#62 | 40.2%(-19.4)#19,021 |
| 63. | Wauregan | 20.3% | 17.3%(+3.00)#63 | 40.2%(-19.9)#19,295 |
| 64. | Winsted | 19.9% | 17.3%(+2.60)#64 | 40.2%(-20.3)#19,516 |
| 65. | Old Saybrook Center | 19.9% | 17.3%(+2.60)#65 | 40.2%(-20.3)#19,526 |
| 66. | Bridgeport | 19.8% | 17.3%(+2.50)#66 | 40.2%(-20.4)#19,548 |
| 67. | Lake Pocotopaug | 19.7% | 17.3%(+2.40)#67 | 40.2%(-20.5)#19,608 |
| 68. | West Haven | 19.5% | 17.3%(+2.20)#68 | 40.2%(-20.7)#19,690 |
| 69. | Jewett City Borough | 19.3% | 17.3%(+2.00)#69 | 40.2%(-20.9)#19,820 |
| 70. | Cheshire Village | 18.8% | 17.3%(+1.50)#70 | 40.2%(-21.4)#20,054 |
| 71. | Stratford Downtown | 18.7% | 17.3%(+1.40)#71 | 40.2%(-21.5)#20,128 |
| 72. | East Hartford | 18.5% | 17.3%(+1.20)#72 | 40.2%(-21.7)#20,234 |
| 73. | Cornwall Bridge | 18.2% | 17.3%(+0.900)#73 | 40.2%(-22.0)#20,466 |
| 74. | South Coventry | 18.1% | 17.3%(+0.800)#74 | 40.2%(-22.1)#20,528 |
| 75. | North Grosvenor Dale | 18.1% | 17.3%(+0.800)#75 | 40.2%(-22.1)#20,530 |
| 76. | Thompsonville | 17.6% | 17.3%(+0.300)#76 | 40.2%(-22.6)#20,768 |
| 77. | Danielson Borough | 17.6% | 17.3%(+0.300)#77 | 40.2%(-22.6)#20,776 |
| 78. | Stonington Borough | 17.6% | 17.3%(+0.300)#78 | 40.2%(-22.6)#20,788 |
| 79. | Candlewood Shores | 17.1% | 17.3%(-0.200)#79 | 40.2%(-23.1)#21,082 |
| 80. | Meriden | 16.9% | 17.3%(-0.400)#80 | 40.2%(-23.3)#21,160 |
| 81. | Quasset Lake | 16.7% | 17.3%(-0.600)#81 | 40.2%(-23.5)#21,299 |
| 82. | Old Hill | 16.6% | 17.3%(-0.700)#82 | 40.2%(-23.6)#21,357 |
| 83. | Oakville | 16.5% | 17.3%(-0.800)#83 | 40.2%(-23.7)#21,398 |
| 84. | Terryville | 16.3% | 17.3%(-1.00)#84 | 40.2%(-23.9)#21,526 |
| 85. | Torrington | 16.2% | 17.3%(-1.10)#85 | 40.2%(-24.0)#21,566 |
| 86. | Old Greenwich | 16.2% | 17.3%(-1.10)#86 | 40.2%(-24.0)#21,579 |
| 87. | Derby | 16.1% | 17.3%(-1.20)#87 | 40.2%(-24.1)#21,630 |
| 88. | Byram | 15.9% | 17.3%(-1.40)#88 | 40.2%(-24.3)#21,734 |
| 89. | Woodmont Borough | 15.8% | 17.3%(-1.50)#89 | 40.2%(-24.4)#21,811 |
| 90. | Glastonbury Center | 15.7% | 17.3%(-1.60)#90 | 40.2%(-24.5)#21,844 |
| 91. | Salmon Brook | 15.5% | 17.3%(-1.80)#91 | 40.2%(-24.7)#21,958 |
| 92. | Litchfield Borough | 15.5% | 17.3%(-1.80)#92 | 40.2%(-24.7)#21,963 |
| 93. | New Britain | 15.4% | 17.3%(-1.90)#93 | 40.2%(-24.8)#21,989 |
| 94. | Simsbury Center | 15.4% | 17.3%(-1.90)#94 | 40.2%(-24.8)#22,005 |
| 95. | Lordship | 15.4% | 17.3%(-1.90)#95 | 40.2%(-24.8)#22,008 |
| 96. | Old Mystic | 15.4% | 17.3%(-1.90)#96 | 40.2%(-24.8)#22,010 |
| 97. | Ansonia | 15.2% | 17.3%(-2.10)#97 | 40.2%(-25.0)#22,138 |
| 98. | Canaan | 15.2% | 17.3%(-2.10)#98 | 40.2%(-25.0)#22,170 |
| 99. | Pemberwick | 15.1% | 17.3%(-2.20)#99 | 40.2%(-25.1)#22,240 |
| 100. | Weatogue | 15.1% | 17.3%(-2.20)#100 | 40.2%(-25.1)#22,242 |
Common Questions
What are the Top 10 Cities with the Highest Percentage of Households Heated by Electricity in Connecticut?
Top 10 Cities with the Highest Percentage of Households Heated by Electricity in Connecticut are:
#1
89.4%
#2
52.4%
#3
46.7%
#4
43.5%
#5
41.3%
#6
39.2%
#7
38.4%
#8
37.6%
#9
36.0%
#10
35.3%
What city has the Highest Percentage of Households Heated by Electricity in Connecticut?
Heritage Village has the Highest Percentage of Households Heated by Electricity in Connecticut with 89.4%.
What is the Percentage of Households Heated by Electricity in the State of Connecticut?
Percentage of Households Heated by Electricity in Connecticut is 17.3%.
What is the Percentage of Households Heated by Electricity in the United States?
Percentage of Households Heated by Electricity in the United States is 40.2%.