Litchfield borough, CT Map & Demographics
Litchfield borough Overview
$67,777
PER CAPITA INCOME
$149,432
AVG FAMILY INCOME
$121,346
AVG HOUSEHOLD INCOME
6.0%
WAGE / INCOME GAP [ % ]
94.0¢/ $1
WAGE / INCOME GAP [ $ ]
0.48
INEQUALITY / GINI INDEX
1,355
TOTAL POPULATION
667
MALE POPULATION
688
FEMALE POPULATION
96.95
MALES / 100 FEMALES
103.15
FEMALES / 100 MALES
45.4
MEDIAN AGE
3.1
AVG FAMILY SIZE
2.4
AVG HOUSEHOLD SIZE
692
LABOR FORCE [ PEOPLE ]
61.1%
PERCENT IN LABOR FORCE
4.9%
UNEMPLOYMENT RATE
Income in Litchfield borough
Income Overview in Litchfield borough
Per Capita Income in Litchfield borough is $67,777, while median incomes of families and households are $149,432 and $121,346 respectively.
| Characteristic | Number | Measure |
| Per Capita Income | 1,355 | $67,777 |
| Median Family Income | 319 | $149,432 |
| Mean Family Income | 319 | $208,678 |
| Median Household Income | 522 | $121,346 |
| Mean Household Income | 522 | $160,489 |
| Income Deficit | 319 | $0 |
| Wage / Income Gap (%) | 1,355 | 6.00% |
| Wage / Income Gap ($) | 1,355 | 94.00¢ per $1 |
| Gini / Inequality Index | 1,355 | 0.48 |
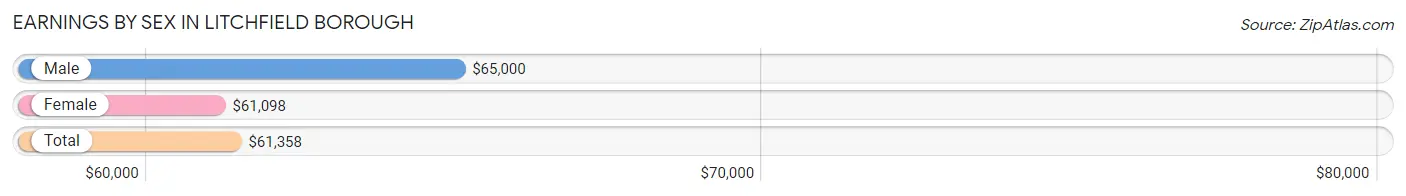
Earnings by Sex in Litchfield borough
Average Earnings in Litchfield borough are $61,358, $65,000 for men and $61,098 for women, a difference of 6.0%.
| Sex | Number | Average Earnings |
| Male | 374 (49.2%) | $65,000 |
| Female | 386 (50.8%) | $61,098 |
| Total | 760 (100.0%) | $61,358 |
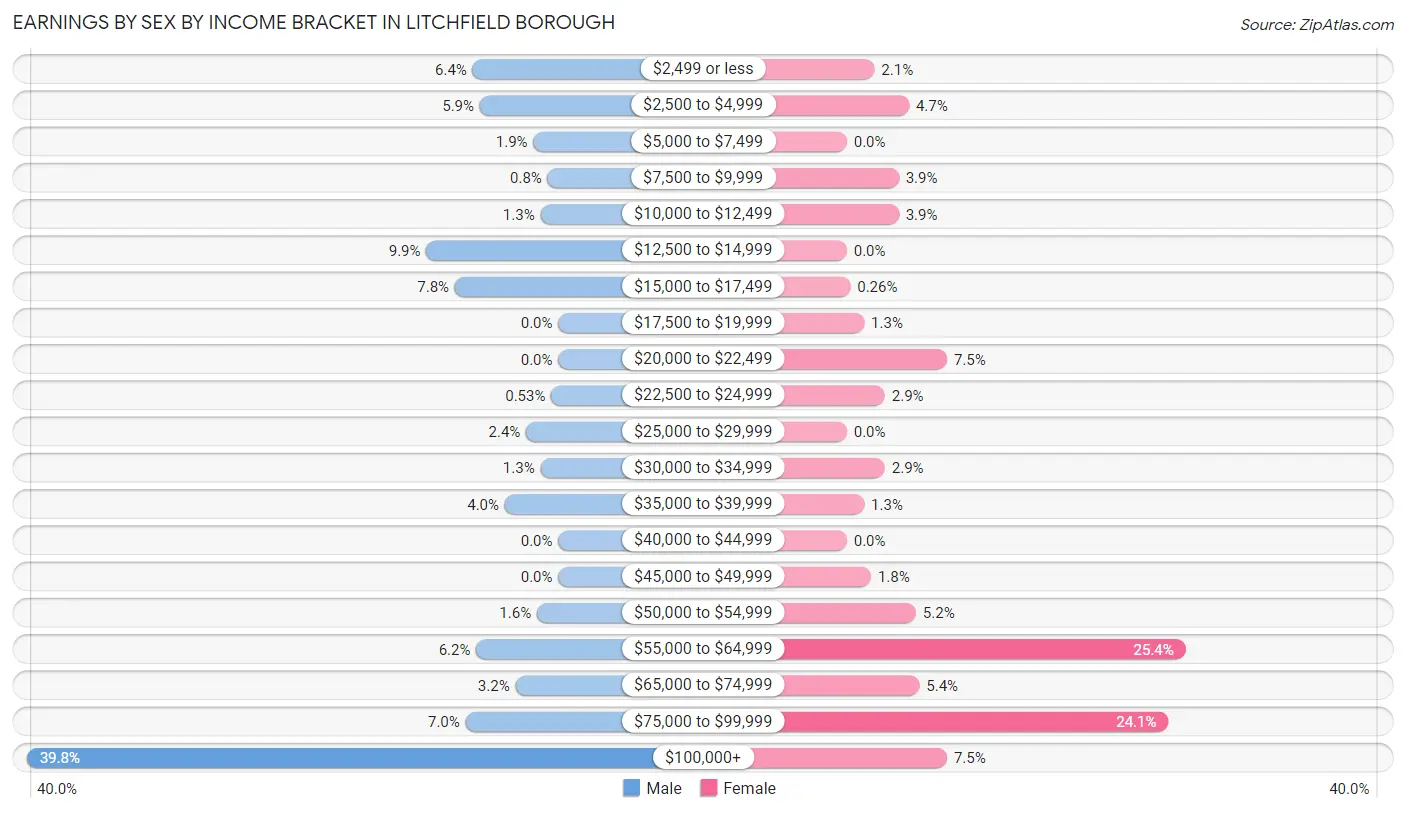
Earnings by Sex by Income Bracket in Litchfield borough
The most common earnings brackets in Litchfield borough are $100,000+ for men (149 | 39.8%) and $55,000 to $64,999 for women (98 | 25.4%).
| Income | Male | Female |
| $2,499 or less | 24 (6.4%) | 8 (2.1%) |
| $2,500 to $4,999 | 22 (5.9%) | 18 (4.7%) |
| $5,000 to $7,499 | 7 (1.9%) | 0 (0.0%) |
| $7,500 to $9,999 | 3 (0.8%) | 15 (3.9%) |
| $10,000 to $12,499 | 5 (1.3%) | 15 (3.9%) |
| $12,500 to $14,999 | 37 (9.9%) | 0 (0.0%) |
| $15,000 to $17,499 | 29 (7.7%) | 1 (0.3%) |
| $17,500 to $19,999 | 0 (0.0%) | 5 (1.3%) |
| $20,000 to $22,499 | 0 (0.0%) | 29 (7.5%) |
| $22,500 to $24,999 | 2 (0.5%) | 11 (2.9%) |
| $25,000 to $29,999 | 9 (2.4%) | 0 (0.0%) |
| $30,000 to $34,999 | 5 (1.3%) | 11 (2.9%) |
| $35,000 to $39,999 | 15 (4.0%) | 5 (1.3%) |
| $40,000 to $44,999 | 0 (0.0%) | 0 (0.0%) |
| $45,000 to $49,999 | 0 (0.0%) | 7 (1.8%) |
| $50,000 to $54,999 | 6 (1.6%) | 20 (5.2%) |
| $55,000 to $64,999 | 23 (6.1%) | 98 (25.4%) |
| $65,000 to $74,999 | 12 (3.2%) | 21 (5.4%) |
| $75,000 to $99,999 | 26 (7.0%) | 93 (24.1%) |
| $100,000+ | 149 (39.8%) | 29 (7.5%) |
| Total | 374 (100.0%) | 386 (100.0%) |
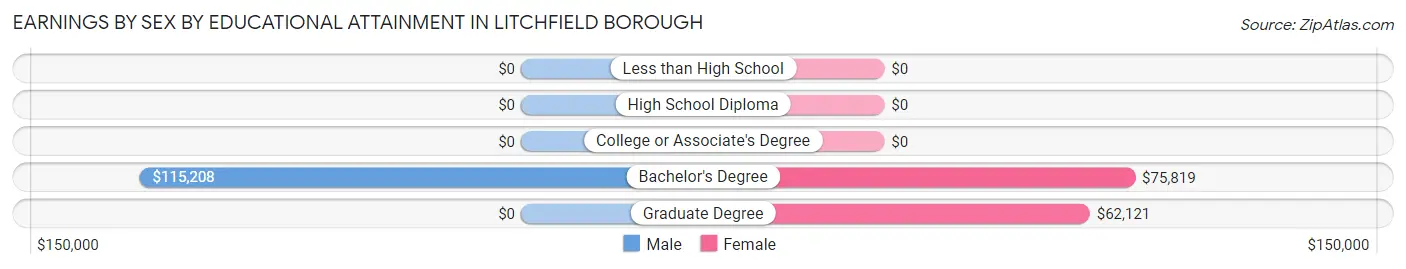
Earnings by Sex by Educational Attainment in Litchfield borough
Average earnings in Litchfield borough are $76,750 for men and $61,572 for women, a difference of 19.8%. Men with an educational attainment of bachelor's degree enjoy the highest average annual earnings of $115,208, while those with bachelor's degree education earn the least with $115,208. Women with an educational attainment of bachelor's degree earn the most with the average annual earnings of $75,819, while those with graduate degree education have the smallest earnings of $62,121.
| Educational Attainment | Male Income | Female Income |
| Less than High School | - | - |
| High School Diploma | - | - |
| College or Associate's Degree | - | - |
| Bachelor's Degree | $115,208 | $75,819 |
| Graduate Degree | - | - |
| Total | $76,750 | $61,572 |
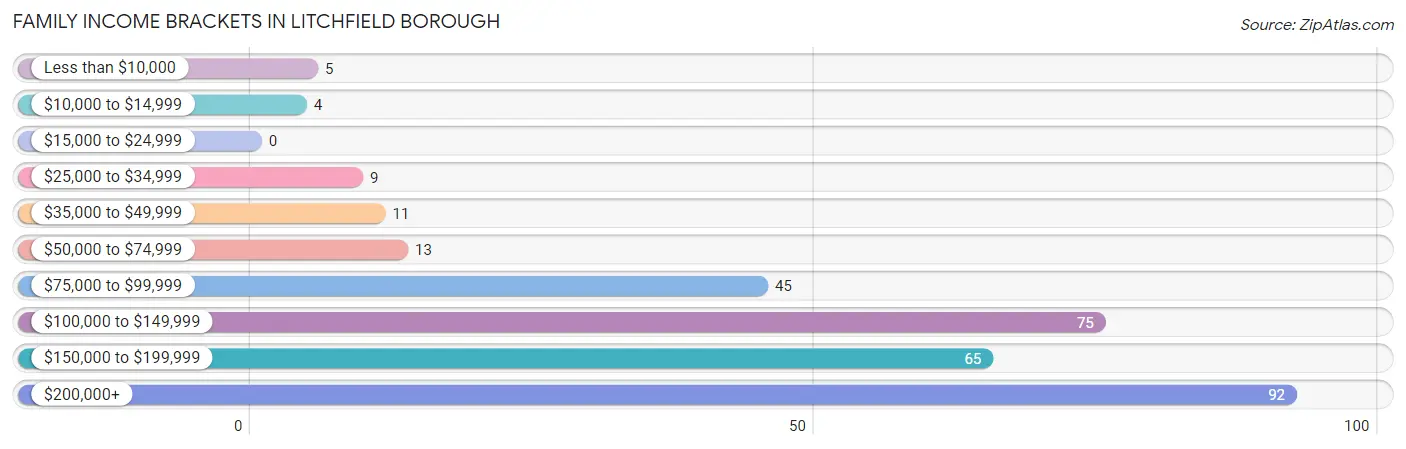
Family Income in Litchfield borough
Family Income Brackets in Litchfield borough
According to the Litchfield borough family income data, there are 92 families falling into the $200,000+ income range, which is the most common income bracket and makes up 28.8% of all families.
| Income Bracket | # Families | % Families |
| Less than $10,000 | 5 | 1.6% |
| $10,000 to $14,999 | 4 | 1.3% |
| $15,000 to $24,999 | 0 | 0.0% |
| $25,000 to $34,999 | 9 | 2.8% |
| $35,000 to $49,999 | 11 | 3.4% |
| $50,000 to $74,999 | 13 | 4.1% |
| $75,000 to $99,999 | 45 | 14.1% |
| $100,000 to $149,999 | 75 | 23.5% |
| $150,000 to $199,999 | 65 | 20.4% |
| $200,000+ | 92 | 28.8% |
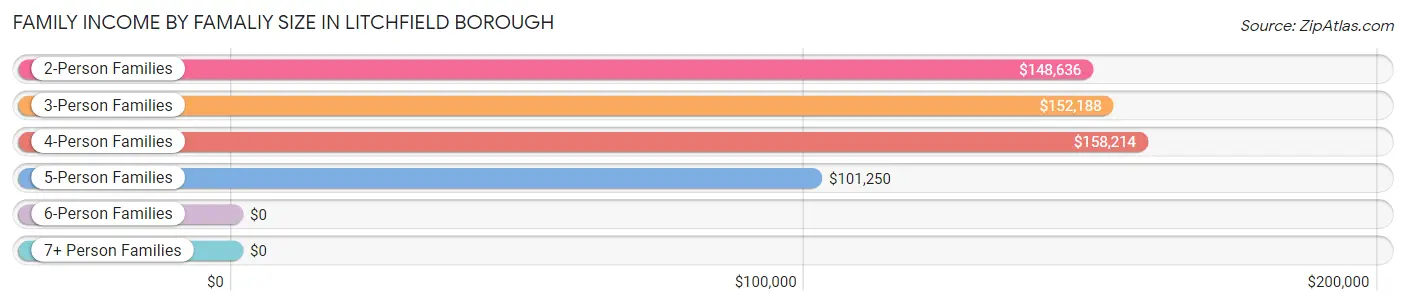
Family Income by Famaliy Size in Litchfield borough
4-person families (42 | 13.2%) account for the highest median family income in Litchfield borough with $158,214 per family, while 2-person families (130 | 40.7%) have the highest median income of $74,318 per family member.
| Income Bracket | # Families | Median Income |
| 2-Person Families | 130 (40.7%) | $148,636 |
| 3-Person Families | 103 (32.3%) | $152,188 |
| 4-Person Families | 42 (13.2%) | $158,214 |
| 5-Person Families | 35 (11.0%) | $101,250 |
| 6-Person Families | 9 (2.8%) | $0 |
| 7+ Person Families | 0 (0.0%) | $0 |
| Total | 319 (100.0%) | $149,432 |
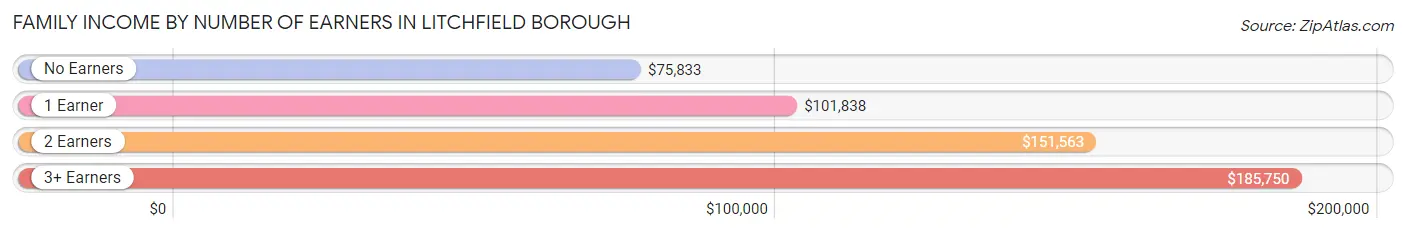
Family Income by Number of Earners in Litchfield borough
The median family income in Litchfield borough is $149,432, with families comprising 3+ earners (31) having the highest median family income of $185,750, while families with no earners (32) have the lowest median family income of $75,833, accounting for 9.7% and 10.0% of families, respectively.
| Number of Earners | # Families | Median Income |
| No Earners | 32 (10.0%) | $75,833 |
| 1 Earner | 97 (30.4%) | $101,838 |
| 2 Earners | 159 (49.8%) | $151,563 |
| 3+ Earners | 31 (9.7%) | $185,750 |
| Total | 319 (100.0%) | $149,432 |
Household Income in Litchfield borough
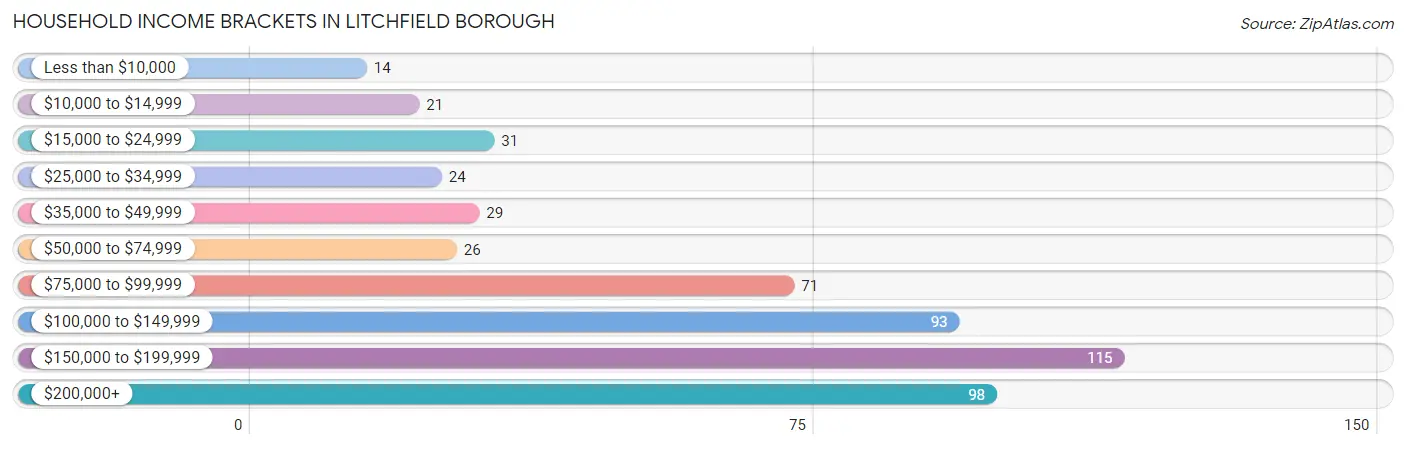
Household Income Brackets in Litchfield borough
With 115 households falling in the category, the $150,000 to $199,999 income range is the most frequent in Litchfield borough, accounting for 22.0% of all households. In contrast, only 14 households (2.7%) fall into the less than $10,000 income bracket, making it the least populous group.
| Income Bracket | # Households | % Households |
| Less than $10,000 | 14 | 2.7% |
| $10,000 to $14,999 | 21 | 4.0% |
| $15,000 to $24,999 | 31 | 5.9% |
| $25,000 to $34,999 | 24 | 4.6% |
| $35,000 to $49,999 | 29 | 5.6% |
| $50,000 to $74,999 | 26 | 5.0% |
| $75,000 to $99,999 | 71 | 13.6% |
| $100,000 to $149,999 | 93 | 17.8% |
| $150,000 to $199,999 | 115 | 22.0% |
| $200,000+ | 98 | 18.8% |
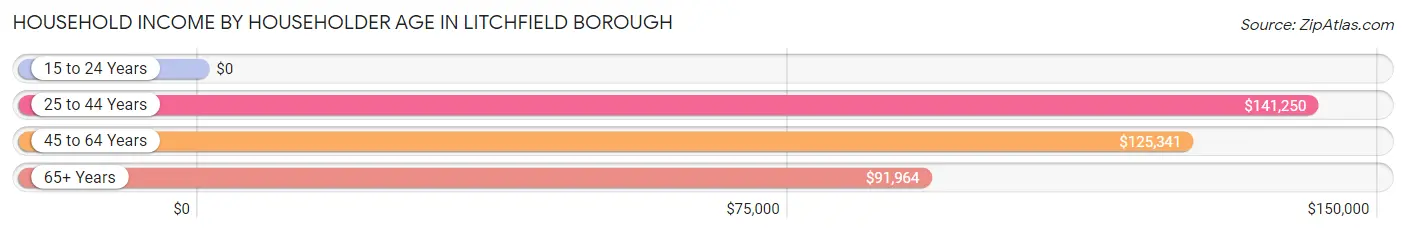
Household Income by Householder Age in Litchfield borough
The median household income in Litchfield borough is $121,346, with the highest median household income of $141,250 found in the 25 to 44 years age bracket for the primary householder. A total of 94 households (18.0%) fall into this category.
| Income Bracket | # Households | Median Income |
| 15 to 24 Years | 0 (0.0%) | $0 |
| 25 to 44 Years | 94 (18.0%) | $141,250 |
| 45 to 64 Years | 193 (37.0%) | $125,341 |
| 65+ Years | 235 (45.0%) | $91,964 |
| Total | 522 (100.0%) | $121,346 |
Poverty in Litchfield borough
Income Below Poverty by Sex and Age in Litchfield borough
With 5.3% poverty level for males and 6.3% for females among the residents of Litchfield borough, 35 to 44 year old males and 16 and 17 year old females are the most vulnerable to poverty, with 17 males (23.9%) and 6 females (37.5%) in their respective age groups living below the poverty level.

| Age Bracket | Male | Female |
| Under 5 Years | 6 (20.7%) | 3 (8.1%) |
| 5 Years | 0 (0.0%) | 0 (0.0%) |
| 6 to 11 Years | 0 (0.0%) | 5 (22.7%) |
| 12 to 14 Years | 0 (0.0%) | 0 (0.0%) |
| 15 Years | 0 (0.0%) | 0 (0.0%) |
| 16 and 17 Years | 0 (0.0%) | 6 (37.5%) |
| 18 to 24 Years | 0 (0.0%) | 0 (0.0%) |
| 25 to 34 Years | 0 (0.0%) | 4 (2.9%) |
| 35 to 44 Years | 17 (23.9%) | 8 (13.3%) |
| 45 to 54 Years | 5 (7.6%) | 0 (0.0%) |
| 55 to 64 Years | 0 (0.0%) | 0 (0.0%) |
| 65 to 74 Years | 0 (0.0%) | 10 (11.2%) |
| 75 Years and over | 7 (9.6%) | 6 (7.7%) |
| Total | 35 (5.3%) | 42 (6.3%) |
Income Above Poverty by Sex and Age in Litchfield borough
According to the poverty statistics in Litchfield borough, males aged 5 years and females aged 5 years are the age groups that are most secure financially, with 100.0% of males and 100.0% of females in these age groups living above the poverty line.
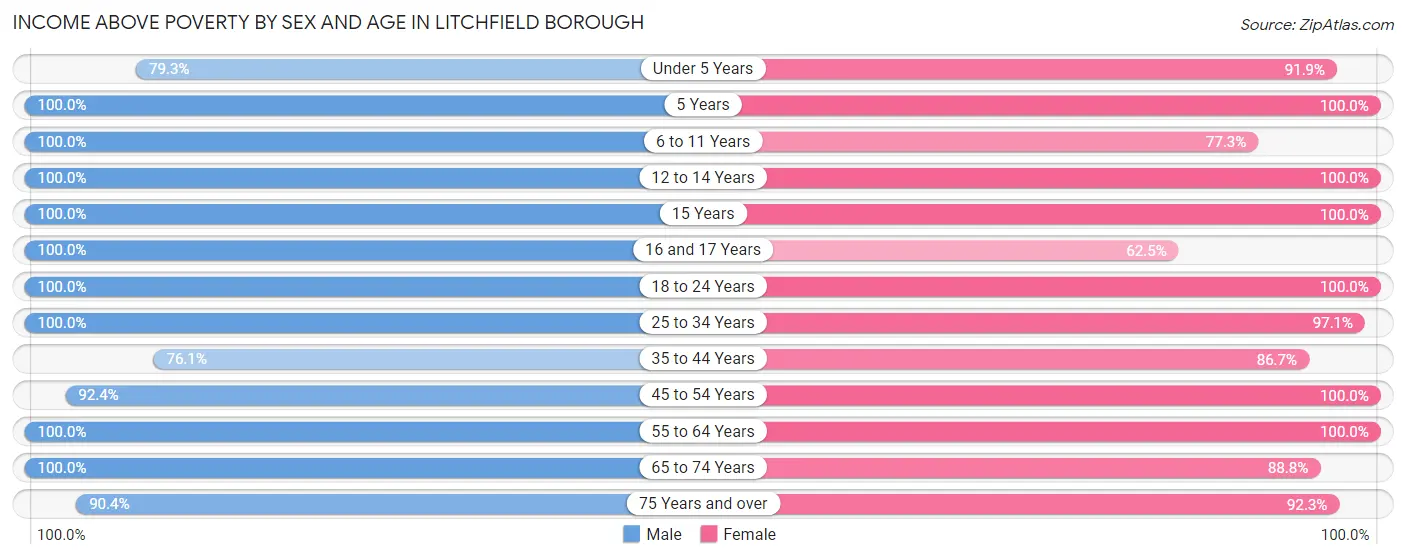
| Age Bracket | Male | Female |
| Under 5 Years | 23 (79.3%) | 34 (91.9%) |
| 5 Years | 15 (100.0%) | 6 (100.0%) |
| 6 to 11 Years | 45 (100.0%) | 17 (77.3%) |
| 12 to 14 Years | 24 (100.0%) | 15 (100.0%) |
| 15 Years | 23 (100.0%) | 5 (100.0%) |
| 16 and 17 Years | 34 (100.0%) | 10 (62.5%) |
| 18 to 24 Years | 73 (100.0%) | 15 (100.0%) |
| 25 to 34 Years | 42 (100.0%) | 133 (97.1%) |
| 35 to 44 Years | 54 (76.1%) | 52 (86.7%) |
| 45 to 54 Years | 61 (92.4%) | 77 (100.0%) |
| 55 to 64 Years | 61 (100.0%) | 105 (100.0%) |
| 65 to 74 Years | 99 (100.0%) | 79 (88.8%) |
| 75 Years and over | 66 (90.4%) | 72 (92.3%) |
| Total | 620 (94.7%) | 620 (93.7%) |
Income Below Poverty Among Married-Couple Families in Litchfield borough
The poverty statistics for married-couple families in Litchfield borough show that 1.8% or 5 of the total 273 families live below the poverty line. Families with 3 or 4 children have the highest poverty rate of 12.5%, comprising of 5 families. On the other hand, families with no children have the lowest poverty rate of 0.0%, which includes 0 families.
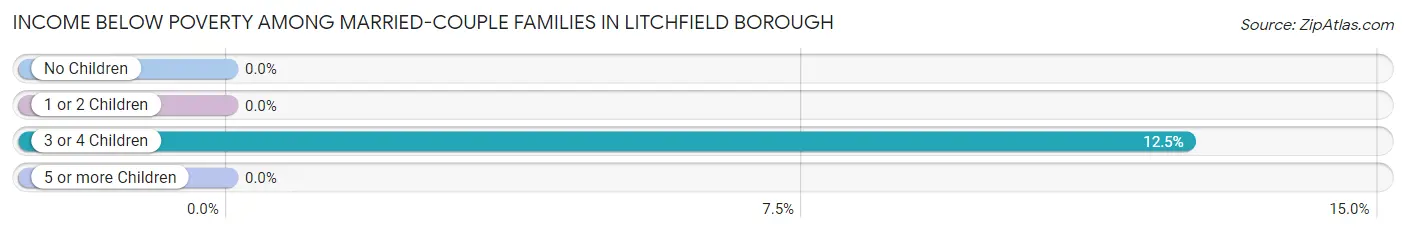
| Children | Above Poverty | Below Poverty |
| No Children | 149 (100.0%) | 0 (0.0%) |
| 1 or 2 Children | 84 (100.0%) | 0 (0.0%) |
| 3 or 4 Children | 35 (87.5%) | 5 (12.5%) |
| 5 or more Children | 0 (0.0%) | 0 (0.0%) |
| Total | 268 (98.2%) | 5 (1.8%) |
Income Below Poverty Among Single-Parent Households in Litchfield borough
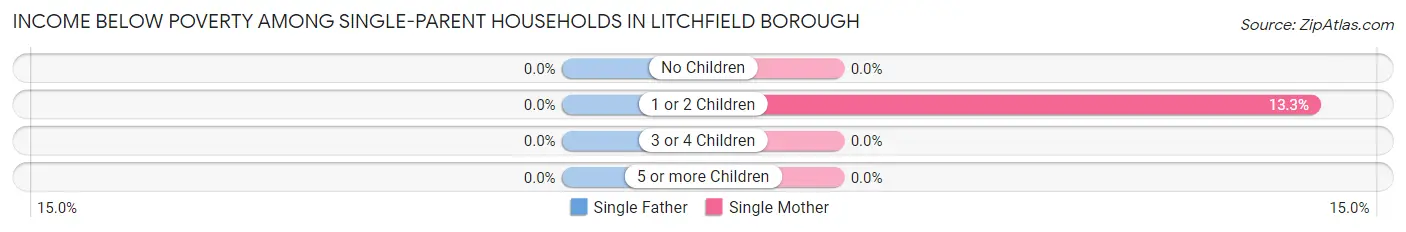
| Children | Single Father | Single Mother |
| No Children | 0 (0.0%) | 0 (0.0%) |
| 1 or 2 Children | 0 (0.0%) | 4 (13.3%) |
| 3 or 4 Children | 0 (0.0%) | 0 (0.0%) |
| 5 or more Children | 0 (0.0%) | 0 (0.0%) |
| Total | 0 (0.0%) | 4 (9.1%) |
Income Below Poverty Among Married-Couple vs Single-Parent Households in Litchfield borough
The poverty data for Litchfield borough shows that 5 of the married-couple family households (1.8%) and 4 of the single-parent households (8.7%) are living below the poverty level. Within the married-couple family households, those with 3 or 4 children have the highest poverty rate, with 5 households (12.5%) falling below the poverty line. Among the single-parent households, those with 1 or 2 children have the highest poverty rate, with 4 household (13.3%) living below poverty.
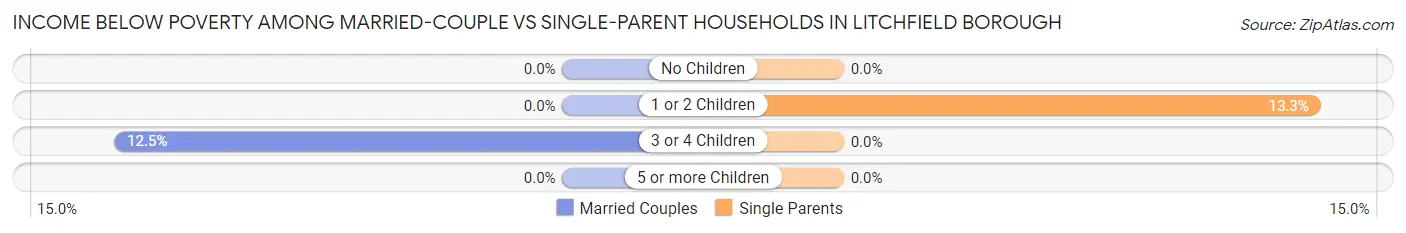
| Children | Married-Couple Families | Single-Parent Households |
| No Children | 0 (0.0%) | 0 (0.0%) |
| 1 or 2 Children | 0 (0.0%) | 4 (13.3%) |
| 3 or 4 Children | 5 (12.5%) | 0 (0.0%) |
| 5 or more Children | 0 (0.0%) | 0 (0.0%) |
| Total | 5 (1.8%) | 4 (8.7%) |
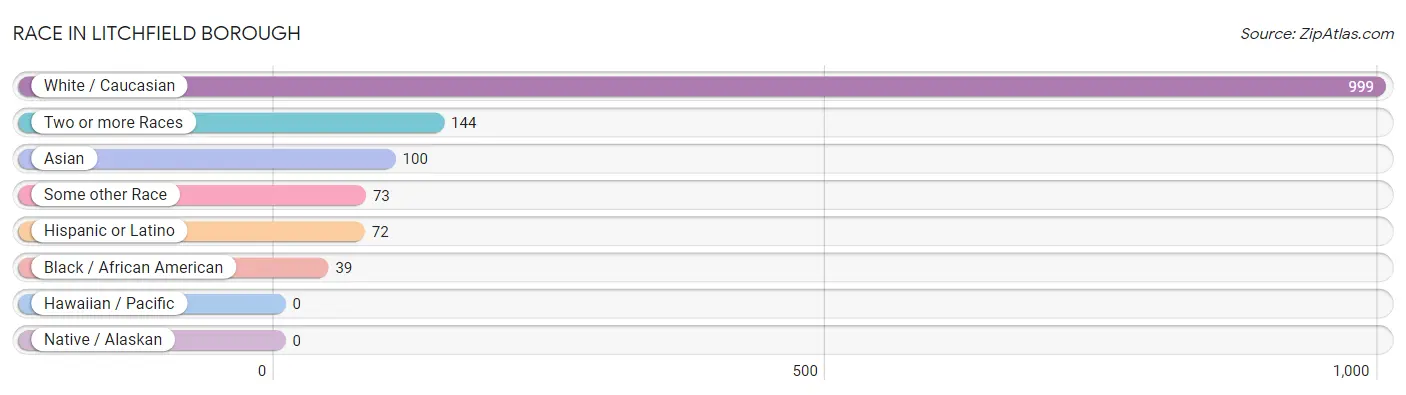
Race in Litchfield borough
The most populous races in Litchfield borough are White / Caucasian (999 | 73.7%), Two or more Races (144 | 10.6%), and Asian (100 | 7.4%).
| Race | # Population | % Population |
| Asian | 100 | 7.4% |
| Black / African American | 39 | 2.9% |
| Hawaiian / Pacific | 0 | 0.0% |
| Hispanic or Latino | 72 | 5.3% |
| Native / Alaskan | 0 | 0.0% |
| White / Caucasian | 999 | 73.7% |
| Two or more Races | 144 | 10.6% |
| Some other Race | 73 | 5.4% |
| Total | 1,355 | 100.0% |
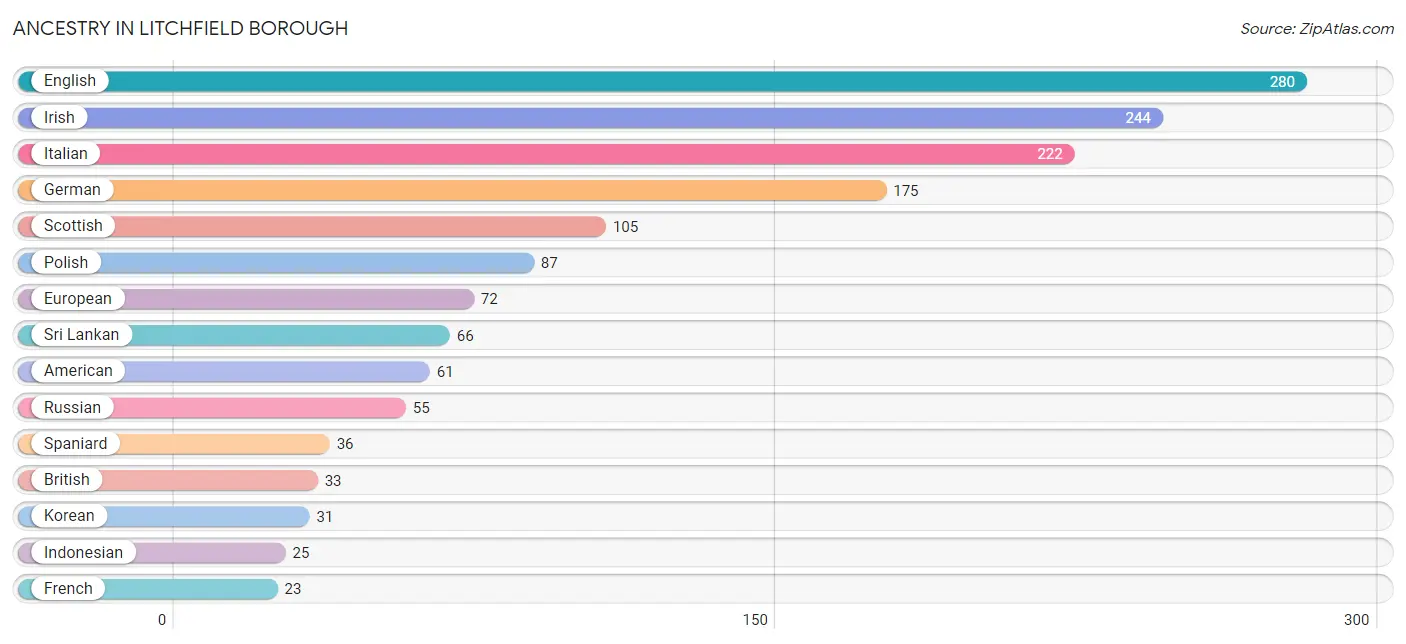
Ancestry in Litchfield borough
The most populous ancestries reported in Litchfield borough are English (280 | 20.7%), Irish (244 | 18.0%), Italian (222 | 16.4%), German (175 | 12.9%), and Scottish (105 | 7.7%), together accounting for 75.7% of all Litchfield borough residents.
| Ancestry | # Population | % Population |
| African | 17 | 1.3% |
| American | 61 | 4.5% |
| Argentinean | 7 | 0.5% |
| Australian | 5 | 0.4% |
| Austrian | 4 | 0.3% |
| Bhutanese | 6 | 0.4% |
| British | 33 | 2.4% |
| Canadian | 6 | 0.4% |
| Central American | 7 | 0.5% |
| Czech | 1 | 0.1% |
| Czechoslovakian | 6 | 0.4% |
| Dutch | 9 | 0.7% |
| Eastern European | 8 | 0.6% |
| English | 280 | 20.7% |
| European | 72 | 5.3% |
| Filipino | 5 | 0.4% |
| French | 23 | 1.7% |
| French Canadian | 9 | 0.7% |
| German | 175 | 12.9% |
| Greek | 3 | 0.2% |
| Guatemalan | 7 | 0.5% |
| Hungarian | 6 | 0.4% |
| Indian (Asian) | 15 | 1.1% |
| Indonesian | 25 | 1.8% |
| Irish | 244 | 18.0% |
| Italian | 222 | 16.4% |
| Korean | 31 | 2.3% |
| Mexican | 21 | 1.5% |
| Norwegian | 18 | 1.3% |
| Polish | 87 | 6.4% |
| Portuguese | 3 | 0.2% |
| Puerto Rican | 1 | 0.1% |
| Russian | 55 | 4.1% |
| Scandinavian | 8 | 0.6% |
| Scottish | 105 | 7.7% |
| Slavic | 2 | 0.2% |
| Slovak | 5 | 0.4% |
| Slovene | 2 | 0.2% |
| South American | 7 | 0.5% |
| Spaniard | 36 | 2.7% |
| Sri Lankan | 66 | 4.9% |
| Subsaharan African | 17 | 1.3% |
| Swedish | 16 | 1.2% |
| Thai | 12 | 0.9% |
| Welsh | 6 | 0.4% | View All 45 Rows |
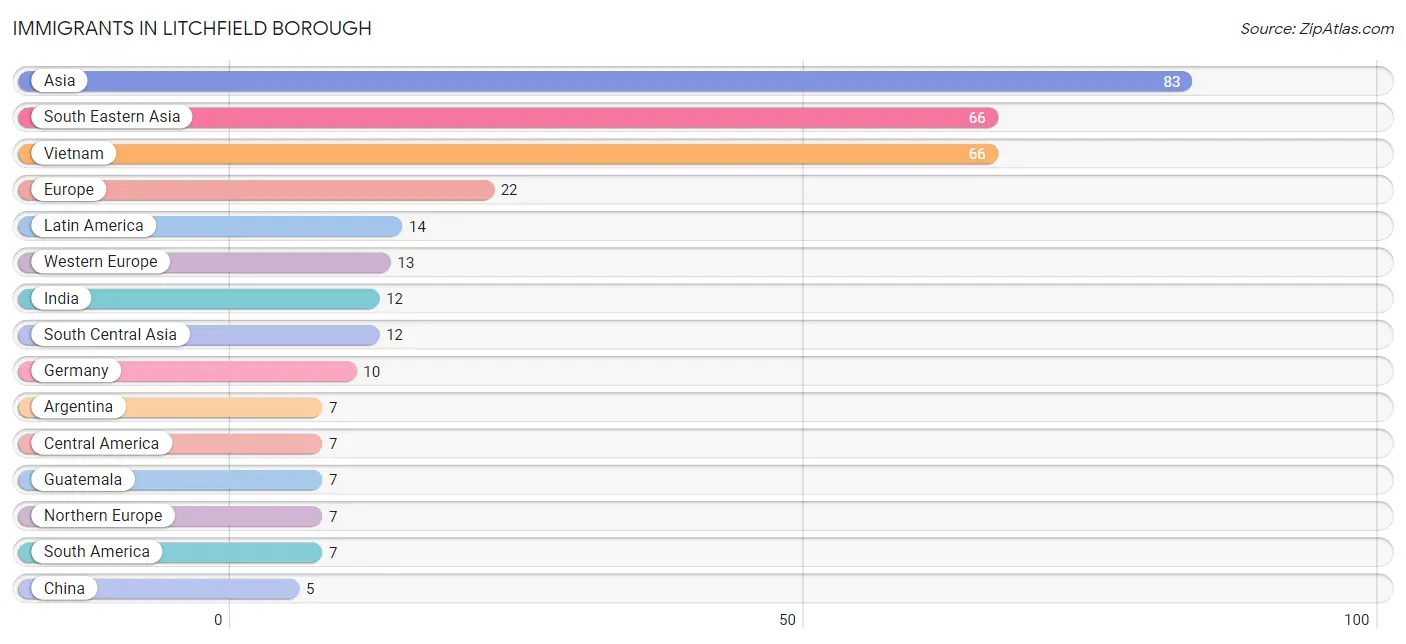
Immigrants in Litchfield borough
The most numerous immigrant groups reported in Litchfield borough came from Asia (83 | 6.1%), South Eastern Asia (66 | 4.9%), Vietnam (66 | 4.9%), Europe (22 | 1.6%), and Latin America (14 | 1.0%), together accounting for 18.5% of all Litchfield borough residents.
| Immigration Origin | # Population | % Population |
| Argentina | 7 | 0.5% |
| Asia | 83 | 6.1% |
| Austria | 3 | 0.2% |
| Central America | 7 | 0.5% |
| China | 5 | 0.4% |
| Eastern Asia | 5 | 0.4% |
| England | 3 | 0.2% |
| Europe | 22 | 1.6% |
| Germany | 10 | 0.7% |
| Greece | 2 | 0.2% |
| Guatemala | 7 | 0.5% |
| India | 12 | 0.9% |
| Latin America | 14 | 1.0% |
| Northern Europe | 7 | 0.5% |
| South America | 7 | 0.5% |
| South Central Asia | 12 | 0.9% |
| South Eastern Asia | 66 | 4.9% |
| Southern Europe | 2 | 0.2% |
| Taiwan | 5 | 0.4% |
| Vietnam | 66 | 4.9% |
| Western Europe | 13 | 1.0% | View All 21 Rows |
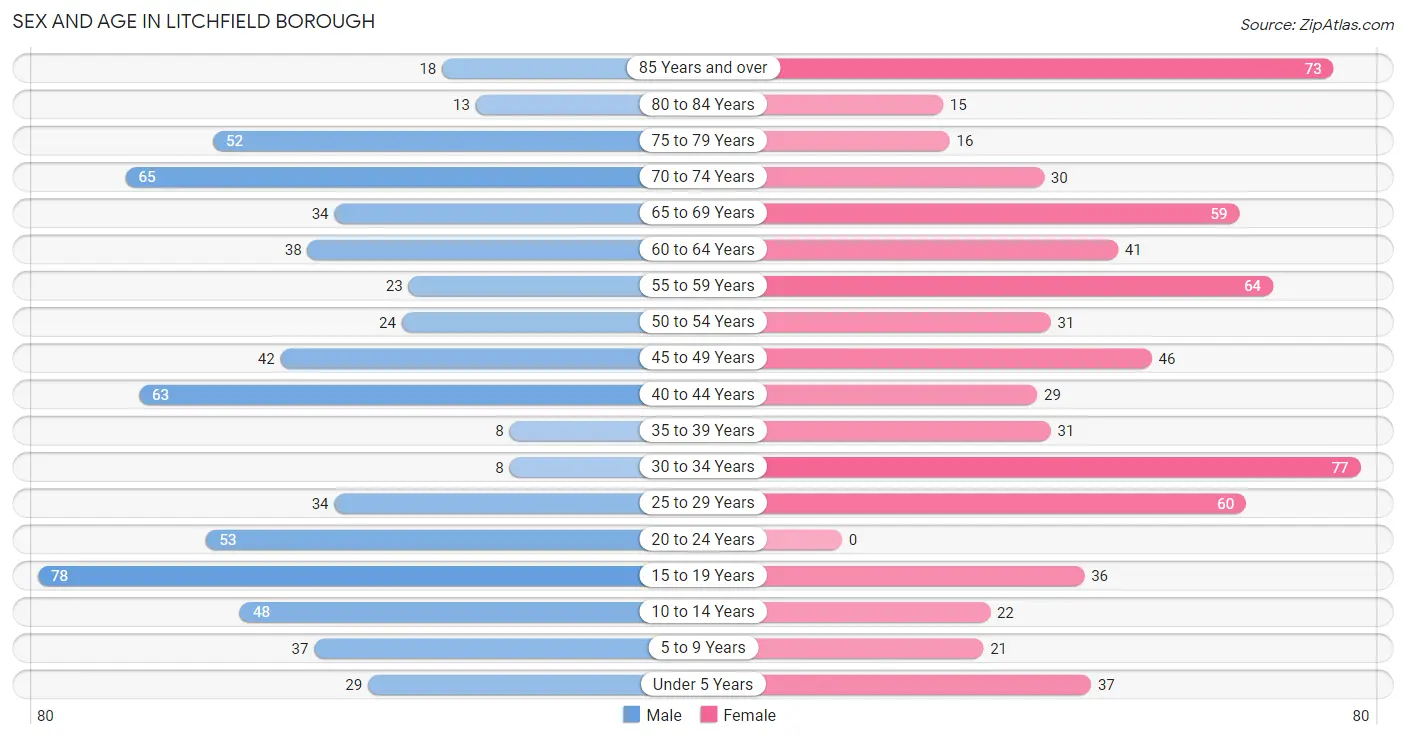
Sex and Age in Litchfield borough
Sex and Age in Litchfield borough
The most populous age groups in Litchfield borough are 15 to 19 Years (78 | 11.7%) for men and 30 to 34 Years (77 | 11.2%) for women.
| Age Bracket | Male | Female |
| Under 5 Years | 29 (4.3%) | 37 (5.4%) |
| 5 to 9 Years | 37 (5.6%) | 21 (3.0%) |
| 10 to 14 Years | 48 (7.2%) | 22 (3.2%) |
| 15 to 19 Years | 78 (11.7%) | 36 (5.2%) |
| 20 to 24 Years | 53 (8.0%) | 0 (0.0%) |
| 25 to 29 Years | 34 (5.1%) | 60 (8.7%) |
| 30 to 34 Years | 8 (1.2%) | 77 (11.2%) |
| 35 to 39 Years | 8 (1.2%) | 31 (4.5%) |
| 40 to 44 Years | 63 (9.5%) | 29 (4.2%) |
| 45 to 49 Years | 42 (6.3%) | 46 (6.7%) |
| 50 to 54 Years | 24 (3.6%) | 31 (4.5%) |
| 55 to 59 Years | 23 (3.5%) | 64 (9.3%) |
| 60 to 64 Years | 38 (5.7%) | 41 (6.0%) |
| 65 to 69 Years | 34 (5.1%) | 59 (8.6%) |
| 70 to 74 Years | 65 (9.8%) | 30 (4.4%) |
| 75 to 79 Years | 52 (7.8%) | 16 (2.3%) |
| 80 to 84 Years | 13 (1.9%) | 15 (2.2%) |
| 85 Years and over | 18 (2.7%) | 73 (10.6%) |
| Total | 667 (100.0%) | 688 (100.0%) |
Families and Households in Litchfield borough
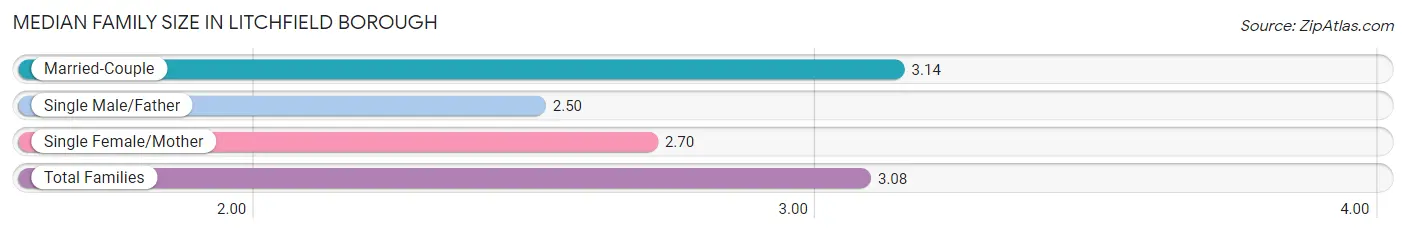
Median Family Size in Litchfield borough
The median family size in Litchfield borough is 3.08 persons per family, with married-couple families (273 | 85.6%) accounting for the largest median family size of 3.14 persons per family. On the other hand, single male/father families (2 | 0.6%) represent the smallest median family size with 2.50 persons per family.
| Family Type | # Families | Family Size |
| Married-Couple | 273 (85.6%) | 3.14 |
| Single Male/Father | 2 (0.6%) | 2.50 |
| Single Female/Mother | 44 (13.8%) | 2.70 |
| Total Families | 319 (100.0%) | 3.08 |
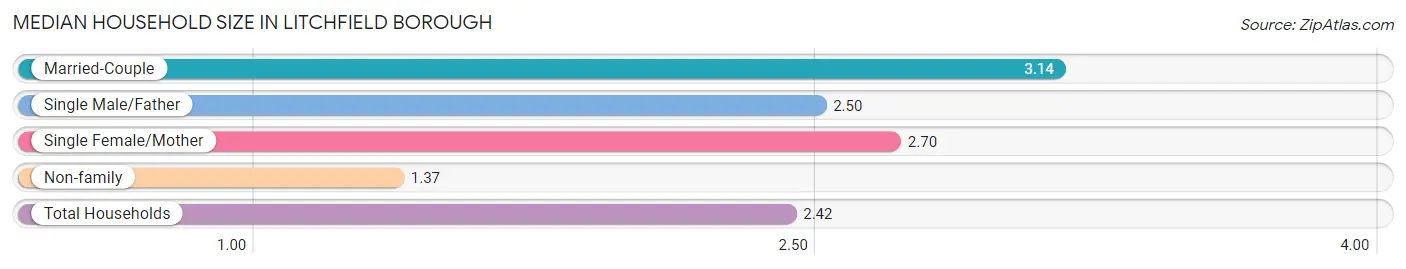
Median Household Size in Litchfield borough
The median household size in Litchfield borough is 2.42 persons per household, with married-couple households (273 | 52.3%) accounting for the largest median household size of 3.14 persons per household. non-family households (203 | 38.9%) represent the smallest median household size with 1.37 persons per household.
| Household Type | # Households | Household Size |
| Married-Couple | 273 (52.3%) | 3.14 |
| Single Male/Father | 2 (0.4%) | 2.50 |
| Single Female/Mother | 44 (8.4%) | 2.70 |
| Non-family | 203 (38.9%) | 1.37 |
| Total Households | 522 (100.0%) | 2.42 |
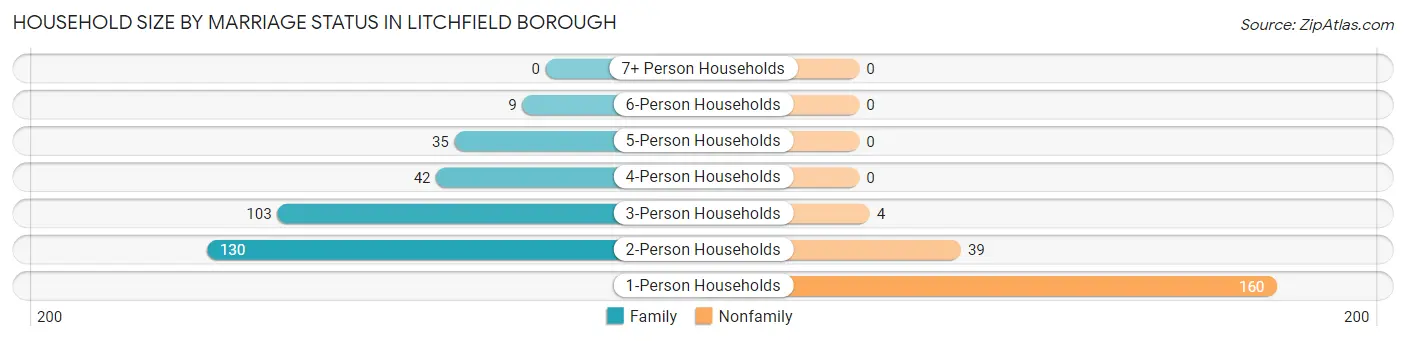
Household Size by Marriage Status in Litchfield borough
Out of a total of 522 households in Litchfield borough, 319 (61.1%) are family households, while 203 (38.9%) are nonfamily households. The most numerous type of family households are 2-person households, comprising 130, and the most common type of nonfamily households are 1-person households, comprising 160.
| Household Size | Family Households | Nonfamily Households |
| 1-Person Households | - | 160 (30.6%) |
| 2-Person Households | 130 (24.9%) | 39 (7.5%) |
| 3-Person Households | 103 (19.7%) | 4 (0.8%) |
| 4-Person Households | 42 (8.1%) | 0 (0.0%) |
| 5-Person Households | 35 (6.7%) | 0 (0.0%) |
| 6-Person Households | 9 (1.7%) | 0 (0.0%) |
| 7+ Person Households | 0 (0.0%) | 0 (0.0%) |
| Total | 319 (61.1%) | 203 (38.9%) |
Female Fertility in Litchfield borough
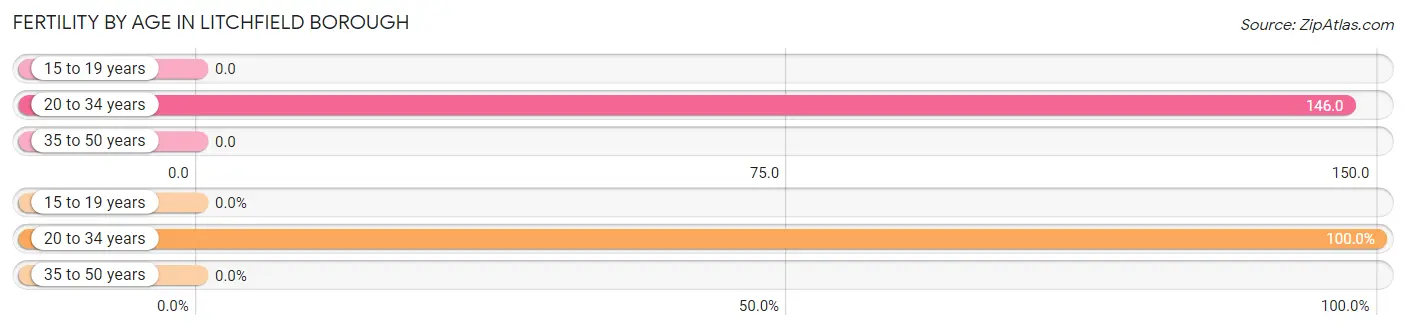
Fertility by Age in Litchfield borough
Average fertility rate in Litchfield borough is 72.0 births per 1,000 women. Women in the age bracket of 20 to 34 years have the highest fertility rate with 146.0 births per 1,000 women. Women in the age bracket of 20 to 34 years acount for 100.0% of all women with births.
| Age Bracket | Women with Births | Births / 1,000 Women |
| 15 to 19 years | 0 (0.0%) | 0.0 |
| 20 to 34 years | 20 (100.0%) | 146.0 |
| 35 to 50 years | 0 (0.0%) | 0.0 |
| Total | 20 (100.0%) | 72.0 |
Fertility by Age by Marriage Status in Litchfield borough
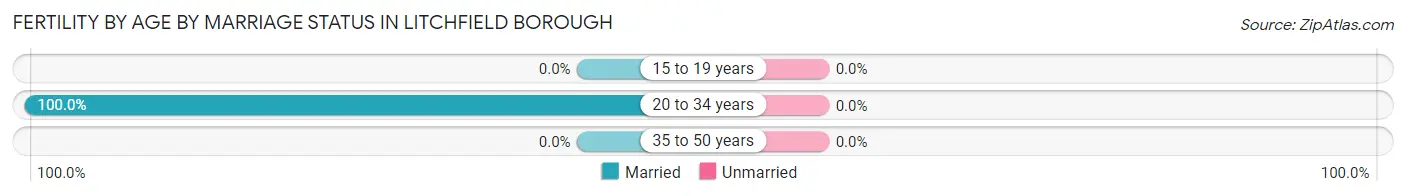
| Age Bracket | Married | Unmarried |
| 15 to 19 years | 0 (0.0%) | 0 (0.0%) |
| 20 to 34 years | 20 (100.0%) | 0 (0.0%) |
| 35 to 50 years | 0 (0.0%) | 0 (0.0%) |
| Total | 20 (100.0%) | 0 (0.0%) |
Fertility by Education in Litchfield borough
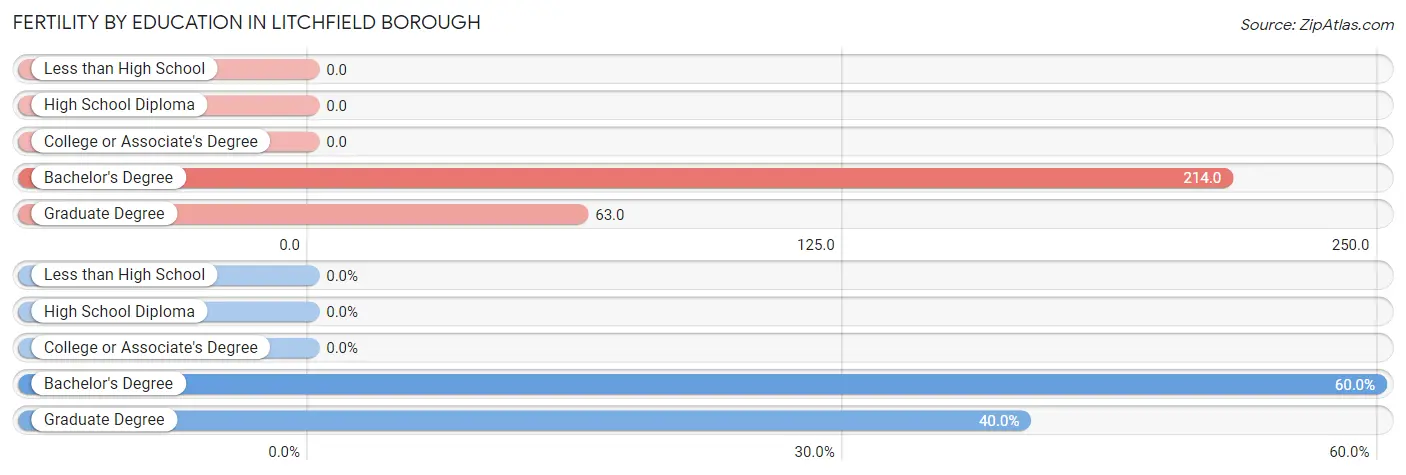
| Educational Attainment | Women with Births | Births / 1,000 Women |
| Less than High School | 0 (0.0%) | 0.0 |
| High School Diploma | 0 (0.0%) | 0.0 |
| College or Associate's Degree | 0 (0.0%) | 0.0 |
| Bachelor's Degree | 12 (60.0%) | 214.0 |
| Graduate Degree | 8 (40.0%) | 63.0 |
| Total | 20 (100.0%) | 72.0 |
Fertility by Education by Marriage Status in Litchfield borough
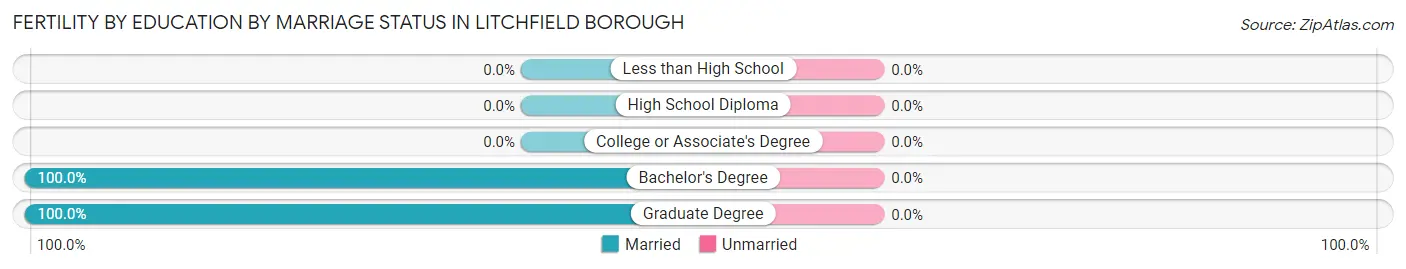
| Educational Attainment | Married | Unmarried |
| Less than High School | 0 (0.0%) | 0 (0.0%) |
| High School Diploma | 0 (0.0%) | 0 (0.0%) |
| College or Associate's Degree | 0 (0.0%) | 0 (0.0%) |
| Bachelor's Degree | 12 (100.0%) | 0 (0.0%) |
| Graduate Degree | 8 (100.0%) | 0 (0.0%) |
| Total | 20 (100.0%) | 0 (0.0%) |
Employment Characteristics in Litchfield borough
Employment by Class of Employer in Litchfield borough
Among the 648 employed individuals in Litchfield borough, private company employees (376 | 58.0%), not-for-profit organizations (92 | 14.2%), and local government employees (68 | 10.5%) make up the most common classes of employment.
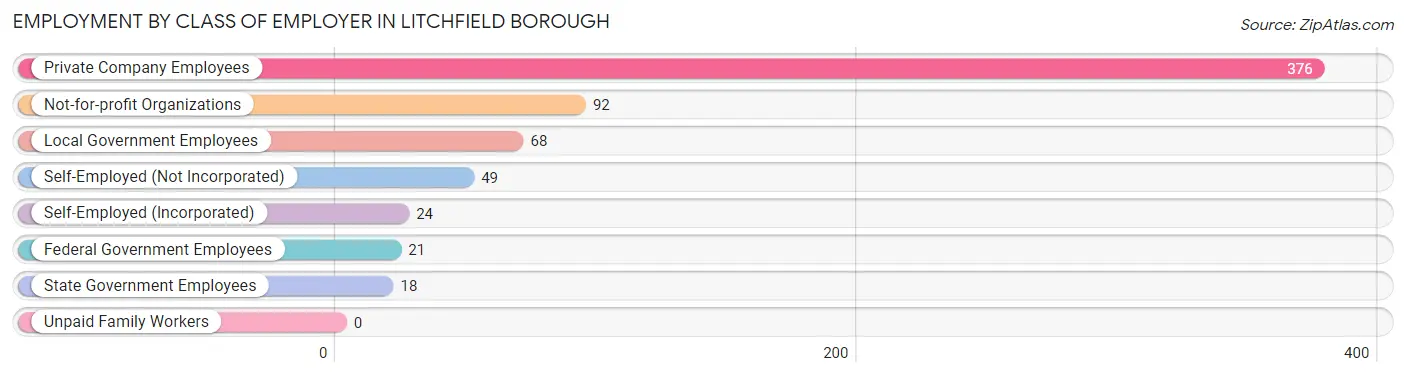
| Employer Class | # Employees | % Employees |
| Private Company Employees | 376 | 58.0% |
| Self-Employed (Incorporated) | 24 | 3.7% |
| Self-Employed (Not Incorporated) | 49 | 7.6% |
| Not-for-profit Organizations | 92 | 14.2% |
| Local Government Employees | 68 | 10.5% |
| State Government Employees | 18 | 2.8% |
| Federal Government Employees | 21 | 3.2% |
| Unpaid Family Workers | 0 | 0.0% |
| Total | 648 | 100.0% |
Employment Status by Age in Litchfield borough
According to the labor force statistics for Litchfield borough, out of the total population over 16 years of age (1,133), 61.1% or 692 individuals are in the labor force, with 4.9% or 34 of them unemployed. The age group with the highest labor force participation rate is 25 to 29 years, with 100.0% or 94 individuals in the labor force. Within the labor force, the 25 to 29 years age range has the highest percentage of unemployed individuals, with 21.3% or 20 of them being unemployed.
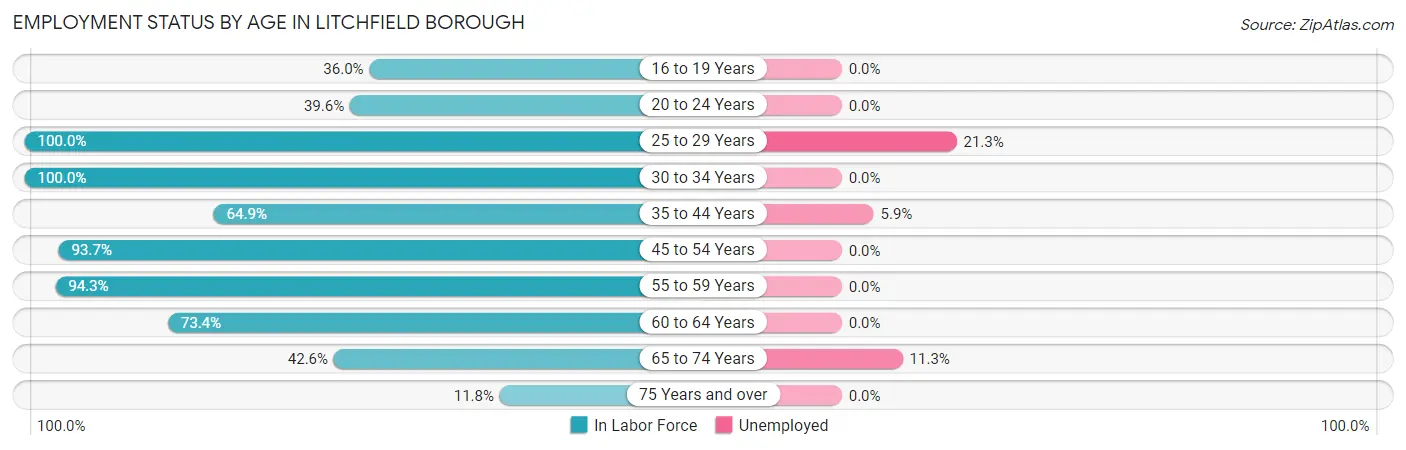
| Age Bracket | In Labor Force | Unemployed |
| 16 to 19 Years | 31 (36.0%) | 0 (0.0%) |
| 20 to 24 Years | 21 (39.6%) | 0 (0.0%) |
| 25 to 29 Years | 94 (100.0%) | 20 (21.3%) |
| 30 to 34 Years | 85 (100.0%) | 0 (0.0%) |
| 35 to 44 Years | 85 (64.9%) | 5 (5.9%) |
| 45 to 54 Years | 134 (93.7%) | 0 (0.0%) |
| 55 to 59 Years | 82 (94.3%) | 0 (0.0%) |
| 60 to 64 Years | 58 (73.4%) | 0 (0.0%) |
| 65 to 74 Years | 80 (42.6%) | 9 (11.3%) |
| 75 Years and over | 22 (11.8%) | 0 (0.0%) |
| Total | 692 (61.1%) | 34 (4.9%) |
Employment Status by Educational Attainment in Litchfield borough
According to labor force statistics for Litchfield borough, 86.9% of individuals (538) out of the total population between 25 and 64 years of age (619) are in the labor force, with 4.6% or 25 of them being unemployed. The group with the highest labor force participation rate are those with the educational attainment of less than high school, with 100.0% or 10 individuals in the labor force. Within the labor force, individuals with college / associate degree education have the highest percentage of unemployment, with 18.3% or 20 of them being unemployed.
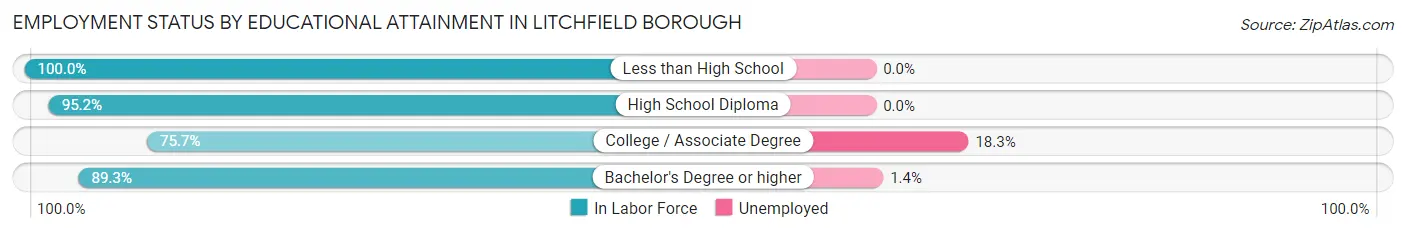
| Educational Attainment | In Labor Force | Unemployed |
| Less than High School | 10 (100.0%) | 0 (0.0%) |
| High School Diploma | 59 (95.2%) | 0 (0.0%) |
| College / Associate Degree | 109 (75.7%) | 26 (18.3%) |
| Bachelor's Degree or higher | 360 (89.3%) | 6 (1.4%) |
| Total | 538 (86.9%) | 28 (4.6%) |
Employment Occupations by Sex in Litchfield borough
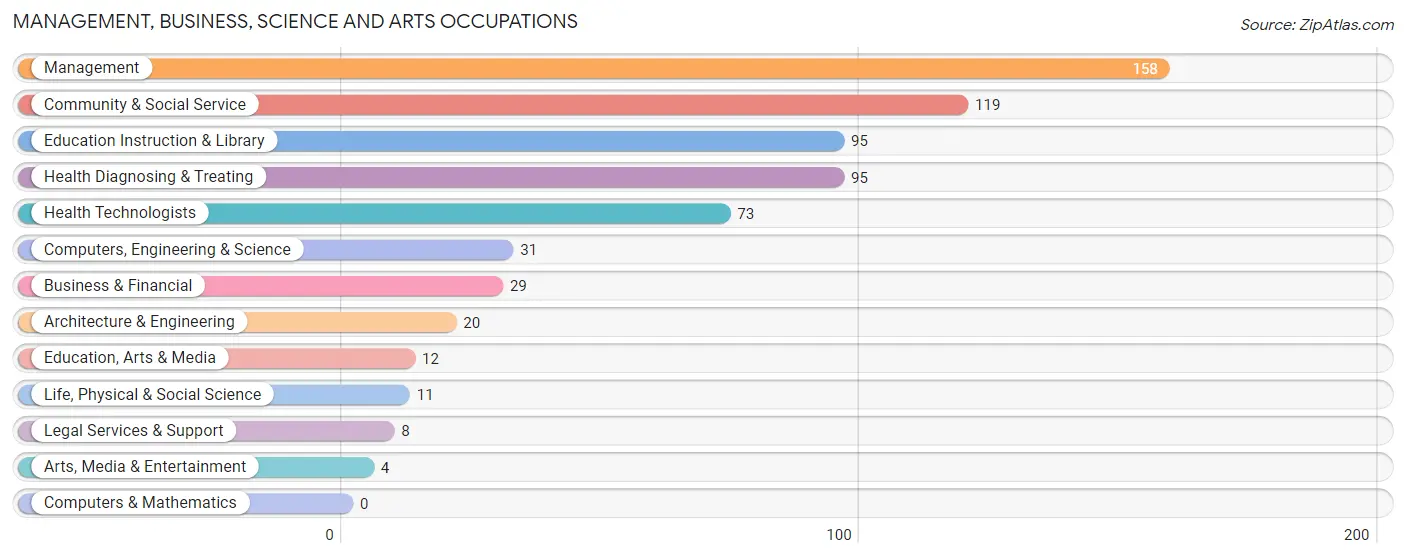
Management, Business, Science and Arts Occupations
The most common Management, Business, Science and Arts occupations in Litchfield borough are Management (158 | 24.0%), Community & Social Service (119 | 18.1%), Education Instruction & Library (95 | 14.4%), Health Diagnosing & Treating (95 | 14.4%), and Health Technologists (73 | 11.1%).
Management, Business, Science and Arts Occupations by Sex
Within the Management, Business, Science and Arts occupations in Litchfield borough, the most male-oriented occupations are Computers, Engineering & Science (100.0%), Architecture & Engineering (100.0%), and Life, Physical & Social Science (100.0%), while the most female-oriented occupations are Education, Arts & Media (75.0%), Business & Financial (65.5%), and Education Instruction & Library (65.3%).
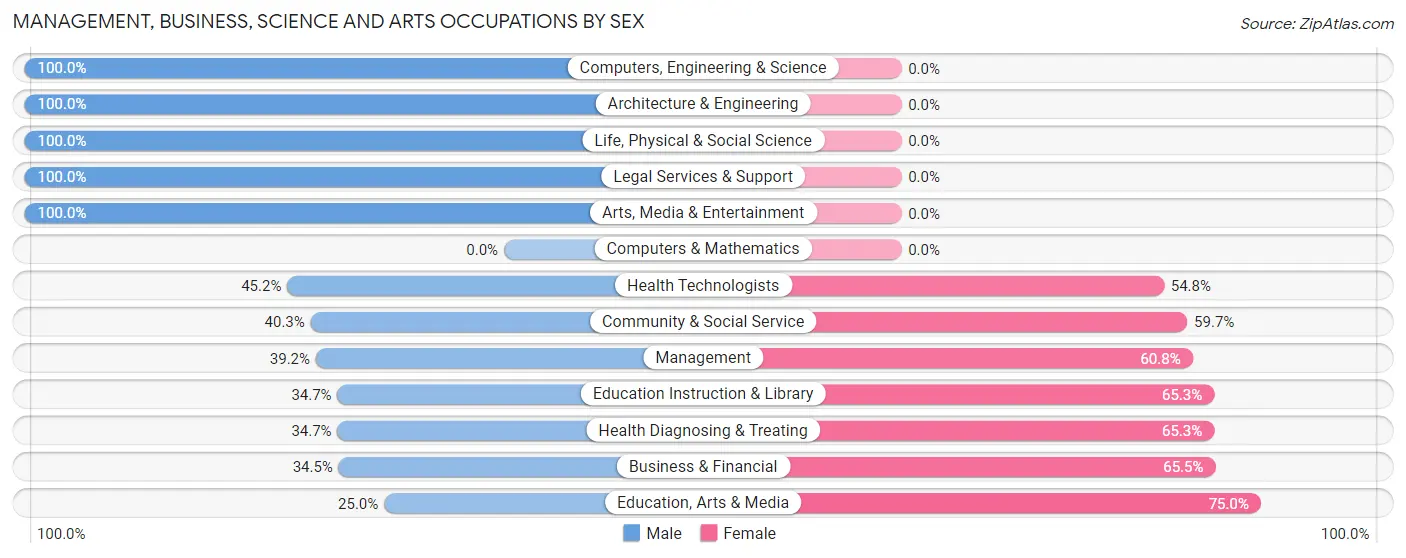
| Occupation | Male | Female |
| Management | 62 (39.2%) | 96 (60.8%) |
| Business & Financial | 10 (34.5%) | 19 (65.5%) |
| Computers, Engineering & Science | 31 (100.0%) | 0 (0.0%) |
| Computers & Mathematics | 0 (0.0%) | 0 (0.0%) |
| Architecture & Engineering | 20 (100.0%) | 0 (0.0%) |
| Life, Physical & Social Science | 11 (100.0%) | 0 (0.0%) |
| Community & Social Service | 48 (40.3%) | 71 (59.7%) |
| Education, Arts & Media | 3 (25.0%) | 9 (75.0%) |
| Legal Services & Support | 8 (100.0%) | 0 (0.0%) |
| Education Instruction & Library | 33 (34.7%) | 62 (65.3%) |
| Arts, Media & Entertainment | 4 (100.0%) | 0 (0.0%) |
| Health Diagnosing & Treating | 33 (34.7%) | 62 (65.3%) |
| Health Technologists | 33 (45.2%) | 40 (54.8%) |
| Total (Category) | 184 (42.6%) | 248 (57.4%) |
| Total (Overall) | 307 (46.7%) | 351 (53.3%) |
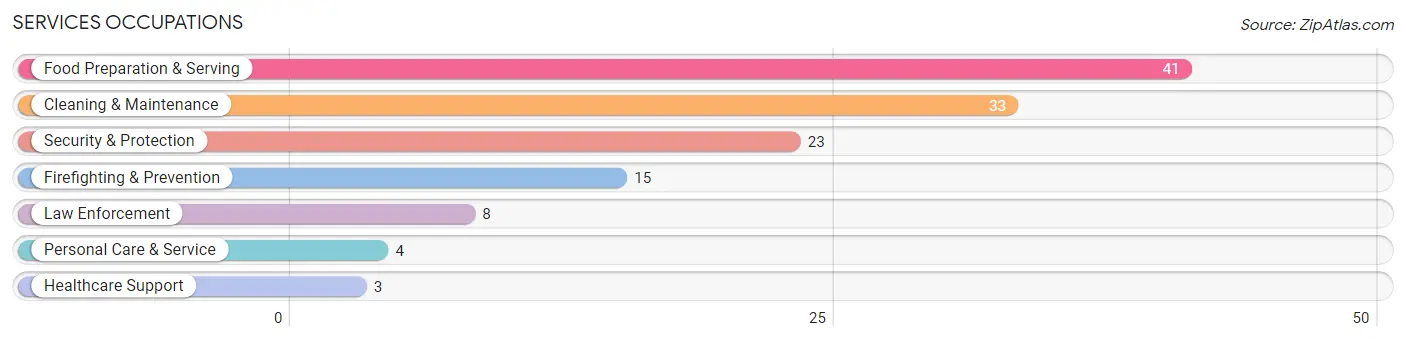
Services Occupations
The most common Services occupations in Litchfield borough are Food Preparation & Serving (41 | 6.2%), Cleaning & Maintenance (33 | 5.0%), Security & Protection (23 | 3.5%), Firefighting & Prevention (15 | 2.3%), and Law Enforcement (8 | 1.2%).
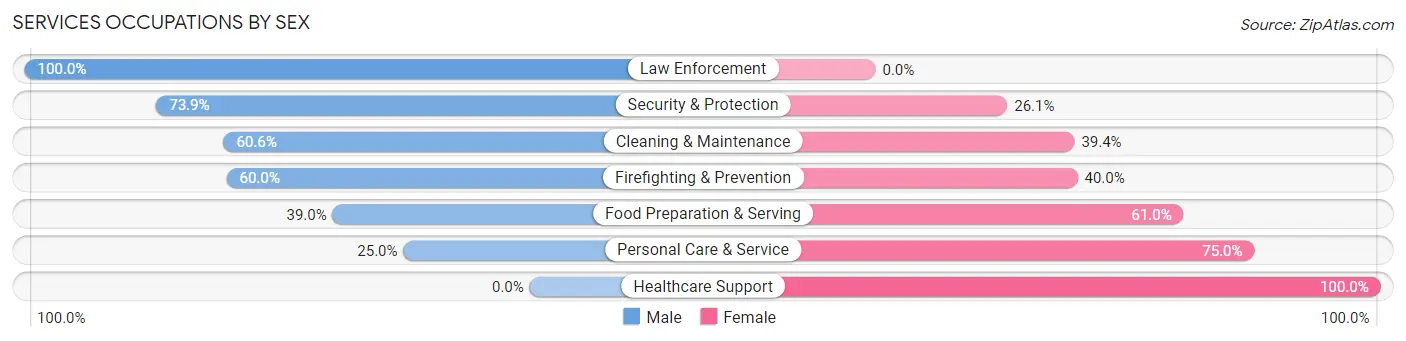
Services Occupations by Sex
Within the Services occupations in Litchfield borough, the most male-oriented occupations are Law Enforcement (100.0%), Security & Protection (73.9%), and Cleaning & Maintenance (60.6%), while the most female-oriented occupations are Healthcare Support (100.0%), Personal Care & Service (75.0%), and Food Preparation & Serving (61.0%).
| Occupation | Male | Female |
| Healthcare Support | 0 (0.0%) | 3 (100.0%) |
| Security & Protection | 17 (73.9%) | 6 (26.1%) |
| Firefighting & Prevention | 9 (60.0%) | 6 (40.0%) |
| Law Enforcement | 8 (100.0%) | 0 (0.0%) |
| Food Preparation & Serving | 16 (39.0%) | 25 (61.0%) |
| Cleaning & Maintenance | 20 (60.6%) | 13 (39.4%) |
| Personal Care & Service | 1 (25.0%) | 3 (75.0%) |
| Total (Category) | 54 (51.9%) | 50 (48.1%) |
| Total (Overall) | 307 (46.7%) | 351 (53.3%) |
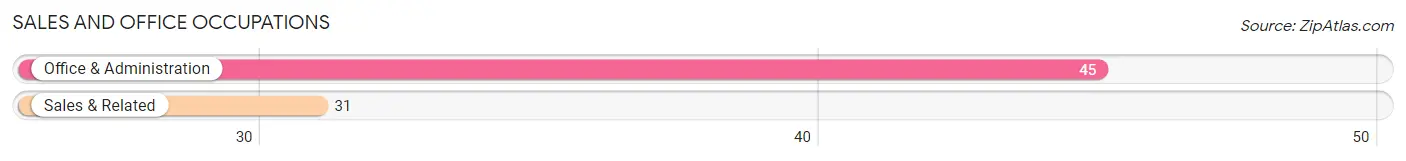
Sales and Office Occupations
The most common Sales and Office occupations in Litchfield borough are Office & Administration (45 | 6.8%), and Sales & Related (31 | 4.7%).
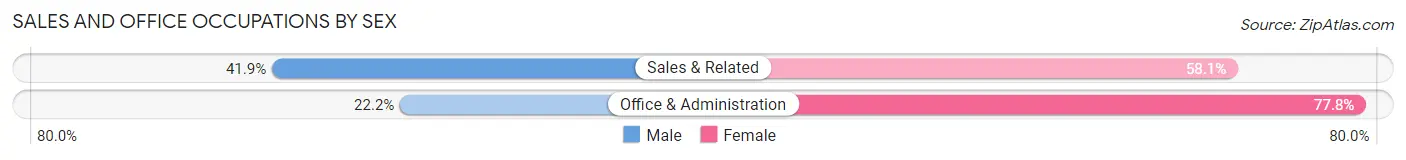
Sales and Office Occupations by Sex
| Occupation | Male | Female |
| Sales & Related | 13 (41.9%) | 18 (58.1%) |
| Office & Administration | 10 (22.2%) | 35 (77.8%) |
| Total (Category) | 23 (30.3%) | 53 (69.7%) |
| Total (Overall) | 307 (46.7%) | 351 (53.3%) |
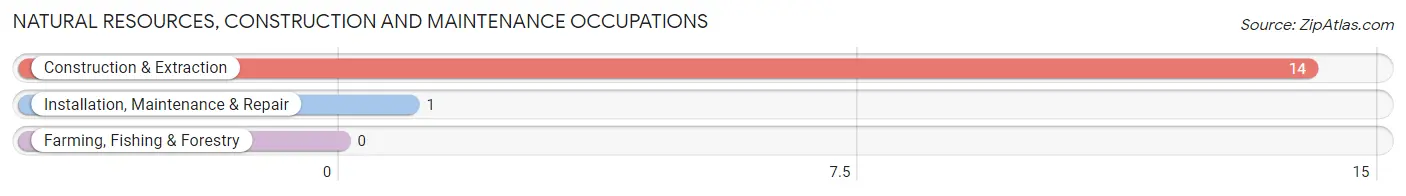
Natural Resources, Construction and Maintenance Occupations
The most common Natural Resources, Construction and Maintenance occupations in Litchfield borough are Construction & Extraction (14 | 2.1%), and Installation, Maintenance & Repair (1 | 0.2%).
Natural Resources, Construction and Maintenance Occupations by Sex
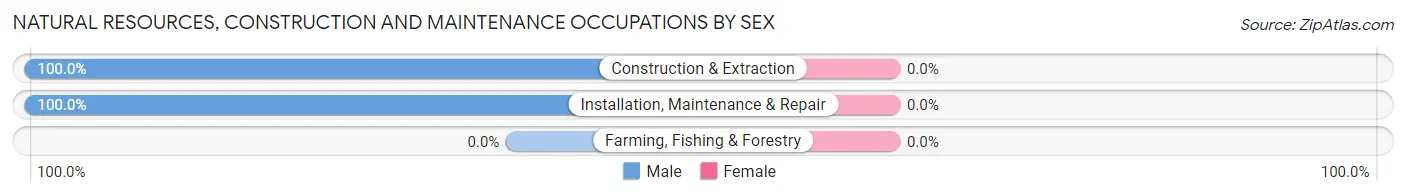
| Occupation | Male | Female |
| Farming, Fishing & Forestry | 0 (0.0%) | 0 (0.0%) |
| Construction & Extraction | 14 (100.0%) | 0 (0.0%) |
| Installation, Maintenance & Repair | 1 (100.0%) | 0 (0.0%) |
| Total (Category) | 15 (100.0%) | 0 (0.0%) |
| Total (Overall) | 307 (46.7%) | 351 (53.3%) |
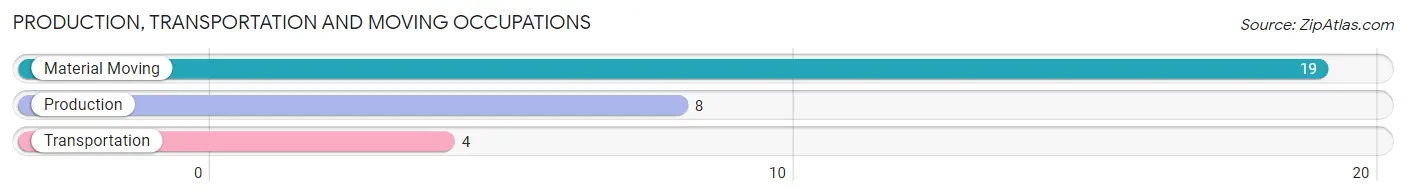
Production, Transportation and Moving Occupations
The most common Production, Transportation and Moving occupations in Litchfield borough are Material Moving (19 | 2.9%), Production (8 | 1.2%), and Transportation (4 | 0.6%).
Production, Transportation and Moving Occupations by Sex
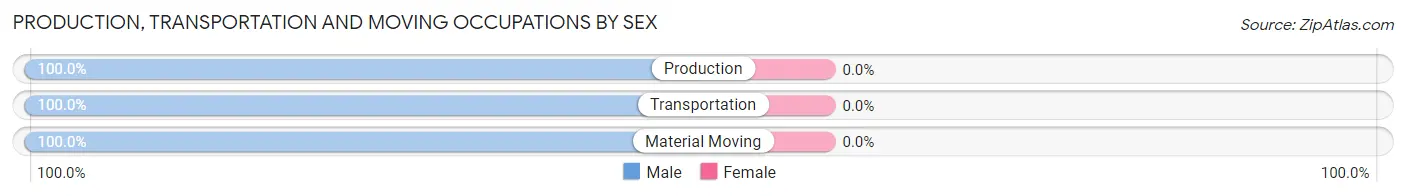
| Occupation | Male | Female |
| Production | 8 (100.0%) | 0 (0.0%) |
| Transportation | 4 (100.0%) | 0 (0.0%) |
| Material Moving | 19 (100.0%) | 0 (0.0%) |
| Total (Category) | 31 (100.0%) | 0 (0.0%) |
| Total (Overall) | 307 (46.7%) | 351 (53.3%) |
Employment Industries by Sex in Litchfield borough
Employment Industries in Litchfield borough
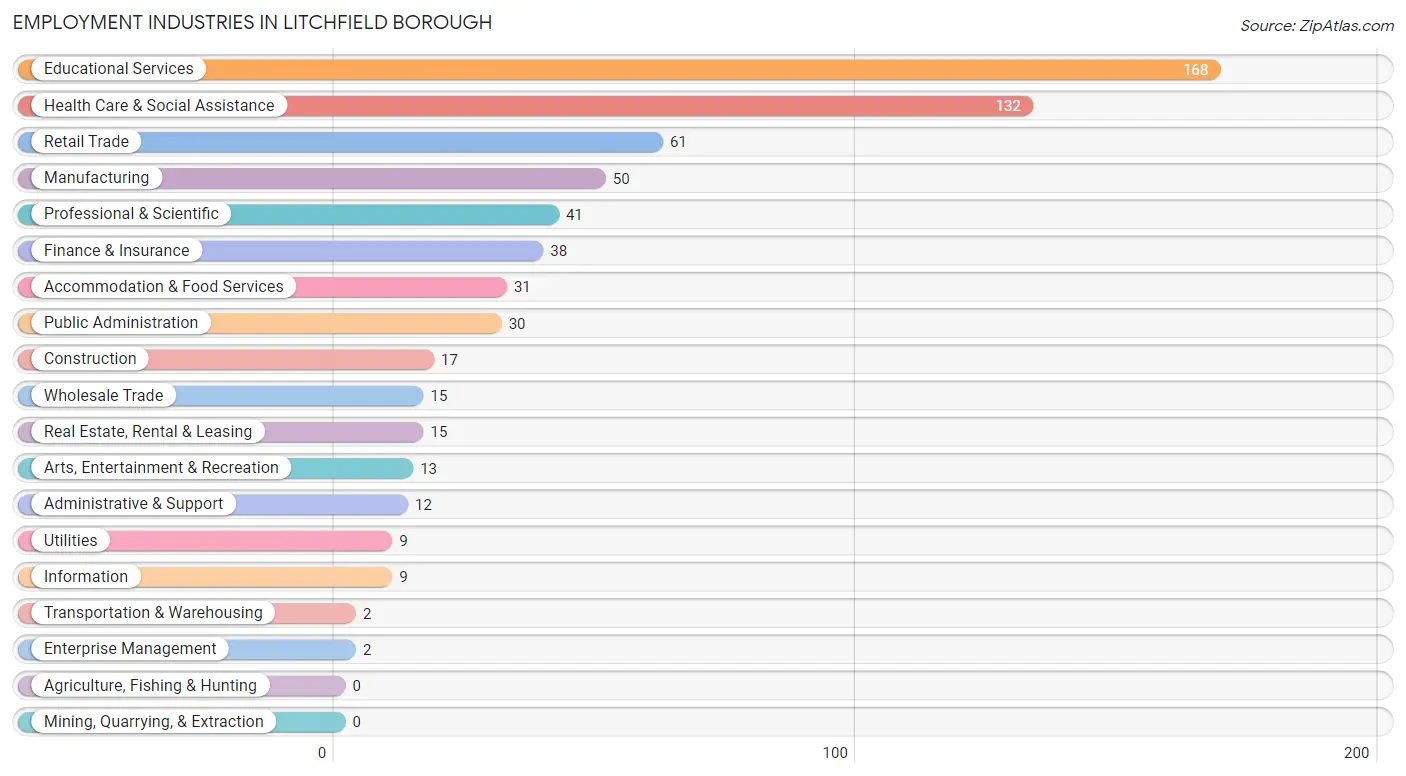
The major employment industries in Litchfield borough include Educational Services (168 | 25.5%), Health Care & Social Assistance (132 | 20.1%), Retail Trade (61 | 9.3%), Manufacturing (50 | 7.6%), and Professional & Scientific (41 | 6.2%).
Employment Industries by Sex in Litchfield borough
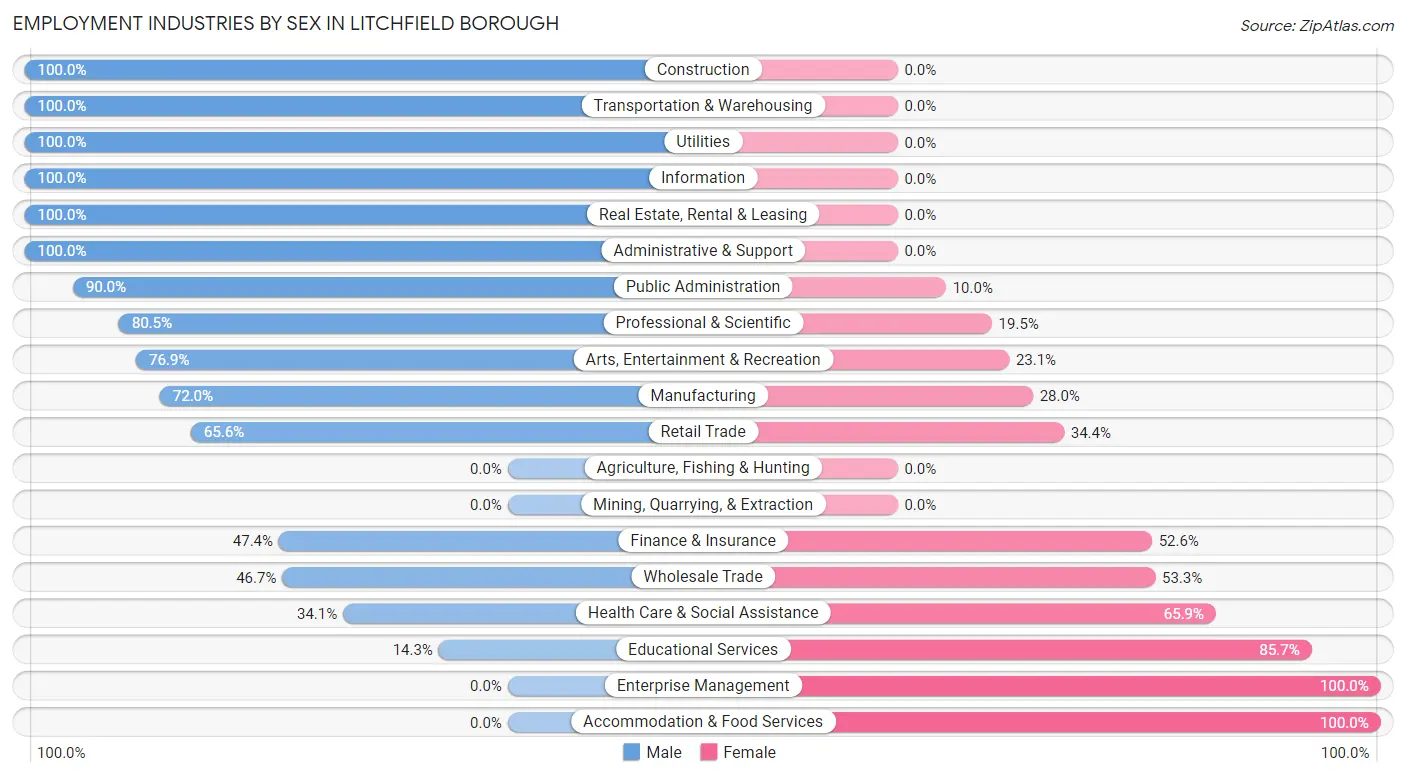
The Litchfield borough industries that see more men than women are Construction (100.0%), Transportation & Warehousing (100.0%), and Utilities (100.0%), whereas the industries that tend to have a higher number of women are Enterprise Management (100.0%), Accommodation & Food Services (100.0%), and Educational Services (85.7%).
| Industry | Male | Female |
| Agriculture, Fishing & Hunting | 0 (0.0%) | 0 (0.0%) |
| Mining, Quarrying, & Extraction | 0 (0.0%) | 0 (0.0%) |
| Construction | 17 (100.0%) | 0 (0.0%) |
| Manufacturing | 36 (72.0%) | 14 (28.0%) |
| Wholesale Trade | 7 (46.7%) | 8 (53.3%) |
| Retail Trade | 40 (65.6%) | 21 (34.4%) |
| Transportation & Warehousing | 2 (100.0%) | 0 (0.0%) |
| Utilities | 9 (100.0%) | 0 (0.0%) |
| Information | 9 (100.0%) | 0 (0.0%) |
| Finance & Insurance | 18 (47.4%) | 20 (52.6%) |
| Real Estate, Rental & Leasing | 15 (100.0%) | 0 (0.0%) |
| Professional & Scientific | 33 (80.5%) | 8 (19.5%) |
| Enterprise Management | 0 (0.0%) | 2 (100.0%) |
| Administrative & Support | 12 (100.0%) | 0 (0.0%) |
| Educational Services | 24 (14.3%) | 144 (85.7%) |
| Health Care & Social Assistance | 45 (34.1%) | 87 (65.9%) |
| Arts, Entertainment & Recreation | 10 (76.9%) | 3 (23.1%) |
| Accommodation & Food Services | 0 (0.0%) | 31 (100.0%) |
| Public Administration | 27 (90.0%) | 3 (10.0%) |
| Total | 307 (46.7%) | 351 (53.3%) |
Education in Litchfield borough
School Enrollment in Litchfield borough
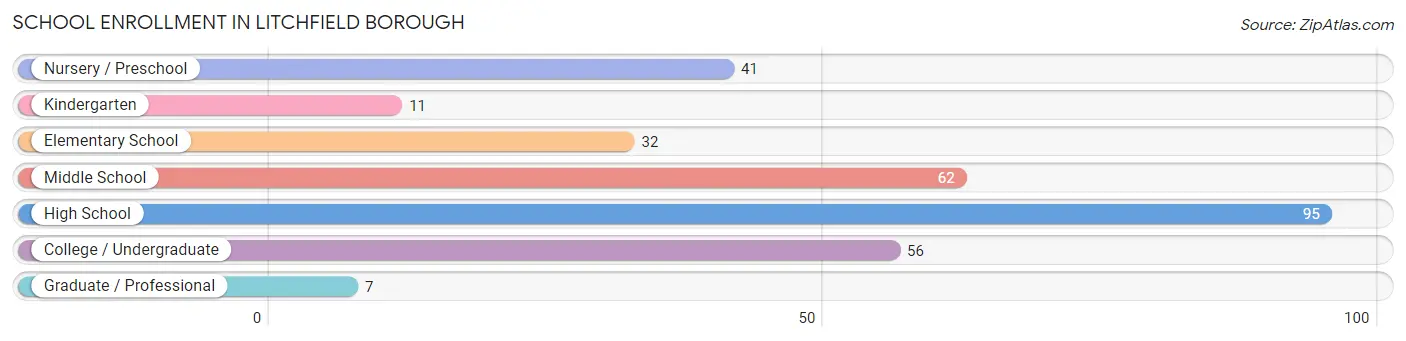
The most common levels of schooling among the 304 students in Litchfield borough are high school (95 | 31.2%), middle school (62 | 20.4%), and college / undergraduate (56 | 18.4%).
| School Level | # Students | % Students |
| Nursery / Preschool | 41 | 13.5% |
| Kindergarten | 11 | 3.6% |
| Elementary School | 32 | 10.5% |
| Middle School | 62 | 20.4% |
| High School | 95 | 31.2% |
| College / Undergraduate | 56 | 18.4% |
| Graduate / Professional | 7 | 2.3% |
| Total | 304 | 100.0% |
School Enrollment by Age by Funding Source in Litchfield borough
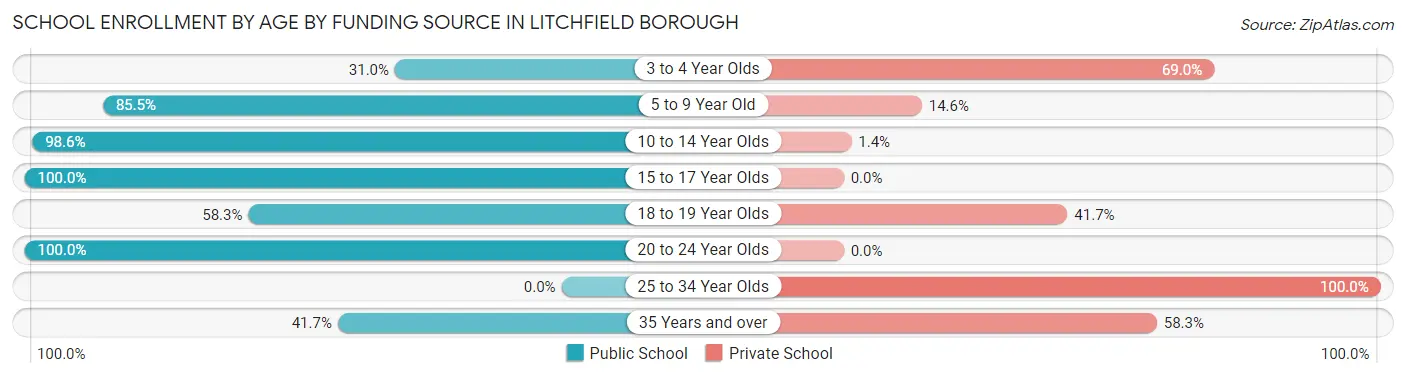
Out of a total of 304 students who are enrolled in schools in Litchfield borough, 55 (18.1%) attend a private institution, while the remaining 249 (81.9%) are enrolled in public schools. The age group of 25 to 34 year olds has the highest likelihood of being enrolled in private schools, with 4 (100.0% in the age bracket) enrolled. Conversely, the age group of 15 to 17 year olds has the lowest likelihood of being enrolled in a private school, with 78 (100.0% in the age bracket) attending a public institution.
| Age Bracket | Public School | Private School |
| 3 to 4 Year Olds | 9 (31.0%) | 20 (69.0%) |
| 5 to 9 Year Old | 47 (85.5%) | 8 (14.5%) |
| 10 to 14 Year Olds | 69 (98.6%) | 1 (1.4%) |
| 15 to 17 Year Olds | 78 (100.0%) | 0 (0.0%) |
| 18 to 19 Year Olds | 21 (58.3%) | 15 (41.7%) |
| 20 to 24 Year Olds | 20 (100.0%) | 0 (0.0%) |
| 25 to 34 Year Olds | 0 (0.0%) | 4 (100.0%) |
| 35 Years and over | 5 (41.7%) | 7 (58.3%) |
| Total | 249 (81.9%) | 55 (18.1%) |
Educational Attainment by Field of Study in Litchfield borough
Literature & languages (198 | 27.9%), social sciences (94 | 13.3%), business (67 | 9.5%), science & technology (53 | 7.5%), and education (45 | 6.4%) are the most common fields of study among 709 individuals in Litchfield borough who have obtained a bachelor's degree or higher.
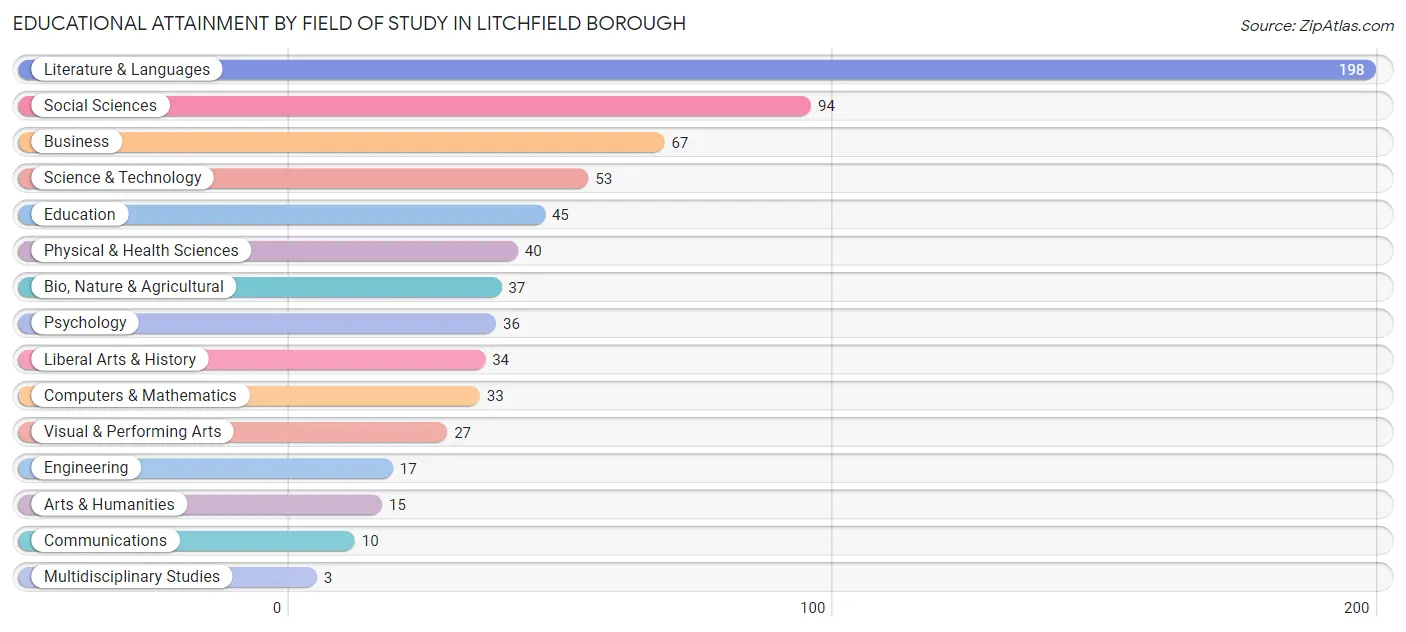
| Field of Study | # Graduates | % Graduates |
| Computers & Mathematics | 33 | 4.6% |
| Bio, Nature & Agricultural | 37 | 5.2% |
| Physical & Health Sciences | 40 | 5.6% |
| Psychology | 36 | 5.1% |
| Social Sciences | 94 | 13.3% |
| Engineering | 17 | 2.4% |
| Multidisciplinary Studies | 3 | 0.4% |
| Science & Technology | 53 | 7.5% |
| Business | 67 | 9.5% |
| Education | 45 | 6.4% |
| Literature & Languages | 198 | 27.9% |
| Liberal Arts & History | 34 | 4.8% |
| Visual & Performing Arts | 27 | 3.8% |
| Communications | 10 | 1.4% |
| Arts & Humanities | 15 | 2.1% |
| Total | 709 | 100.0% |
Transportation & Commute in Litchfield borough
Vehicle Availability by Sex in Litchfield borough
The most prevalent vehicle ownership categories in Litchfield borough are males with 2 vehicles (201, accounting for 66.6%) and females with 2 vehicles (143, making up 58.3%).
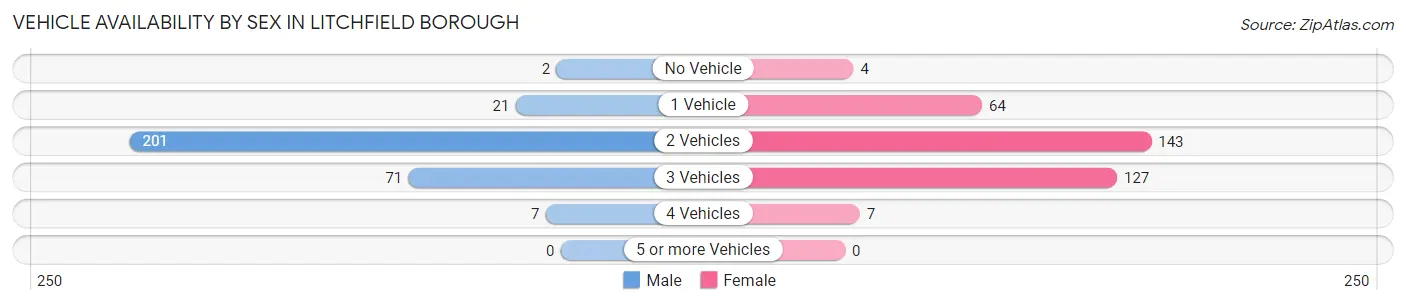
| Vehicles Available | Male | Female |
| No Vehicle | 2 (0.7%) | 4 (1.2%) |
| 1 Vehicle | 21 (7.0%) | 64 (18.5%) |
| 2 Vehicles | 201 (66.6%) | 143 (41.4%) |
| 3 Vehicles | 71 (23.5%) | 127 (36.8%) |
| 4 Vehicles | 7 (2.3%) | 7 (2.0%) |
| 5 or more Vehicles | 0 (0.0%) | 0 (0.0%) |
| Total | 302 (100.0%) | 345 (100.0%) |
Commute Time in Litchfield borough
The most frequently occuring commute durations in Litchfield borough are 20 to 24 minutes (117 commuters, 20.2%), 10 to 14 minutes (91 commuters, 15.7%), and 15 to 19 minutes (88 commuters, 15.2%).
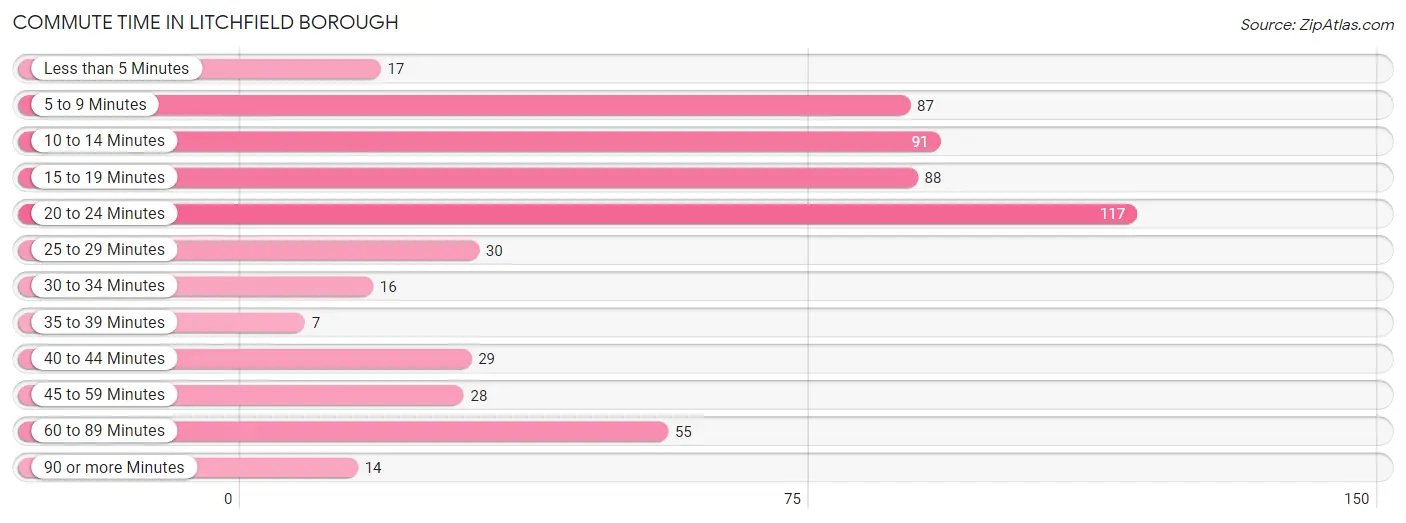
| Commute Time | # Commuters | % Commuters |
| Less than 5 Minutes | 17 | 2.9% |
| 5 to 9 Minutes | 87 | 15.0% |
| 10 to 14 Minutes | 91 | 15.7% |
| 15 to 19 Minutes | 88 | 15.2% |
| 20 to 24 Minutes | 117 | 20.2% |
| 25 to 29 Minutes | 30 | 5.2% |
| 30 to 34 Minutes | 16 | 2.8% |
| 35 to 39 Minutes | 7 | 1.2% |
| 40 to 44 Minutes | 29 | 5.0% |
| 45 to 59 Minutes | 28 | 4.8% |
| 60 to 89 Minutes | 55 | 9.5% |
| 90 or more Minutes | 14 | 2.4% |
Commute Time by Sex in Litchfield borough
The most common commute times in Litchfield borough are 15 to 19 minutes (59 commuters, 21.9%) for males and 20 to 24 minutes (99 commuters, 31.9%) for females.
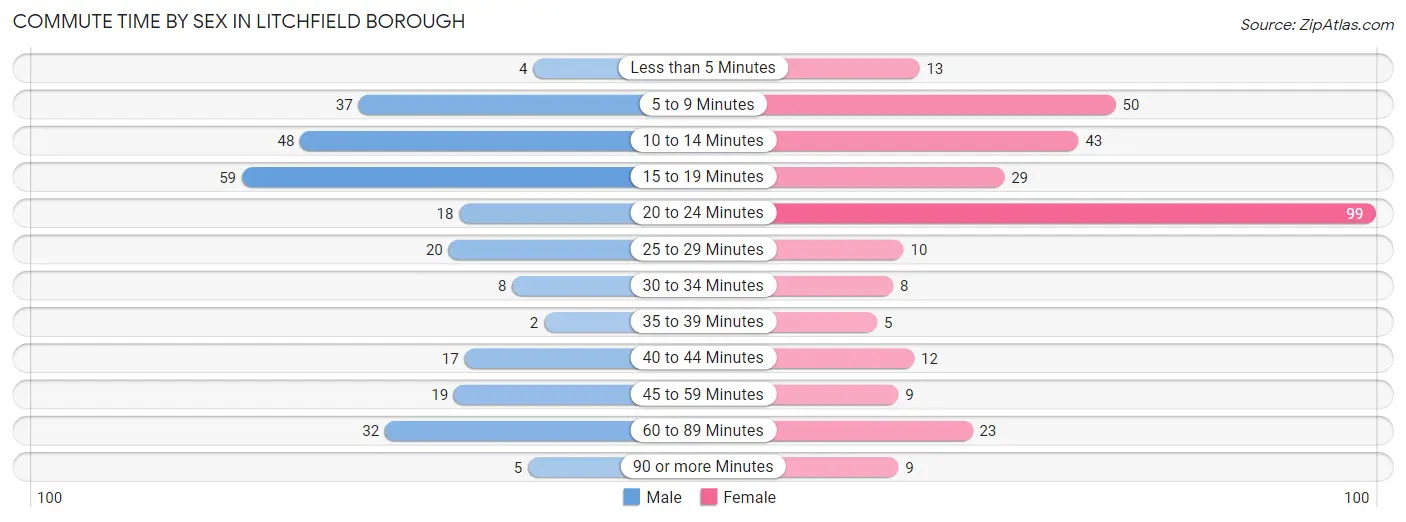
| Commute Time | Male | Female |
| Less than 5 Minutes | 4 (1.5%) | 13 (4.2%) |
| 5 to 9 Minutes | 37 (13.8%) | 50 (16.1%) |
| 10 to 14 Minutes | 48 (17.8%) | 43 (13.9%) |
| 15 to 19 Minutes | 59 (21.9%) | 29 (9.3%) |
| 20 to 24 Minutes | 18 (6.7%) | 99 (31.9%) |
| 25 to 29 Minutes | 20 (7.4%) | 10 (3.2%) |
| 30 to 34 Minutes | 8 (3.0%) | 8 (2.6%) |
| 35 to 39 Minutes | 2 (0.7%) | 5 (1.6%) |
| 40 to 44 Minutes | 17 (6.3%) | 12 (3.9%) |
| 45 to 59 Minutes | 19 (7.1%) | 9 (2.9%) |
| 60 to 89 Minutes | 32 (11.9%) | 23 (7.4%) |
| 90 or more Minutes | 5 (1.9%) | 9 (2.9%) |
Time of Departure to Work by Sex in Litchfield borough
The most frequent times of departure to work in Litchfield borough are 7:00 AM to 7:29 AM (57, 21.2%) for males and 7:30 AM to 7:59 AM (108, 34.8%) for females.
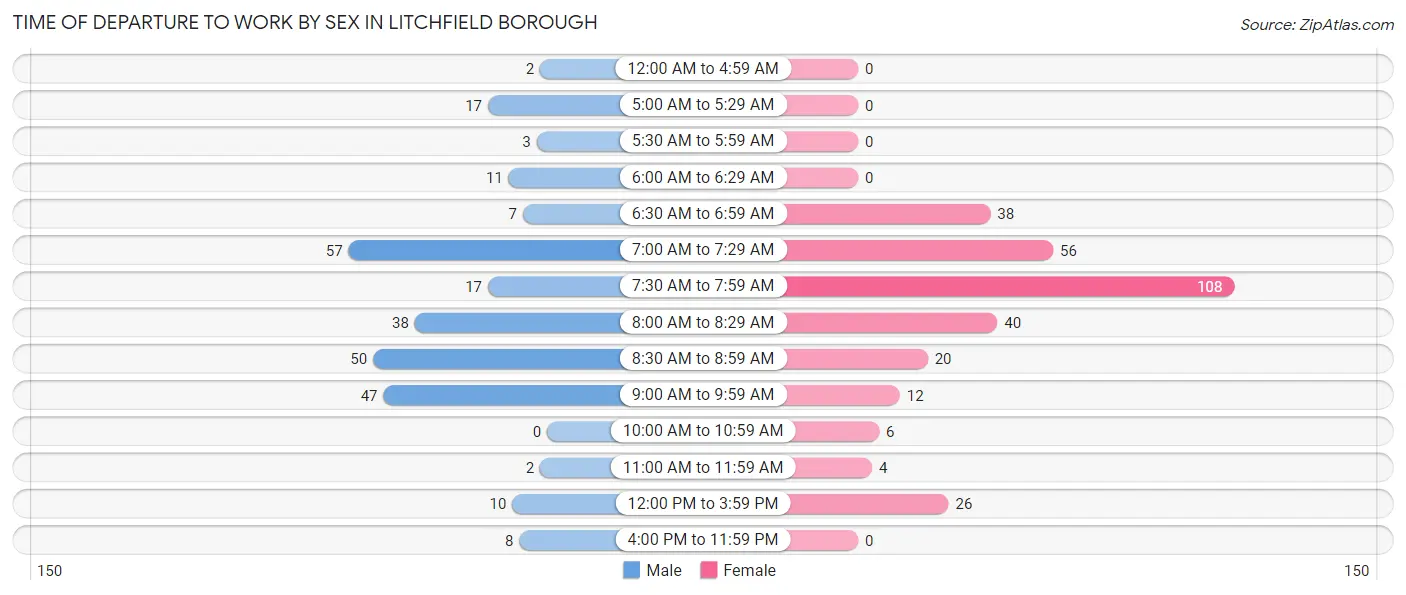
| Time of Departure | Male | Female |
| 12:00 AM to 4:59 AM | 2 (0.7%) | 0 (0.0%) |
| 5:00 AM to 5:29 AM | 17 (6.3%) | 0 (0.0%) |
| 5:30 AM to 5:59 AM | 3 (1.1%) | 0 (0.0%) |
| 6:00 AM to 6:29 AM | 11 (4.1%) | 0 (0.0%) |
| 6:30 AM to 6:59 AM | 7 (2.6%) | 38 (12.3%) |
| 7:00 AM to 7:29 AM | 57 (21.2%) | 56 (18.1%) |
| 7:30 AM to 7:59 AM | 17 (6.3%) | 108 (34.8%) |
| 8:00 AM to 8:29 AM | 38 (14.1%) | 40 (12.9%) |
| 8:30 AM to 8:59 AM | 50 (18.6%) | 20 (6.5%) |
| 9:00 AM to 9:59 AM | 47 (17.5%) | 12 (3.9%) |
| 10:00 AM to 10:59 AM | 0 (0.0%) | 6 (1.9%) |
| 11:00 AM to 11:59 AM | 2 (0.7%) | 4 (1.3%) |
| 12:00 PM to 3:59 PM | 10 (3.7%) | 26 (8.4%) |
| 4:00 PM to 11:59 PM | 8 (3.0%) | 0 (0.0%) |
| Total | 269 (100.0%) | 310 (100.0%) |
Housing Occupancy in Litchfield borough
Occupancy by Ownership in Litchfield borough
Of the total 522 dwellings in Litchfield borough, owner-occupied units account for 392 (75.1%), while renter-occupied units make up 130 (24.9%).
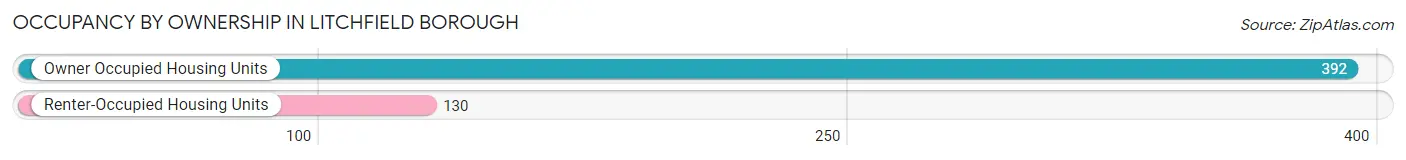
| Occupancy | # Housing Units | % Housing Units |
| Owner Occupied Housing Units | 392 | 75.1% |
| Renter-Occupied Housing Units | 130 | 24.9% |
| Total Occupied Housing Units | 522 | 100.0% |
Occupancy by Household Size in Litchfield borough
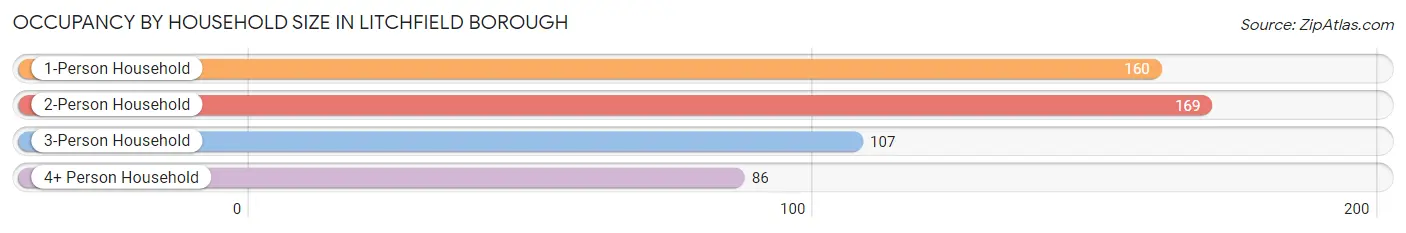
| Household Size | # Housing Units | % Housing Units |
| 1-Person Household | 160 | 30.6% |
| 2-Person Household | 169 | 32.4% |
| 3-Person Household | 107 | 20.5% |
| 4+ Person Household | 86 | 16.5% |
| Total Housing Units | 522 | 100.0% |
Occupancy by Ownership by Household Size in Litchfield borough
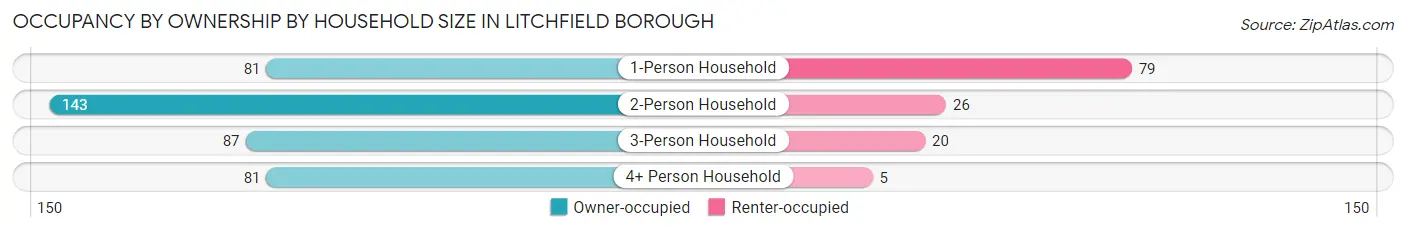
| Household Size | Owner-occupied | Renter-occupied |
| 1-Person Household | 81 (50.6%) | 79 (49.4%) |
| 2-Person Household | 143 (84.6%) | 26 (15.4%) |
| 3-Person Household | 87 (81.3%) | 20 (18.7%) |
| 4+ Person Household | 81 (94.2%) | 5 (5.8%) |
| Total Housing Units | 392 (75.1%) | 130 (24.9%) |
Occupancy by Educational Attainment in Litchfield borough
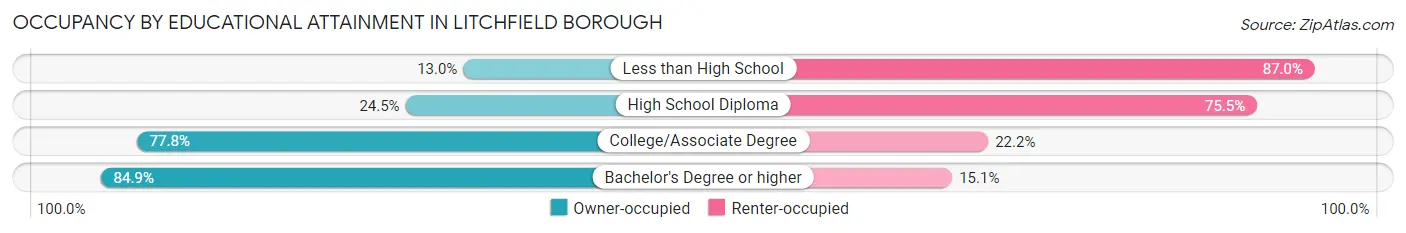
| Household Size | Owner-occupied | Renter-occupied |
| Less than High School | 3 (13.0%) | 20 (87.0%) |
| High School Diploma | 12 (24.5%) | 37 (75.5%) |
| College/Associate Degree | 56 (77.8%) | 16 (22.2%) |
| Bachelor's Degree or higher | 321 (84.9%) | 57 (15.1%) |
Occupancy by Age of Householder in Litchfield borough
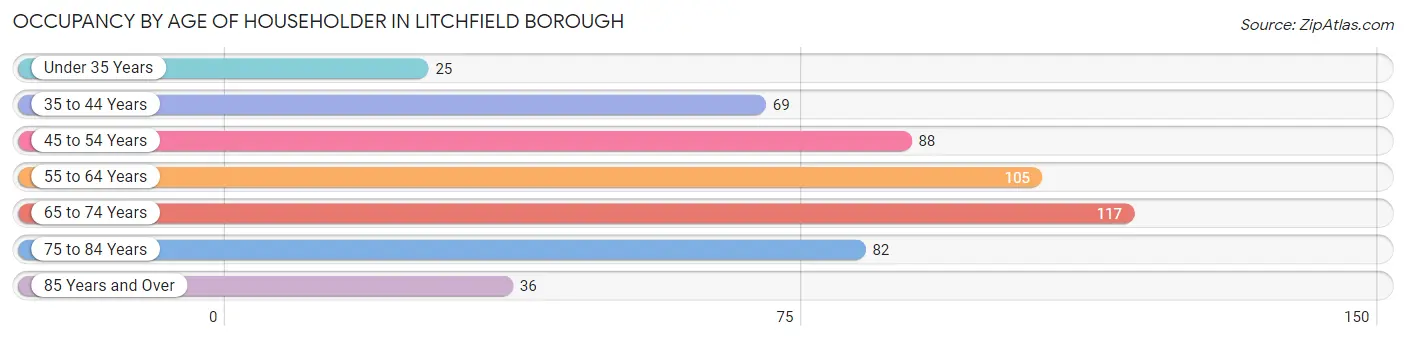
| Age Bracket | # Households | % Households |
| Under 35 Years | 25 | 4.8% |
| 35 to 44 Years | 69 | 13.2% |
| 45 to 54 Years | 88 | 16.9% |
| 55 to 64 Years | 105 | 20.1% |
| 65 to 74 Years | 117 | 22.4% |
| 75 to 84 Years | 82 | 15.7% |
| 85 Years and Over | 36 | 6.9% |
| Total | 522 | 100.0% |
Housing Finances in Litchfield borough
Median Income by Occupancy in Litchfield borough
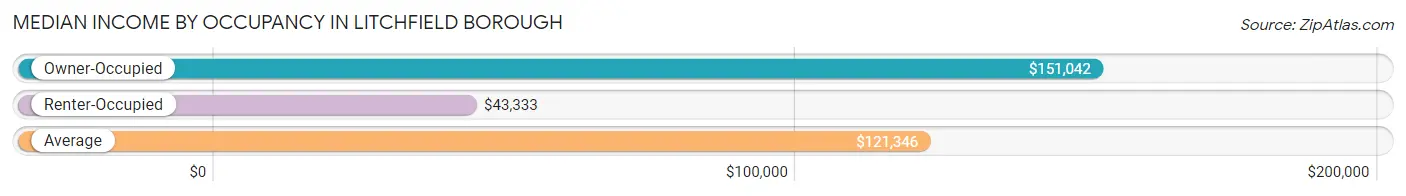
| Occupancy Type | # Households | Median Income |
| Owner-Occupied | 392 (75.1%) | $151,042 |
| Renter-Occupied | 130 (24.9%) | $43,333 |
| Average | 522 (100.0%) | $121,346 |
Occupancy by Householder Income Bracket in Litchfield borough
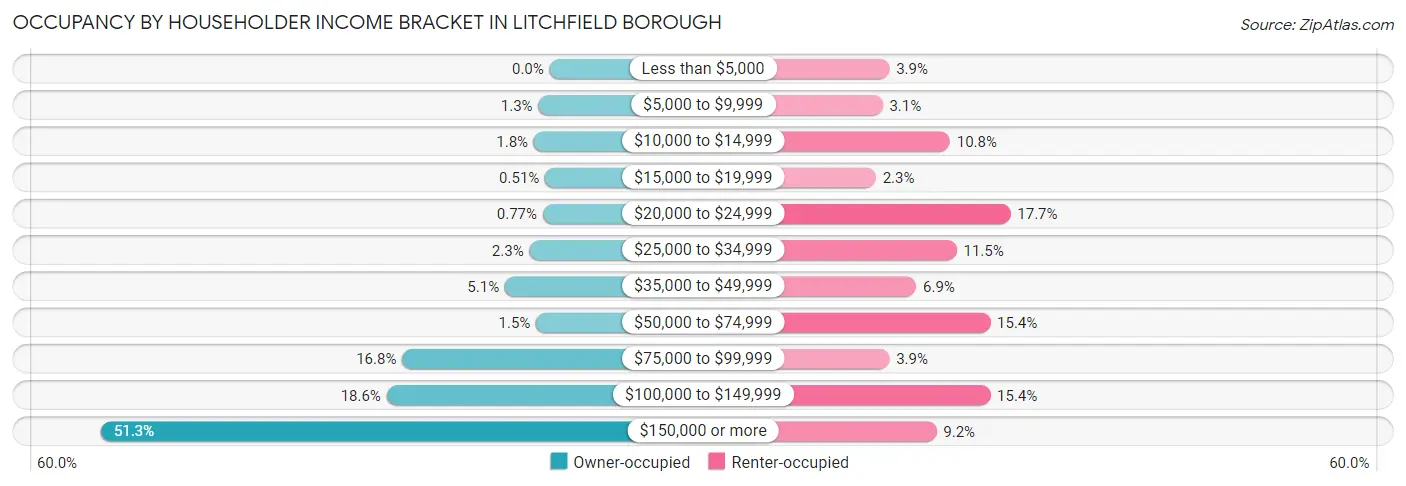
| Income Bracket | Owner-occupied | Renter-occupied |
| Less than $5,000 | 0 (0.0%) | 5 (3.8%) |
| $5,000 to $9,999 | 5 (1.3%) | 4 (3.1%) |
| $10,000 to $14,999 | 7 (1.8%) | 14 (10.8%) |
| $15,000 to $19,999 | 2 (0.5%) | 3 (2.3%) |
| $20,000 to $24,999 | 3 (0.8%) | 23 (17.7%) |
| $25,000 to $34,999 | 9 (2.3%) | 15 (11.5%) |
| $35,000 to $49,999 | 20 (5.1%) | 9 (6.9%) |
| $50,000 to $74,999 | 6 (1.5%) | 20 (15.4%) |
| $75,000 to $99,999 | 66 (16.8%) | 5 (3.8%) |
| $100,000 to $149,999 | 73 (18.6%) | 20 (15.4%) |
| $150,000 or more | 201 (51.3%) | 12 (9.2%) |
| Total | 392 (100.0%) | 130 (100.0%) |
Monthly Housing Cost Tiers in Litchfield borough
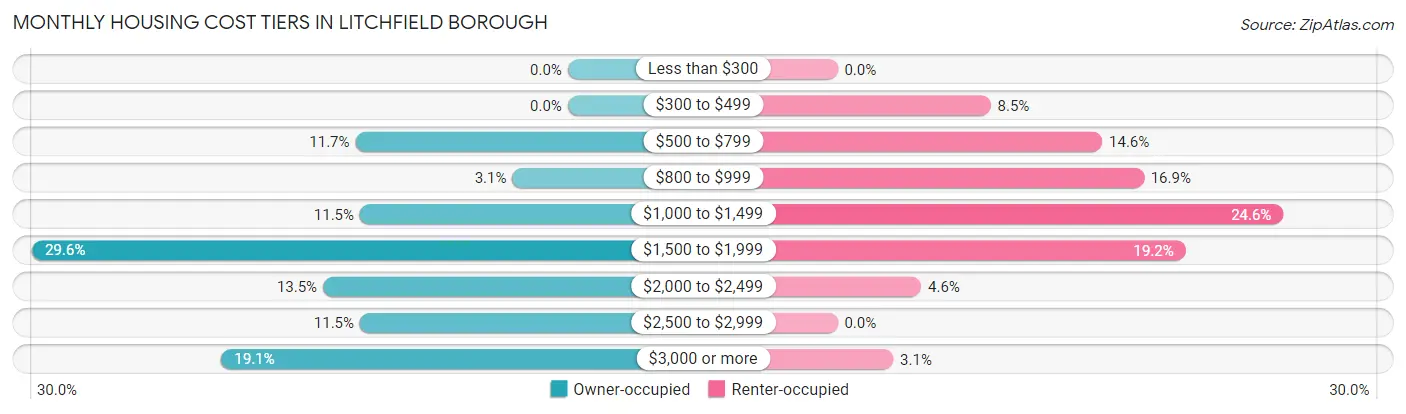
| Monthly Cost | Owner-occupied | Renter-occupied |
| Less than $300 | 0 (0.0%) | 0 (0.0%) |
| $300 to $499 | 0 (0.0%) | 11 (8.5%) |
| $500 to $799 | 46 (11.7%) | 19 (14.6%) |
| $800 to $999 | 12 (3.1%) | 22 (16.9%) |
| $1,000 to $1,499 | 45 (11.5%) | 32 (24.6%) |
| $1,500 to $1,999 | 116 (29.6%) | 25 (19.2%) |
| $2,000 to $2,499 | 53 (13.5%) | 6 (4.6%) |
| $2,500 to $2,999 | 45 (11.5%) | 0 (0.0%) |
| $3,000 or more | 75 (19.1%) | 4 (3.1%) |
| Total | 392 (100.0%) | 130 (100.0%) |
Physical Housing Characteristics in Litchfield borough
Housing Structures in Litchfield borough
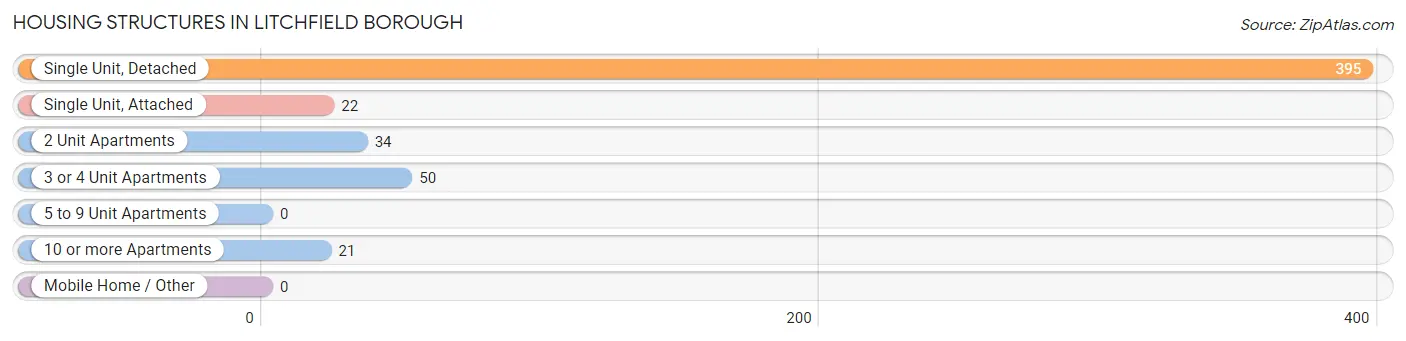
| Structure Type | # Housing Units | % Housing Units |
| Single Unit, Detached | 395 | 75.7% |
| Single Unit, Attached | 22 | 4.2% |
| 2 Unit Apartments | 34 | 6.5% |
| 3 or 4 Unit Apartments | 50 | 9.6% |
| 5 to 9 Unit Apartments | 0 | 0.0% |
| 10 or more Apartments | 21 | 4.0% |
| Mobile Home / Other | 0 | 0.0% |
| Total | 522 | 100.0% |
Housing Structures by Occupancy in Litchfield borough
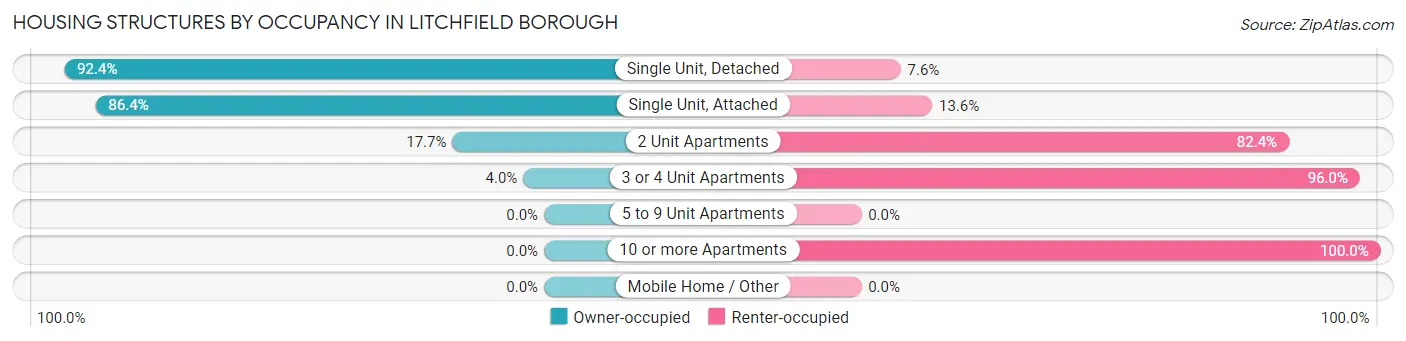
| Structure Type | Owner-occupied | Renter-occupied |
| Single Unit, Detached | 365 (92.4%) | 30 (7.6%) |
| Single Unit, Attached | 19 (86.4%) | 3 (13.6%) |
| 2 Unit Apartments | 6 (17.6%) | 28 (82.4%) |
| 3 or 4 Unit Apartments | 2 (4.0%) | 48 (96.0%) |
| 5 to 9 Unit Apartments | 0 (0.0%) | 0 (0.0%) |
| 10 or more Apartments | 0 (0.0%) | 21 (100.0%) |
| Mobile Home / Other | 0 (0.0%) | 0 (0.0%) |
| Total | 392 (75.1%) | 130 (24.9%) |
Housing Structures by Number of Rooms in Litchfield borough
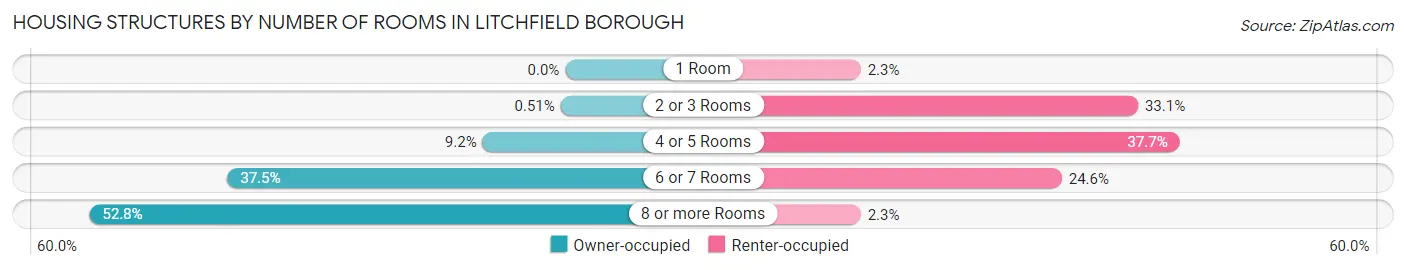
| Number of Rooms | Owner-occupied | Renter-occupied |
| 1 Room | 0 (0.0%) | 3 (2.3%) |
| 2 or 3 Rooms | 2 (0.5%) | 43 (33.1%) |
| 4 or 5 Rooms | 36 (9.2%) | 49 (37.7%) |
| 6 or 7 Rooms | 147 (37.5%) | 32 (24.6%) |
| 8 or more Rooms | 207 (52.8%) | 3 (2.3%) |
| Total | 392 (100.0%) | 130 (100.0%) |
Housing Structure by Heating Type in Litchfield borough
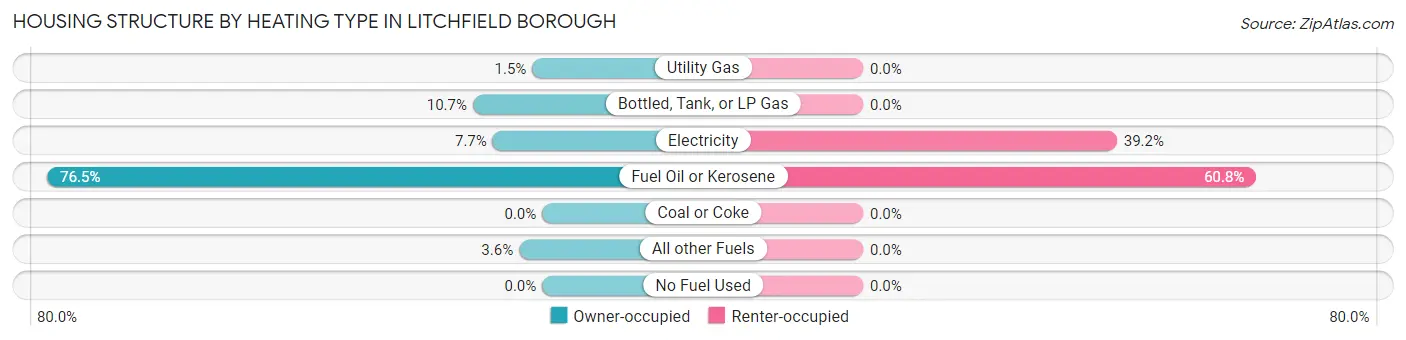
| Heating Type | Owner-occupied | Renter-occupied |
| Utility Gas | 6 (1.5%) | 0 (0.0%) |
| Bottled, Tank, or LP Gas | 42 (10.7%) | 0 (0.0%) |
| Electricity | 30 (7.6%) | 51 (39.2%) |
| Fuel Oil or Kerosene | 300 (76.5%) | 79 (60.8%) |
| Coal or Coke | 0 (0.0%) | 0 (0.0%) |
| All other Fuels | 14 (3.6%) | 0 (0.0%) |
| No Fuel Used | 0 (0.0%) | 0 (0.0%) |
| Total | 392 (100.0%) | 130 (100.0%) |
Household Vehicle Usage in Litchfield borough
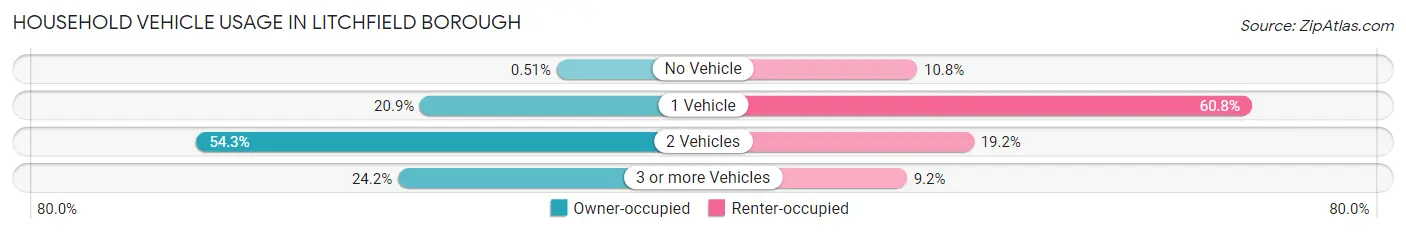
| Vehicles per Household | Owner-occupied | Renter-occupied |
| No Vehicle | 2 (0.5%) | 14 (10.8%) |
| 1 Vehicle | 82 (20.9%) | 79 (60.8%) |
| 2 Vehicles | 213 (54.3%) | 25 (19.2%) |
| 3 or more Vehicles | 95 (24.2%) | 12 (9.2%) |
| Total | 392 (100.0%) | 130 (100.0%) |
Real Estate & Mortgages in Litchfield borough
Real Estate and Mortgage Overview in Litchfield borough
| Characteristic | Without Mortgage | With Mortgage |
| Housing Units | 126 | 266 |
| Median Property Value | $417,600 | $372,000 |
| Median Household Income | $92,262 | $150 |
| Monthly Housing Costs | $1,071 | $69 |
| Real Estate Taxes | $5,875 | $0 |
Property Value by Mortgage Status in Litchfield borough
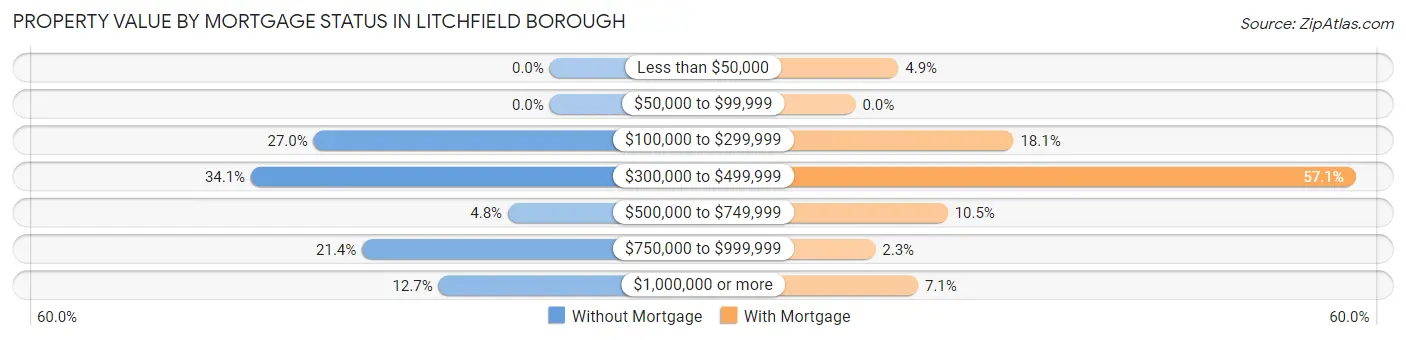
| Property Value | Without Mortgage | With Mortgage |
| Less than $50,000 | 0 (0.0%) | 13 (4.9%) |
| $50,000 to $99,999 | 0 (0.0%) | 0 (0.0%) |
| $100,000 to $299,999 | 34 (27.0%) | 48 (18.0%) |
| $300,000 to $499,999 | 43 (34.1%) | 152 (57.1%) |
| $500,000 to $749,999 | 6 (4.8%) | 28 (10.5%) |
| $750,000 to $999,999 | 27 (21.4%) | 6 (2.3%) |
| $1,000,000 or more | 16 (12.7%) | 19 (7.1%) |
| Total | 126 (100.0%) | 266 (100.0%) |
Household Income by Mortgage Status in Litchfield borough
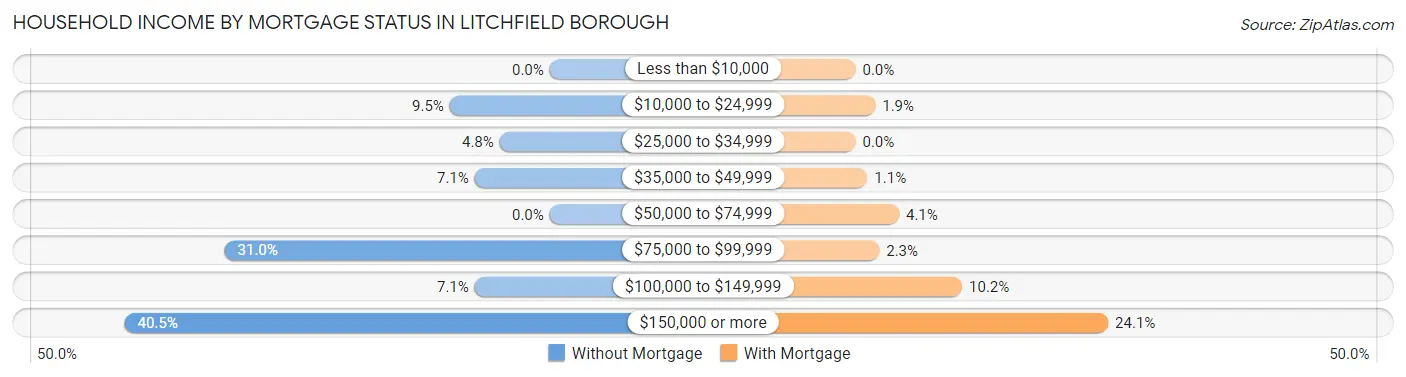
| Household Income | Without Mortgage | With Mortgage |
| Less than $10,000 | 0 (0.0%) | 0 (0.0%) |
| $10,000 to $24,999 | 12 (9.5%) | 5 (1.9%) |
| $25,000 to $34,999 | 6 (4.8%) | 0 (0.0%) |
| $35,000 to $49,999 | 9 (7.1%) | 3 (1.1%) |
| $50,000 to $74,999 | 0 (0.0%) | 11 (4.1%) |
| $75,000 to $99,999 | 39 (30.9%) | 6 (2.3%) |
| $100,000 to $149,999 | 9 (7.1%) | 27 (10.2%) |
| $150,000 or more | 51 (40.5%) | 64 (24.1%) |
| Total | 126 (100.0%) | 266 (100.0%) |
Property Value to Household Income Ratio in Litchfield borough
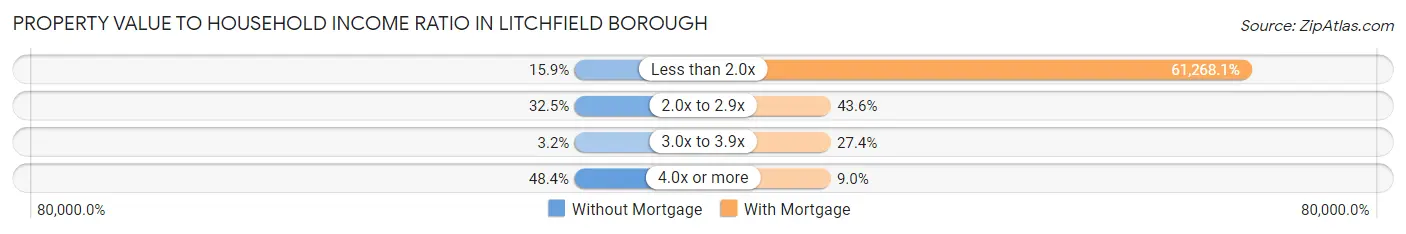
| Value-to-Income Ratio | Without Mortgage | With Mortgage |
| Less than 2.0x | 20 (15.9%) | 162,973 (61,268.1%) |
| 2.0x to 2.9x | 41 (32.5%) | 116 (43.6%) |
| 3.0x to 3.9x | 4 (3.2%) | 73 (27.4%) |
| 4.0x or more | 61 (48.4%) | 24 (9.0%) |
| Total | 126 (100.0%) | 266 (100.0%) |
Real Estate Taxes by Mortgage Status in Litchfield borough
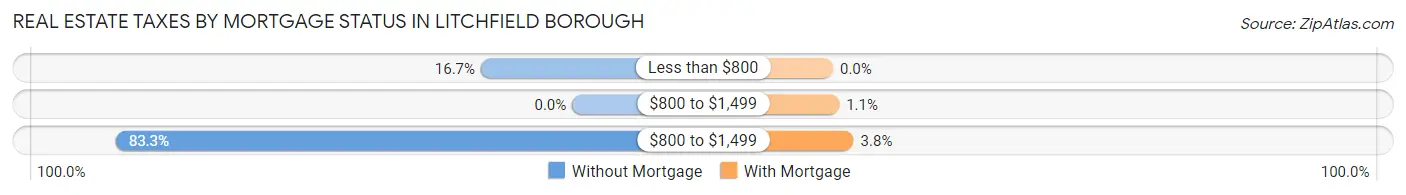
| Property Taxes | Without Mortgage | With Mortgage |
| Less than $800 | 21 (16.7%) | 0 (0.0%) |
| $800 to $1,499 | 0 (0.0%) | 3 (1.1%) |
| $800 to $1,499 | 105 (83.3%) | 10 (3.8%) |
| Total | 126 (100.0%) | 266 (100.0%) |
Health & Disability in Litchfield borough
Health Insurance Coverage by Age in Litchfield borough
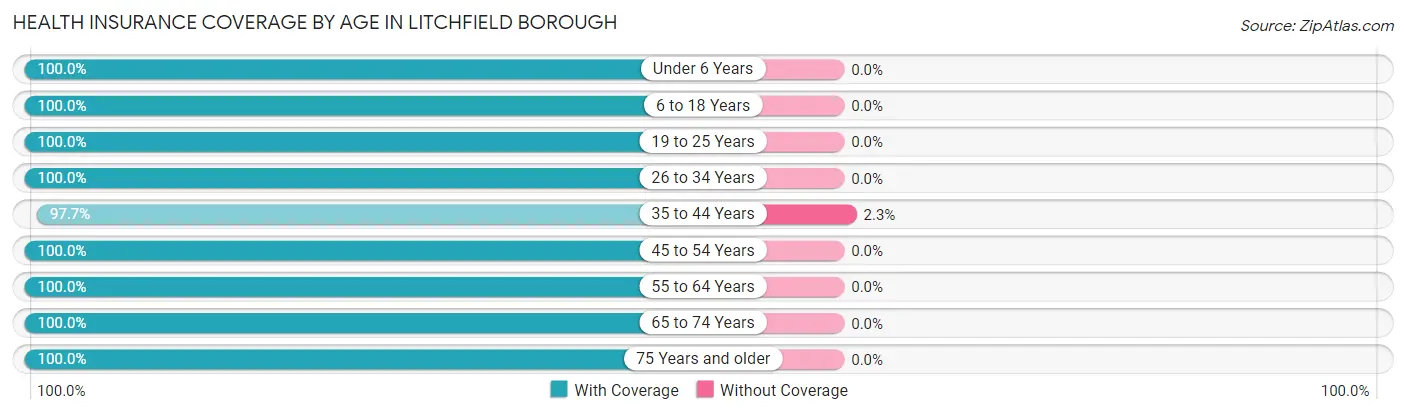
| Age Bracket | With Coverage | Without Coverage |
| Under 6 Years | 87 (100.0%) | 0 (0.0%) |
| 6 to 18 Years | 205 (100.0%) | 0 (0.0%) |
| 19 to 25 Years | 91 (100.0%) | 0 (0.0%) |
| 26 to 34 Years | 157 (100.0%) | 0 (0.0%) |
| 35 to 44 Years | 128 (97.7%) | 3 (2.3%) |
| 45 to 54 Years | 143 (100.0%) | 0 (0.0%) |
| 55 to 64 Years | 166 (100.0%) | 0 (0.0%) |
| 65 to 74 Years | 188 (100.0%) | 0 (0.0%) |
| 75 Years and older | 151 (100.0%) | 0 (0.0%) |
| Total | 1,316 (99.8%) | 3 (0.2%) |
Health Insurance Coverage by Citizenship Status in Litchfield borough
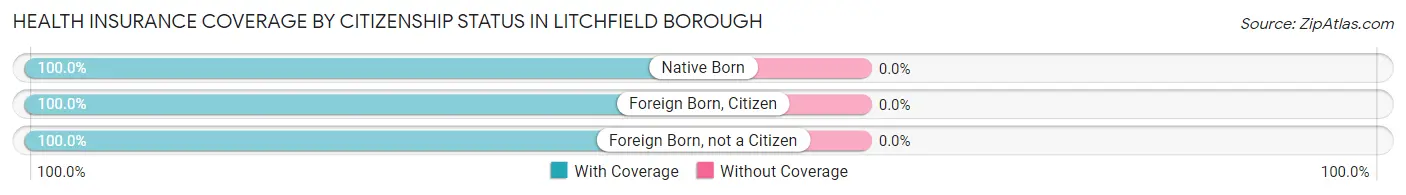
| Citizenship Status | With Coverage | Without Coverage |
| Native Born | 87 (100.0%) | 0 (0.0%) |
| Foreign Born, Citizen | 205 (100.0%) | 0 (0.0%) |
| Foreign Born, not a Citizen | 91 (100.0%) | 0 (0.0%) |
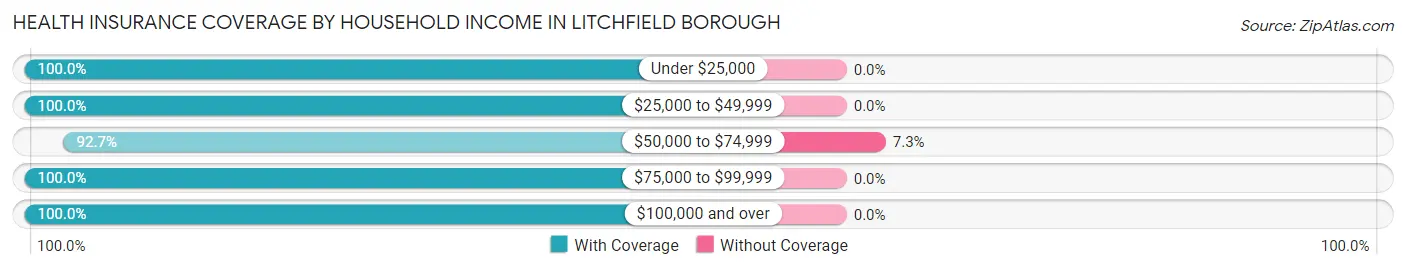
Health Insurance Coverage by Household Income in Litchfield borough
| Household Income | With Coverage | Without Coverage |
| Under $25,000 | 91 (100.0%) | 0 (0.0%) |
| $25,000 to $49,999 | 84 (100.0%) | 0 (0.0%) |
| $50,000 to $74,999 | 38 (92.7%) | 3 (7.3%) |
| $75,000 to $99,999 | 154 (100.0%) | 0 (0.0%) |
| $100,000 and over | 891 (100.0%) | 0 (0.0%) |
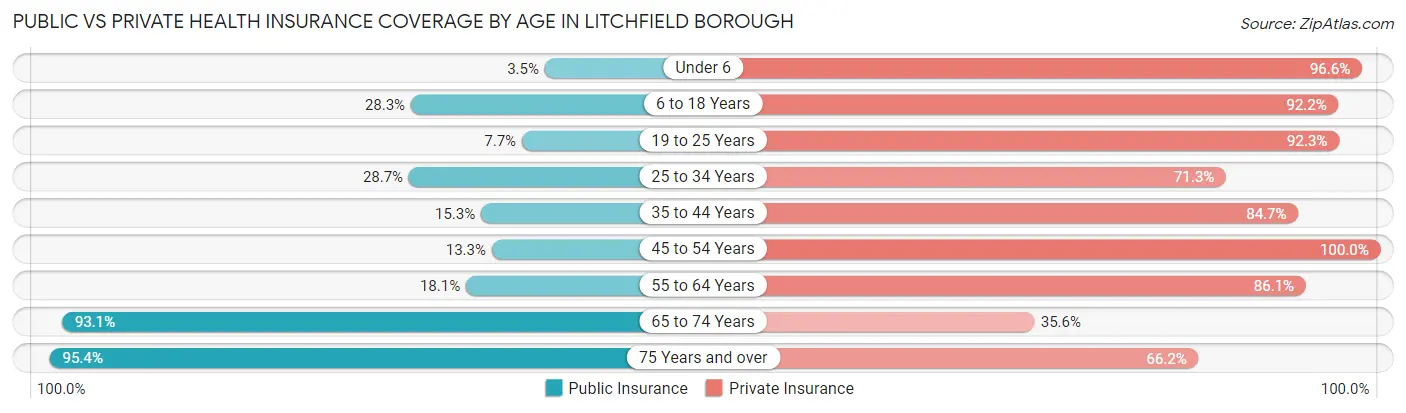
Public vs Private Health Insurance Coverage by Age in Litchfield borough
| Age Bracket | Public Insurance | Private Insurance |
| Under 6 | 3 (3.5%) | 84 (96.6%) |
| 6 to 18 Years | 58 (28.3%) | 189 (92.2%) |
| 19 to 25 Years | 7 (7.7%) | 84 (92.3%) |
| 25 to 34 Years | 45 (28.7%) | 112 (71.3%) |
| 35 to 44 Years | 20 (15.3%) | 111 (84.7%) |
| 45 to 54 Years | 19 (13.3%) | 143 (100.0%) |
| 55 to 64 Years | 30 (18.1%) | 143 (86.1%) |
| 65 to 74 Years | 175 (93.1%) | 67 (35.6%) |
| 75 Years and over | 144 (95.4%) | 100 (66.2%) |
| Total | 501 (38.0%) | 1,033 (78.3%) |
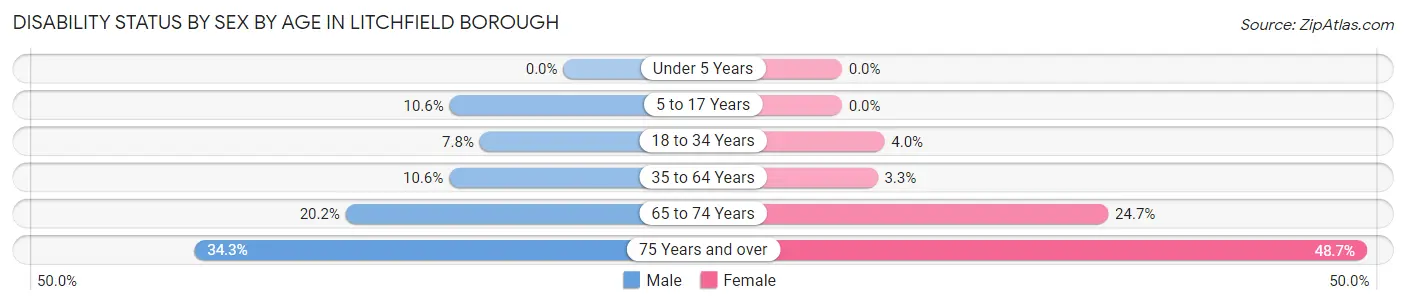
Disability Status by Sex by Age in Litchfield borough
| Age Bracket | Male | Female |
| Under 5 Years | 0 (0.0%) | 0 (0.0%) |
| 5 to 17 Years | 15 (10.6%) | 0 (0.0%) |
| 18 to 34 Years | 9 (7.8%) | 6 (4.0%) |
| 35 to 64 Years | 21 (10.6%) | 8 (3.3%) |
| 65 to 74 Years | 20 (20.2%) | 22 (24.7%) |
| 75 Years and over | 25 (34.3%) | 38 (48.7%) |
Disability Class by Sex by Age in Litchfield borough
Disability Class: Hearing Difficulty
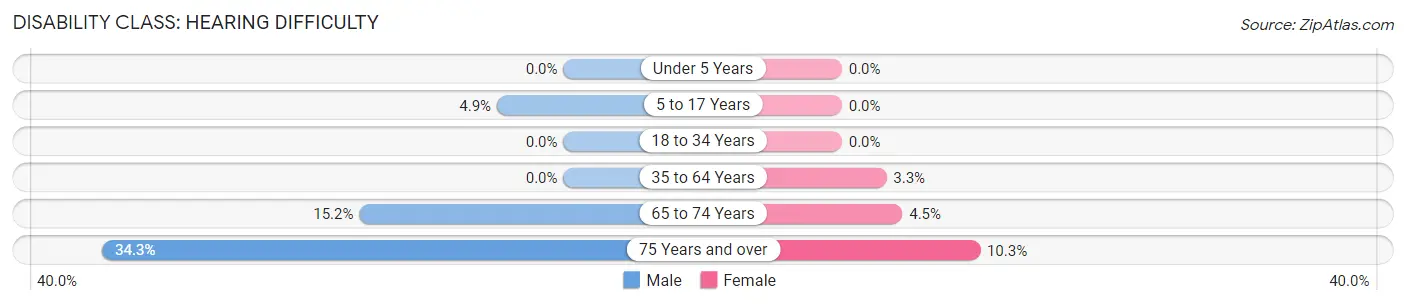
| Age Bracket | Male | Female |
| Under 5 Years | 0 (0.0%) | 0 (0.0%) |
| 5 to 17 Years | 7 (4.9%) | 0 (0.0%) |
| 18 to 34 Years | 0 (0.0%) | 0 (0.0%) |
| 35 to 64 Years | 0 (0.0%) | 8 (3.3%) |
| 65 to 74 Years | 15 (15.1%) | 4 (4.5%) |
| 75 Years and over | 25 (34.3%) | 8 (10.3%) |
Disability Class: Vision Difficulty
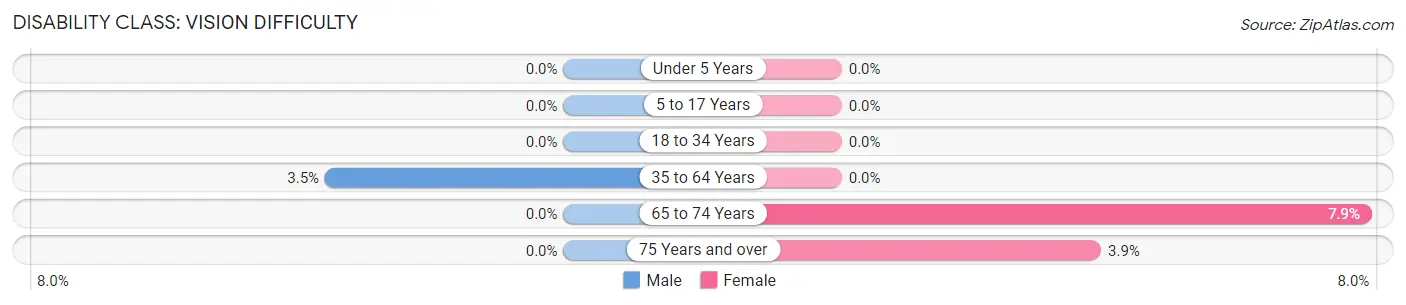
| Age Bracket | Male | Female |
| Under 5 Years | 0 (0.0%) | 0 (0.0%) |
| 5 to 17 Years | 0 (0.0%) | 0 (0.0%) |
| 18 to 34 Years | 0 (0.0%) | 0 (0.0%) |
| 35 to 64 Years | 7 (3.5%) | 0 (0.0%) |
| 65 to 74 Years | 0 (0.0%) | 7 (7.9%) |
| 75 Years and over | 0 (0.0%) | 3 (3.8%) |
Disability Class: Cognitive Difficulty
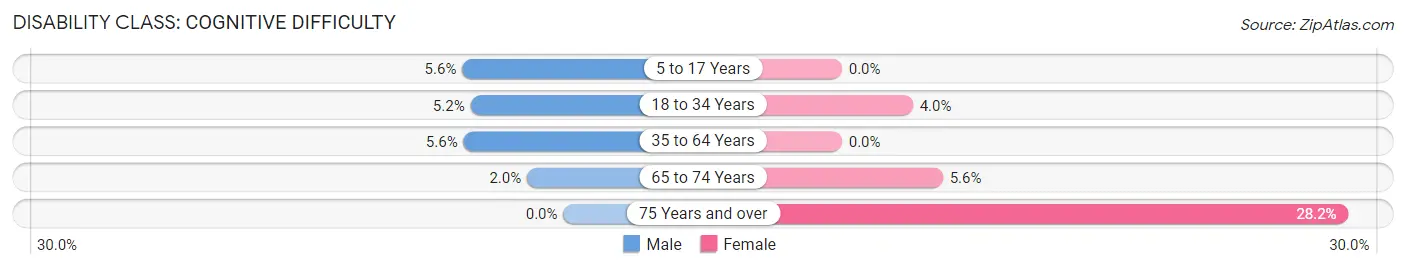
| Age Bracket | Male | Female |
| 5 to 17 Years | 8 (5.6%) | 0 (0.0%) |
| 18 to 34 Years | 6 (5.2%) | 6 (4.0%) |
| 35 to 64 Years | 11 (5.6%) | 0 (0.0%) |
| 65 to 74 Years | 2 (2.0%) | 5 (5.6%) |
| 75 Years and over | 0 (0.0%) | 22 (28.2%) |
Disability Class: Ambulatory Difficulty
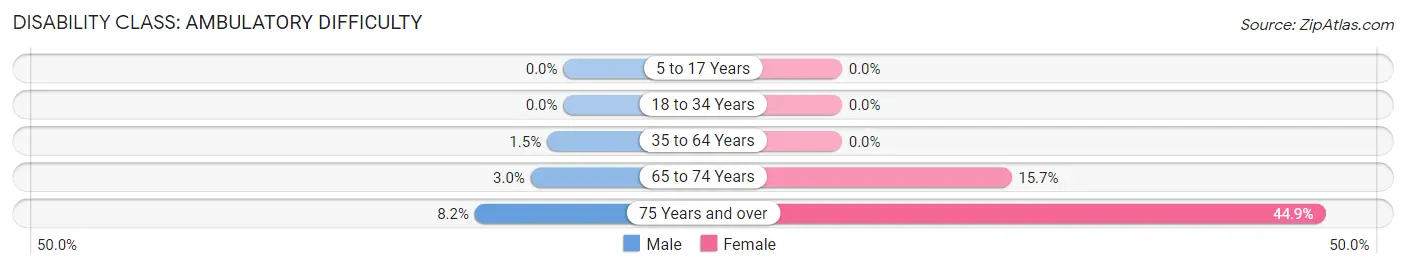
| Age Bracket | Male | Female |
| 5 to 17 Years | 0 (0.0%) | 0 (0.0%) |
| 18 to 34 Years | 0 (0.0%) | 0 (0.0%) |
| 35 to 64 Years | 3 (1.5%) | 0 (0.0%) |
| 65 to 74 Years | 3 (3.0%) | 14 (15.7%) |
| 75 Years and over | 6 (8.2%) | 35 (44.9%) |
Disability Class: Self-Care Difficulty
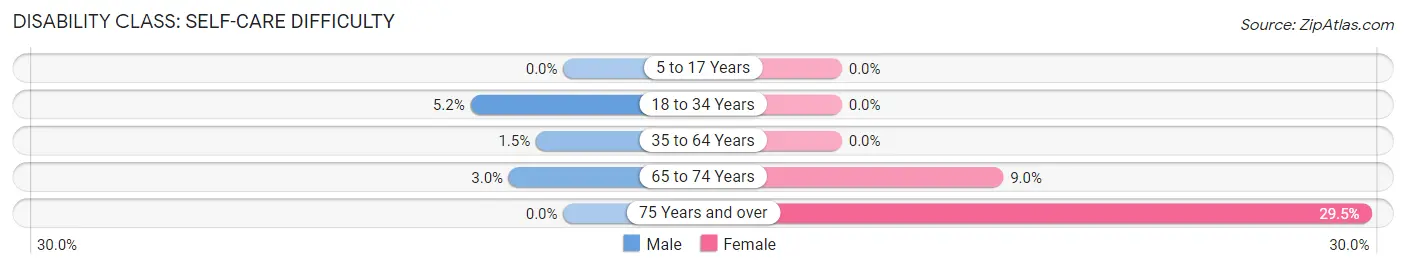
| Age Bracket | Male | Female |
| 5 to 17 Years | 0 (0.0%) | 0 (0.0%) |
| 18 to 34 Years | 6 (5.2%) | 0 (0.0%) |
| 35 to 64 Years | 3 (1.5%) | 0 (0.0%) |
| 65 to 74 Years | 3 (3.0%) | 8 (9.0%) |
| 75 Years and over | 0 (0.0%) | 23 (29.5%) |
Technology Access in Litchfield borough
Computing Device Access in Litchfield borough
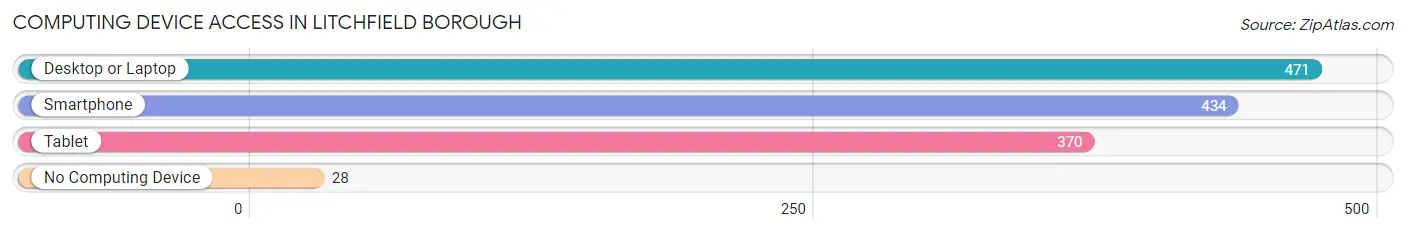
| Device Type | # Households | % Households |
| Desktop or Laptop | 471 | 90.2% |
| Smartphone | 434 | 83.1% |
| Tablet | 370 | 70.9% |
| No Computing Device | 28 | 5.4% |
| Total | 522 | 100.0% |
Internet Access in Litchfield borough
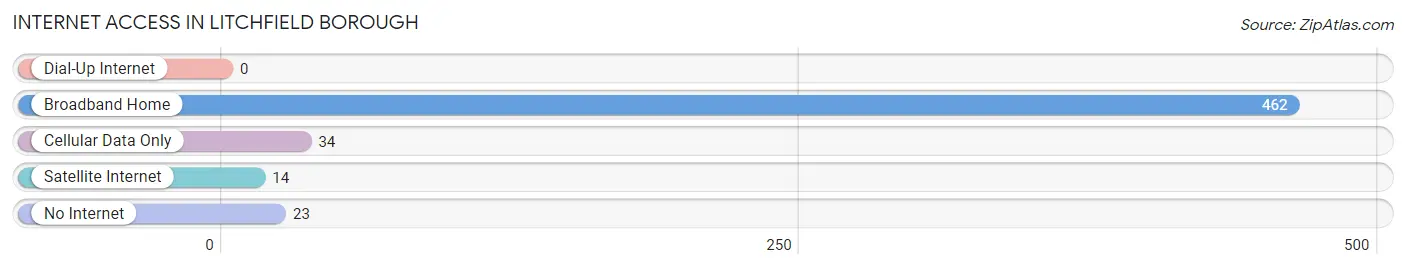
| Internet Type | # Households | % Households |
| Dial-Up Internet | 0 | 0.0% |
| Broadband Home | 462 | 88.5% |
| Cellular Data Only | 34 | 6.5% |
| Satellite Internet | 14 | 2.7% |
| No Internet | 23 | 4.4% |
| Total | 522 | 100.0% |
Litchfield borough Summary
Litchfield Borough is a small town located in Litchfield County, Connecticut. It is situated in the northwest corner of the state, about an hour and a half from Hartford and two hours from New York City. The town has a population of approximately 2,000 people and covers an area of about 4.5 square miles.
History
Litchfield Borough was first settled in 1720 by a group of settlers from Massachusetts. The town was originally known as “Litchfield Plantation” and was part of the larger town of Litchfield. In 1751, the town was officially incorporated as the Borough of Litchfield.
The town was an important center of commerce and industry in the early 19th century. It was home to several mills, including a cotton mill, a paper mill, and a woolen mill. The town was also home to several factories, including a hat factory, a shoe factory, and a clock factory.
In the late 19th century, the town began to decline in importance as the industrial revolution shifted production to larger cities. However, the town remained an important center of commerce and culture. It was home to several prominent families, including the Beechers, the Daytons, and the Litchfields.
Geography
Litchfield Borough is located in the northwest corner of Connecticut, about an hour and a half from Hartford and two hours from New York City. The town is situated in the foothills of the Berkshire Mountains and is bordered by the towns of Morris, Goshen, and Harwinton.
The town is divided into two sections: the Borough of Litchfield and the Town of Litchfield. The Borough of Litchfield is the more urbanized area and is home to most of the town’s businesses and services. The Town of Litchfield is more rural and is home to several farms and small businesses.
The town is home to several parks and recreational areas, including White Memorial Conservation Center, Litchfield Hills State Park, and Litchfield Historical Society.
Economy
Litchfield Borough’s economy is largely based on tourism and retail. The town is home to several small businesses, including restaurants, shops, and galleries. The town is also home to several large employers, including the Litchfield County Bank and the Litchfield Historical Society.
The town is also home to several educational institutions, including the Litchfield Academy, the Litchfield Preparatory School, and the Litchfield Community College.
Demographics
As of the 2010 census, the population of Litchfield Borough was 2,000. The racial makeup of the town was 95.2% White, 1.2% African American, 0.7% Native American, 0.7% Asian, 0.2% Pacific Islander, 0.7% from other races, and 1.4% from two or more races. Hispanic or Latino of any race were 2.2% of the population.
The median household income in the town was $60,000, and the median family income was $68,000. The per capita income in the town was $30,000. About 8.2% of the population was below the poverty line.
Conclusion
Litchfield Borough is a small town located in Litchfield County, Connecticut. It is situated in the northwest corner of the state, about an hour and a half from Hartford and two hours from New York City. The town has a population of approximately 2,000 people and covers an area of about 4.5 square miles. The town’s economy is largely based on tourism and retail, and it is home to several educational institutions. The town has a diverse population, with a median household income of $60,000 and a median family income of $68,000.
Common Questions
What is Per Capita Income in Litchfield borough?
Per Capita income in Litchfield borough is $67,777.
What is the Median Family Income in Litchfield borough?
Median Family Income in Litchfield borough is $149,432.
What is the Median Household income in Litchfield borough?
Median Household Income in Litchfield borough is $121,346.
What is Income or Wage Gap in Litchfield borough?
Income or Wage Gap in Litchfield borough is 6.0%.
Women in Litchfield borough earn 94.0 cents for every dollar earned by a man.
What is Inequality or Gini Index in Litchfield borough?
Inequality or Gini Index in Litchfield borough is 0.48.
What is the Total Population of Litchfield borough?
Total Population of Litchfield borough is 1,355.
What is the Total Male Population of Litchfield borough?
Total Male Population of Litchfield borough is 667.
What is the Total Female Population of Litchfield borough?
Total Female Population of Litchfield borough is 688.
What is the Ratio of Males per 100 Females in Litchfield borough?
There are 96.95 Males per 100 Females in Litchfield borough.
What is the Ratio of Females per 100 Males in Litchfield borough?
There are 103.15 Females per 100 Males in Litchfield borough.
What is the Median Population Age in Litchfield borough?
Median Population Age in Litchfield borough is 45.4 Years.
What is the Average Family Size in Litchfield borough
Average Family Size in Litchfield borough is 3.1 People.
What is the Average Household Size in Litchfield borough
Average Household Size in Litchfield borough is 2.4 People.
How Large is the Labor Force in Litchfield borough?
There are 692 People in the Labor Forcein in Litchfield borough.
What is the Percentage of People in the Labor Force in Litchfield borough?
61.1% of People are in the Labor Force in Litchfield borough.
What is the Unemployment Rate in Litchfield borough?
Unemployment Rate in Litchfield borough is 4.9%.